a tale of two communities: explaining deforestation in...
TRANSCRIPT
A Tale of Two Communities:Explaining deforestation in Mexico
Jennifer Alix-Garcia, Alain de Janvry, and Elisabeth Sadoulet1
University of California at Berkeley
April 2004
Forthcoming in World Development
Summary.
Developing policies to mitigate deforestation in Mexico requires recognizing heterogeneity in themanagement schemes used by communities. In particular, behavior towards land use change is verydifferent in communities that extract wood from the forest for profit and those that gain theirlivelihoods through other means. In the former, forestry projects generate funds which can beinvested in public goods to help increase the value of the standing forest from the perspective ofthose who do not receive direct dividends from the projects. An increase in investment of forestryprofits in public goods helps decrease forest loss. In communities without such projects,deforestation is related to the ability of the community to induce formation of a coalition ofmembers that cooperates in reducing forest clearing. This is easier in smaller communities with moreexperienced leaders. Data collected in 2002 combined with satellite imagery are used to test thesehypotheses. In addition to verifying the predictions of the models, a disturbing result of the analysisis that deforestation is higher when a community engages in forestry projects, even after properlyaccounting for self-selection into this activity. This suggests that forestry projects as they now existin Mexico are not sustainable and contribute to the deforestation problem.
Key words: Deforestation, common property, partial cooperationJEL classification codes: D70, H41, O13, N56, Q23, Q24
1 This paper would not exist without the contributions and support of the Instituto Nacional de Ecología(INE), particularly Carlos Muñoz-Piña, Maria Zorilla Ramos, and Josefina Braña. Also indispensable have beenAlejandro Guevara and his team at the Universidad Iberoamericana, Juan Manuel Torres and others of theCentro de Investigaciones y Docencias Económicas (CIDE), and the World Bank. Most importantly, wecannot thank enough all of the very patient and kind members of the ejidos and comunidades we visited.
- 2 - 9/17/04
1. INTRODUCTION
The 1990s saw a flurry of activity in the economic modeling of deforestation, with early
efforts focused on cross-country analyses and second-wave models moving to micro-level
approaches (Kaimowitz and Angelsen (1998), Barbier (2001)). The current paper is in the latter
category, but with a twist: the introduction of behavior, where the unit of analysis for deforestation
corresponds to the unit of decision-making. Specifically, the vast majority of the land-use change
literature views deforestation through binary response models based upon an individual’s profit
maximization problem (see Chomitz and Gray (1996)) but applied to a pixel or to an entire
municipality (see Cropper et al (2001), Monroe et al (2002), Godoy and Contreras (2001), Vance and
Geoghegan (2002), Deininger and Minten (1999)). This study differs substantially from these, in that
it recognizes that the decision process comes from the interaction between individual households
and authorities in a community. Analyzing the community level interactions reconciles the unit of
analysis (community-level deforestation) and the unit at which decisions are made (individual
landholders). This approach, combined with the unique situation in Mexico where most forests are
held in common property, reveals two different levels at which forest policy can affect deforestation.
First, field experience has shown us that there is a sharp contrast between the deforestation
processes in communities in which the forest is mostly removed by individual households to expand
their agricultural or cattle activities, and in communities that extract wood as a commercial activity.
In the former, demand for socially excessive forest conversion may be reduced by cooperation within
the community. In the latter, the distribution of profits can be used as a tool to minimize individual
incentives to encroach on the forest. These two mechanisms imply policy responses that are specific
to each of these two types of communities.
Second, although a large part of a community’s decision to enter the forestry business or not
is determined by geophysical variables, there remains room for policies to influence this choice. This
is of particular relevance given the observation that communities that enter the forestry business have
significantly higher deforestation than those that do not practice forestry. This finding lends
- 3 - 9/17/04
particular importance to policies that target communities practicing forestry and give them incentives
to manage their business in a sustainable fashion.
The paper proceeds as follows. First, we discuss the Mexican forestry context (section 2),
develop two theories of community behavior (section 3), describe the data, and show summary
statistics (section 4). We then present the estimation strategy (section 5), the results (section 6), and
conclude with possible policy implications (section 7).
2. THE MEXICAN FORESTRY CONTEXT
This study focuses on the Mexican ejidos, rural communities resulting from a drawn-out land
reform that extended from the end of the 1910 Revolution until the early 1990s. During this time, an
area equivalent to half the country was redistributed to peasants organized in communities. Ejidos are
composed of two different kinds of property rights over land: private parcels and commons. Private
land is mostly used for agricultural activities. Within these same communities there also live many
people who are not members of the ejido, usually descendants of the original members (ejidatarios)
who were prevented from becoming members by the legal restriction on inheritance to only one
child. The non-members do not have voting rights and are not formally given land, but in practice
they often farm on ejido lands ceded by others or illegally taken from the commons. The commons
are mainly dedicated to pasture and forest. Importantly for the case at hand, they harbor 80% of
Mexico’s remaining forest.
Though there has been much debate regarding estimation of Mexico’s annual deforestation
rate, there is no doubt that, conservatively estimated at 1.3%, it is among the highest in the world
(Torres-Rojo and Flores-Xolocotzi, 2001). The estimated rate in our sample is 1.2% per year.
Mexico is among the most biologically diverse countries in the world, with first place in reptilian
diversity, third in bird, and fourth in mammal. Its plant diversity exceeds that of the United States
and Canada combined (CNF, 2001). In addition, Mexico is a water scarce country, and forests play
an important function in regulating stream flows from watersheds. This suggests that there are
- 4 - 9/17/04
significant negative externalities to deforestation in Mexico and justifies our focus on measures to
mitigate forest loss.
3. TWO THEORIES OF COMMUNITY BEHAVIOR
During fieldwork in 2002, we observed sharp contrasts in deforestation between communities
that manage their forests as a business and that which simply have forests in their common land.
They are classified here as forestry and non-forestry ejidos, respectively. Forestry ejidos are those that
have received a forest exploitation permit from the government and organize extractive forestry as a
business. Non-forestry ejidos are those where there is no formal structure for tree extraction aside
from what is provided by a set of basic rules approved by the community assembly. Each ejidatario
works individually subject to these rules and his personal constraints.
(a) Forest conversion in non-forestry ejidos
Deforestation in non-forestry ejidos is conceptualized in a theory of partial cooperation,
which is based on Barrett’s (1989, 1994) work on emissions agreements in Europe. Other authors
who have expanded this approach include Carraro and Siniscalco (1993) and Petrakis and
Xepapadeas (1996). Several authors have used game theory to model deforestation. Among the
papers in this vein are Angelsen (2001) and Ligon and Narain (1998) who focus on games between
communities and the state. Alston et al. (2000) examine how uncertainty in property rights induces a
game between local landholders.
Based upon field interviews, we posit that the driving force behind rapid deforestation in
non-forestry ejidos is individual incentives that are not aligned with socially optimal behavior as a
consequence of the common property nature of the forest. These incentives come from households’
land requirements for both crops and cattle, the latter of which are often used for insurance, and
from extraction of wood for domestic use. In many villages, one observes a core group of
households who seem to work together, setting and obeying rules limiting the amount of cattle in the
- 5 - 9/17/04
commons or the wood extracted for domestic use. Moreover, this group exists despite the fact that
there often are people around it who are not obeying the rules. This is the concept of a coalition of
cooperators.
The intuition of the model is as follows. Households derive benefits from the forest. These
benefits may vary across households and include current benefits such as firewood, house-building
materials, and non-wood products as well as future benefits. Both current and future benefits depend
upon the quality of the forest, accessibility, and its state at time zero. There may also be benefits
from cutting the forest, or encroachment, which include profits from agriculture and cattle, or
insurance from cattle. These benefits are decreasing with the size of parceled or private landholdings
and increasing with family size, population pressure, and the quality of potential agricultural or
pasture land. Finally, there is a cost to encroachment that encompasses the work needed to remove
forest and the risk of punishment incurred from being caught encroaching. This risk can be
increased by strong leadership (see Bianco and Bates (1990)).
The conditions derived from the model sort the households into three distinct groups as a
function of land endowments, outside employment options, and the opportunities available on ejido
land. These characteristics determine in which of three categories a household will derive the
highest net benefits: those who have nothing to gain from encroachment, those who will always be
better off encroaching than cooperating, and those who, as a group, will be better off cooperating
than encroaching, even when others are encroaching. The first group is comprised of households
who have a low demand for common land because they either support themselves with outside jobs,
have sufficient private land, or the potential agricultural land is too far away to make it worth the
effort of going and clearing it. They accrue no gains from cutting down the forest, and potentially
benefit from its continued existence. We call them “passive cooperators”, as no incentive is needed
to induce them to curb their deforestation activities. The second group is composed of households
with high cattle to land ratios, or high household size to land ratios, or little chance of accessing
- 6 - 9/17/04
future benefits from the forest (e.g., they may not be ejidatarios). They are better off cutting down
more trees than not. For this reason, we label them “unrestrained encroachers”.
The last group is composed of “cooperators.” Cooperation gains are equal to the difference
between a cooperator’s benefits when he is part of the group that does not encroach on the forest (or
clears at a lower level), and the benefits he would receive if cooperation broke down and all members
of the group were to cut forest at their optimal individual level. These households have access to
current and future benefits, with high costs to encroaching. While the structure of benefits makes
these households prefer a cooperative solution, it is not sufficient to prevent individual defaulting at
the margin on the group’s decision. This is the usual incentive that leads to a non-cooperative
equilibrium, even in the case of recognized benefits from cooperation. Sustainability of the coalition
requires, as in most cooperation cases, an enforcement mechanism. The coalition of cooperators is
thus composed of households that have voluntarily given themselves a mechanism of enforcement
and punishment that prevents the unraveling of their collective choice. They typically commit to the
cooperative encroachment level by a show of hands in the assembly. This type of mechanism is not
unusual in developing countries (see Baland and Platteau (1996) for similar examples).
How might the behavior of these three groups affect deforestation? Here, encroachment is
equal to forest loss. Therefore, if we know what may increase or decrease the size of a coalition of
cooperators, we know what may decrease or increase deforestation.
To formalize the logic, let B(F − E, z f , zi
f ) represent forest benefits to household i , where
F is total forest before encroachment, E = eii∑ where
ei are household encroachment levels, z
f are
forest quality indicators, and the vector zi
f contains household factors that influence benefits from
forest products. Household encroachment benefits are given by b ei , z p , zi
p( ) , where zp are
indicators of the potential pasture/agricultural quality of the current forest land that is candidate for
encroachment, and zi
p are household factors which make encroachment more attractive. Finally,
- 7 - 9/17/04
c ei , zc ,δ( ) are encroachment costs which increase in encroachment level. This function also
includes physical characteristics zc which raise the cost of encroachment, like distance from dwellings
and forest type, plus community characteristics δ that make enforcement of rules more difficult,
thus decreasing encroachment costs.
The socially optimal level of encroachment is the solution to the problem:
(1) maxall ei
B F − E , z f , zif( ) + b ei , z p , zi
p( ) − c ei , zc ,δ( )( )i∑ .
The first order conditions, ′bi (⋅) = ′Bj (j∑ ⋅) + ′ci (⋅) for all i , define the optimal ejido level of
encroachment: ei
* . Here ′bi (⋅), ′Bj (.), and ′ci (⋅) are derivatives of b, B, and c with respect to
ei . The
social optimum is thus found where each household’s marginal benefit is equal to the ejido’s marginal
losses from deforestation plus the household’s marginal encroachment cost.
At the other end of the spectrum, in the non-cooperative equilibrium, household i
maximizes benefits from encroaching without taking into account the impact on others, a classic
tragedy of the commons story (see Hardin, (1968)):
(2) max
ei
B F − E, z f , zif( ) + b ei , z p , zi
p( ) − c ei , zc ,δ( )( ) .
This solution, ei , is defined by
′bi (⋅) = ′Bi (⋅) + ′ci (⋅) , the optimal household encroachment level. Note,
however, that the forest benefits function depends upon the size of the forest minus total
encroachment, which implies that the household’s decision depends upon the decisions ej of
everybody else – the less the others encroach, the lower are the marginal forest benefits, and hence
the more household i encroaches. The solution results in a reaction function that depends on factors
that affect individual benefits from forest and pasture, forest and pasture quality, encroachment
costs, punishments, and the encroachment choices E− i of the other households, which of course
depend upon their respective characteristics:

- 8 - 9/17/04
(3) ei = e (zi
f , zip , z f , z p , zc ,δ , E− i (.)) ,
where E− i = ejj≠ i∑ is the sum of the other households’ encroachment decisions.
Comparing the cooperative solution derived from (1) and the non-cooperative solution (3),
we can divide the households between those that would get higher benefits from cooperation and
those that would prefer the non-cooperative higher level of encroachment. A partial cooperation
equilibrium can emerge if a group of households would prefer the cooperative solution within their
coalition, despite the fact that households outside the coalition do not cooperate.2 The coalition and
the individual encroachers play a non-cooperative game. The coalition maximizes its aggregate
benefits, given the non-cooperators’ encroachment levels, ek :
(4)
maxej , all j∈J
B F − EJ − ekk∑ , z f , z jf( ) + b ej , z p , z j
p( ) − c ej , zc ,δ( )( ) , k ∈K , j ∈Jj∑ ,
where J and K denote the respective sets of cooperators and encroachers, and EJ = ejj∑ the level of
encroachment of the cooperative coalition with each member encroaching ej . The encroachers
individually solve an optimization problem similar to (2), taking as given the encroachment levels of
the coalition and of the other individual encroachers. The equilibrium solution sets the optimal
encroachment level for each of these groups, and hence the partial cooperation aggregate level of
encroachment:
(5)
E = ejj∈J∑ + ek
k∈K∑ ,
where e is encroachment by unrestrained encroachers when there is a cooperative coalition. The
three groups are defined by the following conditions:
1. Passive cooperators, i ∈ I , are worse off encroaching than doing nothing for any level of the
others’ encroachment:
2 Note that under this partial cooperation scheme, cooperators’ benefit is lower than at the full cooperativelevel, while encroachers benefit even more than under the full non-cooperative case.
- 9 - 9/17/04
(6) b ei , z p , zi
p( ) − c ei , zc ,δ( ) ≤ 0, B F − E, z f , zif( ) ≥ 0 .
2. Cooperators, j ∈J , are defined as those who are better off at the cooperative level than they
would be if everyone encroached:
(7)
B F − E, z f , z jf( ) + b ej , z p , z j
p( ) − c ej , zc ,δ( ) ≥B F − E, z f , z j
f( ) + b ej , z p , z jp( ) − c ej , zc ,δ( )
3. Unrestrained encroachers, k ∈K , are defined by the opposite inequality.
We modify equation (5) for the empirical analysis to give encroachment per member which,
for M members, is:
(8)
EM
=ej ⋅( )j∈J∑
M+
ek ⋅( )k∈K∑M
.
Since the cooperative encroachment level is less than the individual unrestrained
encroacher’s level, deforestation decreases with the size of the coalition. The levels of encroachment
of the unrestrained encroachers and of the coalition members are a function of the household
characteristics that affect their demands for common land, the quality of the land itself, and the
characteristics of all other households in the community. The size of the coalition, which is itself
endogenous, depends upon forest benefits, the quantity of good agricultural/pasture land, household
characteristics that change land demand, and strong leadership, which may increase the cost of not
participating in the coalition. It is here that we observe the effects of features traditionally associated
with cooperation, such as group size (Olson (1965), Runge (1986)) and inequality in asset
endowments (Bardhan et al. (2002)).
(b) Forest conversion in forestry ejidos
A forestry management system is one where there is a community “forestry firm” made up
of either some or all of the ejido members. The objective for these firms is to maximize their profits
over the long term. From this point of view, all other things held equal, this management regime
- 10 - 9/17/04
should be the most likely to operate like a single, profit-maximizing owner. There are, however, two
important differences between the profit-maximizing owner and the ejido. First, ejidos are given a
harvest limit by the government and must follow a management plan that includes reforestation,
among other activities. If they exceed this limit, or do not reforest sufficiently, they are threatened by
loss of all future profits through removal of their permit. These limits, however, are not necessarily
the optimal level that the ejido would choose as they internalize national social objectives. Since
enforcement is not perfect, ejidos will optimally take a certain level of risk in not complying with the
limits, hoping to get away with a certain amount of forest loss.
The second complication of the “owner’s” problem is the heterogeneous constituency
composed of those who receive direct benefits from the forest project, the ejido members, and those
who receive benefits only indirectly, the non-members. As in the case of the non-forestry ejidos,
households (both members and non-members) encroach on common lands for grazing animals and
planting crops. Conversion of forest for these activities increases the reforestation responsibilities of
forest managers. For this reason, forest managers have an incentive to try to reduce the conversion
of forested land by individual activities. They do this through a bribe which has to be different for
members and non-members.
It is quite easy to bribe members through the division of profits among them; it is bribing
the non-members, who often vastly outnumber members, that creates a problem. To solve this
problem, one observes many communities that invest heavily in public goods in lieu of dividing up all
the profits. There are two possible reasons behind this behavior. First, there are returns to scale in
investment in public goods, so that in large communities, public goods may generate more individual
benefits than cash distribution. Second, only members are legally owners of the forest product, and
it would be very difficult to decide who among non-members could qualify for profit sharing. This
suggests that forest managers may be acting to minimize encroachment incentives by “paying off”
non-members through investments in public goods. The tradeoff is between penalizing members

- 11 - 9/17/04
who see part of their dividends being diverted to non-members, and reducing incentives for non-
members to remove trees clandestinely from the forest.
We model the relationship between forest managers and households in a principal agent
framework where forest managers choose optimal levels of harvesting, reforestation, and the profit
sharing rule, anticipating the behavior of community members.
Consider the households’ decisions. Their incentives to encroach depend upon their own
costs and benefits, as in non-forestry ejidos, and also upon how their actions affect the forest stock in
future periods. This turns their problem into a dynamic one, since their actions today affect the size
of the forest in the next period, and hence the size of forest profits. Suppose there are M ejidatarios
and N non-members, and that the percentage of profits that go to dividends is γ .3 The resource
constraint is Ft+1 = Ft − Ht − Et + Rt , where
Ft+1 is the area of forest stock in period t+1, and
Ht ,
Et , and
Rt are the total area harvested for forestry, total encroachment, and reforestation in period t,
respectively. An ejidatario m chooses the optimal encroachment level to maximize his net benefit
given the division of profits and the current harvest level:
(9)
V Ft( ) =em
max B Ft − Ht − Et , z f , zmf( ) + b em , z p , zm
p( ) − c em , zc( ) + γ pHt
M+ g 1− γ( ) pHt( ) + βV Ft+1( )⎡
⎣⎢⎢
⎤
⎦⎥⎥
,
where p is the net revenue per hectare of forest exploitation, g ⋅( ) is the benefit derived from the
consumption of public goods, and βV Ft+1( ) is the discounted value of the maximized future stream
of benefits coming from the forested land for the ejidatario. The vectors z f , zm
f , z p , zmp , and z
c are as
in the previous section. The first order condition is:
(10) ′bm ⋅( ) = ′Bm ⋅( ) + ′cm ⋅( ) + β ′V ,
3 Note that the sum of members and non-members in the forestry model is equal to the sum of the threedifferent groups in the previous model: M+N = I+J+K.
- 12 - 9/17/04
where ′bm ⋅( ) , ′Bm ⋅( ) , and
′cm ⋅( ) are defined like in the previous model as derivatives of benefits and
cost with respect to encroachment em . This implies that the benefits from encroaching one hectare
today must be equal to the sum of the lost benefits from having the same piece of forest today, the
costs incurred in encroaching it, and the discounted value of the decrease in the future forest stock.
The corresponding expression for non-member n is the solution to:
(11) W Ft( ) = max
en
B Ft − Ht − Et , z f , znf( ) + b en , z p , zn
p( ) − c en , zc( ) + g 1− γ( ) pHt( ) + βW Ft+1( )⎡⎣⎢
⎤⎦⎥ ,
where W Ft+1( ) is interpreted in the same way as
V Ft+1( ) above. Note that profit dividends do not
appear in the non-member’s value of the forest. The first order condition is:
(12) ′bn ⋅( ) = ′Bn ⋅( ) + ′cn ⋅( ) + β ′W .
Jointly, these expressions define two encroachment reaction functions, which solve for the optimal
encroachment levels e z, Ft , Ht , Rt ,γ( ) and
e z, Ft , Ht , Rt ,γ( ) for ejidatarios and non-members,
respectively, which gives the total amount of encroachment E = em ⋅( )
m∈M∑ + en ⋅( )
n∈N∑ . The vector z
includes all characteristics of all members of the community present in equations (9) and (11). Note
that non-members unequivocally lose from an increase in the share γ of profits that go into
dividends, and one can show that their encroachment increases in response to an increase in γ . For
the members, we can make no such statement, as the sign of the marginal effect depends on the
initial amount of the public good and their marginal utility from it.
At the ejido level, managers know households’ reaction functions. Their objective is to
maximize forest extraction profits taking into account the fact that if they harvest more than the
permit level, or don’t reforest enough, it is likely that they will have their forestry permit revoked in
the next period. Let q Ht + Et − Rt ; zq( ) denote the probability that a community will be successful in
evading detection of poor management and continue harvesting in the second period, with the
discount rate β . The vector zq includes characteristics that increase the probability that excessive
- 13 - 9/17/04
deforesting remains undetected. Finally, k Rt ; zk( ) is the forest management cost function which is
increasing in reforestation and characteristics zk that might make these activities more difficult.
With U denoting the value of the forest, the ejido manager’s problem can be written as follows:
(13) U Ft( ) = max
γ ,Ht ,Rt
pHt − k Rt ; zk( ) + βq Ht + Et − Rt ; zq( )U Ft+1( )⎡⎣⎢
⎤⎦⎥
where Ft+1 = Ft − Ht − Et + Rt , Et = E Ft , Ht , Rt ,γ( ) , q(⋅) < 1 and ′q < 0 when
Ht + Et − Rt > Ht , and
q = 1 otherwise, and H is the deforestation area allowed by the government.
The first order conditions for γ , Ht , and
Rt are:
(14) β ′q U − q ′U( ) dE
dγ= 0 ,
(15) p + β ′q U − q ′U( ) 1+ dE
dH
⎛⎝⎜
⎞⎠⎟= 0 ,
and (16) − ′k − β ′q U − q ′U( ) 1− dE
dR
⎛⎝⎜
⎞⎠⎟= 0 .
The first expression shows that the optimal profit allocation rule γ is the level that
minimizes aggregate encroachment. This is obtained where the sum of the marginal encroachment
effect of an increase in dividends for members is equal to the sum of the effects of this change on
non-members’ encroachment. The intuition is that leadership needs to find a level where increasing
the public good to the detriment of dividends begins to increase the encroachment of members by
more than it decreases that of non-members. If we assume for a moment that all members are
identical and all non-members are also identical, then the optimal profit distribution depends on the
ratio of members to non-members:
(17)
∂en ∂γ−∂em ∂γ
= MN
.
- 14 - 9/17/04
If all the encroachment demand functions are concave, the proportion of profits allocated to
dividends increases as the ratio of members to non-members increases. It is possible that at some
point, as membership size increases, it will be optimal to distribute ejido profits through public
goods, as the value of the goods to members may exceed the cash value of the dividends when they
are divided among many people.
The term − ′q U − q ′U( ) represents the marginal future benefits of reforestation (or cost of
harvesting): the decrease in the probability of losing the permit plus the increase in the future stock
of trees to be harvested. Equations (15) and (16) state that current marginal return to harvesting and
marginal cost of deforestation must equal the marginal future value of these decisions, respectively.
Equations (14), (15), and (16) jointly solve for the optimal area harvested Ht
∗ , reforested Rt∗ , and
allocation of profits to dividends γ ∗ . These three choices define the optimal encroachment level
Et∗ , and the total forest loss from one period to the next:
Ft+1 − Ft = Ht
* + Et* − Rt
* .
To summarize, in this model deforestation depends upon the forestry firm’s harvest level,
household encroachment level, and the forest manager’s reforestation efforts. All three are jointly
determined and hence a function of all exogenous variables. However, the specific variables
associated with deforestation are prices, characteristics that affect the probability of getting caught by
the forest service for not complying with the management plan, the size of the forest stock, and the
discount rate. Those associated with encroachment are individual characteristics, the quality of
available agricultural land, the forest stock, and the division of profits between dividends and public
goods. Finally, those affecting reforestation are the cost of forest management, the factors that affect
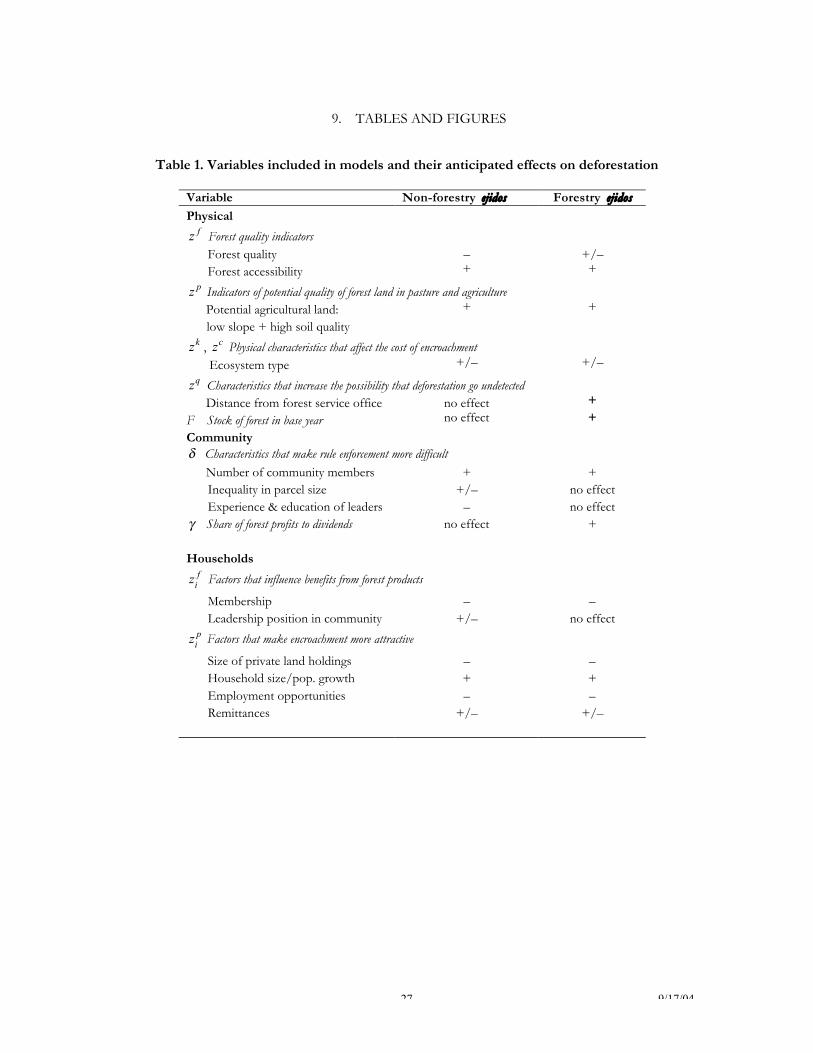
the probability of getting caught, the size of the forest stock, and the discount rate. Table 1
summarizes the variables that affect deforestation in the two models, along with the direction of their
expected effects.
TABLE 1 HERE
- 15 - 9/17/04
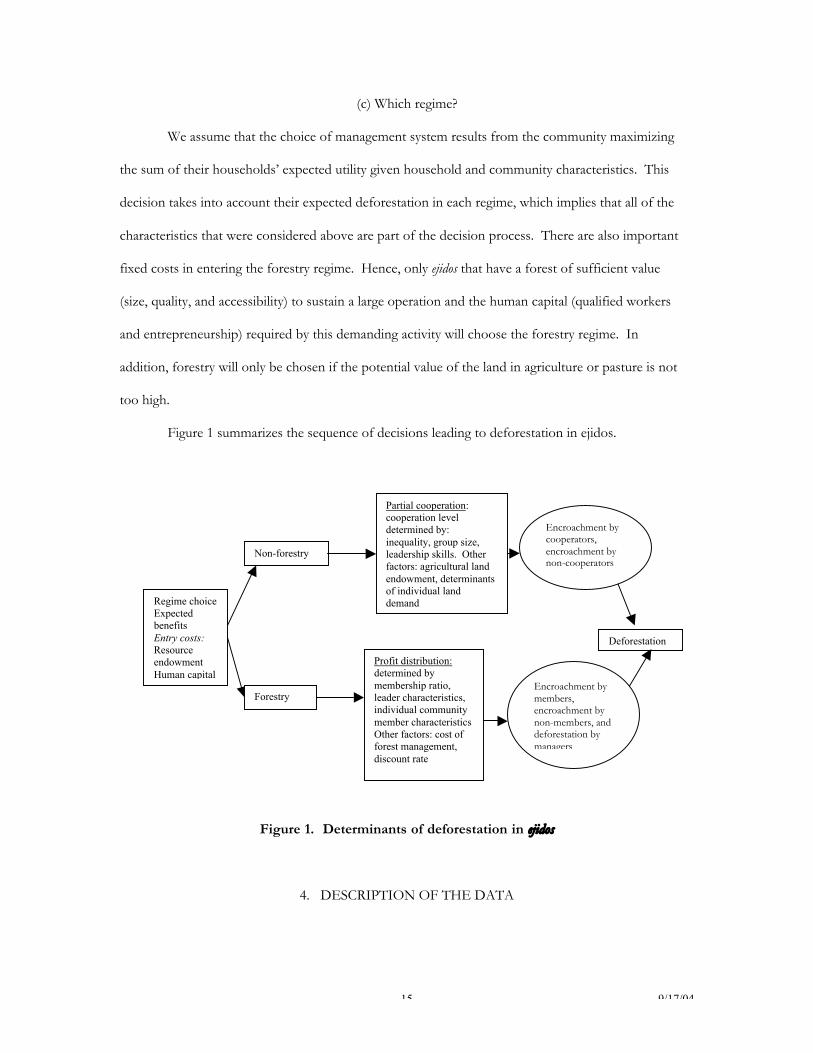
(c) Which regime?
We assume that the choice of management system results from the community maximizing
the sum of their households’ expected utility given household and community characteristics. This
decision takes into account their expected deforestation in each regime, which implies that all of the
characteristics that were considered above are part of the decision process. There are also important
fixed costs in entering the forestry regime. Hence, only ejidos that have a forest of sufficient value
(size, quality, and accessibility) to sustain a large operation and the human capital (qualified workers
and entrepreneurship) required by this demanding activity will choose the forestry regime. In
addition, forestry will only be chosen if the potential value of the land in agriculture or pasture is not
too high.
Figure 1 summarizes the sequence of decisions leading to deforestation in ejidos.
Figure 1. Determinants of deforestation in ejidos
4. DESCRIPTION OF THE DATA
Regime choiceExpectedbenefitsEntry costs:ResourceendowmentHuman capital
Non-forestry
Forestry
Partial cooperation:cooperation leveldetermined by:inequality, group size,leadership skills. Otherfactors: agricultural landendowment, determinantsof individual landdemand
Profit distribution:determined bymembership ratio,leader characteristics,individual communitymember characteristicsOther factors: cost offorest management,discount rate
Deforestation
Encroachment bymembers,encroachment bynon-members, anddeforestation bymanagers
Encroachment bycooperators,encroachment bynon-cooperators
- 16 - 9/17/04
The data come from a survey of 450 ejidos conducted throughout Mexico in 2002 jointly by
SEMARNAT, the University of California at Berkeley, and the World Bank. The survey consisted in
two parts, a community questionnaire and an indirect census. In the first part, information on basic
characteristics of the community, forest exploitation, and governance was collected, in addition to a
sub-set of questions to describe those in leadership positions. There are also data regarding the use
of earnings from forestry-related projects in the past year. The second part of the survey was an
indirect household questionnaire applied to 50 randomly chosen ejidatarios in each ejido, where the
information was obtained from one key informant. It includes information about participation in
government programs, household size, migration, age, employment, land and cattle-holdings, and use
of the commons.
The National Ecology Institute (INE) provided the National Forestry Inventories for 1993
and 2000. The inventories are based upon maps of scale 1:250,000 and 1:125,000, respectively.
Though initially not comparable, the maps have been reinterpreted for comparability by the Institute
of Geography at the Autonomous University of Mexico. The details of this process are described in
Velásquez et al. (2002). Slopes and altitudes have been calculated using digital elevation models of
scale 1:250,000, and soil maps provided by the National Ecology Institute at the same scale. We have
used these two data bases to create an index that indicates good quality agricultural land as land that
is both in the low slope category as well as containing soils of high quality. This classification is
based upon the FAO’s guidelines for defining agro-ecological zones and other soil classification tests
(Fisher et al, 2002). Municipal data for 1990 and 2000 come from the National Institute of Statistics
and Geography (INEGI).
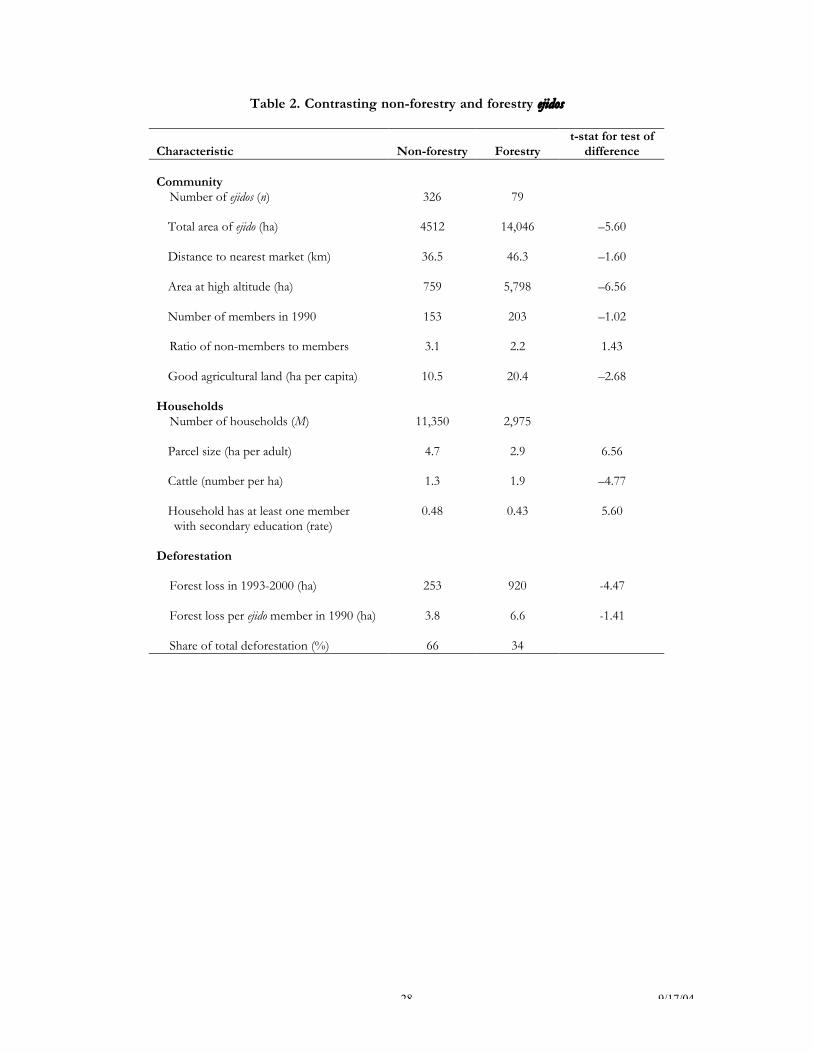
Table 2 compares characteristics of ejidos with and without forestry projects. 20% of ejidos in
the sample have forest management. Non-forestry ejidos are smaller in size. They are also at lower
altitudes, indicating superior agricultural potential. As for distance, we see that ejidos farther from
major markets are more likely to choose a forest management scheme. This may be because they do
not have many other employment options, or it may be that ejidos nearer to markets have already
- 17 - 9/17/04
been largely deforested. Finally, forestry ejidos have more good agricultural land per capita and their
individual parcels are significantly smaller, suggesting pressures for deforestation. They also have less
households with at least one member with secondary schooling.
Deforestation by regime is also reported in Table 2. Area deforested is larger in forestry
ejidos. While they represent only 20% of all ejidos, their deforestation accounts for 34% of total forest
loss in the sample. In terms of per capita forest loss, the difference is not significant, but it is
suggestive of higher loss per capita in forestry ejidos. The nature of the models dictates that the
analysis be done on a per capita basis; therefore, deforestation from this point on will refer to forest
loss per ejidatario between 1993 and 2000.
TABLE 2 HERE
Because we do not observe encroachment behavior, we must design an approximation for
this activity. To do so, we appeal to the household questionnaire, where we asked the informant if
households used the commons for any activity, be it pasture, agriculture, or forestry. The
assumption is that those that do not use the commons are not encroaching, since all of the forest is
located within the commons. Users and non-users were further divided into those with more than
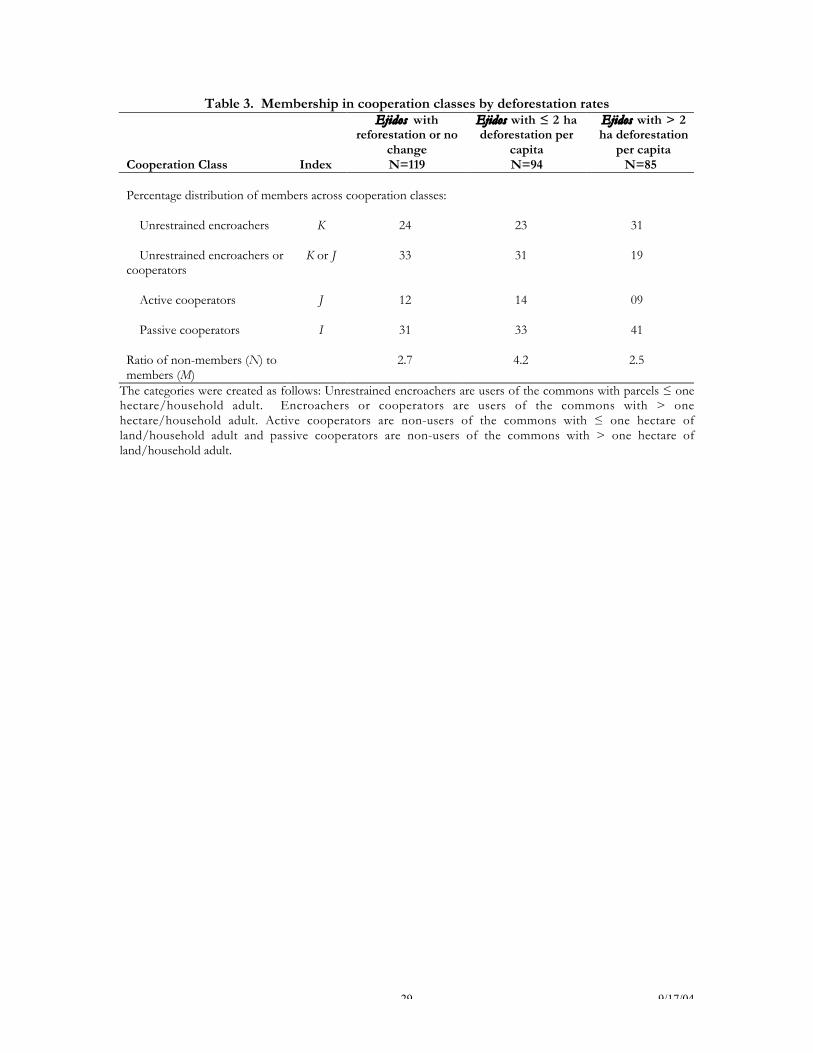
one hectare of land per adult and those with less. Table 3 shows these four groups, plus the total
number of non-members in the community (for whom there is no household data) into possible
upper and lower bounds for the cooperating groups. Passive cooperators I are those who possess
more than one hectare of land per adult and do not use the commons, as these are ejidatarios with little
need to venture into the commons to satisfy land needs. At a minimum, cooperators J are those with
less than one hectare of land per adult who do not use the commons. The cooperating group might
also include those who use the commons but are land rich, although these households might also be
classified as encroachers (K ). Those who use the commons and are land-poor fall into the
unrestrained encroacher group K. Non-members are also classified as unrestrained encroachers.
This categorization suggests that a proxy upper bound for the number J is the sum of the
land-scarce non-users plus the land-rich users, while the land-scarce non-users can be used as a lower
- 18 - 9/17/04
bound. Similarly, an upper bound for the encroachers (K) is the sum of the land-scarce users, the
land-rich users, and the non-members, while a lower bound is just the group of land-scarce users.
Because the estimation is of forest loss per member, we will be using the ratio of these totals to
membership. Table 3 gives the percentage distribution of these groups by three classes of ejidos in
terms of deforestation levels (reforestation or no change, ≤ 2 hectares of deforestation per ejidtario,
and > 2 hectares per ejidatario). It is interesting to see that deforestation per member increases as the
percentage of members in the unrestrained encroachers category rises. Also notable is the decrease
in “active cooperators”, those who don’t use the commons but have small land holdings, between
the high and low deforestation categories. Finally, we see that deforestation increases as the
percentage of members who are land rich users of the commons, categorized as unrestrained
encroachers or cooperators (potential upper bound of cooperators), decreases steadily.
TABLE 3 HERE
5. AN EMPIRICAL STRATEGY
As the choice of forestry vs. non-forestry regime is endogenous, the estimation model
includes this decision. The variables affecting this choice, including fixed costs and factors affecting
the profitability of forestry, are contained in the vector W. We assume that the decision of entering a
forestry regime is derived from a linear net benefits S∗ as follows:
S∗ = Wα + u
S = 1 if S∗ > 0, = 0 otherwise,
where α is a vector of parameters to be estimated. The deforestation equations are written:
ΔLF = X FβF + εF if S = 1,
ΔLNF = X NFβNF + εNF if S = 0,
where the subscript F indicates a forestry ejido and NF a non-forestry one, ΔL are hectares of forest
loss per member between 1993 and 2000, X are vectors of variables identified in the two models as
determining the level of deforestation, and β are vectors of parameters. The error terms u and ε
are all assumed to have zero mean. The selection process creates correlation between u and each of
- 19 - 9/17/04
the ε in the sample used for estimation. We estimate these equations as a system using maximum
likelihood.
Two variables that appear in the land change equations require instrumentation due to
endogeneity: the numbers of cooperators and of unrestrained encroachers. While we know who uses
the commons and who does not, and there is information on land ownership and commons use for
the households in the survey (used for the classification given in Table 3), commons use is
endogenous to the process of deforestation. The use of predicted values in the main regression
requires that we bootstrap the entire estimation process, which is done 1000 times for each estimated
equation. The results are discussed in the next section.
6. RESULTS
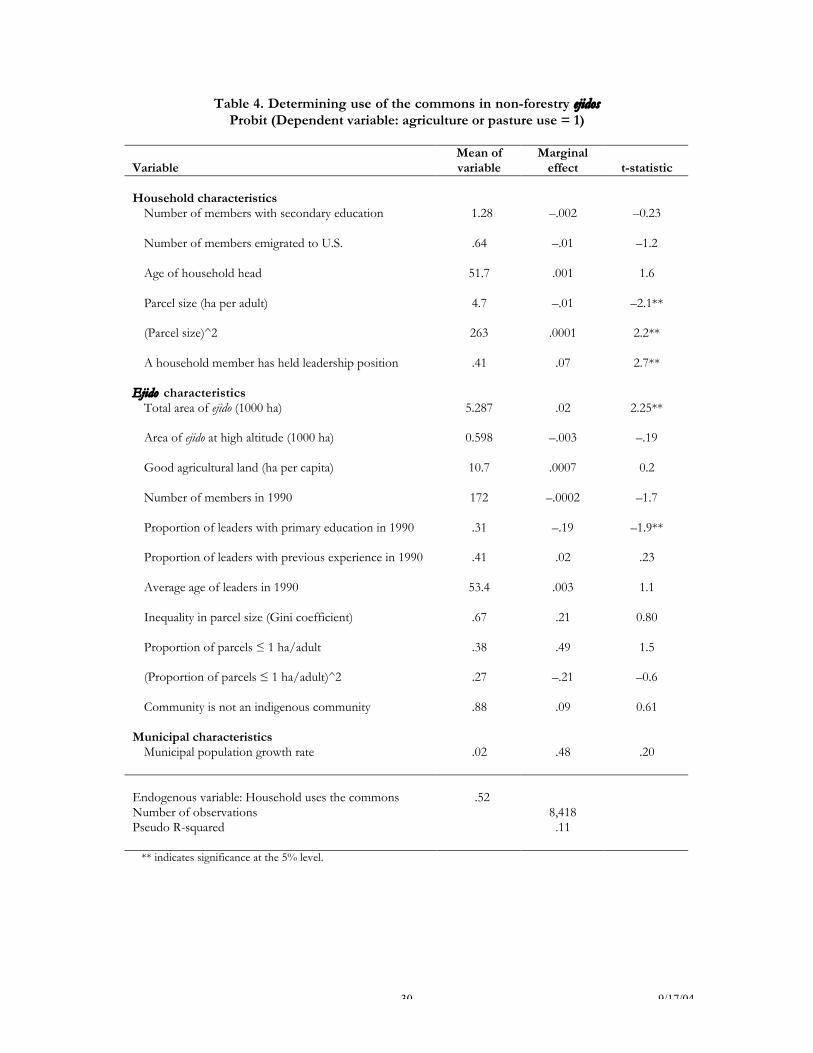
The predictive regression of the use of commons for agriculture or pasture by households in
non-forestry ejidos is presented in Table 4. As expected, the probability that a household uses the
commons decreases with its parcel size (the effect is negative for parcels up to 50 hectares, far above
the observed range). Those who have previously held leadership positions are more likely to use
the commons. With regards to ejido characteristics, we see that the probability of use increases with
total ejido size, though not by very much. The aggregate leadership variable suggests a negative effect
of leader education on land use, suggesting the role of quality of leadership in devising and imposing
restrictive rules.
In order to create the group size proxies, we calculate the average of the predicted
probabilities among households with plot size larger or smaller than one hectare per adult in each
ejido. We then tabulate the upper and lower bounds of the cooperating and encroaching groups as
described above. Since the dependent variable of the regression is deforestation per member, these
average probabilities reflect the percentage of members who are predicted to be in each of the
groups of interest. We observe that older ejidatarios are more likely to use the commons, as are those
who have previously held leadership positions. In addition, larger parcel sizes have a generally
- 20 - 9/17/04
negative effect on the probability of commons use. We justify inclusion of these household level
variables, collected in 2002, in this and other regressions by the fact that the characteristics that we
use are quite structural in the communities that we sample – most ejidos have maintained the same
membership they had at founding.
TABLE 4 HERE
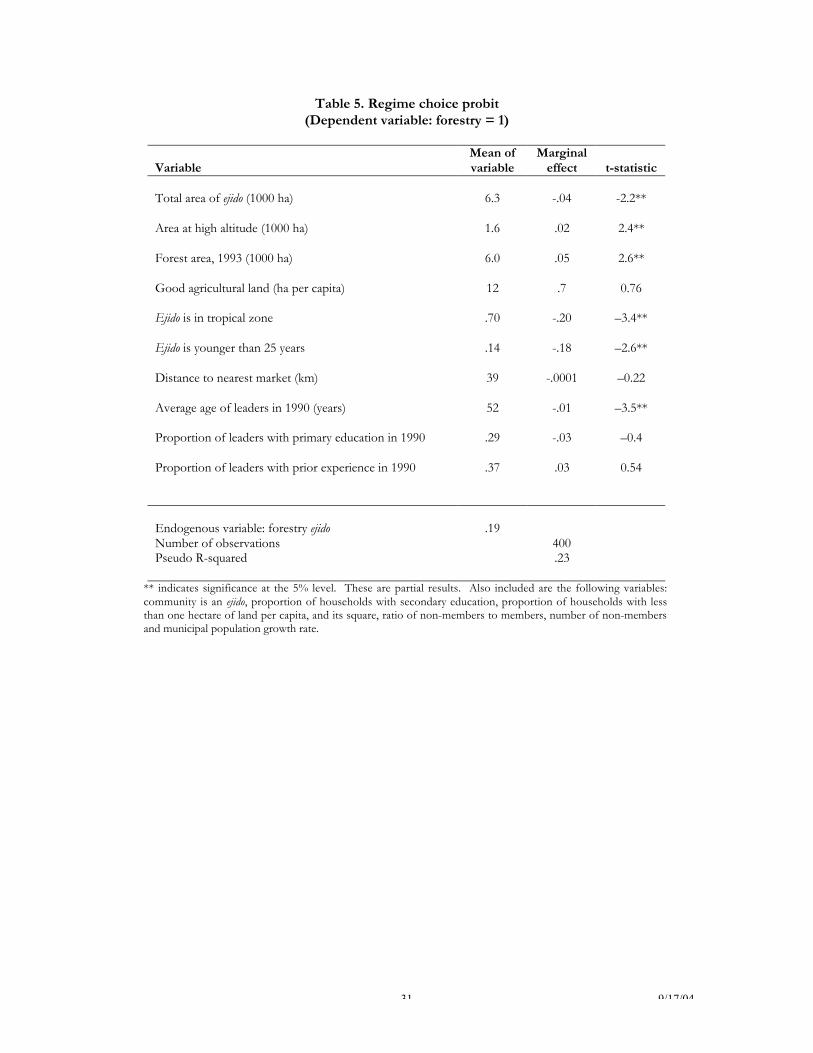
The equation of land use change in each regime is then estimated simultaneously with regime
choice. In the regime choice equation, explanatory variables include the entry costs variables as well
as the characteristics included in the land use change regressions. Table 5 reports partial results,
focusing on the entry cost variables. Variables that represent the potential value of a forestry project
include ejido size, forest type and stock size, hectares at high altitude, and distance from nearest
market. Ejidos formed at a later date (later than 1975) are more likely to have found themselves
endowed with already degraded forest as the land reform was extended to increasingly marginal land,
so this variable is a proxy for forest quality. Competition with livestock and agriculture is
represented by good agricultural land per capita. Also included are variables that describe the leaders
in 1990: their age, education, and previous leadership experience.
We find support for the hypotheses stated in the regime choice section. Being a young ejido,
which suggests low forest quality, decreases the probability of choosing forestry by 18 percentage
points. Ejidos found in tropical zones are much less likely (20 percentage points) to enter into
forestry. The initial forest area and land at high altitude increase the probability of forestry. Holding
these two variables constant and increasing the overall size of the ejido decreases the likelihood of
entering into forestry, probably because it increases the distance to the forest. Finally, leadership is
important: having leaders ten years younger increases the probability of choosing forestry by nearly
10 percentage points.
TABLE 5 HERE
- 21 - 9/17/04
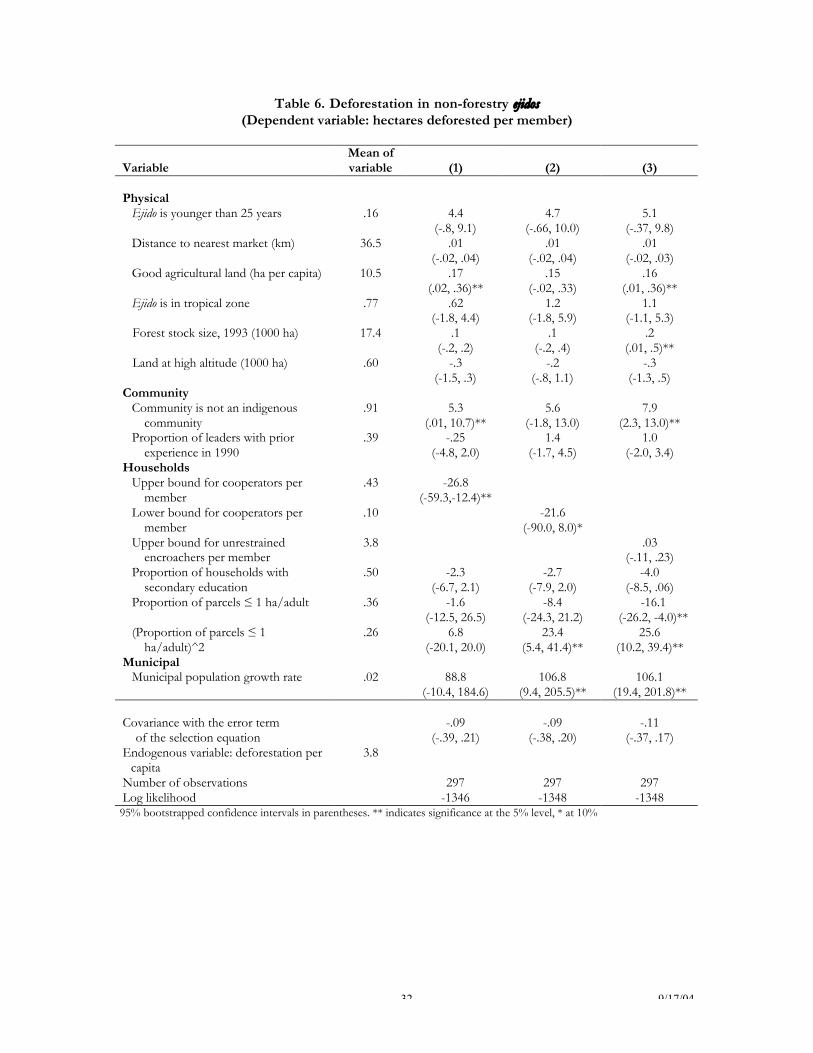
Table 6 shows the estimates for deforestation in non-forestry ejidos, following the
classification of variables introduced in Table 1.4 Because our theory describes individual behavior
within a community, we use average deforestation per ejido member as the dependent variable in the
deforestation regressions. The key variable of the theory, the size of the group of cooperators, has
the expected significant negative effect. Both upper and lower bound variables reveal a similar effect.
An increase of .10 in the proportion of cooperators among members may decrease forest loss by
approximately 2.7 hectares per capita. Compared to the average forest loss per capita of 4.4 hectares,
this is quite important. In the case of the unrestrained encroaching group, the point estimate for the
upper bound is positive but imprecise. As the lower bound of encroacher is just one minus the
upper bound of the cooperators, we do not use this variable. Among physical characteristics of the
ejido, an increase in good agricultural land per capita, reflecting an increase in the opportunity cost of
the forest, increases deforestation. The number of households with small plots per adult and
population pressure captures the demand for land. For ejidos with more than a few parcels smaller
than 1ha/adult (beyond 18 to 32% when the average is 36%), an increase in the number of small
parcels increases deforestation. The population pressure effect, as reflected in municipal population
growth over the period, is consistently positive. The non-significance of the estimated covariance
between the error terms indicates no evidence of unobservable characteristics of the ejidos that would
both condition the choice of regime and the deforestation level.
INSERT TABLE 6
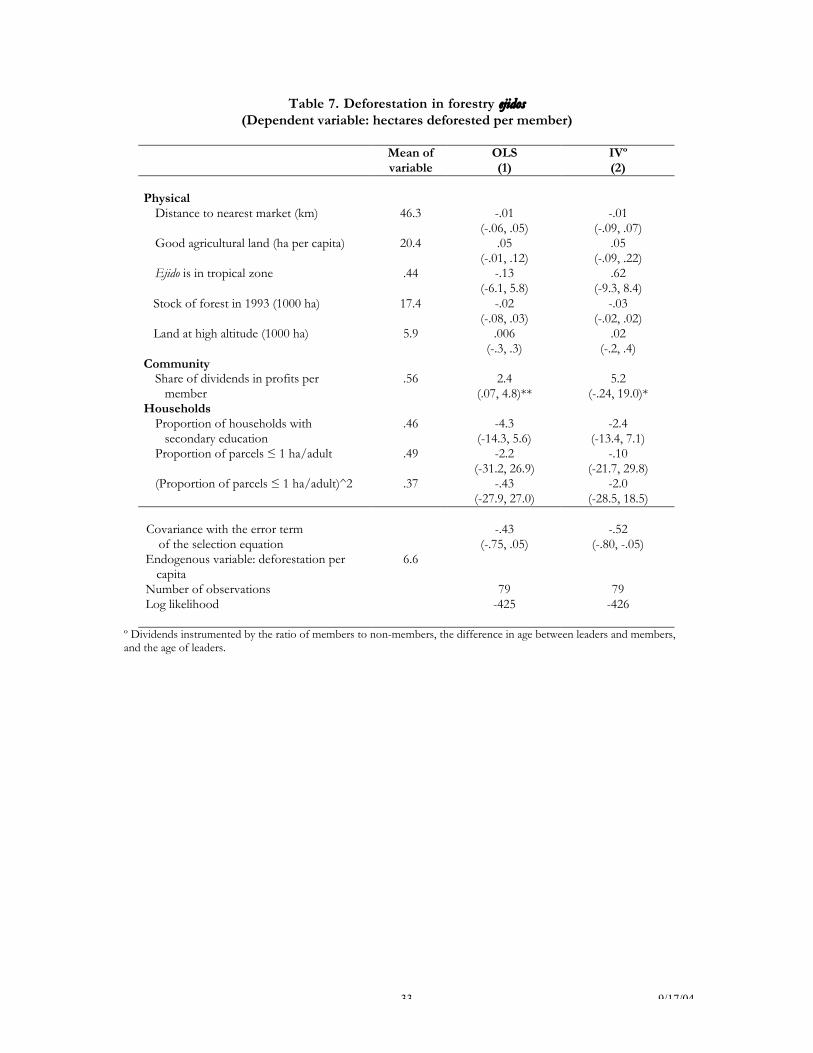
In order to estimate deforestation in forestry ejidos, we use the variables identified in the two
models of community behavior representing physical, community, and household characteristics.
Here, we exclude the variable used to describe forest quality due to the fact that there is not sufficient
variation in it for this part of the sample – only 3 of the forestry ejidos are less than 25 years old.
4 Among the expected community variables, we omitted the number of members, as it was not significant andcould cause spurious correlation with the endogenous variable of deforestation per capita. Inequality iscaptured by the proportion of small parcels. Aggregate variables for the household individual encroachmentlevels are share of small parcels, municipal growth rate (as a proxy for population pressure in the ejido), andeducation as a proxy for employment opportunities.
- 22 - 9/17/04
Because of the small number of degrees of freedom and their lack of significance, the number of
members and municipal population growth rates are not included either. Including these variables
does not significantly affect the sign, magnitude, or significance of the other exogenous variables.
Since profit allocation is an endogenous choice, we instrument for it using the ratio of members to
non-members, the difference in age between leaders and ejidatarios, and the age of leaders.
Table 7 shows the results, following the classification of variables reported in Table 1. Most
of the estimated parameters have very large standard errors, probably due to the small sample size.
We see, however, that the key variable in the theory, the share of profits in dividends per ejidatario,
has the predicted positive sign and is significant in both estimates. The point estimates imply that if
we increase each ejidatarios’ share of dividends by .5 (doubling the mean), deforestation increases by
1.2 to 2.1 hectares per capita. The negative covariance with the error term of the selection equation
indicates that the unobserved factors that induce ejidos toward choosing to undertake a forestry
project contribute to lower the deforestation rate.
Finally, one can simulate the effect of incorporating as members some of the current non-
members, a solution to commons management problems suggested by Muñoz-Piña et al. (2003). If
all of the forestry communities were to incorporate 100 new members from among the non-
members, then the average predicted deforestation per capita would decrease by 2.8 hectares. This
results from both a change in the predicted amount of dividends and in the amount of land per
capita. Because the effect of the membership ratio is highly non-linear, an increase of 100 members
actually decreases the amount of profits allocated to dividends by nine percent.
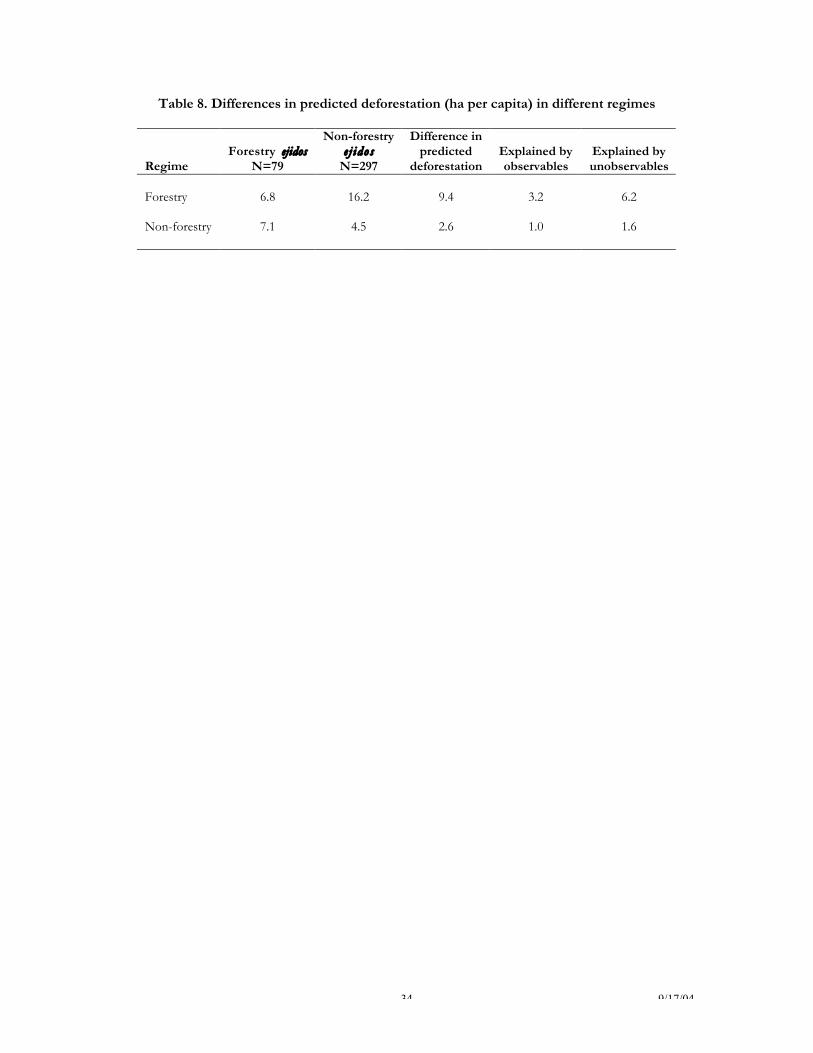
According to the analysis, high deforestation in ejidos with forestry projects results from the
dilemma posed by the presence of non-community members living in the ejidos and from the
prevailing high discount rates associated with poverty. A disturbing fact is that ejidos with forestry
projects have higher deforestation rates than non-forestry ejidos. We observed this in the descriptive
statistics. This is also confirmed by the regression analysis in which we control for self-selection into
forestry. The predicted average deforestation for ejidos in forestry is 6.8 hectares per capita over a
- 23 - 9/17/04
seven year time period. Using the model of deforestation for non-forestry ejidos, and properly
correcting for self-selection into the forestry regime, their predicted level of deforestation if they
were non-forestry instead of forestry would be 7.1 hectares per capita. For non-forestry ejidos, the
predicted average deforestation per capita is 4.5 hectares, lower than that of the forestry ejidos, even if
they choose not to do forestry. Should all of the non-forestry communities suddenly begin forestry
projects, their predicted average deforestation per capita would increase to 16.2. These results are
shown in Table 8. This table also shows the decomposition of the difference in predicted
deforestation for ejidos in and out of their own regimes. Non-forestry ejidos have higher
deforestation when they are put in forestry regimes as a result of observables (more non-members
and less hectares in forest) and unobservables. Similarly, forestry ejidos are predicted to have higher
deforestation in non-forestry regimes due to their higher agricultural land per capita and large
proportion of population with small parcels (observables), as well as the same large differences in the
unobservable characteristics that make them choose forestry. This could indicate that as currently
managed and regulated, the forestry projects are not sufficiently profitable for ejidos to maintain their
resource and ensure its long term sustainability.
INSERT TABLE 8
7. CONCLUSIONS
The main conclusion of our analysis is that deforestation is affected by the institutional
choices that communities make – whether to choose forestry or not – as well as the dynamics within
these different regimes, and policies must be tailored to address this heterogeneity. We have
developed two theories to describe deforestation in communities with and without forestry projects,
where the former is a story of conflict management and the latter of partial cooperation. We find
that large ejidos from non-tropical ecological zones with more area at high altitude and younger
leaders are more likely to have a forestry project. Younger ejidos, however are much less likely to
exploit their forest, probably because they have inherited low quality forest. For ejidos that choose

- 24 - 9/17/04
not to have forestry exploitation, we show that deforestation is largely related to the ability of the
community to induce as large a group of households as possible to cooperate in not encroaching.
The members of that coalition are more likely to be younger households with sufficient private land,
but not having exercised a leadership position. The coalition is also larger in small ejidos with
experienced leaders.
When ejidos with non-members present in the community choose to enter forestry, the main
determinant of their deforestation is their choice of how to divide up profits between dividends and
public goods. Holding all else constant, a larger investment in public goods helps reward non-
members for not encroaching and decreases forest loss per member. In addition, incorporation of
new members into forestry ejidos can help decrease deforestation. We are also presented with a
puzzle with regards to productive forestry. While it is true that forestry ejidos would deforest more
even if they did not do forestry, we also find that non-forestry ejidos, were they to enter into forestry,
would have significantly higher deforestation per member. This suggests that forestry projects as
they now exist in Mexico are contributing to the deforestation problem because they are not
sufficiently profitable relative to land use in agriculture and pasture. We conclude that serious
analysis and reform of the current forestry incentive and regulation systems is imperative.
The findings also shed light on a targeting strategy for the policy that Mexico is currently
considering to mitigate their deforestation problem – introduction of payments for environmental
services. This is one strategy to raise the profitability of the forest relative to agriculture, and should
be given to communities with forests at higher risk of forest loss, namely large ejidos with low-sloped
land of high quality and leaders with little previous experience in management.
8. REFERENCES
Alston, L.J., Libecap, G.D., and Mueller, B. (2000). Land reform Policies, the Source of Violent Conflict andImplications for Deforestation in the Brazilian Amazon. Journal of Environmental Economics and Management , 39,162-188.
Angelsen, A. (2001) Playing Games in the Forest: State-Local Conflicts of Land Appropriation. Land Economics,77(2), 285-299.
Baland, J-M. and Platteau, J.P. (1996). Halting Degradation of Natural Resources: Is There a Role for Rural Communities?Oxford, New York: Oxford University Press.
- 25 - 9/17/04
Barbier, E. (2001). The Economics of Tropical Deforestation and Land Use: An Introduction to the SpecialIssue. Land Economics, 77 (2), 155-171.
Bardhan, P., M. Ghatak, and A. Karaivanov. (2002). Inequality, Market Imperfections and the VoluntaryProvision of Collective Goods. Working paper, MacArthur Network on the Effects of Inequality on EconomicPerformance. http://globetrotter.berkeley.edu/macarthur/inequality/papers/#Bardhan.
Barrett, S. (1989). On the Nature and Significance of International Environmental Agreements. LondonBusiness School.
Barrett, S. (1994). Self-Enforcing International Environmental Agreements. In A. Batabyal (Ed.) The Economicsof International Environmental Agreements. Aldershot: Ashgate Press.
Bianco, W.T. and Bates, R. (1990). Cooperation by Design: Leadership, Structure, and Collective Dilemmas.The American Political Science Review, 84 (1), 133-147.
Carraro, C. and Siniscalco (1993). Strategies for the International Protection of the Environment. In A.Batabyal (ed.) The Economics of International Environmental Agreements. Aldershot: Ashgate Press.
CNF, Comisión Nacional Forestal, Semarnat/Conafor (2001) Programa Nacional Forestal 2001-2006.
Chomitz, K. and Gray, D. (1996). Roads, Land Use and Deforestation: a spatial model applied to Belize. WorldBank Economic Review, 10, 487–512.
Cropper, M., Puri, J. and Griffiths., C. (2001). Predicting the Location of Deforestation: The Role of Roads andProtected Areas in North Thailand. Land Economics, 77 (2), 172-186.
Deininger, K. and Minten, B. (1999). Poverty, Policies, and Deforestation: The Case of Mexico. EconomicDevelopment and Cultural Change, 47 (2), 313-325.
Fischer, G. et al. (2002) Global Agro-ecological Assessment for Agriculture in the 21st Century: Methodology and ResultsRome: FAO.
Godoy, R. and Contreras, M. (2001). A Comparative Study of Education and Tropical Deforestation amongLowland Bolivian Amerindians: Forest Values, Environmental Externality, and School Subsidies. EconomicDevelopment and Cultural Change, 49 (3), 555-574.
Kaimowitz, D. and A. Angelsen (1998) Economic Models of Tropical Deforestation: A Review. Bogor, Indonesia:Center for International Forestry Research (CIFOR).
Ligon, E. and Nairain, U. (1998). Government Management of Village Commons: Comparing Two ForestPolicies. Journal of Environmental Economics and Management, 37, 272-289.
Monroe, D.K., Southworth, J. and Tucker, C. (2002). The dynamics of land-cover change in westernHonduras: exploring spatial and temporal complexity. Agricultural Economics, 27, 355-369.
Muñoz-Piña, C., de Janvry, A., and Sadoulet, E. (2003). Recrafting Rights over Common Property Resourcesin Mexico: Divide, Incorporate, and Equalize. Economic Development and Cultural Change, 52(1): 129-158.
Olson, M. (1965). The Logic of Collective Action: Public Goods and the Theory of Groups. Cambridge, M.A.: HarvardUniversity Press.
Runge, C.F. (1986) Common Property and Collective Action in Economic Development World Development,14(5), 623-635.
- 26 - 9/17/04
Petrakis, E. and Xepapadeas, A. (1996). Environmental Consciousness and Moral Hazard in InternationalAgreements to Protect the Environment. In A. Batabyal (Ed.) The Economics of International EnvironmentalAgreements, Aldershot: Ashgate Press.
Torres-Rojo, J.M. and Flores-Xolocotzi, R. (2001). Deforestation and Land Use Change in Mexico. In ClimateChange and Forest Management in the Western Hemisphere. Haworth Press, Inc.
Vance, C. and Geoghegan, J. (2002). Temporal and Spatial Modeling of Tropical Deforestation: a survivalanalysis linking satellite and household survey data. Agricultural Economics, 27, 317–332
Velásquez, A., Mas, J. and Palacio, J.L. (2002). Análisis del cambio de uso del suelo. Convenio INEIGg(UNAM) Oficio de autorización de inversion 213.A. -00215. January.
- 27 - 9/17/04
9. TABLES AND FIGURES
Table 1. Variables included in models and their anticipated effects on deforestation
Variable Non-forestry ejidos Forestry ejidosPhysical
zf Forest quality indicators Forest quality Forest accessibility
–+
+/–+
zp Indicators of potential quality of forest land in pasture and agriculture
Potential agricultural land: low slope + high soil quality
+ +
zk , z
c Physical characteristics that affect the cost of encroachment Ecosystem type +/– +/–
zq Characteristics that increase the possibility that deforestation go undetected
Distance from forest service office no effect +
F Stock of forest in base year no effect +
Communityδ Characteristics that make rule enforcement more difficult Number of community members
Inequality in parcel size Experience & education of leaders
γ Share of forest profits to dividends
++/–
–no effect
+no effectno effect
+
Households
zi
f Factors that influence benefits from forest products
Membership Leadership position in community
–+/–
–no effect
zi
p Factors that make encroachment more attractive
Size of private land holdings Household size/pop. growth Employment opportunities Remittances
–+–
+/–
–+–
+/–
- 28 - 9/17/04
Table 2. Contrasting non-forestry and forestry ejidos
Characteristic Non-forestry Forestryt-stat for test of
difference
Community Number of ejidos (n)
Total area of ejido (ha)
Distance to nearest market (km)
Area at high altitude (ha)
Number of members in 1990
Ratio of non-members to members
Good agricultural land (ha per capita)
Households Number of households (M)
Parcel size (ha per adult)
Cattle (number per ha)
Household has at least one memberwith secondary education (rate)
Deforestation
Forest loss in 1993-2000 (ha)
Forest loss per ejido member in 1990 (ha)
Share of total deforestation (%)
326
4512
36.5
759
153
3.1
10.5
11,350
4.7
1.3
0.48
253
3.8
66
79
14,046
46.3
5,798
203
2.2
20.4
2,975
2.9
1.9
0.43
920
6.6
34
–5.60
–1.60
–6.56
–1.02
1.43
–2.68
6.56
–4.77
5.60
-4.47
-1.41
- 29 - 9/17/04
Table 3. Membership in cooperation classes by deforestation rates
Cooperation Class Index
Ejidos withreforestation or no
changeN=119
Ejidos with ≤ 2 hadeforestation per
capitaN=94
Ejidos with > 2ha deforestation
per capitaN=85
Percentage distribution of members across cooperation classes:
Unrestrained encroachers
Unrestrained encroachers orcooperators
Active cooperators
Passive cooperators
Ratio of non-members (N) tomembers (M)
K
K or J
J
I
24
33
12
31
2.7
23
31
14
33
4.2
31
19
09
41
2.5
The categories were created as follows: Unrestrained encroachers are users of the commons with parcels ≤ onehectare/household adult. Encroachers or cooperators are users of the commons with > onehectare/household adult. Active cooperators are non-users of the commons with ≤ one hectare ofland/household adult and passive cooperators are non-users of the commons with > one hectare ofland/household adult.
- 30 - 9/17/04
Table 4. Determining use of the commons in non-forestry ejidosProbit (Dependent variable: agriculture or pasture use = 1)
VariableMean ofvariable
Marginaleffect t-statistic
Household characteristicsNumber of members with secondary education
Number of members emigrated to U.S.
Age of household head
Parcel size (ha per adult)
(Parcel size)^2
A household member has held leadership position
Ejido characteristicsTotal area of ejido (1000 ha)
Area of ejido at high altitude (1000 ha)
Good agricultural land (ha per capita)
Number of members in 1990
Proportion of leaders with primary education in 1990
Proportion of leaders with previous experience in 1990
Average age of leaders in 1990
Inequality in parcel size (Gini coefficient)
Proportion of parcels ≤ 1 ha/adult
(Proportion of parcels ≤ 1 ha/adult)^2
Community is not an indigenous community
Municipal characteristicsMunicipal population growth rate
1.28
.64
51.7
4.7
263
.41
5.287
0.598
10.7
172
.31
.41
53.4
.67
.38
.27
.88
.02
–.002
–.01
.001
–.01
.0001
.07
.02
–.003
.0007
–.0002
–.19
.02
.003
.21
.49
–.21
.09
.48
–0.23
–1.2
1.6
–2.1**
2.2**
2.7**
2.25**
–.19
0.2
–1.7
–1.9**
.23
1.1
0.80
1.5
–0.6
0.61
.20
Endogenous variable: Household uses the commonsNumber of observationsPseudo R-squared
.528,418.11
** indicates significance at the 5% level.
- 31 - 9/17/04
Table 5. Regime choice probit(Dependent variable: forestry = 1)
VariableMean ofvariable
Marginaleffect t-statistic
Total area of ejido (1000 ha)
Area at high altitude (1000 ha)
Forest area, 1993 (1000 ha)
Good agricultural land (ha per capita)
Ejido is in tropical zone
Ejido is younger than 25 years
Distance to nearest market (km)
Average age of leaders in 1990 (years)
Proportion of leaders with primary education in 1990
Proportion of leaders with prior experience in 1990
6.3
1.6
6.0
12
.70
.14
39
52
.29
.37
-.04
.02
.05
.7
-.20
-.18
-.0001
-.01
-.03
.03
-2.2**
2.4**
2.6**
0.76
–3.4**
–2.6**
–0.22
–3.5**
–0.4
0.54
Endogenous variable: forestry ejidoNumber of observationsPseudo R-squared
.19400.23
** indicates significance at the 5% level. These are partial results. Also included are the following variables:community is an ejido, proportion of households with secondary education, proportion of households with lessthan one hectare of land per capita, and its square, ratio of non-members to members, number of non-membersand municipal population growth rate.
- 32 - 9/17/04
Table 6. Deforestation in non-forestry ejidos(Dependent variable: hectares deforested per member)
VariableMean ofvariable (1) (2) (3)
PhysicalEjido is younger than 25 years .16 4.4
(-.8, 9.1)4.7
(-.66, 10.0)5.1
(-.37, 9.8)Distance to nearest market (km) 36.5 .01
(-.02, .04).01
(-.02, .04).01
(-.02, .03)Good agricultural land (ha per capita) 10.5 .17
(.02, .36)**.15
(-.02, .33).16
(.01, .36)**Ejido is in tropical zone .77 .62
(-1.8, 4.4)1.2
(-1.8, 5.9)1.1
(-1.1, 5.3) Forest stock size, 1993 (1000 ha) 17.4 .1
(-.2, .2).1
(-.2, .4).2
(.01, .5)** Land at high altitude (1000 ha) .60 -.3
(-1.5, .3)-.2
(-.8, 1.1)-.3
(-1.3, .5)Community
Community is not an indigenouscommunity
.91 5.3(.01, 10.7)**
5.6(-1.8, 13.0)
7.9(2.3, 13.0)**
Proportion of leaders with priorexperience in 1990
.39 -.25(-4.8, 2.0)
1.4(-1.7, 4.5)
1.0(-2.0, 3.4)
HouseholdsUpper bound for cooperators per
member.43 -26.8
(-59.3,-12.4)**Lower bound for cooperators per
member.10 -21.6
(-90.0, 8.0)*Upper bound for unrestrained
encroachers per member3.8 .03
(-.11, .23)Proportion of households with
secondary education.50 -2.3
(-6.7, 2.1)-2.7
(-7.9, 2.0)-4.0
(-8.5, .06)Proportion of parcels ≤ 1 ha/adult .36 -1.6
(-12.5, 26.5)-8.4
(-24.3, 21.2)-16.1
(-26.2, -4.0)**(Proportion of parcels ≤ 1
ha/adult)^2.26 6.8
(-20.1, 20.0)23.4
(5.4, 41.4)**25.6
(10.2, 39.4)**Municipal
Municipal population growth rate .02 88.8(-10.4, 184.6)
106.8(9.4, 205.5)**
106.1(19.4, 201.8)**
Covariance with the error term of the selection equation
-.09(-.39, .21)
-.09(-.38, .20)
-.11(-.37, .17)
Endogenous variable: deforestation percapita
Number of observationsLog likelihood
3.8
297-1346
297-1348
297-1348
95% bootstrapped confidence intervals in parentheses. ** indicates significance at the 5% level, * at 10%
- 33 - 9/17/04
Table 7. Deforestation in forestry ejidos(Dependent variable: hectares deforested per member)
Mean ofvariable
OLS(1)
IVº(2)
PhysicalDistance to nearest market (km) 46.3 -.01
(-.06, .05)-.01
(-.09, .07)Good agricultural land (ha per capita) 20.4 .05
(-.01, .12).05
(-.09, .22)Ejido is in tropical zone .44 -.13
(-6.1, 5.8).62
(-9.3, 8.4) Stock of forest in 1993 (1000 ha) 17.4 -.02
(-.08, .03)-.03
(-.02, .02) Land at high altitude (1000 ha) 5.9 .006
(-.3, .3).02
(-.2, .4)Community
Share of dividends in profits permember
.56 2.4(.07, 4.8)**
5.2(-.24, 19.0)*
HouseholdsProportion of households with
secondary education.46 -4.3
(-14.3, 5.6)-2.4
(-13.4, 7.1)Proportion of parcels ≤ 1 ha/adult .49 -2.2
(-31.2, 26.9)-.10
(-21.7, 29.8)(Proportion of parcels ≤ 1 ha/adult)^2 .37 -.43
(-27.9, 27.0)-2.0
(-28.5, 18.5)
Covariance with the error term of the selection equation
-.43(-.75, .05)
-.52(-.80, -.05)
Endogenous variable: deforestation percapita
Number of observationsLog likelihood
6.6
79-425
79-426
º Dividends instrumented by the ratio of members to non-members, the difference in age between leaders and members,and the age of leaders.
- 34 - 9/17/04
Table 8. Differences in predicted deforestation (ha per capita) in different regimes
RegimeForestry ejidos
N=79
Non-forestrye j i do s
N=297
Difference inpredicted
deforestationExplained byobservables
Explained byunobservables
Forestry
Non-forestry
6.8
7.1
16.2
4.5
9.4
2.6
3.2
1.0
6.2
1.6