a tale of two states: an ebp report card american probation and parole association february 2008
DESCRIPTION
A Tale of Two States: An EBP Report Card American Probation and Parole Association February 2008. Mark Rubin Research Associate Muskie School of Public Service University of Southern Maine. Meghan Howe Senior Project Manager Crime and Justice Institute. Michael Kane - PowerPoint PPT PresentationTRANSCRIPT

A Tale of Two States:
An EBP Report Card
American Probation and Parole Association
February 2008
Mark RubinResearch AssociateMuskie School of Public ServiceUniversity of Southern Maine
Meghan HoweSenior Project ManagerCrime and Justice Institute
Michael KaneAssistant Project ManagerCrime and Justice Institute
Dot FaustCorrectional Program SpecialistNational Institute of Corrections

Project Overview

Implementing Effective Correctional Management of Offenders in the Community NIC/CJI Project
Four Project Sites
Maine (2004-2007)
Illinois (2004-2007)
Maricopa County, Arizona (2007-2009)
Orange County, California (2008-2010)
What gets MEASUREDis what gets DONE
If you can’t MEASURE it
you can’t MANAGE it
1 2 3 4 5 6 7 8

Measuring for Management and Evaluation
Offender Demographics and Case Info Criminal History Risk Level/Gain Scores Treatment Data
Offender Outcomes Re-arrest, reconviction, revocations
Intermediate Measures/Implementation Data Completion of Assessment/Reassessment Completion of Case Plan Treatment Referrals Quality Assurance Information
Organizational Climate Collaboration

Maine: Contextual Background

A Centralized Structure

Staffing Structure Associate Commissioner for Adult Community
Services
4 Regional Administrators
4 Assistant Regional Administrators
2 Resource Coordinators
74 Probation Officers
~Specialized Caseloads in Sex Offenders and Domestic Violence

Supervision Types
Parole: “Has nearly been phased out. Represents a very small number of Inmates”
Supervised Community Confinement: “Generally low risk inmates meeting requirements are allowed to serve the remainder of a sentence under community supervision”
Probation: “A term of supervision ordered as a disposition by a sentencing Court. Is the majority of the Adult Community population”

Offender Management System
CORIS ● CORrections Information System
A fully integrated, web based MIS system designed to manage all aspects of MDOC data.
In production since 2003 with detailed records for over 60,000 clients
Extensive operational and reporting functionality including: Adult and Juvenile Facility Corrections Adult and Juvenile Community Services Central Office Administration

Current FunctionalityCommunity
IntakeAlerts & Concerns EducationCase Load Sentence CalculationChargesDetentionsConditional ReleaseConditionsInformal ResolutionInterstate CompactSupervised Community ConfinementCase PlanProgramsAssessmentLSI / YOLSIProbation StatisticsRoad NotesCase Load ReportForm LettersCivilian ContactsMessage BoardSex Offender AssessmentUnassigned CasesRestitution and Fees
Institution
Intake and AdmitRelease Date CalculationsChargesSentences/DispositionsClassificationHousing AssignmentsInstitutional JobsGood Time Sentence AdjustmentInstitutional IncidentsEscapesKeep SeparatesSpecial ManagementPrograms and TreatmentTransport and TransferVictim NotificationPrisoner PropertyCivilian ContactsMessage BoardBatch Count ReportsMedicaid / MaineCareFurloughClassification RatingState PropertyRestitution

ME: The Data Collection Process

Research TeamSubcommittee Members and Responsibilities
Agency Representative(s) Roles
MDOC AdministrationNIC Project ManagerBusiness AnalystManagement Analyst
Chair & staff research subcommitteeLiaison and ensure ongoing communication between research subcommittee, internal policy committee, and other DOC staff, RCAsIdentify intersection issues between implementation and researchReview and provide comment on research reports
SAC Director’s OfficeResearch Associates
SAC / Cooperative agreement management & reporting with NICLead the research, working in collaboration with DOC to guide the work of the research subcommitteeData collection, compilation, analysis, and reporting
MDOC – Maine Department of Corrections SAC – University of Southern Maine, Statistical Analysis Center

Data DictionaryMaking Sense of It All
Review of Variables Data Availability Policy / Practice Issues
Divide and Conquer Demographic Information Individual Case Level (supervision /
assessment) Case Level Variables (treatment / programs) Case Level Outcomes (arrest and revocation)
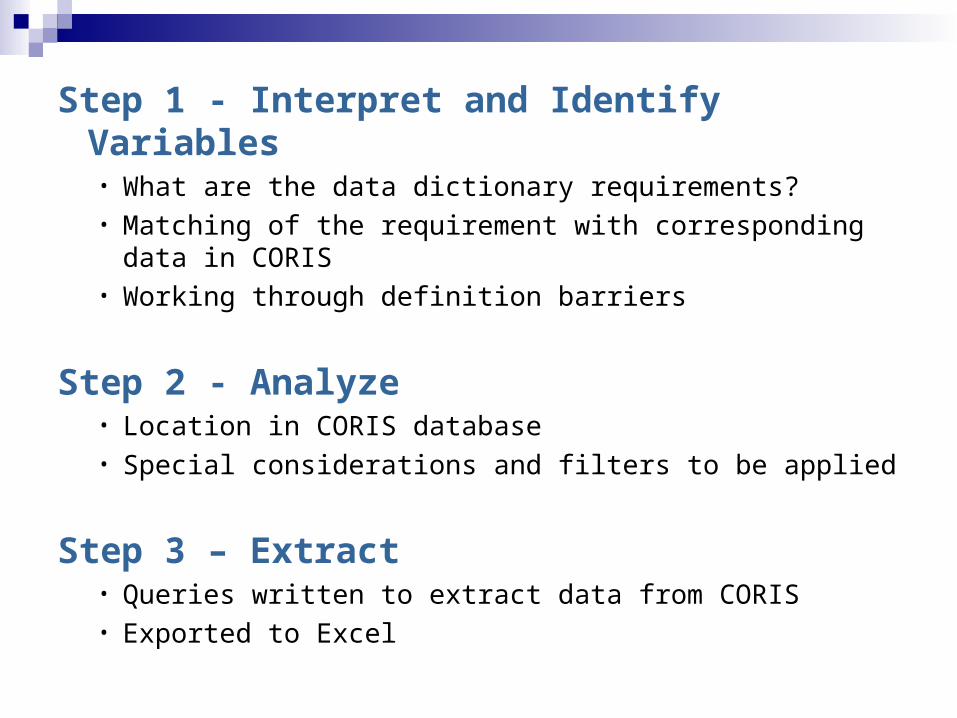
Data ExtractionStep 1 - Interpret and Identify Variables• What are the data dictionary requirements?• Matching of the requirement with corresponding
data in CORIS• Working through definition barriers
Step 2 - Analyze• Location in CORIS database• Special considerations and filters to be applied
Step 3 – Extract• Queries written to extract data from CORIS• Exported to Excel
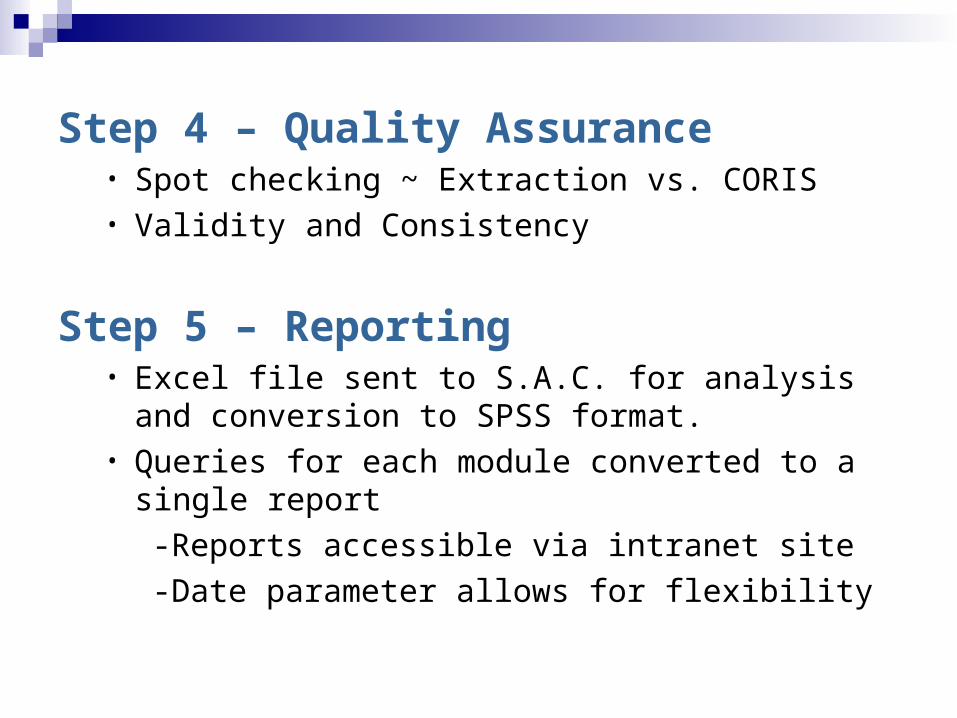
Data Extraction Cont…Step 4 – Quality Assurance• Spot checking ~ Extraction vs. CORIS• Validity and Consistency
Step 5 – Reporting • Excel file sent to S.A.C. for analysis and
conversion to SPSS format.• Queries for each module converted to a single
report-Reports accessible via intranet site -Date parameter allows for flexibility
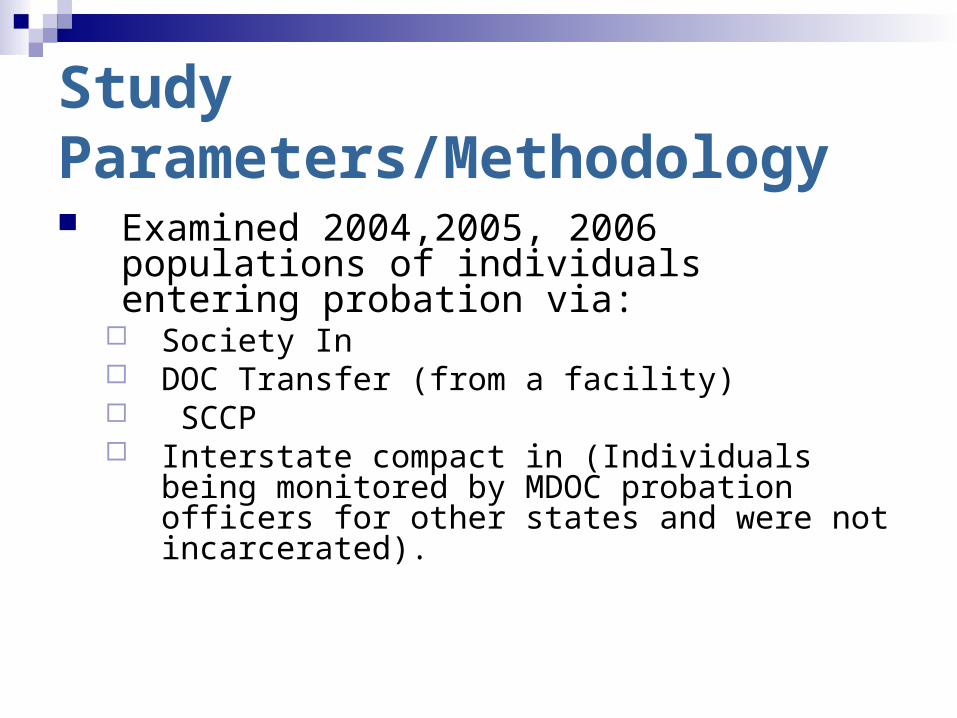
Study Parameters/Methodology Examined 2004,2005, 2006 populations
of individuals entering probation via: Society In DOC Transfer (from a facility) SCCP Interstate compact in (Individuals being
monitored by MDOC probation officers for other states and were not incarcerated).

Variable categories
• Demographic (age, gender, race, etc.)• Individual Case Level (supervision start
date, presenting offense, probation office, LSI score (with domain scores), etc.)
• Case Level Outcomes (arrest, revocations, and violations histories)
• Case Level Variables (treatment info.)*
* Not available at this time
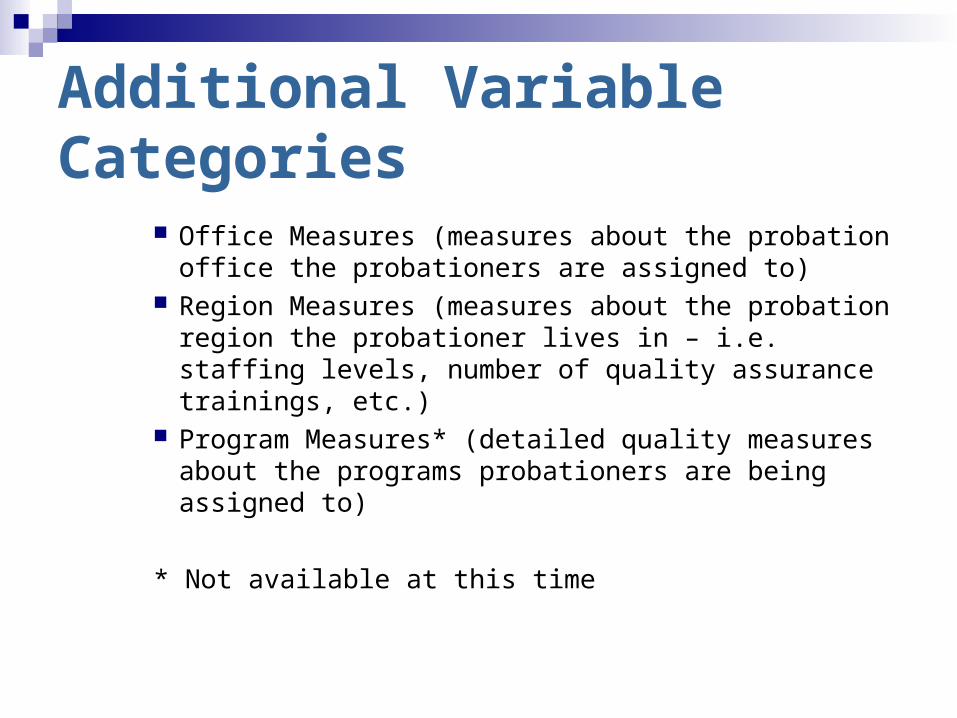
Additional Variable Categories
Office Measures (measures about the probation office the probationers are assigned to)
Region Measures (measures about the probation region the probationer lives in – i.e. staffing levels, number of quality assurance trainings, etc.)
Program Measures* (detailed quality measures about the programs probationers are being assigned to)
* Not available at this time

TABLE 3. DATA QUALITY
Gender Education Level
Minority Status Employment Status
GED Age at First Arrest
Marital Status Number of Priors
Current Age Proxy Risk Score
Total Risk Score Total Protective Score
Length of Probation LSI Subscales
Office Contacts
Phone Contacts
Home Contacts
Collaterol Contacts
New Arrest
Probation Violations
Technical Violations
Probation Revocations
LSI Risk Level
Months to Arrest
Days-to-First Violation
Consistent/Populated (CP) Consistent/Unpopulated (CU)
Inconsistent/Populated (IP) Inconsistent/Unpopulated (IU)

ME: Individual Case-Level Data
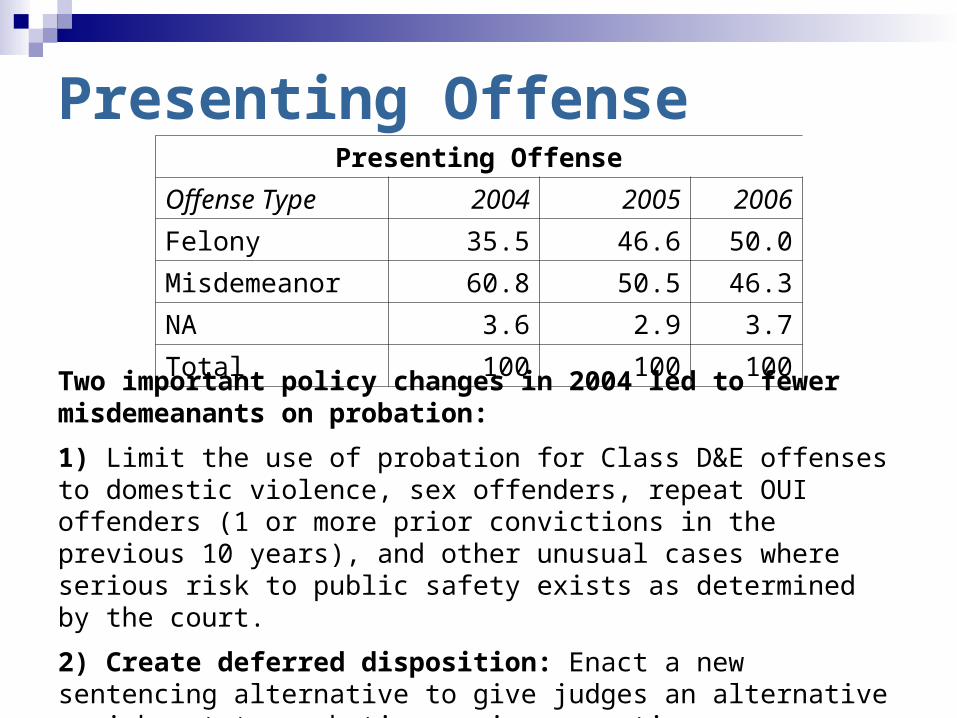
Presenting Offense
Two important policy changes in 2004 led to fewer misdemeanants on probation:
1) Limit the use of probation for Class D&E offenses to domestic violence, sex offenders, repeat OUI offenders (1 or more prior convictions in the previous 10 years), and other unusual cases where serious risk to public safety exists as determined by the court.
2) Create deferred disposition: Enact a new sentencing alternative to give judges an alternative punishment to probation or incarceration.
Presenting Offense
Offense Type 2004 2005 2006
Felony 35.5 46.6 50.0
Misdemeanor 60.8 50.5 46.3
NA 3.6 2.9 3.7
Total 100 100 100

Top 3 Crimes of Probation Entrants
Crimes
Offense Type 2004200
5 2006
Assault/ Threatening 26.0
30.8 29.1
Drugs 11.110.6 14.3
OUI 12.412.2 12.3
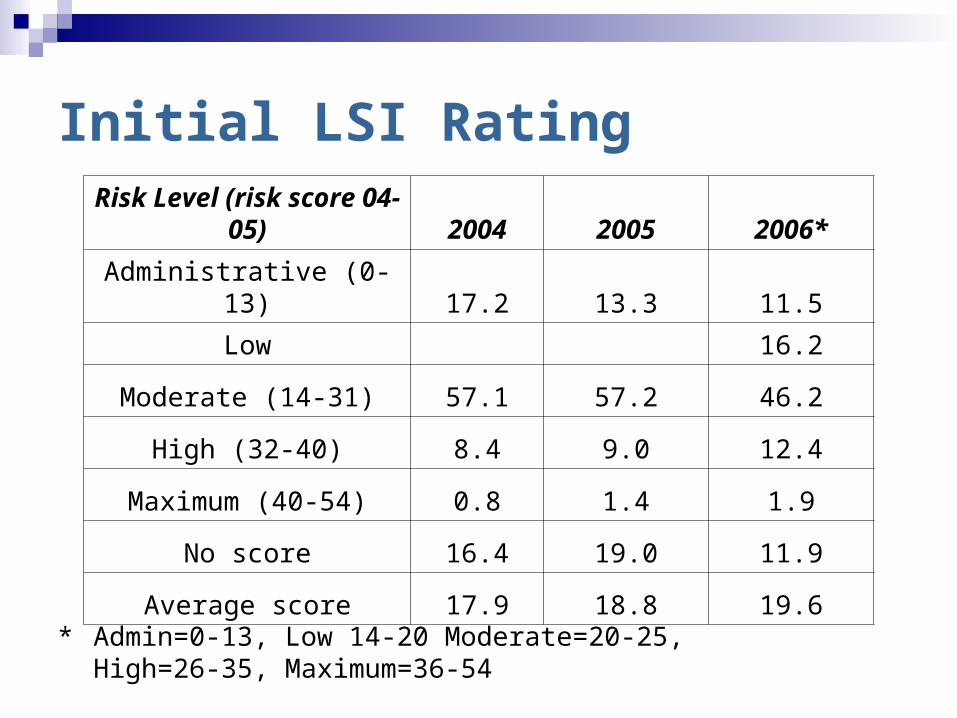
Initial LSI Rating
* Admin=0-13, Low 14-20 Moderate=20-25, High=26-35, Maximum=36-54
Risk Level (risk score 04-05) 2004 2005 2006*
Administrative (0-13) 17.2 13.3 11.5
Low 16.2
Moderate (14-31) 57.1 57.2 46.2
High (32-40) 8.4 9.0 12.4
Maximum (40-54) 0.8 1.4 1.9
No score 16.4 19.0 11.9
Average score 17.9 18.8 19.6

ME: Case Level Outcomes
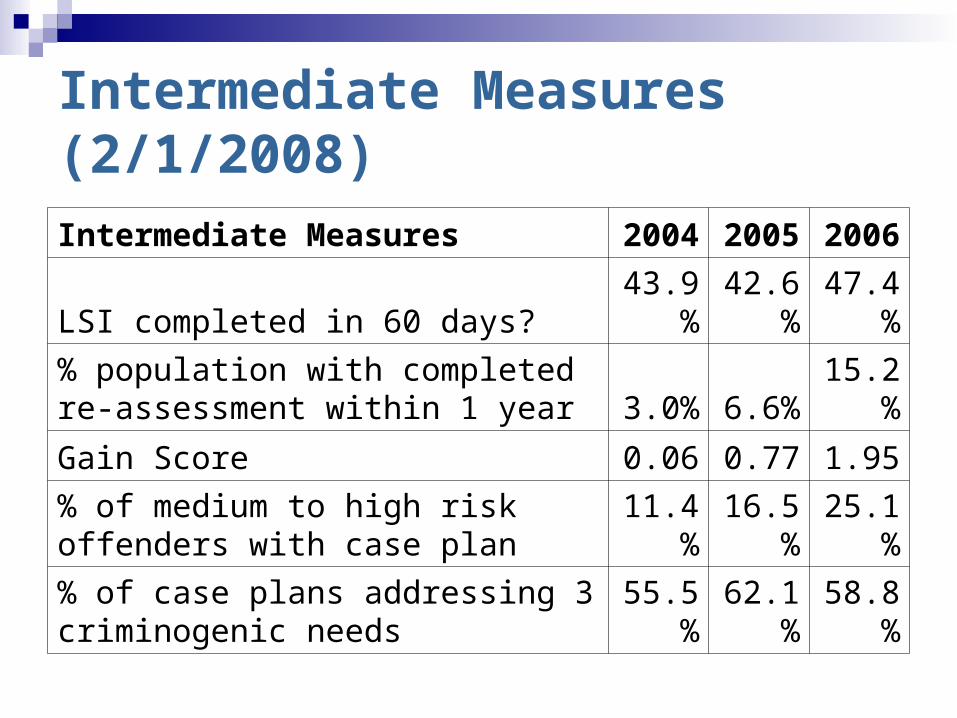
Intermediate Measures (2/1/2008)
Intermediate Measures200
4200
5200
6
LSI completed in 60 days?43.9
%42.6
%47.4
%
% population with completed re-assessment within 1 year 3.0% 6.6%
15.2%
Gain Score 0.06 0.77 1.95
% of medium to high risk offenders with case plan
11.4%
16.5%
25.1%
% of case plans addressing 3 criminogenic needs
55.5%
62.1%
58.8%
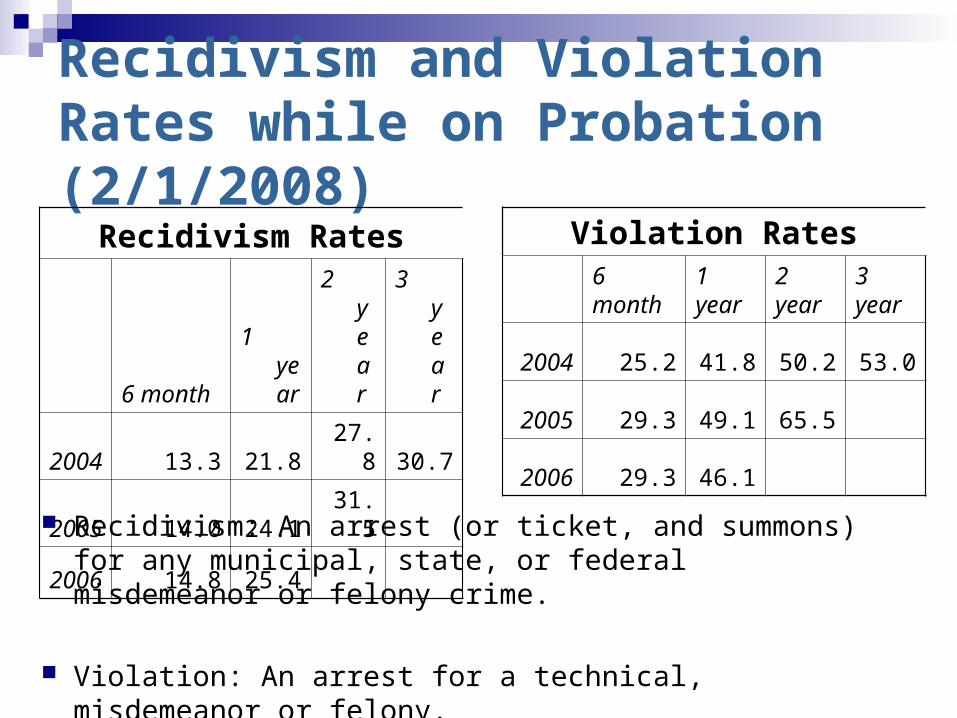
Recidivism and Violation Rates while on Probation (2/1/2008)
Recidivism Rates
6 month
1 year
2 year
3 year
2004 13.3 21.8 27.8 30.7
2005 14.0 24.1 31.5
2006 14.8 25.4
Recidivism: An arrest (or ticket, and summons) for any municipal, state, or federal misdemeanor or felony crime.
Violation: An arrest for a technical, misdemeanor or felony.
.
Violation Rates
6 month
1 year
2 year
3 year
2004 25.2 41.8 50.2 53.0
2005 29.3 49.1 65.5
2006 29.3 46.1

1 yr. Recidivism and Violation Rates by Risk Level (2/1/2008)
1 year Recidivism rate
Risk Level 2004 2005 2006
Admin 10.1 10.5 8.6
Moderate 22.0 23.2 24.1
High 33.8 36.7 43.7
Max 48.6 48.1 53.1
1 year Violation rate
Risk Level 2004 2005 2006
Admin 20.7 23.1 17.7
Moderate 42.3 44.3 45.3
High 63.0 64.9 73.4
Max 78.4 84.6 81.3

Intermediate Sanctions for Technical Violations
Graduated Sanction By Officer
Warning By Officer
2004 0.8% 3.0%
2005 2.4% 11.2
2006 6.7% 18.1%

ME: Benefits, Next Steps, Challenges

Informed Decision Making and Benefits Has provided us with a real “first look” at
many areas; Assessments / populations / caseloads / violations etc..
Trend and activity identification…. violations handling
Data entry discrepancies and issues become evident. Can be addressed appropriately with practice, policy or functionality changes.
Designed with a capacity to continue research beyond the scope of the project.

Policy makers reviewed data on “Administrative” (low risk) cases for case banking.
Added “Low” category to probation
Changed risk level ranges of probation supervision
Implementing “case planning” of all moderate to maximum cases
Informed Decision Making and Benefits
Challenges and Next Steps Time consuming process with limited resources. Maintaining accuracy in monitoring recidivism Improving data completion rates Receiving complete criminal history records Learning and understanding effective methods of
analyzing all the data. Adding treatment data
The good news…….Once it’s done, it’s done
Dissemination
Split Sentencing Analysis for the Corrections Alternatives Advisory Committee
Probation violations brief (to be released March/April 2008)
3 future working papers examining outcomes by offender type
Key Contacts
Lisa Nash – MDOC Project [email protected]
Chris Oberg – CORIS Business Analyst
Mark Rubin – Research [email protected]
Maine Justice Policy Center http://muskie.usm.maine.edu/justiceresearch

Illinois: Contextual Background

Decentralized System Administrative Office of the Illinois Courts
provides oversight to independent county-or circuit-level probation entities.
Each pilot site (Lake, Adams, Cook, DuPage, and Sangamon Counties, and the 2nd Judicial Circuit) has a separate data collection system.
Some systems were automated and some were not.
Data collection is ongoing; no case-level outcome data are available yet.

IL: Process Measures

Measuring Implementation Sites wanted measures of ongoing
implementation, organization change, and fidelity to EBP (the “outputs” of the process).
These data are beneficial for improving quality and assessing the incremental success of the Initiative.
Diverse data systems posed a challenge in developing a data collection tool and allowing cross-site comparisons.
Measuring Organizational Development and Collaboration Paper and web-based tools overcame MIS
challenges. Likert Organizational Climate Survey
administered annually in pilot sites. Larson and Chrislip Collaboration Survey
administered annually to statewide EBP Coordinating Council.
Survey results informed strategic planning and showed annual progress/fallbacks

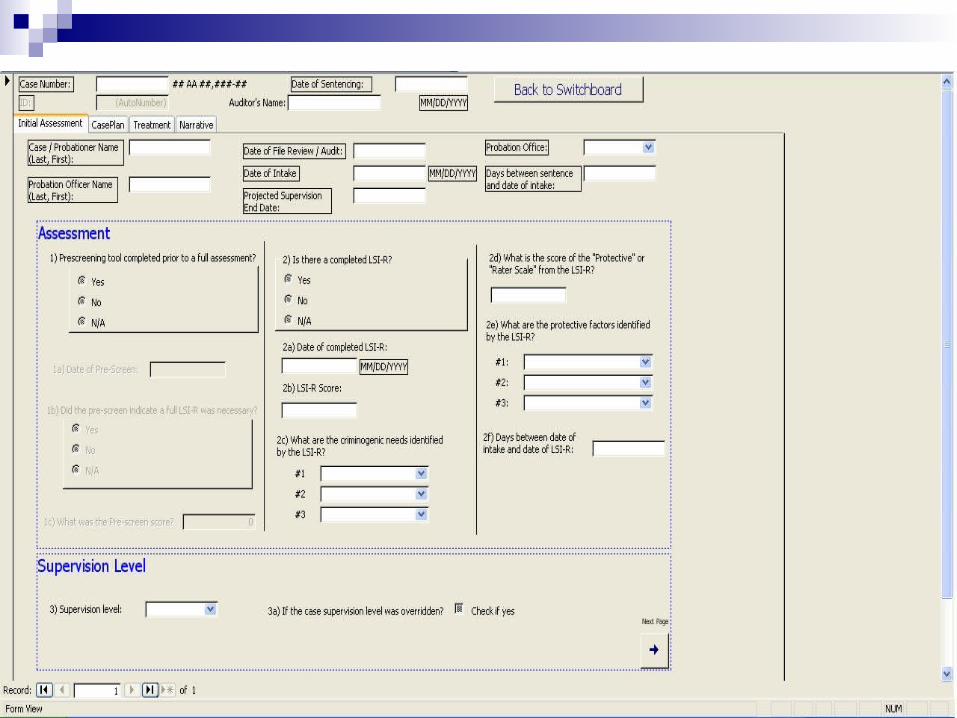
Intermediate Measures Database To overcome MIS issues, an independent Access
database was developed to capture case audit data on assessment, case planning, and treatment.
Pilot sites participated in development and testing.
Audit data are entered on a random sample of cases, and the database can produce queries and a limited number of pre-programmed reports to the officer level.
Two counties have piloted the system and the state is planning a wider rollout.

Accountability Through Intermediate Measures (AIM)
The big question: what to do with the data? Adams and DuPage Counties used a modified
CompStat approach to review data and set improvement goals.
Challenges: Using the right data to answer the right questions Understanding the data Facilitation Accountability
User’s guide available for the IM database and AIM Process

IL: Benefits, Next Steps, Challenges

Benefits
Ongoing measurement has informed implementation (i.e. Organizational Climate and Collaboration Surveys)
Intermediate measures data and AIM/CompStat approach provides framework for data-driven decision making and quality assurance.
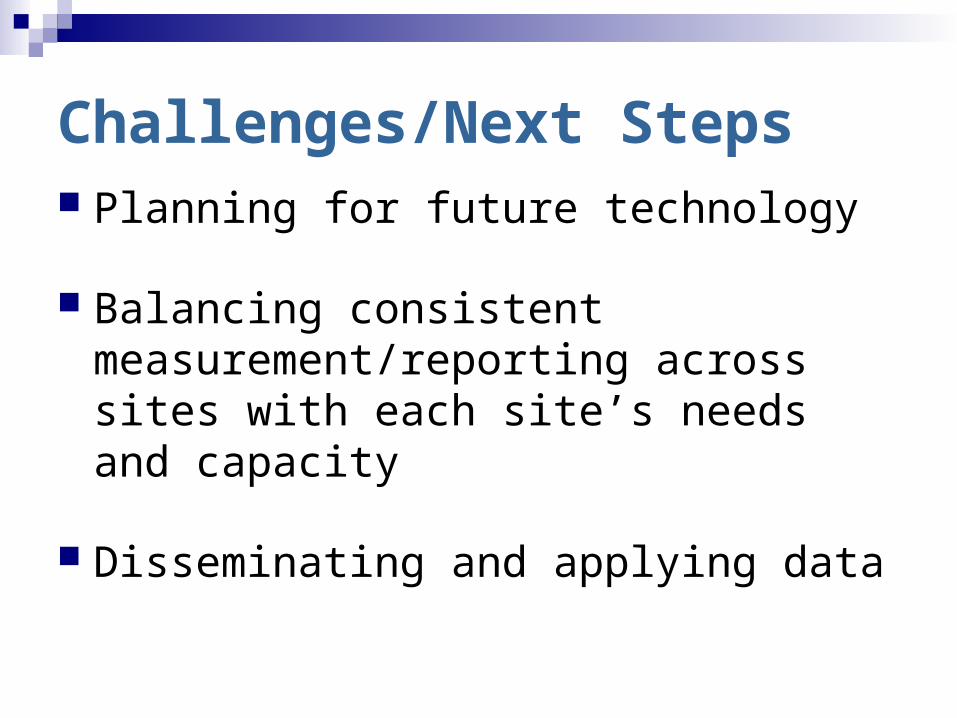
Challenges/Next Steps Planning for future technology
Balancing consistent measurement/reporting across sites with each site’s needs and capacity
Disseminating and applying data
Going Forward with Evaluation
Lessons Learned
Site selection
Research planning and process
Assessment tools
Site Selection New accelerated immersion approach Well-developed databases/MIS New data model Less data collection Research staff
Experience with research projectsExperience with outside researchers
Collect some important intermediate measures data

Research Process
Research Plan Data matrix as a guide, not prescriptive Review the site’s data Interactive process with the site
What research questions want answered? Key question: “How does the organization change?” Research consultant
Applied and ‘pure’ research experience

Assessment Tools
Review our site assessment tools Three areas: Organizational Development,
Collaboration, Evidence-Based Practice Work with site(s) to develop tool package Review of new tools, etc. Addition of new leadership assessments

Research Changes
Learned from 1st implementation Challenge with new model Sites are more advanced – research-
wise Assessment tools reviewed, updated Less primary data collection needed Research process altered to sites
SIides available at: www.cjinstitute.org
Meghan Howe, CJI Project [email protected]
Michael Kane, CJI Research [email protected]
Dot Faust, NIC Project [email protected]