a taste of python and its capabilities - iris · pdf filea taste of python and its...
TRANSCRIPT

A Taste of PythonAnd Its Capabilities
Emily WolinNorthwestern University

Goal: Overview of Python basics, with some hands-on examples
Adapted from material presented at USArray Data Processing and Analysis short course
(highly recommended!)

Download examples at www.earth.northwestern.edu/
~emilyw/pythonbasics.tgz

What is Python?
• Interpreted
• High-level
• Free and open-source
• Object-oriented: each object has various attributes and methods

Why do I use Python?“How good are current tomographic models
of North America?”

Why do I use Python?“How good are current tomographic models
of North America?”
“We can use current tomographic models to predict S and Rayleigh wavetrains from earthquakes within North America. Do these synthetic seismograms agree with observations at SPREE and the TA?”
−120˚
−105˚
−90˚
−75˚
−60˚−45˚
30˚
30˚
45˚
45˚

Things I need to know to compare two waveforms:
• Time series of ground motion (of course)• Station, network, component, location • Lat, lon, depth of station• Start and end time of traces• Sampling rate• Event hypocenter and origin time• Phase picks
SAC deals with headers nicely and provides a lot of nice functions.
But I hate writing SAC macros.
And I need to do things that SAC can’t do.
Why do I use Python?

Goal: Measure misfit between observed and synthetic seismograms
Why do I use Python?
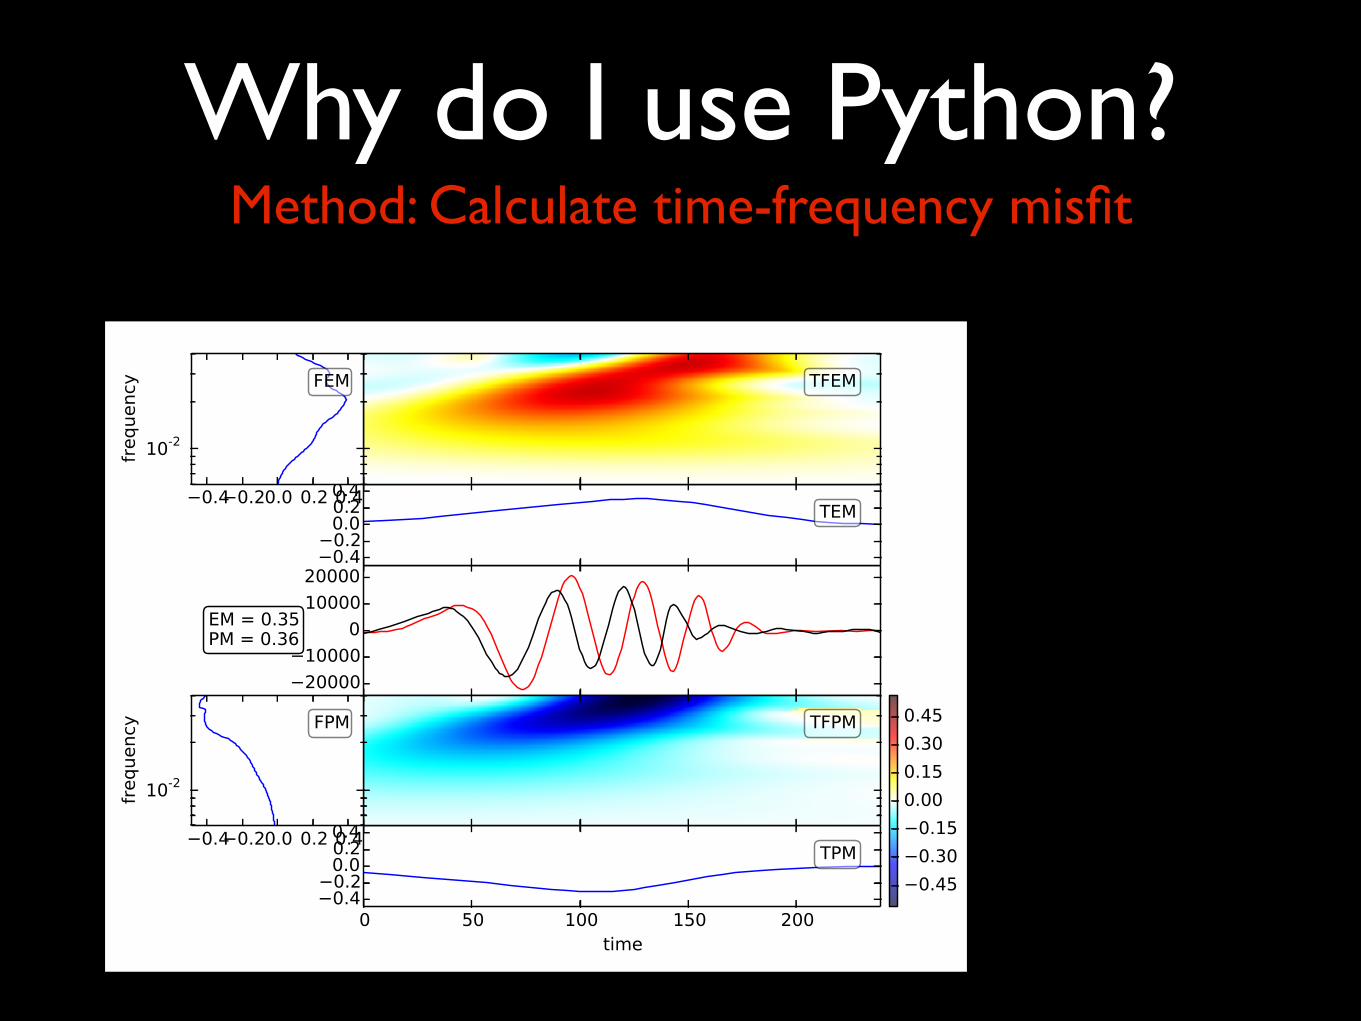
Why do I use Python?Method: Calculate time-frequency misfit
Input: two data arrays
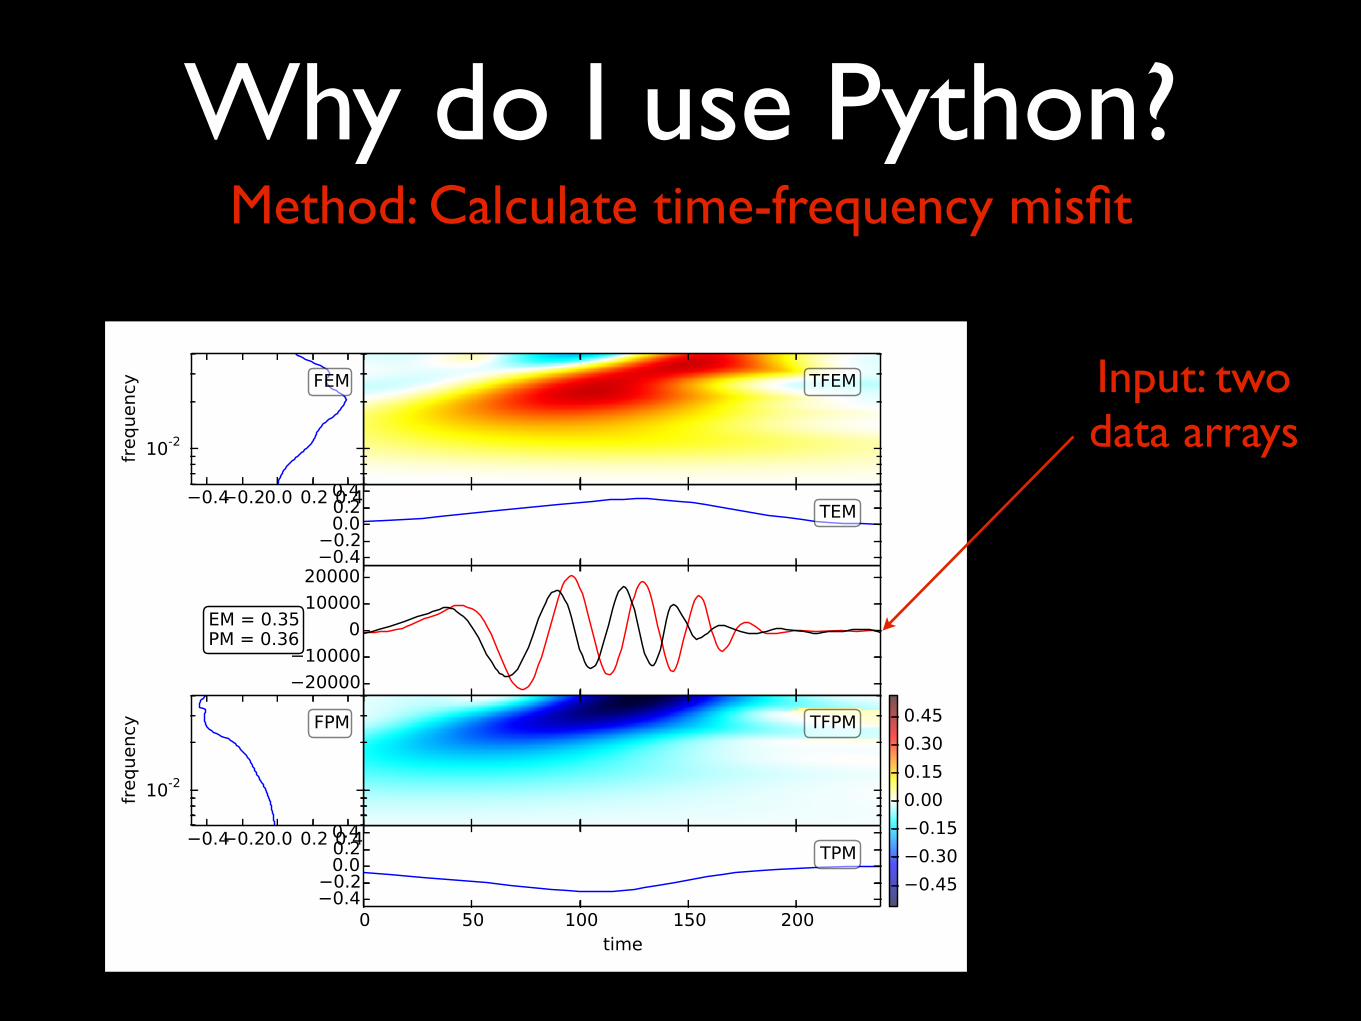
Why do I use Python?Method: Calculate time-frequency misfit

Input: two data arrays
Output: amplitude and phasedifferences
Why do I use Python?Method: Calculate time-frequency misfit

Why do I use Python?Method: Calculate time-frequency misfit
How can I get my SAC files into Python and preserve
necessary metadata?

In Python, I could build an object containing the time series and the headers.
mytrace.header.stnmmytrace.header.stlamytrace.data
I could also define functions that act on or modify the object’s attributes.
mytrace.trim(starttime=t1, endtime=t2)mytrace.filter("highpass", freq=0.02)mytrace.remove_response(output="DISP")
Note: these are all pseudocode
Why do I use Python?
attributes}methods}

Good news:
Seismology-friendly data structures already exist in a package called ObsPy.
Even better news:
I can use powerful numerical and scientific Python libraries to process and visualize my data.
Why do I use Python?

Tip: Use a text editor with syntax highlighting.
In Vim (my favorite), set up ~/.vimrc:
syntax on
set number
set noeb vb t_vb=
(turn on syntax highlighting and line numbers; turn off annoying beeps)

Getting started: IPythonIn a terminal window, type ipython --pylab

Getting started: IPython
print('Hello, world!')
In a terminal window, type ipython --pylab

a='1'a=1a=1.1a=1+2j
strintfloatcomplex
Getting started: IPython
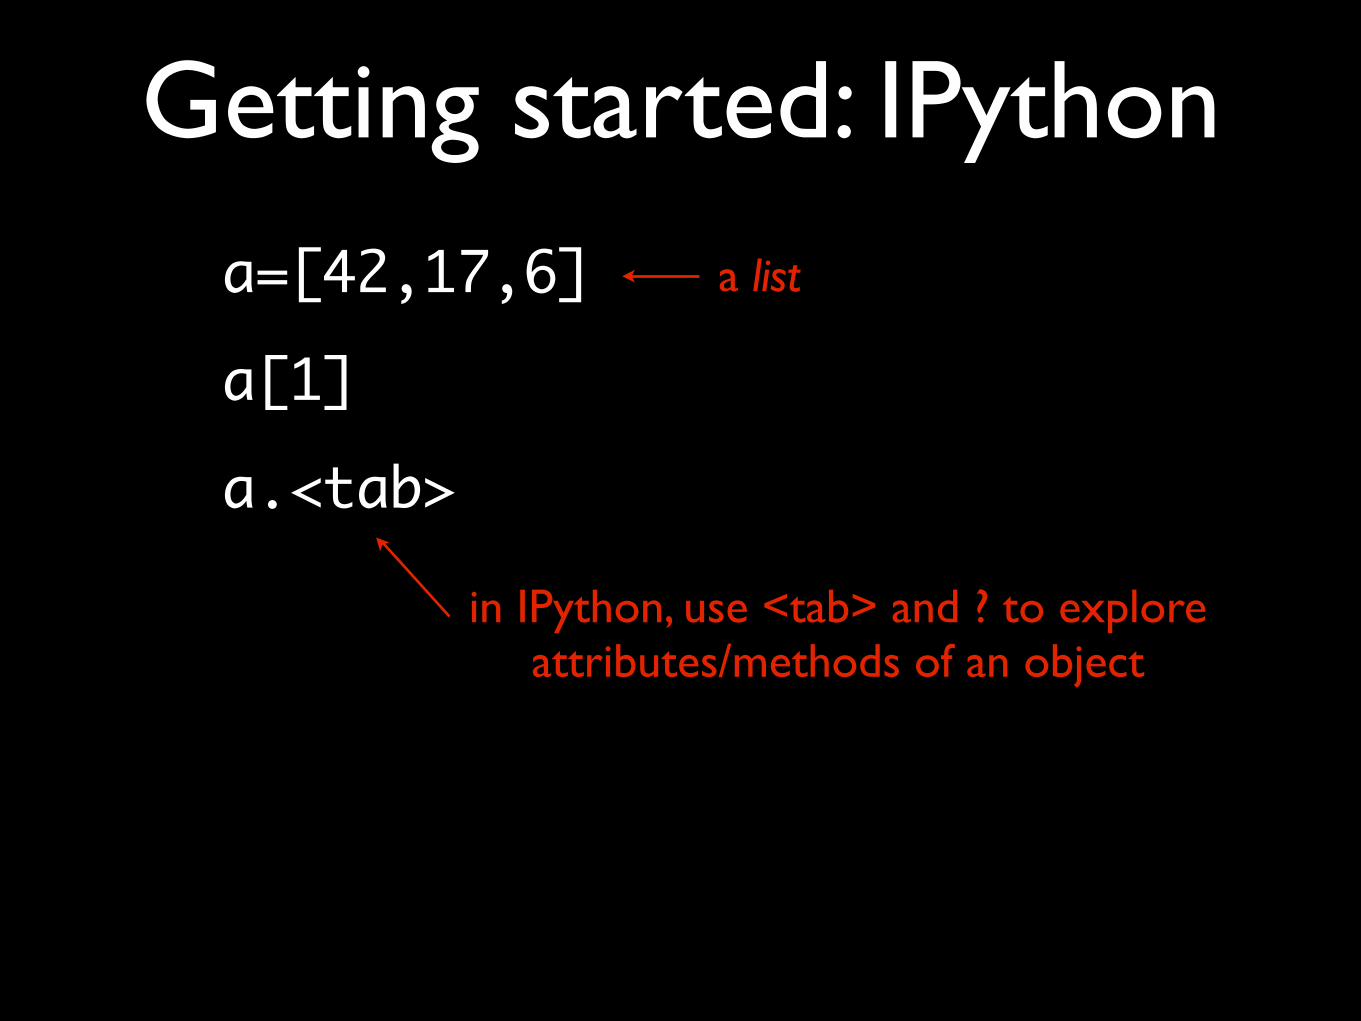
a=[42,17,6]a[1]a.<tab>
in IPython, use <tab> and ? to explore attributes/methods of an object
a list
Getting started: IPython

s='hello there 's[1]s.<tab>
a string
Getting started: IPython
in IPython, use <tab> and ? to explore attributes/methods of an object

if answer != 42: print('that is not correct')for i in range(5): print('Hello, world!')}
Spaces! (4)
Getting started: IPython

Using modules
import oshelp(os)os.environmyname=os.environ['USER']
a dictionary
Python doesn’t load modules unless you ask for them
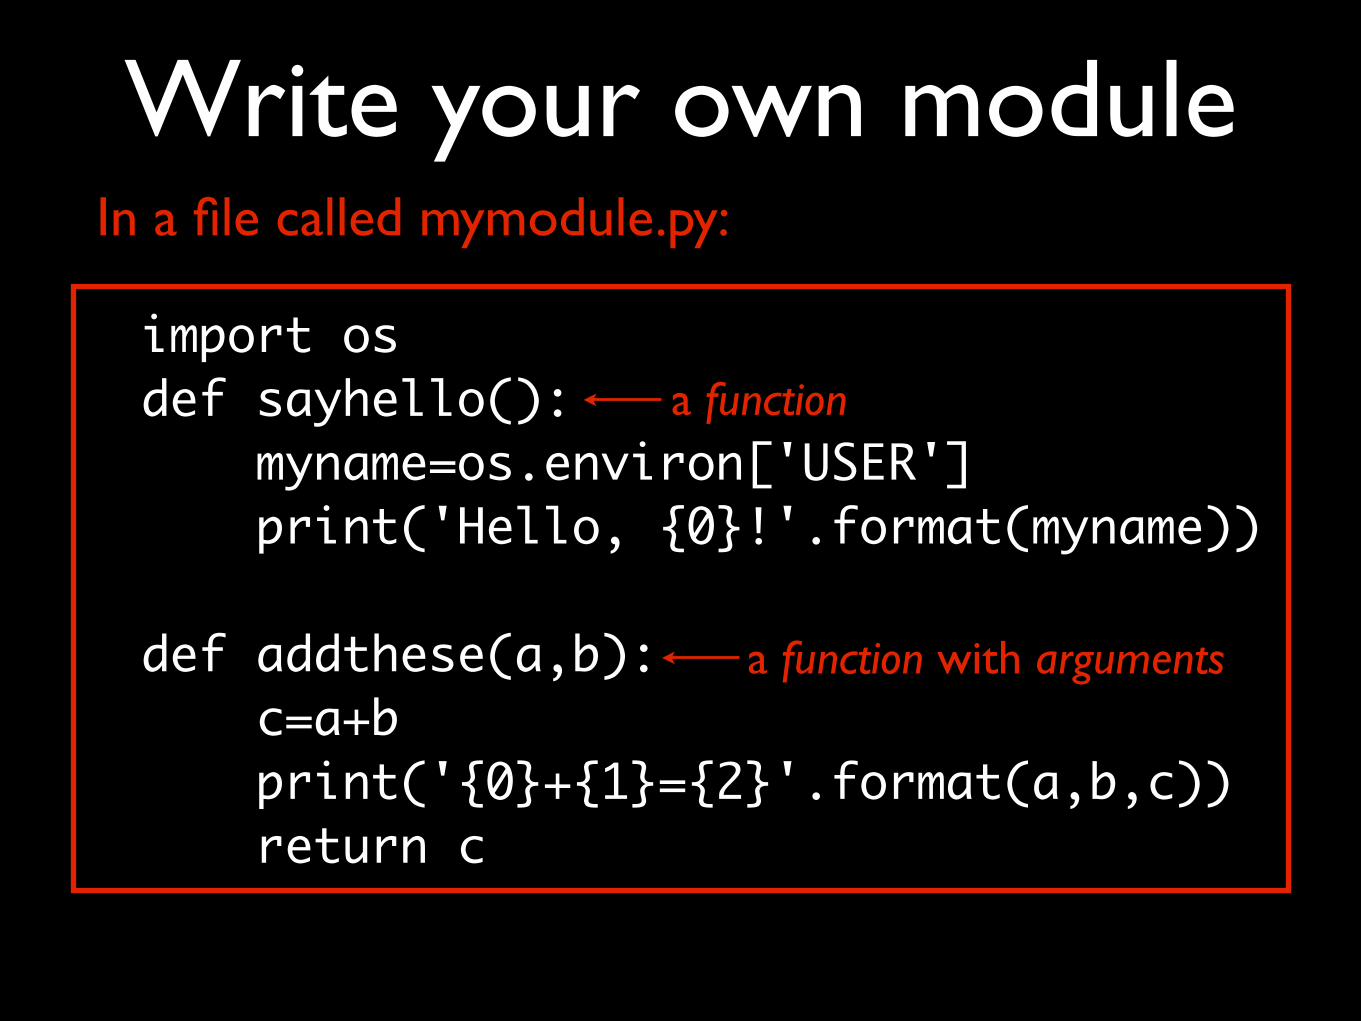
Write your own module
import osdef sayhello(): myname=os.environ['USER'] print('Hello, {0}!'.format(myname))
def addthese(a,b): c=a+b print('{0}+{1}={2}'.format(a,b,c)) return c
In a file called mymodule.py:
a function
a function with arguments

Use your new module
import mymodulemymodule.sayhello()a=mymodule.addthese(3.1,2.7)
In the IPython shell:
import mymodule as mmmm.sayhello()a=mm.addthese(3.1,2.7)
Or, if your fingers are getting tired:
Using classesWe can define a class (an object) that has its own attributes and methods.
from birdclasses import Swallowbird=Swallow(species='African', loadstatus='unladen')bird.loadstatusbird.velocity
http://style.org/unladenswallow/

Using classesWe can define a class (an object) that has its own attributes and methods.
from birdclasses import Swallowbird=Swallow(species='African', loadstatus='unladen')bird.loadstatusbird.velocity
Try giving the bird a coconut:bird.giveCoconut()What is the airspeed velocity of an unladen swallow?
http://style.org/unladenswallow/

Useful ModulesNumPy:
“the fundamental package for scientific computing with Python. It contains among other things:• a powerful N-dimensional array object• sophisticated (broadcasting) functions• tools for integrating C/C++ and Fortran code• useful linear algebra, Fourier transform, and
random number capabilities”
http://www.numpy.org/

matplotlib:
“matplotlib is a python 2D plotting library which produces publication quality figures in a variety of hardcopy formats and interactive environments across platforms”
http://matplotlib.org/
Useful Modules
pylab gives MATLAB-like syntax

SciPy:
“a collection of numerical algorithms and domain-specific toolboxes, including signal processing, optimization, statistics and much more”
http://www.scipy.org/about.html
Useful Modules
ObsPy:
“an open-source project dedicated to provide a Python framework for processing seismological data. It provides parsers for common file formats and seismological signal processing routines which allow the manipulation of seismological time series”
http://docs.obspy.org/
Useful Modules

Python Basics
• Data types
• Object orientation: attributes, methods
• Flow control statements (if/while/for): mandatory indentation
• Importing modules and writing simple functions
Now you know a little about:

And now for something a little different...

Scripting with PythonSample code (mylinefit.py):
• Generate a linearly-spaced array of x values
• Calculate a function y(x) at each point• Add random noise to y(x)• Fit a line through the noisy data• Plot the noisy data, original function, and
best-fit line

Scripting with Python
Run script from IPython: run mylinefit.py

Run in Terminal:
chmod +x mylinefit.py./mylinefit.py(The first line of mylinefit.py should be
#!/usr/bin/env python so the shell knows this is a Python program.)
Scripting with Python
Run script from IPython: run mylinefit.py

Fit line in 2 ways:
• SciPy: stats.linregress module
• “By hand” with NumPy matrices and some inverse theory
yn = axn + bGm = d
m = GTG( )-1 GTd
G =
x1 1x2 1! !xn 1
!
"
#####
$
%
&&&&&
m = ab
!
"#
$
%&
d =
y1y2!yn
!
"
#####
$
%
&&&&&
Scripting with Python

Fit line in 2 ways:
• SciPy: stats.linregress module
• “By hand” with NumPy matrices and some inverse theory
yn = axn + bGm = d
m = GTG( )-1 GTd
G =
x1 1x2 1! !xn 1
!
"
#####
$
%
&&&&&
m = ab
!
"#
$
%&
d =
y1y2!yn
!
"
#####
$
%
&&&&&
Scripting with Python

Read and plot a waveformfrom obspy import readst = read('TA.SPMN..LHZ.disp')st.plot()
print stlen(st)tr = st[0] print trprint tr.statsprint tr.stats['station']tr.data
Also try:

Read and plot a waveformfrom obspy import readst = read('TA.SPMN..LHZ.disp')st.plot()
print stlen(st)tr = st[0] print trprint tr.statsprint tr.stats['station']tr.data
Also try:
Plot a focal mechanismfrom obspy.imaging.beachball import Beachballmt = [ 180, 80, 90 ]Beachball(mt, size=500)
mt2 = [-0.463, 4.61, -4.15, -0.0633, -0.171, -1.49]Beachball(mt2, size=500)

Plot a focal mechanismfrom obspy.imaging.beachball import Beachballmt = [ 180, 80, 90 ]Beachball(mt, size=500)
mt2 = [-0.463, 4.61, -4.15, -0.0633, -0.171, -1.49]Beachball(mt2, size=500)

Scripting with PythonPlot any two-column ASCII file from Terminal:

chmod +x plotanything.py./plotanything.py vs.ak135./plotanything.py vs.*(Again, note the #!/usr/bin/env python in the first line of plotanything.py)
Scripting with PythonPlot any two-column ASCII file from Terminal:

Download from this link
ipython notebook python_introduction.ipynb --pylab inline
If you want to learn more: IPython notebooks
click here (do not try to right-click and save)
Then run the notebook (will open in a browser):
http://docs.obspy.org/tutorial

Want to learn more?• A Byte of Python
http://swaroopch.com/notes/python/
• ObsPy tutorials:
http://docs.obspy.org/tutorial/
• Python Scripting for Computational Science
http://folk.uio.no/hpl/scripting/index.html
• Python Scientific Lecture Notes
http://scipy-lectures.github.io/index.html

improvement (Figs. 3 and 4) are the result of quality control inthe form of removing traces with low quality and incoherentarrivals. In practice, there is an ongoing need to remove suchtraces from virtually all earthquake-based sets of seismograms.Figure 2b shows an example in which half of all seismogramsfrom an earthquake are to be discarded. Therefore, we imple-
ment a mechanism to conveniently (de)select seismogramsutilizing the event-handling API of Matplotlib.
In the processing interface (Fig. 2a or 2b), there are twodivisions of selected and deselected seismograms. Selected seis-mograms with a positive trace number are displayed with bluelines and fills, while deselected seismograms are gray and have a
(a)
▴ Figure 2. (a) Snapshot of the GUI showing aligned teleseismic Pwaves on vertical-component seismograms from the same earthquakeas in Figure 1. The seismograms are sorted by cross-correlation coefficient. The page here only shows the first 25 selected and 1 de-selected seismograms out of a total of 163 seismograms. The user can click on the Prev and Next buttons to navigate through all sevenpages. Clicking the Save button saves changes to files and the Quit button quits processing. The four buttons on the upper left correspondto the procedure described in the Combining ICCS with MCCC section: the ICCS-A button for step 1; the Sync button for step 2; the ICCS-Bbutton for step 3; and the MCCC button for step 4. The screenshot shows the GUI after step 3. The time axis is relative to time pick 2T i , andthe time windowWb is shaded with a transparent green. Clicking the SACP2 button produces Figure 4. (b) Similar snapshot but for anotherearthquake that occurred in Kyushu, Japan, on 21 November 2005 (Mw 6.2). Seismograms are sorted by user-defined weighted average ofthe three quality factors. Negative signals of the waveform are filled with less transparency. This illustrates a case in which a large portionof seismograms must be removed and how the GUI and seismogram sorting parameters aid in trace selection. (Continued)
Seismological Research Letters Volume 84, Number 1 January/February 2013 89
AIMBAT: Teleseismic travel-time picking
www.earth.northwestern.edu/~xlou/aimbat.html


Read and plot a waveformfrom obspy.core import readst = read('http://examples.obspy.org/RJOB_061005_072159.ehz.new')print stlen(st)tr = st[0] print trprint tr.statsprint tr.stats[‘station’]tr.datatr.plot()

Importing: which style is best?
import mymodulefrom mymodule import *
import mymodule as mmfrom mymodule import sayhello, addthese
OK for IPython/quick testing
Beware of name clashes(and don’t trust your memory)
Better for scripting!

How could you describe an earthquake?
• Hypocenter (lat, lon, depth)• Origin time• Rise time/other source-time function• Moment tensor• Who contributed the solution (may be several solutions--
ISC, PDE, Global CMT, etc.)?• Event ID
It’d be nice if we had a way of tying all of these different pieces of information together.
What’s an object?

Instead of using a bunch of different variables...

Instead of using a bunch of different variables...
evla=23.761

Instead of using a bunch of different variables...
evla=23.761evlo=45.646

Instead of using a bunch of different variables...
evla=23.761evlo=45.646
evdp=10.0

Instead of using a bunch of different variables...
evla=23.761evlo=45.646
evdp=10.0
origin_time=...?

an Event object would help us organize all of this together:
myevent.latitudemyevent.longitudemyevent.depthmyevent.origintimemyevent.mwmyevent.msmyevent.mband so forth...