a test lab techno corp. - shopmanda pad...2. introduction the a test lab techno corp. has performed...
TRANSCRIPT

©2010 A Test Lab Techno Corp.
Report Number: 1011FS15 Page 1 of 89
A Test Lab Techno Corp. Changan Lab:No. 140 -1, Changan Street, Bade City, Taoyuan County, Taiwan R.O.C.
Tel:886-3-271-0188 / Fax:886-3-271-0190
SAR EVALUATION REPORT Test Report No. : 1011FS15 Applicant : Huawei Technologies Co., Ltd. Product Type : HSPA Module Trade Name : HUAWEI Model Number : EM770W Dates of Test : Aug. 28, 2010 Test Environment : Ambient Temperature: 22 ± 2 ° C Relative Humidity:40 - 70 % Test Specification : Standard C95.1-2005 IEEE Std. 1528-2003 2.1093;FCC/OET Bulletin 65 Supplement C [July 2001] RSS-102 Issue 3 (June 2009)
FCC KDB 447498 D01 Mobile Portable RF Exposure V04, Published on Nov. 16, 2009
FCC KDB 616217 D01 SAR for Laptop with screen Ant V01, Published on Nov. 16, 2009
FCC KDB 941225 D01 SAR test for 3G devices V02 Max. SAR : 1.460 W/kg Body SAR Test Lab Location : Chang-an Lab
1. The test operations have to be performed with cautious behavior, the test results are as attached.
2. The test results are under chamber environment of A Test Lab Techno Corp. A Test Lab Techno Corp. does not assume responsibility for any conclusions and generalizations drawn from the test results with regard to other specimens or samples.
3. The measurement report has to be written approval of A Test Lab Techno Corp. It may only be reproduced or published in full. This report shall not be reproduced except in full, without the written approval of A Test Lab Techno Corp. The test results in the report only apply to the tested sample.
Sam Chuang Nov. 19, 2010 Alex Wu Nov. 19, 2010 Approve Signer Testing Engineer
Draft Report

Contents
1. Description of Equipment under Test (EUT) ..................................................................................... 3
2. Introduction .......................................................................................................................................... 4
3. SAR Definition ...................................................................................................................................... 4
4. SAR Measurement Setup .................................................................................................................... 5
5. Test Equipment List ............................................................................................................................. 6
6. Tissue Simulating Liquids................................................................................................................... 7 6.1 Ingredients.................................................................................................................................... 8 6.2 Recipes......................................................................................................................................... 8 6.3 Liquid Confirmation ...................................................................................................................... 9
7. Measurement Process....................................................................................................................... 10 7.1 Device and Test Conditions........................................................................................................ 10 7.2 RF Conducted Output Power ..................................................................................................... 13 7.3 Test Mode Description................................................................................................................ 15 7.4 Simultaneous Transmitting Evaluate.......................................................................................... 16 7.5 System Performance Check....................................................................................................... 16 7.6 Measurement Procedures .......................................................................................................... 18 7.7 Spatial Peak SAR Evaluation ..................................................................................................... 19
8. Measurement Uncertainty ................................................................................................................. 20
9. SAR Test Results Summary .............................................................................................................. 22 9.1 WCDMA (RMC 12.2K) / HSDPA / HSUPA Band II - Body SAR ................................................. 22 9.2 WCDMA (RMC 12.2K) / HSDPA / HSUPA Band V - Body SAR................................................. 24 9.3 Std. C95.1-2005 RF Exposure Limit........................................................................................... 26
10. Conclusion.......................................................................................................................................... 27
11. References.......................................................................................................................................... 27
Appendix A - System Performance Check ........................................................................................... 28
Appendix B - SAR Measurement Data .................................................................................................. 30
Appendix C - Calibration ........................................................................................................................ 54
©2010 A Test Lab Techno Corp.
Report Number: 1011FS15 Page 2 of 89
Draft Report

©2010 A Test Lab Techno Corp.
Report Number: 1011FS15 Page 3 of 89
1. Description of Equipment under Test (EUT)
Applicant : Huawei Technologies Co., Ltd.
Applicant Address : Bantian, Longgang District, Shenzhen 518129, P. R. China
Manufacturer : Huawei Technologies Co., Ltd.
Manufacturer Address : Bantian, Longgang District, Shenzhen 518129, P. R. China
Product Type : HSPA Module
Trade Name : HUAWEI
Model Number : EM770W
IMEI No. : 357030020579369
FCC ID : QISEM770W
IC ID : 6369A-EM770W
Tx Frequency : 1852.4 - 1907.6 MHz WCDMA(RMC 12.2K)/HSDPA/HSUPA Band II
826.4 - 846.6 MHz WCDMA(RMC 12.2K)/HSDPA/HSUPA Band V
RF Conducted Power : 0.150 W / 21.76 dBm WCDMA(RMC 12.2K)/HSDPA/HSUPA Band II
0.205 W / 23.11 dBm WCDMA(RMC 12.2K)/HSDPA/HSUPA Band V
Max. SAR Measurement : 1.460 W/kg Body SAR
Antenna Type : PIFA Type
Device Category : Mobile Device RF Exposure Environment : General Population / Uncontrolled
Battery Option : Standard
Application Type : Certification
Host Tablet PC : Trade Name: M & A Technology, Inc.
Model Number: MAEPAD-BB
Manufacturer (1): Pegatron Corporation
5F, No. 76,Ligong St., Beitou District, Taipei City112, Taiwan (R.O.C.)
Manufacturer (2): Maintek Computer (Suzhou) Co., Ltd
233 Jin Feng Road, Suzhou City New District, Jiangsu Province, China
Manufacturer (3): Protek (Shanghai) Limited No. 3768 Xiu Yan Rd., Nanhui District, Shanghai, China
This wireless portable device has been shown to be capable of compliance for localized specific absorption rate (SAR) for uncontrolled environment / general population exposure limits specified in Standard C95.1-2005 / RSS-102 Issue 3 (June 2009) and had been tested in accordance with the measurement procedures specified in IEEE Std. 1528-2003.
Draft Report

2. Introduction
The A Test Lab Techno Corp. has performed measurements of the maximum potential exposure to the
user of Huawei Technologies Co., Ltd. Trade Name:HUAWEI Model(s):EM770W. The test
procedures, as described in American National Standards, Institute C95.1 - 2005[1], FCC/OET Bulletin
65 Supplement C [July 2001] and RSS-102 Issue 3 (June 2009) were employed and they specify the
maximum exposure limit of 1.6mW/g as averaged over any 1 gram of tissue for portable devices being
used within 25cm between user and EUT in the uncontrolled environment. A description of the product
and operating configuration, detailed summary of the test results, methodology and procedures used in
the equipment used are included within this test report.
3. SAR Definition
Specific Absorption Rate (SAR) is defined as the time derivative (rate) of the incremental energy (dw)
absorbed by (dissipated in) an incremental mass (dm) contained in a volume element (dv) of a given
density (ρ ). It is also defined as the rate of RF energy absorption per unit mass at a point in an absorbing body (see Figure 2).
SAR Mathematical Equation
SAR = ⎟⎠⎞
⎜⎝⎛
dmdw
dtd
= ⎟⎟⎠
⎞⎜⎜⎝
⎛dv
dwdtd
ρ
SAR is expressed in units of Watts per kilogram (W/kg)
SAR = ρE 2σ
Where:
σ = conductivity of the tissue (S/m)
ρ = mass density of the tissue (kg/m3)
E = RMS electric field strength (V/m)
*Note:
The primary factors that control rate of energy absorption were found to be the wavelength of the
incident field in relations to the dimensions and geometry of the irradiated organism, the orientation of
the organism in relation to the polarity of field vectors, the presence of reflecting surfaces, and whether
conductive contact is made by the organism with a ground plane[2]
©2010 A Test Lab Techno Corp.
Report Number: 1011FS15 Page 4 of 89
Draft Report

4. SAR Measurement Setup
The DASY5 system for performing compliance tests consists of the following items: 1. A standard high precision 6-axis robot (Stäubli TX family) with controller, teach pendant and
software. An arm extension for accommodating the data acquisition electronics (DAE). 2. A dosimetric probe, i.e., an isotropic E-field probe optimized and calibrated for usage in tissue
simulating liquid. The probe is equipped with an optical surface detector system. 3. A data acquisition electronics (DAE) which performs the signal amplification, signal multiplexing,
AD-conversion, offset measurements, mechanical surface detection, collision detection, etc. The unit is battery powered with standard or rechargeable batteries. The signal is optically transmitted to the EOC.
4. The function of the measurement server is to perform the time critical tasks such as signal filtering, control of the robot operation and fast movement interrupts.
5. A probe alignment unit which improves the (absolute) accuracy of the probe positioning. 6. A computer operating Windows 2003. 7. DASY5 software. 8. Remote controls with teach pendant and additional circuitry for robot safety such as warning
lamps, etc. 9. The SAM twin phantom enabling testing left-hand and right-hand usage. 10. The device holder for handheld mobile phones. 11. Tissue simulating liquid mixed according to the given recipes. 12. Validation dipole kits allowing validating the proper functioning of the system.
©2010 A Test Lab Techno Corp.
Report Number: 1011FS15 Page 5 of 89
Draft Report

5. Test Equipment List
Manufacturer Name of Equipment Type/Model Serial Number Last Calibration Remark
SPEAG Dosimetric E-Field Probe EX3DV4 3632 01/26/2010 (1)
SPEAG 835MHz System Validation Kit D835V2 4d082 07/20/2010 (1)
SPEAG 1900MHz System Validation Kit D1900V2 5d111 07/16/2010 (1)
SPEAG Data Acquisition Electronics DAE4 779 01/21/2010 (1)
SPEAG Device Holder N/A N/A NCR -----
SPEAG Phantom SAM V4.0 TP-1150 NCR -----
SPEAG Robot Staubli TX90XL F07/564ZA1/C/01 NCR -----
SPEAG Software DASY5 V5.0 Build 125 N/A NCR -----
SPEAG Software SEMCAD X V13.4 Build 125 N/A NCR -----
SPEAG Measurement Server SE UMS 011 AA 1025 NCR -----
R&S Wireless CommunicationTest Set CMU200 109369 08/10/2010 (1)
Agilent Wireless CommunicationTest Set E5515C GB47020167 05/25/2010 (1)
Agilent ENA Series Network Analyzer E5071B MY42402996 11/04/2009 (2)
Agilent Dielectric Probe Kit 85070C US99360094 NCR -----
R&S Power Sensor NRP-Z22 100179 05/20/2010 (1)
Agilent Signal Generator E8257D MY44320425 03/09/2009 (2)
Agilent Dual Directional Coupler 778D 50334 NCR -----
Mini-Circuits Power Amplifier ZHL-42W-SMA D111103#5 NCR -----
Mini-Circuits Power Amplifier ZVE-8G-SMA D042005 671800514 NCR -----
Remark: (1) Calibration period 1 year. (2) Calibration period 2 years.
NOTE: N.C.R. = No Calibration Request.
©2010 A Test Lab Techno Corp.
Report Number: 1011FS15 Page 6 of 89
Draft Report
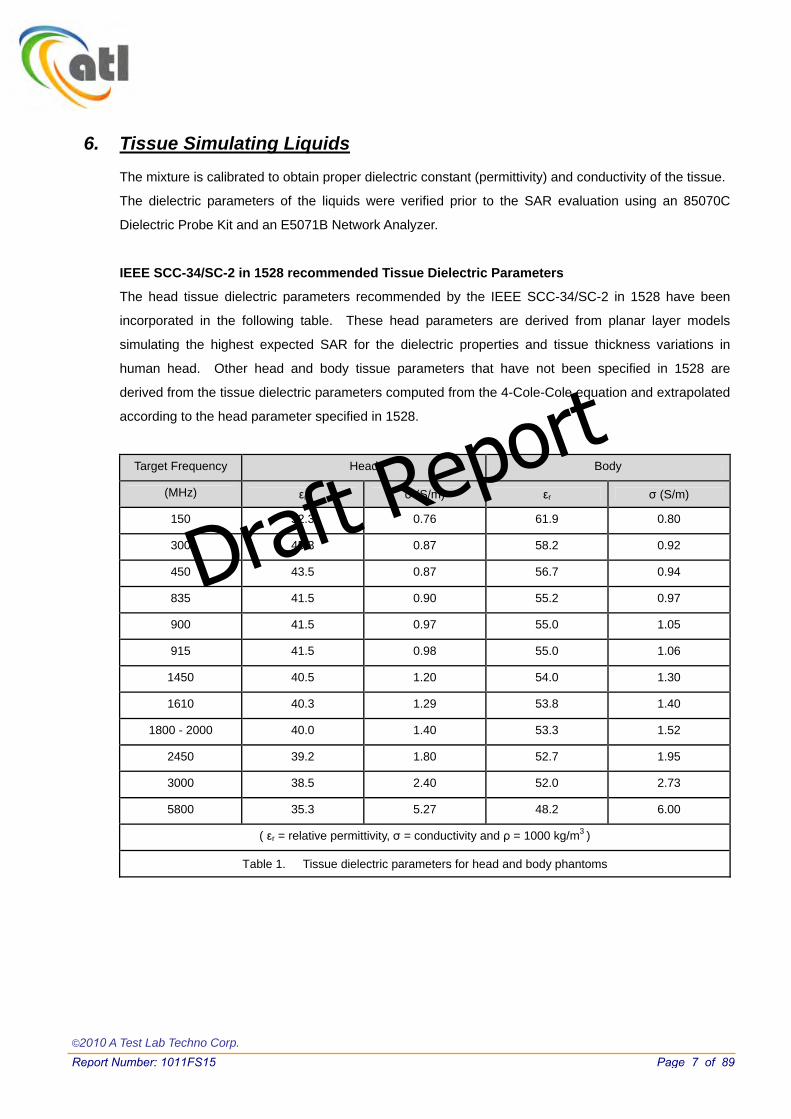
6. Tissue Simulating Liquids The mixture is calibrated to obtain proper dielectric constant (permittivity) and conductivity of the tissue.
The dielectric parameters of the liquids were verified prior to the SAR evaluation using an 85070C
Dielectric Probe Kit and an E5071B Network Analyzer.
IEEE SCC-34/SC-2 in 1528 recommended Tissue Dielectric Parameters
The head tissue dielectric parameters recommended by the IEEE SCC-34/SC-2 in 1528 have been
incorporated in the following table. These head parameters are derived from planar layer models
simulating the highest expected SAR for the dielectric properties and tissue thickness variations in
human head. Other head and body tissue parameters that have not been specified in 1528 are
derived from the tissue dielectric parameters computed from the 4-Cole-Cole equation and extrapolated
according to the head parameter specified in 1528.
Target Frequency Head Body
(MHz) εr σ (S/m) εr σ (S/m)
150 52.3 0.76 61.9 0.80
300 45.3 0.87 58.2 0.92
450 43.5 0.87 56.7 0.94
835 41.5 0.90 55.2 0.97
900 41.5 0.97 55.0 1.05
915 41.5 0.98 55.0 1.06
1450 40.5 1.20 54.0 1.30
1610 40.3 1.29 53.8 1.40
1800 - 2000 40.0 1.40 53.3 1.52
2450 39.2 1.80 52.7 1.95
3000 38.5 2.40 52.0 2.73
5800 35.3 5.27 48.2 6.00
( εr = relative permittivity, σ = conductivity and ρ = 1000 kg/m3 )
Table 1. Tissue dielectric parameters for head and body phantoms
©2010 A Test Lab Techno Corp.
Report Number: 1011FS15 Page 7 of 89
Draft Report
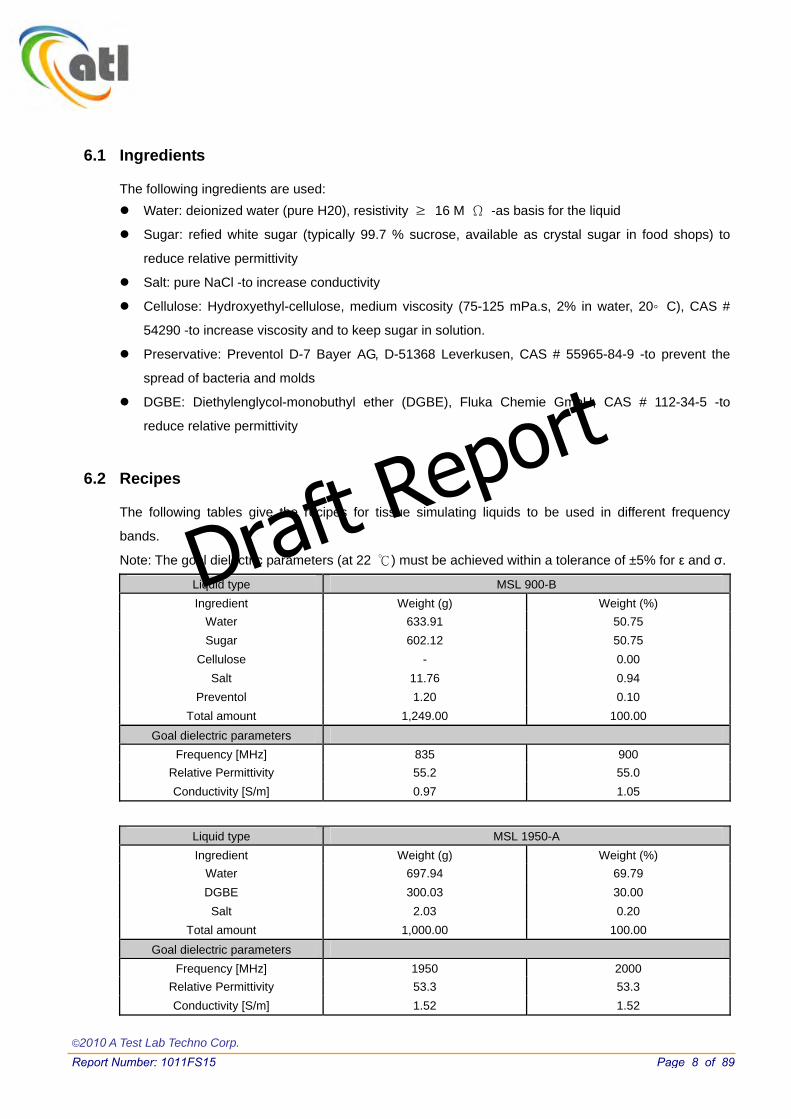
6.1 Ingredients
The following ingredients are used: Water: deionized water (pure H20), resistivity ≥ 16 M Ω -as basis for the liquid
Sugar: refied white sugar (typically 99.7 % sucrose, available as crystal sugar in food shops) to
reduce relative permittivity
Salt: pure NaCl -to increase conductivity
Cellulose: Hydroxyethyl-cellulose, medium viscosity (75-125 mPa.s, 2% in water, 20◦ C), CAS #
54290 -to increase viscosity and to keep sugar in solution.
Preservative: Preventol D-7 Bayer AG, D-51368 Leverkusen, CAS # 55965-84-9 -to prevent the
spread of bacteria and molds
DGBE: Diethylenglycol-monobuthyl ether (DGBE), Fluka Chemie GmbH, CAS # 112-34-5 -to
reduce relative permittivity
6.2 Recipes
The following tables give the recipes for tissue simulating liquids to be used in different frequency
bands.
Note: The goal dielectric parameters (at 22 ℃) must be achieved within a tolerance of ±5% for ε and σ.
Liquid type MSL 900-B Ingredient Weight (g) Weight (%)
Water 633.91 50.75 Sugar 602.12 50.75
Cellulose - 0.00 Salt 11.76 0.94
Preventol 1.20 0.10 Total amount 1,249.00 100.00
Goal dielectric parameters Frequency [MHz] 835 900
Relative Permittivity 55.2 55.0 Conductivity [S/m] 0.97 1.05
Liquid type MSL 1950-A Ingredient Weight (g) Weight (%)
Water 697.94 69.79 DGBE 300.03 30.00
Salt 2.03 0.20 Total amount 1,000.00 100.00
Goal dielectric parameters Frequency [MHz] 1950 2000
Relative Permittivity 53.3 53.3 Conductivity [S/m] 1.52 1.52
©2010 A Test Lab Techno Corp.
Report Number: 1011FS15 Page 8 of 89
Draft Report

6.3 Liquid Confirmation
6.3.1 Parameters
Liquid Verify (Ambient Temperature: 22 ± 2 °C;Relative Humidity:40 -70%)
Liquid Type Frequency Temp (°C) Parameters Target
ValueMeasured
Value Deviation
(%) Limit (%) Measured Date
εr 55.2 54.71 -0.88 ± 5 820MHz 22.0
σ 0.97 0.96 -0.67 ± 5 εr 55.2 54.68 -0.95 ± 5
835MHz 22.0 σ 0.97 0.98 1.11 ± 5 εr 55.2 54.67 -0.95 ± 5
835MHz Body
850MHz 22.0 σ 0.97 1.00 3.18 ± 5
08/28/2010
εr 53.3 52.60 -1.31 ± 5 1850MHz 22.0
σ 1.52 1.46 -3.98 ± 5 εr 53.3 52.65 -1.22 ± 5
1900MHz 22.0 σ 1.52 1.51 -0.74 ± 5 εr 53.3 52.45 -1.59 ± 5
1900MHz Body
1930MHz 22.0 σ 1.52 1.55 2.15 ± 5
08/28/2010
Table 2. Measured Tissue dielectric parameters for head and body phantoms
6.3.2 Liquid Depth
The liquid level was during measurement 15cm ±0.5cm.
Figure 2. Head-Tissue-Simulating-Liquid Figure 3. Body-Tissue-Simulating-Liquid
©2010 A Test Lab Techno Corp.
Report Number: 1011FS15 Page 9 of 89
Draft Report
7. Measurement Process
7.1 Device and Test Conditions
The Test Device was provided by Huawei Technologies Co., Ltd. for this evaluation. The spatial
peak SAR values were assessed for the lowest, middle and highest channels defined by WCDMA(RMC
12.2K) / HSPDA / HSUPA Band II (#9692=1852.4MHz, #9400=1880.0MHz, #9538=1907.6MHz) and
WCDMA(RMC 12.2K) / HSPDA / HSUPA Band V (#4132=826.4MHz, #4183=836.6MHz,
#4233=846.4MHz) systems..
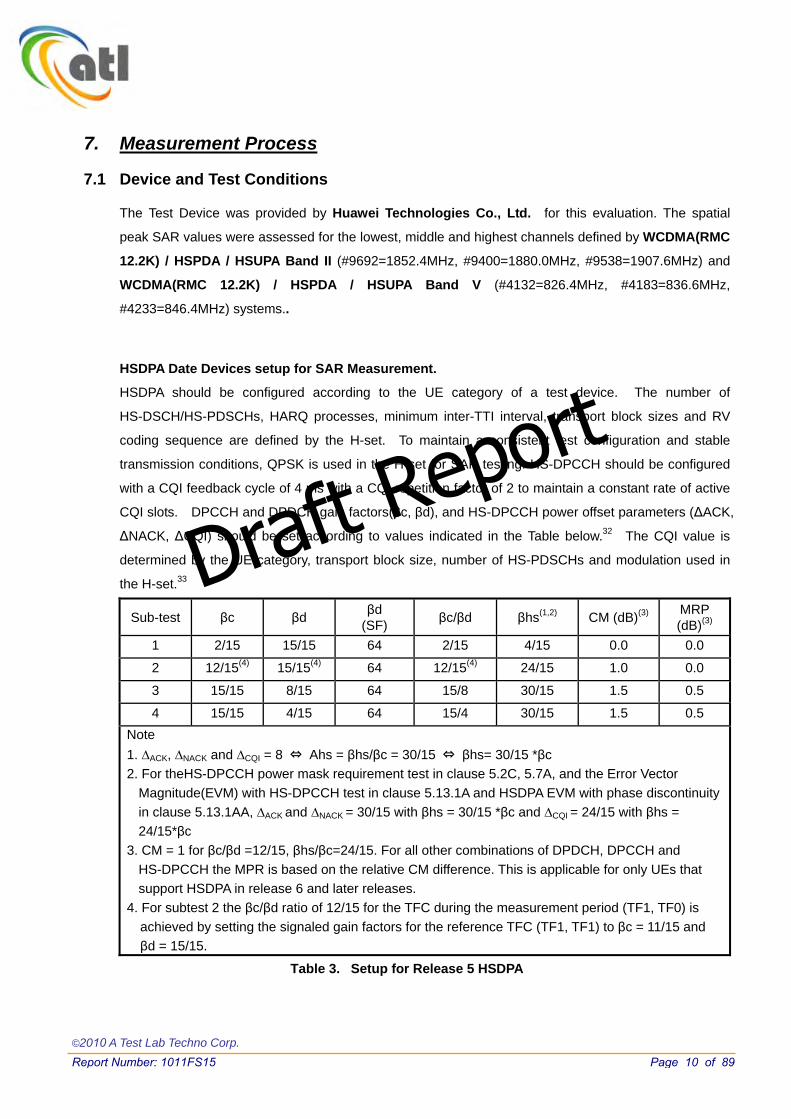
HSDPA Date Devices setup for SAR Measurement.
HSDPA should be configured according to the UE category of a test device. The number of
HS-DSCH/HS-PDSCHs, HARQ processes, minimum inter-TTI interval, transport block sizes and RV
coding sequence are defined by the H-set. To maintain a consistent test configuration and stable
transmission conditions, QPSK is used in the H-set for SAR testing. HS-DPCCH should be configured
with a CQI feedback cycle of 4 ms with a CQI repetition factor of 2 to maintain a constant rate of active
CQI slots. DPCCH and DPDCH gain factors(βc, βd), and HS-DPCCH power offset parameters (ΔACK,
ΔNACK, ΔCQI) should be set according to values indicated in the Table below.32 The CQI value is
determined by the UE category, transport block size, number of HS-PDSCHs and modulation used in
the H-set.33
Sub-test βc βd βd (SF) βc/βd βhs(1,2) CM (dB)(3) MRP
(dB)(3) 1 2/15 15/15 64 2/15 4/15 0.0 0.0
2 12/15(4) 15/15(4) 64 12/15(4) 24/15 1.0 0.0
3 15/15 8/15 64 15/8 30/15 1.5 0.5
4 15/15 4/15 64 15/4 30/15 1.5 0.5 Note 1. ∆ACK, ∆NACK and ∆CQI = 8 ⇔ Ahs = βhs/βc = 30/15 ⇔ βhs= 30/15 *βc 2. For theHS-DPCCH power mask requirement test in clause 5.2C, 5.7A, and the Error Vector
Magnitude(EVM) with HS-DPCCH test in clause 5.13.1A and HSDPA EVM with phase discontinuity in clause 5.13.1AA, ∆ACK and ∆NACK = 30/15 with βhs = 30/15 *βc and ∆CQI = 24/15 with βhs = 24/15*βc
3. CM = 1 for βc/βd =12/15, βhs/βc=24/15. For all other combinations of DPDCH, DPCCH and HS-DPCCH the MPR is based on the relative CM difference. This is applicable for only UEs that support HSDPA in release 6 and later releases.
4. For subtest 2 the βc/βd ratio of 12/15 for the TFC during the measurement period (TF1, TF0) is achieved by setting the signaled gain factors for the reference TFC (TF1, TF1) to βc = 11/15 and βd = 15/15.
Table 3. Setup for Release 5 HSDPA
©2010 A Test Lab Techno Corp.
Report Number: 1011FS15 Page 10 of 89
Draft Report

HSPA Date Devices setup for SAR Measurement.
The following procedures are applicable to HSPA (HSUPA/HSDPA) data devices operating under 3GPP
Release 6. Body exposure conditions generally apply to these devices, including handsets and data
modems operating in various electronic devices. HSUPA operates in conjunction with WCDMA and
HSDPA. SAR is initially measured in WCDMA test configurations without HSPA. The default test
configuration is to establish a radio link between the DUT and a communication test set to configure a
12.2 kbps RMC (reference measurement channel) in Test Loop Mode 1. SAR for HSPA is selectively
measured with HS-DPCCH, EDPCCH and E-DPDCH, all enabled, along with a 12.2 kbps RMC using
the highest SAR configuration in WCDMA with 12.2 kbps RMC only. An FRC is configured according to
HSDPCCH Sub-test 1 using H-set 1 and QPSK. HSPA is configured according to E-DCH Subtest 5
requirements. SAR for other HSPA sub-test configurations is also confirmed selectively according to
output power, exposure conditions and E-DCH UE Category. Maximum output power is verified
according to procedures in applicable versions of 3GPP TS 34.121 and SAR must be measured
according to these maximum output conditions. The UE Categories for HSDPCCH and HSPA should be
clearly identified in the SAR report. The following procedures are applicable only if Maximum Power
Reduction (MPR) is implemented according to Cubic Metric (CM) requirements.
When voice transmission and head exposure conditions are applicable to a WCDMA/HSPA data device,
head exposure is measured according to the ‘Head SAR Measurements’ procedures in the ‘WCDMA
Handsets’ section of this document. SAR for body exposure configurations are measured according to
the ‘Body SAR Measurements’ procedures in the ‘WCDMA Handsets’ section of this document. In
addition, body SAR is also measured for HSPA when the maximum average output of each RF channel
with HSPA active is at least ¼ dB higher than that measured without HSPA using 12.2 kbps RMC or the
maximum SAR for 12.2 kbps RMC is above 75% of the SAR limit. Body SAR for HSPA is measured
with E-DCH Sub-test 5, using H-Set 1 and QPSK for FRC and a 12.2 kbps RMC configured in Test
Loop Mode 1 with power control algorithm 2, according to the highest body SAR configuration in 12.2
kbps RMC without HSPA. When VOIP is applicable for head exposure, SAR is not required when the
maximum output of each RF channel with HSPA is less than ¼ dB higher than that measured using
12.2 kbps RMC; otherwise, the same HSPA configuration used for body measurements should be used
to test for head exposure.
Due to inner loop power control requirements in HSPA, a commercial communication test set should be
used for the output power and SAR tests. The 12.2 kbps RMC, FRC H-set 1 and E-DCH configurations
for HSPA should be configured according to the β values indicated below as well as other applicable
procedures described in the ‘WCDMA Handset’ and ‘Release 5 HSDPA Data Devices’ sections of this
document.
©2010 A Test Lab Techno Corp.
Report Number: 1011FS15 Page 11 of 89
Draft Report

The highest body SAR measured in Antenna Extended & Retracted configurations on a channel in 12.2
kbps RMC. The possible channels are the High, Middle & Low channel. Contact the FCC Laboratory for
test and approval requirements if the maximum output power measured in E-DCH Sub-test 2 - 4 is
higher than Sub-test 5.
Sub- test
βc βd βd
(SF) βc/βd βhs(1) βec βed
Βed(SF)
Βed (codes)
CM(2) (dB)
MPR (dB)
AG(4)
IndexE-
TFCI
1 11/15(3) 15/15(3) 64 11/15(3) 22/15 209/225 1039/225 4 1 1.0 0.0 20 75
2 6/15 15/15 64 6/15 12/15 12/15 94/75 4 1 3.0 2.0 12 67
3 15/15 9/15 64 15/9 30/15 30/15βed1: 47/15βed2: 47/15
4 2 2.0 1.0 15 92
4 2/15 15/15 64 2/15 4/15 2/15 56/75 4 1 3.0 2.0 17 71
5 15/15(4) 15/15(4) 64 15/15(4) 30/15 24/15 134/15 4 1 1.0 0.0 21 81
Note 1: ∆ACK, ∆NACK and ∆CQI = 8 ⇔ Ahs = βhs/βc = 30/15 ⇔ βhs= 30/15 *βc. Note 2: CM = 1 for βc/βd =12/15, βhs/βc=24/15. For all other combinations of DPDCH, DPCCH, HS-
DPCCH, E-DPDCH and E-DPCCH the MPR is based on the relative CM difference. Note 3: For subtest 1 the βc/βd ratio of 11/15 for the TFC during the measurement period (TF1, TF0) is
achieved by setting the signaled gain factors for the reference TFC (TF1, TF1) to βc = 10/15 and βd = 15/15.
Note 4: For subtest 5 the βc/βd ratio of 15/15 for the TFC during the measurement period (TF1, TF0) is achieved by setting the signaled gain factors for the reference TFC (TF1, TF1) to βc = 14/15 and βd = 15/15.
Note 5: Testing UE using E-DPDCH Physical Layer category 1 Sub-test 3 is not required according to TS 25.306 Table 5.1g.
Note 6: βed can not be set directly; it is set by Absolute Grant Value.
Table 4. Setup for Release 6 HSPA / Release 7 HSPA+
©2010 A Test Lab Techno Corp.
Report Number: 1011FS15 Page 12 of 89
Draft Report

©2010 A Test Lab Techno Corp.
7.2 RF Conducted Output Power
Band Sub-test CH Frequency (MHz)
Burst – Average Conducted power
(dBm)
Peak Conducted power
(dBm) Lowest 1852.4 21.16 22.62 Middle 1880.0 21.76 22.61 WCDMA(RMC 12.2K)
Band II ----- Highest 1907.6 21.40 22.69 Lowest 1852.4 21.13 22.59 Middle 1880.0 21.64 22.48 1 Highest 1907.6 21.22 22.62 Lowest 1852.4 21.05 22.52 Middle 1880.0 21.60 22.43 2 Highest 1907.6 21.17 22.56 Lowest 1852.4 20.70 22.17 Middle 1880.0 21.20 22.07 3 Highest 1907.6 20.78 22.14 Lowest 1852.4 20.71 22.10 Middle 1880.0 21.19 22.07
HSDPA Band II
4 Highest 1907.6 20.74 22.13 Lowest 1852.4 20.96 21.68 Middle 1880.0 21.22 22.31 1 Highest 1907.6 20.98 21.79 Lowest 1852.4 18.98 19.72 Middle 1880.0 19.26 20.32 2 Highest 1907.6 19.00 19.85 Lowest 1852.4 20.02 20.72 Middle 1880.0 20.23 21.32 3 Highest 1907.6 20.00 20.82 Lowest 1852.4 18.97 19.71 Middle 1880.0 19.27 20.33 4 Highest 1907.6 19.04 19.81 Lowest 1852.4 20.96 21.65 Middle 1880.0 21.18 22.27
HSUPA Band II
5 Highest 1907.6 20.96 21.71
Report Number: 1011FS15 Page 13 of 89
Draft Report

©2010 A Test Lab Techno Corp.
Band Sub-test CH Frequency (MHz)
Burst – Average Conducted power
(dBm)
Peak Conducted power
(dBm) Lowest 826.4 22.90 24.15 Middle 836.6 23.11 24.22 WCDMA(RMC 12.2K)
Band V ----- Highest 846.4 23.00 23.98 Lowest 826.4 22.90 23.95 Middle 836.6 23.10 24.16 1 Highest 846.4 22.94 23.99 Lowest 826.4 22.82 23.89 Middle 836.6 23.04 24.13 2 Highest 846.4 22.85 23.89 Lowest 826.4 22.44 23.48 Middle 836.6 22.61 23.69 3 Highest 846.4 22.49 23.57 Lowest 826.4 22.44 23.49 Middle 836.6 22.61 23.69
HSDPA Band V
4 Highest 846.4 22.45 23.52 Lowest 826.4 22.38 22.51 Middle 836.6 22.20 22.33 1 Highest 846.4 21.91 22.24 Lowest 826.4 20.44 20.55 Middle 836.6 20.20 20.36 2 Highest 846.4 19.95 20.32 Lowest 826.4 21.39 21.51 Middle 836.6 21.22 21.36 3 Highest 846.4 20.93 21.32 Lowest 826.4 20.46 20.53 Middle 836.6 20.24 20.38 4 Highest 846.4 20.00 20.32 Lowest 826.4 22.31 22.48 Middle 836.6 22.17 22.33
HSUPA Band V
5 Highest 846.4 21.87 22.21
Report Number: 1011FS15 Page 14 of 89
Draft Report
©2010 A Test Lab Techno Corp.
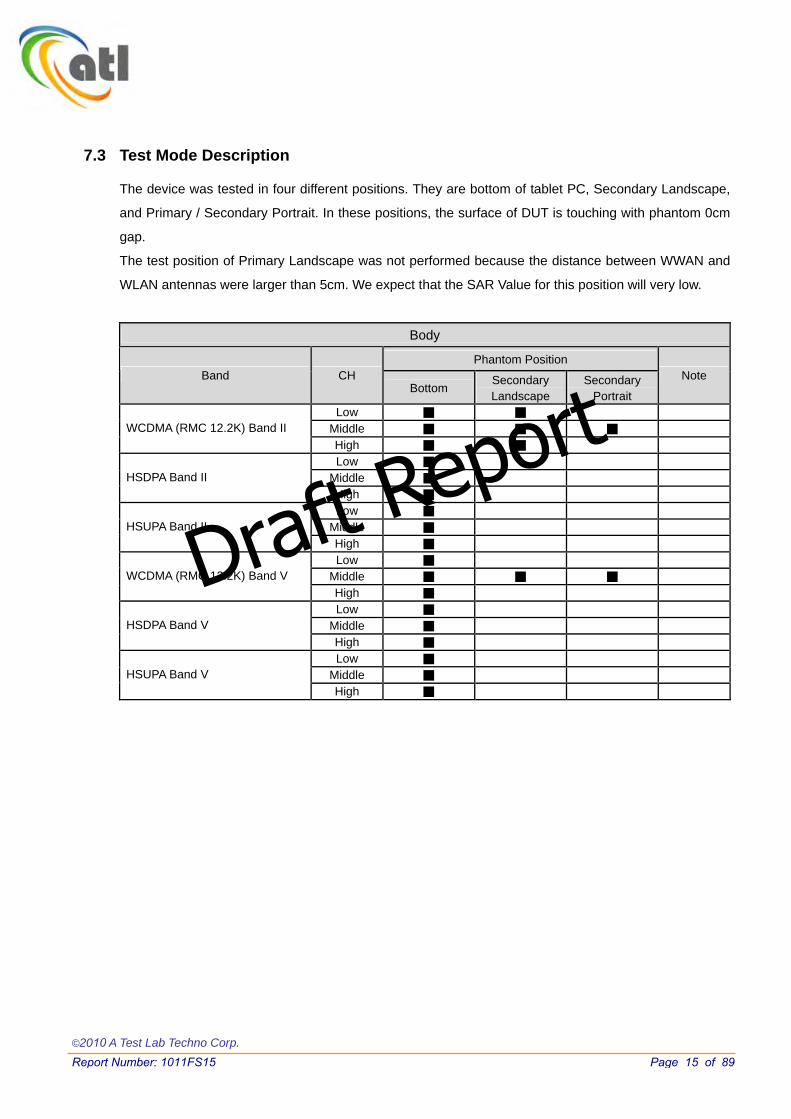
7.3 Test Mode Description
The device was tested in four different positions. They are bottom of tablet PC, Secondary Landscape,
and Primary / Secondary Portrait. In these positions, the surface of DUT is touching with phantom 0cm
gap.
The test position of Primary Landscape was not performed because the distance between WWAN and
WLAN antennas were larger than 5cm. We expect that the SAR Value for this position will very low.
Body
Phantom Position Band CH
Bottom Secondary Landscape
Secondary Portrait
Note
Low ■ ■ Middle ■ ■ ■ WCDMA (RMC 12.2K) Band II High ■ ■ Low ■
Middle ■ HSDPA Band II High ■ Low ■
Middle ■ HSUPA Band II High ■ Low ■
Middle ■ ■ ■ WCDMA (RMC 12.2K) Band V High ■ Low ■
Middle ■ HSDPA Band V High ■ Low ■
Middle ■ HSUPA Band V High ■
Report Number: 1011FS15 Page 15 of 89
Draft Report

7.4 Simultaneous Transmitting Evaluate
RF Conducted Power Antenna Distance
Band dBm W Antenna Account Distance (cm)
WCDMA/HSDPA/HPUPA Band V 23.11 0.20 BT to WLAN 3.2
WCDMA/HSDPA/HPUPA Band II 21.76 0.15 BT to WANM(License) 9.6
Wi-Fi 802.11b 17.70 0.06 WLAN to WWAN(License) 14.4
Wi-Fi 802.11g 17.00 0.05
Wi-Fi 802.11n_HT20 16.90 0.05
Wi-Fi 802.11n_HT40 15.27 0.03
BT 2.15 0.002
※ All system can’t use at the same time. 7.5 System Performance Check
Prior to the assessment, the system validation kit was used to test whether the system was operating
within its specifications of ± 7%. The validation was performed at 835MHz and 1900MHz.
Validation kit Mixture Type
SAR1g [mW/g]
SAR10g
[mW/g] Date of Calibration
D835V2-SN4d082 Body 10.32 6.76 07/20/2009
D1900V2-SN5d111 Body 42.4 22.64 07/16/2009
Difference Percentage Frequency (MHz)
Power (dBm)
SAR1g
(mW/g) SAR10g
(mW/g)Drift (dB)
1g 10g Date of Test
250mW 2.49 1.63 835 (Body) Normalize
to 1 Watt 9.96 6.52 0.054 -3.5 % -3.6 % 08/28/2010
250mW 10.6 5.52 1900 (Body) Normalize
to 1 Watt 42.4 22.08 0.186 0.0 % -2.5 % 08/28/2010
©2010 A Test Lab Techno Corp.
Report Number: 1011FS15 Page 16 of 89
Draft Report
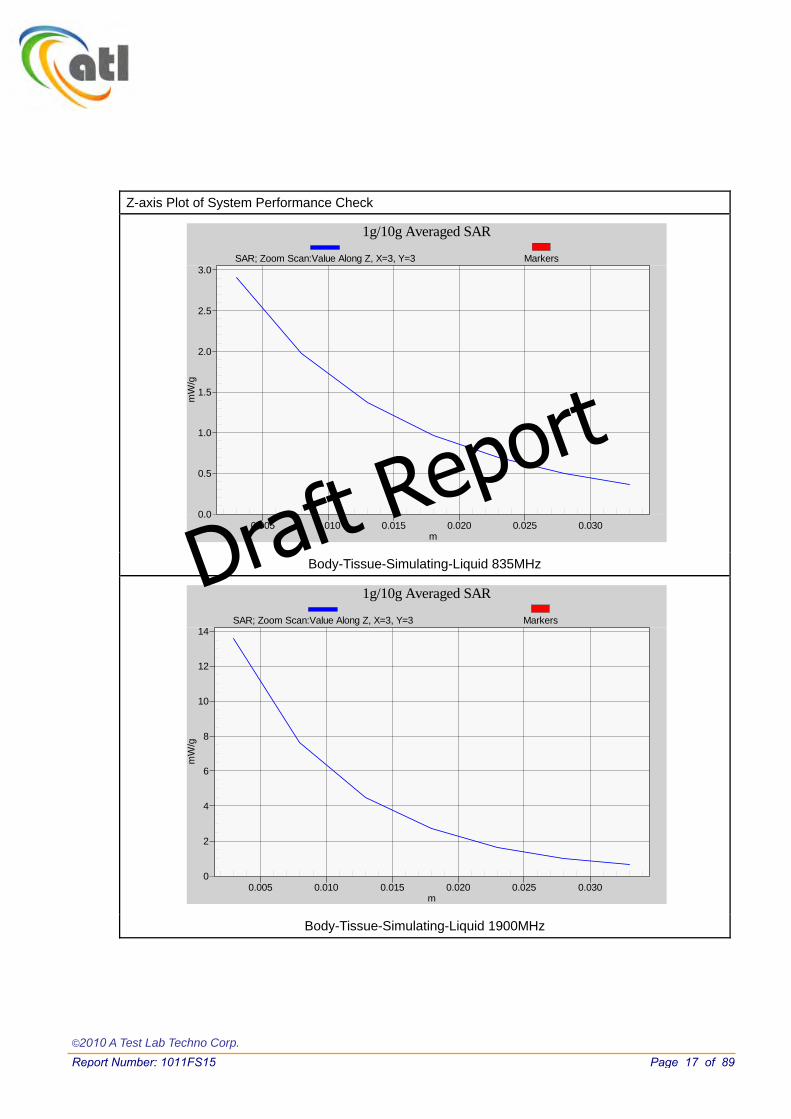
Z-axis Plot of System Performance Check
0.0
0.5
1.0
1.5
2.0
2.5
3.0
0.005 0.010 0.015 0.020 0.025 0.030
1g/10g Averaged SAR
mW
/g
m
SAR; Zoom Scan:Value Along Z, X=3, Y=3 Markers
Body-Tissue-Simulating-Liquid 835MHz
0
2
4
6
8
10
12
14
0.005 0.010 0.015 0.020 0.025 0.030
1g/10g Averaged SAR
mW
/g
m
SAR; Zoom Scan:Value Along Z, X=3, Y=3 Markers
Body-Tissue-Simulating-Liquid 1900MHz
©2010 A Test Lab Techno Corp.
Report Number: 1011FS15 Page 17 of 89
Draft Report

7.6 Measurement Procedures
The evaluation was performed with the following procedures:
Surface Check: A surface checks job gathers data used with optical surface detection. It determines
the distance from the phantom surface where the reflection from the optical
detector has its peak. Any following measurement jobs using optical surface
detection will then rely on this value. The surface check performs its search a
specified number of times, so that the repeatability can be verified. The probe tip
distance is 1.3mm to phantom inner surface during scans.
Reference: The reference job measures the field at a specified reference position, at 4 mm
from the selected section’s grid reference point.
Area Scan: The area scan is used as a fast scan in two dimensions to find the area of high field
values, before doing a finer measurement around the hot spot. The sophisticated
interpolation routines can find the maximum locations even in relatively coarse
grids. When an area scan has measured all reachable points, it computes the field
maxima found in the scanned area, within a range of the global maximum. Any
following zoom scan within the same procedure will then perform fine scans around
these maxima. The area covered the entire dimension of the EUT and the
horizontal grid spacing was 15 mm × 15 mm.
Zoom Scan: Zoom scans are used to assess the highest averaged SAR for cubic averaging
volumes with 1 g and 10 g of simulated tissue. The zoom scan measures 7 x 7 x 9
points in a 30 x 30 x 24 mm cube whose base faces are centered around the
maxima returned from a preceding area scan within the same procedure.
Drift: The drift job measures the field at the same location as the most recent reference
job within the same procedure, with the same settings. The drift measurement
gives the field difference in dB from the last reference measurement. Several drift
measurements are possible for each reference measurement. This allows
monitoring of the power drift of the device in the batch process. If the value
changed by more than 5%, the evaluation was repeated.
©2010 A Test Lab Techno Corp.
Report Number: 1011FS15 Page 18 of 89
Draft Report
7.7 Spatial Peak SAR Evaluation
The DASY5 software includes all numerical procedures necessary to evaluate the spatial peak SAR
values. Based on the Draft: SCC-34, SC-2, WG-2 - Computational Dosimetry, IEEE P1529/D0.0 (Draft
Recommended Practice for Determining the Spatial-Peak Specific Absorption Rate (SAR) Associated
with the Use of Wireless Handsets - Computational Techniques), a new algorithm has been
implemented. The spatial-peak SAR can be computed over any required mass.
The base for the evaluation is a ”cube” measurement in a volume of (32×32×30)mm3 (5×5×7 points).
The measured volume must include the 1g and 10g cubes with the highest averaged SAR values. For
that purpose, the center of the measured volume is aligned to the interpolated peak SAR value of a
previously performed area scan. If the 10g cube or both cubes are not entirely inside the measured
volumes, the system issues a warning regarding the evaluated spatial peak values within the
Postprocessing engine (SEMCAD). This means that if the measured volume is shifted, higher values
might be possible. To get the correct values you can use a finer measurement grid for the area scan. In
complicated field distributions, a large grid spacing for the area scan might miss some details and give
an incorrectly interpolated peak location.
The entire evaluation of the spatial peak values is performed within the Postprocessing engine
(SEMCAD). The system always gives the maximum values for the 1g and 10g cubes. The algorithm to
find the cube with highest averaged SAR is divided into three stages:
Interpolation and Extrapolation
The probe is calibrated at the center of the dipole sensors which is located 1 to 2.7mm away from the
probe tip. During measurements, the probe stops shortly above the phantom surface, depending on the
probe and the surface detecting system. Both distances are included as parameters in the probe
configuration file. The software always knows exactly how far away the measured point is from the
surface. As the probe cannot directly measure at the surface, the values between the deepest
measured point and the surface must be extrapolated.
In DASY5, the choice of the coordinate system defining the location of the measurement points has no
influence on the uncertainty of the interpolation, Maxima Search and SAR extrapolation routines. The
interpolation, Maxima Search and extrapolation routines are all based on the modified Quadratic
Shepard’s method [7].
©2010 A Test Lab Techno Corp.
Report Number: 1011FS15 Page 19 of 89
Draft Report

8. Measurement Uncertainty
Measurement uncertainties in SAR measurements are difficult to quantify due to several variables
including biological, physiological, and environmental. However, we estimate the measurement
uncertainties in SAR to be less than ±21.4 %[8].
According to Std. C95.3[9], the overall uncertainties are difficult to assess and will vary with the type of
meter and usage situation. However, accuracy’s of ± 1 to 3 dB can be expected in practice, with
greater uncertainties in near-field situations and at higher frequencies (shorter wavelengths), or areas
where large reflecting objects are present. Under optimum measurement conditions, SAR measurement
uncertainties of at least ± 2dB can be expected.
According to CENELEC[10], typical worst-case uncertainty of field measurements is ± 5 dB. For
well-defined modulation characteristics the uncertainty can be reduced to ± 3 dB.
©2010 A Test Lab Techno Corp.
Report Number: 1011FS15 Page 20 of 89
Draft Report

Error Description Uncertainty value
Prob. Dist. Div. (ci)
1g (ci) 10g
Std. Unc. (1g)
Std. Unc. (10g) (vi) veff
Measurement System
Probe Calibration ± 5.5 % N 1 1 1 ± 5.5 % ± 5.5 % �
Axial Isotropy ± 4.7 % R 0.7 0.7 ± 1.9 % ± 1.9 % ∞
Hemispherical Isotropy ± 9.6 % R 3 0.7 0.7 ± 3.9 % ± 3.9 % ∞
Boundary Effects ± 1.0 % R 3 1 1 ± 0.6 % ± 0.6 % ∞
Linearity ± 4.7 % R 3 1 1 ± 2.7 % ± 2.7 % ∞
System Detection Limits ± 1.0 % R 3 1 1 ± 0.6 % ± 0.6 % ∞
Readout Electronics ± 0.3 % N 1 1 1 ± 0.3 % ± 0.3 % ∞
Response Time ± 0.8 % R 3 1 1 ± 0.5 % ± 0.5 % ∞
Integration Time ± 2.6 % R 3 1 1 ± 1.5 % ± 1.5 % ∞
RF Ambient Noise ± 3.0 % R 3 1 1 ± 1.7 % ± 1.7 % ∞
RF Ambient Reflections ± 3.0 % R 3 1 1 ± 1.7 % ± 1.7 % ∞
Probe Positioner ± 0.4 % R 3 1 1 ± 0.2 % ± 0.2 % ∞
Probe Positioning ± 2.9 % R 3 1 1 ± 1.7 % ± 1.7 % ∞
Max. SAR Eval. ± 1.0 % R 3 1 1 ± 0.6 % ± 0.6 % ∞
Test Sample Related
Device Positioning ± 2.9 % N 1 1 1 ± 2.9 % ± 2.9 % 145
Device Holder ± 3.6 % N 1 1 1 ± 3.6 % ± 3.6 % 5
Power Drift ± 5.0 % R 3 1 1 ± 2.9 % ± 2.9 % ∞
Phantom and Setup
Phantom Uncertainty ± 4.0 % R 3 1 1 ± 2.3 % 2.3 % ∞
Liquid Conductivity (target) ± 5.0 % R 3 0.64 0.43 ± 1.8 % 1.2 % ∞
Liquid Conductivity (meas.) ± 2.5 % N 1 0.64 0.43 ± 1.6 % 1.1 % ∞
Liquid Permittivity (target) ± 5.0 % R 3 0.6 0.49 ± 1.7 % 1.4 % ∞
Liquid Permittivity (meas.) ± 2.5 % N 1 0.6 0.49 ± 1.5 % 1.2 % ∞
Combined Std. Uncertainty ± 10.7 % ± 10.5 % 387
Expanded STD Uncertainty ± 21.4 % ± 21.0 %
Table 5. Uncertainty Budget of DASY
©2010 A Test Lab Techno Corp.
Report Number: 1011FS15 Page 21 of 89
Draft Report

9. SAR Test Results Summary
Detail results see Appendix B.
9.1 WCDMA (RMC 12.2K) / HSDPA / HSUPA Band II - Body SAR
Ambient:
Temperature (℃): 22 ± 2 Relative HUMIDITY (%): 40-70
Liquid:
Mixture Type: MSL1900 Liquid Temperature (℃) : 22.0
Depth of liquid (cm): 15
Measurement: Duty Cycle: 1:1 Probe S/N: 3632
Frequency
MHz CH Band Power
(dBm) PhantomPosition
AntennaPosition Accessory SAR1g
[mW/g] Power Drift
(dB) Remark
1852.4 9262 WCDMA Band II 21.16 Flat PIFA N/A 1.010 -0.048 Bottom
1880.0 9400 WCDMA Band II 21.76 Flat PIFA N/A 1.460 -0.031 Bottom
1907.6 9538 WCDMA Band II 21.40 Flat PIFA N/A 1.400 0.146 Bottom
1852.4 9262 HSDPA Band II 21.13 Flat PIFA N/A 1.330 -0.121 Bottom
1880.0 9400 HSDPA Band II 21.64 Flat PIFA N/A 1.360 -0.056 Bottom
1907.6 9538 HSDPA Band II 21.22 Flat PIFA N/A 1.310 -0.141 Bottom
1852.4 9262 HSUPA Band II 20.96 Flat PIFA N/A 1.130 -0.183 Bottom
1880.0 9400 HSUPA Band II 21.22 Flat PIFA N/A 1.160 -0.123 Bottom
1907.6 9538 HSUPA Band II 20.98 Flat PIFA N/A 1.110 -0.088 Bottom
1852.4 9262 WCDMA Band II 21.16 Flat PIFA N/A 0.901 0.188 Secondary
Landscape
1880.0 9400 WCDMA Band II 21.76 Flat PIFA N/A 1.130 0.126 Secondary
Landscape
1907.6 9538 WCDMA Band II 21.40 Flat PIFA N/A 1.030 0.156 Secondary
Landscape
1852.4 9400 WCDMA Band II 21.76 Flat PIFA N/A 0.228 0.055 Secondary
Portrait
Std. C95.1-2005 - Safety Limit Spatial Peak
Uncontrolled Exposure/General Population
1.6 W/kg (mW/g) Averaged over 1 gram
©2010 A Test Lab Techno Corp.
Report Number: 1011FS15 Page 22 of 89
Draft Report

0.0
0.2
0.4
0.6
0.8
1.0
1.2
1.4
1.6
1.8
0.005 0.010 0.015 0.020 0.025
1g/10g Averaged SARm
W/g
m
SAR; Zoom Scan:Value Along Z, X=3, Y=3 Markers
Z-axis Plot of Flat WCDMA(RMC 12.2K) Band II CH 9400 _ Bottom
©2010 A Test Lab Techno Corp.
Report Number: 1011FS15 Page 23 of 89
Draft Report
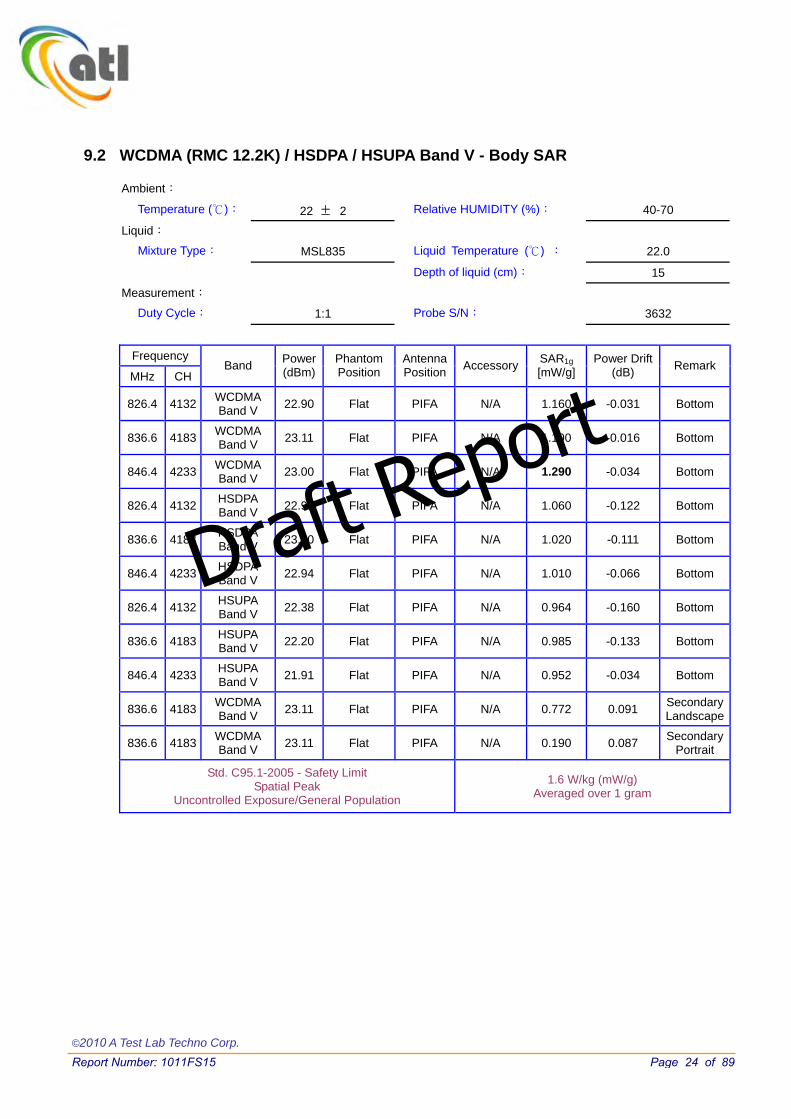
9.2 WCDMA (RMC 12.2K) / HSDPA / HSUPA Band V - Body SAR
Ambient:
Temperature (℃): 22 ± 2 Relative HUMIDITY (%): 40-70
Liquid:
Mixture Type: MSL835 Liquid Temperature (℃) : 22.0
Depth of liquid (cm): 15
Measurement: Duty Cycle: 1:1 Probe S/N: 3632
Frequency
MHz CH Band Power
(dBm) PhantomPosition
AntennaPosition Accessory SAR1g
[mW/g] Power Drift
(dB) Remark
826.4 4132 WCDMA Band V 22.90 Flat PIFA N/A 1.160 -0.031 Bottom
836.6 4183 WCDMA Band V 23.11 Flat PIFA N/A 1.190 -0.016 Bottom
846.4 4233 WCDMA Band V 23.00 Flat PIFA N/A 1.290 -0.034 Bottom
826.4 4132 HSDPA Band V 22.90 Flat PIFA N/A 1.060 -0.122 Bottom
836.6 4183 HSDPA Band V 23.10 Flat PIFA N/A 1.020 -0.111 Bottom
846.4 4233 HSDPA Band V 22.94 Flat PIFA N/A 1.010 -0.066 Bottom
826.4 4132 HSUPA Band V 22.38 Flat PIFA N/A 0.964 -0.160 Bottom
836.6 4183 HSUPA Band V 22.20 Flat PIFA N/A 0.985 -0.133 Bottom
846.4 4233 HSUPA Band V 21.91 Flat PIFA N/A 0.952 -0.034 Bottom
836.6 4183 WCDMA Band V 23.11 Flat PIFA N/A 0.772 0.091 Secondary
Landscape
836.6 4183 WCDMA Band V 23.11 Flat PIFA N/A 0.190 0.087 Secondary
Portrait
Std. C95.1-2005 - Safety Limit Spatial Peak
Uncontrolled Exposure/General Population
1.6 W/kg (mW/g) Averaged over 1 gram
©2010 A Test Lab Techno Corp.
Report Number: 1011FS15 Page 24 of 89
Draft Report

0.0
0.2
0.4
0.6
0.8
1.0
1.2
1.4
1.6
0.005 0.010 0.015 0.020 0.025
1g/10g Averaged SARm
W/g
m
SAR; Zoom Scan:Value Along Z, X=3, Y=4 Markers
Z-axis Plot of Flat WCDMA(RMC 12.2K) Band V CH 4233 _ Bottom
©2010 A Test Lab Techno Corp.
Report Number: 1011FS15 Page 25 of 89
Draft Report

9.3 Std. C95.1-2005 RF Exposure Limit
Population Uncontrolled Occupational Controlled
Exposure Exposure Human Exposure
( W/kg ) or (mW/g) ( W/kg ) or (mW/g)
Spatial Peak SAR*
(head) 1.60 8.00
Spatial Peak SAR**
(Whole Body) 0.08 0.40
Spatial Peak SAR***
(Partial-Body) 1.60 8.00
Spatial Peak SAR****
(Hands / Feet / Ankle / Wrist ) 4.00 20.00
Table 6. Safety Limits for Partial Body Exposure
Notes:
* The Spatial Peak value of the SAR averaged over any 1 gram of tissue.
( defined as a tissue volume in the shape of a cube ) and over the appropriate averaging time.
** The Spatial Average value of the SAR averaged over the whole – body.
*** The Spatial Average value of the SAR averaged over the partial – body.
**** The Spatial Peak value of the SAR averaged over any 10 grams of tissue.
( defined as a tissue volume in the shape of a cube ) and over the appropriate averaging time.
Population / Uncontrolled Environments:are defined as locations where there is the exposure of
individuals who have no knowledge or control of their exposure.
Occupational / Controlled Environments:are defined as locations where there is exposure that may
be incurred by persons who are aware of the potential for exposure, (i.e. as a result of employment or
occupation).
©2010 A Test Lab Techno Corp.
Report Number: 1011FS15 Page 26 of 89
Draft Report

10. Conclusion
The SAR test values found for the portable mobile phone Huawei Technologies Co., Ltd. Trade
Name:HUAWEI Model(s):EM770W is below the maximum recommended level of 1.6 W/kg (mW/g).
11. References
[1] Std. C95.1-2005, “American National Standard safety levels with respect to human exposure to
radio frequency electromagnetic fields, 300KHz to 100GHz”, New York.
[2] NCRP, National Council on Radiation Protection and Measurements, “Biological Effects and
Exposure Criteria for Radio frequency Electromagnetic Fields”, NCRP report NO. 86, 1986.
[3] T. Schmid, O. Egger, and N. Kuster, “Automatic E-field scanning system for dosimetric
assessments”, IEEE Transactions on Microwave Theory and Techniques, vol. 44, pp, 105-113, Jan.
1996.
[4] K. Pokovi,c , T. Schmid, and N. Kuster, “Robust setup for precise calibration of E-field probes in
tissue simulating liquids at mobile communications frequency”, in ICECOM’97, Dubrovnik, October
15-17, 1997, pp.120-124.
[5] K. Pokovi,c , T. Schmid, and N. Kuster, “E-field probe with improved isotropy in brain simulating
liquids”, in Proceedings of the ELMAR, Zadar, Croatia, 23-25 June, 1996, pp.172-175.
[6] N. Kuster, and Q. Balzano, “Energy absorption mechanism by biological bodies in the near field of
dipole antennas above 300MHz”, IEEE Transaction on Vehicular Technology, vol. 41, no. 1, Feb.
1992, pp. 17-23.
[7] Robert J. Renka, ”Multivariate Interpolation Of Large Sets Of Scattered Data”, University of North
Texas ACM Transactions on Mathematical Software, vol. 14, no. 2, June 1988 , pp. 139-148.
[8] N. Kuster, R. Kastle, T. Schmid, Dosimetric evaluation of mobile communications equipment with
known precision, IEEE Transaction on Communications, vol. E80-B, no. 5, May 1997, pp. 645-652.
[9] Std. C95.3-1991, “IEEE Recommended Practice for the Measurement of Potentially Hazardous
Electromagnetic Fields – RF and Microwave, New York: IEEE, Aug. 1992.
[10] CENELEC CLC/SC111B, European Prestandard (prENV 50166-2), Human Exposure to
Electromagnetic Fields High-frequency: 10KHz-300GHz, Jan. 1995.
©2010 A Test Lab Techno Corp.
Report Number: 1011FS15 Page 27 of 89
Draft Report

Appendix A - System Performance Check
Test Laboratory: A Test Lab Techno Corp.
Date/Time: 8/28/2010 9:27:32 AM
System Performance Check at 835MHz_20100828_Body
DUT: Dipole 835 MHz; Type: D835V2; Serial: D835V2 - SN:4d082
Communication System: CW; Frequency: 835 MHz;Duty Cycle: 1:1 Medium parameters used: f = 835 MHz; � = 0.981 mho/m; �r = 54.7; � = 1000 kg/m3
Phantom section: Flat Section Measurement Standard: DASY5 (IEEE/IEC)
DASY5 Configuration:
� Probe: EX3DV4 - SN3632; ConvF(9.17, 9.17, 9.17); Calibrated: 1/26/2010 � Sensor-Surface: 3mm (Mechanical Surface Detection) � Electronics: DAE4 Sn779; Calibrated: 1/21/2010 � Phantom: ELI 4.0; Type: QDOVA001BB; Serial: 1036 � Measurement SW: DASY5, V5.0 Build 125;SEMCAD X Version 13.4 Build 125
System Performance Check at 835MHz/Area Scan (61x121x1): Measurement grid: dx=15mm, dy=15mm Maximum value of SAR (interpolated) = 2.86 mW/g System Performance Check at 835MHz/Zoom Scan (7x7x7)/Cube 0: Measurement grid: dx=5mm, dy=5mm, dz=5mm Reference Value = 53.4 V/m; Power Drift = 0.054 dB Peak SAR (extrapolated) = 3.73 W/kg SAR(1 g) = 2.49 mW/g; SAR(10 g) = 1.63 mW/g Maximum value of SAR (measured) = 2.91 mW/g
0 dB = 2.91mW/g
©2010 A Test Lab Techno Corp.
Report Number: 1011FS15 Page 28 of 89
Draft Report

Test Laboratory: A Test Lab Techno Corp.
Date/Time: 8/28/2010 4:32:12 PM
System Performance Check at 1900MHz_20100828_Body
DUT: Dipole D1900V2_SN5d111; Type: D1900V2; Serial: D1900V2 - SN:5d111
Communication System: CW; Frequency: 1900 MHz;Duty Cycle: 1:1 Medium parameters used: f = 1900 MHz; � = 1.51 mho/m; �r = 52.6; � = 1000 kg/m3
Phantom section: Flat Section Measurement Standard: DASY5 (IEEE/IEC)
DASY5 Configuration:
� Probe: EX3DV4 - SN3632; ConvF(7.57, 7.57, 7.57); Calibrated: 1/26/2010 � Sensor-Surface: 3mm (Mechanical Surface Detection) � Electronics: DAE4 Sn779; Calibrated: 1/21/2010 � Phantom: ELI 4.0; Type: QDOVA001BB; Serial: 1036 � Measurement SW: DASY5, V5.0 Build 125;SEMCAD X Version 13.4 Build 125
System Performance Check at 1900MHz/Area Scan (61x61x1): Measurement grid: dx=15mm, dy=15mm Maximum value of SAR (interpolated) = 12.9 mW/g System Performance Check at 1900MHz/Zoom Scan (7x7x7)/Cube 0: Measurement grid: dx=5mm, dy=5mm, dz=5mm Reference Value = 85.9 V/m; Power Drift = 0.186 dB Peak SAR (extrapolated) = 19.5 W/kg SAR(1 g) = 10.6 mW/g; SAR(10 g) = 5.52 mW/g Maximum value of SAR (measured) = 13.6 mW/g
0 dB = 13.6mW/g
©2010 A Test Lab Techno Corp.
Report Number: 1011FS15 Page 29 of 89
Draft Report

Appendix B - SAR Measurement Data
Test Laboratory: A Test Lab Techno Corp.
Date/Time: 8/28/2010 6:45:47 PM
Flat_WCDMA Band II CH9262_Bottom Close Body
DUT: EM770W ; Type: HSPA Module; FCC ID: QISEM770W
Communication System: WCDMA Band II; Frequency: 1852.4 MHz;Duty Cycle: 1:1 Medium parameters used (interpolated): f = 1852.4 MHz; � = 1.46 mho/m; �r = 52.6; � = 1000 kg/m3
Phantom section: Flat Section Measurement Standard: DASY5 (IEEE/IEC)
DASY5 Configuration:
� Probe: EX3DV4 - SN3632; ConvF(7.57, 7.57, 7.57); Calibrated: 1/26/2010 � Sensor-Surface: 3mm (Mechanical Surface Detection) � Electronics: DAE4 Sn779; Calibrated: 1/21/2010 � Phantom: ELI 4.0; Type: QDOVA001BB; Serial: 1036 � Measurement SW: DASY5, V5.0 Build 125;SEMCAD X Version 13.4 Build 125
Flat/Area Scan (81x111x1): Measurement grid: dx=15mm, dy=15mm Maximum value of SAR (interpolated) = 1.36 mW/g Flat/Zoom Scan (7x7x9)/Cube 0: Measurement grid: dx=5mm, dy=5mm, dz=3mm Reference Value = 4.82 V/m; Power Drift = -0.048 dB Peak SAR (extrapolated) = 1.68 W/kg SAR(1 g) = 1.01 mW/g; SAR(10 g) = 0.575 mW/g Maximum value of SAR (measured) = 1.23 mW/g
0 dB = 1.23mW/g
©2010 A Test Lab Techno Corp.
Report Number: 1011FS15 Page 30 of 89
Draft Report
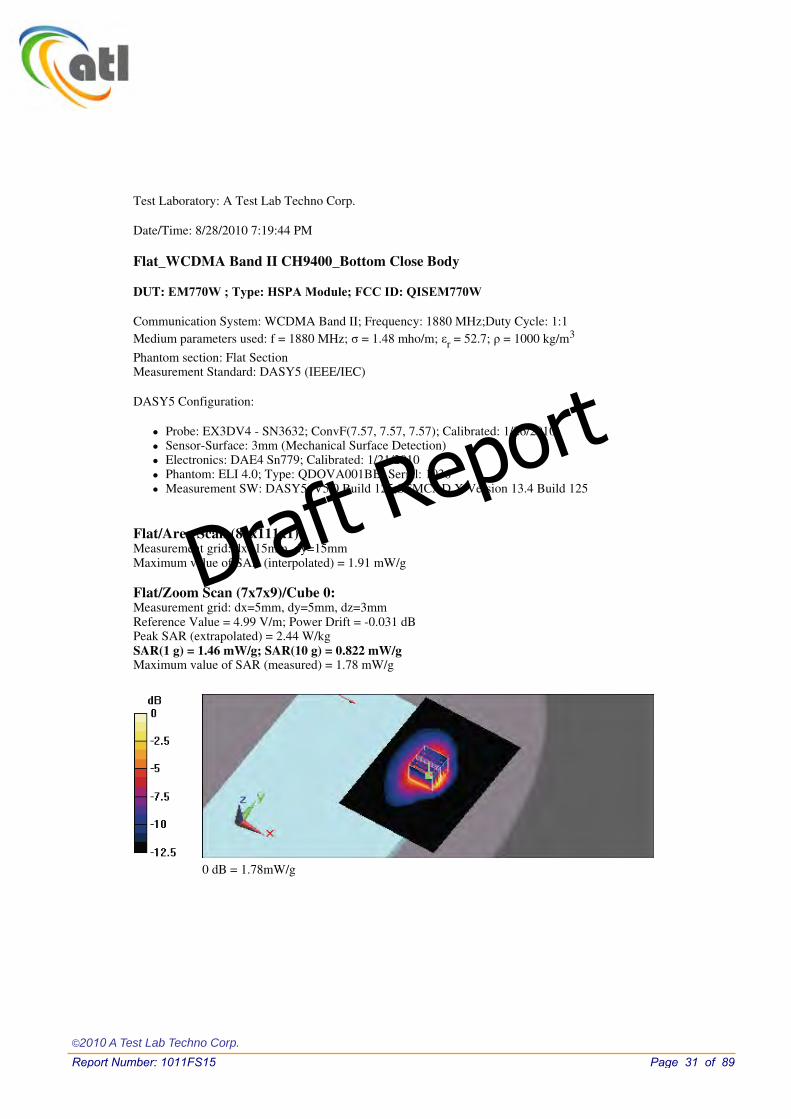
Test Laboratory: A Test Lab Techno Corp.
Date/Time: 8/28/2010 7:19:44 PM
Flat_WCDMA Band II CH9400_Bottom Close Body
DUT: EM770W ; Type: HSPA Module; FCC ID: QISEM770W
Communication System: WCDMA Band II; Frequency: 1880 MHz;Duty Cycle: 1:1 Medium parameters used: f = 1880 MHz; � = 1.48 mho/m; �r = 52.7; � = 1000 kg/m3
Phantom section: Flat Section Measurement Standard: DASY5 (IEEE/IEC)
DASY5 Configuration:
� Probe: EX3DV4 - SN3632; ConvF(7.57, 7.57, 7.57); Calibrated: 1/26/2010 � Sensor-Surface: 3mm (Mechanical Surface Detection) � Electronics: DAE4 Sn779; Calibrated: 1/21/2010 � Phantom: ELI 4.0; Type: QDOVA001BB; Serial: 1036 � Measurement SW: DASY5, V5.0 Build 125;SEMCAD X Version 13.4 Build 125
Flat/Area Scan (81x111x1): Measurement grid: dx=15mm, dy=15mm Maximum value of SAR (interpolated) = 1.91 mW/g Flat/Zoom Scan (7x7x9)/Cube 0: Measurement grid: dx=5mm, dy=5mm, dz=3mm Reference Value = 4.99 V/m; Power Drift = -0.031 dB Peak SAR (extrapolated) = 2.44 W/kg SAR(1 g) = 1.46 mW/g; SAR(10 g) = 0.822 mW/g Maximum value of SAR (measured) = 1.78 mW/g
0 dB = 1.78mW/g
©2010 A Test Lab Techno Corp.
Report Number: 1011FS15 Page 31 of 89
Draft Report

Test Laboratory: A Test Lab Techno Corp.
Date/Time: 8/28/2010 7:49:26 PM
Flat_WCDMA Band II CH9538_Bottom Close Body
DUT: EM770W ; Type: HSPA Module; FCC ID: QISEM770W
Communication System: WCDMA Band II; Frequency: 1907.6 MHz;Duty Cycle: 1:1 Medium parameters used: f = 1908 MHz; � = 1.52 mho/m; �r = 52.6; � = 1000 kg/m3
Phantom section: Flat Section Measurement Standard: DASY5 (IEEE/IEC)
DASY5 Configuration:
� Probe: EX3DV4 - SN3632; ConvF(7.57, 7.57, 7.57); Calibrated: 1/26/2010 � Sensor-Surface: 3mm (Mechanical Surface Detection) � Electronics: DAE4 Sn779; Calibrated: 1/21/2010 � Phantom: ELI 4.0; Type: QDOVA001BB; Serial: 1036 � Measurement SW: DASY5, V5.0 Build 125;SEMCAD X Version 13.4 Build 125
Flat/Area Scan (81x111x1): Measurement grid: dx=15mm, dy=15mm Maximum value of SAR (interpolated) = 1.83 mW/g Flat/Zoom Scan (7x7x9)/Cube 0: Measurement grid: dx=5mm, dy=5mm, dz=3mm Reference Value = 4.93 V/m; Power Drift = 0.146 dB Peak SAR (extrapolated) = 2.32 W/kg SAR(1 g) = 1.4 mW/g; SAR(10 g) = 0.786 mW/g Maximum value of SAR (measured) = 1.71 mW/g
0 dB = 1.78mW/g
©2010 A Test Lab Techno Corp.
Report Number: 1011FS15 Page 32 of 89
Draft Report

Test Laboratory: A Test Lab Techno Corp.
Date/Time: 8/29/2010 1:31:44 AM
Flat_HSDPA Band II CH9262_Sub-test1_Bottom Close Body
DUT: EM770W ; Type: HSPA Module; FCC ID: QISEM770W
Communication System: WCDMA HSDPA Band II; Frequency: 1852.4 MHz;Duty Cycle: 1:1 Medium parameters used (interpolated): f = 1852.4 MHz; � = 1.46 mho/m; �r = 52.6; � = 1000 kg/m3
Phantom section: Flat Section Measurement Standard: DASY5 (IEEE/IEC)
DASY5 Configuration:
� Probe: EX3DV4 - SN3632; ConvF(7.57, 7.57, 7.57); Calibrated: 1/26/2010 � Sensor-Surface: 3mm (Mechanical Surface Detection) � Electronics: DAE4 Sn779; Calibrated: 1/21/2010 � Phantom: ELI 4.0; Type: QDOVA001BB; Serial: 1036 � Measurement SW: DASY5, V5.0 Build 125;SEMCAD X Version 13.4 Build 125
Flat/Area Scan (81x111x1): Measurement grid: dx=15mm, dy=15mm Maximum value of SAR (interpolated) = 1.81 mW/g Flat/Zoom Scan (7x7x9)/Cube 0: Measurement grid: dx=5mm, dy=5mm, dz=3mm Reference Value = 4.77 V/m; Power Drift = -0.121 dB Peak SAR (extrapolated) = 2.38 W/kg SAR(1 g) = 1.33 mW/g; SAR(10 g) = 0.803 mW/g Maximum value of SAR (measured) = 1.64 mW/g
0 dB = 1.64mW/g
©2010 A Test Lab Techno Corp.
Report Number: 1011FS15 Page 33 of 89
Draft Report
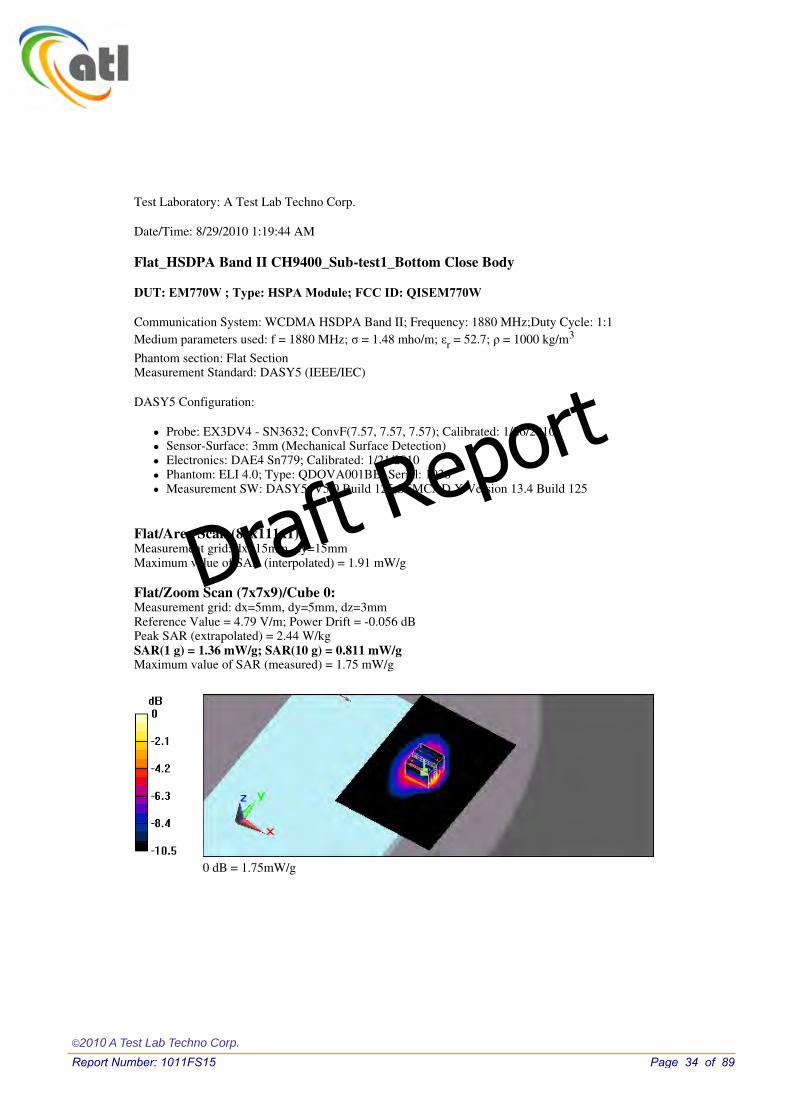
Test Laboratory: A Test Lab Techno Corp.
Date/Time: 8/29/2010 1:19:44 AM
Flat_HSDPA Band II CH9400_Sub-test1_Bottom Close Body
DUT: EM770W ; Type: HSPA Module; FCC ID: QISEM770W
Communication System: WCDMA HSDPA Band II; Frequency: 1880 MHz;Duty Cycle: 1:1 Medium parameters used: f = 1880 MHz; � = 1.48 mho/m; �r = 52.7; � = 1000 kg/m3
Phantom section: Flat Section Measurement Standard: DASY5 (IEEE/IEC)
DASY5 Configuration:
� Probe: EX3DV4 - SN3632; ConvF(7.57, 7.57, 7.57); Calibrated: 1/26/2010 � Sensor-Surface: 3mm (Mechanical Surface Detection) � Electronics: DAE4 Sn779; Calibrated: 1/21/2010 � Phantom: ELI 4.0; Type: QDOVA001BB; Serial: 1036 � Measurement SW: DASY5, V5.0 Build 125;SEMCAD X Version 13.4 Build 125
Flat/Area Scan (81x111x1): Measurement grid: dx=15mm, dy=15mm Maximum value of SAR (interpolated) = 1.91 mW/g Flat/Zoom Scan (7x7x9)/Cube 0: Measurement grid: dx=5mm, dy=5mm, dz=3mm Reference Value = 4.79 V/m; Power Drift = -0.056 dB Peak SAR (extrapolated) = 2.44 W/kg SAR(1 g) = 1.36 mW/g; SAR(10 g) = 0.811 mW/g Maximum value of SAR (measured) = 1.75 mW/g
0 dB = 1.75mW/g
©2010 A Test Lab Techno Corp.
Report Number: 1011FS15 Page 34 of 89
Draft Report

Test Laboratory: A Test Lab Techno Corp.
Date/Time: 8/29/2010 2:06:22 AM
Flat_HSDPA Band II CH9538_Sub-test1_Bottom Close Body
DUT: EM770W ; Type: HSPA Module; FCC ID: QISEM770W
Communication System: WCDMA HSDPA Band II; Frequency: 1907.6 MHz;Duty Cycle: 1:1 Medium parameters used: f = 1908 MHz; � = 1.52 mho/m; �r = 52.6; � = 1000 kg/m3
Phantom section: Flat Section Measurement Standard: DASY5 (IEEE/IEC)
DASY5 Configuration:
� Probe: EX3DV4 - SN3632; ConvF(7.57, 7.57, 7.57); Calibrated: 1/26/2010 � Sensor-Surface: 3mm (Mechanical Surface Detection) � Electronics: DAE4 Sn779; Calibrated: 1/21/2010 � Phantom: ELI 4.0; Type: QDOVA001BB; Serial: 1036 � Measurement SW: DASY5, V5.0 Build 125;SEMCAD X Version 13.4 Build 125
Flat/Area Scan (81x111x1): Measurement grid: dx=15mm, dy=15mm Maximum value of SAR (interpolated) = 1.68 mW/g Flat/Zoom Scan (7x7x9)/Cube 0: Measurement grid: dx=5mm, dy=5mm, dz=3mm Reference Value = 5.08 V/m; Power Drift = -0.141 dB Peak SAR (extrapolated) = 2.53 W/kg SAR(1 g) = 1.31 mW/g; SAR(10 g) = 0.782 mW/g Maximum value of SAR (measured) = 1.61 mW/g
0 dB = 1.61mW/g
©2010 A Test Lab Techno Corp.
Report Number: 1011FS15 Page 35 of 89
Draft Report

Test Laboratory: A Test Lab Techno Corp.
Date/Time: 8/29/2010 6:30:28 AM
Flat_HSUPA Band II CH9262_Sub-test1_Bottom Close Body
DUT: EM770W ; Type: HSPA Module; FCC ID: QISEM770W
Communication System: HSUPA WCDMA Band II; Frequency: 1852.4 MHz;Duty Cycle: 1:1 Medium parameters used (interpolated): f = 1852.4 MHz; � = 1.46 mho/m; �r = 52.6; � = 1000 kg/m3
Phantom section: Flat Section Measurement Standard: DASY5 (IEEE/IEC)
DASY5 Configuration:
� Probe: EX3DV4 - SN3632; ConvF(7.57, 7.57, 7.57); Calibrated: 1/26/2010 � Sensor-Surface: 3mm (Mechanical Surface Detection) � Electronics: DAE4 Sn779; Calibrated: 1/21/2010 � Phantom: ELI 4.0; Type: QDOVA001BB; Serial: 1036 � Measurement SW: DASY5, V5.0 Build 125;SEMCAD X Version 13.4 Build 125
Flat/Area Scan (81x111x1): Measurement grid: dx=15mm, dy=15mm Maximum value of SAR (interpolated) = 1.69 mW/g Flat/Zoom Scan (7x7x9)/Cube 0: Measurement grid: dx=5mm, dy=5mm, dz=3mm Reference Value = 4.61 V/m; Power Drift = -0.183 dB Peak SAR (extrapolated) = 1.93 W/kg SAR(1 g) = 1.13 mW/g; SAR(10 g) = 0.766 mW/g Maximum value of SAR (measured) = 1.55 mW/g
0 dB = 1.55mW/g
©2010 A Test Lab Techno Corp.
Report Number: 1011FS15 Page 36 of 89
Draft Report

Test Laboratory: A Test Lab Techno Corp.
Date/Time: 8/29/2010 6:01:12 AM
Flat_HSUPA Band II CH9400_Sub-test1_Bottom Close Body
DUT: EM770W ; Type: HSPA Module; FCC ID: QISEM770W
Communication System: HSUPA WCDMA Band II; Frequency: 1880 MHz;Duty Cycle: 1:1 Medium parameters used: f = 1880 MHz; � = 1.48 mho/m; �r = 52.7; � = 1000 kg/m3
Phantom section: Flat Section Measurement Standard: DASY5 (IEEE/IEC)
DASY5 Configuration:
� Probe: EX3DV4 - SN3632; ConvF(7.57, 7.57, 7.57); Calibrated: 1/26/2010 � Sensor-Surface: 3mm (Mechanical Surface Detection) � Electronics: DAE4 Sn779; Calibrated: 1/21/2010 � Phantom: ELI 4.0; Type: QDOVA001BB; Serial: 1036 � Measurement SW: DASY5, V5.0 Build 125;SEMCAD X Version 13.4 Build 125
Flat/Area Scan (81x111x1): Measurement grid: dx=15mm, dy=15mm Maximum value of SAR (interpolated) = 1.71 mW/g Flat/Zoom Scan (7x7x9)/Cube 0: Measurement grid: dx=5mm, dy=5mm, dz=3mm Reference Value = 4.96 V/m; Power Drift = -0.123 dB Peak SAR (extrapolated) = 2.02 W/kg SAR(1 g) = 1.16 mW/g; SAR(10 g) = 0.788 mW/g Maximum value of SAR (measured) = 1.58 mW/g
0 dB = 1.58mW/g
©2010 A Test Lab Techno Corp.
Report Number: 1011FS15 Page 37 of 89
Draft Report

Test Laboratory: A Test Lab Techno Corp.
Date/Time: 8/29/2010 7:12:21 AM
Flat_HSUPA Band II CH9538_Sub-test1_Bottom Close Body
DUT: EM770W ; Type: HSPA Module; FCC ID: QISEM770W
Communication System: HSUPA WCDMA Band II; Frequency: 1907.6 MHz;Duty Cycle: 1:1 Medium parameters used: f = 1908 MHz; � = 1.52 mho/m; �r = 52.6; � = 1000 kg/m3
Phantom section: Flat Section Measurement Standard: DASY5 (IEEE/IEC)
DASY5 Configuration:
� Probe: EX3DV4 - SN3632; ConvF(7.57, 7.57, 7.57); Calibrated: 1/26/2010 � Sensor-Surface: 3mm (Mechanical Surface Detection) � Electronics: DAE4 Sn779; Calibrated: 1/21/2010 � Phantom: ELI 4.0; Type: QDOVA001BB; Serial: 1036 � Measurement SW: DASY5, V5.0 Build 125;SEMCAD X Version 13.4 Build 125
Flat/Area Scan (81x111x1): Measurement grid: dx=15mm, dy=15mm Maximum value of SAR (interpolated) = 1.68 mW/g Flat/Zoom Scan (7x7x9)/Cube 0: Measurement grid: dx=5mm, dy=5mm, dz=3mm Reference Value = 4.32 V/m; Power Drift = -0.088 dB Peak SAR (extrapolated) = 1.91 W/kg SAR(1 g) = 1.11 mW/g; SAR(10 g) = 0.758 mW/g Maximum value of SAR (measured) = 1.53 mW/g
0 dB = 1.53mW/g
©2010 A Test Lab Techno Corp.
Report Number: 1011FS15 Page 38 of 89
Draft Report

Test Laboratory: A Test Lab Techno Corp.
Date/Time: 8/28/2010 5:59:52 PM
Flat_WCDMA Band II CH9262_Tip Close Body
DUT: EM770W ; Type: HSPA Module; FCC ID: QISEM770W
Communication System: WCDMA Band II; Frequency: 1852.4 MHz;Duty Cycle: 1:1 Medium parameters used (interpolated): f = 1852.4 MHz; � = 1.46 mho/m; �r = 52.6; � = 1000 kg/m3
Phantom section: Flat Section Measurement Standard: DASY5 (IEEE/IEC)
DASY5 Configuration:
� Probe: EX3DV4 - SN3632; ConvF(7.57, 7.57, 7.57); Calibrated: 1/26/2010 � Sensor-Surface: 3mm (Mechanical Surface Detection) � Electronics: DAE4 Sn779; Calibrated: 1/21/2010 � Phantom: ELI 4.0; Type: QDOVA001BB; Serial: 1036 � Measurement SW: DASY5, V5.0 Build 125;SEMCAD X Version 13.4 Build 125
Flat/Area Scan (71x121x1): Measurement grid: dx=15mm, dy=15mm Maximum value of SAR (interpolated) = 1.16 mW/g Flat/Zoom Scan (7x7x9)/Cube 0: Measurement grid: dx=5mm, dy=5mm, dz=3mm Reference Value = 19.2 V/m; Power Drift = 0.188 dB Peak SAR (extrapolated) = 1.72 W/kg SAR(1 g) = 0.901 mW/g; SAR(10 g) = 0.466 mW/g Maximum value of SAR (measured) = 1.16 mW/g Flat/Zoom Scan (7x7x9)/Cube 1: Measurement grid: dx=5mm, dy=5mm, dz=3mm Reference Value = 19.2 V/m; Power Drift = 0.188 dB Peak SAR (extrapolated) = 1.42 W/kg SAR(1 g) = 0.691 mW/g; SAR(10 g) = 0.311 mW/g Maximum value of SAR (measured) = 0.902 mW/g
0 dB = 0.902mW/g
©2010 A Test Lab Techno Corp.
Report Number: 1011FS15 Page 39 of 89
Draft Report

Test Laboratory: A Test Lab Techno Corp.
Date/Time: 8/28/2010 8:24:48 PM
Flat_WCDMA Band II CH9400_Tip Close Body
DUT: EM770W ; Type: HSPA Module; FCC ID: QISEM770W
Communication System: WCDMA Band II; Frequency: 1880 MHz;Duty Cycle: 1:1 Medium parameters used: f = 1880 MHz; � = 1.48 mho/m; �r = 52.7; � = 1000 kg/m3
Phantom section: Flat Section Measurement Standard: DASY5 (IEEE/IEC)
DASY5 Configuration:
� Probe: EX3DV4 - SN3632; ConvF(7.57, 7.57, 7.57); Calibrated: 1/26/2010 � Sensor-Surface: 3mm (Mechanical Surface Detection) � Electronics: DAE4 Sn779; Calibrated: 1/21/2010 � Phantom: ELI 4.0; Type: QDOVA001BB; Serial: 1036 � Measurement SW: DASY5, V5.0 Build 125;SEMCAD X Version 13.4 Build 125
Flat/Area Scan (71x121x1): Measurement grid: dx=15mm, dy=15mm Maximum value of SAR (interpolated) = 1.47 mW/g Flat/Zoom Scan (7x7x9)/Cube 0: Measurement grid: dx=5mm, dy=5mm, dz=3mm Reference Value = 22.1 V/m; Power Drift = 0.126 dB Peak SAR (extrapolated) = 2.19 W/kg SAR(1 g) = 1.13 mW/g; SAR(10 g) = 0.576 mW/g Maximum value of SAR (measured) = 1.47 mW/g
0 dB = 1.47mW/g
©2010 A Test Lab Techno Corp.
Report Number: 1011FS15 Page 40 of 89
Draft Report

Test Laboratory: A Test Lab Techno Corp.
Date/Time: 8/28/2010 8:53:52 PM
Flat_WCDMA Band II CH9538_Tip Close Body
DUT: EM770W ; Type: HSPA Module; FCC ID: QISEM770W
Communication System: WCDMA Band II; Frequency: 1907.6 MHz;Duty Cycle: 1:1 Medium parameters used: f = 1908 MHz; � = 1.52 mho/m; �r = 52.6; � = 1000 kg/m3
Phantom section: Flat Section Measurement Standard: DASY5 (IEEE/IEC)
DASY5 Configuration:
� Probe: EX3DV4 - SN3632; ConvF(7.57, 7.57, 7.57); Calibrated: 1/26/2010 � Sensor-Surface: 3mm (Mechanical Surface Detection) � Electronics: DAE4 Sn779; Calibrated: 1/21/2010 � Phantom: ELI 4.0; Type: QDOVA001BB; Serial: 1036 � Measurement SW: DASY5, V5.0 Build 125;SEMCAD X Version 13.4 Build 125
Flat/Area Scan (71x121x1): Measurement grid: dx=15mm, dy=15mm Maximum value of SAR (interpolated) = 1.33 mW/g Flat/Zoom Scan (7x7x9)/Cube 0: Measurement grid: dx=5mm, dy=5mm, dz=3mm Reference Value = 21.6 V/m; Power Drift = 0.156 dB Peak SAR (extrapolated) = 2.02 W/kg SAR(1 g) = 1.03 mW/g; SAR(10 g) = 0.525 mW/g Maximum value of SAR (measured) = 1.35 mW/g Flat/Zoom Scan (7x7x9)/Cube 1: Measurement grid: dx=5mm, dy=5mm, dz=3mm Reference Value = 21.6 V/m; Power Drift = 0.156 dB Peak SAR (extrapolated) = 1.61 W/kg SAR(1 g) = 0.791 mW/g; SAR(10 g) = 0.359 mW/gMaximum value of SAR (measured) = 0.979 mW/g
0 dB = 0.979mW/g
©2010 A Test Lab Techno Corp.
Report Number: 1011FS15 Page 41 of 89
Draft Report

Test Laboratory: A Test Lab Techno Corp.
Date/Time: 8/28/2010 9:40:29 PM
Flat_WCDMA Band II CH9400_Right Side edge Close Body
DUT: EM770W ; Type: HSPA Module; FCC ID: QISEM770W
Communication System: WCDMA Band II; Frequency: 1880 MHz;Duty Cycle: 1:1 Medium parameters used: f = 1880 MHz; � = 1.48 mho/m; �r = 52.7; � = 1000 kg/m3
Phantom section: Flat Section Measurement Standard: DASY5 (IEEE/IEC)
DASY5 Configuration:
� Probe: EX3DV4 - SN3632; ConvF(7.57, 7.57, 7.57); Calibrated: 1/26/2010 � Sensor-Surface: 3mm (Mechanical Surface Detection) � Electronics: DAE4 Sn779; Calibrated: 1/21/2010 � Phantom: ELI 4.0; Type: QDOVA001BB; Serial: 1036 � Measurement SW: DASY5, V5.0 Build 125;SEMCAD X Version 13.4 Build 125
Flat/Area Scan (71x121x1): Measurement grid: dx=15mm, dy=15mm Maximum value of SAR (interpolated) = 0.276 mW/g Flat/Zoom Scan (7x7x9)/Cube 0: Measurement grid: dx=5mm, dy=5mm, dz=3mm Reference Value = 7.09 V/m; Power Drift = 0.055 dB Peak SAR (extrapolated) = 0.467 W/kg SAR(1 g) = 0.228 mW/g; SAR(10 g) = 0.124 mW/g Maximum value of SAR (measured) = 0.295 mW/g
0 dB = 0.295mW/g
©2010 A Test Lab Techno Corp.
Report Number: 1011FS15 Page 42 of 89
Draft Report

Test Laboratory: A Test Lab Techno Corp.
Date/Time: 8/28/2010 2:32:38 PM
Flat_WCDMA Band V CH4132_Bottom Close Body
DUT: EM770W ; Type: HSPA Module; FCC ID: QISEM770W
Communication System: WCDMA Band V; Frequency: 826.4 MHz;Duty Cycle: 1:1 Medium parameters used (interpolated): f = 826.4 MHz; � = 0.97 mho/m; �r = 54.7; � = 1000 kg/m3
Phantom section: Flat Section Measurement Standard: DASY5 (IEEE/IEC)
DASY5 Configuration:
� Probe: EX3DV4 - SN3632; ConvF(9.17, 9.17, 9.17); Calibrated: 1/26/2010 � Sensor-Surface: 3mm (Mechanical Surface Detection) � Electronics: DAE4 Sn779; Calibrated: 1/21/2010 � Phantom: ELI 4.0; Type: QDOVA001BB; Serial: 1036 � Measurement SW: DASY5, V5.0 Build 125;SEMCAD X Version 13.4 Build 125
Flat/Area Scan (81x111x1): Measurement grid: dx=15mm, dy=15mm Maximum value of SAR (interpolated) = 1.39 mW/g Flat/Zoom Scan (7x7x9)/Cube 0: Measurement grid: dx=5mm, dy=5mm, dz=3mm Reference Value = 4.58 V/m; Power Drift = -0.031 dB Peak SAR (extrapolated) = 2.11 W/kg SAR(1 g) = 1.16 mW/g; SAR(10 g) = 0.662 mW/g Maximum value of SAR (measured) = 1.41 mW/g
0 dB = 1.41mW/g
©2010 A Test Lab Techno Corp.
Report Number: 1011FS15 Page 43 of 89
Draft Report
Test Laboratory: A Test Lab Techno Corp.
Date/Time: 8/28/2010 2:02:08 PM
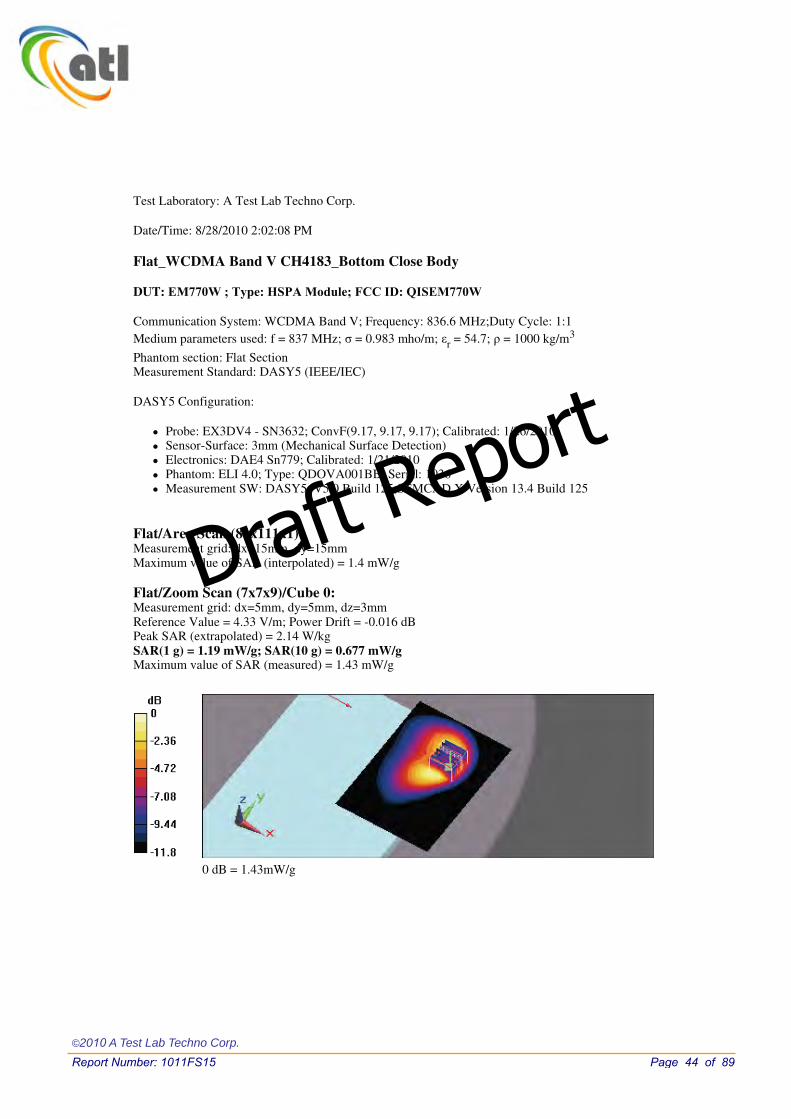
Flat_WCDMA Band V CH4183_Bottom Close Body
DUT: EM770W ; Type: HSPA Module; FCC ID: QISEM770W
Communication System: WCDMA Band V; Frequency: 836.6 MHz;Duty Cycle: 1:1 Medium parameters used: f = 837 MHz; � = 0.983 mho/m; �r = 54.7; � = 1000 kg/m3
Phantom section: Flat Section Measurement Standard: DASY5 (IEEE/IEC)
DASY5 Configuration:
� Probe: EX3DV4 - SN3632; ConvF(9.17, 9.17, 9.17); Calibrated: 1/26/2010 � Sensor-Surface: 3mm (Mechanical Surface Detection) � Electronics: DAE4 Sn779; Calibrated: 1/21/2010 � Phantom: ELI 4.0; Type: QDOVA001BB; Serial: 1036 � Measurement SW: DASY5, V5.0 Build 125;SEMCAD X Version 13.4 Build 125
Flat/Area Scan (81x111x1): Measurement grid: dx=15mm, dy=15mm Maximum value of SAR (interpolated) = 1.4 mW/g Flat/Zoom Scan (7x7x9)/Cube 0: Measurement grid: dx=5mm, dy=5mm, dz=3mm Reference Value = 4.33 V/m; Power Drift = -0.016 dB Peak SAR (extrapolated) = 2.14 W/kg SAR(1 g) = 1.19 mW/g; SAR(10 g) = 0.677 mW/g Maximum value of SAR (measured) = 1.43 mW/g
0 dB = 1.43mW/g
©2010 A Test Lab Techno Corp.
Report Number: 1011FS15 Page 44 of 89
Draft Report

Test Laboratory: A Test Lab Techno Corp.
Date/Time: 8/28/2010 3:02:21 PM
Flat_WCDMA Band V CH4233_Bottom Close Body
DUT: EM770W ; Type: HSPA Module; FCC ID: QISEM770W
Communication System: WCDMA Band V; Frequency: 846.6 MHz;Duty Cycle: 1:1 Medium parameters used: f = 847 MHz; � = 0.997 mho/m; �r = 54.7; � = 1000 kg/m3
Phantom section: Flat Section Measurement Standard: DASY5 (IEEE/IEC)
DASY5 Configuration:
� Probe: EX3DV4 - SN3632; ConvF(9.17, 9.17, 9.17); Calibrated: 1/26/2010 � Sensor-Surface: 3mm (Mechanical Surface Detection) � Electronics: DAE4 Sn779; Calibrated: 1/21/2010 � Phantom: ELI 4.0; Type: QDOVA001BB; Serial: 1036 � Measurement SW: DASY5, V5.0 Build 125;SEMCAD X Version 13.4 Build 125
Flat/Area Scan (81x111x1): Measurement grid: dx=15mm, dy=15mm Maximum value of SAR (interpolated) = 1.54 mW/g Flat/Zoom Scan (7x7x9)/Cube 0: Measurement grid: dx=5mm, dy=5mm, dz=3mm Reference Value = 4.57 V/m; Power Drift = -0.034 dB Peak SAR (extrapolated) = 2.34 W/kg SAR(1 g) = 1.29 mW/g; SAR(10 g) = 0.733 mW/g Maximum value of SAR (measured) = 1.6 mW/g
0 dB = 1.6mW/g
©2010 A Test Lab Techno Corp.
Report Number: 1011FS15 Page 45 of 89
Draft Report

Test Laboratory: A Test Lab Techno Corp.
Date/Time: 8/28/2010 3:18:38 PM
Flat_HSDPA Band V CH4132_Sub-test1_Bottom Close Body
DUT: EM770W ; Type: HSPA Module; FCC ID: QISEM770W
Communication System: WCDMA HSDPA Band V; Frequency: 826.4 MHz;Duty Cycle: 1:1 Medium parameters used (interpolated): f = 826.4 MHz; � = 0.97 mho/m; �r = 54.7; � = 1000 kg/m3
Phantom section: Flat Section Measurement Standard: DASY5 (IEEE/IEC)
DASY5 Configuration:
� Probe: EX3DV4 - SN3632; ConvF(9.17, 9.17, 9.17); Calibrated: 1/26/2010 � Sensor-Surface: 3mm (Mechanical Surface Detection) � Electronics: DAE4 Sn779; Calibrated: 1/21/2010 � Phantom: ELI 4.0; Type: QDOVA001BB; Serial: 1036 � Measurement SW: DASY5, V5.0 Build 125;SEMCAD X Version 13.4 Build 125
Flat/Area Scan (81x111x1): Measurement grid: dx=15mm, dy=15mm Maximum value of SAR (interpolated) = 1.35 mW/g Flat/Zoom Scan (7x7x9)/Cube 0: Measurement grid: dx=5mm, dy=5mm, dz=3mm Reference Value = 4.38 V/m; Power Drift = -0.122 dB Peak SAR (extrapolated) = 2.11 W/kg SAR(1 g) = 1.06 mW/g; SAR(10 g) = 0.644 mW/g Maximum value of SAR (measured) = 1.36 mW/g
0 dB = 1.36mW/g
©2010 A Test Lab Techno Corp.
Report Number: 1011FS15 Page 46 of 89
Draft Report
Test Laboratory: A Test Lab Techno Corp.
Date/Time: 8/28/2010 10:36:38 PM
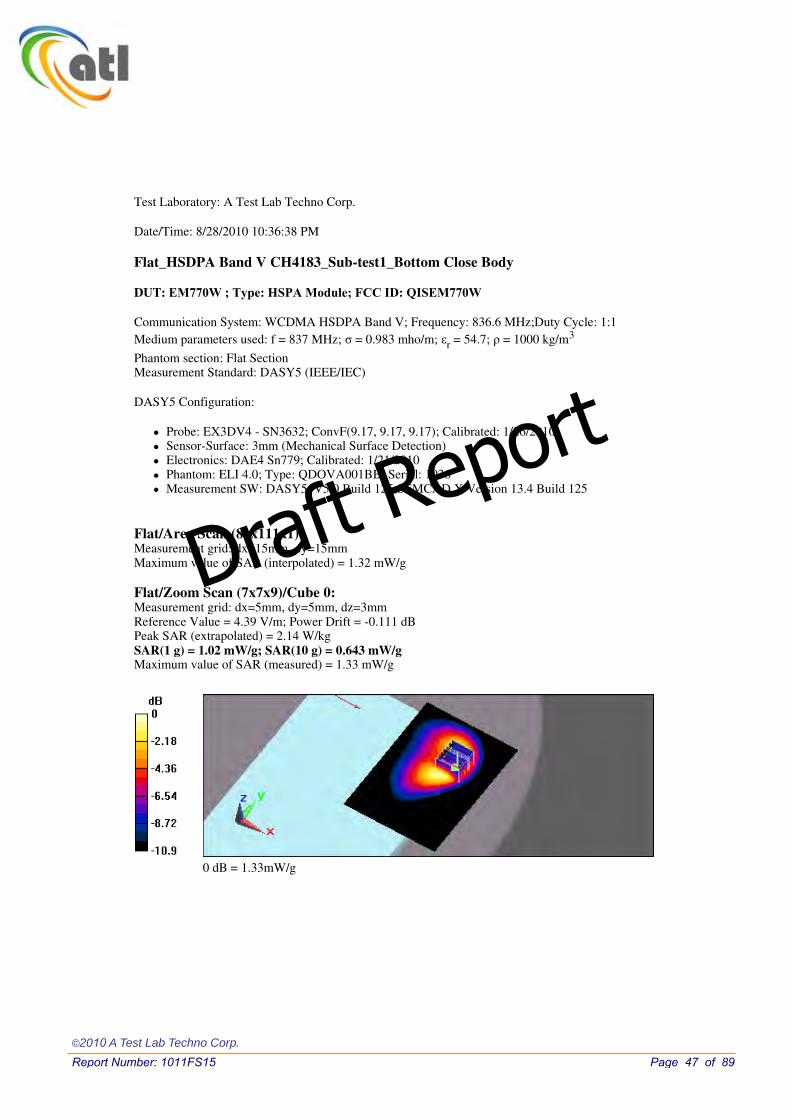
Flat_HSDPA Band V CH4183_Sub-test1_Bottom Close Body
DUT: EM770W ; Type: HSPA Module; FCC ID: QISEM770W
Communication System: WCDMA HSDPA Band V; Frequency: 836.6 MHz;Duty Cycle: 1:1 Medium parameters used: f = 837 MHz; � = 0.983 mho/m; �r = 54.7; � = 1000 kg/m3
Phantom section: Flat Section Measurement Standard: DASY5 (IEEE/IEC)
DASY5 Configuration:
� Probe: EX3DV4 - SN3632; ConvF(9.17, 9.17, 9.17); Calibrated: 1/26/2010 � Sensor-Surface: 3mm (Mechanical Surface Detection) � Electronics: DAE4 Sn779; Calibrated: 1/21/2010 � Phantom: ELI 4.0; Type: QDOVA001BB; Serial: 1036 � Measurement SW: DASY5, V5.0 Build 125;SEMCAD X Version 13.4 Build 125
Flat/Area Scan (81x111x1): Measurement grid: dx=15mm, dy=15mm Maximum value of SAR (interpolated) = 1.32 mW/g Flat/Zoom Scan (7x7x9)/Cube 0: Measurement grid: dx=5mm, dy=5mm, dz=3mm Reference Value = 4.39 V/m; Power Drift = -0.111 dB Peak SAR (extrapolated) = 2.14 W/kg SAR(1 g) = 1.02 mW/g; SAR(10 g) = 0.643 mW/g Maximum value of SAR (measured) = 1.33 mW/g
0 dB = 1.33mW/g
©2010 A Test Lab Techno Corp.
Report Number: 1011FS15 Page 47 of 89
Draft Report

Test Laboratory: A Test Lab Techno Corp.
Date/Time: 8/28/2010 11:32:42 PM
Flat_HSDPA Band V CH4233_Sub-test1_Bottom Close Body
DUT: EM770W ; Type: HSPA Module; FCC ID: QISEM770W
Communication System: WCDMA HSDPA Band V; Frequency: 846.6 MHz;Duty Cycle: 1:1 Medium parameters used: f = 847 MHz; � = 0.997 mho/m; �r = 54.7; � = 1000 kg/m3
Phantom section: Flat Section Measurement Standard: DASY5 (IEEE/IEC)
DASY5 Configuration:
� Probe: EX3DV4 - SN3632; ConvF(9.17, 9.17, 9.17); Calibrated: 1/26/2010 � Sensor-Surface: 3mm (Mechanical Surface Detection) � Electronics: DAE4 Sn779; Calibrated: 1/21/2010 � Phantom: ELI 4.0; Type: QDOVA001BB; Serial: 1036 � Measurement SW: DASY5, V5.0 Build 125;SEMCAD X Version 13.4 Build 125
Flat/Area Scan (81x111x1): Measurement grid: dx=15mm, dy=15mm Maximum value of SAR (interpolated) = 1.32 mW/g Flat/Zoom Scan (7x7x9)/Cube 0: Measurement grid: dx=5mm, dy=5mm, dz=3mm Reference Value = 4.28 V/m; Power Drift = -0.066 dB Peak SAR (extrapolated) = 2.18 W/kg SAR(1 g) = 1.01 mW/g; SAR(10 g) = 0.641 mW/g Maximum value of SAR (measured) = 1.29 mW/g
0 dB = 1.29mW/g
©2010 A Test Lab Techno Corp.
Report Number: 1011FS15 Page 48 of 89
Draft Report

Test Laboratory: A Test Lab Techno Corp.
Date/Time: 8/29/2010 3:55:44 AM
Flat_HSUPA Band V CH4132_Sub-test1_Bottom Close Body
DUT: EM770W ; Type: HSPA Module; FCC ID: QISEM770W
Communication System: HSUPA WCDMA Band V; Frequency: 826.4 MHz;Duty Cycle: 1:1 Medium parameters used (interpolated): f = 826.4 MHz; � = 0.97 mho/m; �r = 54.7; � = 1000 kg/m3
Phantom section: Flat Section Measurement Standard: DASY5 (IEEE/IEC)
DASY5 Configuration:
� Probe: EX3DV4 - SN3632; ConvF(9.17, 9.17, 9.17); Calibrated: 1/26/2010 � Sensor-Surface: 3mm (Mechanical Surface Detection) � Electronics: DAE4 Sn779; Calibrated: 1/21/2010 � Phantom: ELI 4.0; Type: QDOVA001BB; Serial: 1036 � Measurement SW: DASY5, V5.0 Build 125;SEMCAD X Version 13.4 Build 125
Flat/Area Scan (81x111x1): Measurement grid: dx=15mm, dy=15mm Maximum value of SAR (interpolated) = 1.39 mW/g Flat/Zoom Scan (7x7x9)/Cube 0: Measurement grid: dx=5mm, dy=5mm, dz=3mm Reference Value = 4.31 V/m; Power Drift = -0.16 dB Peak SAR (extrapolated) = 1.66 W/kg SAR(1 g) = 0.964 mW/g; SAR(10 g) = 0.548 mW/g Maximum value of SAR (measured) = 1.21 mW/g
0 dB = 1.21mW/g
©2010 A Test Lab Techno Corp.
Report Number: 1011FS15 Page 49 of 89
Draft Report

Test Laboratory: A Test Lab Techno Corp.
Date/Time: 8/29/2010 4:25:41 AM
Flat_HSUPA Band V CH4183_Sub-test1_Bottom Close Body
DUT: EM770W ; Type: HSPA Module; FCC ID: QISEM770W
Communication System: HSUPA WCDMA Band V; Frequency: 836.6 MHz;Duty Cycle: 1:1 Medium parameters used (interpolated): f = 837 MHz; � = 0.983 mho/m; �
r = 54.7; � = 1000 kg/m3
Phantom section: Flat Section Measurement Standard: DASY5 (IEEE/IEC)
DASY5 Configuration:
� Probe: EX3DV4 - SN3632; ConvF(9.17, 9.17, 9.17); Calibrated: 1/26/2010 � Sensor-Surface: 3mm (Mechanical Surface Detection) � Electronics: DAE4 Sn779; Calibrated: 1/21/2010 � Phantom: ELI 4.0; Type: QDOVA001BB; Serial: 1036 � Measurement SW: DASY5, V5.0 Build 125;SEMCAD X Version 13.4 Build 125
Flat/Area Scan (81x111x1): Measurement grid: dx=15mm, dy=15mm Maximum value of SAR (interpolated) = 1.43 mW/g Flat/Zoom Scan (7x7x9)/Cube 0: Measurement grid: dx=5mm, dy=5mm, dz=3mm Reference Value = 4.36 V/m; Power Drift = -0.133 dB Peak SAR (extrapolated) = 1.66 W/kg SAR(1 g) = 0.985 mW/g; SAR(10 g) = 0.559 mW/g Maximum value of SAR (measured) = 1.28 mW/g
0 dB = 1.28mW/g
©2010 A Test Lab Techno Corp.
Report Number: 1011FS15 Page 50 of 89
Draft Report

Test Laboratory: A Test Lab Techno Corp.
Date/Time: 8/29/2010 4:50:41 AM
Flat_HSUPA Band V CH4233_Sub-test1_Bottom Close Body
DUT: EM770W ; Type: HSPA Module; FCC ID: QISEM770W
Communication System: HSUPA WCDMA Band V; Frequency: 846.6 MHz;Duty Cycle: 1:1 Medium parameters used (interpolated): f = 847 MHz; � = 0.997 mho/m; �r = 54.7; � = 1000 kg/m3
Phantom section: Flat Section Measurement Standard: DASY5 (IEEE/IEC)
DASY5 Configuration:
� Probe: EX3DV4 - SN3632; ConvF(9.17, 9.17, 9.17); Calibrated: 1/26/2010 � Sensor-Surface: 3mm (Mechanical Surface Detection) � Electronics: DAE4 Sn779; Calibrated: 1/21/2010 � Phantom: ELI 4.0; Type: QDOVA001BB; Serial: 1036 � Measurement SW: DASY5, V5.0 Build 125;SEMCAD X Version 13.4 Build 125
Flat/Area Scan (81x111x1): Measurement grid: dx=15mm, dy=15mm Maximum value of SAR (interpolated) = 1.36 mW/g Flat/Zoom Scan (7x7x9)/Cube 0: Measurement grid: dx=5mm, dy=5mm, dz=3mm Reference Value = 4.26 V/m; Power Drift = -0.034 dB Peak SAR (extrapolated) = 1.58 W/kg SAR(1 g) = 0.952 mW/g; SAR(10 g) = 0.547 mW/g Maximum value of SAR (measured) = 1.2 mW/g
0 dB = 1.2mW/g
©2010 A Test Lab Techno Corp.
Report Number: 1011FS15 Page 51 of 89
Draft Report

Test Laboratory: A Test Lab Techno Corp.
Date/Time: 8/28/2010 11:47:36 AM
Flat_WCDMA Band V CH4183_Tip Close Body
DUT: EM770W ; Type: HSPA Module; FCC ID: QISEM770W
Communication System: WCDMA Band V; Frequency: 836.6 MHz;Duty Cycle: 1:1 Medium parameters used: f = 837 MHz; � = 0.983 mho/m; �r = 54.7; � = 1000 kg/m3
Phantom section: Flat Section Measurement Standard: DASY5 (IEEE/IEC)
DASY5 Configuration:
� Probe: EX3DV4 - SN3632; ConvF(9.17, 9.17, 9.17); Calibrated: 1/26/2010 � Sensor-Surface: 3mm (Mechanical Surface Detection) � Electronics: DAE4 Sn779; Calibrated: 1/21/2010 � Phantom: ELI 4.0; Type: QDOVA001BB; Serial: 1036 � Measurement SW: DASY5, V5.0 Build 125;SEMCAD X Version 13.4 Build 125
Flat/Area Scan (71x121x1): Measurement grid: dx=15mm, dy=15mm Maximum value of SAR (interpolated) = 0.845 mW/g Flat/Zoom Scan (7x7x9)/Cube 0: Measurement grid: dx=5mm, dy=5mm, dz=3mm Reference Value = 20.2 V/m; Power Drift = 0.091 dB Peak SAR (extrapolated) = 1.75 W/kg SAR(1 g) = 0.772 mW/g; SAR(10 g) = 0.366 mW/g Maximum value of SAR (measured) = 1.04 mW/g Flat/Zoom Scan (7x7x9)/Cube 1: Measurement grid: dx=5mm, dy=5mm, dz=3mm Reference Value = 20.2 V/m; Power Drift = 0.091 dB Peak SAR (extrapolated) = 1.06 W/kg SAR(1 g) = 0.625 mW/g; SAR(10 g) = 0.398 mW/g Maximum value of SAR (measured) = 0.756 mW/g
0 dB = 0.756mW/g
©2010 A Test Lab Techno Corp.
Report Number: 1011FS15 Page 52 of 89
Draft Report

Test Laboratory: A Test Lab Techno Corp.
Date/Time: 8/28/2010 12:36:15 PM
Flat_WCDMA Band V CH4183_Right Side edge Close Body
DUT: EM770W ; Type: HSPA Module; FCC ID: QISEM770W
Communication System: WCDMA Band V; Frequency: 836.6 MHz;Duty Cycle: 1:1 Medium parameters used: f = 837 MHz; � = 0.983 mho/m; �r = 54.7; � = 1000 kg/m3
Phantom section: Flat Section Measurement Standard: DASY5 (IEEE/IEC)
DASY5 Configuration:
� Probe: EX3DV4 - SN3632; ConvF(9.17, 9.17, 9.17); Calibrated: 1/26/2010 � Sensor-Surface: 3mm (Mechanical Surface Detection) � Electronics: DAE4 Sn779; Calibrated: 1/21/2010 � Phantom: ELI 4.0; Type: QDOVA001BB; Serial: 1036 � Measurement SW: DASY5, V5.0 Build 125;SEMCAD X Version 13.4 Build 125
Flat/Area Scan (71x121x1): Measurement grid: dx=15mm, dy=15mm Maximum value of SAR (interpolated) = 0.215 mW/g Flat/Zoom Scan (7x7x9)/Cube 0: Measurement grid: dx=5mm, dy=5mm, dz=3mm Reference Value = 8.8 V/m; Power Drift = 0.087 dB Peak SAR (extrapolated) = 0.352 W/kg SAR(1 g) = 0.190 mW/g; SAR(10 g) = 0.111 mW/g Maximum value of SAR (measured) = 0.239 mW/g
0 dB = 0.239mW/g
©2010 A Test Lab Techno Corp.
Report Number: 1011FS15 Page 53 of 89
Draft Report

Appendix C - Calibration
All of the instruments Calibration information are listed below.
Dipole _ D835V2 SN:4d082 Calibration No.D835V2-4d082 _Jul10
Dipole _ D1900V2 SN:5d111 Calibration No.D1900V2-5d111_Jul10
Probe _ EX3DV4 SN:3632 Calibration No.EX3-3632_Jan10
DAE _ DAE4 SN:779 Calibration No.DAE4-779_ Jan10
©2010 A Test Lab Techno Corp.
Report Number: 1011FS15 Page 54 of 89
Draft Report

©2010 A Test Lab Techno Corp.
Report Number: 1011FS15 Page 55 of 89
Draft Report
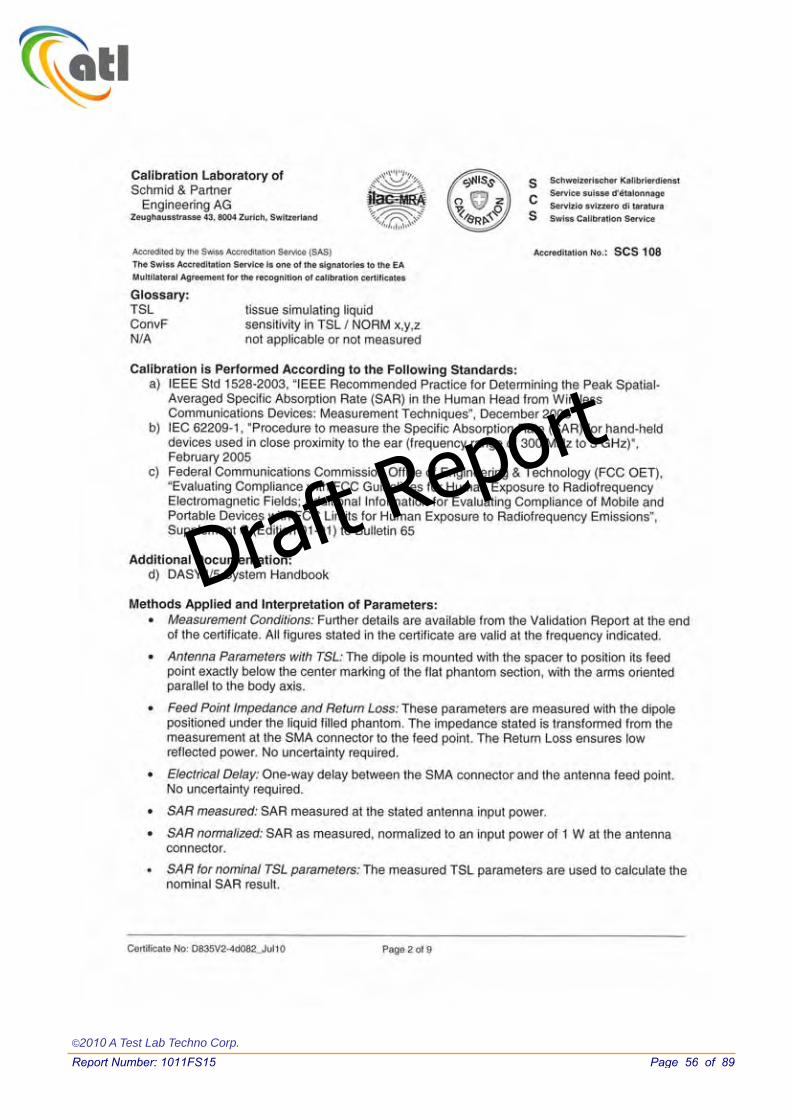
©2010 A Test Lab Techno Corp.
Report Number: 1011FS15 Page 56 of 89
Draft Report

©2010 A Test Lab Techno Corp.
Report Number: 1011FS15 Page 57 of 89
Draft Report

©2010 A Test Lab Techno Corp.
Report Number: 1011FS15 Page 58 of 89
Draft Report
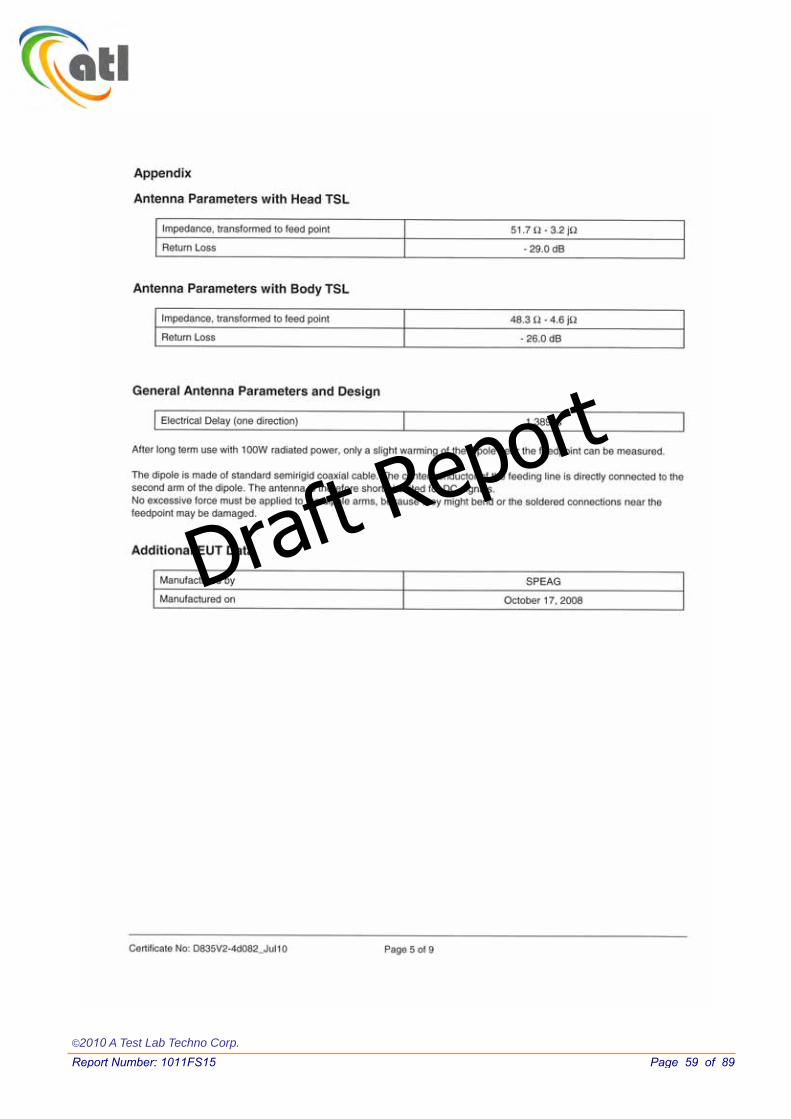
©2010 A Test Lab Techno Corp.
Report Number: 1011FS15 Page 59 of 89
Draft Report

©2010 A Test Lab Techno Corp.
Report Number: 1011FS15 Page 60 of 89
Draft Report
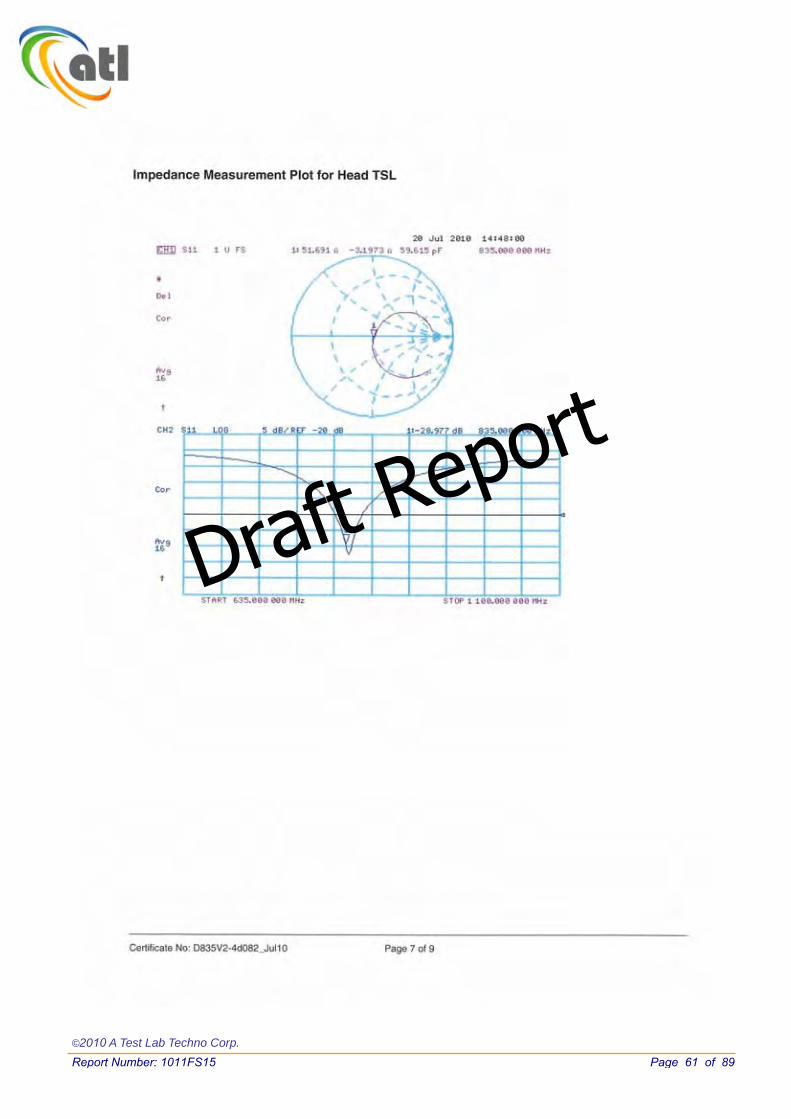
©2010 A Test Lab Techno Corp.
Report Number: 1011FS15 Page 61 of 89
Draft Report

©2010 A Test Lab Techno Corp.
Report Number: 1011FS15 Page 62 of 89
Draft Report

©2010 A Test Lab Techno Corp.
Report Number: 1011FS15 Page 63 of 89
Draft Report

©2010 A Test Lab Techno Corp.
Report Number: 1011FS15 Page 64 of 89
Draft Report

©2010 A Test Lab Techno Corp.
Report Number: 1011FS15 Page 65 of 89
Draft Report

©2010 A Test Lab Techno Corp.
Report Number: 1011FS15 Page 66 of 89
Draft Report
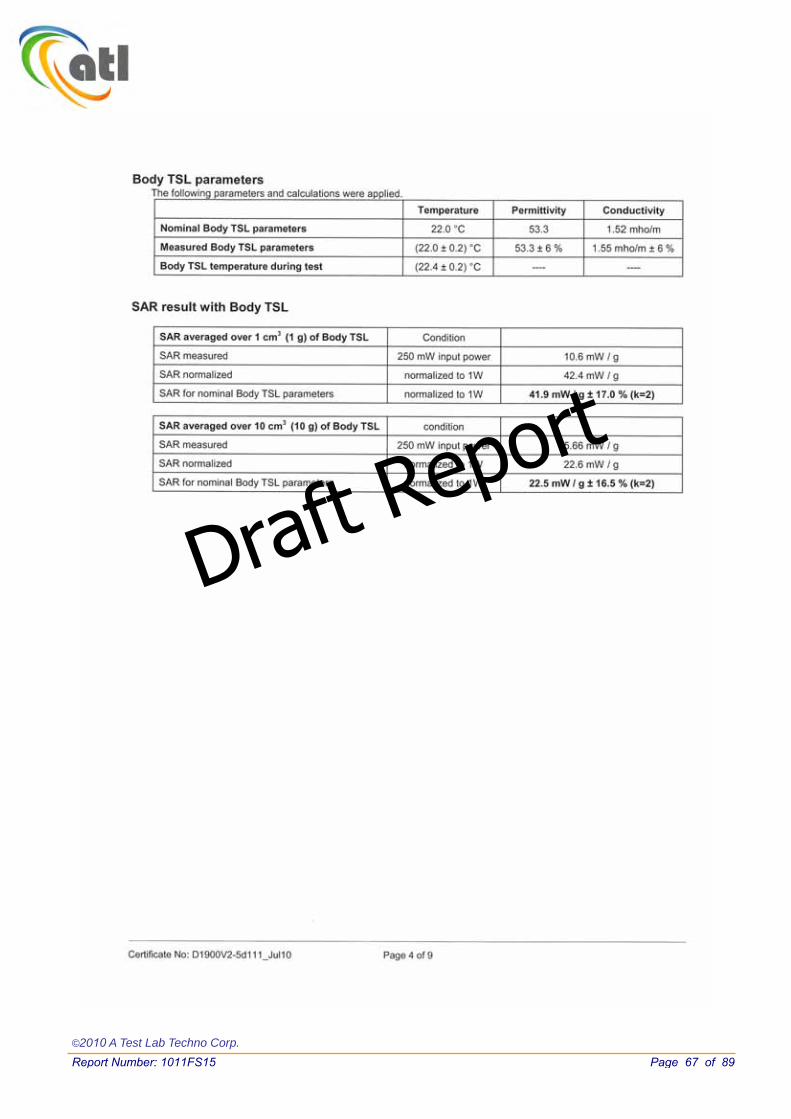
©2010 A Test Lab Techno Corp.
Report Number: 1011FS15 Page 67 of 89
Draft Report

©2010 A Test Lab Techno Corp.
Report Number: 1011FS15 Page 68 of 89
Draft Report

©2010 A Test Lab Techno Corp.
Report Number: 1011FS15 Page 69 of 89
Draft Report
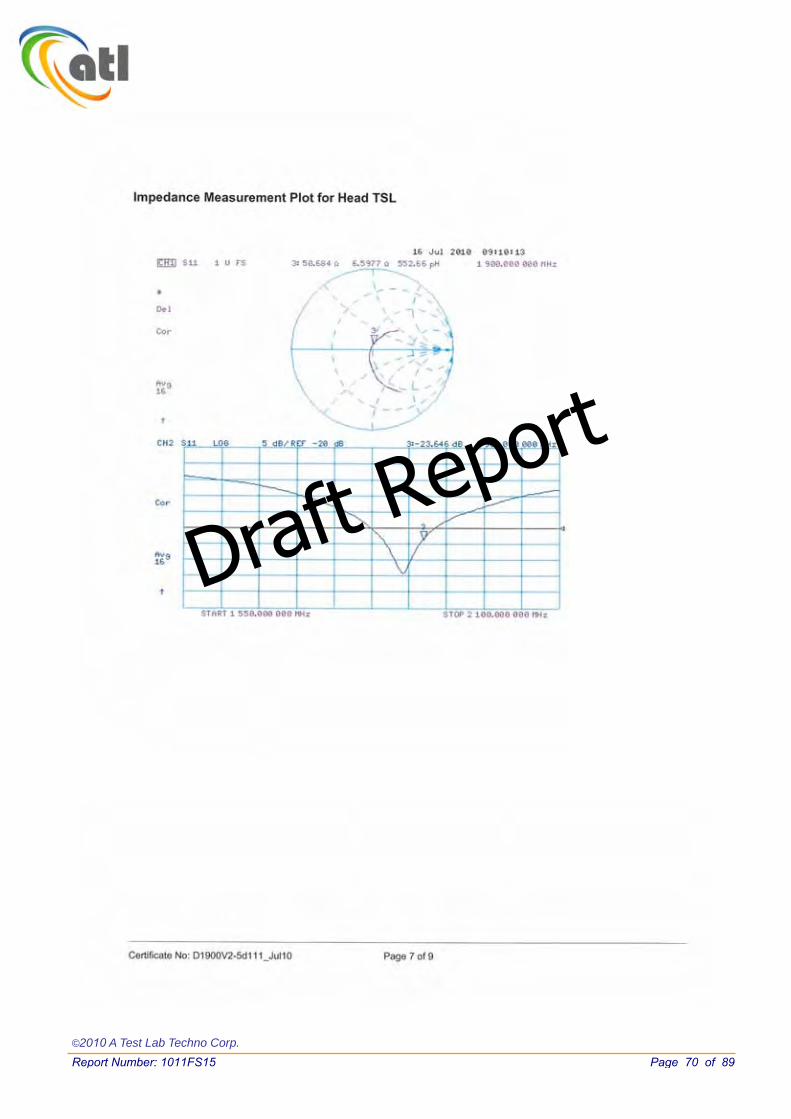
©2010 A Test Lab Techno Corp.
Report Number: 1011FS15 Page 70 of 89
Draft Report

©2010 A Test Lab Techno Corp.
Report Number: 1011FS15 Page 71 of 89
Draft Report

©2010 A Test Lab Techno Corp.
Report Number: 1011FS15 Page 72 of 89
Draft Report

©2010 A Test Lab Techno Corp.
Report Number: 1011FS15 Page 73 of 89
Draft Report
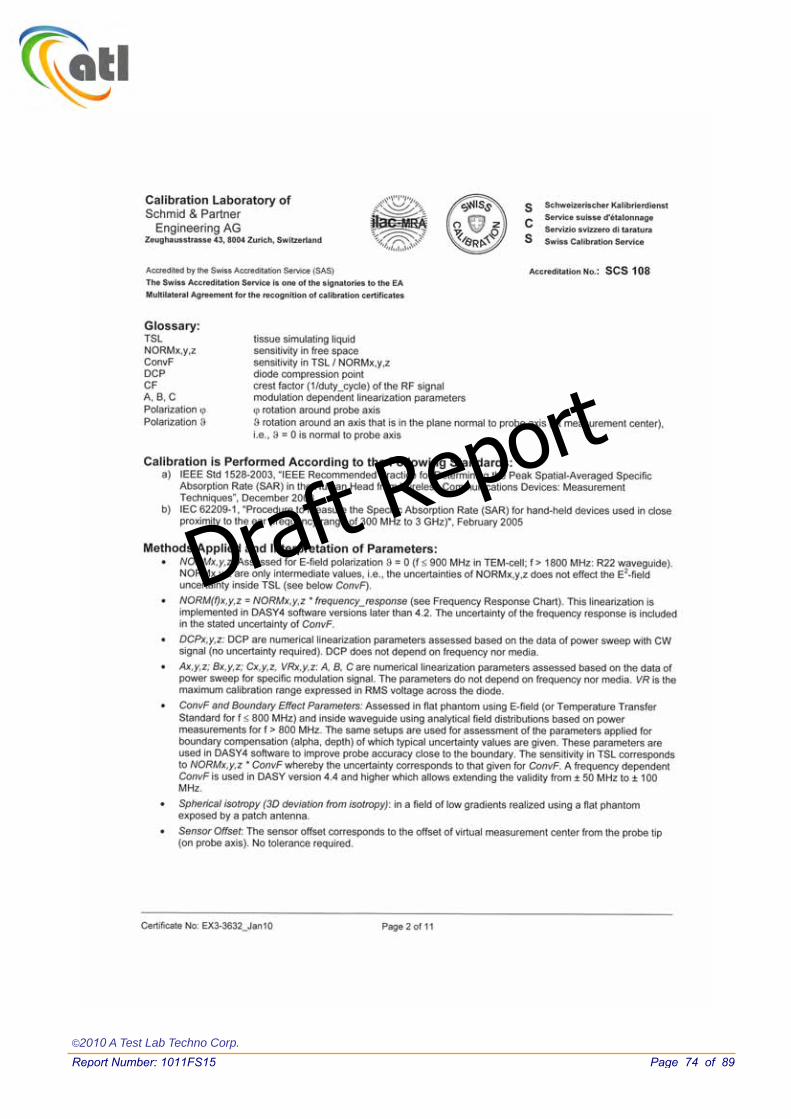
©2010 A Test Lab Techno Corp.
Report Number: 1011FS15 Page 74 of 89
Draft Report

©2010 A Test Lab Techno Corp.
Report Number: 1011FS15 Page 75 of 89
Draft Report
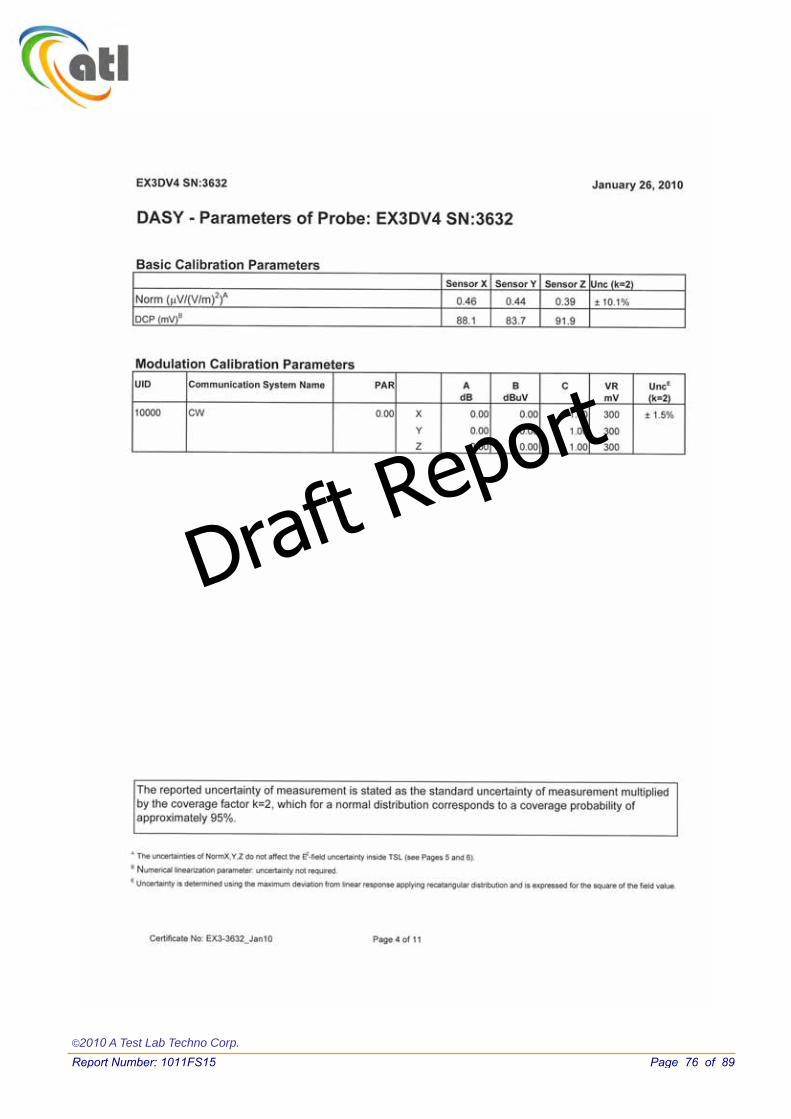
©2010 A Test Lab Techno Corp.
Report Number: 1011FS15 Page 76 of 89
Draft Report

©2010 A Test Lab Techno Corp.
Report Number: 1011FS15 Page 77 of 89
Draft Report

©2010 A Test Lab Techno Corp.
Report Number: 1011FS15 Page 78 of 89
Draft Report

©2010 A Test Lab Techno Corp.
Report Number: 1011FS15 Page 79 of 89
Draft Report

©2010 A Test Lab Techno Corp.
Report Number: 1011FS15 Page 80 of 89
Draft Report

©2010 A Test Lab Techno Corp.
Report Number: 1011FS15 Page 81 of 89
Draft Report

©2010 A Test Lab Techno Corp.
Report Number: 1011FS15 Page 82 of 89
Draft Report

©2010 A Test Lab Techno Corp.
Report Number: 1011FS15 Page 83 of 89
Draft Report
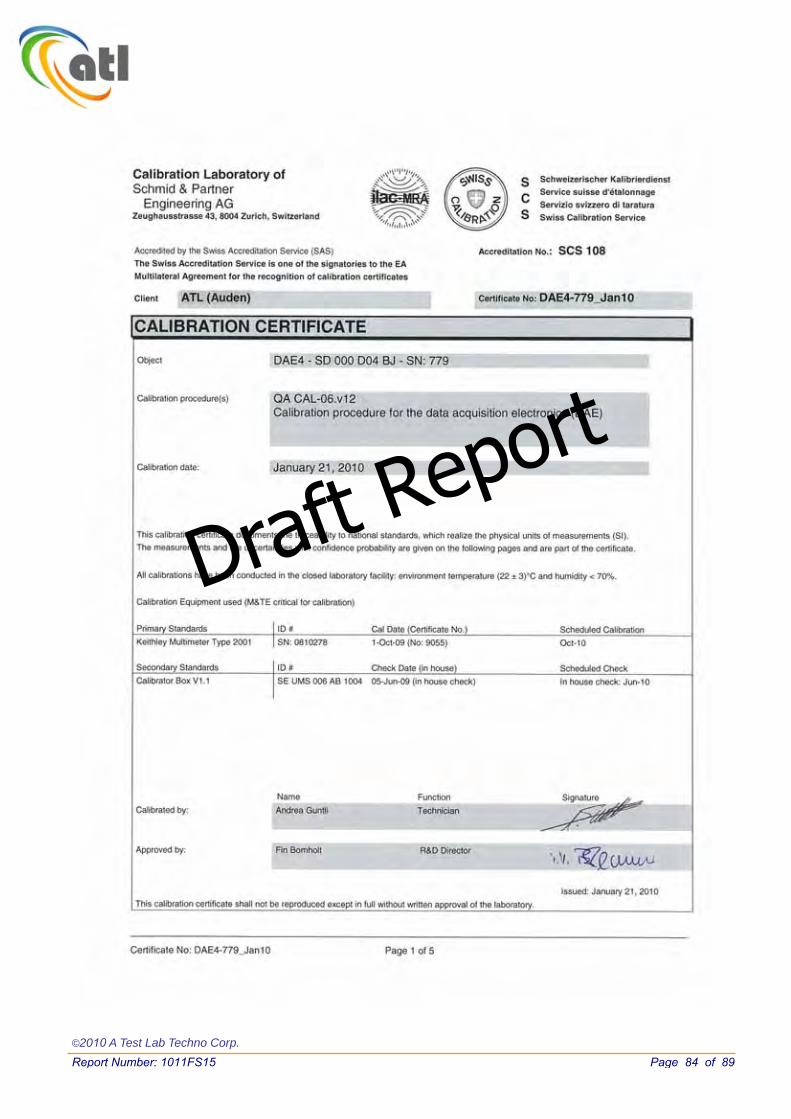
©2010 A Test Lab Techno Corp.
Report Number: 1011FS15 Page 84 of 89
Draft Report

©2010 A Test Lab Techno Corp.
Report Number: 1011FS15 Page 85 of 89
Draft Report

©2010 A Test Lab Techno Corp.
Report Number: 1011FS15 Page 86 of 89
Draft Report

©2010 A Test Lab Techno Corp.
Report Number: 1011FS15 Page 87 of 89
Draft Report

©2010 A Test Lab Techno Corp.
Report Number: 1011FS15 Page 88 of 89
Draft Report

©2010 A Test Lab Techno Corp.
Report Number: 1011FS15 Page 89 of 89
Draft Report