a time-series analysis of protest and … · “uncovering the dynamics of domestic conflict: a...
TRANSCRIPT

“UNCOVERING THE DYNAMICS OF DOMESTIC CONFLICT:
A TIME-SERIES ANALYSIS OF PROTEST AND REPRESSION IN LATIN AMERICA AND SUB-SAHARAN AFRICA”
SABINE C. CAREY
Department of Government
University of Essex, UK
&
Center for Basic Research in the Social Sciences Harvard University, USA
Paper prepared for the ECPR Joint Sessions, Workshop 9: The Systematic Study of Human Rights Violations
March 2002

Sabine C. Carey 2
ABSTRACT
This study contributes to our understanding of the causal relationship between protest and repression, where both protest and repression range from low to high intensity conflictual behaviour. Previous research on domestic conflict has usually ignored that both protest and repression are influenced by each other, as well as that the government and the opposition can also choose to cooperate with each other. This study employs vector autoregressions to account for the interdependence of the behaviour of the state and the population. Using daily data from nine Latin American and African countries from the late 1970s to the early 1990s, the results suggest that there is indeed a reciprocal relationship between protest and repression. In most cases, in which protest leads to repression, repression also leads to protest. Although the results suggest a weaker link between cooperative behaviour, the direction of the relationship still appears to work both ways, from state cooperation to dissident cooperation and from dissident cooperation to state cooperation. The results also suggest that, although in democracies governments respond more frequently with coercion to dissent, it is usually at a lower level of intensity than in non-democracies.

Sabine C. Carey 3
This study analyses the dynamics behind domestic conflict in nine Latin American and African countries from the late 1970s to the early 1990s. The main questions addressed in the study are (1) whether protest leads to repression, (2) whether repression leads to protest and (3) whether the answers for those two questions differ for democracies and non-democracies. Previous research usually focused on only one direction of this relationship. The main argument of this study is that both influence each other. If we want to find out why people protest against their governments, we ought to take into account how the government react towards their people. Similarly, if we want to better understand why states limit the political rights of their citizens, or even torture and kill them, we ought to add the behaviour of the population towards their governments to the picture. The relationship between the state and the population is likely to differ between democracies and non-democracies. Political regimes set the stage for the interaction between the state and the citizens. It shapes the behaviour of both actors. Therefore, I analyse democracies separately from non-democracies in order to account for the impact of these institutional differences. The main contributions of this study to research on domestic conflict are four-fold. First, this study takes into account the dynamic interdependence of the behaviour of the government and the opposition. It argues that both protest and repression affect each other. Second, it includes cooperative behaviour in the equation. Previous research has focused on the conflictual behaviour and has not accounted for the fact that both actors might choose to cooperate with each other. This study adds cooperative behaviour of both the state and the opposition to the analysis of domestic conflict. Third, the statistical analysis distinguishes between democracies and non-democracies to account for the impact of different institutional settings on the behaviour of the government and the general population. And finally, the data used in this study measure more accurately the interactions between the government and the citizens, since the dataset I use allows me to identify who does what to whom. Most previous research has used yearly or quarterly data for the analysis of domestic conflict. This study employs daily data, which are more appropriate to capture the dynamics of the interactions between the government and oppositional forces.
BACKGROUND
As briefly mentioned above, previous research on domestic conflict has usually concentrated on one direction of the relationship, either on how repression affects protest or on how protest affects repression, without taking into account the feedback from the

Sabine C. Carey 4
dependent to the independent variable. In the following section I present the main arguments from these two areas of research.
The Reaction of Protest to State Repression
There are four main relationships between protest and repression that are developed in the literature: (1) positive linear, (2) negative linear, (3) U-relationship and (4) inverted U-relationship (Davis and Ward 1990). The first scenario (1) hypothesises that higher levels of repression trigger higher levels of protest. This argument has usually been based on the deprivation approach. The deprivation approaches argues that the more repressive the regime, the more people feel frustrated and react with protest (Lichbach 1987; Opp and Ruehl 1990). However, the hypothesis of a positive linear relationship between repression and protest can also be explained in the framework of rational actors. Within this setting, the relationship is based on responsive and adaptive behaviour, rather than on frustration and regression. Figure 1. Four Hypotheses about the Response of Protest to Repression
(2) (1)
protest protest
repression repression
protest protest
repressionrepression(3) (4)
If the population is faced with more repression, it will put more effort into limiting the control and power of the state and rebel against the government. At every level of repression, the opposition attempts to counterbalance the forces of the government, and it does so with similar intensity and force. Therefore, low levels of repression are faced with low levels of protest; medium-levels of repression correspond to medium-levels of protest, and widespread and violent repression encounters widespread and violent rebellion.

Sabine C. Carey 5
However, there is also an argument for expecting the opposite, namely as repression increases, protest decreases. This is stated in the second hypothesis. It argues that there is a negative linear relationship. This argument is based on the deterrence theory (see Lichbach 1987). As repression increases, protest becomes more costly. The cost-sensitive opposition will therefore react with less dissident activity. Vice versa, when negative state sanctions and human rights violations are low, more people are willing to demonstrate and actively protest against the government because open dissent appears to be less risky than under repressive regimes, meaning the costs of protest are perceived to be lower. In the third relationship both low and high levels of repression lead to high levels of protest, whereas protest is lowest during medium-level repression. This argument is related to the backlash hypothesis. The backlash hypothesis argues that “harsh coercion accelerates protest” (Francisco 1996: 1182). It suggests that extremely severe coercion, although it decreases protest temporarily, increases dissident behaviour in the long-run, especially when repression is applied indiscriminately (Mason and Krane 1989).1 The last hypothesis (4) that uses repression as independent and protest as dependent variable, builds on a completely different argument. The rationale behind the inverted U-hypothesis is that under very repressive regimes, the costs and risks associated with protest and rebellious activity keeps people off the street. On the other hand, under non-repressive regimes, opponents make use of other means that are available to them to achieve their objectives, rather than engaging in dissident activities. But under semi-repressive regimes, protesters can be mobilized and no other means besides protest seem feasible to voice discontent and resist government repression (Muller and Weede 1990).
The Reaction of State Repression to Domestic Protest
This section addresses the relationship between dissident movement and regime countermovement (Hoover and Kowalewski 1992). The common hypothesis is that the greater the threat posed by the opposition, the more likely it is that the regime responds with repression (e.g. Davis and Ward 1990), hence a positive linear relationship is expected. The reason behind this argument is that the government intends to maintain, or
1 The backlash is primarily based on a more dynamic framework, distinguishing short-term from long-term effects of repression on protest. But it also has an important message for the contemporaneous and relatively short-term relationship between protest and repression. It predicts that the population responds with fierce resistance and opposition to very high levels of repression. The reasoning behind this exponential relationship is that very intensive, and then often indiscriminately applied, state repression diminishes the additional costs of protest. People might feel that they have no choice but to respond with severe resistance. Active opposition may become an obligation. Hence, accelerating repression is expected to increase the levels of protest.

Sabine C. Carey 6
improve, the Strength/Threat ratio. From the position of the government, the strength of the state should always be greater than the threat posed by the opposition and by dissidents. Hence, if the threat in the form of popular protest increases, the state is expected to respond either by increasing its strength or by diminishing the threat.
BUILDING A MODEL OF DOMESTIC POLITICAL CONFLICT
The brief overview of the literature on the protest-repression nexus highlights the wide range of often contradicting theories, which are usually backed-up by some empirical evidence. However, the focus is always on only one direction of the causal arrow, despite the fact that there is no convincing theoretical argument that would suggest that the relationship goes only in one specific direction without a feedback loop. There is no a priori reason for arguing that only protest affects repression and that repression has no impact on protest, or that only repression affects protest without protest influencing repression. However, the main argument of this study is that there is a dynamic two-way relationship and that both influence each other. In this section, I first define the main elements of the actors’ behaviour, protest, repression, dissident cooperation and state cooperation. The second part develops a model of domestic conflict that is tested in the following section.
Defining the Core Concepts
Gurr and Lichbach define political conflict as “open physical confrontations between collective actors over political issues” (1986: 5). Based on this definition, political conflict has three main elements: (1) actions that are fuelled by political issues, (2) some form of violence and (3) collective actors. For the purpose of this study, this definition is both too narrow and too wide. The type of political conflict analysed here is not restricted to “physical confrontation.” Non-physical “struggles over values or claims to power” are perceived as an important and integral part of domestic political conflict. Negative statements, verbal threats and deadlock in negotiations are also seen as a form of political conflict. For the purpose of this study, domestic political conflict is defined as any verbal or physical confrontation by domestic actors over political issues. In this sense, domestic political conflict includes, but is not restricted to, social movements, which can be defined as “sustained, conflictual interaction between social challengers and opponents” (Tilly 1984: 299).

Sabine C. Carey 7
This study focuses on the reciprocal relationship between repression, exercised by the state, and domestic protest, displayed by the domestic opposition. Both protest and repression are understood in rather broad terms. Tarrow defines protest as “disruptive collective action that is aimed at institutions, elites, authorities, or other groups on behalf of the collective goals of the actors or of those they claim to represent” (1991: 11). This study uses a slightly modified version of this definition. I define protest as any confrontational activity by domestic non-governmental actors that disrupts and challenges any government actor, agency or policy. This includes verbal threats, as well as both non-violent and violent actions, since “group violence ordinarily grows out of collective actions which are not intrinsically violent – festivals, meetings, strikes, demonstrations and so on. Without them, the collective violence could hardly occur” (Tilly 1972: 74). The state’s reaction, repression, also incorporates a broad range of actions. It includes negative sanctions, such as restrictions on free speech, violations of life integrity rights, such as torture and political imprisonment, as well as state terror in the form of genocide. In the context, of this study repression refers to all of those actions, since “all address behaviour that is applied by governments in an effort to bring about political quiescence and facilitate the continuity of the regime through some form of restriction or violation of political and civil liberties” (Davenport 2000: 6). In short, domestic political conflict comprises all confrontational activities, violent and non-violent, that are either directed from the government towards the population or from the population towards the government. Apart from conflictual actions, the actors might also choose to show cooperative behaviour towards the opponent. Therefore, this study incorporates dissident cooperation and state cooperation in the analysis of domestic conflict. Dissident cooperation summarises all cooperative behaviour that is displayed by non-state actors and is addressed towards the government. It ranges from supportive statements of the regimes, to demonstrations for the government and the declaring of a cease-fire. Whenever a government actor displays cooperative behaviour towards the population, it is labelled State Cooperation. State cooperation also ranges from low-intensity (such as agreement to talk with the opposition) to high-intensity (ending civil war) activities.
THE DYNAMICS OF DOMESTIC CONFLICT AND COOPERATION
The Assumptions
The model of domestic political conflict rests on two assumptions. Both the state and the opposition are seen as unitary actors. The state is united in its aim to stay in power and to

Sabine C. Carey 8
diminish the threat from potential or actual opponents of the state. The state as unitary actor includes the national executive, the judiciary and elected representatives, as well as local government, political parties in power, military, police and other paramilitary forces of the government.2 Both expressions, “the state” and “the government,” refer to this unitary actor. The opposition is also seen as a unitary actor. It is united in the goal to bring about change in the government, to limit its power and to achieve wider participation and inclusion of the population in the political process. It includes, for example, dissident groups and guerrilla forces, as well as political parties in opposition, labour unions, students and churches. The second assumption is that both actors are perceived as being rational (see Lichbach 1995; Oberschall 1994; Opp 1989l; Tarrow 1994; Taylor 1998). The behaviour of the government and of the opposition results from cost-benefit calculations. Behaviour is perceived as being adaptive and responsive. Dissident activities are understood as a reaction to government behaviour. The emphasis is on the political process, not on deprivation, frustration or grievances (Gurr 1968; Muller 1980). Also governments respond as rational actors to the challenges that are posed by the dissidents. Within this framework, domestic political conflict is an inherently dynamic and reciprocal process. Reciprocity means “the behaviour of one actor is conditioned by the behaviour of other actors in a given social system” (Moore 1995: 133). The government reacts to threats exercised through various protest activities, and the population responds to repression and negative sanctions implemented by the government.
The Model As outlined above, there are plausible arguments for various different relationships between protest and repression. The main argument of this study is that both protest and repression are interdependent: The behaviour of the opposition towards the government is influenced by the way in which the government reacts to the behaviour of the opposition. Similarly, the behaviour of the government towards dissent is conditioned on the action of the opposition towards the government. I argue that the conflicting empirical results found in previous research on protest and repression are partly due to one direction of the relationship between protest and repression being neglected.3 2 The assumption that the state is a unitary actor however does not always reflect the true relationship among state forces across time and space. In many cases, it is exacly the split among the ruling elite, a split among the military or a split between the military and the civilian government that brings about domestic conflict. However, the core object of this study is the relationship between the government and domestic opposition, not the dynamics within the ruling class of a country. Within this framework the assumption that the government and the opposition are unitary actors is a helpful instrument to reduce the complexity of reality in order to focus on the dynamics driving the conflict between the state and its opponents. 3 Most studies either analyse how protest affects repression (e.g. Fransisco 1995, 1996; Gamson 1975; Gartner and Regan 1996; Gupta et al. 1993; Gurr and Lichbach 1986; Krain 1997; Mason and Krane 1989)

Sabine C. Carey 9
FIGURE 2: The Dynamics of Domestic Conflict and Cooperation.
Repression Protest
State Cooperation
Dissident Cooperation
Since specific hypotheses on the relationship between protest and repression have not yielded a consistent picture, I focus on two questions: (a) whether protest affects repression and (b) whether repression affects protest. Figure 2 graphically shows the concept that this study is based upon. I argue that protest and repression cannot be seen in isolation, but are connected by a dynamic interdependence. Protest is expected to lead to repression, but also repression is expected to lead to protest. Both actors, the government and the opposition, try to maintain, or increase, the sphere of influence and power. When one attempts to increase one’s influence by attacking the opponent, the opponent is likely to respond in the same way. If the population is faced with state coercion, then the citizens are most likely to respond with dissent. Similarly, if the government encounters protest, then it is most likely to respond with repression. The situation under which both actors operate is marked by limited information, limited capabilities and uncertain payoffs. Therefore, they base their actions primarily on the observable behaviour of the opponent. The actors can also choose to cooperate with the other side. Therefore, I add state cooperation and dissident cooperation to the model of domestic conflict. Again, both actors react to each others’ behaviour. Similar to tit-for-tat strategies, when one actor shows cooperation, the other one is expected to respond with cooperative behaviour as well. But the cooperative and conflictual behaviour are not assumed to be independent from each other. As shown in Figure 2 above, I also expect a link between the cooperative behaviour of the one actor and the conflictual behaviour of another.
The Impact of Past Behaviour
The behaviour of both institutions and individuals is argued to be relatively stable and or how repression affects protest (e.g. Hibbs 1973; Lichbach 1987; Moore 1998; Opp 1994; Opp and Ruehl 1990; Rasler 1996; Tilly 1978).

Sabine C. Carey 10
slow to change. This is due to inertia, particularly with respect to institutions and organisations, and the diminishing costs of collective actions once collective action has been established. Therefore, I expect that the four elements of domestic conflict and cooperation (protest, repression, dissident cooperation and state cooperation) are relatively stable. These processes are discussed in more detail below for protest and repression. However, the same holds true for dissident and state cooperation. Protest at time t is expected to lead to further protest at time t+1. The protest movements,
lso, repression at time t is expected to lead to further repression at time t+1. The rational
in general, tend to maintain themselves. Once dissidents have successfully invested the costs of organising themselves and carrying out protest against the government, they try to maintain the momentum and to sustain the protest (see Lichbach 1995). A similar notion is reflected in micromobilisation theory and the closely related the bandwagon model and threshold model. The main argument behind these concepts is that “small numbers of people trigger the participation of larger numbers of people over time” (Rasler 1996: 134). Micromobilisation theory argues that the potential rebels can be mobilised for opposition movements by overt dissident behaviour because this (a) shows the willingness and commitment of others, (b) makes the goal of their activities desirable and (c) raises the social rewards for participating in this movement (Opp 1994; Opp and Roehl 1990; Rasler 1996). The main argument of the bandwagon model is based on this rational. The greater the number of people participating in dissident activities, the more likely it is that more people will join them. The threshold model maintains that once a certain, usually unspecified, threshold of number of participants is crossed, the costs of mobilising a larger crowd are relatively low.4 Abehind this is the following. In the case of state coercion, policy inertia dampens radical change of the government’s behaviour. Therefore, the government tends to maintain strategies, once they have been adopted. Apart from inertia in the executive and administrative apparatus, government agencies, once established, try to perpetuate their existence. This means that when special security forces are put into place to protect the national executive and to control dissident groups, they usually try to maintain their status and role and are difficult to dissolve.
4 Although this paper does not look at the specific number of dissidents involved in protest activities, it does not strictly apply those concepts of micromobilisation theory. But these models nevertheless highlight the point made above, namely that protest at time t is likely to lead to further protest at time t+1. Continuing protest is a sign of the willingness and commitment of the activists to the collective good of dissent. This does not only encourage other members of the public to participate in the protest activities, as argued in the bandwagon model. It also influences perceptions of the possibility of success of the protest. It signals at least some confidence in the desirability of the collective goal and in the prospects of achieving it. Even if the number of protesters does not increase, the quiet support of the population still might, which, in turn, gives the activists more confidence to increase their pressure on the government.

Sabine C. Carey 11
The Influence of the Nature of the Political Regime
Domestic political conflict takes places in a specific setting and environment. The nature and institutions of the political regime are of particular importance. The political regime sets the rules of the game and shapes the interaction between the government and the domestic opposition. It determines the choices of the actors and the costs that are attached to those choices. I expect that the dynamics of domestic conflict and cooperation differ under different institutional settings. In this study I distinguish between two broad categories: democracies and non-democracies (also called “autocracies”). These labels refer to the institutional setting of the regime with respect to the degree of political participation and competition. It does not take into account the respect for human rights or civil liberties. In the context of this study, democracy is defined along institutional lines, based on competition and participation (Dahl 1971). In this sense, democracy can be defined as “a system of governance in which rulers are held accountable for their actions in the public realm by citizens, acting indirectly through competition and cooperation of their elected representative” (Schmitter and Karl 1996: 50). In a democracy, the public has institutionalised channels for participation. Democratic governments are expected not to employ negative sanctions or human rights violations, due to the rules and norms of democracies. Democracies are expected to be more accommodating of the opposition and the general public than autocratic regimes. The norms and institutions prevalent in democracies facilitate compromises and are designed to reduce the conflictual behaviour of all parties. Therefore, in democracies, I expect the link between cooperative behaviour to be stronger (i.e. to occur more frequently) than in non-democracies. Similarly, in democracies retaliation as a response to conflictual behaviour is expected to be less frequent than in non-democracies, since democracies provide institutionalised channels for political participation and competition. Since the data for this study come from Latin American and African cases, I will also compare the results from the analysis along geographical lines. This will be discussed in more detailed at a later stage.

Sabine C. Carey 12
OPERATIONALISATION - THE IPI PROJECT
To analyse the interactions between the state and the dissidents, I use the data from the Intranational Political Interactions (IPI) Project (Davis et al. 1998; Moore 1998, 2000).5 This project measures intrastate political conflict and cooperation on a ten-point scale through coding news sources.6 It identifies the actor, target and the intensity of the events, which are listed by the date of occurrence. The data cover nine middle powers from Latin
merican and Africa between 1974 and 1992: Argentina, Brazil, Chile, Colombia,
r the statistical analysis I do not pool the data since I am interested in the vents and interactions within each state. This produces a more accurate picture of the
AMexico, Venezuela, Nigeria, Zaire and Zimbabwe.7 I have chosen the IPI dataset because it corresponds extremely well with the research questions that I am interested in. As I discuss in more detail below, this dataset allows me to clearly identify who does what, when and to whom. The main analysis covers nine countries over the time period of 8 to 13 years. The nine Latin American and sub-Saharan African countries represent an interesting selection of cases for the purpose of this research. The variables on protest and repression vary substantially within and between the countries. The nine countries also cover the whole spectrum of authoritarian and democratic regimes; some of them have experienced more regime changes than others during the time period of observation. Together they represent an interesting sample of countries with different backgrounds and experiences with domestic political conflict and democracy. Foerelationships between the variables within the countries since they are not driven by particular outliers in any one particular country or by cross-variations between countries.
Protest and Repression, Dissident Cooperation and State Cooperation
Previous studies have included the number of political deaths in the measurement of protest and excluded violent repressive behaviour of the state from the measurement of state coercion (Gupta et al. 1993; Muller and Weede 1990). However, the number of olitical deaths seems to be heavily dependent on the actions of the government, which p
5 Information about the IPI project, including codebook and data files, can be found on the web at http://garnet.acns.fsu.edu/~whmoore/ipi/ipi.html. The principal investigators are David R. Davis and Will H.
oore. North American Service, Reuters World Service, The New York Times Index, and the Africa
Research Bulletin. 7 The exact country-years are as follows: Argentina (April 1982 – December 1992), Brazil (July 1983 – December 1992), Chile (May 1979 – October 1992), Colombia (May 1983 – December 1992), Mexico (February 1984 – November 1992), Venezuela (March 1983 – December 1992), Nigeria (January 1983 – December 1992), Zaire (January 1974 – December 1992) and Zimbabwe (December 1974 – December 1985).
M6 Reuters

Sabine C. Carey 13
would fall into the categ ject allow me to model protest and repression more accurately, since they enable me to identify the actor, the
lings and civil war. I argue that both on-violent and violent actions can be placed on a continuum and represent different
ble to analyse the interaction between the state and non-governmental domestic actors, I
extract tho ’ and the target is the ‘Population’ (‘State → Population’) or (2) where the actor is the ‘Population’
Second, for each of the two variables, I separate the conflict-events from the cooperation-ents and
s of
e of
ory of repression. The data from the IPI pro
target and the intensity of each event. It includes a broad spectrum of state actors, such as the executive, the military, paramilitary forces and the policy. It also identifies a variety of non-state actors, such as specific ethnic populations, dissident organisations, labour unions and churches. The IPI project also captures a wide breadth of conflictual behaviour, ranging from non-violent, low-confrontational actions to large-scale kilnmethods to achieve similar goals. Additionally, violent action usually builds upon non-violent confrontation, such as verbal confrontation, and develops from minor conflictual behaviours (Tilly 1972). The IPI Conflict Scale codes news sources on a scale ranging from 1 to 10, where 1 stands for mildly negative statements and 10 stands for civil war. The same conflict scale is used to measure the conflict-behaviour from the state and the population. In addition to hostility levels, the IPI Project also measures cooperation between the actors. These actions are also coded on a scale from 1 to 10 and range from mildly positive statements (1) to conflict resolution (10). The original data are ordinal and capture the intensity of events. For the purpose of the statistical analysis I transform the ordinal-level data into interval-like data, using a weighting scheme developed by Shellman (2000). These weights are based on a group of experts’ judgements. Instead of the IPI scale I used the weights. For this study, I create a new data file for each of the nine countries. First, in order to bea
se event codes from the data set, where either (1) the actor is the ‘State
and the target is the ‘State’ (‘Population → State’). Because I am only interested in the interaction between state and society, all other events, such as conflicts between different ethnic groups or between the military and the police, are dropped from the study.
events. Since the data are daily aggregated at a later stage, the negative conflict-evthe positive cooperation events would cancel each other out. Since conflictual events are negative, I multiply them by –1 to obtain a scale with low values indicating low levelconflict, and high values indicating high levels of conflict. Third, to obtain a time series data set, I create a daily dataset, using the total valu

Sabine C. Carey 14
conflict and cooperation on each day within the time period of the dataset. Many actions trigger reactions almost instantaneously, leading to responses within a few days. Therefore, using daily aggregation appears to display the dynamic process between the state and the opposition most accurately.
THE METHODOLOGY
f all other endogenous variables in the system. Hence, the VAR odel of this study consists of four equations, since it includes four variables:
131 t-1 13p t-p
β241State Cooperationt-1 +...+ β24pState Cooperationt-p + ε2
β421Repressiont-1 +...+ β42pRepressiont-p +
β441State Cooperationt-1 +...+ β44pState Cooperationt-p + ε4
The two main arguments of this study are (1) that the relationship between protest and repression is dynamic and interactive, and (2) that there are no clear theoretical arguments on how this relationship should look like. Vector autoregression (VAR) models (see Freeman 1983; Freeman, Williams and Lin 1989; Sims 1987) fit these criteria extremely well. They are well suited for empirically investigating the two-way relationship between protest and repression. The advantages of VAR models are that they are based on weak theoretical assumptions and that all variables are treated as endogenous. Their goal is “to find important inter-relationships among the variables and not to make short-term forecasts” (Enders 1995: 301). Although VAR models have been criticised for being atheoretical, the weak theoretical assumptions and the flexibility are not a downside but rather an advantage of this method in this context, bearing in mind the different and contradicting theories in this area of research. Every endogenous variable in the VAR is regressed on a constant, its own lagged values and on the lagged values om Protestt = c1 + β111Protestt-1 +...+ β11pProtestt-p +
β121Repressiont-1 +...+ β12pRepressiont-p + β Dissident Cooperation +...+ β Dissident Cooperation + β141State Cooperationt-1 +...+ β14pState Cooperationt-p + ε1
Repressiont = c2 + β211Protestt-1 +...+ β21pProtestt-p + β221Repressiont-1 +...+ β22pRepressiont-p + β231Dissident Cooperationt-1 +...+ β23pDissident Cooperationt-p +
Dissident Cooperationt = c3 + β311Protestt-1 +...+ β31pProtestt-p +
β321Repressiont-1 +...+ β32pRepressiont-p + β331Dissident Cooperationt-1 +...+ β33pDissident Cooperationt-p + β341State Cooperationt-1 +...+ β34pState Cooperationt-p + ε3
State Cooperationt = c4 + β411Protestt-1 +...+ β41pProtestt-p +
β431Dissident Cooperationt-1 +...+ β43pDissident Cooperationt-p +

Sabine C. Carey 15
Each equation contains lags of the variables Protest, Repression, Dissident Cooperation and State Cooperation. For the statistical analysis I use the natural log of all four variables due to their skewed distribution8; c is the constant, ε is the error term in each equation and p indicates the number of lags used in the VAR. The error terms are assumed to be
ncorrelated white noise disturbances. The lag length p is determined so that there is no significant autocorrelation in the e mza and Deadman 1997; Enders 1995).
The Cases used in the Statistical Analysis
urror terms (see Chare
In vector autoregression models the specific coefficients from specific lags have very little substantive meaning. More important is whether all lags from one particular variable are jointly significantly different from zero. Hence, the underlying question is whether the history of one variable can improve the prediction of the dependent variable. This notion is based on the concept of Granger causality (Freeman 1983). The notion of Granger causality is that if a variable Y can be better predicted from past values of both X and Y than by past values of Y alone, then X Granger causes Y (Freeman 1983, Granger 1969, Pierce 1977). For example, if the prediction of protest can be improved by using both the history of protest as well as the history of repression, then repression “Granger causes” protest. F-tests are used to test for Granger causality. I use the 95% confidence interval.
gime are likely to differ within an authoritarian context compared to a more democratic mics between protest and repression
in different in rately for democracies a country, so that within a case, the Polity-value from the Polity IV dataset is consistent. The Polity value is
0 to 10) from the democracy scale (also ran g h utocratic) to +10 (very d together, where
9
For the analysi le 1 at the end of the pa which I will use
period over which each case
As argued earlier, political institutions set the stage for the interactions between the state and the general population. The interactions between the government and opponents of the reone. To account for the potentially very different dyna
stitutional settings, I estimate vector autoregression models sepand non-democracies. I create a number of cases from each
created by subtracting the autocracy scale (ranging fromgin from 0 to 10) so that t e Polity scale ranges from –10 (very aemocratic). However, I collapse those cases of one country
the polity difference is of the value 1.
s I use 17 cases. Hence, I calculate 17 different VAR models. Tabper shows the 17 cases, listing the labels of the cases,
throughout the study and in discussion of the results, the time
l log cannot be taken from zero, I add 0.5 to every variable because ln(x) ≈ ln(xdiffer from this rule due to autocorrelation in the errors.
8 Since the natura + 0.5). 9 Chile and Zaire

Sabine C. Carey 16
spans, as well as the corresponding Polity values. Every country-case with the Polity value between 1-10 is labelled “Democracy” and every case with the Polity value ranging between –10 and 0 is labelled “Non-Democracy”.
TABLE 2. Distribution of Cases
DEMOCRACY NON-DEMOCRACY TOTAL
LATIN AMERICA 5 5 10
AFRICA 3 4 7
8 9 17
Table 2 shows the distribution of the cases across democracies and non-democracies, as well as across the two different continents. The sample of cases is relatively evenly distributed between democracies and non-democracies. There are eight democracies and nine non-democracies in the sample. Also the numbers of cases that come from Latin American countries and from sub-Saharan Africa are fairly balanced. The sample contains ten cases from Argenti Venezuela, and seven cases from the three African countries, Nigeria, Zaire and Zimbabwe.
na, Brazil, Chile, Colombia, Mexico and
Results of the Statistical Analysis
The results of the Granger causality tests based on the VAR models for the 17 cases are reported in Tables 3-11 at the end of the paper. The bottom of the tables contains the number of observations (after adjusting for the lags), as well as the lag length used for the particular VAR model. The F-statistic and the corresponding probability are in bold when the F-statistic is statistically significant at p < 0.05.
General Patterns of the Interactions between the Government and the Opposition
This section discusses the overall picture presented by the analysis of 17 different cases. able 12 at the end of the paper summarises the results of the analysis shown in Tables 3-
Granger cause the dependent variable at a significance level of p < 0.05, it was noted with nd
T11. The first line in the top row lists the dependent variable of the four regressions and the second line contains the initials of the independent variables, i.e. it is the variable that is tested whether it Granger causes the dependent variable. Where one variable was found to
an “X” in the table. The grey rows highlight democratic cases (which fall between 1 a

Sabine C. Carey 17
10 on the Polity scale), the white rows stand for the autocratic cases. The last row in Table 19 summarises the results of the F-tests across all cases. The first impression one gets from looking at the total number of cases, in which one variable was found to Gran our variables in the system
rotest, Repression, Dissident Cooperation and State Cooperation) appear to play an important le in this web interaction. Every single variable was found to Granger cause another in at least six instances. This means that every variable improved the prediction of another at least 35% of the tim . Although the results are based on a relatively small sample, this figure is still quite high and suggests a relatively tight web of interactions between the state and the citizens. The most consistent finding is t is highly autoregressive. Out of the 17 cases, rotest does not Granger cause further protest in only case, which is the civilian regime in
he most consistent patterns across the cases, apart from protest, repression and state cooperation being autoregre es repression (in 11 cases) and that repression Granger causes protest (in 10 cases). Conflictual behaviour from one
pation and in response security forces iolently crack down on the students. Another typical example, starting with the
oppo or
ger cause another, is that all f(P
ro of
es
that protespChile in the late 1980s and early 1990s.10 In general, conflictual behaviour (protest and repression) is more often found to have a sustained and consistent pattern, compared to cooperative behaviour (dissident cooperation and state cooperation). Across the countries, dissident cooperation appears to be more sporadic than any other behaviour since it is found to be autoregressive in only 8 out of the 17 cases (compared to 12 for repression and 10 for state cooperation). T
ssive, is that protest Granger caus
actor to another is most likely to result in a conflictual response. Also, in eight countries, protest leads to repression, as well as repression leading to protest. In most cases when the state retaliates against oppositional activities, it can expect the population to respond with conflictual behaviour towards government restrictions and sanctions. For example, students protest against restriction in political particiv
sition forces, would be that rebels occupy a village, the government’s militaryparamilitary forces fight the rebels, and in response to this the dissidents kidnap a
10 Chile II is an interesting case for finding protest not to be autoregressive. It is the only democratic case that directly succeeded a very violent and highly repressive regime. Although other countries, such as Brazil and Argentina, also experienced very high levels of state repression under their military regimes, those periods were prior to the beginning of the IPI data. Hence, by the time these countries adopted democratic institutions and procedures, the severe state coercion was many years in the past. But for the people under President Aylwin (Dec. 1989 until the end of the dataset in October 1992), the memories of past violence was probably much more present. This could have lead to the less sustained protest behaviour in order to avoid dissident activities jeopardising the newly regained democratic rule of law.

Sabine C. Carey 18
government official. If coercive behaviour triggers a conflictual response from the other actor, then his or her reactions are very likely to further spiral the conflict.
ses, the direction of the causality goes both ways. The sults also suggest that repression is not a very useful instrument for making the
It is interesting to note that cooperative behaviour, in general, seems to play a rather minor role in the interaction between the government and the population. It is not very well explained by the variables in the models and it has no strong or consistent effect on domestic conflict. Nevertheless, in seven cases cooperation of the government lead to dissident cooperation. Also, in seven cases cooperative behaviour of the population Granger caused the government to cooperate with the citizens. Hence, in about 40% of the cases analysed in this study, cooperative behaviour of one actor caused the other actor to cooperate as well. In five of those careopposition cooperate with the regime. In only 35% of the cases (six cases) did the immediate history of repression improve the prediction of dissident cooperation.
The Dynamics of Domestic Conflict and Cooperation
in Democracies versus Non-democracies
This section compares how the interactions between the government and the citizens differ between democracies and non-democracies (see Table 13). As in the total sample, protest,
pression, dissident cooperation and state cooperation are relatively consistent in both
seems to be rather counterintuitive. However, one should keep in mind that the variable te
al e s.
redemocracies and autocracies. However, it is interesting to note that in democracies, once the government starts to cooperate with the opposition, it is likely to continue to do so in the near future as well. Lagged state cooperation helps to predict future state cooperation in six out of the eight democracies in the sample (equivalent to 75%), whereas the same result is found in only four out of the nine non-democracies (equivalent to 44%). This supports the argument that in democracies the government is more willing to cooperate than in autocratic regimes. The results suggest another interesting difference between democracies and non-democracies. In seven out of the eight democratic cases, protest leads to repression, whereas the same results are found in only four of the nine autocratic cases. At first, this
labelled “Repression” does not capture only the most violent and severe forms of stacoercion. In the context of this study, repression refers to any conflictual behaviour by the government addressed at the opposition or the general population. The conflictubehaviour ranges from very low-intensity actions, such as negative statements about thopposition, to state sanctions and up to violent repression, such as torture and killing

Sabine C. Carey 19
Another point ought to be highlighted: the democracies in this sample are primarily very young democracies. Many democratic regimes analysed in this study had just overcome
ilitary rule. The results suggest that these, in most cases relatively weak (in the sense of mnot consolidated) and young democracies are not very tolerant of the display of dissent with the regime.
The Dynamics of Domestic Conflict and Cooperation
in Latin America compared to sub-Saharan Africa
This section briefly highlights some interesting differences in the results from the analysis of the ten Latin American cases and the seven cases from Nigeria, Zaire and Zimbabwe (see Table 14). Since the protest movements seem to have quite different characteristics in Latin American and Africa, the dynamics of the relationship between the government and the population might differ as well. In Latin America, the protest movement against the
ling elite has often been driven by other elites, which are not in power, and by organised groups. For exam portant roles in opposition governments cases, it appears as if only in Zambia (and more recently in Zimbabwe), such organised groups played a major
roles of the actors are switched. In the previous paragraph I ointed out that dissident cooperation Granger caused state repression more often in Latin
ruple, labour unions and churches have played im
in Latin America. Looking at the African
role in the conflict with the government. In general, Africa has a weaker and less developed middle class than Latin America. Hence, dissent in Africa seems to be driven primarily by more spontaneous activities, by student and teachers, rather than by labour unions or business organisations. Three interesting differences present themselves from the analysis of ten Latin American and seven African cases. First, in the overall sample, in only six cases dissident cooperation Granger cause repression. But five of these are from Latin America and only one is from Africa (Zaire II). The second point I would like to highlight is equivalent to the first one, only that the pAmerica than in Africa. Similarly, cooperative behaviour of the state Granger causes protest more often in Latin America than in Africa. Whenever state cooperation leads to protest (seven out of the total seventeen cases), it is more likely to be in Latin America (five out of ten cases) than in Africa (two out of seven cases). These two observations suggest that in Latin America, as opposed to Africa, cooperative behaviour of one actor is more likely to be interpreted as a weakness of the opposition and it is then exploited by exercising more pressure on the opponent. And finally, of the six cases, in which repression leads to dissident cooperation, four (out

Sabine C. Carey 20
of seven) are from Africa and only two (from ten) are from the Latin American sample (Brazil II and Chile I). This suggests that although repression is usually not a very effective strategy to make dissidents cooperate with the ruling elite, however, when it does work, it is more likely to be in Africa than in Latin America. The comparison of the results from the ten Latin American cases and the seven African cases highlighted s tive behaviour of the state was more ilarly cooperative behaviour of the opposition lead to state coercion more often in Latin America than in
ome interesting differences. In Latin America, coopera likely to trigger protest than in Africa, and sim
Africa. However, in Latin America in particular, repression appears to be a very unsuccessful method in making dissidents cooperate with the government. This suggests that the organisation of the more institutionalised protest movement in Latin America, usually driven and/or supported by elite groups, was better able to resist state repression and was therefore less likely to resort to cooperation as a result of coercive strategies of the government.
Impulse Response Functions
Impulse response functions are used to show the dynamics of the VAR system. Impulse response functions “represent the behavior of the modeled series in response to shocks (innovations)” (Charemza and Deadman 1997: 164). In the impulse response graphs, “the relationships among variables can be uncovered through this simulation of the system’s
sponse to innovations” (Freeman et al. 1989: 846). Usually one standard deviation in a revariable’s residuals is used as the innovation. However, the innovations should not be contemporaneously correlated, which is not controlled for by simply using one standard deviation as the innovation. For this study I use generalized impulses. This constructs an orthogonal set of innovations that does not depend on the VAR ordering (Pesaran and Shin 1998). For the purpose of this paper I only show four selected graphs from the two cases from Chile. These graphs are intended to shed more light on the earlier finding, namely that protest was found to Granger cause repression more often in democracies than in autocracies. Figures 2 and 3 show the Impulse Response Functions using two variables, Protest and Repression, plotting the response to the shocks over a period of two weeks. The x-axis represents the number of days after the innovation and the y-axis represents the intensity of the response.

Sabine C. Carey 21
Figure 2 shows the Impulse Response Functions from Chile under Pinochet, Figure 3 draws the graphs from the following period under the elected President Aylwin. The difference I would like to point out is that under the military regime (Chile I), the response of both repression and protest to an innovation in repression is on a more intense level
an under the civilian regime (Chile II). This pattern is very consistent across all nine
ries and empirical evidence on the relationship between protest and pression. Theories on domestic conflict usually focus on only one direction of the
relationship, i.e. either on hoprotest. Neither feedback loops are taken into account, nor is there a strong theoretical
itutional structures shape the interactions between state and non-state actors.
cooperation is particularly stable, more than in non-democratic gimes. Additionally, if one actor responds positively, i.e. with cooperation, to
cooperative behaviour of the other actor, then he can also expect that his own initiation of
thcountries. This suggests that although in the (mostly young) democracies governments react more often with conflict to protest behaviour than in non-democracies, they usually do so at a lower level of intensity than in non-democracies.
CONCLUSION
This study investigated the inter-relationships between domestic conflict and cooperation between government actors on the one side and members of the general public and opposition groups on the other. This research was born out of an abundance of often contradictory theore
w protest affects repression or on how repression affects
foundation for deciding on a particular one-way relationship between protest and repression. This study is intended to contribute to our understanding of the causality behind the protest-repression nexus in three ways. First, without imposing a particular direction of the relationship, it analyses the questions (a) whether protest leads to repression and (b) whether repression leads to protest. Second, I add cooperative behaviour of the government and the opposition to the study of domestic conflict. I argue that conflictual behaviour is also influenced by cooperative behaviour and that cooperative behaviour of one actor leads the other actor to cooperate as well. And finally, I investigate these relationships separately for democracies and non-democracies, to take into account that inst Using daily data from six Latin American and three African countries between the late 1970s and early 1990s, the results suggest that protest and repression are indeed interdependent. In most cases in which protest lead to repression, repression also lead to protest. Therefore, looking at only one direction of the relationship is likely to miss half of the picture. The results also show that protest, repression and state cooperation are highly autoregressive, suggesting that, in general, behaviour does not change from one day to the next. In democracies state re

Sabine C. Carey 22
cooperation is answered with accommodation and cooperative behaviour. Comparing eight democratic with nine non-democratic cases, it appears that in the mostly young democracies, dissident activities are likely to trigger more restrictive policies by the government. However, once a government responds to protest with conflict, it is usually on a more intense level in non-democracies than in democracies. Since this study was restricted to nine countries due to data limitation, future research might extend the analysis to a larger number of cases, once appropriate data become available. But despite focusing on a relatively small number of cases, it highlighted several interesting patterns of the
teractions between the state and the general population. It also pointed out several outlier cases and hopefully future case stud utliers will provide a more detailed picture of what drives domestic conflict and cooperation.
inies of these o

Sabine C. Carey 23
BIBLIOGRAPHY Charemza, Wojciech W. and Derek F. Deadman. 1997. New Directions in Econometric
Practice. Cheltenham: Edward Elgar. Dahl, Robert. 1971. Polyarchy: Participation and Opposition. New Haven, CT: Yale
University Press. Davenport, Christian. 2000. Introduction to Human Rights Violations and Contentious
Politics. Christian Davenport, ed. Lanham: Rowman and Littlefield, pp. 1-24. Davis, David R., Brett Ashley Leeds, and Will H. Moore. 1998. “Measuring Dissident and
State Behavior: The Intranational Political Interactions (IPI) Project.” Paper presented at the Workshop on Cross-National Data Collection, Texas A&M
Davis, David R., and Michael D. Ward. 1990. “They Dance Alone: Deaths and the Disappeared in Contemporary Chile.” Journal of Conflict Resolution 34(3): 449-475.
Enders, Walter. 1995. Applied Economic Time Series. New York: John Wiley & Sons. Francisco, Ronald A. 1995. “The Relationship between Coercion and Protest: An
Empirical Evaluation in three coercive states.” Journal of Conflict Resolution 39:263-282.
Francisco, Ronald A. 1996. “Coercion and Protest: An Empirical Test in Two Democratic
States.” American Journal of Political Science 40(4): 1179-1204. Freeman, John R. 1983. “Granger Causality and the Time Series Analysis of Political
Relationships.” American Journal of Political Science 27: 327-358. Freeman, John R., John T. Williams and Tse-min Lin. 1989. “Vector Autoregression and
the Study of Politics.” American Journal of Political Science 33(4): 842-877. Gamson, William. 1975. The Strategy of Social Protest. Homewood, IL: The Dorsey
Press. Gartner, Scott Sigmund, and Patrick M. Regan. 1996. “Threat and Repression: The Non-
Linear Relationship between Government and Opposition Violence.” Journal of Peace Research 33(3): 273-87.
Granger, C W. J. 1969. “Investigating Causal Relations by Econometric Models and Cross
Spectral Methods.” Econometrica 37(May): 424-438. Gupta, Dipal K., Harinder Singh, and Tom Sprague. 1993. “Government Coercion of
Dissidents.” Journal of Conflict Resolution 37(2): 301-339. Gurr, Ted R. 1968. “Psychological Factors in Civil Violence.” World Politics 20: 245-78.
University, November 21.

Sabine C. Carey 24
Gurr, Ted R., and Mark I. Lichbach. 1986. “Forecasting international Conflict: A Competitive Evaluation of Empirical Theories.” Comparative Political Studies
ibbs, D. 1973. Mass Political Violence: A Cross-National Causal Analysis. New York:
oover, Dean, and David Kowaleski. 1992. “Dynamic Models of Dissident and
rain, Matthew. 1997. “State-Sponsored Mass Murder: the Onset and Severity of
Lichbach of
ournal of Conflict Resolution 31(2): 266-297.
igan
ason, David, and D. Krane. 1989. “The Political Economy of Death Squads: Toward a
Quarterly 33: 175-98.
Moore, Wernational Conflict Nexus during the ‘Rhodesia Problem.’” Journal
of Conflict Resolution 39(1): 129-167.
Moore, W iming.” American Journal of Political Science 42:851-873.
Moore, W overnment Coercion.” Journal of Conflict Resolution 44(1): 107-127.
Muller, E Gurr, ed. Handbook of Political Conflict and Violence: Theory and Research.
uller, Edward N., and Erich Weede. 1990. “Cross-National Variation in Political
berschall, Anthony R. 1994. “Rational Choice in Collective Protests.” Rationality and
pp, Karl-Dieter. 1989. The Rationality of Political Protest. Boulder, CO: Westview.
Opp, Ka Germany in 1989.” Rationality and Society 6:101-138.
19(1): 3-38.
HWiley.
HRepression”. Journal of Conflict Resolution 36(1): 150-82.
KGenocides and Politicides.” Journal of Conflict Resolution 41(3): 331-360.
, Mark I. 1987. “Deterrence or Escalation? The Puzzle of Aggregate Studies Repression and Dissent”. J
Lichbach, Mark, I. 1995. The Rebel’s Dilemma. Ann Arbor, MI: University of Mich
Press.
MTheory of the Impact of State-Sanctioned Terror.” International Studies
ill H. 1995. “Action-Reaction or Rational Expectation? Reciprocity and the
Domestic-Int
ill H. 1998. “Repression and Dissent: Substitution, Context, and T
ill H. 2000. “The Repression of Dissent. A Substitution Model of G
dward N. 1980. “The Psychology of Political Protest and Violence”. In Ted R.
New York: Free Press.
MViolence: A Rational Action Approach.” Journal of Conflict Resolution 34(4): 624-651.
OSociety 6: 79-100.
O
rl-Dieter. 1994. “Repression and Revolutionary Action: East

Sabine C. Carey 25
Opp, Karl-Dieter, and Wolfgang Ruehl. 1990. “Repression, Micromobilization, anPolitical Protest.” Social Forces 69: 521-547.
d
esaran, M. Hashem and Y. Shin. 1998. “Generalized Impulse Response Analysis in
ierce, David A. 1977. “Relationships – and Lack Thereof – between Economic Time
the ections: 11-22.
an
ocracy. Baltimore, MD: Johns Hopkins University Press, 49-62.
Shellman, Stephen M. 2000. “Measuring the Intensity of Intranational Political Interactions Events Data: Two Interval-like Scales.” Manuscript, Florida State
Sims, Ch oeconomics and Reality.” Econometrica 48 (January): 1-
49.
Tarrow, ell Western Societies Paper no. 21 Ithaca,
NY: Cornell University Press.
Tarrow, ts, Collective Action and Politics. Cambridge, UK: Cambridge University Press.
Taylor, M ction”, In Rationality and Revolution, Michael Taylor, ed. Cambridge: Cambridge University Press, p.
Tilly, Ch isation of Political Conflict in France.
Tilly, Charles. 1984. Big Structures, Large Processes, Huge Comparisons. New York:
Russell Sage Foundation.
PLinear Multivariate Models.” Economics Letters 58(1): 17-29.
PSeries, with Special Reference to Money and Interest Rates.” Journal ofAmerican Statistical Association, 72(March): Applications S
Rasler, Karen A. 1996. “Concessions, Repression, and Political Protest in the Irani
Revolution.” American Sociological Review 61(February): 132-152. Schmitter, Phillipe C., and Terry L. Karl. 1996. “What Democracy is ... and is not.” In
Larry Diamond and Marc F. Plattner, eds. The Global Resurgence of Dem
University.
ristopher. 1980. “Macr
Sidney. 1991. Struggle, Politics, and Reform: Collective Action, Social Movements, and Cycles of Protest. Corn
Sidney. 1994. Power in Movement: Social Movemen
ichael. 1998. “Rationality and Revolutionary Collective A
63-97.
arles. 1972 The Modern Tilly, Charles. 1978. From Mobilization to Revolution. Reading, MA: Addison-Wesley.

Sabine C. Carey 26
TABLE 1. Summary of Cases
RES NAME OF CASE TIME PERIOD POLITY SCO
Argentina I 1 April 1982 – 30 October 1983 -8
A rgentina II 31 October 1983 – 31 December 1992 8 and 7
Brazil I 1 July 1983 – 15 January 1985 -3
Brazil II 16 January 1985 – 31 December 1992 7 and 8
Chile I 1 May 1979 – 15 December 1989 -7, -6 and -1
Chile II 15 December 1989 – 30 October 1992 8
Colombia I 1 May 1983 – 31 December 1992 8 and 9
Mexico I 1 February 1984 – 13 July 1988 -3
Mexico II 14 July 1988 – 30 November 1992 0
Venezuela I 1 March 1983 – 3 February 1992 9 and 8
Nigeria I 1 January 1983 – 31 December 1983 7
Nigeria II 1 January 1984 – 3 May 1989 -7
Nigeria III 4 May 1989 – 31 December 1992 -5
Zaire I 1 January 1975 – 23 November 1990 -9
Zaire II 24 November 1990 – 31 December 1992 -8
Zimbabwe I 1 December 1974 – 30 June 1983 4 and 5 11
Zimbabwe II 1 July 1983 – 31 December 1985 1
11 One might suggest that it would be more intuitive to divide the time periods for Zimbabwe into two cases before and after independence instead of using the polity-scale as a rule for chosing the cases. I used chow-tests to statistically determine whether there is a significant break in the time series when then Rhodesia became independent. However, the test was not statistically significant at the 0.5 level.

Sabine C. Carey 27
RESULTS OF F-TEST FOR ON VAR ESTIMATION
TABL 3: F-tests Results for Argentina I and II
I II
GRANGER CAUSALITY, BASED
E
Polity -8 Polity 8/7
1/04/82 – 30/10/83 31/10/83 – 31/12/92
DV* Granger Cause F-STAT PROB. F-STAT PROB.
Protest Protest 2.768 0.008 108.298 0.000 Repress 2.873 0.000 ion 1.114 0.352 Dissident Coop. 0.350 0.930 1.078 0.370 State 1.759 0.031 Coop. 2.012 0.052 Rep Protest 4.482 0.000 ression 1.042 0.401 Repressi 3.987 0.000 on 2.734 0.009 Dissident Coop. 6.290 0.000 0.836 0.645 State C 2.899 0.000 oop. 0.433 0.882 Dis Protest 1.4 30 sident Coop. 1.674 0.113 03 0.1 Repression 1.978 0.056 1.539 0.078 Dissid 3.157 0.000 ent Coop. 10.059 0.000 State Coop. 0.767 0.615 2.477 0.001 Stat Protest 0.822 0.662 e Coop. 2.099 0.042 Repression 2.311 0.025 1.598 0.061 Dissid 2.112 0.006 ent Coop. 3.475 0.001 State Coop. 1.610 0.130 4.244 0.000
N 3350 571
Lags 7 16
* Depende ariable
Figures in bold indicate statistical significance for p < 0.05. nt V

Sabine C. Carey 28
TABLE
I II
4: F-tests Results for Brazil I and II
Polity -3 Polity 7/8
1/07/83 – 15/01/85 16/01/93 – 31/12/92
DV* Granger Cause B.
F-STAT PRO F-STAT PROB.
Protest 3 0 Protest 10.24 0.00 114.472 0.000 Repression 1.345 0.125 2.247 0.005 Dissident Coop. 9 0 0.22 1.00 0.896 0.563 State . 2 0 Coop 2.60 0.00 1.007 0.443 Repression Protest 2 6 1.40 0.09 2.966 0.000 Repression 1.504 0.058 1.308 0.194 Dissident Coop. 8 3 0.43 0.99 1.530 0.092 State . 3 0 Coop 3.35 0.00 1.506 0.100 Dissident Coop. 9 0 Protest 2.50 0.00 1.947 0.018 Repression 0.542 0.967 1.896 0.023 Dissident Coop. 3 9 0.32 0.99 0.479 0.945 State . 7 6 Coop 0.75 0.79 1.327 0.182 State Coop. 1 0 Protest 6.55 0.00 1.274 0.215 Repression 7.578 0.000 2.747 0.000 Dissident Coop. 8 1 1.09 0.34 1.033 0.416 State . 6 0 Coop 8.95 0.00 2.410 0.002
N 540 9 2 07
Lags 25 14
* Depende riable
Figures in bold indicate statistical significance for p < 0.05. nt Va

Sabine C. Carey 29
TABLE 5: F-tests Results for Chile I and II
I II
Polit Py -7, -6, -1 olity 8
1 15/05/79 – 15/12/89 /12/89 – 30/10/92
DV* Granger F P F PCause -STAT ROB. -STAT ROB.
Protest Protest 0 06.639 .000 0.934 .443 R 1 0 1.218 0.301 epression .947 .006 D 2 0 0.045 0.996 issident Coop. .181 .001 State 1 0 4.357 0.002 Coop. .569 .047 Repression Protest 2 0 5.542 0.000 .485 .000 R 42 0 23.512 0.000 epression .113 .000 D 1 0 0.312 0.870 issident Coop. .794 .014 State 1 0 1.673 0.154 Coop. .856 .010 D P 1 0 0.004 1.000 issident Coop. rotest .341 .136 R 1 0 0.080 0.989 epression .654 .031 D 3 0 0.015 1.000 issident Coop. .683 .000 State 3 0 0.032 0.998 Coop. .495 .000 S P 1 0 5.644 0.000 tate Coop. rotest .094 .346 R 1 0 0.384 0.820 epression .903 .008 D 2 0 6.477 0.000 issident Coop. .882 .000 State 5 0 0.348 0.846 Coop. .891 .000
N 38 1 61 051
Lags 21 4
* Dependent Variable
Figures in bold indicate statistical significance for p < 0.05.

Sabine C. Carey 30
TABLE 6: F-tests Results for Colombia I
I
Polity 8/9
1/05/83 – 31/12/92
DV* Granger Cause F-STAT PROB.
Protest Protest 8.233 0.000 Repression 0.634 0.890 Dissident Cooperati 1.301 on 0.166 State Cooperation 1.159 0.280 Repression Protest 1.692 0.028 Repression 3.604 0.000 Dissident Cooperati 2.044 0.004 on State Cooperation 1.790 0.017 Dissident Coopera test 0tion Pro .985 0.477 Repression 1.194 0.249 Dissident Cooperati 6.316 0.000 on State Cooperation 1.969 0.006 State Cooperation test 1.705 0.026 Pro Repression 1.186 0.256 Dissident Cooperati 4.012 0.000 on State Cooperation 3.305 0.000
N 3513
Lags 20
* Dependent Variable
Figures in bold indicate statistical significance for p < 0.05.

Sabine C. Carey 31
TABLE 7: F-tests Results for Mexico I and II
I II
Polity -3 Polity 0
1/02/84 – 13/07/88 214/07/88 – 30/11/9
DV* Gra F-STAT PROB.
AT . nger Cause F-ST PROB
Protest Pro 0.000 0.000 20 test 213.9 0.000 Repression 3.014 0.001 57 1.8 0.047 Dissident 308 0.221 35 Coop. 1. 2.7 0.002 State 0.482 0.903 27 Coop. 0.4 0.934 Repression Pro 3.036 0.001 64 test 1.3 0.191 Repression 2.039 0.026 42 1.0 0.405 Dissident 101 1.000 95 Coop. 0. 2.6 0.003 State 0.110 1.000 21 Coop. 1.2 0.272 Dissident Coop. Protest 3.707 0.000 85 3.6 0.000 Repression 0.568 0.841 73 1.5 0.109 Dissident 036 1.000 31 Coop. 0. 3.0 0.001 State 0.046 1.000 18 Coop. 4.4 0.000 State Coop. Pro 2.116 0.021 68 test 0.8 0.563 Repression 1.487 0.138 73 0.3 0.959 Dissident 439 0.928 64 Coop. 0. 1.0 0.387 State 1.436 0.159 76 Coop. 1.9 0.032
N 1615 1606
Lags 10 10
* Dependent Variable
Figures in bold indicate statistical significance for p < 0.05.
Sabine C. Carey 32
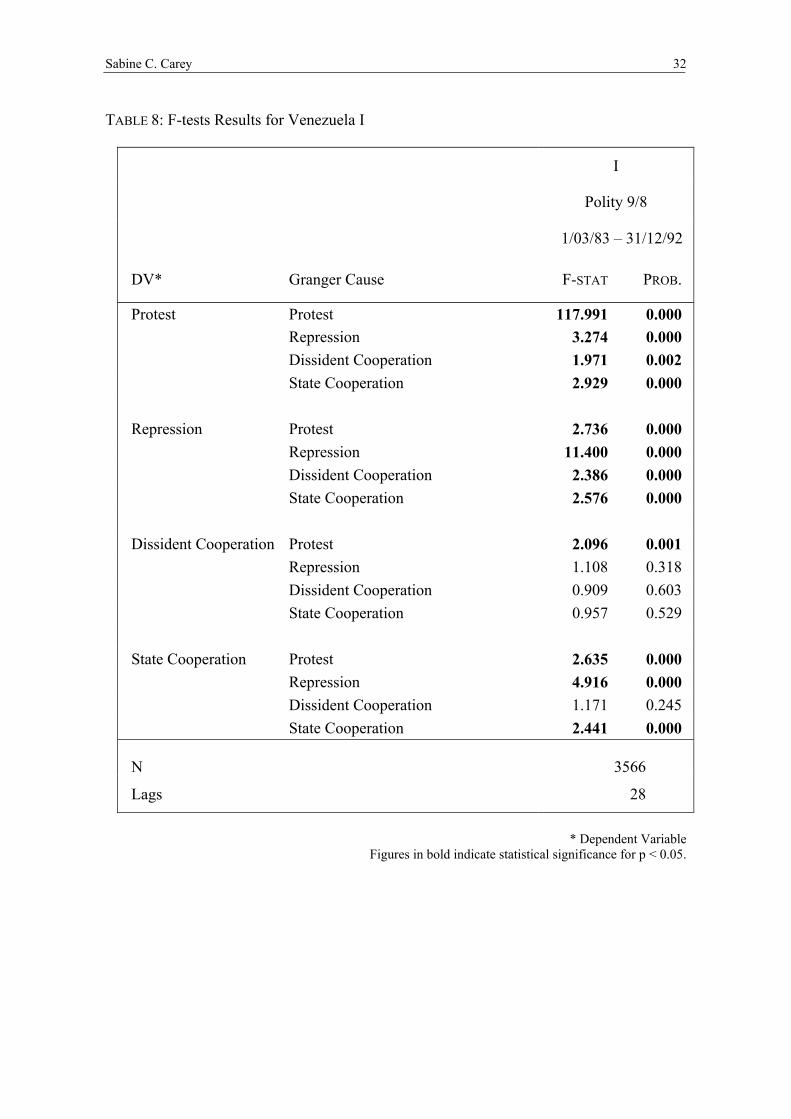
TABLE 8: F-tests Results for Venezuela I
I
Polity 9/8
1/03/83 – 31/12/92
DV* Granger Cause -STAT PROB. F
P test ro Protest 117.991 0.000 3.274 0.000 Repression Cooperation 1.971 0.002 Dissident State Cooperation 2.929 0.000 Repression Protest 2.736 0.000 Repression 11.400 0.000 Cooperation 2.386 0.000 Dissident State Cooperation 2.576 0.000 Dissident Cooperatio 2.096 0.001 n Protest 1.108 0.318 Repression Cooperation 0.909 0.603 Dissident State Cooperation 0.957 0.529 State Cooperation 2.635 0.000 Protest 4.916 0.000 Repression Cooperation 1.171 0.245 Dissident State Cooperation 2.441 0.000
N 3566
Lags 28
Figures in bold indicate statistical significance for p < 0.05. * Dependent Variable

Sabine C. Carey 33
TABLE 9: F-tests Results for Nigeria I, II and III
I II III
Polity 7 Polity -7 Polity -5
1/01/83 – 31/12/83 1/01/84 – 3/05/89 4/05/89 – 31/12/92
DV* GC** F-STAT PROB. F-STAT PROB. F-STAT PROB.
Protest Protest 7.334 0.000 54.686 0.000 13.866 0.000 Repression 0.000 1.526 0.094 4.771 2.545 0.013 Diss. Coop. 0.349 2.778 0.000 1.113 1.031 0.408 State Coop. 1.598 0.073 3.188 0.000 0.504 0.832 Repr. Protest 7.121 0.000 3.452 0.000 1.178 0.312 pression 0.000 25.560 0.000 Re 8.481 19.800 0.000 Diss. Coop. 1.000 1.439 0.127 0.002 0.997 0.432 State Coop. 0.882 0.579 5.507 0.000 0.214 0.982 D. Coop. Protest 0.002 1.000 5.957 0.000 0.198 0.986 1.000 1.765 0.038 Repression 0.007 1.727 0.099 Diss. Coop. 1.000 2.370 0.003 0.017 1.558 0.144 State Coop. 1.955 0.018 0.015 1.000 0.728 0.648 St. Coop. Protest 6.789 0.000 0.883 0.578 2.168 0.034 n 0.000 2.773 0.000 Repressio 4.537 1.979 0.055 Diss. Coop. 1.000 1.990 0.015 0.005 0.462 0.862 State Coop. 1.156 0.303 7.853 0.000 1.675 0.111
N 353 1950 1338
Lags 12 14 7
* Dependent Variable ** Granger Causality
Figures in bold indicate statistical significance for p < 0.05.
Sabine C. Carey 34
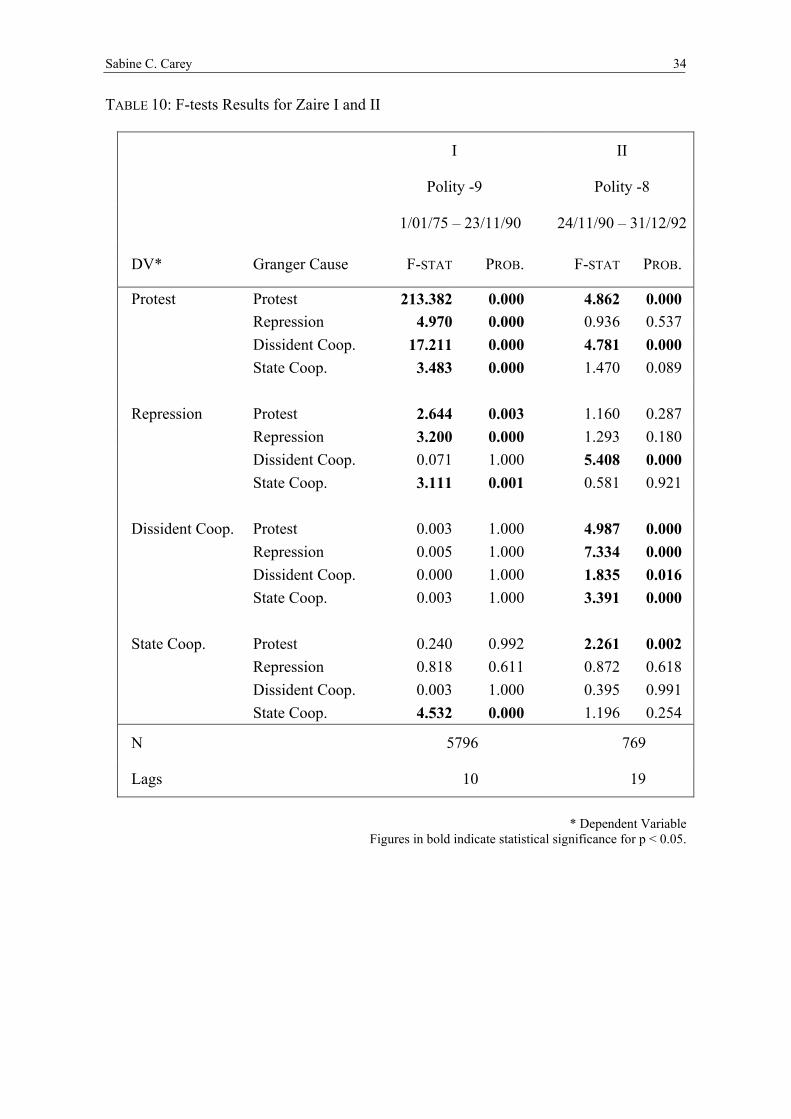
TABLE 10: F-tests Results for Zaire I and II
I II
Polity -9 Polity -8
/011 /75 – 23/11/90 24/11/90 – 31/12/92
DV* Grang e -ST PROer Caus F AT B. F-STAT PROB.
Protest Protest 3.3 0.0021 82 0 4.862 0.000 press 4.97 0.00Re ion 0 0 0.936 0.537 Dissident p. 7.21 0.00Coo 1 1 0 4.781 0.000 te C 3.48 0.00Sta oop. 3 0 1.470 0.089 Repressio Protest 2.64 0.00n 4 3 1.160 0.287 press 3.2 0.00Re ion 00 0 1.293 0.180 Dissident p. 0.07 1.00Coo 1 0 5.408 0.000 te C 3.11 0.00Sta oop. 1 1 0.581 0.921 Dissident Coop. Protest 0.00 1.003 0 4.987 0.000 press 0.00 1.00Re ion 5 0 7.334 0.000 Dissident p. 0.00 1.00Coo 0 0 1.835 0.016 te C 0.00 1.00Sta oop. 3 0 3.391 0.000 State Coo Protest 0.24 0.99p. 0 2 2.261 0.002 press 0.81 0.61Re ion 8 1 0.872 0.618 Dissident p. 0.00 1.00Coo 3 0 0.395 0.991 te C 4.53 0.00Sta oop. 2 0 1.196 0.254
N 5796 769
Lags 10 19
* Dependent Variable nificance for p < 0.05. Figures in bold indicate statistical sig

Sabine C. Carey 35
TABLE 11: F-tests Results for Zimbabwe I and II
I II
Polity 4/5 Polity 1
1/12/74 – 30/06/83 1/07/83 – 31/12/85
DV* Granger Cause F-STAT PROB. F-STAT PROB.
Protest Protest 7.830 0.000 8.821 0.000 Repression 4.111 0.000 0.583 0.793 Dissident Coop. 0.748 0.665 1.333 0.223 State Coop. 1.397 0.183 0.619 0.763 Repression Protest 2.358 0.012 1.367 0.207 Repression 6.738 0.000 1.034 0.408 Dissident Coop. 1.333 0.214 0.432 0.902 State Coop. 1.248 0.261 0.693 0.698 Dissident Coop. Protest 2.734 0.004 0.441 0.897 Repression 2.322 0.013 2.653 0.007 Dissident Coop. 46.071 0.000 0.023 1.000 State Coop. 2.129 0.024 0.065 1.000 State Coop. Protest 1.162 0.315 1.335 0.222 Repression 1.159 0.317 1.499 0.153 Dissident Coop. 24.515 0.000 1.115 0.350 State Coop. 1.061 0.389 3.478 0.001
N 3125 915
Lags 9 8
* Dependent Variable
Figures in bold indicate statistical significance for p < 0.05.

Sabine C. Carey 36
TABLE ausality Tests
F-t of r as s ni ant < 0.05. ndent Variable
P = Protest, R = Repression, DC = Dissident Cooperation, SC = State Cooperation
DV PR TEST REPRESSION DISSIDENT C PERATION S TE OOPERATION
X = the est for the lags this va iable w tatistically sigDV = Depe
fic at p
O OO TA CSC D
X X X X X X X
X X X X X X X X X X XX X X
X
X X X X X X X X X X X X X X
X X X
X X X
X X
7 11 6 7 8 6 7 9 7 7 10 2 .29 41.18 58.82
12: General Summary of the Granger C
Polity Granger Cause P R DC SC P R DC P R C SC P R DC SC -8 Argentina I X X X X X X X 7/8 Argentina II X X X X X X X X X -3 Brazil I X 7/8 Brazil II X X X
-7/-6/-1 Chile I X X X X X X X 8 Chile II X X
8/9 Colombia I X X X X X X X X X -3 Mexico X X X X X I X
XX X XXXXX X 164.1
0 Mexico II X X X X X X X 9 Venezuela I X X X 7 Nigeria I X X -7 Nigeria II X X X X X X X -5 Nigeria III X X -9 Zaire I X X X X -8 Zaire II X X X X X X X 4/5 Zimbabwe I X X X X X X X 1 Zimbabwe III X TOTAL (17) 10 6 12 8 % 9 58.8 35 41.18 64.71 70.59 35.29 41.18 47.06 35.29 47.06 41.18 52.94 41.182

Sabine C. Carey 37
s versus Non-democracies
TAB E 14: S Gra er America versus Africa
The num t e lags of the variable had an tic i a
N = Total numb
DV PROTEST REPRESSION DISSIDENT COOPERATION STATE COOPERATION
L ummary of ng Causality Tests, Latin
ber in the gray cells refer to the number of cases hat th statis ally s gnific nt F-test at p < 0.05.
Cau DC P R DC P R DC SC P R DC mocracy 3 4 3 4 6 % 87.50 62.50 12.50 50.00 87.50 75.00 25.00 50.00 37.50 37.50 50.00 37.5037.50 37.50 50.00 75.00 9 Autocracy 3 5 4 4 3 4 % 100 55.56 55.56 33.33 44.44 66.67 44.44 33.33 55.56 33.33 55.56 44.44 44.4455.56 33.33 44.44
DV PR EST REP SSIO DI DENT COOPERATIO ATE OOPE ATIOOT RE N SSI N ST C R N N Grang P R P R DC P R DC SC D SC er Cause DC SC SC P R C LA 6 7
% 90 60 30 50 70 70 50 50 50 20 50 40 60 50 50 70
Africa 3 % 100 57.14 42.8 28.5 57. 71. 14.2 28. 42.86 57. 42.866 7 14 43 9 57 14 42.86 42.86 28.57 28.57 42.86
N Granger se P R SC SC SC
8 De 7 5 1 4 7 6 2 4 3 3 3
10 5 59 6 3 5 7 7 5 5 5 2 5 4
7 7 4 3 2 4 5 1 2 3 4 3 3 3 2 2
TABLE 13: Summary of Granger Causality Tests, Democracie
DV = Dependent variable er of cases in this category
P = Protest, R = Repression, DC = Dissident Cooperation, SC = State Cooperation
5 9 5 5 3 4 6 4 3 5

Sabine C. Carey 38
Imnse to G ralized On andard De Innova s over thre ek
Figu
pulse Response Functions e StRe
re 2
spo ene
: Chile I (Military Regime)
.2
0.0
.2
.4
.6
1.0
.2
6 12
a) Respon logg
.4
.8
6 12
viation tion e we
-0.2
0.
0.2
0.
0.6
1.0
1.
10
( nse o ression
0.0
0.4
0.8
1.2
10
s
12
o It
12
Rep
-0
0
0
0
0.8
1
2 4 8 10 14
( se of logged Repression to ed Protest
0
4
0.8
2
2 4 6 8 14
b) Respo f logged Rep t
0.0
0
0
1.2
2 4 8 10 14
(c) Response of logged Protest to Itself
2 4 6 8 14
(d) Response of logged Protest to logged ressio
self
n

Sabine C. Carey 39
Figure 3: Chile II (Civilian Re
gime)
-.1
.0
.1
.2
.3
.4
.5
.6
.7
2 4 6 8 10 12 14-.1
.0
.1
.2
.3
.4
.5
.6
.7
2 4 6 8 10 12 14
-.1
.0
.1
.2
.3
.4
.5
.6
2 4 6 8 10 12 14
(c) Response of logged Protest to Itself
-.1
.0
.1
.2
.3
.4
.5
.6
2 4 6 8 10 12 14
(d) Response of logged Protest to Repression
(a) Response of logged Repression to logged Protest (b) Response of logged Repression to Itself.8 .8