a tool for online packet analysis in mobile networks - diva portal
TRANSCRIPT

A Tool For Online Packet Analysis InMobile Networks
NAVID FARADJZADEH
Master’s Degree ProjectStockholm, Sweden June 2012
XR-EE-LCN 2012:007

Master Thesis Report
A Tool For Online PacketAnalysis In Mobile Networks
Navid Faradjzadeh
Supervisors
Gyorgy Dan (KTH) Hakan Tranberg (Ericsson AB)
June 13, 2012 Gothenburg, Sweden

Preface
This work is a Master of Science thesis project that was done at Ericsson AB andthe result of the project is going to be used at Ericsson packet core SGSN-MMEsupport unit in Lindholmen-Gothenburg.
1

Acknowledgements
On the way to realize an idea into a working example one faces enormous numberof difficulties that takes a great deal of knowledge and experience. As much asthere is satisfaction and content on the way there are times of frustration anddisappointment as well. All this was too much for me to take without thesupport and advice from wonderful people around me for whom I want to takethe opportunity to express my deepest gratitude and respect.
From Ericsson AB, I want to thank my supervisor Hakan Tranberg whosebrilliant ideas helped the project develop so far. Hakan with his experience andindisputable knowledge put me on the right track on my way to realizing thisthesis. I also want to thank Claes Uggla whose suggestions helped me integrateinto the environment and make the best out my experience at Ericsson AB.
I want to thank Gorgy Dan my supervisor at KTH who patiently walked withme throughout the entire work from the first day to the last. His precise, criticaland brilliant view on my work is what has made this thesis worth reading.
My family, specially my parents and my brother Vahid were the ones whobacked me up always and under any condition. Without their full support, Iwould not be at this point in my life and doing this thesis in the first place.
Finally, It is needless to mention that I am also thankful to many peoplesupporting me with their advices and ideas in this work from my colleagues atEricsson to my friends and I regret that I cannot mention them one by one here.
2
Abstract
Today the mobile networks face a high demand for packet data delivery atever increasing rates. In order to satisfy the demand, new network modulesand protocols are introduced into mobile networks. This leads to a complexsystem of protocols and algorithms. This level of complexity requires efficientmethods of troubleshooting. This need has motivated the implementation ofmore efficient packet analizers besides the ones that already exist today.
A number of packet analizers have already been introduced in order to readthe data from the wires and dissect them into packets but the process of readingbinary data and dissecting them is a multistage procedure. In this project wetried to propose a more efficient solution to packet analizing in mobile networksdomain. Packet analizers that already exist can dissect a packet provided thatit is a full packet or in case that there is an absent header the user must beaware of the type of the header and add it to the packet manually and thenhand it over to a packet analizer for dissection. However, here in this projectwe implemented a packet analizer that can dissect any headers extracted froma packet without the need to have prior information on the type of the absentheaders.
In this report we describe the types of protocols that our solutions potentiallycan support then we discuss the requirements and constraints of such a tool. Wegive a description of the design and implementation of the software and finallywe discuss some improvements on the performance of our solution.
3
Contents
1 Introduction 101.1 Methodology . . . . . . . . . . . . . . . . . . . . . . . . . . . . . 111.2 Structure . . . . . . . . . . . . . . . . . . . . . . . . . . . . . . . 12
2 Mobile Internet and Design Issues 132.1 Mobile Radio Generations 0 and 1 . . . . . . . . . . . . . . . . . 14
2.1.1 Cellular Mobile System . . . . . . . . . . . . . . . . . . . 142.2 Second Generation(2G) . . . . . . . . . . . . . . . . . . . . . . . 15
2.2.1 GPRS . . . . . . . . . . . . . . . . . . . . . . . . . . . . . 172.3 Third Generation(3G) . . . . . . . . . . . . . . . . . . . . . . . . 17
2.3.1 Universal Mobile Telecommunication System(UMTS) . . 182.3.2 Core Network . . . . . . . . . . . . . . . . . . . . . . . . . 18
2.3.2.1 Gateway GPRS Support Node (GGSN) . . . . . 182.3.2.2 Serving GPRS Support Node (SGSN) . . . . . . 19
2.4 Forth Generation(4G) and beyond . . . . . . . . . . . . . . . . . 192.4.1 Long Term Evolution(LTE) . . . . . . . . . . . . . . . . . 20
2.4.1.1 Mobility Management Entity(MME) . . . . . . . 202.4.2 SGSN-MME support . . . . . . . . . . . . . . . . . . . . . 20
2.4.2.1 SGSN-MME and Protocols . . . . . . . . . . . . 212.4.2.2 Support Unit . . . . . . . . . . . . . . . . . . . . 21
2.5 Wireshark . . . . . . . . . . . . . . . . . . . . . . . . . . . . . . . 222.5.1 Text2pcap . . . . . . . . . . . . . . . . . . . . . . . . . . . 232.5.2 Tshark . . . . . . . . . . . . . . . . . . . . . . . . . . . . . 23
3 Online Packet Analizer 243.1 Requirements . . . . . . . . . . . . . . . . . . . . . . . . . . . . . 24
3.1.1 Query Submission Method . . . . . . . . . . . . . . . . . . 253.1.2 Protocol Support . . . . . . . . . . . . . . . . . . . . . . . 253.1.3 Database . . . . . . . . . . . . . . . . . . . . . . . . . . . 253.1.4 Output Interface . . . . . . . . . . . . . . . . . . . . . . . 26
3.2 Constraints . . . . . . . . . . . . . . . . . . . . . . . . . . . . . . 263.2.1 Processing Complexity . . . . . . . . . . . . . . . . . . . . 263.2.2 Code Complexity . . . . . . . . . . . . . . . . . . . . . . . 27
4 Design and Implementation 284.1 User Submission . . . . . . . . . . . . . . . . . . . . . . . . . . . 284.2 Processing The Input . . . . . . . . . . . . . . . . . . . . . . . . . 294.3 Displaying The Results . . . . . . . . . . . . . . . . . . . . . . . . 30
4
4.4 Login System . . . . . . . . . . . . . . . . . . . . . . . . . . . . . 304.5 Database . . . . . . . . . . . . . . . . . . . . . . . . . . . . . . . 304.6 Handling Files . . . . . . . . . . . . . . . . . . . . . . . . . . . . 304.7 GUI Design of OPA . . . . . . . . . . . . . . . . . . . . . . . . . 32
5 Performance Improvements 37
6 Conclusion 46
5
List of Figures
2.1 Cellular Mobile Network . . . . . . . . . . . . . . . . . . . . . . . 152.2 GSM protocol architecture . . . . . . . . . . . . . . . . . . . . . . 162.3 GPRS protocol stack . . . . . . . . . . . . . . . . . . . . . . . . . 172.4 3G Core Network . . . . . . . . . . . . . . . . . . . . . . . . . . . 192.5 E-UTRAN overall architecture . . . . . . . . . . . . . . . . . . . 202.6 The S1-MME protocol stack . . . . . . . . . . . . . . . . . . . . . 222.7 A wireshark screenshot . . . . . . . . . . . . . . . . . . . . . . . . 23
4.1 OPA input form snapshot . . . . . . . . . . . . . . . . . . . . . . 334.2 OPA results page snapshot . . . . . . . . . . . . . . . . . . . . . 344.3 Login window . . . . . . . . . . . . . . . . . . . . . . . . . . . . . 354.4 Database update form . . . . . . . . . . . . . . . . . . . . . . . . 354.5 Entry check page . . . . . . . . . . . . . . . . . . . . . . . . . . . 354.6 Procedures list page . . . . . . . . . . . . . . . . . . . . . . . . . 364.7 HTML view . . . . . . . . . . . . . . . . . . . . . . . . . . . . . . 36
5.1 Cumulative number of system calls for uniformly distributed input 385.2 Cumulative number of system calls for biased input . . . . . . . . 395.3 Cumulative number of system calls for same type inputs . . . . . 405.4 Cumulative number of system calls for same type inputs in the
long run . . . . . . . . . . . . . . . . . . . . . . . . . . . . . . . . 405.5 Comparison of the performance of Hard and Soft priority in re-
sponse to slow and fast changing input pattern . . . . . . . . . . 425.6 Comparison of the performance of Hard and Soft and Dynamic
priority in response to slow and fast changing input pattern . . . 435.7 Realistic Scenario . . . . . . . . . . . . . . . . . . . . . . . . . . . 44
6
List of Tables
5.1 Comparison of user experience in the biased input type . . . . . 445.2 Comparison of user experience in the same type input . . . . . . 445.3 Comparison of user experience in the same type input . . . . . . 45
7

Acronyms
BS Base Station
CDMA Code Division Multiple Access
CGI Common Gateway Interface
CN Core Network
CS Circuit Switched
EDGE Enhanced Data rates for GSM Evolution
eNB E-UTRAN Node B
EPC Evolved Packet Core
ETSI European Telecommunications Standards Institute
E-UTRA Evolved UMTS Terrestrial Radio Access
E-UTRAN Evolved UMTS Terrestrial Radio Access Network
FDMA Frequency Division Multiple Access
GERAN GSM/EDGE Radio Access Network
GSM Global System for Mobile communications
GGSN Gateway GPRS Support Node
GMM GPRS Mobility Management
GPRS General Packet Radio Service
GTP GPRS Tunnelling Protocol
GUI Graphical User Interface
HLR Home Location Register
HSDPA High-Speed Downlink Packet Access
HSUPA High-Speed Uplink Packet Access
HTML HyperText Markup Language
HTTP Hyper Text Transfer Protocol
IM IP Multimedia
IMSI International Mobile Subscriber Identity
IMT International Mobile Telecommunication
IPTV TV through the internet
IPv4 Internet Protocol version 4
8
ITU International Telecommunication Union
LTE Long Term Evolution
MME Mobility Management Entity
MMS Multimedia Messaging Service
MS Mobile Station
MSC Mobile Switching Centre
MSC Mobile-services Switching Centre
NAS Non-access Stratum
PDN Packet Data Network
PDP Packet Data Protocol
PS Packet Switched
PSTN Public Switched Telephone Networks
P-TMSI Packet-Temporary Mobile Station Identity
RNC Radio Network Controller
SCTP Stream Control Transmission Protocol
SGSN-MME Serving GPRS Support Node and Mobility Management Entity
SGW Serving GateWay
SM Session Management
SMS Short Messaging System
S1AP S1 Application Interface
TCP Transport Control Protocol
TDMA Time Division Multiple Access
UE User Equipment
UMTS Universal Mobile Telecommunication System
VLR Visitor Location Register
WAP Wireless Application Protocol
WWW World Wide Web
3GPP 3rd Generation Partnership Project
9

Chapter 1
Introduction
A packet analizer – or a packet sniffer – is a tool that can be installed on somenetwork nodes and can read all the binary data passing through the node’sinterfaces and save them onto the memory. It can parse the bits into meaningfulpackets with various network headers later from the memory or in real time andon the go. This process is rather complex, since there are enormously largenumber of protocols that are actively in use in today’s networks. To get afeeling of how many protocols might be out there just consider that startingfrom link Layer in TCP/IP protocol suite and only for Ethernet there is afield (etherType) to indicate the next layer protocol and this field is 16 bits longwhich means there potentially can be 65536 different next layer protocols andamong these potential protocols IPv4 is only one. In the IPv4 header there isanother field (Protocol) that indicates the next layer protocol. This field itselfis 8 bits long which indicates 256 different potential protocols for the next layer.The applications that TCP can carry on top or application layer are indicatedby the port numbers in TCP header. Since there are application protocols thatcan use any free ports and moreover these applications can be designated tocarry higher level protocols there can be literally infinite number of applicationlayer protocols. HTTP is an example of an application layer protocol whichworks on port 80. This was only TCP/IP protocol suite. Taking for examplemobile internet into account opens up another world of protocols.
These countless protocols each having their own data structure and encodingsuggests that the task of packet analizing is quite a complex process. But thegood news is these protocols all share a common characteristic. They all havea means inside them to indicate what next layer protocol they are carrying. Inother words we can start from link layer and after dissecting link layer headerwe will already have known what next header protocol we are expecting. Thiscan reduce packet analizing tools design into implementing specific dissectorsfor each protocol1 then upon finding out what is to be expected next just callthe proper dissector for the next protocol.
1As there are enormous number of protocols this can only be realized in the best form bydistributed collaboration of many people. These kinds of collaborations being the heart ofopen source society, best packet analizer softwares you can find are products of open source.Wireshark is the perfect example of such rich softwares that is realized this way.
10

As long as the analizer tool sits right behind the network interface everythingis fine. We have a complete packet hex dump and we have the characteristicsof the network card hence enough information about the first layer and then weonly need to start dissecting. But there comes serious obstacles in the wholeprocess when it comes to real world applications of such a tool. Different Net-work industry corporations might not follow the regulations indicated in RFCs.For example etherType in Ethernet header of Ericsson SGSN-MME productmight not be 0x0800 but still carrying IPv4 protocol as the next header. Fortu-nately packet sniffers generally have options for these purposes so that they canbe forced to interpret the next header as IPv4 regardless of etherType value forexample. In another scenario a hex dump might be handed to packet analizerthat starts with IP for instance rather than Ethernet. This also can be handledby introducing fake headers. The problem can be even more complicated. Ahex dump might be handed to a packet sniffer for which there is no former infor-mation about what header is absent. This later problem is not solved in today’spacket analizers since for such class of problems there is no straightforward so-lution. The hex dump might start with any number and this number mightrepresent the first byte of any header. Here in our project we tried to find anoptimized solution to this later problem for a specific application domain(MobileNetworks).
This project is a design and implementation of an online packet analizerwhich is capable of dissecting any hexdumps uploaded provided that the typeof top level protocol is indicated. Despite the fact that the process of dissectingis straightforward from bottom to top; The reverse process, which is dissectingfrom top to bottom seems to be an intensive task. Along with this capabilitythis web service contains a database of sample network procedures that will beused for network support and maintenance purposes.
1.1 Methodology
In the beginning, this project was just an idea. During the first week I gotfamiliar with Perl scripting and CGI programming and did a little research onWireshark and generally packet dissection algorithms in order to see the possi-bilities that these tools as well as Perl CGI programming can provide. It wasthen that I had an estimate of the extent and potential possibilities of the soft-ware that I could implement in regard to the limited time for implementation.In one month I could form a solid knowledge of Perl CGI scripting and imple-ment a prototype to see how the software would look like. During this I hadmeetings with my supervisor to define and decide on the requirements of thesoftware. In the second month I became more familiar with the protocol typesand hex dumps that support staff deals with mostly. An important part of theproject was to find out what protocols should be added. As I did not havean extensive knowledge of all the protocol types in SGSN-MME I had to addthese new protocols based on the requests from support staff. This made meimplement the code in a generic style so that I could integrate new protocolssupport in the shortest time possible. At the end of the second month the betaversion of the software was ready. during the third month I tried to optimize theheader guessing algorithm and draw diagrams and tables to be able to discussthe issues in the algorithm. In the forth month I had a first version ready to
11

be used and I had a meeting with potential users of the software in order tointroduce the software and let them use it in order to find out further bugs andproblems with the software.
1.2 Structure
The second chapter is a very short introduction of mobile internet networks andsome well known protocols in that area since this project is going to be usedin a network support unit for SGSN-MME which is a very central module intoday’s mobile internet. We will take a look at the challenges ahead in orderto introduce fake headers into mobile internet protocols. In the third chapterwe will introduce our online packet analizer tool and later we will discuss itsdesign and implementation in chapter 4. Fifth chapter is a discussion on theefficiency of our header guessing method and finally in chapter 6 we will discussthe future works and possibilities of this tool.
12

Chapter 2
Mobile Internet and DesignIssues“Imagine wherever you have mobile phone coverage you are also
connected to internet; A connection just as fast as your connection
at home.”
The idea is fairly simple and the problem — at least on the surface — is clear. Infact Mobile Internet is no more than what the name suggests; We want Internetand we want it to be mobile. Meaning that we want to be connected while weare carrying our Internet enabled device; However, the main problems of today’sdesigns arise when we want to connect exactly the same way as we are connectedthrough fixed internet connections; With the same quality and speed. There arenumerous challenges ahead while trying to design and implement such a systemlike, Service Quality, Availability, Low price, etc... .
In fact mobile radio networks in the beginning were to transmit audio overradio channels and they were not intended to be used for data communicationlet alone Internet connectivity. The main concern in mobile radio was to utilize aradio channel bandwidth to carry audio signals along with some control signals.As we will see through coming sections the need for data transmission graduallystarted to emerge. From the introduction of SMS in 2G to fully packet switchedInternet connectivity in 4G we will see how mobile infrastructure starts to evolvein order to cope with this need.
Here in this chapter we will try to cover engineering efforts that led to today’smobile internet technology and possibly the future of it. In fact the history ofsuch efforts can be summarized to Zero, First, Second, Third, Forth and Fifthgenerations of mobile telephony. The point that should be mentioned is thatthroughout this chapter by interfaces between to modules we mean protocolsdesigned specifically for these devices in order to communicate. Interfaces can beconsidered as languages between two specific network devices. A large amountof application layer protocols are designed for these interfaces.
13

2.1 Mobile Radio Generations 0 and 1
0G is the first effort to have wireless communication. It was started after thesecond world war with introduction of mobile telephone service through whichcalls were set up by a wireless operator. Cell connectivity had not been intro-duced yet.
In fact in the beginning the use of designated protocols was not as extensiveand complex as it is today. Technologies used in 0G were PTT (Push to Talk),MTS (Mobile Telephone System), IMTS (Improved Mobile Telephone Service),AMTS (Advanced Mobile Telephone System), OLT (Norwegian for OffentligLandmobil Telefoni, Public Land Mobile Telephony) and MTD (Swedish abbre-viation for Mobilelefonisystem D, or Mobile telephony system D)[1]. These arenot protocols as we know them today but algorithms in order to multiplex andmanage the sending and receiving different voice channels with the least lossand distortion over radio carriers. Quite a few number of radio channels wereused in such systems.
1G was introduced after a number of standards developed in 1980’s[1]. Itwas the beginning of cellular mobile radio which is the base of today’s mobileradio design. 1G networks were still analogue and used to transfer voice usingFDMA technique. Here we try to expand on cellular networks since it is thefoundation of today’s mobile networks.
2.1.1 Cellular Mobile System
In order to have a cellular network four important items are necessary as illus-trated in Figure 2.1[3],
1. Mobile station
2. Base station
3. Mobile switching centre
4. Public switched telephone network (PSTN)[2]
Mobile Station is the device that connects the subscriber to the base sta-tion. An MS is composed of a user interface between the subscriber and thesystem and a radio unit which is able to connect to the base station[2]. Theuser interface is commonly composed of a keypad along with a speaker and amicrophone. As the mobile telephony has advanced in time this interface hasalso become more and more complicated. A common example of an MS is amobile handset or nowadays known as Cellphone.
Base Station is responsible to take the signal from an MS in its respectivecell coverage and transmit it to the switching centre via land line. This typeof transfer is done on a circuit switched basis. There is a bandwidth which isdivided into channels using techniques such as FDMA/TDMA and the wholeportion of the bandwidth is allocated to this transmission. There is no packetsinvolved but rather chunks of data or frames that are sent in time/frequencyslots.
Another important task in a BS1 is to detect the signal strength to recom-mend handoff if necessary[2]. The handoff is an important technique that was
1Base Station
14

Figure 2.1: Cellular Mobile Network
developed to make the moving of mobile station with the least loss of qualitypossible. There are two methods to transfer these type of control signals. Oneway is to dedicate specific bandwidth exclusively to transfer control signals an-other way is to insert silent periods in between the voice frames and transmitthese control signals inside those frames. This type of signalling is done muchmore efficiently in packet switched networks such as the internet using packetprotocols. As the need for data transmission increases the need for control sig-nalling also increases and this type of signalling as in 1G seems not to be themost efficient in terms of utilization and bandwidth.
Mobile Switching Centre is responsible to interface the mobile units and thefixed telephone network. It switches the calls coming from a number of BS’s.An MSC service area is the number of BS’s that it can serve. A PSDN is theconventional telephone network that treats the MCS as fixed telephones[2].
2.2 Second Generation(2G)
2G was a cellular telephony system that was installed based on the GSM stan-dard in Finland in 1991. Second generation is not designed for data commu-nication, however SMS was introduced into it. It is used in 212 countries andby almost 2 billion people around the world[1]. It uses two technologies namelyCDMA and TDMA. 2G was aimed to provide an increased voice clarity and re-duced power needed by mobile systems to operate on it. GSM architecture fol-lows the layerd OSI model. There are three major layers in GSM architecture[4],
1. Layer 1: Physical Layer which is radio transmission.
2. Layer 2: Data Link Layer for error free transmission.
3. Layer 3: Networking Layer to transfer call related messages betweenvarious network entities.
In Figure 2.2 the general GSM protocol stack along with the Interfaces betweendifferent network components can be seen.
15

Figure 2.2: GSM protocol architecture
In parallel to these improvements, the Internet on the other hand was tradi-tionally based on packet switched networks. This packet switched characteristicof the Internet facilitated employing enormous number of Protocols therefore therange of applications it could support was incomparable to Mobile Networks. Inan attempt to modulate and carry digital data such as packets over conventionalPSTN analogue systems and also to demodulate them in the digital receiversmodems were introduced. However, this is a point where Mobile Networks startto implement packet switched functionality besides their circuit switched naturein an attempt to support wider range of applications. 2.5G systems came afterintroduction of packet switched domain in addition to circuit switched domain.GPRS implements packet switched domain by the ability to establish and main-tain virtual channels rather than physical channels in order to transmit packetdata. This kind of connection accesses the radio channel only when a packetis being transmitted otherwise the physical medium is released to be used byother connections while the virtual connection is not disrupted and only goesidle and as soon as the next packet arrives the connection starts to utilize thechannel again. This type of connection is more efficient than conventional cir-cuit switched connections that establish a physical connection and occupy thechannel during the whole connection. However voice and SMS transmission in2.5G is still done using circuit switched connections. 2.5G was a step toward 3Gsystems[1]. 2.5G systems are officially defined as GPRS (General Packet Ra-dio Service) technology. GPRS supporting packet switched transmission, couldbe used for applications such as WAP, MMS, WWW and Email. Such packetswitched networks needed well defined protocols in the form of data chunks eachaccompanied with a proper header with addresses and ports defined, thereforethe need for packet analizing in mobile networks started to emerge.
In an attempt to reach higher data rates EDGE was introduced into GSMsystems. EDGE is in fact an enhancement on GSM systems which can be im-plemented on any GPRS enabled Network provided that the carrier implementsupgrades needed[1].
16

2.2.1 GPRS
GPRS is an attempt to add packet delivery functionality to conventional GSMnetworks. All the network elements is GSM needed to be modified in order tobe able to support packet connectivity[13]. There are two major enhancementsto GSM in GPRS which is adding two new modules for packet connectivity -SGSN and GGSN. The mobile networks with GPRS suddenly could support awide range of protocols. The protocol stack in GPRS is demonstrated in Figure2.3[13].
Figure 2.3: GPRS protocol stack
As is depicted in Figure 2.3 a mobile station can connect to the Internetusing IP connectivity. This connection is made through GGSN that works likea gateway and connects the internal mobile network to outside packet datanetworks like the internet. The GTP or GPRS Tunneling Protocol is a protocolintroduced in GPRS in order to make and maintain a tunnel from mobile stationto the nearest GGSN for internet connectivity. We will talk about this protocollater in coming sections.
2.3 Third Generation(3G)
3G emerged fulfilling the ITU IMT-2000 specifications[1]. 3G is based on anumber of standards such as UMTS – standardized by 3GPP – and CDMA2000– standardized by 3GPP2. It makes use of TDMA and CDMA and is compatibleto work with 2G systems. The advancements of 3G over 2.5G includes supportfor a wider range of applications such as, Video-conferencing, Web and WAPbrowsing at higher speed and IPTV support.
Such applications needed their respective protocols in order for their packetsto be transmitted in mobile networks. The introduction of HDSDPA into 3Gnetwork makes the 3.5G. It’s a mobile telephony protocol which is a smoothevolutionary path towards UMTS. The introduction of HSUPA is the start ofUMTS which is a quite evolved version of 3G[1].
17

2.3.1 Universal Mobile Telecommunication System(UMTS)
UMTS was standardized by European Telecommunication Standards Institute(ETSI).Later 3GPP took the role of standardizing 3G. Radio Access Network, Core Net-work, Terminals, Services and System Aspects and GERAN are the 5 important3GPP standardization areas. A UMTS network consists of three interacting do-mains,
• Core Network(CN);
• UMTS Terrestrial Radio Access Network(UTRAN);
• User Equipment(UE);
A UE is the same as MS in 1G except it should be 3G enabled. In UTRANthe base station is called Node-B and control equipment for Node-B is calledRNC. The core network is based on GSM with GPRS. Here we take a very brieflook at core network and its elements.
2.3.2 Core Network
The Core Network is divided to PS2(Packet Switched) domain, CS3(CircuitSwitched) domain and IM subsystem[5]. The most important core networkelements are illustrated in Figure 2.4[11].
The Home Location Register (HLR) is the location register to which a mobilesubscriber is assigned for record purposes such as subscriber information.[5]
The Mobile-services Switching Centre (MSC) constitutes the interface be-tween the radio system and the fixed networks. The MSC performs all thenecessary functions in order to handle the circuit switched services to and fromthe mobile stations.[5]
A Radio Network Controller (RNC) is a network component in the PLMNthat implements the functions of controlling of one or more Node Bs. Node Bis a logical network component which serves one or more UTRAN cells.[5]
The other two very important modules are SGSN and GGSN for which wewill have a short discussion.
2.3.2.1 Gateway GPRS Support Node (GGSN)
GGSN is a PS domain module that provides connectivity to external PacketData Network(PDN) – such as the Internet – using Gi interface. Interfacessuch as Gi in core network are groups of protocols used in order to transmitspecific data between two core network modules or to transmit information toouter networks. GGSN can be considered as a typical IP router that imple-ments additional functionality to support mobile connectivity. Such function-ality includes GPRS Tunnelling Protocol(GTP). GTP can dynamically adjustthe tunnel according to user’s mobility.[6] It is carried on top of SCTP.
2A “PS type of connection” transports the user information using autonomous concatena-tion of bits called packets: each packet can be routed independently from the previous one[5].This type of connectivity is called a connection-less service
3A “CS type of connection” is a connection for which dedicated network resources areallocated at the connection establishment and released at the connection release[5].
18

Figure 2.4: 3G Core Network
2.3.2.2 Serving GPRS Support Node (SGSN)
SGSN is a key core network element which provides PS related user-plane andcontrol-plane functions. In control plane these functions include GPRS MobilityManagement(GMM) and Session Management(SM) functions.
The SGSN stores two types of subscriber data for handling originating andterminating packet data transfer; GMM and SM information. When a mobileattaches to a PS i.e. to one SGSN, the SGSN establishes a GMM for thatmobile. Furthermore if a mobile establishes a new PS bearer the SGSN createsa new PDP Context.
The GMM context includes the mobile’s permanent identity (IMSI), it’s tem-porary identity for the PS domain(Packet-Temporary Mobile Station Identity,P-TMSI), the address of the Visitor Location Register(VLR) currently servingthe MS, information for authenticating the MS, etc.
The PDP context includes information on an established PS bearer, such asPDP address, the PDP type, the external PDN related to this PS bearer, etc.[6]
2.4 Forth Generation(4G) and beyond
4G is basically the extension in 3G technology with more bandwidth and ser-vices offered. The expectation for 4G technology is basically the high qualityaudio/video streaming over end to end Internet Protocols[1]. Internet protocolsin this technology will be the main method of connectivity delivering an almostfully packet switched connectivity for mobile devices built upon the mobile in-frastructure. LTE standard in fact was the step toward 4G mobile networks.
5G Technology stands for 5th Generation Mobile technology. 5G technologyhas changed the means to use cell phones within very high bandwidth. Nowa-days mobile users have much awareness of the cell phone (mobile) technology.The 5G technologies include all types of advanced features which makes themmost powerful and in huge demand in near future[1]. The discussion of 5G
19

technological expectations is beyond the scope of this report.
2.4.1 Long Term Evolution(LTE)
LTE was developed in 3GPP and more formally is referred to as Evolved UMTSTerrestrial Radio Access(E-UTRA) and Evolved UMTS Terrestrial Radio Ac-cess Network(E-UTRAN). One of the most important objectives of LTE is toimplement an all IP network in which the whole connectivity in the network ispacket based[7].
Figure 2.5: E-UTRAN overall architecture
As can be seen from Figure 2.5[9] an E-UTRAN is composed of eNBs. eNBsare interconnected with X2 interfaces. They are connected to EPC or morespecifically to MME(Mobility Management Entity) with S1 interface[8].
2.4.1.1 Mobility Management Entity(MME)
MME is the key control-node for the LTE access-network. It is responsiblefor idle mode UE (User Equipment) tracking and paging procedure includingretransmissions.It is involved in the bearer activation/deactivation process andis also responsible for choosing the SGW for a UE at the initial attach and atthe time of intra-LTE handover involving Core Network (CN) node relocation.It is responsible for authenticating the user[10].
2.4.2 SGSN-MME support
SGSN-MME (Serving GPRS Support Node and Mobility Management Entity)is a core network module with different responsibilities like maintaining a ses-sion for mobile connectivity to Internet during the period between opening andclosing a connection. It uses different routing algorithms in order to send andreceive packets through it’s interfaces. SGSN-MME uses some number of in-terfaces for IP connectivity. setting up these interfaces uses different protocolsand methods. Here in this chapter we try to make a brief description of theseinterfaces along with the protocols involved in it. Later we will move on toSGSN-MME support and give a short introduction of the nature of their work.
20

2.4.2.1 SGSN-MME and Protocols
As mentioned before there are numerous interfaces through which the core net-work elements are connected to each other. In order to setup these connectionsa number of interfaces are introduced in SGSN-MME. These interfaces include
• Gn Interface to connect SGSN-MME to GGSNs and other SGSN-MMEswithin the same PLMN.
• Gb Interface to connect to BSCs.
• Gp Interface to connect SGSN-MME to GGSNs and SGSN-MMEs inthe other PLMNs.
• Gr Interface to connect SGSN-MME to Home Location Registers (HLR).
• S1-MME Interface to connect SGSN-MME to eNodeBs which are inturn connected to UE.
These are only some examples and there are many such interfaces. In order toimplement these interfaces a large number of specific protocols are designed. Forinstance when a user wants to start a session4 SGSN creates a PDP Context onbehalf of the user. The MS sends a request to join a PDN. SGSN-MME – afterauthenticating it – will establish a virtual data network between that MS and thePDN. SGSN-MME uses the GTP (GPRS Tunnelling Protocol), an applicationprotocol to set up and dynamically change the settings of the MS connection tothe PDN. S1-MME interface as another example is an application layer proto-col that connects SGSN-MME to eNodeB. S1AP (S1 Application Protocol) isthe type of messages transferred in this connection and NAS (Non-Access Stra-tum) are transferred between SGSN-MME and UE. S1-MME transfers S1-APmessages over SCTP (Stream Control Transmission Protocol). SCTP itself isanother transport layer protocol. S1AP being an application protocol carrieson top NAS Messages which is another application protocol. In Figure 2.65 youcan see an overview of the different protocols used to interface MME only.
There are many protocols involved in SGSN-MME alone. SGSN-MME is amobile network module that connects mobile nodes to the internet. Taking intoaccount all the protocols in the Internet today helps to imagine how diverse theinput types to a packet analizer can be.
2.4.2.2 Support Unit
In SGSN-MME support unit, engineers should find the faults and bugs in themodule. the debugging process requires them to perform extensively the taskof dumping the hex bytes from interfaces and inspect them packet by packet tofind the anomalies in regular network procedures. There are devices to dissectthese bytes in massive scale – and as they are being generated – but it happensquite a lot of times that these bytes cannot be dissected properly therefore theyappear in trace files as hex bytes rather than meaningful packets. The situationgets critical when there is an emergency call and they have to find a fault thathappened in a module that is put to work for a costumer. In such circumstances
4Starting a session can be considered as connecting to the Internet5Picture taken from Ericsson internal documents
21

Figure 2.6: The S1-MME protocol stack
a tool that can take these bytes and do the cumbersome task of guessing absentheaders and dissecting the bytes into correct packet representation is of greatbenefit.
2.5 Wireshark
With the emergence of packet switched technology in mobile networks there isan increasing demand for powerful packet analizing methods and tools in thisarea. There are some number of packet analyzers in use today. tcpdump6,netsniff-ng7, Wireshark8 and a lot of other packet sniffers9.
We preferred Wireshark for this work for some reasons,
• Wireshark’s license is BSD GPL10 which means it is free and open source.
• Wireshark is a software with a lot of capabilities and features and a com-fortable GUI that we have imitated in our online web form for the sake ofintegrity. Furthermore a huge number of programmers from around theworld are still working on it and updating it for the newest technologiesand protocols.
• Wireshark is also being updated inside Ericsson and by Ericsson develop-ers for the new technologies that Ericsson is using.
A screenshot of Wireshark GUI is depicted in Figure 2.7[12]. Wiresharkincludes in its package some number of programs.
6http://www.tcpdump.org/7http://netsniff-ng.org/8http://www.wireshark.org/9In Wikipedia there is an article about this under the title of “Comparison of packet
analyzers”10For more info on free licences check http://www.gnu.org/licenses/license-list.html
22

Figure 2.7: A wireshark screenshot
2.5.1 Text2pcap
In order for Wireshark to work you have to feed it with a proper file format i.e.“.pcap”. text2pcap converts a properly formatted text file with all the hex bytesin it into a capture file that can later be fed to Wireshark.11 text2pcap is a partof Wireshark distribution and is available in Wireshark download package.
2.5.2 Tshark
Tshark can be considered as the engine of Wireshark. Tshark can print theresults in terminal as well as generating them in all kinds of useful file for-mats.12 In other words Wireshark is enhanced tshark with a rich GUI. As wehave implemented our own HTML web form we only need Tshark rather thanWireshark.
Tshark takes as input a “.pcap” file format and generates the results in theform of a number of file formats like,
• Text; Which is a human readable text of the summary of the packet. Weused this to out put the summary of the packet in our form.
• psml; Packet Summary Markup Language. An XML format of the sum-mary of the packet information.
• pdml; Packet Details Markup Language. An XML format of the Detailedinformation of the packet as is displayed in Wireshark output. We usedthis to generate an HTML page containing a wireshark-like GUI with allthe packet details.
11http://www.wireshark.org/docs/man-pages/text2pcap.html12http://www.wireshark.org/docs/man-pages/tshark.html
23

Chapter 3
Online Packet Analizer
In network support and maintenance as the nature of their work implies, thereis an extensive need for analizing packets in the network. A big part of whatthey do is to dump the raw hex data from connectors and see actually whatis going on. These dumps are of course not easy to read for humans and theyneed to be dissected into human readable text. There is a number of PacketAnalysers that are used today for this purpose. We mentioned some of them inprevious chapter. They listen to the network interfaces and sniff the data anddisplay them in packet format. They can also take an input file of previouslydumped data in a proper format(e.g. “.pcap” for Wireshark) and display themjust the same way. All packet analizers come as software packages and can beinstalled and used in PCs. However the core of this project is to implement anonline packet analizer which can be accessed through web. We have also addedvarious features to this online packet analizer.
3.1 Requirements
OPA is supposed to be a web page i.e. a URL through which you can access theservices. The first idea in the beginning was to have a server that could receivea stream of hex data and analize it and dissect it into human readable packetrepresentation and return the result back. Furthermore the server should be ableto return some relevant information about the packet. The requirements werealmost clear and straightforward but there was nothing more on how it shouldlook like or how should it operate nor any framework in which the softwareshould be implemented. After discussions and a little research the followingminimum requirements were decided,
1. User friendly input interface; The server should be able to receive queriesthrough an easy to use interface.
2. Wide range of protocol support and flexible ability to dissect any kind ofmeaningful hex stream; The server should be able to dissect the hex streaminto correct packet representation and announce the results as detailed aswireshark does.
24

3. Flexible smart and intense database of side material; The server shouldbe able to keep a database of the correct examples of network proceduresand return those correct examples in a Useful setting beside the results.
4. User friendly output interface; The server should be able to represent theoutput in an easy to read, use and understand manner.
It is notable that these are minimum tasks that the server at least should beable to perform. Of course there are many possibilities for adding extra featuresto the system.
3.1.1 Query Submission Method
The user query submission should be very easy to use. The scenario wouldbe like the user is looking at a hex dump and he/she needs to know what itrepresents on the go. Therefore it will only take a copy and paste of the datafrom any screen into the text box in input form and submit it. In fact it ispossible to copy and paste any piece of text and the software will search forany relevant patterns of hex bytes and tries to dissect them provided that it isindicated if the data has offset numbers or it is just raw hex dump. This inputmethod was developed having that in mind that if the user encounters a hexstream he/she will want to know what it represents so he/she might just copythe text from any console and paste it. The software should be as robust aspossible since in many cases the hex stream is embedded inside a lot of otherirrelevant text. Therefore looking or a hex stream and copying it might becumbersome for human eye.
The update database part should be easy to use and it should take all therelevant information in an easy way. There should be a part to enter a shortdescription of what the database entry is about and it should accommodate thecapture sample file to be assigned to the entry. It should also be quite easy todelete an entry.
3.1.2 Protocol Support
One important issue is the hex dumps that are uploaded to the web page. Thesehex dumps are generated using all kinds of packet sniffing devices and later havebeen manipulated in all kinds of ways. For instance some hex dumps are selectedfrom an already dissected packet data and there is no useful information of whatthey represent or what kinds of headers are stripped off. The software shouldbe flexible enough to add all the necessary information to the hex dumps makea packet that can be dissected and display it.
3.1.3 Database
When a support engineer debugs a bogus procedure he/she does not have inmind the correct sequence of all the packets involved in the procedure so it willbe of a great use if a correct example of the possible procedures that involve thatpacket be displayed along with the dissected packet. This raises the need to havea database. These procedures are numerous and highly complex. Furthermoreeveryday might rise a need for a new procedure to be added to the database.
25
Therefore the database should be dynamic rather than a static repository ofsample capture files.
In order to manipulate and update this database we need a login systemto allow trusted users to add or remove or change these samples. These usersshould be aware of what type of description they assign to the procedures sothat they can later be searchable using proper tags. Such type of administeredaccess to database is a direct result of the need to update the database regularly.There is no sign up form for this log in system since we do not want to givethe privilege of administration to more than 3 users at a time. Therefore thesign up procedure would be to send a request to the maintainer of the code andhe/she would manually add the required username and password to the accesslist.
3.1.4 Output Interface
The output should be as easy to use as Wireshark. In other words the packetrepresentation should be displayed in a way that users can fold and unfold thedetails and study all the elements in the packets easily. It should also displaysome samples of the procedures that might involve this type of protocol. Theseinformation should be easy to access and there should be a download part sothat users can download their capture file that was generated during the processfor later use.
The database should have comfortable search options to brows through theprocedures. It should be able to display the procedures in HTML format as wellas the ability to download the capture file into the local hard drive.
3.2 Constraints
There are a number of constraints in dealing with the problem. Some constraintsrise from the very nature of the problem and some of them are the result of theenvironment in which the software is supposed to operate. The first thing toconsider in any design is that what kind of platforms are we expecting oursoftware to run on. In our project we have a server which runs on Linux1. Theweb server is Apache2. Users should be able to connect to the server from theirsystems from all kinds of OS or web browsers. In our design we tried to use themost controversial HTML and Perl features so that it can be compatible withalmost all systems and browsers. In some cases we used some features that wasadded later to aforementioned languages.3
3.2.1 Processing Complexity
This service will be run on a server along with many other processes. Thereforewe have a limited processing power that we can utilize. Therefore we should keepthe processing complexity as low as possible. Reading the input text for examplecould be smarter but it would put huge burden on the processing complexity
1More specifically we started with a Red hat Linux server only for development purposes.We will move on to another system the soon our software is ready to be used.
2Apache 2.2.3 but we will move to another system3Like use of iFrame in HTML that was added later and was not supported by many browsers
long ago but we believe most of today’s browsers support them all.
26

of the program that we cannot tolerate. Even after extracting the proper hexstream there are bigger issues in processing complexity. As was mentioned in theintroduction we need to guess the write headers to be added to the hex streamso that it can be dissected. Designing an algorithm to guess these informationis processor intensive as well. Time complexity of such method is rather highand it appears to be the bottleneck of our system. However in chapter 5 wetake a deeper look at the method we used for improving time complexity of thismethod.
We will have to access the hard drive many times during the operation.Tshark and text2pcap read from files on the hard drive and therefore we haveto save the results of every step onto the hard drive in order for them to beusable by these softwares. This amount of access to the hard drive is not themost efficient and reliable but again we can tolerate it since the number of theseaccesses are linear and they do not grow with the size of input.
3.2.2 Code Complexity
The code for this program needs constant maintenance. As the next person tomaintain the code could be some one other than the coder himself the code flowsshould be easy to understand. However the nature of some algorithms used inthis project requires complex coding. This complexity might cause the softwareto be hard to maintain. However, we tried to use clear variable names and easyto understand code flows to make it as simple as possible to trace. Furthermorewe even sacrificed some features for the sake of simplicity of the design. Forexample updating the HTML form dynamically or showing the results at thesame page as the input form made the design quite complex while it was notreally crucial for the requirements.
27

Chapter 4
Design and Implementation
We chose Perl1 CGI scripting to write the program since all the other Programsand functions on the server are implemented with Perl, so for the sake of integritywe chose to write in Perl. Furthermore since there are many scripts in theweb server running on Perl we already had a rich collection of libraries andinterpreters installed on the web server for Perl. Perl is also a very powerfultool for handling text (As we need it in our project) through regular expressionsand string manipulation functions. Our whole design can be summarized intothe following stages,
1. User submission.
2. Processing the input and generating the results.
3. Displaying the results.
4. Login system.
5. Database search and update.
4.1 User Submission
The flow of the code for accepting and processing the user queries and displayingthem is as the following
d e l e t eO l d f i l e s ( ) ;i f (defined $uploadedFileName ){
getTheUploadedFile ( ) ;}else{
getTheBytes ( ) ;}
1http://www.perl.org/
28

convertToPcap ( ) ;ReportBack ( ) ;htmlAnounce ( ) ;l o gA c t i v i t i e s ( ) ;#$
First we check if there is a file uploaded or the bytes are pasted into text box.After retrieving them we store them and go to next step which is to format inputand prepare it to be fed into text2pcap. In this step a file with extension “.raw”is created to keep the original user input. Here in getTheUploadedFile() we savethe file into “.raw” or in function gettheBytes() save the text. In get functiongetTheBytes() we run the algorithm to extract the meaningful hex stream fromthe input text. In this step we need to know if the bytes are raw hex dumpsor offsetted bytes. The result of this step is kept on the hard drive inside afile with extension “.fmt”. This file is the proper format to feed into tex2pcap.Next step is to convert the file into “.pcap” format.
4.2 Processing The Input
In this step we need to generate capture file and – using that capture file – togenerate actual output in form of packet representation. Imagine that user hasuploaded a hex dump of SCTP header and all the other headers are stripedoff already. In order to make a proper “.pcap” file we need to add a fake IPheader as well as a fake Ethernet header on top of it. So what we need is to calltext2pcap with an option to add fake IP header2 like the following,
text2pcap − i 132 $ inpu tF i l e $outputF i l e ;
“-i 132” in the above command means that text2pcap should add an IP headerwhich encapsulates an SCTP header. That explains the need to have the radiobutton list and prompt the user to choose the type of protocol.
But as mentioned before we still do not know which header is absent. Thisis handled in convertToPcap function. In order to deal with this we start withtesting the hex dump by adding headers one after another and see which onedissects the packet as we expect. Imagine the SCTP scenario again. Uponreceiving the input we have to try it as it is first. If the result from tshark isnot relevant to SCTP we will add Ethernet header and try it again if the resultwas not relevant we add IP and so on. There are some considerations on how toprioritize these headers and which header to add first in order to converge to asolution as fast as possible. We will take a look at these methods in discussion.
During this process a “.pcap” is created and the actual packet is generatedwith tshark. The only thing we need to do is to save it in a text file. Savingthe result is done inside ReportBack() function. We make a “.txt” file of thesummary packet in report back as well as generating a “.pdml” file. All thesefiles will be published in the results page for the user to download them.
2text2pcap will add the fake Ethernet header automatically
29

4.3 Displaying The Results
The function htmlAnounce() makes an HTML form and displays all the infor-mation generated. We use the “.pdml” file in order to display the results ina wireshark like HTML format. We have a pdml2html file containing a Javascript to transform our PDML file into an HTML web page to display in outputscreen. For every query there is a pdml file created in XML format. In order todisplay it we copy this pdml to the html3 folder of the server. Then call it upondisplay. There is a small consideration when we make the pdml file name byappending the time of the day as well as the process id. This ensures a uniquefile name in case that there are couple of queries in close succession, eliminatingthe danger of two processes writing into the same file. We also use the packetsummary generated with tshark and display it. All warning messages are alsomade and displayed in the output form.
4.4 Login System
There are numerous network procedures and they are evolving as the new tech-nologies appear. Therefore we need a method so that privileged users can addand delete sample capture files of these procedures from the database. In orderto handle administered update of the database we have made a login system.This is a login page that takes the username and password then matches it witha list of username password pairs to allow access. This list is updated manuallyand there is no sign up system. This list is not coded or scrambled in any wayand it is plain text. In turn we highly control the access to this file. This pageis only one CGI file and it redirects to itself in cases that there is a problemwith login. Problems such as no username or password provided or incorrectusername and password combination.
4.5 Database
The Database update flow is quite straightforward. The update form appearsafter login. It checks if the entry is already submitted then adds it to thedatabase. This update consists of saving the sample capture file into the harddrive then adding entry’s name along with the description and tags assigned toit inside a file.
In order to generate tags we use the procedure name provided by the user.Then we tokenize the description and extract the words and use them as tagsas well. We exclude the very common words4 from the tag list so that theprocedure will not be included in irrelevant search queries.
4.6 Handling Files
In order to make files we have appended system time with “seconds” precision.One issue in handling files is that if two consecutive requests are sent to theserver and two instances of the script are run in less than one second then the
3Or it can be htdocs folder as well4These words are called Stop Words in the literature
30

file names are the same resulting in two processes writing into same files. Inorder to solve this we have appended the process ID along with system timeto the files to make sure that files generated by different instances of the scripthave different names. Taking this approach in the design we can be sure thateach instance of the script makes files that are unique to that instance only andtherefore is secure from other scripts making changes to them.
There are a lot of files generated during the running of the program. Wecan delete the files instantly after the execution of the script but as mentionedin requirements part, we need to keep them for a little while so that the usershave time to download their results file. These files pile up and occupy a largeportion of the hard drive after a while. Therefore we need to get rid of themoccasionally. We decided to remove the files that are older than 15 minutes.There are couple of approaches to do so.
• To write a Perl script to delete files and set up the system5 to run thatscript in every 15 minutes.
• To write a Perl script and make it run forever and delete the files every15 minutes.
• To make the main script to handle the job somehow.
The problem with the first approach is that we become dependent on systemresources that we cannot trust thoroughly. In real world servers there are manyrestrictions and updates of the policies and restarts that you cannot rely on theon-schedule running of your script. Furthermore, on the servers that differentpeople are running different jobs you are never sure if your scheduling is secure.
The second approach does not have the problem of being dependent on thesystem resources but on the other hand you are keeping a process running forever hence misusing system resources most of the time. This approach is alsonot secure to interruptions by third parties.
We took the third approach as we believe it is the most robust way of doingsuch a thing. As someone sends a request to the server the script is run once, wecheck for all the files and if they are e.g. older than 15 minutes in our case wedelete them in the very start of the script. In this manner we make sure when auser starts its job on the server there are no old files there. This approach hasthe problem of not deleting the files if no one visits our web page. But we neednot to worry about that since once the script is invoked again it will make sureto clean up the hard disk.
This system can be modeled as an M/G/∞ queue. A queue with Poissonarrivals and a general distribution of the service time and infinite number ofservers. Assume that the holding time for every file is T . Therefore the servicetime for every job is T . In other words µ = 1/T . The arrival process is Poissonwith rate λ. Our actual number of servers – slots available on the hard drive –here is K rather than ∞. Therefore we are fine as long as there are k ≤ K filesin the queue. We would like the probability of our server being in state PK orabove be less than 0.01. This way we can guarantee the longest T for keepingthe files on the disk while the probability that the disk gets full is less than 0.01.
In other words we wantK∑
0
PK ≥ 0.99 at all times.
5In Linux setting up a “cron job” will do that.
31

To estimate λ at nth invocation we can consider the exponentially smoothedmeasure of the interarrival time – t – between two consecutive invocations fromthe following formula,
tn = αt+ (1− α)tn−1 (4.1)
α is the smoothing weight that can be 0.01 in our case. Now at the nth invocationwe have λn = 1/tn. As K is not a very well defined value we have to estimateit. From the different input sizes considered in many test queries an averagevalue of 3.7 MB per query could be a good estimate. Using this estimate andconsidering B as the total memory size considering K = B/3.7 would be arelatively good estimate.
On the other hand, we know the steady state probability that the queue isin state k is,
Pk =ρk
k!e−ρ (4.2)
Therefore we haveK∑
0
ρk
k!e−ρ ≥ 0.99 (4.3)
We solve this inequality for ρ = λ/µ which in turn can be solved for µ = 1/T .Hence if µ ≥ m therefore T ≤ 1/m. Considering the left hand side of 4.3 asB(K). We can also calculate B(K) using the following recursion,
B(K) = (1 +ρ
K)B(K − 1)−
ρ
KB(K − 2) (4.4)
Where,B(0) = e−ρ (4.5)
B(1) = (1 + ρ)e−ρ (4.6)
4.7 GUI Design of OPA
Online Packet Analizer is a web page with the Interface as depicted in Figure4.1. There are 2 methods of uploading input to the website. To copy and pastethe hex data as text into the text box provided in the form or to upload a textfile containing the hex data using upload file section in the form are the twomethods of query submission. All the characters other than hex numbers willbe ignored from input. The interpreted characters as input data are “0” to “9”and “a/A” to “f/F”. Many delimiters can be inserted in between the actualhex data(e.g. delimiters like , or ;) freely since they will be ignored. No needto mention that if one inserts one of the before mentioned hex representationcharacters inside the hex stream they will be counted as relevant input hex dataand hence leading to erroneous results. The input will be scanned for relevanthex streams offsetted or raw. The radio buttons at the bottom of the page are tochoose between raw or offsetted format. These streams will then be forwardedto be processed. We have put the option to upload a file containing hex dumpsas it is quite common to have the hex dumps on a text file. Imagine the userhas received a hex dump in a text file. It is quite comfortable to upload thewhole file at once. The user also have to specify what top level protocol her/hishex bytes represent. There are protocol options to choose from on the list at
32

Figure 4.1: OPA input form snapshot
the top of the web page.6 The user can also request the results to be sent tohis/her Email by providing an Email address at the bottom of the page.
After submitting the input the packet representation of the hex dump will beshown as a result. As is illustrated in Figure 4.2 at the top there is a wireshark-like list of the details of the packet. the user can brows through the details byopening and closing the tabs in the form. In the text box under the wiresharkwindow a summery of the packet is provided for a quick look. At the bottomof the page there are links to download some types of output files that weregenerated from the results. The user can download a plain text file containingpacket summery. It contains exactly the same text shown in the text box. Thecapture file is also available in case one wants to open it in wireshark. A PDMLfile is also available which is the XML representation of the packet details. Thereferenced hex stream can also be downloaded which can be used as input totext2pcap program. At the bottom of the packet details window there is awarning message. It indicates that the Ethernet header is a fake header. In factif any header was added by the program there will be a warning indicating it.We discussed fake headers in previous sections.
From main form the login system can be accessed to login to database. Thelogin system as is shown in Figure 4.3 gives the advantage of manipulating thedatabase to qualified users.
After logging into database there will be a form like in Figure 4.4 throughwhich the data base can be updated. First item in the form is a name to choose
6The need to specify the protocol will be discussed further in coming sections.
33
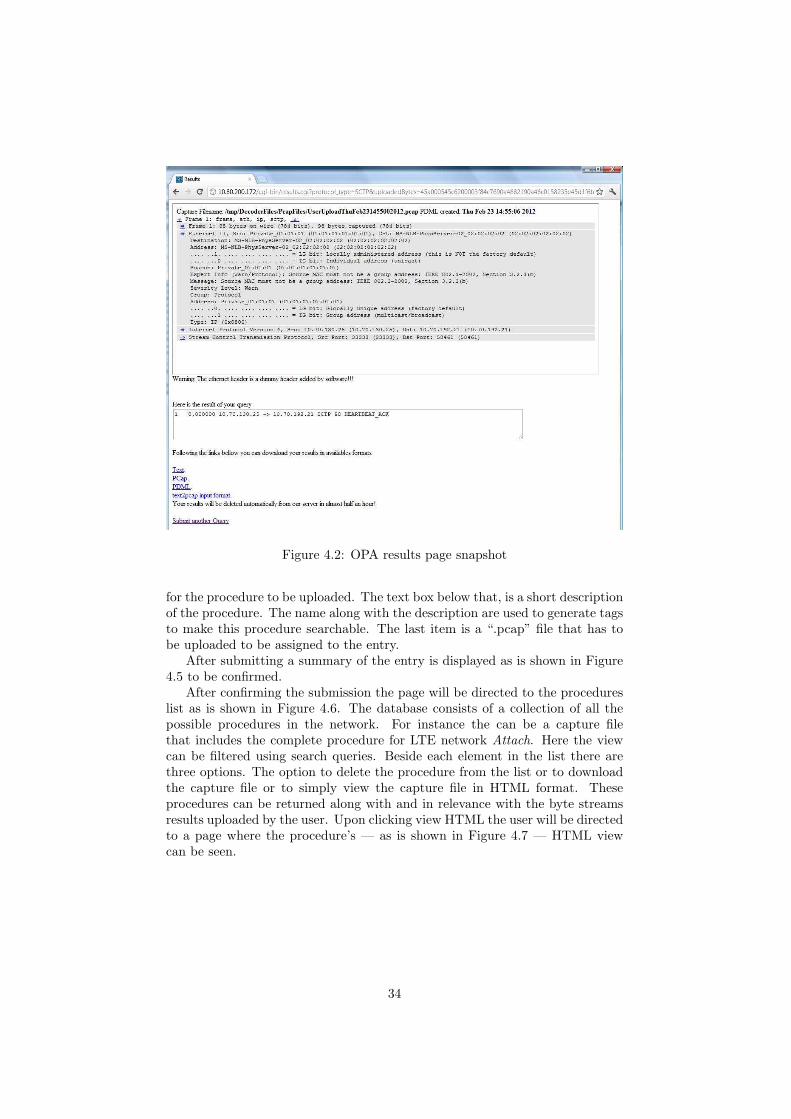
Figure 4.2: OPA results page snapshot
for the procedure to be uploaded. The text box below that, is a short descriptionof the procedure. The name along with the description are used to generate tagsto make this procedure searchable. The last item is a “.pcap” file that has tobe uploaded to be assigned to the entry.
After submitting a summary of the entry is displayed as is shown in Figure4.5 to be confirmed.
After confirming the submission the page will be directed to the procedureslist as is shown in Figure 4.6. The database consists of a collection of all thepossible procedures in the network. For instance the can be a capture filethat includes the complete procedure for LTE network Attach. Here the viewcan be filtered using search queries. Beside each element in the list there arethree options. The option to delete the procedure from the list or to downloadthe capture file or to simply view the capture file in HTML format. Theseprocedures can be returned along with and in relevance with the byte streamsresults uploaded by the user. Upon clicking view HTML the user will be directedto a page where the procedure’s — as is shown in Figure 4.7 — HTML viewcan be seen.
34
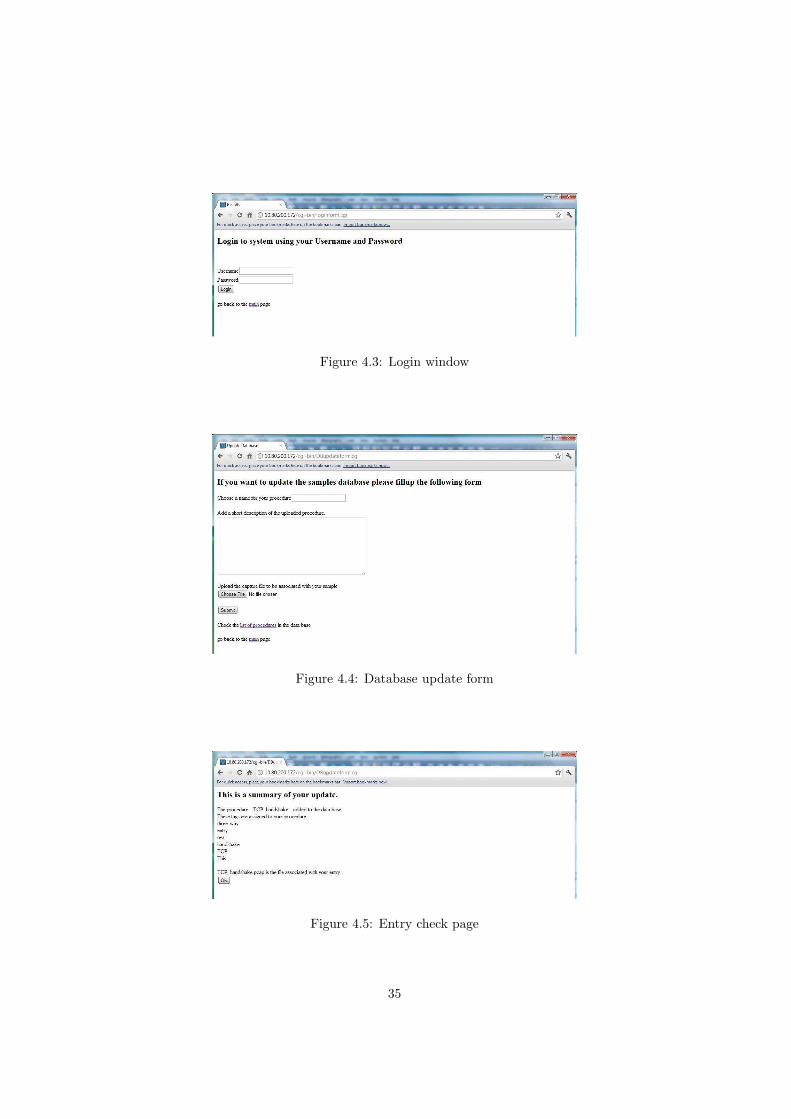
Figure 4.3: Login window
Figure 4.4: Database update form
Figure 4.5: Entry check page
35

Figure 4.6: Procedures list page
Figure 4.7: HTML view
36

Chapter 5
Performance Improvements
In the previous chapter we mentioned an important constraint of our system;The fact that the we do not know which header is absent. Taking a closer lookwe can see that there can be at least 5 different absent header types,
1. No Header is absent
2. Link Layer Header is absent
3. Network Layer Header is absent
4. Transport Layer Header is absent
5. Application Layer Header is absent1
The naive approach to the problem is that regardless of any extra information,every time we check all the headers in the same order.2. Remember that foreach try we have to have at least 2 system calls which is a very time consumingprocess. Therefore avoiding any system calls can save us a lot of run time.
One way to improve the performance is to consider somehow the history ofthe headers submitted before, hoping that any upcoming queries might probablybe of the type that has been uploaded most. In order to investigate the effec-tiveness of our approaches we imagine for now that we have an infinite memoryto hold all the running history of the software.
Taking this idea the question now is how to prioritize the headers in the queuethat are waiting to be tried so that the number of tries (system calls) becomesminimum. We take three major prioritizing policies and compare them to seewhat difference they make.
1. Always try headers in the same order. (Naive approach)
2. Always try the header that has happened most in the first place then theheader with second most occurrence and so on. (Hard priority)
1An application that carries a higher layer application and we only have that higher layerheader
2In a uniformly distributed space of queries with the same probability that any of the aboveheaders are absent(which is not so realistic) we still have a first try hit rate of almost 20%
37

3. Try the header that has happened most with higher probability than oth-ers. (Soft Priority)
We examined these three approaches by generating queries with differentsequence patterns of absent header. Let L be the number of layers. A packetcould start with lth layer which is 1 ≤ l ≤ L. In our first example we generatedpackets that could start with Ethernet or IP or SCTP or Diameter – which isan application layer protocol. These packets could be of types 1 ≤ l ≤ 4. In ourfirst input pattern we generated 100 input queries with uniformly distributedamounts of packets with absent headers3; Which means P1 = P2 = P3 = P4 =0.25. Figure 5.1 depicts the cumulative distribution of the system calls for 100input queries using three approaches.
In Soft Priority each time we pick a random header from the list accordingto the distribution Ps(Ln) and try it. if it is not the right header we removethe element from the list and redefine our distribution. Ln being the randomvariable assigned to our headers in nth try we can define the distribution in eachtry according to the following formula,
Ps(L0) = NL/NT (5.1)
Ps(Ln) = Ps(Ln−1)/(1− Ps(Ln−1)) (5.2)
NL is the number of occurrences of type L header and NT is the total numberof items in the history.
Figure 5.1: Cumulative number of system calls for uniformly distributed input
As can be seen in the figure in uniformly distributed case there is not muchdifference between these three approaches. We could expect this since in uniformcase there are almost the same amount of packets of all kinds received in thehistory at any given time therefore our prioritizing policy makes no big changein the order that the headers are to be tried. However every now and then thatthe two or more consecutive queries happen to be the same type the slope ofthe diagram tends to decrease in case of soft and specially hard priority.
We repeat the experiment but this time our input query sequence is biased onone type. In the other words there is a 50% chance that the input is of type 2 at
3We tried with a Diameter protocol packet and the input queries consisted of this packetwith absent LinkLayer or absent Internet or absent Transport or a complete packet with noheaders absent.(As the nature of the packet suggests we could not include a packet with absentapplication layer header but it makes no big difference in our conclusions of the study)
38

any given time. The result of the repeated experiment with 300 inputs for eachapproach is shown in Figure 5.2. The interesting phenomenon in this diagram
Figure 5.2: Cumulative number of system calls for biased input
is that in the beginning all three approaches are more or less the same. But atsome point(around 150) Hard priority begins to show a better performance. Thereason is that as the inputs’ history is accumulated in the memory the numberof type 1 record becomes more and more significant comparing to other threetypes. In naive approach it makes no difference since we do not prioritize butin the hard approach the number grows farther and farther from the numberof other input types and it is stuck to the top of the list and is always chosenfirst and good for us that in 50% of input queries it is actually the right choicecausing the number of system calls to drop. The Soft priority approach is alittle tricky. In this case we still prioritize according to the history and half ofthe buffer is populated with type 2 packets but still in every decision in case oftype 2 inputs there is a 50% chance that we do not choose the type 2 headerand this makes the system calls to grow4.
In real world applications it is quite probable that for a long time the inputremains the same type or equivalently one user might send a big amount of thequeries of the same type. In the Figure 5.3 you can see the behaviour of thethree approaches in regard to this phenomenon. Here in each approach we havefed the software with 100 queries of which the first 30 are of the same typeand next 70 are of a different one. As can be seen from the figure in Naiveapproach the slope is the same since the input type is the same and after 30 theslope changes since the input type changes. In Hard priority approach the sloperemains the same until 30 and is much less than Naive approach since in thiscase this type of header comes first with absolute priority. After 30 the inputtype changes but it is still the second priority in the list since there is still arecord of 30 inputs of the previous type in the history. That explains the biggerslope right after 30. It goes on until there are 30 instances of the second typeare submitted, which happens at iteration 60, now the number of the secondtype overcomes the number of the previous type and it goes to the top of thelist and the slope decreases to what it was in the first place. In the Soft priority
4One point is worth mentioning. As the diagram shows Soft priority and Naive approachesare more or less the same in terms of efficiency but this is not true. As in Naive approach wemake a list and this list remains the same forever the more populated input type (in our casetype 2) might be somewhere at the top of the list and this might cause the naive approachseem to have less or equal amount of system calls.
39

Figure 5.3: Cumulative number of system calls for same type inputs
approach the diagram shows a smoother path. Taking a closer look you cansee at 30 the slope starts to increase but it is smoothed out and reaches thedesired slope fast. However the overall amount of system calls is slightly morethan Hard approach since we give less chance to the top priority packet to beactually tried first(like in Hard approach).
The difference in behaviour of Hard and Soft approaches is a very importantremark. We illustrate the importance of this difference in Figure 5.4 in whichwe repeated the same experiment but in a longer run; With 350 input queries ofwhich 150 are the same type and the rest are of a different type. As you can see
Figure 5.4: Cumulative number of system calls for same type inputs in the longrun
in the figure the Soft approach outperforms the Hard approach when catchingup to replace the top priority in its list at iteration 250. However later on Hardpriority catches up near 350 and becomes better again.
This behaviour illustrates an example of an undesirable phenomenon inwhich when there are a lot of requests for one type its record outnumbers othertypes and it becomes stuck at the top of the list while there is no more requestfor it. This is a fundamental problem with Hard priority approach. In case ofsoft priority approach this problem is smoothed out by providing a chance toother types every now and then to become top in the list. Taking this approachthe top priority record is more reluctant to becoming top in the priority list andtherefore its count becoming significantly bigger than other types in the history.
40

In fact the problem becomes even more severe when considering irregular inputsequences due to frauds or mistakes. In such cases the software can be madeto accommodate very large and different records. In those cases the items inpriority list are fixed in their places in Hard approach and our algorithm can dono better than in Naive approach.
This problem can be viewed as being the result of keeping a too long historyalso. In fact the history expires after a while and we should only take intoconsideration the relevant and new data to decide on the type of next input.furthermore, recall that we considered to have an infinite buffer to keep therecord of all previously submitted enquiries. Well, this is not the case in realityand we have to consider a buffer size to keep some limited amount of historyto use in our algorithm. Considering the problem with Hard priority as beinga result of keeping too much history, we can define a buffer size. A very shortbuffer — e.g. to decide only on the last result — would lead to ignoring a largeamount of useful information and it becomes pretty much like the case with nobuffer but resolves the problem with Hard priority. A very large buffer providesa more insightful decision on the next type to be expected but again suggeststhe problem with Hard priority.
From all the discussions before we should take into consideration two veryimportant criteria that affect the performance of our system,
• Fast response to highly frequent changes in input pattern. Meaning thatit shouldn’t take so long for the software to decide if the input type haschanged thus it should come higher in priority list.
• Fast response to less frequent changes in input pattern. Meaning thatdespite having a long history of one type – say A – In case of receivingtype B the software should be able to converge fast into reordering thepriority list so that type B comes up in place of type A.
In order to elaborate more on this issue we should consider another importantfactor as well. These diagrams so far show the overall performance of our systembut what we really are interested in is the user experience of the response timeof the system. The four diagrams in Figure 5.5 show the performance of oursystem in terms of the user satisfaction and cumulative number of system calls.These are two experiments with 350 inputs for which a history window size of300 is used. In Figure 5.5(a) you can see the system’s performance with aninput pattern of 50% of type 2 packets dispersed among other types. In Figure5.5(b)5 you can see the system’s performance with an input pattern of 150 typeA packets in a row followed by 200 of type B. Using these two diagrams wewill try to investigate the performance of Soft and Hard priority under twoaforementioned criteria.
As is shown in the figures, Hard priority works better in highly changingtraffic; Since it can assign priorities so fast and replace the higher with the onebelow. But in Soft priority approach the real higher priority type gets only 50%chance of being chosen first. However in the second experiment Soft shows abetter performance since it did not allow the higher priority record become sobig so that it takes a long time for the new packet to replace it on top of thelist; What happened actually to the Hard case.
5We have eliminated the diagram for Naive approach since its scales were relatively biggerand made the other two diagrams’ difference appear vague.
41

(a) 50% biased input (fast changing traffic pattern)
(b) packets of the same type (slow changing traffic pattern)
Figure 5.5: Comparison of the performance of Hard and Soft priority in responseto slow and fast changing input pattern
Furthermore from Figure 5.5 you can see a measure of user satisfaction.This diagram shows the distribution of the number of system calls during eachexperiment. In other words you can see that for example in the first experimentaround 190 users (out of 350) experienced a delay equal to 2 system calls in theHard approach comparing it to around 100 users in the Soft approach or 50 inthe Naive approach. You will see later a summary of these information in table5.1 and 5.2.
The above observations bring us to a third approach which is a compromisebetween Hard and Soft approaches. We need a dynamic algorithm that Hardprioritize the list in case of highly fluctuating traffic and Soft prioritize in caseof a large number of requests for the same type of input. In order to reach forsuch a method we need to consider our prioritizing approaches from a differentpoint of view. When we have a fluctuating traffic with a biased probability oflet’s say type 1 traffic be 50% we are actually expecting 50% of our buffer tobe populated by type 1 packets at any given run of the program. It meansthat if for any reason the traffic pattern changes and becomes biased to anothertype we have to fill the buffer as fast as possible so that the new type replacesthe old one. For our example of 50% this process takes effect relatively fastas you can see from Figure 5.5(a). Now what we can do is to let the bufferfill up to 50% in a Hard Prioritizing manner then if the top item in the listexceeds 50% of the buffer we change the plan and order our buffer in a Softprioritizing manner. This way we ensure that for highly fluctuating traffic wewill give the absolute chance for the higher item in the list to be chosen butif it starts to overpopulate our buffer we take the Soft approach in order toprevent it from getting stuck at the top of the list. We propose 50% since in
42

real world application it is quite probable that up to 50% of the input queriesbe the same type. But if it exceeds 50% it can be an indication of abnormalbehaviour in input submissions. In other words our probability distribution foreach invocation is as the following,
Pd(L) =
Ps(L) ,if the most populated header in the buffer
occupies more than 50% of the buffer
1 ,if l is the most populated header in the buffer
and it occupies less than 50% of the buffer
0 ,if l is not the most populated header in the buffer
and the most populated header in the buffer
occupies more than 50% of the buffer
(5.3)
We implemented our Dynamic approach and compared it to the other twoapproaches in the same two before mentioned cases. In Figure 5.6 you can seethe results of our Dynamic approach. As can be seen, our Dynamic approach
(a) 50% biased input (fast changing traffic pattern)
(b) packets of the same type (slow changing traffic pattern)
Figure 5.6: Comparison of the performance of Hard and Soft and Dynamicpriority in response to slow and fast changing input pattern
in Figure 5.6(a) tries to imitate the shape of Hard priority approach which isto Hard prioritize packets since there is most of the time less than 50% of thebuffer populated with the same type packets and in Figure 5.6(b) the Dynamicapproach tries to imitate the Soft priority approach which is more efficient thanHard in those circumstances.
In terms of user satisfaction as is demonstrated in table 5.1 in the case thatthe input is biased on one type 180 users have experienced 4 system calls inNaive approach. In other three approaches most users experienced 2 system
43

calls but, comparing hard case with 174 users and soft case with 102 usersexperiencing 2 system calls we can see a big difference in user experience whilein Dynamic case the user experience is much better than in Soft case and with154 users experiencing 2 system calls is quite close to Hard case.
Number of System Calls Naive Hard Soft Dynamic2 52 174 102 1544 180 59 99 736 63 55 76 638 55 62 73 60
Table 5.1: Comparison of user experience in the biased input type
In the second experiment with input pattern of the same type header re-peated a large number of times, The user experience in Naive case is so badwith no user experiencing any system calls smaller than 6. However in Hardcase with 199 users with 2 system calls and 149 with 4 and comparing it tothe Soft case with 221 users with 2 system calls and 123 with 4 we can seethat soft is working better in this case while Dynamic approach again leanstoward the better performance with 208 users experiencing 2 system calls and131 experiencing 4.
Number of System Calls Naive Hard Soft Dynamic2 0 199 221 2084 0 149 123 1316 200 2 5 98 150 0 1 2
Table 5.2: Comparison of user experience in the same type input
In order to make an overall evaluation of our method we designed a morerealistic scenario of the input sequences. Our scenario consists of 1050 enquiriesfor each of the 4 approaches. 350 first inputs are uniformly distributed inputsof all types. Next 150 would be of one type only and afterwards the next 200inputs of a different type. Finally the last 350 inputs are biased inputs with50% chance of one type being the input type. Here in Figure 5.7 you can seethe cumulative distribution of the number of system calls along with the usersatisfaction diagram. From Figure 5.7 the cumulative system calls the adopting
Figure 5.7: Realistic Scenario
44

behaviour of our Dynamic method can be clearly seen that in each stage of theinput pattern it tries to imitate the best approach. Table 5.3 illustrates thenumber of relatively satisfied users with a experience of 2 system calls are bigenough in Dynamic method with respect to the number of unhappy users withthe number of 6 or 8 system calls and these numbers are smaller than those ofSoft approach. However if you take a snapshot of the runs of the program atany given time you can see that the Dynamic method is closer to the betterapproach.
There is another important thing to notice in the figures. It is true that inthe Hard approach there are more users that experience 2 system calls but ingeneral our system might operate with 2 or 4 or 6 or 8 system calls. waiting timefor 2 and 4 system calls does not differ that much comparing them to waitingtime for 6 or 8. Therefore if we pay the price of having less users with 2 systemcalls and more with 4 system calls in turn we gain the advantage of having theleast users with 6 or 8 system calls. In other words we prefer the diagram ofuser satisfaction to be a smooth and straight line rather than having a peak at2 system calls but having also maximums at 6 or 8 which are not desirable userexperiences at all.
Number of System Calls Naive Hard Soft Dynamic2 153 445 324 3814 258 315 316 2696 350 146 233 2228 289 144 177 178
Table 5.3: Comparison of user experience in the same type input
45

Chapter 6
Conclusion
Generally the flow of understanding a network packet as is done in real world isdivided into some major stages; Sniffing the bits from wire and storing them ontothe memory in a proper format (such as hex numbers), then retrieving the hexnumbers from memory and converting them into proper formats – such as addingadditional information like timestamps, etc... – in order to be understandableby packet analizer tools, and finally comes the packet analizer that provides theuseful information about the packet in a user friendly format. The Online PacketAnalizer (OPA) developed in this thesis is an online service to facilitate the taskof packet analysis merging the two last stages. There are serious considerationswhen trying to automate a human task; These hex streams of meaningful packetscould be embedded inside a lot of other irrelevant text that sometimes very muchlook like meaningful packets. These packets can be extracts of headers ratherthan a complete packet. Here in our work we tried to find a solution for theseproblems by guessing the missing parts of the packet and trying them one afteranother to see which one makes a meaningful and dissectable packet. This typeof adding headers is generally done by engineers that have a former view of theproper header to add. These kinds of knowledge are very hard to be embeddedinside a computer code. However our prioritizing policies that were discussedin the last chapter was an attempt to get closer to human efficiency in guessingthe absent headers.
The database that comes along with the OPA service is also intended tofacilitate the troubleshooting of the network. The ability to update this databaseby the experts in the field provides an opportunity to have a valuable collectionof side material that can be beneficial for the support experts as well as thenewly started interns that want to learn new material.
This service is made specifically to be employed inside Ericsson support butsuch an online service could be beneficial everywhere. This is a light weight webpage therefore one can even use it from his/her mobile phone. This means tohave a Wireshark almost anywhere.
The OPA can be used for educational purposes. Imagine finding any exampleof packet data protocols in the website with all the educational side materialand links to manuals and white papers and standards all in one page. Alsoconsidering the feature of sending test packets, a webpage can be imagined with
46

all the necessary building blocks of a packet. One can easily choose headertypes and build his/her own packet and send it to a destination and observe thepackets returned and actually see what is happening. Such a feature not onlymakes it easy for the support guru to test their systems but also is of a greateducational value. The students who just have learnt network protocols can putwhat they learn to practice. They will never forget it this way!
For the future improvements this service can be considered as a script thatprocesses any text document from the html pages in a browser to any text fileon the local hard drive. The result will be a document with all the hex bytestream like text inside it highlighted. Then it only takes a click to find out whatpacket the stream represents.
The efficiency of the header guessing method can also be subject to im-provement by considering an algorithm that finds a more precise probabilitydistribution by looking into the history then predicting the next packet to beexpected from that distribution.
47

Bibliography
[1] Mudit Ratana Bhalla, Anand Vardhan Bhalla, Generations of Mobile Wire-less Technology: A Survey, International Journal of Computer Applications(0975 8887) Volume 5 No.4, 2010.
[2] Michel Daoud Yacoub, Foundations of Mobile Radio Engineering, CRCPress, 1993, page 27.
[3] Jean-Marie Bourjolly, Leslie Djoie, Ke Ding, Oumar Dioume andMichel Lominy, http://www.orms-today.org/orms-4-02/frfrequency.
html, April, 2002.
[4] Shariful Hasan Shaikot, http://eecs.wsu.edu/~sshaikot/docs/gsm/GSM_Presentation_Shaikot.ppt, Computer Science Department OklahomaState University, May, 2012.
[5] 3GPP white papers, 3rd Generation Partnership Project; Technical Speci-fication Group Services and System Aspects; Network architecture(Release11), TS 23.002 V11.1.0, 2011-12.
[6] Willie W. Lu, Broadband wireless mobile: 3G and beyond, John Wiley andSons, 2002, page 152.
[7] https://sites.google.com/site/lteencyclopedia/home, Last Update22 Feb. 2012.
[8] 3GPP white papers, 3rd Generation Partnership Project; Technical Specifi-cation Group Radio Access Network; Evolved Universal Terrestrial Radio Ac-cess (E-UTRA) and Evolved Universal Terrestrial Radio Access Network(E-UTRAN); Overall description; Stage 2 (Release 11), TS 36.300 V11.0.0,2011-12.
[9] Ericsson white papers, 4G, 284 23-3153 Uen, April 2011.
[10] Kathleen Regalado, http://www.goinglte.com/glossary/
mme-mobility-management-entity/, November 18, 2009.
[11] razunitem, http://razunitem.wordpress.com/2009/10/11/
gprs-core-network/, October 11, 2009.
[12] http://en.wikipedia.org/wiki/File:Wireshark_screenshot.png,May 13, 2008.
[13] http://www.tutorialspoint.com/gprs/gprs_protocol_stack.htm,June 12, 2012.
48