a tourist navigation system that promotes interaction with
TRANSCRIPT
Abstract— We propose a new tourist navigation system that
does not provide detailed route information. Most conventional navigation systems provide the shortest optimal route from the current location to the destination. This often changes a sightseeing stroll into an act that traces the recommended route. In our approach, users are required to create a sightseeing route plan, by deciding which spots to visit and how to reach the spots. They use icons to specify the spots, and draw routes freehand on the digital map system. When they start sightseeing, the digital map is not displayed on the mobile computer, and they can refer only to spot icons, freehand routes and real-time location data from the GPS. The freehand route is expected to create accidental encounters.
Index Terms— Accidental encounter, tourist navigation system, benefit of inconvenience, sightseeing stroll.
I. INTRODUCTION
As an ITS (Intelligent Transport Systems) field, a tourist navigation system (TNS) is being developed to support transportation in sightseeing areas. Most tourist navigation systems fundamentally adhere to the concept of a car navigation system. They clearly calculate and propose the optimal route in terms of time and distance from the current location to the destination. This type of system is very convenient for tourists who do not have much time for a sightseeing stroll. However, some tourists enjoy the process to the destination by straying from the direct route. From our experience, in the case of a TNS which clearly shows the shortest optimal route, this often changes a sightseeing stroll into an act of tracing the recommended route. To enjoy strolling and the landscape, it is important to enjoy casual walking and not be tied down by a predetermined route unless we lose the relationship between the destination and the current position.
This study proposes new approach to a tourist navigation system that haphazardly encourages tourists in finding routes and sightseeing spots without providing detailed route
Manuscript received February 2, 2010. This work was supported by
Ritsumeikan University. Y. Nakatani is with the Graduate School of Science and Engineering,
Ritsumeikan University, Kusatsu city, Shiga, 525-8577 Japan (phone: +81-77-561-5932; fax: +81-77-561-5203; e-mail: [email protected]. ac.jp).
K. Tanaka is with the Graduate School of Science and Engineering, Ritsumeikan University, Kusatsu city, Shiga, 525-8577 Japan (phone: +81-77-561-5932; fax: +81-77-561-5203; e-mail: [email protected]. ac.jp).
K. Ichikawa was with the Graduate School of Science and Engineering, Ritsumeikan University, Japan, and is now with the Quality Innovation Center, Honda Motor Co., Ltd., No.52-1, Hagadai, Haga-Machi, Haga-gun, Tochigi, 321-3325 Japan (phone: +81-28-687-2127; fax: +81-28-687-2157; e-mail: [email protected]).
information[1]. In the next section, we discuss the concept of sightseeing, which is the base of design and construction of the system. Then we report experiment results using the system in Nara city and introduce the new approach that we are trying. Based on the discussion and the experiments, we propose a new system. The system was evaluated in an experiment in a historic city in Japan.
II. SIGHTSEEING AND TOURIST NAVIGATION SYSTEM
A. Current status of Tourist Navigation Systems
Existing tourist navigation systems and services include the personal navigation system P-Tour [2] and Raku-Raku scheduler provided by NAVIT [3]. In both systems, tourists can designate multiple sightseeing spots they want to visit in the order of their choice under a time constraint (schedule function) and obtain an optimal route in accordance with their schedule. These systems accurately adhere to a concept of car navigation systems. That is, these systems are designed to lead people to the destination with the minimum lost.
Tarumi et al. [4] performed an open experiment where they overlapped virtual space on the map displayed on mobile phones to guide tourists in sightseeing areas. They reported that the system was evaluated differently by age and gender. Twenties or younger were highly evaluated the informative screen design and women preferred photos. The most important finding in this experiment was that some subjects did not appreciate the system because it provided the same information as the travel brochures and advertising signs. This means the system should provide new information or opportunities to meet new things.
B. Experience with Tourist Navigation System
We participated in an open experiment of a tourist navigation system to understand the current status for tourist support, and we investigated the current status of guideboards for tourists. (1) Nara prefecture tourist navigation experiment
We participated in Nara’s autonomous mobile support project performed by the Ministry of Land, Infrastructure, Transport and Tourism and Nara prefecture in autumn 2006 [5]. Nara city is the ancient capital in the 8th century. More than 35 millions of tourists visit to this traditional city. This experiment provided information service using ubiquitous technology for smooth transport and enhancing the appeal of sightseeing areas aiming at the 1,300th anniversary (2010) of the change of the national capital to Nara.
The experiment provided a route from Kintetsu (private railway) Nara station to Todaiji temple, the biggest wooden building in the world, and information about sightseeing areas, shops, public restrooms, and resting-places from a PDA. We could move about with the PDA, obtaining
A Tourist Navigation System that Promotes Interaction with Environment
Yoshio Nakatani, Ken Tanaka, and Kanako Ichikawa
Engineering Letters, 18:2, EL_18_2_08
(Advance online publication: 13 May 2010)
______________________________________________________________________________________

information from IC tags on guideboards and area information for current positions without wires (Bluetooth). For route guidance, spoken commands and instructions on a terminal screen were provided at turning points. Usage of the PDA, and experiment area maps were printed on an A4 paper.
Eight students participated in the experiment. Opinions after the experiment are shown below. Some students admired the PDA: 1) We could walk listening to voice navigation without
watching the screen. 2) One group enjoyed the PDA display. Others were critical of the PDA: 3) We could obtain detailed route information from the
PDA. However, it is difficult to walk while watching the screen.
4) We tended to aim at the next radio spot (Figure 1). We could not enjoy how the street looked as we walked.
5) For audio assist, we had to listen to unnecessary information before necessary information.
6) If a person is familiar with the area, it is enough to listen to the person’s explanation (The PDA did not provide additional information.).
7) We could not obtain information that was not part of the specified route.
(2) Current status of tourist navigation system The tourist navigation system that we investigated
provided the shortest route to the destination. Of course, tourist navigation systems are designed to provide detailed information about both sightseeing spots and purpose determined spots (i.e., restaurants, facilities) along the route. However, the information imposes preconditions for tracing the route proposed by the system. The TNS has the same concept as car navigation in terms of a system-driven tourist guide.
Social psychology proposes two travel patterns: “place-name driven” sightseeing and “purpose-driven” sightseeing [6]. Existing goal-oriented navigation is useful for place-name driven sightseeing (i.e., place-name oriented sightseeing). However, for people who enjoy strolling, this kind of system does not lead to smart shops not in guidebooks. It does not provide opportunities for walking into labyrinthian alleys through a trial-and-error process and they
Fig.1 System Usage to Download the Sightseeing
Information
cannot find something new or feel the atmosphere of an area.
We realized that enjoying assimilation into an area was
required to enjoy strolling.
C. Field Investigation
(1) Investigation of guideboards In order to enjoy strolling, equipment and social devices
are required to support strolling at a site. Therefore, we investigated the distribution of sightseeing guideboards in a sightseeing area. We investigated around Yasaka shrine in Kyoto. This area is one of the most popular sightseeing spots in Kyoto and many tourists sightsee there on foot. There are many narrow streets and tourists easily get lost.
We found 56 guideboards. Of the guideboards, 29 were sketched maps, 17 were simple directional signs and 10 were standard maps.
Tourists used guideboards as follows: 1) Checking current position. 2) Considering a subsequent route after that (planning) 3) Checking the direction of the destination
These maps had various scale sizes and different illustrations. Installers included the city, local towns, individuals and stores. The maps showed travel direction, north direction or destination, and they were inconsistent. Tourists reflected on a route by comparing maps. However because some maps were blocked by bicycles parked in front of them, we could not approach some of the maps. Some maps could not be read because the characters on the wooden board had been drawn using felt pens and the texts had faded so they were illegible. On the surface, we assumed that these complications would bother the sightseeing. However, we discovered that our initial assumption was not entirely true. When several individuals were strolling, they discussed how to interpret maps and check their location (Figure 2). Their behaviors were unexpectedly impressive, and we confirmed those behaviors could increase the excitement of sightseeing. (2) Confirmatory experiment for sightseeing behavior
We investigated enjoyment in sightseeing behavior and determining destination in Nara. The subjects were eight individuals including university students with a GPS. We asked four pairs to sightsee starting from JR Nara station and complete their sightseeing within two hours. After completion, we checked their routes using GPS data. Additionally, we asked the subjects to illustrate their routes. We questioned why they stayed at some places for a certain period of time and what the most impressive sites were.
Fig.2 Example of Using a Guideboard
Engineering Letters, 18:2, EL_18_2_08
(Advance online publication: 13 May 2010)
______________________________________________________________________________________

Fig.3 Example of A Constructed Route Map
The subjects found routes by searching the surroundings for landmarks, such as many trees, a pagoda, and a residential area, for their destination. In approaching a route, they behaved in a destination-oriented manner due to time constraints. In the return route, they flexibly stopped at a spot they noticed during their approach route when they were under time pressure. In listening to the subjects after their sightseeing, the places they stopped and the objects and spots they saw by chance came up in conversation. Judging from route selections and the recollections of the subjects, they seemed to be interested in chance factors.
The subjects were asked to draw route maps. Figure 3 shows a map drawn by a subject. Most subjects emphasized the spots that impressed them in the route maps. Interesting spots on the route had impressed the subjects who added place names and illustrations on the map. They did not understand other spots in as detailed and accurate a manner. In some cases, the destinations were not mentioned on the map, which means that the subjects enjoyed the process to walk to the destinations, not the destinations themselves.
III. SUPPORT OF SIGHTSEEING AREA IMAGE CONSTRUCTION
A. Approach of This Study
Based on our analysis shown above, we tried in this study to provide chance factors for strolling by utilizing an image of the sightseeing area. Accidental events are an important factor for play, which corresponds to “casualness” proposed by R. Caillois, a famous researcher of play [7]. Conditions in which users can play are developed by the system creating a situation that is likely to generate casualness. At this moment, users do not “play with the system.” The system generates a situation in which users “play with the environment.”
Fig.4 System Architecture
Nishimura described “Space owned by the situation that surrounds me” in “Phenomenology of play” [8]. Playing with the environment generates a state for “playing with the situation.” Further, it generates casualness.
The experiments show that people follow the proposed route and it is difficult to ignore it. So our approach to generate “play with the environment” situation is to introduce “ambiguity” to the route information and to promote people to look around them in order to confirm the situation..
B. System Configuration
Figure 4 shows the configuration of the prototype system. The system is roughly divided into a sightseeing area image forming system before the actual sightseeing and a transportation support system on the day of sightseeing.
At first, the system prepares sightseeing information for the area to be visited on the system server in XML format. In the figure, the file is named the “sightseeing information” file. Then, users describe the sightseeing plan (spots to be visited and route) on the electronic map with the destination icon (and explanation) and a freehand route line based on sightseeing information file, guidebooks, magazines and information on the Web to save as the “sightseeing plan map.”
On the sightseeing day, users move about with a GPS. At this moment, no map is displayed. Sightseers are provided with the position data file obtained from the GPS on the sightseeing map file. Only the icons to be visited, the freehand route and current position information obtained from GPS are provided.
C. Sightseeing Area Image Forming System
In this study, users themselves prepared a sightseeing plan map before sightseeing to create an image of the sightseeing plan. Tourists have images of sightseeing areas as a mental map. Therefore, even if they see an ambiguous map on the day of sightseeing, they have sense of direction and can guess about facilities at the spot. They can avoid a situation where they become completely disoriented and cannot at all enjoy sightseeing. Additionally, images of appropriate levels of detail will make tourists lose touch with the realities in the sightseeing areas to promote play in the situation.
Before Sightseeing
En Route
Sightseeing Plan Map
System Server
Sightseeing Information
Sightseeing Plan Map
Navigation Navigation
Engineering Letters, 18:2, EL_18_2_08
(Advance online publication: 13 May 2010)
______________________________________________________________________________________
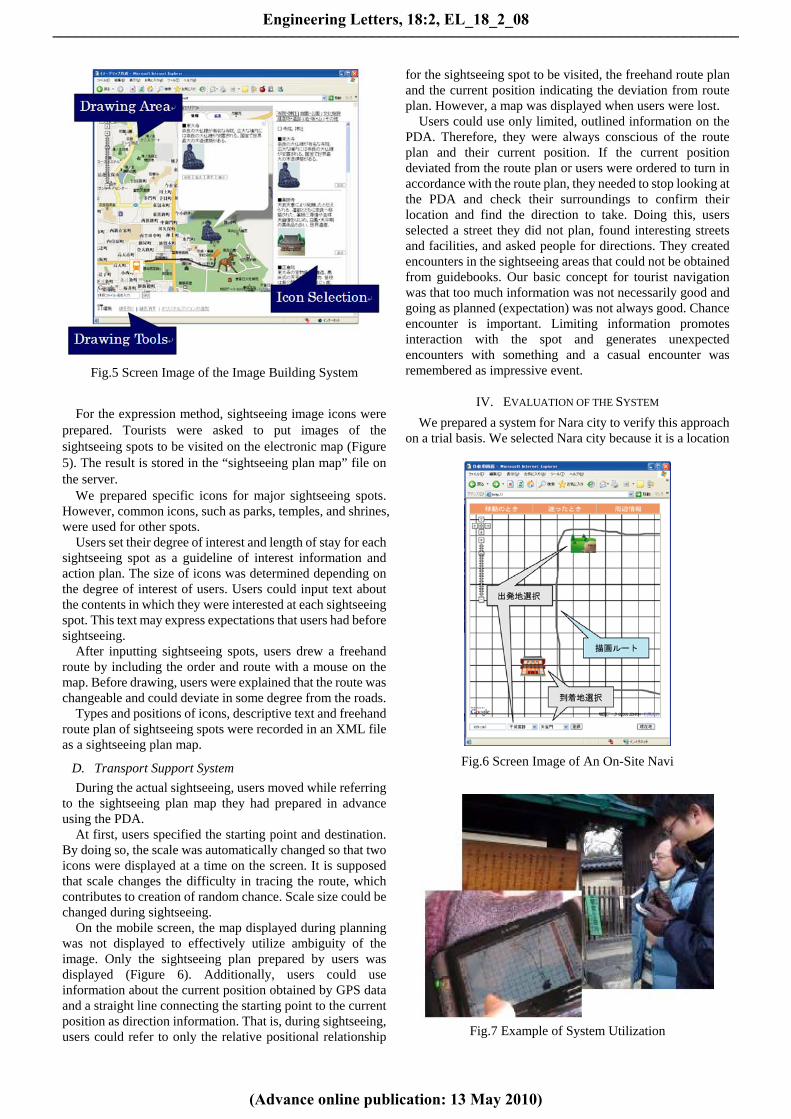
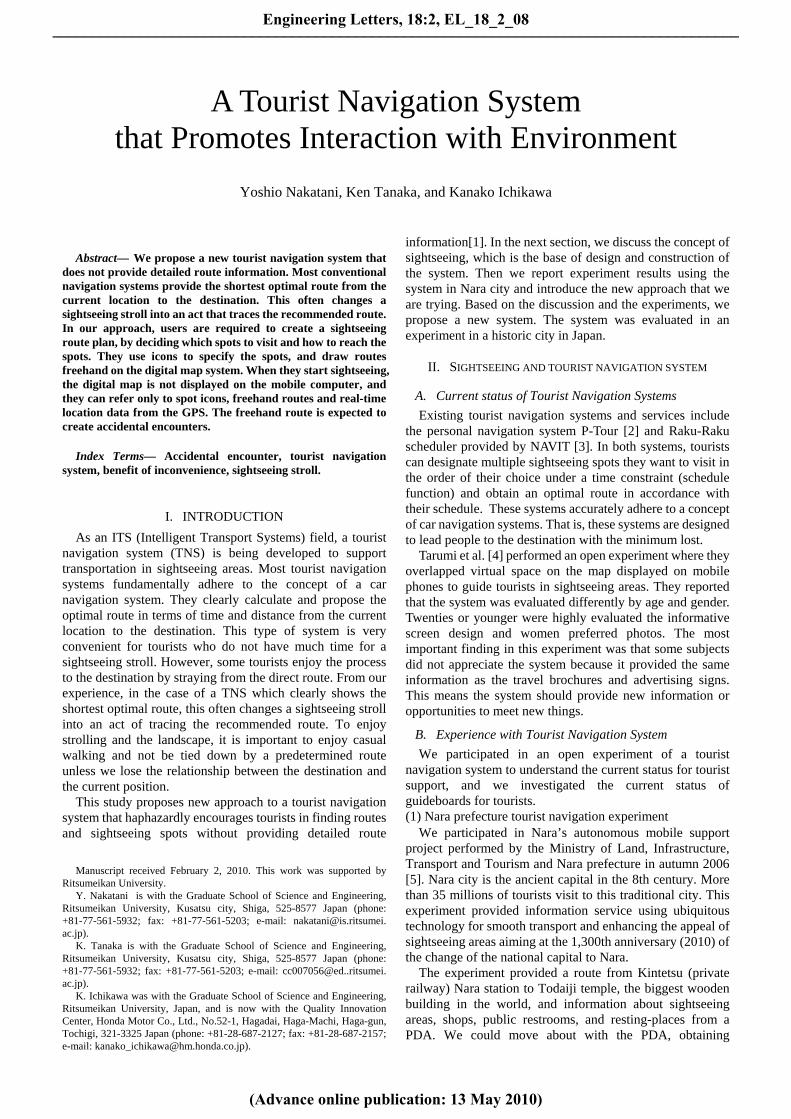
Fig.5 Screen Image of the Image Building System
For the expression method, sightseeing image icons were
prepared. Tourists were asked to put images of the sightseeing spots to be visited on the electronic map (Figure 5). The result is stored in the “sightseeing plan map” file on the server.
We prepared specific icons for major sightseeing spots. However, common icons, such as parks, temples, and shrines, were used for other spots.
Users set their degree of interest and length of stay for each sightseeing spot as a guideline of interest information and action plan. The size of icons was determined depending on the degree of interest of users. Users could input text about the contents in which they were interested at each sightseeing spot. This text may express expectations that users had before sightseeing.
After inputting sightseeing spots, users drew a freehand route by including the order and route with a mouse on the map. Before drawing, users were explained that the route was changeable and could deviate in some degree from the roads.
Types and positions of icons, descriptive text and freehand route plan of sightseeing spots were recorded in an XML file as a sightseeing plan map.
D. Transport Support System
During the actual sightseeing, users moved while referring to the sightseeing plan map they had prepared in advance using the PDA.
At first, users specified the starting point and destination. By doing so, the scale was automatically changed so that two icons were displayed at a time on the screen. It is supposed that scale changes the difficulty in tracing the route, which contributes to creation of random chance. Scale size could be changed during sightseeing.
On the mobile screen, the map displayed during planning was not displayed to effectively utilize ambiguity of the image. Only the sightseeing plan prepared by users was displayed (Figure 6). Additionally, users could use information about the current position obtained by GPS data and a straight line connecting the starting point to the current position as direction information. That is, during sightseeing, users could refer to only the relative positional relationship
for the sightseeing spot to be visited, the freehand route plan and the current position indicating the deviation from route plan. However, a map was displayed when users were lost.
Users could use only limited, outlined information on the PDA. Therefore, they were always conscious of the route plan and their current position. If the current position deviated from the route plan or users were ordered to turn in accordance with the route plan, they needed to stop looking at the PDA and check their surroundings to confirm their location and find the direction to take. Doing this, users selected a street they did not plan, found interesting streets and facilities, and asked people for directions. They created encounters in the sightseeing areas that could not be obtained from guidebooks. Our basic concept for tourist navigation was that too much information was not necessarily good and going as planned (expectation) was not always good. Chance encounter is important. Limiting information promotes interaction with the spot and generates unexpected encounters with something and a casual encounter was remembered as impressive event.
IV. EVALUATION OF THE SYSTEM
We prepared a system for Nara city to verify this approach on a trial basis. We selected Nara city because it is a location
Fig.6 Screen Image of An On-Site Navi
Fig.7 Example of System Utilization
Engineering Letters, 18:2, EL_18_2_08
(Advance online publication: 13 May 2010)
______________________________________________________________________________________
for historical sightseeing with an environment suited for strolling. Sightseeing spots and historical streets are preserved in a relatively narrow space in which tourists can walk. Round trips on foot are possible. A Sony VAIO type U was used for the PDA (Figure 7).
The subjects were nine individuals (male: 7, female: 2). They were divided into three groups (five individuals, two, and two) (Table 1) and strolled.
Table 1 Subjects
Group 1 Group 2 Group 3 Number of
persons 5 2 2
Spots to be visited
2 3 4
Nara sightseeing experience
Insufficient Rather
insufficient Sufficient
We asked the subjects to prepare a sightseeing plan sheet, sightsee using the system and answer a questionnaire after the experiment as an assignment. The experiment was performed in January 2008.
A. Preparation of Map
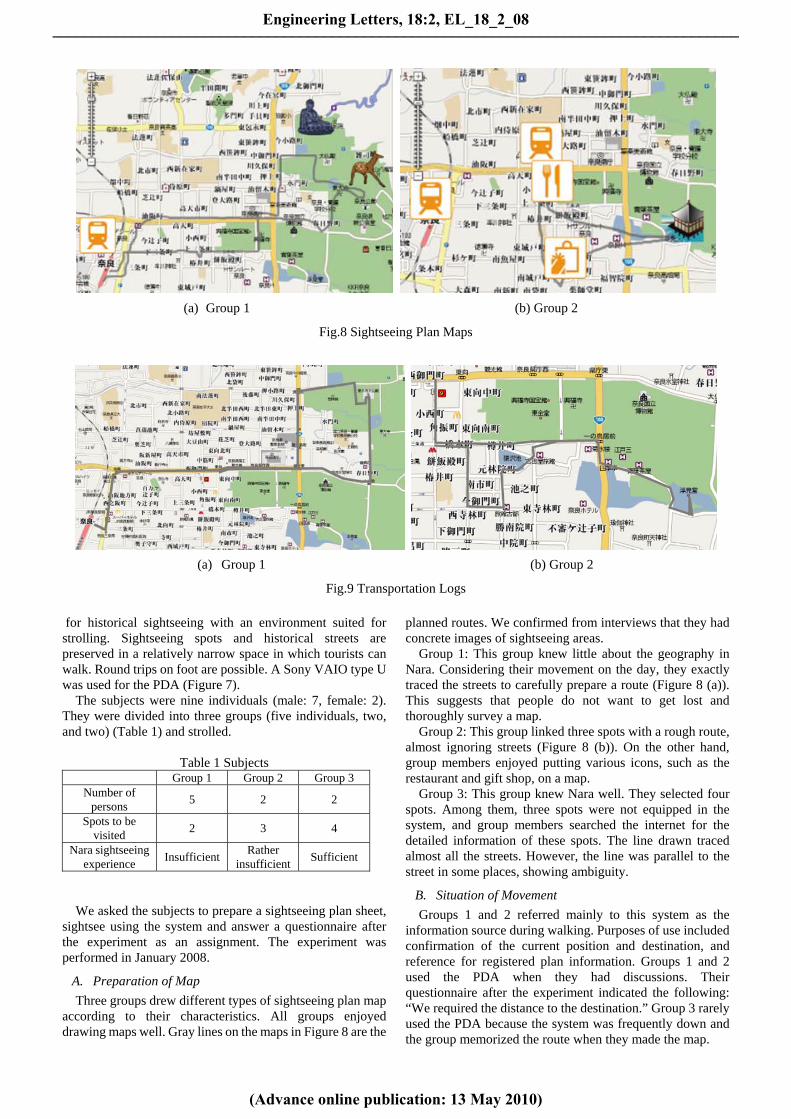
Three groups drew different types of sightseeing plan map according to their characteristics. All groups enjoyed drawing maps well. Gray lines on the maps in Figure 8 are the
planned routes. We confirmed from interviews that they had concrete images of sightseeing areas.
Group 1: This group knew little about the geography in Nara. Considering their movement on the day, they exactly traced the streets to carefully prepare a route (Figure 8 (a)). This suggests that people do not want to get lost and thoroughly survey a map.
Group 2: This group linked three spots with a rough route, almost ignoring streets (Figure 8 (b)). On the other hand, group members enjoyed putting various icons, such as the restaurant and gift shop, on a map.
Group 3: This group knew Nara well. They selected four spots. Among them, three spots were not equipped in the system, and group members searched the internet for the detailed information of these spots. The line drawn traced almost all the streets. However, the line was parallel to the street in some places, showing ambiguity.
B. Situation of Movement
Groups 1 and 2 referred mainly to this system as the information source during walking. Purposes of use included confirmation of the current position and destination, and reference for registered plan information. Groups 1 and 2 used the PDA when they had discussions. Their questionnaire after the experiment indicated the following: “We required the distance to the destination.” Group 3 rarely used the PDA because the system was frequently down and the group memorized the route when they made the map.
(a) Group 1 (b) Group 2
Fig.8 Sightseeing Plan Maps
(a) Group 1 (b) Group 2
Fig.9 Transportation Logs
Engineering Letters, 18:2, EL_18_2_08
(Advance online publication: 13 May 2010)
______________________________________________________________________________________

Figure 9 shows the transportation logs of three groups. Group 1: Only one route was different from the plan
(Figure 9 (a)). The group traced the route almost as planned. They said “The system requires shortcut display function.” They did target-oriented sightseeing.
Group 2: The group’s strategy was to walk on the main street. Group members moved roughly as planned (Figure 9 (b)). They turned back once because the street had disappeared. This is because the planned route was not accurate. They changed the order of their going to the various tourist spots on the sightseeing day and flexibly selected the routes.
Group 3: Before reaching the first destination, group members looked at a guideboard beside the road. They were interested in an unscheduled spot and spent approximately 30 minutes at the spot. The distance became 500m longer than the planned distance. This group changed the route largely because they were interested in a country road.
C. Ambiguity of Planned Route and Movement
The ratio of the original route the groups actually traced was calculated as “relevance ratio” to investigate the correlation between ambiguity of the map and the route actually taken (Table 2).
Table 2 The distance actually walked in the plan
Group 1 Group 2 Group 3
Planned route length (km)
5.9 3.5 5.6
Concordant distance (km)
5.3 1.5 4.0
Relevance rate (%) 89.8 42.9 71.4 The relevance rate of group 1 and 3 is high. The relevance
rate of group 2 was less than 50% showing significant difference from the other groups. The planned route of group 2 was rougher than the other groups. This may have facilitated their changing routes.
For walking speed (brisk walking: 80m /min as a reference), groups 1 and 2 stopped walking (0-20m/min) and walked slowly (20-60m/min) more frequently than group 3. Especially, group 2 showed this tendency (Figure 10). This is because planned route was ambiguous and they walked and checked their surroundings.
As shown above, it was suggested that ambiguity of the planned route promoted selection of an unplanned route and reduced waking speed.
D. Creation of Contingency
The ratio of the unplanned route to the entire movement distance was calculated as the rate of deviation (Table 3).
Table 3 Ratio of distance from the plan Group 1 Group 2 Group 3
Total movement distance (km)
5.9 3.6 7.2
Unplanned distance (km)
0.6 2.1 3.2
Rate of deviation (%)
10.2 58.3 44.4
Fig.10 Movement Speed of Each Group Group 1 prepared a rigorously planned route that rarely
showed behavior in looking for an unplanned route. The rate of deviation was lowest (approximately 10%). For group 2, the walking distance was short and the relevance rate was low. Therefore, the rate of deviation was highest (approximately 58%). The rate of deviation for group 3 was also high. The group followed the planned route. However, group members added destinations on site and passed an unplanned street at some point. Therefore, movement distance was longer than planned.
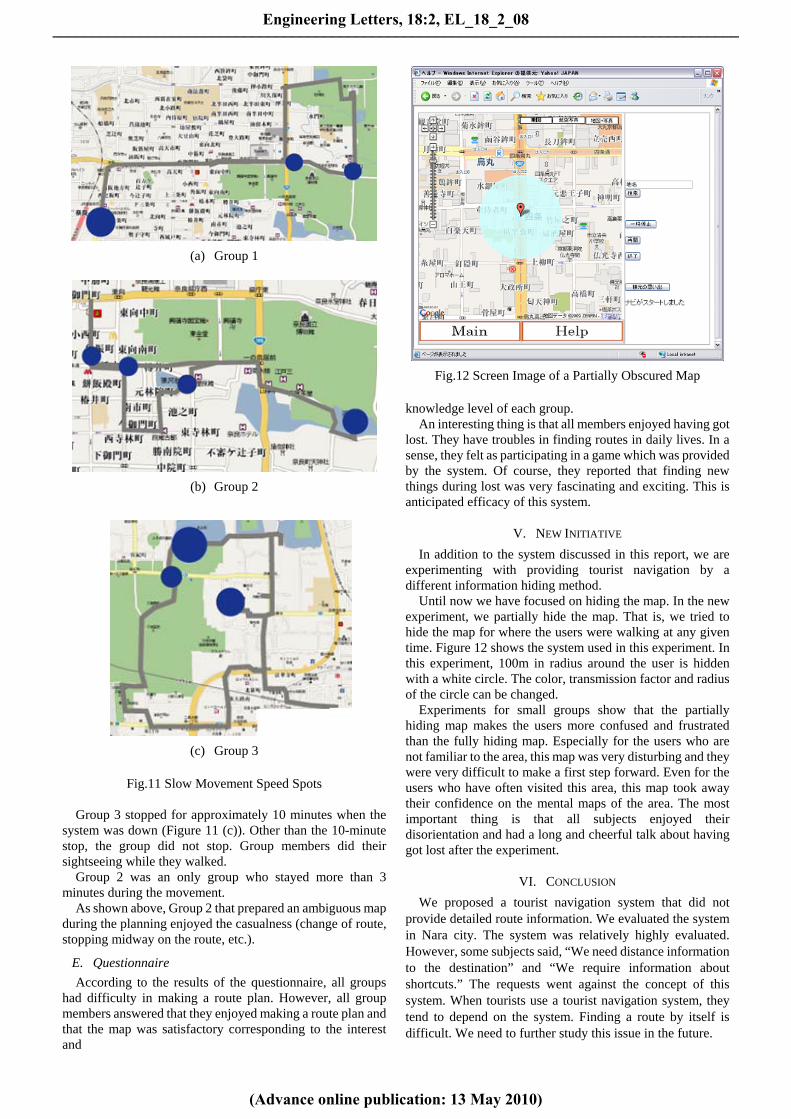
Slow movement speed spots (0-40 m/min) were analyzed for each group. Figure 11 shows the spots where each group stayed more than 3 minutes. A small circle shows 3-6 minutes staying, a middle circle shows 6-10 minutes staying, and a large circle shows more than 10 minutes staying.
Group 1 stopped for 10 minutes at the starting point (Figure 11 (a)). In these 10 minutes, group members started the system and decided their sightseeing strategy. They rarely stayed long on a spot.
Group 2 often stopped during the movement (Figure 11 (b)). Group members very often took pictures of the scenery and posters. They seemed to enjoy strolling as they moved.
Engineering Letters, 18:2, EL_18_2_08
(Advance online publication: 13 May 2010)
______________________________________________________________________________________
(a) Group 1
(b) Group 2
(c) Group 3
Fig.11 Slow Movement Speed Spots Group 3 stopped for approximately 10 minutes when the
system was down (Figure 11 (c)). Other than the 10-minute stop, the group did not stop. Group members did their sightseeing while they walked.
Group 2 was an only group who stayed more than 3 minutes during the movement.
As shown above, Group 2 that prepared an ambiguous map during the planning enjoyed the casualness (change of route, stopping midway on the route, etc.).
E. Questionnaire
According to the results of the questionnaire, all groups had difficulty in making a route plan. However, all group members answered that they enjoyed making a route plan and that the map was satisfactory corresponding to the interest and
Fig.12 Screen Image of a Partially Obscured Map
knowledge level of each group. An interesting thing is that all members enjoyed having got
lost. They have troubles in finding routes in daily lives. In a sense, they felt as participating in a game which was provided by the system. Of course, they reported that finding new things during lost was very fascinating and exciting. This is anticipated efficacy of this system.
V. NEW INITIATIVE
In addition to the system discussed in this report, we are experimenting with providing tourist navigation by a different information hiding method.
Until now we have focused on hiding the map. In the new experiment, we partially hide the map. That is, we tried to hide the map for where the users were walking at any given time. Figure 12 shows the system used in this experiment. In this experiment, 100m in radius around the user is hidden with a white circle. The color, transmission factor and radius of the circle can be changed.
Experiments for small groups show that the partially hiding map makes the users more confused and frustrated than the fully hiding map. Especially for the users who are not familiar to the area, this map was very disturbing and they were very difficult to make a first step forward. Even for the users who have often visited this area, this map took away their confidence on the mental maps of the area. The most important thing is that all subjects enjoyed their disorientation and had a long and cheerful talk about having got lost after the experiment.
VI. CONCLUSION
We proposed a tourist navigation system that did not provide detailed route information. We evaluated the system in Nara city. The system was relatively highly evaluated. However, some subjects said, “We need distance information to the destination” and “We require information about shortcuts.” The requests went against the concept of this system. When tourists use a tourist navigation system, they tend to depend on the system. Finding a route by itself is difficult. We need to further study this issue in the future.
Engineering Letters, 18:2, EL_18_2_08
(Advance online publication: 13 May 2010)
______________________________________________________________________________________

REFERENCES [1] Yoshio Nakatani, Ken Tanaka and Kanako Ichikawa, A Tourist
Navigation System That Does NOT Provide Route Maps, Lecture Notes in Engineering and Computer Science: Proceedings of The World Congress on Engineering and Computer Science 2009, WCECS 2009, 20-22 October, 2009, San Francisco, USA, pp.1264-1269.
[2] A. Maruyama, N. Shibata, Y. Murata, K. Yasumoto and M. Ito, P-TOUR: A Personal Navigation System: Proceedings of The 11th World Congress on ITS, 18-22 October, 2004, Nagoya, Japan, pp. 18-21.
[3] NAVIT, Raku-Raku scheduler. http://www17.pos.to/~navit/hp/ mannavi/scheduler01.html. (in Japanese)
[4] H. Tarumi, et al., Open experiments of mobile sightseeing support systems with shared virtual worlds: Proceedings of The 2006 ACM SIGCHI International Conference on The Advances in Computer Entertainment Technology, 3-5 June, 2006, Singapore (DVD).
[5] Ministry of Land, Infrastructure, Transport and Tourism and Nara prefecture, “Nara Prefecture Autonomous Mobile Support Experiment.” http:// www.pref.nara.jp/doroi/jiritsu/. (in Japanese)
[6] K. Oguchi, Social Psychology of Sightseeing. Tokyo: Kitaoji-Shobo, 2006. (in Japanese)
[7] R. Caillois, Man, Play, and Games (ranslated from the French by Meyer Barash). Urbana : University of Illinois Press, 2001.
[8] K. Nishimura, Phenomenology of play. Tokyo: Keiso-Shobo, 1989.
Engineering Letters, 18:2, EL_18_2_08
(Advance online publication: 13 May 2010)
______________________________________________________________________________________