a tradition in transition - spate irrigation · abraham mehari haile born in asmara, eritrea....
TRANSCRIPT

A TRADITION IN TRANSITION
Water Management Reforms and Indigenous Spate Irrigation
Systems in Eritrea
Promoters: Prof. dr. ir. B. Schultz Professor of Land and Water Development UNESCO-IHE Institute of Water Education, the Netherlands
Prof. dr. ir. P.C. Struik Professor of Crop Physiology
Wageningen University, the Netherlands Awarding Committee: Prof. dr. L.F. Vincent
Wageningen University, the Netherlands
Prof. dr. ir. N.C. van de Giesen Delft University of Technology, the Netherlands
Dr. P.J.M. de Laat UNESCO-IHE Institute of Water Education, the Netherlands
Prof. dr. Hector Malano International Technologies Center, Australia
A TRADITION IN TRANSITION Water Management Reforms and Indigenous Spate Irrigation
Systems in Eritrea
DISSERTATION
Submitted in fulfilment of the requirements of the Academic Board of Wageningen University and
the Academic Board of the UNESCO-IHE Institute for Water Education
for the Degree of DOCTOR to be defended in public
on Friday, 27 April 2007 at 15:00 hrs in Delft, the Netherlands
by
Abraham Mehari Haile born in Asmara, Eritrea

Taylor & Francis is an imprint of the Taylor & Francis Group, an informa business © 2007, Abraham Mehari Haile All rights reserved. No part of this publication or the information contained herein may be reproduced, stored in a retrieval system, or transmitted in any form or by any means, electronic, mechanical, by photocopying, recording or otherwise, without written prior permission from the publishers. Although all care is taken to ensure integrity and the quality of this publication and the information herein, no responsibility is assumed by the publishers nor the author for any damage to the property or persons as a result of operation or use of this publication and/or the information contained herein. Published by: Taylor & Francis/Balkema PO Box 447, 2300 AK Leiden, The Netherlands e-mail: [email protected] www.balkema.nl, www.taylorandfrancis.co.uk, www.crcpress.com ISBN 10 0-415-43947-7 (Taylor & Francis Group) ISBN 13 978-0-415-43947-3 (Taylor & Francis Group) ISBN 90-8504-601-7 (Wageningen University)
Contents V
Contents
CONTENTS V
ACKNOWLEDGEMENT IX
SUMMARY XI
1 COUNTRY BACKGROUND 1 1.1 Country Profile 1 1.2 History in Brief 3 1.3 The Agriculture Sector 3 1.4 Water Resources 6 1.5 Land and Water Development 8 2 RESEARCH BACKGROUND 11 2.1 Irrigation, Water Scarcity and Food Security: Global, Regional and National Perspectives 11 2.2 Problem Description 14 2.3 Research Goal, Objectives and Questions 18 2.3.1 Overall Goal 18
2.3.2 Specific Objectives 18 2.3.3 Specific Questions 19
2.4 Research Methods 20 2.5 Conceptual and Theoretical Framework 21 2.6 Set-up of this Thesis 22 3 PRINCIPLES AND PRACTICES OF SPATE IRRIGATION SYSTEMS 25 3.1 Introduction 25 3.2 Spate Irrigation Systems in Pakistan 26 3.3 Spate Irrigation Systems in the Republic of Yemen 28 3.4 Spate Irrigation Systems in Eritrea 31 3.5 Concluding Remarks 34 4 THE STUDY SITE: THE WADI LABA SPATE IRRIGATION SYSTEM 35 4.1 Location, Climate and Demography 35 4.2 Layout and Command Area of the Indigenous System 38 4.3 Indigenous Irrigation Structures 40 4.4 Layout and Command Area of the Modern System 43 4.5 Modern Irrigation Structures 43 4.6 Water Resources 47

VI A Tradition in Transition: Water Management Reforms and Spate Irrigation Systems in Eritrea
4.7 Soil Resource Analyses 47 4.7.1 Soil Texture 47 4.7.2 Total Available Water 51 4.8 Infiltration 53 4.9 Farming Systems 57 4.9.1 Crop Production 57 4.9.2 Livestock Production 60 4.10 Concluding Remarks 61 5. INDIGENOUS WATER RIGHTS, RULES AND MANAGEMENT BEFORE AND AFTER WATER MANAGEMENT REFORMS 63 5.1 Introduction 63 5.2 The Wadi Laba Floods 64 5.3 Water Rights and Rules in Managing Unpredictable Flood Water 66 5.3.1 Rights and Rules on Land Demarcation 67 5.3.2 Rights and Rules on Deliberate Breaching of Bunds 67 5.3.3 Rights and Rules on Flood Water Division 69 5.3.4 Rights and Rules on Sequence 69 5.3.5 Rules on Depth of Irrigation 70 5.3.6 Rules on Second and Third Turns 70 5.4 Enforcement of Water Rights and Rules 71 5.4.1 Local Organizations and Institutions 71 5.4.2 Relationship between Water Rights and Rules, and Maintenance 75 5.4.3 Codification of Rules 76 5.5 Modifying and Changing Water Rights and Rules, and their Implications 76 5.6 Concluding Remarks 82 6. MODELING SOIL MOISTURE AND ASSESSING ITS IMPACTS ON WATER SHARING AND CROP YIELD 85 6.1 Introduction 85 6.2 The Soil Water Accounting Model (SWAM) 86 6.2.1 Conceptual Background 86 6.2.2 Model Inputs and Outputs 88 6.2.3 Computational Procedure 88 6.3 The Soil Water Atmosphere Plant Model (SWAP) 92 6.4 Results and Discussion 93 6.4.1 Impact of Final Soil Moisture Storage on Water Sharing 93 6.4.2 Effect of Final Soil Moisture Storage on Sorghum and Maize Yields 96 6.5 Concluding Remarks 99 7 HYDRAULIC PERFORMANCE EVALUATION AFTER WATER MANAGEMENT REFORMS 101 7.1 Introduction 101 7.2 Assessment of the Initial Phase of the Water Management Reforms 102
Contents VII
7.3 Extent and Distribution of Irrigated Area 103 7.4 Design and Layout, and Water Supply and Distribution 106 7.5 Concluding Remarks 110 8. SALINITY AND SODICITY IMPACT ASSESSMENT ON CROP YIELD AND SOIL INFILTRATION RATE 113 8.1 Introduction 113 8.2 Salinities of the Flood Water and the Suspended Sediments 114 8.3 Average Soil Water Salinity in the Rootzones of Sorghum and Maize 118 8.4 Impact of Average Soil Water Salinity on Sorghum and Maize Yield 120 8.5 Hazard Assessment of Sodium Toxicity 124 8.6 Analyses of Sodium Induced Infiltration Restrictions 126 8.7 An Alternative Approach for Sodicity Evaluation 130 8.8 Concluding Remarks 132 9. NUTRIENT AND SEDIMENT YIELD ANALYSES FOR THE FLOOD WATER AND IRRIGATED FIELDS 135 9.1 Introduction 135 9.2 Depletion Status of Nutrients in African Soils: A Conceptual Note 136 9.3 The Nutrient Balances for the Different Flood Categories 139 9.3.1 Nutrient Balance Approach 139 9.3.2 Nutrient Balance Results and Discussion 145 9.4 Nutrient Balances of the Irrigated Fields 147 9.5 Concluding Remarks 149 10 EVALUATION 151 10.1 The Wadi Laba Indigenous Water Management System: Successes and Limitations 151 10.2 Water Management Reforms in the Wadi Laba: Expectations and Realities 152 10.3 Further Research 158 10.4 Concluding Remarks: The Way Forward 158 REFERENCES 159 APPENDIX 1: Wetted Cross-sectional Area, Velocity and Discharge Data 167 APPENDIX 2: Climatic and Evapotranspiration Data 175 APPENDIX 3: The Soil Water Atmosphere Plant Model (SWAP) Input Data 177 APPENDIX 4: Water Balance Simulation Results Obtained from the Soil Water Accounting Model (SWAM) 181

VIII A Tradition in Transition: Water Management Reforms and Spate Irrigation Systems in Eritrea
APPENDIX 5: Water Balance Simulation Results Obtained from the Soil Water Atmosphere Plant Model (SWAP) 185 SYMBOLS, ACRONYMS AND GLOSSARY 189 SAMENVATTING 197 ABOUT THE AUTHOR 211
Acknowledgment IX
Acknowledgement
Dear Promoter, Professor Bart Schultz; I could not have asked more. You provided me with a well articulated scientific guidance through constructive discussions, comments and corrections, the very few privileged could get. I also learned from you how to remain positive on a rainy day; I thank you very much.
My mentor, Mr. Herman Depeweg; your relentless, yet patient guidance was instrumental in shaping my study for the good, and has enabled me to acquire a wealth of scientific knowledge. I can dare say almost every one would dream to have a mentor like you; I am truly grateful.
Dear Professor Struik; your thoughtful comments and suggestions during our discussion on the progress of my research have significantly contributed to the improvement of the content of my thesis. You have also been very kind to welcome me warmly on all the occasions that we had met. I am extremely thankful.
My deep appreciation goes to you dear Peter Hollanders for being willing to visit me in the Wadi Laba, Eritrea. You helped me focus my field work and I learned quite a lot from your presence there. As a person, I found you kind and a pleasure to be with.
This study would not have been possible without the financial support from the Netherlands Organization for International Cooperation in Higher Education (NUFFIC). I express my sincere gratitude. Thanks also to the host Institute, UNESCO-IHE Institute for Water Education, the Core Land and Water Development in particular, for the opportunity to pursue my study. I also extend a heartfelt thanks to all the academic and administrative staff for providing a friendly atmosphere that made my work productive and smooth. Jolanda Boots and Tonneke Morgenstond deserve special acknowledgement for enduring my numerous administrative requests; the laboratory staff for their guidance and hospitality, Guy Beaujot for easing my computer problems and Marloes Mul for kindly sharing her GIS skills.
I have directly and indirectly benefited from comments of and discussions with many experts. In particular, the technical inputs of Dr. Jos van Dam, Wageningen University and Dr. Pieter de Laat, UNESCO-IHE Institute were substantial as were the institutional comments of Dr. Frank van Steenbergen from MetaMeta. I thank you all.
I am indebted to my colleagues at the University of Asmara, and the Wadi Laba staff of the Ministry of Agriculture, Eritrea, for their moral support and physical help in data collection; and the Wadi Laba farming community for their unreserved participation in the interviews and discussions that generated much of the valuable data contained in this thesis.
I would like to take this opportunity to have a moment of silence with my close friend, Berhane Haile, who lost his life in a car accident. In his post as the Wadi Laba project coordinator, he supported me morally, materially and by personally participating in data collection. May God bless his soul and shepherd his family. I shall miss him a lot.
I was fortunate to have met many decent PhD students. In particular, Eyasu Yazew has been a true and honest friend and I thank him for that.
Last, but not least, my deep appreciation goes to you, my beloved wife, Aster Goitom. You shouldered the responsibility of being the mother and the father of our two lovely sons, Esrom and Essey, and have done so diligently. You have been supportive, caring and loving.

X A Tradition in Transition: Water Management Reforms and Spate Irrigation Systems in Eritrea

Summary XI
Summary
The Rationale for the Water Management Reforms and this Research Eritrea is a small country in the Horn of Africa striving to meet the basic food demands of its population. At an annual growth rate of 3%, the population is expected to rise from 4.5 million in 2005 to 8 million in 2025. To provide each person with the basic 0.16 ton annual food requirement, a total of 1.3 million tons would be needed by 2025. The 600,000 ha land suitable for rainfed agriculture can furnish 450,000 tons (average yield is 0.75 ton ha-1 y-1) leaving a gap of 850,000 tons. This gap has to be filled by irrigated agriculture and/or import, if Eritrea is to be food self sufficient and/or food secure.
The current (2006) irrigated area in Eritrea is about 28,000 ha whereas the potential is estimated to be 391,000 ha. With appropriate water management practices, the yield under irrigated agriculture could be five to six fold that of rainfed agriculture. Advisory literature suggests that the optimum yield of irrigated sorghum grain, the major crop in Eritrea, ranges from 3.5 to 5 ton ha-1 y-1. Since irrigation development in Eritrea is in its infancy, the 5 ton ha-
1 y-1 may not be within reach at least for the coming few years. But, slightly more than tripling the yield of rainfed agriculture to 2.5 ton ha-1 y-1 may be achievable and if concerted water management efforts are made, a 3.5 ton ha-1 y-1production may be attained. In fact, farmers practising spate irrigation (the focus of this research) have reported an average and a maximum sorghum yield of 2.5 and 4.5 ton ha-1 y-1respectively. Assuming that the 391,000 ha are brought under irrigation by 2025, at a yield of 2.5 ton ha-1 y-1, the total production would more than cover the 850,000 tons food gap. A 3.5 ton ha-1 y-1 yield would require only 225,000 ha to be irrigated to attain food self sufficiency.
The vital role that irrigated agriculture can play in the endeavour to cope with each additional mouth to be fed is well recognized by the Government. With a focus on spate irrigation, efforts have been under way to expand the irrigable area and introduce appropriate ‘water management’ reforms aimed at increasing production per unit land and water quantity. The phrase ‘water management’ spans ‘the organizational aspects of the people involved; the approaches and techniques used in the (re)design and layout, (re)construction, operation and maintenance of the infrastructure; the nature of land and water rights and the water sharing arrangements and their enforcement mechanisms; the type of water related conflicts and conflict resolution strategies.’
In Eritrea, there are 11 spate irrigation systems supporting the livelihoods of the rural poor segment of the population. In 2006, the systems collectively covered 16,000 ha or about 56% of the total irrigated area. Their potential development is estimated at 91,000 ha, which is nearly 25% of the total potential irrigable land. At 2.5 and 3.5 ton ha-1 y-1 yields, the systems could sufficiently feed 20% or 25% of predicted 8 million population in 2025. As a result, the Ministry of Agriculture has identified spate irrigation a key component to contribute to the attainment of food self sufficiency and/or food security. Accordingly, the Ministry drafted a short-term (1998 to 2003) plan to introduce water management reforms in some 4,000 ha and establish about 5,000 ha newly spate irrigated area; and a long-term plan (2005 to 2015) to institute water management reforms in 12,000 ha and set-up a farther 60,000 to 70,000 ha. So far, due to lack of financial and skilled human resources, only about 3,500 ha of spate-

XII A Tradition in Transition: Water Management Reforms and Spate Irrigation Systems in Eritrea
irrigated land have been subject to water management reforms and no new land has been brought under spate irrigation.
The Wadi Laba (an ephemeral stream) spate irrigation system (study area) was selected to pioneer the short-term water management reforms. This was because the Wadi Laba was the first such system established around 100 years ago. It was therefore believed that some relevant data could be available, and that the farmers had acquired a wealth of experience that could also be of valuable input to the water management reform interventions. The replacement of the indigenous earthen and brushwood structures (Agims and Musghas) with concrete headworks and gabions was at the core of the water management reforms. Replacement of the indigenous land tenure system with the 1994 Land Proclamation was another important component of the reforms. The overall goal of the reforms was to bring-about a sustainable improvement in the living conditions of the farmers in the upstream, midstream and downstream service area. The specific targets were: - doubling the production by increasing the water diversion efficiency and the annually
irrigated area from 50% and 1,200 ha (assumed under the indigenous system) to 80% and 2,600 ha in an ‘average’ season when at most 20 floods occur;
- diverting large floods (100 to 265 m3 s-1) in a reliable and regulated manner to augment the possibility of irrigating downstream fields, while minimizing erosion and deposition of coarse sediments in canals and fields. The Agims and Musghas were usually destroyed by medium and smaller floods (≤ 50 m3 s-1);
- reducing deforestation by curtailing the use of brushwood for (re)construction and maintenance of the Agims and Musghas;
- avoiding land fragmentation that is being caused by the indigenous land tenure system. This research was conducted as a contribution to these efforts towards ongoing and future
water management reforms. Its two main objectives were: - to identify, understand and evaluate the main pillars of the indigenous water management
systems; - to assess if and how the water management reforms have built upon the strengths and
have overcome the weaknesses of the indigenous water management systems and to what extent the reforms have achieved or are likely to reach the set targets.
The Study Area This research was undertaken in the Wadi Laba spate irrigation system, which is located on the coastal plains of Eritrea at an altitude of 300 m+MSL (Mean Sea Level) in the lower section of the Wadi Laba catchment. This lower section has an area of 60,000 ha or one quarter of the 240,000 ha area of the whole catchment. The climate is hot and arid with a maximum daily temperature ranging from 21 oC in January to 45 oC in August. The mean annual rainfall is only 150 mm. The upper section of the catchment (180,000 ha), the source of the flood water for the low-lying fields, is hilly and mountainous with elevations ranging from 1,000 to 3,000 m+MSL. The climate is warm to mild with a mean annual temperature of about 22 oC. The average annual rainfall ranges from 400 to 600 mm and is erratic in nature.
The Wadi Laba spate irrigation system currently covers 2,600 ha and its potential is estimated at 5,000 ha. It has five zones or groups. A total of about 3,000 households or 21,000
Summary XIII
people directly rely on the system for their livelihood. In the indigenous system, the main Agim, the Jelwet, diverted water from the Wadi to the
Sheeb-Kethin canal, and the Sheeb-Abay, a common canal of the other four irrigation zones. At the secondary and tertiary levels water was spread with the help of numerous Agims and Musghas. The water management reforms replaced the Jewlet with concrete headwords and some other secondary Agims and Mughas with gabions. At field level, the indigenous water distribution system - from head to tail end and from field-to-field - is still operational. The headworks have six major components - main canal head regulator gates, secondary canal head regulator gates, culvert, scour sluice, gravel trap and breaching bund. The culvert replaced the Sheeb-Kethin open earthen canal. The scour sluice prevents coarse sediments from entering the main canal gates. The gravel trap collects the coarse sediment the scour sluice failed to remove and the breaching bund is an earthen embankment designed to fail at a discharge of 265 m3 s-1 thereby minimizing damage to the main concrete part of the headworks.
The major crops, sorghum and maize, complete their entire growth period (September to April) based on the soil moisture stored during the flood season from 15 June to 15 August. Thus, the existence of a deep soil profile with a good water holding capacity and infiltration rate is an important element for the sustainability of the system. The soils of the irrigated fields are silt loams. The available water holding capacity of these soils is on average 36 cm m-1, which is considered moderately high and their basic infiltration rate (19 mm hr-1) is moderately rapid.
The farmers categorize the floods into six types: very small, small, medium, moderately-large, large and very large. Based on the number of floods, the farmers classify the flood season into excellent, good, average and dry. A 13-year record (1992 to 2004) indicated that 25% of the years have been either dry or excellent and the remaining have been average or good. The medium and smaller floods accounted for 77% of the 229 floods that occurred. Moderately-large floods occurred at least twice a year, large floods occurred once a year, and very large floods occurred only once every two years.
The Indigenous Water Management System: the Pre-Water Management Reform Era The objectives of the indigenous water management systems that had operated for the past 100 years (1900 to 2000) were: - securing at least three and at most four irrigation turns of 50 cm each at the earliest time of
the flood/irrigation season. The farmers believe that a three irrigation turn can produce 4.5 ton ha-1 y-1 of sorghum or sorghum and maize; a fourth irrigation turn can possibly raise the yield by about 1 ton ha-1 y-1; two irrigation turns can result in only half the yield;
- promoting fair flood water sharing within and among the upstream, midstream and downstream irrigated areas. Simultaneous achievement of the above objectives was a formidable challenge,
particularly because the floods, the major source of irrigation water, are unpredictable in timing, volume and duration, and destructive in nature. To cope with the challenge, the farmers introduced two key water management pillars - a set of water rights and rules and an effective enforcing organization. The two most important rights and rules were:

XIV A Tradition in Transition: Water Management Reforms and Spate Irrigation Systems in Eritrea
- water right on sequence. This water right allocates small and medium, and occasionally moderately-large floods to the upstream fields; moderately-large and sometimes large floods to the midstream fields; and large and very large floods to the downstream fields;
- water right on irrigation turns. This water right states that a certain field is entitled to a second, third and fourth turn, only after all other fields receive one, two and three turns respectively. It further directs that in a new year, regardless of their location, the fields that remained dry in the previous year should get one turn before any of the other fields. These water rights and rules were largely observed. Medium and larger floods have
frequently destroyed the Agims and Musghas thereby increasing the likelihood of safeguarding the rights of the midstream and downstream fields to the large floods. The frequent failure of the indigenous structures also meant that ‘timely’ maintenance was vital if the prospect of diverting the next flood(s) was to be high. ‘The critical mass’ - the minimum amount of labour, draft animal and materials needed for maintenance - could only be made available through strong cooperation among upstream, midstream and downstream farmers. The fact that tail-end farmers were interested in sharing the burden of maintenance only if they were not systematically deprived of their water right, made ‘the critical mass’ key for serving as a check on too large an inequity in water sharing.
The farmers’ organization was effective in mobilizing the resources and in executing the maintenance work; protecting the rights of the downstream farmers and mitigating conflicts. This was because the Wadi Laba society was socio-economically homogenous (land holding per household was about 1 ha) and strongly believed in equity of water distribution; the farmers’ organization was fully autonomous in the ‘organizational dimension’ - the ‘organizational control of water’ - as it was entirely responsible for making decisions on how water should be distributed and it was only on its request that Government institutions interfered; the farmers’ organization was largely autonomous in the ‘financial dimension’ since most of the maintenance work of the Agims and Musghas was primarily accomplished by mobilizing the human labour and draft animals of the farming community - Government institutions provided only some materials such as shovels, spades and occasionally dozers - even that only if the farmers’ organization requested; the group leaders (Ternefti) and sub-group leaders (Teshakil) were elected and were largely accountable to the farmers.
The two pillars of the indigenous water management system succeeded in creating a perception of fairness in water sharing. This instilled a feeling of togetherness among the farming community, which led to the reality that in the past 10 decades when many devastating floods occurred, the community managed to largely prevent erosion and excess sedimentation in the canals and fields.
The indigenous water management system had, however, some failures. Only about 60% and 80% of the total 2,600 ha was irrigated during an average and good/excellent flood seasons, mainly because of the inability to adequately mitigate the unpredictability of the flood water. As a result, the farming community remained poor, living from hand to mouth, albeit homogenously. Moreover, the use of brushwood for frequent maintenance of the Agims and the Musghas was a major contributor to the 60% reduction in vegetation cover in the area. The elderly farmers explained that in the 1950s, they only walked about 15 minutes to fetch brushwood, whereas now, the shortest walking distance is 90 minutes.
Summary XV
The Water Management Reforms: If and How They Can Achieve their Set Targets The water management reforms have not attained their key targets: only 1,550 ha or 60% of the set target was fully irrigated (received three turns) in the excellent 2004 season when 28 floods occurred; the whole downstream Emdenay/Ede-Eket area (260 ha) remained dry in good and excellent seasons; there was no noticeable decline in the scale of deforestation.
Design and Layout Loopholes and Potential Remedial Measures Understanding the functioning of the indigenous water management system was recognized as being highly relevant to making an appropriate technical design and layout. It was, however, thought that such an understanding would require detailed and prolonged studies, and if taken to their logical conclusion, would involve deferring developments for years whilst data are being collected. Consequently, the design and layout were done with a major oversight to the main tenets of the indigenous water management system. This was the underlining cause for a number of design and layout loopholes that significantly contributed to the underperformance of the modern system. Addressing the loopholes would require: - replacing the Sheeb-Kethin culvert with a head regulator alongside the existing ones so
that it can supply water directly from the Wadi and restore the upstream water right of the farmers;
- providing the farthest midstream and the Emdenay and Ede-Eket downstream fields with separate gabion intakes to enable them to divert flood water directly from the canals, and even from the Wadi, when, for instance, the breaching bund fails. The ultimate objective of the technical interventions is to improve the supply and
distribution of flood water. In this regard, the following may be considered: - reducing the maximum number of irrigation turns from four/three to two. For example, if
the 1,550 ha that received three turns were irrigated only twice, about 7.75 million m3 of water could have been saved and additional 775 ha might have been irrigated;
- modifying the water right on sequence to: regardless of the size of the flood, if the upstream fields are irrigated twice by the mid/end of July, the subsequent flood water would have to be conveyed to the midstream/downstream fields. The presented suggestions are based on ‘residual soil moisture’ simulation results
obtained from the Soil Water Accounting Model (SWAM) that was developed as part of this research. Here, ‘residual soil moisture’ refers to the amount of water retained at the onset of the planting season following irrigation during the flood season.
The simulations with the model have revealed that when a field receives two, three or four turns, the residual soil moisture remains almost the same at 66 cm, 71 cm and 76 cm if the field gets its last turn by 15 July, 30 July and 15 August respectively. Even the 66 cm water depth (with minor contribution from rainfall), sufficiently supports 4.5 ton ha-1 y-1. Unlike in the indigenous system, when the fields usually received a third turn by the end of the flood season, the concrete structures of the modern system have made it possible for some upstream farmers to irrigate three or even four times by July.

XVI A Tradition in Transition: Water Management Reforms and Spate Irrigation Systems in Eritrea
Institutional and Legal Challenges and Possible Solutions Given the destructive nature of the floods, also the modern structures can be damaged any time. These structures necessitate a different type of maintenance. They do not depend on labour and the collection of brushwood, but instead require earthmoving machinery, such as loaders and bulldozers, which in turn call for different organizations, managerially, financially and technically. Over 30 years of management of spate systems by large Government irrigation institutions have proven that such institutions have difficulty in handling the task all by themselves. More than anything, chronic under-funding of maintenance and the loss of vigour in the operation and maintenance departments were the undoing. It left a vacuum where it was not clear who was responsible for water distribution with no one doing the hard work of timely maintenance. Proper operation and maintenance of modern spate irrigation systems necessitate farmers’ organizations that serve as credible partners, but also that play a lead role.
In the Wadi Laba, great strides have been made with the establishment of the farmers’ organization with almost full membership of all farmers and the universal endorsement of its by-laws. The leadership of the organization is very much based on the time-tested system of Ternefti and Tesahkil. The major task remaining is creating the conditions that can restore the financial and organizational autonomy and thus accountability of the organization. To this end, the following may be recommended: - introducing a water fee system where each farmer would have to make annual or monthly
contributions for operation and maintenance. This is being implemented; - instituting laws that strengthen the legal authority of the farmers’ organization in activities
such as making direct contacts with supporting agencies and running independent bank accounts so as to generate sufficient financial resources for major repair works. Apart from the above points, there are issues related to the 1994 Land Proclamation that
need to be addressed. Till 2000, the farmers’ organization and the community as a whole never bothered to clarify what impact the provisions of the 1994 Land Proclamation could have on their rights and obligations to use and run their irrigated land and water resources. Since the implementation of the water management reforms in 2000, however, some farmers and their leaders are frequently asking the question: after the huge financial investments will the Government still allow us to continue to own and utilize ‘our’ land and flood water? The urgency to get an answer to this question emanates from the perceived fear of the farmers that the Government may use the 1994 Land Proclamation as a legal tool to dispossess them of the land they had considered theirs for decades. In Eritrea, owning or having land usufructuary right is a prerequisite to secure a water right for agricultural production.
For generations, the farmers have practised the traditional land tenure system, the Risti (literally translated, inherited land from the founding fathers). Under Risti, ownership of land in a village is vested on the Enda - the extended family that has direct lineage to the founding fathers of the village. The system discriminates against women and may also cause fragmentation of land as it allows partitioning of land through inheritance, but it bestows a strong sense of land and hence water security on the eligible landholders. Its key provision directs that no institution or individual has the right or the power to confiscate a land allocated to a verified Enda member. In contrast, the main provision of the Land Proclamation states

Summary XVII
that the Government or its appropriate Government body has the absolute right and the power to expropriate land that people have been using for agricultural or other activities, for purposes of various development and capital investment projects aimed at boosting national reconstruction. Justified or not, this provision has created a genuine concern of land and water insecurity among the farmers, which is being heightened by the Government’s insistence to replace the sorghum and maize food crops with cotton, despite strong reservations of the farmers. Consequently, the farmers are increasingly becoming reluctant to participate in the operation and maintenance of the system. Addressing the problem may require adopting supplementary provincial/sub-provincial legislations that plainly clarify in the post water management era, what kind of obligations and land and water user rights do the communities have? What decision-making power do these user rights confer on the farmers’ organization as far as modifying/changing the cropping pattern, the water rights and rules, and other important land and water utilization activities are concerned?
Salinity and Sodicity and their Impact on Crop Yield The discussion so far has focused on water quantity, but ‘water quality’ (salinity and sodicity) can also have a profound impact on crop production. Salinity can reduce yields by inducing soil moisture stress and sodicity by causing toxicity and poor infiltration rates.
The water management reforms did not give proper attention to water quality management - the risk of soil salinization and sodium build-up was not adequately assessed. This is because there is a shared perception among the majority of the farmers and irrigation specialists that the floods supply good quality irrigation water, which does not cause soil salinization and sodicity to a level that would reduce sorghum and maize yields or limit infiltration rate. In this study, systematic soil and water analyses were conducted to conclusively determine the long term (10 to 15 years) impact of salinity and sodicity on sorghum and maize yields and the infiltration rate of the irrigated fields. The medium floods were found to be non saline, the moderately large floods slightly saline, the large floods slight to moderately saline and the very large floods moderately saline. Assuming that the existing water rights and rules on sequence and irrigation turns are adhered to, the deductions that can be made with regard to the yield reductions induced by the different flood sizes are: - sorghum and maize yields in the upstream fields will not decline regardless of whether
they are irrigated twice or three times; - sorghum yield in the midstream fields that receive two irrigation turns may not decrease,
but maize yield could decline by 30% to 50%. If the fields get three irrigation turns - two from the moderately large and one from the large floods, the maximum maize yield loss would be about 10%;
- the downstream fields will be the most affected. In the worst scenario, when a field receives two irrigation turns from very large floods, sorghum and maize yields could decrease 75% and 100% respectively. In the best scenario, when a field is irrigated thrice with large floods, only maize yield could decline by 30%. The presented analyses assume that a three irrigation turn at the least furnishes 0.3
Leaching Fraction (LF) as compared to 0.1 LF by a two irrigation turn. According to the SWAM model, the water loss due to evaporation was on average 700 and 900 m3 ha-1 y-1 in the fields irrigated twice and thrice respectively.
XVIII A Tradition in Transition: Water Management Reforms and Spate Irrigation Systems in Eritrea
The proposals to minimize salinity induced sorghum and maize yield losses are: - modifying the water right on sequence and providing separate intakes for midstream/
downstream fields; - limiting the maximum irrigation application to two turns of 6,000 m3 ha-1 y-1 each. This
provides 0.3 LF, while allowing considerable water saving. 4.7 million m3 could be saved from the 1,550 ha that received 15,000 m3 ha-1 y-1, and this can irrigate additional 390 ha;
- strengthening the farmers’ awareness of salinity and its impacts on crop yield so that they grow only sorghum in the fields irrigated by large floods;
- introducing a water management policy of discharging the very large floods to the Wadi and convincing the farmers not to use them. Besides their high impact on maize and sorghum yields, the very large floods are the most destructive and the scarcest;
- giving preference to at least those moderately tolerant to salinity should the need arise to introduce new crops. Coming to sodicity, the existing adjusted Sodium Adsorption Ratio (RNa) method and the
rootzone Average Sodicity Ration (RNae) approach suggested in this research have shown that the floods cause neither infiltration problems nor plant toxicity. However, the toxicity index, the Exchangeable Sodium Percentage (ESP), obtained from the RNae was 9% while that derived from the RNa was only 1.6%. In moderately sensitive crops such as maize, sodium toxicity can occur at an ESP value of 10%.
Nutrient Depletion and its Effects on Crop Yield Obtaining optimum crop yield requires more than just providing the right amount and quality of water at the right moment. It necessitates a sufficient supply of all 16 nutrients, the macro nutrients Nitrogen, Phosphorous and Potassium (NPK) in particular. NPK are needed in large quantities but are usually deficient in many African soils. During the water management reform interventions, it was assumed that the floods deliver sufficient nutrients and that there is no need for any artificial fertilizer application. This assumption was, however, merely based on the fact that nutrient deficiency symptoms had not been observed in the irrigated fields. It is, however, worth noting that slight and moderate nutrient deficiency symptoms could go unnoticed and sometimes be confused with other complex field events, such as salt damage, disease and drought.
In the upper catchment, the source of nutrients for the irrigated fields, rainfed sorghum yield has decreased from 1 ton ha-1 y-1 in 1950s to almost none in 2000 and most fields now at best produce forage. This is attributed to erosion of the relatively fertile topsoil. Nonetheless, the nutrient depletion issue in the upper catchment was only given attention in the past 5 years. This is because until 2000, the owners of the rainfed fields and the majority of the inhabitants of the upper catchment villages were mainly those who also had irrigated lands in the lower catchment. These farmers largely relied for their food crops on the irrigated lands, and the rainfed fields were only used for supplementary food and fodder needs. The permanent settlers, who entirely make their livelihood from the resources of the upper catchment, have been insignificant in number. Since 2000, the Government has been encouraging the grouping of scattered villages for administrative, better land utilization and other development reasons. This has increased the number of permanent inhabitants, which is still on the rise. The upper catchment is thus increasingly becoming viewed not only as the
Summary XIX
supplier of nutrients and sediments for the spate irrigated areas, but also as the resource base for providing livelihood to its permanent settlers. Accordingly, the Government has drafted plans to introduce soil and water conservation measures such as terraces. If this intervention is followed though, it will negatively affect the future supply of sediment and nutrients to the spate irrigated fields.
In line with the above noted realities, the flood water-sediment-nutrient analyses conducted was tailored at testing the following hypothesis: all the different categories of the floods are currently furnishing and will in the future provide sufficient quantities of NPK for 4.5 ton ha-1 y-1 grain and 2 ton ha-1 y-1forage sorghum production and thus there is no need for artificial fertility replenishment. The hypothesis was tested for each of the water application (m3 ha-1 y-1) conditions: a) 15,000; b) 12,000; c) 10,000; d) 5,300, e) 3,800. On the basis of the flood-sediment-nutrient analyses results, the veracity of the hypothesis could be interpreted as follows: - under the current sediment concentrations of the different flood categories, the
hypothesis is true under conditions a, b and c. It is only partially true under conditions d and e as the medium floods will respectively supply only about 70 and 50% of the nitrogen required for sorghum grain/forage production of 4.5/2 ton ha-1 y-1;
- at some future point in time when the sediment concentrations of the floods would be half of what it currently is, the hypothesis would be fully true under condition a; but only partially true under the conditions b, c, d and e;
- at some further future point in time when the current sediment concentrations of the floods would be reduced by three quarters, the hypothesis would only be partially true under all the conditions a, b, c d and e. The nitrogen supply by medium and smaller floods is a concern. The severity of nutrient
depletion in the upper catchment is already acknowledged by the Government; and economic conditions permitting, soil and water conservation measures are likely to be implemented at a fast pace and a large scale. This could, in a short period of time, lead to two or three fold reduction in the sediment concentration. Consequently, the nitrogen supply could be deficient by 65 kg ha-1 y-1 or 50% of what is needed to sustain the stated sorghum yield. Therefore, replenishing the fertility of the irrigated fields with artificial application of nitrogen is inevitable. The presented flood water-sediment-nutrient analyses could serve as a basis for coordinating the soil and water conservation activities in the upper catchment, and the field experiments and awareness creation campaigns with regard to soil fertility management practices in the irrigated fields. It is remarkable to note that fertility management in the Wadi Laba would not be only a technical and an economical challenge, but also a social challenge. Technically, effective fertilizer application is difficult. Since large uncontrolled quantities of water are applied at each irrigation turn, fertilizer losses could be high. This could pose an economical challenge - ensuring each additional US$ fertilizer input results in a sorghum yield US$ profit margin. As to the social challenge, it would need a lot of training and educational campaigns, and concrete on-site field experiments that show tangible favourable results to convince the farmers to adopt a certain artificial fertility management approach.

XX A Tradition in Transition: Water Management Reforms and Spate Irrigation Systems in Eritrea
Major Contributions of this Research Apart from the technical, institutional, legal and environmental improvement measures recommended specifically for the Wadi Laba spate irrigation system, this research has made the following contributions for the management and development of (spate) irrigation systems in Eritrea and in other countries: - the SWAM model, which can be a useful water management tool for irrigation technicians
with limited modelling know-how and/or operating under data scarce conditions. It has been validated with the more complex, well established SWAP model.
- considering salinity and sodicity as part of the economic and technical package for deciding the maximum design discharge cap, which has never been the case so far;
- the sodicity assessment approach, the RNae, which is more stringent than the existing RNa method;
- having two head regulator gates instead of one, which has been and is still the choice to avoid sedimentation problems. A single regulator gate does not handle sedimentation problems well; it can also deprive farmers of their water rights and hinder the much needed flexibility in flood water sharing;
- moving away from a simplistic understanding of water rights and rules - considering water rights and rules as fixed quantities and entitlements (this is still guiding spate irrigation water management reforms) - to treating water rights and rules as operational rights and rules that form part of the water management bundle;
- contrary to the opinion shared by several water management scholars, national/provincial laws are not always of marginal significance. Indigenous water rights and rules do not necessarily sufficiently address the water management needs of (spate) irrigation systems that benefit rural (poor) communities. Following infrastructural reforms, having in place appropriate national/provincial laws becomes a key factor for making farmers and their organizations willing and capable water management partner, and it is hence important for meeting the water management requirements of the spate irrigation systems.
Broad Future Outlook: Rethinking of Existing Water Management Reform Approaches Water management reforms in several indigenous spate irrigation systems have had limited success in attaining their stated objective - enhancing crop production and improving the livelihood of poor communities. Apart from addressing the many site specific factors, rethinking of some aspects of the existing common approaches may be needed if future water management reforms are to have a better prospect of achieving the said objective.
The first aspect relates to the incomplete nature of the technical package. Most water management reforms have started and ended at the main system level where at most two concrete intakes have been introduced. This reality has apparently been driven by the desire to generate an economical return. In some countries, the cost of such concrete intakes has ranged from US$ 1,500 to 2,500 per hectare and this, given the inherent uncertainties in water supply and risks in crop production in spate irrigation systems, has made significant secondary and tertiary level investments economically hardly feasible. Experiences have shown that the concrete intakes are in fact not in line with the field-to-field water distribution system widely practised in many indigenous spate irrigation systems and cause excess abstraction of water in upstream areas that does not necessarily serve a productive

Summary XXI
purpose; and drying of downstream fields. Moreover, the more recent shift from a two to a single intake approach to address sedimentation problems has not delivered. In the several indigenous spate irrigation systems with a two main canal system layout, the one intake approach has not adequately controlled sedimentation at the main system level. In addition, it also can potentially induce sedimentation problems at secondary levels.
The second aspect deals with the misconception about the indigenous water rights and rules. In most water management reforms, water rights and rules have been considered fixed entitlements and to enforce them the focus has been on structural designs that promote a fixed proportional water distribution system. In spate irrigation, where one can not with certainty tell when a flood will occur, what its duration and amount will be and even which areas it will irrigate, the water rights and rules would have to be regarded as operational rules that need to be tailored to reflect the new water distribution realities. This would, in most cases, require having at least two concrete intakes at the main system supplemented with secondary and tertiary intakes; and adoption of a group-of-fields water distribution system. This may in turn imply that the ‘social benefit’ - improving the livelihoods of the respective poor communities - would have to be the basis for justifying investments. Strong concrete intakes are important; but the fact that some violent floods, which can destroy even the concrete structures are used as a source of irrigation water, tips the balance towards timely (re)construction, operation and maintenance of the infrastructure. Thus, even if ‘economical return’ is set to be the guiding principle, it is imperative that the multiple intake approach is adhered to by introducing rock-fill/gabion structures.
The third aspect concerns the impacts of inadequate incorporation of water quality (salinity and sodicity) and nutrient fertility degradation management into the water management reform bundle. As was the case in the Wadi Laba, upper catchments may contain salt bearing minerals and some of the floods they generate can be saline and/or sodic and can significantly reduce crop yields. Likewise, large scale soil and water conservation measures, and these are needed to preserve the resource base of upper catchments and sustain the livelihood of their inhabitants, can curb the sediment and thus, the nutrient supply to the irrigated fields.
The fourth aspect relates to the creation of dual institutional structures. The introduction of formal institutions seems to have become an almost automatic requirement in water management reforms. In some systems, this has no added value; rather, it can undermine the informal, sufficiently organized institutions that enjoy a broad support of the respective community. Moreover, the usually adopted approach that contemplates a blanket 50% representation of the community as a benchmark for a successful establishment of formal institutions needs to be reconsidered. Obviously, 50% success also means 50% failure and the majority of the half of the community left out could be the relatively poor.
Finally, it has to be emphasized that the discussed technical, institutional, legal, and environmental (salinity and sodicity, and nutrient degradation) aspects would have to be taken as one package so as the impact of their interactions and interdependences can be properly understood and analyzed.

XXII A Tradition in Transition: Water Management Reforms and Spate Irrigation Systems in Eritrea

Country Background 1
1 Country Background
1.1 Country Profile
Eritrea is a small country in the Horn of Africa, bordered by the Sudan in the Northwest, Ethiopia in the South, Djibouti in the Southeast and the Red Sea in the East (Figure 1.1). It has two main ports at the Red Sea coast, Massawa and Aseb. The country has a total land area of 12.1 million ha and a population of 4.4 million (2005), which is increasing at an annual rate of 3%. About one seventh of the population lives in the capital, Asmara. The rural/urban and the male/female ratios of the population are 80:20 and 0.99:1 respectively. Roughly 45% of the population is below 14 years of age, 52% is in the range of 15 to 64 and 3% above 65 years (Central Intelligence Agency, 2006).
Figure 1.1 Location map of Eritrea (Stillhardt, et al., 2003)
Eritrea has a large variation in landscape and climatic features. The terrain varies dramatically from the highest point in the central Highlands at Mountain Soira, 3,018 m+MSL (Mean Sea Level); descending to sea level on the East, to the coastal desert plain and the arid Sudan border and finally falling to 75 m-MSL near Kulul at the Danakil depression near the Djibouti border (Central Intelligence Agency, 2006). The climate is
2 A Tradition in Transition: Water Management Reforms and Spate Irrigation Systems in Eritrea
characterized by hot and dry conditions in the desert strip along the Red Sea coast, and cooler and wetter in the central Highlands. 70% of the country is classified as hot to very hot with a mean annual temperature of more than 27 oC, 25% as warm to mild with a mean annual temperature of about 22 oC and the remaining 5% as cool with a mean annual temperature of less than 19 oC (Ogbazghi, 2001). As to rainfall, about 50% of the country receives less than 200 mm, 40% between 300 and 600 mm and nearly 10% more than 600 mm per annum. As in the rest of Sahelian Africa, Eritrea receives its rainfall from April/May to September/October except for the coastal areas, which receive their rain between November/December and February/March. The problem of inadequate total rainfall over most of the country is compounded by the high variability of its distribution.
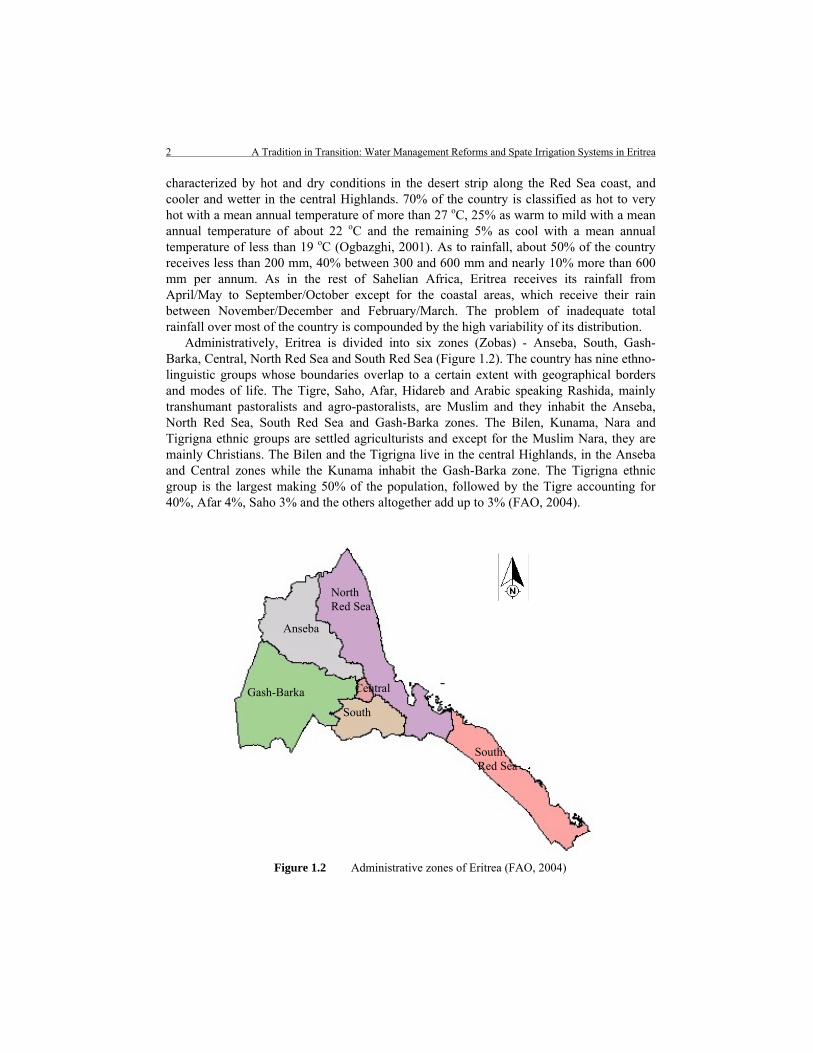
Administratively, Eritrea is divided into six zones (Zobas) - Anseba, South, Gash-Barka, Central, North Red Sea and South Red Sea (Figure 1.2). The country has nine ethno-linguistic groups whose boundaries overlap to a certain extent with geographical borders and modes of life. The Tigre, Saho, Afar, Hidareb and Arabic speaking Rashida, mainly transhumant pastoralists and agro-pastoralists, are Muslim and they inhabit the Anseba, North Red Sea, South Red Sea and Gash-Barka zones. The Bilen, Kunama, Nara and Tigrigna ethnic groups are settled agriculturists and except for the Muslim Nara, they are mainly Christians. The Bilen and the Tigrigna live in the central Highlands, in the Anseba and Central zones while the Kunama inhabit the Gash-Barka zone. The Tigrigna ethnic group is the largest making 50% of the population, followed by the Tigre accounting for 40%, Afar 4%, Saho 3% and the others altogether add up to 3% (FAO, 2004).
Figure 1.2 Administrative zones of Eritrea (FAO, 2004)
North Red Sea
South Red Sea
South
Gash-Barka Central
Anseba

Country Background 3
1.2 History in Brief
Largely due to its strategic location along the Red Sea route between Europe and Asia, for most of its history, Eritrea has been the victim of expansionists and colonizers, including the Ottomans, Egyptians, Italians, and Ethiopians. The Bejas, Turks and Egyptians invaded Eritrea beginning from early to medieval periods. With the opening of the Suez Canal in 1869, the European powers showed increased interest in the region, resulting in the formation of the first Italian colony. The Italians captured the port town of Massawa in 1898 with the aim of establishing permanent residence. They invested heavily in Eritrea, particularly in infrastructure and agriculture, as they viewed Eritrea as a springboard for further East African conquest (Connell, 2005). They confiscated land of high agricultural potential from the indigenous population and transformed it to large-scale commercial farms owned by Italian entrepreneurs.
In 1939, the British defeated the Italians and put Eritrea under a British military administration from 1941 through 1951. This was the time that witnessed increased popular apprising by the Eritrean people for independence. Despite the call by the Eritrean people and some countries for a free nation, the United Nations adopted a resolution in 1952 that put Eritrea in federation with Ethiopia, with a recognition of self-autonomy. Ethiopia, however, immediately abandoned the federation status and annexed the territory of Eritrea. This violation by Ethiopia led to a series of peaceful demonstrations and finally to an armed struggle in 1961 that went on for 30 years. In 1993, a referendum was held under the United Nations supervision when 99.8% of the Eritrean people voted in favour of full independence and Eritrea was admitted to a full membership of the United Nations as the 182nd member nation (Connell, 2005).
In 1994, the country's first elections since independence from Ethiopia took place. The PFDJ (People's Front for Democracy and Justice) that was formerly known as EPLF (Eritrea People Liberation Front) and that had led the country to independence won 284 of the 303 declared results. Mr. Issaias Afwerki, who led the EPLF to victory, became the first elected president of the provisional Government of the State of Eritrea. With participation of the population the first constitution of Eritrea was drafted between 1994 and 1997. On May 23rd 1997, a 527-member Constituent Assembly comprised of the 150 members of the provisional National Assembly, the elected representatives of the six Zoba Assemblies and representatives from the diaspora ratified the constitution. Although general parliamentary and presidential elections were announced for 2001, they have yet to be carried out.
1.3 The Agriculture Sector In Eritrea, agriculture mainly consists of subsistence rainfed crop production, irrigation and pastoralism. It is the main stay of the economy engaging about 80% of the population (Central Intelligence Agency, 2006). The total arable land is estimated at about 1.2 million ha. About 50% of this, however, lies in the arid and semi-desert parts of the country, which receive a mean annual rainfall of below 200 mm making rainfed agriculture impossible. Even in those areas with an annual rainfall of above 400 mm, crop failures are frequent due to mainly the erratic nature of the rainfall. Furthermore, deforestation, desertification, soil erosion and overgrazing have tremendously impoverished the soil in the arable land in
4 A Tradition in Transition: Water Management Reforms and Spate Irrigation Systems in Eritrea
Eritrea in general and have resulted in severe land fertility degradation in many of the Highland farmlands in particular.
Irrigated agriculture in Eritrea currently covers about 28,000 ha with a potential variously reported at approximately 300,000 ha and 600,000 ha (FAO, 1997). The lower estimate does not cover the Eastern Lowlands where spate irrigation is practised, whereas the higher estimate does not take into account the availability and accessibility of water for irrigation.
The Ministry of Agriculture (1995) estimated the potential spate irrigable area at about 137,000 ha. This, however, is not based on any hydrological data of the concerned wadis (ephemeral streams) - it merely indicates the total land area that can be utilized for spate irrigation. International Fund for Agricultural Development (1995), based on very limited discharge data of some of the wadis, projected the potential spate irrigable area at 91,000 ha. The researcher believes the latter estimate is more reliable and will hence be used throughout this document. This implies that the total potential irrigable area that will be considered for further analysis in the following Chapters is 391,000 ha.
Eritrea is divided into six agro-ecological zones based on broad similarities of moisture and temperature regimes, natural vegetation cover, soils and land use (FAO, 2004). These are: the Moist Highland Zone (MHZ), situated at altitudes over 1,500 m+MSL with average annual rainfall between 500 and 700 mm, the Arid Highland Zone (AHZ) located at altitudes between 1,000 and 1,500 m+MSL with average annual rainfall in the range of 200 to 400 mm; the Moist Lowland Zone (MLZ), situated at altitudes between 750 and 1,000 m+MSL receiving annual rainfall between 400 to 600 mm per annum; the Arid Lowland Zone (ALZ), located at altitudes between 600 and 750 m+MSL with average annual rainfall of less than 200 to 300 mm; the Sub-Humid Escarpment Zone (SHEZ), situated between 750 to over 2,000 m+MSL, with mean annual rainfall of 700 to more than 1,000 mm; the Semi-Desert Zone (SDZ), located at altitudes from below sea level to 600 m+MSL with average annual rainfall of less than 200 mm. Table 1.1 presents the land coverage of the six agro-ecological zones.
Table 1.1 Land coverage of the six agro-ecological zones (FAO, 2004)
Agro-ecological zones Land coverage (%)
Moist Highland zone 8.7
Arid Highland zone 2.5
Moist Lowland zone 15.9
Arid Lowland zone 33.3
Sub-humid escarpment zone 0.9
Semi-desert zone 38.7
Total 100.0
In the Highlands, the average farm size is 1 ha or less. The farmers produce mainly wheat, barley, sorghum, teff, peas, beans, chickpeas and linseed. The farmers depend largely on oxen for ploughing and threshing, while small ruminants are reared by most of the families for meat and milk and as a source of cash. There is an acute shortage of fuel-

Country Background 5
wood in this area, which can be primarily attributed to the natural and human induced extensive deforestation that has occurred in the past century. Animal manure is used as the main source of fuel and is therefore not available as fertilizer. This results in a declining soil fertility and production. A minority of farmers has been able to invest in the development of irrigation and produce vegetables - potatoes, tomatoes, pepper and onions - for the local market. The standard of living of these farmers is significantly higher than those relying solely on rainfed cereal production (Leipzig, 1996).
In the Western Lowlands, a large proportion of the population practises an agro-pastoralist production system, with various degrees of transhumance of people and livestock. There are nomadic pastoralist tribes whose main activity is rearing of livestock - camels, cattle and small ruminants - with large transhumant movement of both family and livestock in search of pasture and water. There are also semi-sedentary agro-pastoralists where the main activity remains livestock rearing, but where cultivation of sorghum, pearl millet and sesame are significant. They practise seasonal, shorter transhumant movements of both the homestead and the herd. There are as well sedentary farmers practising a typical mixed crop/livestock production system with crop production being more intensive and with the family living in one village all the year round. Recently, there has been a development of medium and large-scale commercial farmers favoured by distribution of land concession by the Government and availability of capital. They practise mechanized large-scale rainfed cultivation of sorghum and sesame and/or medium-scale irrigated production of bananas and citrus for local consumption and export (Leipzig, 1996).
The areas in the Highlands and the Western Lowlands where some of the major food crops are grown are presented in Figure 1.3. A simple general cropping calendar that shows the sowing and harvesting periods of some of these crops is portrayed in Figure 1.4.
Figure 1.3 Crop zones in the Highlands and Western Lowlands of Eritrea (FAO, 2006)

6 A Tradition in Transition: Water Management Reforms and Spate Irrigation Systems in Eritrea
Wheat
Maize
Millet
Sorghum
Barley
J F M A M J J A S O N D
Sowing and early growth stage Development stage Late growth and harvesting stage
Figure 1.4 General cropping calendar of some major crops in the Highlands and Western Lowlands of Eritrea (FAO, 2006)
Only some parts of the Eastern Lowlands have potential for crop production. These are found in the North Red Sea Zone (Figure 1.2) where there is potential for spate irrigation development using floods generated by heavy rainfall in the Highlands. The soils in these areas are predominantly silt loam and have a deep profile with good water holding capacity. The main activity of the inhabitants of the region is cultivation of sorghum under spate irrigation - ratoon cropping of sorghum or a second crop of maize on residual moisture may be possible in good flood seasons. Additional activities include rearing of mixed herds including camels, cattle and many small ruminants.
1.4 Water Resources
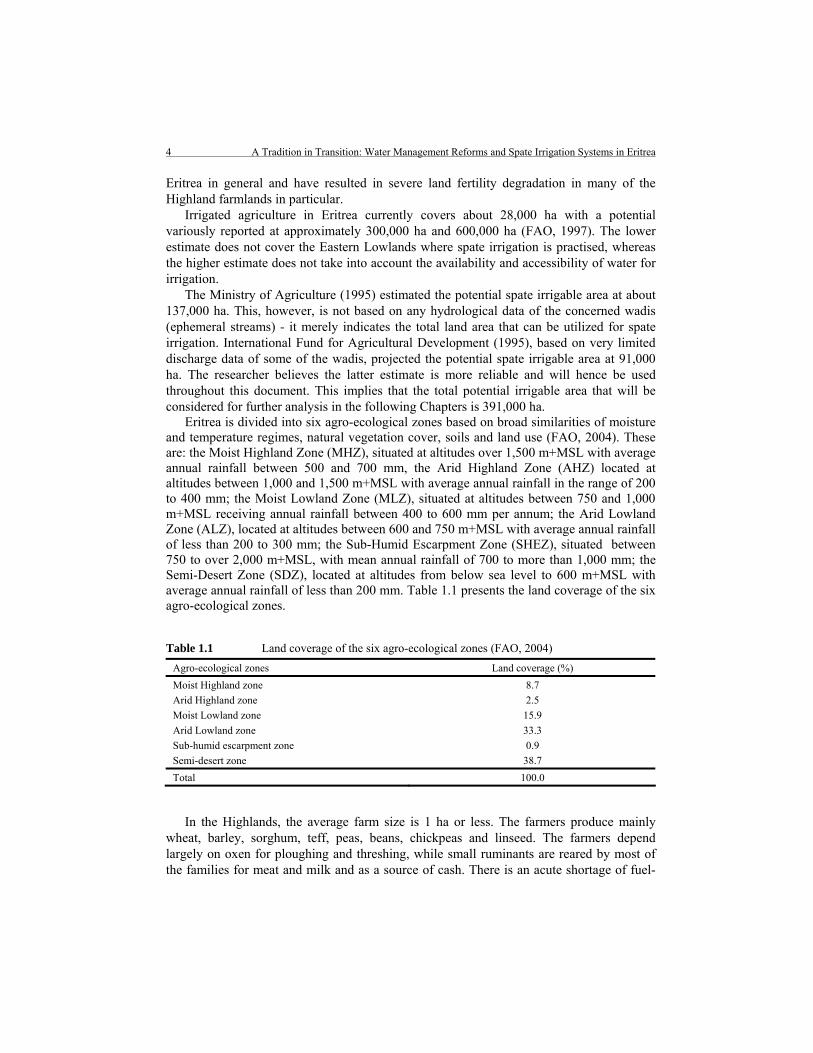
Unfortunately, Eritrea is not well endowed with fresh ground and surface water resources owing to the arid climate prevailing in the country and due to the shortage in amount and the erratic nature of the rainfall. Eritrea has five main drainage basins, namely the Mereb-Gash, the Setit, the Barka-Anseba, the Red Sea and the enclosed Danakil basins (Figure 1.5). The estimated annual flow volumes of the drainage basins are given in Table 1.2.
All these rivers (except the Setit River) are ephemeral, and flow during the rainy season from July to September. The Mereb-Gash, the Barka-Anseba and the Setit rivers all flow into the Western Lowlands, and discharge towards the Eastern Sudanese plains. The Mereb-Gash is a narrow Westward oriented basin covering the area from the Southern part of the central Highlands to the Sudanese border. The Setit River has perennial flows along the Southwestern zone, which shares a common border with Ethiopia. The Barka-Anseba river originate from the Northwestern slopes of the central Highlands and flow Northward to a confluence close to the Sudan border in the extreme Northwest of Eritrea. Although the annual rainfall volume of the Anseba-Barka basin is estimated at 14,815 million m3, the annual flow volume is projected at only 41 million m3. This is probably because much of
Country Background 7
the flow is rapidly infiltrated into the very coarse sandy plains of the river valleys and most of it is evaporated (FAO, 1994).
200 0 200 400 Kilometers
Anseba-Barka
Mereb-Gash DanakilSetit
Small basins
Small basins
Red Sea
Red sea
Figure 1.5 Major drainage basins of Eritrea (based on Centre for Development and Environment, CDE, Data)
Table 1.2 Estimated annual flow volume, catchment area and rainfall of the major drainage basins (FAO, 1994)
Catchment
Drainage basin Catchment
area in 103 ha (1)
Mean annual rainfall in mm
(2)
Mean annual rainfall volume
in Mm3 (3) = (1) × (2)
Annual flow volume in Mm3
(4)
Mean annual runoff
coefficient (5) = (4) ÷ (3)
Red Sea 4,469 350 15,641 444 0.028
Anseba-Barka 3,951 375 14,815 41 0.003
Mereb-Gash 2,346 600 14,073 532 0.038
Danakil basin 1,053 200 2,106 135 0.064
Setit basin 752 650 4,886 49 0.010
Total 12,571 - 51,521 1,201 0.023
As to the groundwater potential, no systematic investigation has been carried out and evaluations have been principally based on interpretations of aerial photography, satellite imagery and on geological maps. A large number of boreholes have been drilled throughout

8 A Tradition in Transition: Water Management Reforms and Spate Irrigation Systems in Eritrea
the country for domestic water supplies, but systematic logging has not been carried out and yields have only been estimated and not measured.
The most important group of aquifers are the unconsolidated deposits of alluvial (Qa) or colluvial/elluvial (Qc) origin, which are unconfined with intergranular permeability. The depth to groundwater in these aquifers ranges from less than 10 m to more than 150 m. Due to their heterogeneous nature, they have varying development potential, with transmissivity ranging from 100 to 3,000 m2 d-1. Water quality is generally fair to good, but deteriorates significantly with salinity increasing with depth, distance from river channels and approaching the coast.
The alluvial deposits of the main river channels offer significant potential for irrigation from the shallow groundwater, which is presently being exploited. Similarly, the colluvial sediments, which have been mapped as covering much of the Mansura and Agordat plains in the Western Lowlands, appear from satellite images to consist mainly of sheet wash/residual soils, which can be of limited thickness (FAO, 1994).
Much of the country is covered by basement rock with localised and limited groundwater resources along the weathered and fractured zones. Exploitation for irrigation is usually limited to alluvial derivatives in river valleys, where yields of up to 5 l s-1 can be obtained.
1.5 Land and Water Development
The basis for developing land and water resources is to have an accurate assessment of their current availability and their potential. As explained earlier, there are two estimates of the irrigable land with remarkable discrepancies. The water resource estimation presented in the above is not based on sufficient field data. It is hence important that the Water Resource Department and other concerned government and non-government institutions share and utilize efficiently the limited resources available at their disposal to make a detailed and a more reliable national, zonal and sub-zonal land and water resources assessment.
In the past 30 years till 1993, when Eritrea was under various colonies, little investment has been made into the development of the irrigation systems. Since independence in 1993, the government of the State of Eritrea, recognizing that irrigation can play a significant role in attaining food security, has been, and is committed to be engaged in expansion, remodelling and modernization of many small and large scale irrigation systems. Spate irrigation is currently being given special attention and already two irrigation systems - the Wadi Laba and Mai-ule - have been subject to water management reform interventions. Although it is undeniable that Eritrea direly needs speedy development activities, the sustainability of the land and water development should be given proper attention when embarking on large-scale irrigation projects. Different experts have defined ‘sustainable’ development in various ways. ‘Sustainable’ development is used in this document as it is defined by the ‘2002 Johannesburg World Summit on Sustainable Development’. In that summit, ‘sustainable development’ was defined as the management and conservation of the natural resource base, and the orientation of technological and institutional change in such a manner as to ensure the attainment and continued satisfaction of human needs for present and future generations’. Such ‘sustainable’ development in spate irrigation systems would
Country Background 9
have to necessarily conserve and manage land, water, plant and animal resources, and would have to be technically appropriate, economically viable and socially acceptable.
There is no doubt that irrigation, as in many arid and semi-arid countries, has the potential to play an important role in boosting crop production in Eritrea. It can enhance food security, promote economic growth, create employment opportunities and improve living conditions of small-scale and large-scale farmers and thus contribute to poverty reduction. If irrigation is not properly managed, however, it can have adverse effects on the environment and the users that may ultimately put at risk the sustainable development of land and water resources. For example, irrigated agriculture supplied with poor drainage infrastructure may lead to salt build-up in soils and pollute the limited available fresh surface and groundwater resources. Likewise, irrigation systems that lack suitable managing institutions that can distribute water in line with agreed (by the majority of users) set of rules and entitlements may among other things lead to the downfall of tail-end users, leaving them unprotected against the excessive capture of the water by the head-end users. This may have a two-fold negative impact. The downstream area getting less water than its agronomic requirement will operate below its productivity potential; the upstream land receiving excess water will not show any yield improvement, as the extra water is not serving a productive purpose.
It is worthy of note that irrigation would have to be necessarily supported by rainfed agriculture if food self-reliance and/or food security is to be achieved in Eritrea. In recognition of this, the government has channelled many resources to expand and mechanize the rainfed agriculture through collective farming and noticeable successes have been observed. Nevertheless, as the rainfall in Eritrea is unreliable in both amount and distribution, on-farm water conservation techniques such as soil or stone bunding (they are almost not practised in the Western Lowland rainfed fields), distribution to the farmers of drought resistance short growing cycle crops, proper training of farmers on how to optimally apply fertilizers are among the measures that would have to be given utmost attention if the sustainability of land and water development is to be realized.

10 A Tradition in Transition: Water Management Reforms and Spate Irrigation Systems in Eritrea
Research Background 11
2 Research Background
2.1 Irrigation, Water Scarcity and Food Security: Global, Regional and National Perspectives
Three broad categories of countries may be identified based on the Gross National Income per capita (GNI) and the classification as given by United Nations Conference on Trade and Development (UNCTAD) (Schultz, et al., 2005). These are: the developed, the emerging and the least developed. GNI is defined as the Gross Domestic Product (GDP) plus net receipts of primary income (compensation of employees and property income) from abroad, divided by the midyear population. The UNCTAD classification is based on factors as: low national income (per capita GDP under US$ 900), weak human assets (a composite index based on health, nutrition and education indicators) and high economic vulnerability (a composite index based on indicators of instability of agricultural production and exports, inadequate diversification and economic smallness) (Schultz, et al., 2005).
The developed countries have a GNI greater than US$ 9,206 and include most of the countries in Western and Central Europe, North America and some countries in Central and South America, the larger countries in Oceania and some countries in Asia. The emerging countries with a GNI less than US$ 9,205 comprise of most of the Eastern European countries (including Russia), majority of the countries in Central and South America, most of the countries in Asia (including China, India and Indonesia), and several countries in Africa. The least developed countries (based on UNCTAD classification) are mainly in Africa, but also include the smaller countries in Oceania (Schultz, et al., 2005).
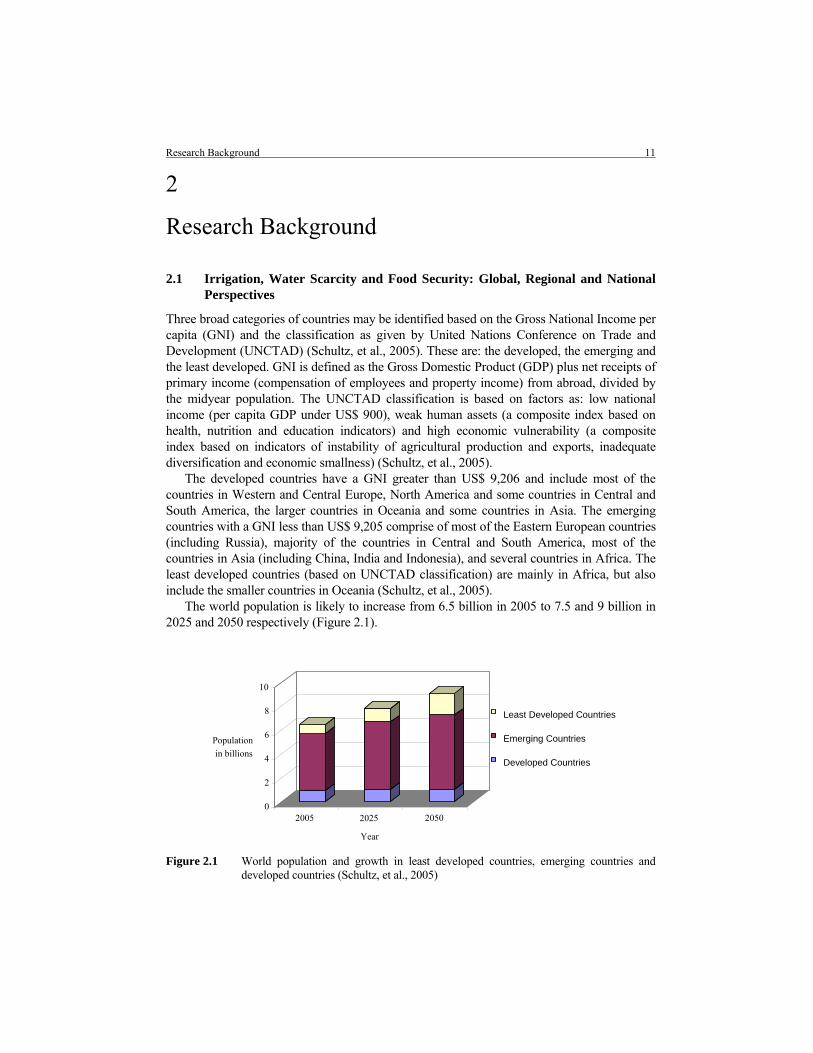
The world population is likely to increase from 6.5 billion in 2005 to 7.5 and 9 billion in 2025 and 2050 respectively (Figure 2.1).
Figure 2.1 World population and growth in least developed countries, emerging countries and
developed countries (Schultz, et al., 2005)
0
2
4
6
8
10
Population
in billions
2005 2025 2050
Year
Least Developed Countries
Emerging Countries
Developed Countries

12 A Tradition in Transition: Water Management Reforms and Spate Irrigation Systems in Eritrea
From Figure 2.1, it can be derived that by far the majority of the world’s population lives in the emerging countries and the least developed countries. It can be also inferred that population growth will especially take place in the least developed and emerging countries. In the developed countries almost no growth is expected anymore (Schultz, et al., 2005). Furthermore, Asia and Africa, and the least developed countries as a whole, have the highest population densities per total area and per arable land (Table 2.1). Eritrea is one of the least developed countries with GNI per capita of US$ 200 (Central Intelligence Agency, 2006). The population densities of Eritrea per total land area and per arable land are 36 and 367 respectively (Table 2.1). The population density per arable land is lower than the average values of Africa and the least developed countries. As explained in Chapter 1, however, about half of the arable land receives less than 200 mm mean annual rainfall making rainfed agriculture hardly possible. Nearly 391,000 ha of the area unsuitable for rainfed agriculture is believed to have a potential for irrigation. But only 28,000 ha are currently provided with an irrigation system (FAO, 1997).
Table 2.1 Continents and types of countries ranked according to the population density with reference to the arable land (Schultz et al., 2005)
Population density in persons/km2 with reference to
Continents/types of countries
Total area in 106 ha
Arable land in 106 ha
Total Population in millions
in 2005
Total area Arable land
Developed 3,186 375 961 30 256
Emerging 7,938 1,005 4,766 60 474
Least developed 2,040 138 759 37 550
*FAO (1994); **Central Intelligence Agency (2006)
Based on projections of the population growth and the increase in the standard of living, there are various views on the speed of increase in food production required to cope with the rapidly increasing mouths to be fed. The sector vision of Water for Food and Rural Development indicates the need for doubling the food production over the coming 25 years whereas the International Food Policy Research Institute (IFPRI) suggests duplication in food production would be required in the forthcoming 50 years (Schultz, et al., 2005). The food production principally depends on availability of water and an increase in production necessarily requires more water to be set aside for the agriculture sector. However, it is estimated that between 2000 and 2025, the global average annual water availability per capita will fall from 6,600 m3 to 4,800 m3. Besides, due to uneven distribution of water resources, some 3 billion people will live in countries wholly or partially arid to semi-arid having less than 1,700 m3 per capita per year water availability (International Commission on Irrigation and Drainage, 2002). Countries or regions are broadly considered water stressed when the annual per capita availability is between 1,000 and 2,000 m3. With availability below 1,700 m3 per capita per year, a country is deemed ‘water scarce’; with less than 1,000 m3 per capita per year, it becomes ‘severe’ (International Commission on Irrigation and Drainage, 2002).
Research Background 13
This fact about the availability of water could be among the reasons for the general consensus that exists among scholars that the major part of the increase in production (about 90%) would have to come from already cultivated land, among others, by water saving, improved irrigation and drainage practices, and increase in storages. The remaining 10% of the increase in food production would have to come from new land reclamations, either in the Highlands, or in the Lowlands (Van Hofwegen and Svendsen, 2000 and Schultz, et al., 2005).
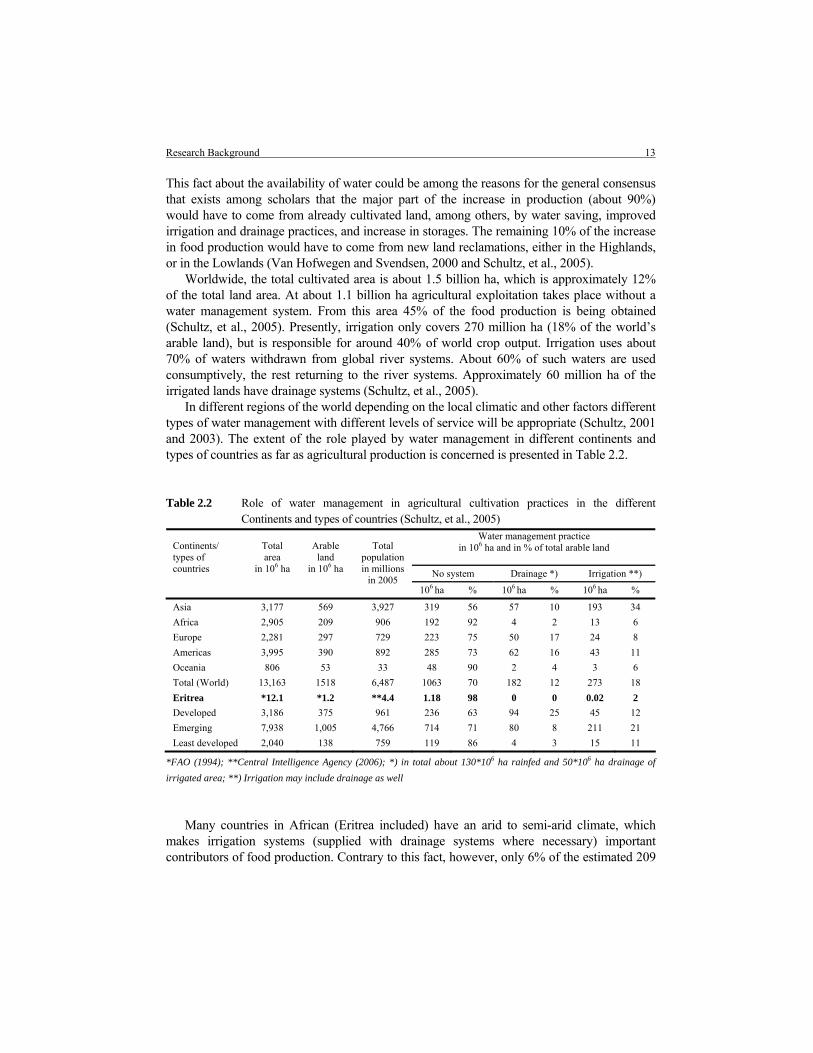
Worldwide, the total cultivated area is about 1.5 billion ha, which is approximately 12% of the total land area. At about 1.1 billion ha agricultural exploitation takes place without a water management system. From this area 45% of the food production is being obtained (Schultz, et al., 2005). Presently, irrigation only covers 270 million ha (18% of the world’s arable land), but is responsible for around 40% of world crop output. Irrigation uses about 70% of waters withdrawn from global river systems. About 60% of such waters are used consumptively, the rest returning to the river systems. Approximately 60 million ha of the irrigated lands have drainage systems (Schultz, et al., 2005).
In different regions of the world depending on the local climatic and other factors different types of water management with different levels of service will be appropriate (Schultz, 2001 and 2003). The extent of the role played by water management in different continents and types of countries as far as agricultural production is concerned is presented in Table 2.2.
Table 2.2 Role of water management in agricultural cultivation practices in the different Continents and types of countries (Schultz, et al., 2005)
Water management practice in 106 ha and in % of total arable land
No system Drainage *) Irrigation **)
Continents/ types of countries
Total area
in 106 ha
Arable land
in 106 ha
Total population in millions
in 2005 106 ha % 106 ha % 106 ha %
Asia 3,177 569 3,927 319 56 57 10 193 34
Africa 2,905 209 906 192 92 4 2 13 6
Europe 2,281 297 729 223 75 50 17 24 8
Americas 3,995 390 892 285 73 62 16 43 11
Oceania 806 53 33 48 90 2 4 3 6
Total (World) 13,163 1518 6,487 1063 70 182 12 273 18
Eritrea *12.1 *1.2 **4.4 1.18 98 0 0 0.02 2 Developed 3,186 375 961 236 63 94 25 45 12
Emerging 7,938 1,005 4,766 714 71 80 8 211 21
Least developed 2,040 138 759 119 86 4 3 15 11
*FAO (1994); **Central Intelligence Agency (2006); *) in total about 130*106 ha rainfed and 50*106 ha drainage of irrigated area; **) Irrigation may include drainage as well
Many countries in African (Eritrea included) have an arid to semi-arid climate, which makes irrigation systems (supplied with drainage systems where necessary) important contributors of food production. Contrary to this fact, however, only 6% of the estimated 209

14 A Tradition in Transition: Water Management Reforms and Spate Irrigation Systems in Eritrea
million ha arable land in Africa is under irrigation. In Eritrea, the situation is even worse with irrigation only accounting for 2% of the 1.2 million ha arable land (Table 2.2).
2.2 Problem Description
Eritrea has not yet been capable to meet the basic food demands of its population. Historical records from 1975 to 1999 reveal that the crop production in Eritrea only covered 20 to 60% of the basic food needs of the population. The 60% coverage was during 1991, when there was a good rainy season (Natarajan, 1999).
The population of Eritrea is expected to rise from the current 4.4 million in 2005 to nearly 8 million in 2025. On the basis of the 0.16 ton of annual food requirement per person (World Bank, 1994), the total annual food requirement by the year 2025 would be nearly 1.3 million tons. Using the average rainfed agriculture grain yield of 0.75 ton ha-1 (World Bank, 1994), about 1.7 million ha of land would have to be cultivated to satisfy the food needs of the population by 2025. As stated earlier, however, there are only 600,000 ha suitable for rainfed agriculture, which, even if fully utilized, will supply only 450,000 tons, leaving a gap of 850,000 tons. Introducing appropriate land fertility management practices, and drought and disease resistant short duration high yielding varieties of the major food crops (sorghum, maize, barley, wheat and millet) may increase the production under rainfed agriculture. These, nonetheless, may not contribute more than maintaining the average grain yield of 0.75 ton ha-1 or slightly more. Eritrea is a drought prone country and even during the best rainfall seasons, crop failures under rainfed agriculture may occur owing to the erratic nature of the rain. Therefore, the 850,000 tons gap should be filled by irrigated agriculture and/or import.
The currently irrigated area in Eritrea is about 28,000 ha and the potential is estimated at 391,000 ha. Applying the optimum amount of water required by the concerned crops at the right irrigation intervals and putting proper water management practices in place could make the yield under irrigated agriculture quadruple or even five to six fold that of rainfed agriculture. Such yield increase may not, however, be achieved in Eritrea (at least for the coming few years) as irrigation development is at its infant stage. Nevertheless, at least slightly more than tripling the yield to 2.5 ton ha-1 is possible. As indicated by the farmers, in the Wadi Laba spate irrigation system (the study area of this research), the average yield of ‘fully’ irrigated fields (gross irrigation of 15,000 m3 ha-1 y-1), is 3.5 ton ha-1, whereas that of ‘partially’ irrigated fields (gross irrigation of 10,000 m3 ha-1 y-1), is about 1.75 ton ha-1. Should all the 391,000 ha be put under irrigation by 2025 and at least 2.5 ton ha-1, the overall average yield of ‘fully’ and ‘partially’ irrigated fields, is realized, the total production would more than cover the 85,000 ton gap. If about 225,000 ha of the 391,000 ha would be supplied with irrigation and a focused and resolute effort is done to introduce appropriate water management reforms, and a 3.5 ton ha-1 yield is attained on a sustainable manner, food self sufficiency would be achieved.
Besides its direct contribution to the attainment of food self sufficiency through locally producing food crops, irrigation could play a significant role in improving the economic growth by among other things creating employment, supplying cheaper raw materials to local food processing and other related industries and producing high quality export crops that

Research Background 15
could generate foreign currency. These in turn might strengthen the ability of the country to import crops during time of need thereby making it more food secure.
The Government of Eritrea fully understands that irrigation is vital for ensuring food self sufficiency and/or food security. Accordingly, with a focus on spate irrigation systems, efforts are under way to expand the irrigable area and introduce appropriate ‘water management’ reforms aimed at increasing production per unit land and water quantity. In the International Glossary of Hydrology (2007) and the International Commission on Irrigation and Drainage (2002), “water management” is defined as “the planned development, distribution, and use of irrigation water in accordance with predetermined objectives and with respect to both quantity and quality of the water resources. It is the specific control of all human intervention on surface and subterranean water. Every planning activity that is directed on water can be looked upon as water management in the broadest sense of the term”. To make this definition more fused on the objectives of this research and the major water related elements and processes in the Wadi Laba spate irrigation system, throughout this document, the phrase ‘water management’ refers to: ‘the broad organizational aspects of the people involved; the approaches and techniques used in the (re)design and layout, operation, (re)construction and maintenance of the infrastructure as well as the nature of land and water rights and their enforcement mechanisms that enable the sharing of irrigation water in accordance with the level of fairness determined by the concerned society while maintaining the quality of the water resource at sustainable levels; the type of water related conflicts and conflict resolution strategies.’
In Eritrea, there are 11 spate irrigation systems. Collectively, they currently cover 16,000 ha or about 56% of the total irrigated area and their potential is estimated at 91,000 ha, which is nearly 25% of the total potential irrigable land. As compared to the other irrigation systems such as furrow, sprinkler and drip, the principles and practices of spate irrigation systems are the most familiar and relatively better understood among the farmers in Eritrea in general and those in the Eastern and Western Lowlands in particular. The Eastern and Western Lowlands are the two regions with vast arable land and that are usually referred to as the breadbaskets of Eritrea. If one presumes that all the 91,000 ha are brought under spate irrigation systems, at 2.5 ton ha-1 y-1 and 3.5 ton ha-1 y-1 production levels, the systems could sufficiently feed 18% or 25% of the total 2025 predicted 8 million population of Eritrea. These facts and realities may, among others, have led the Ministry of Agriculture to identify spate irrigation as one of the main assets that could greatly contribute to the attainment of food self sufficiency and/or food security in Eritea. The Ministry drafted a short-term (1998 to 2003) spate irrigation development plan to introduce water management reforms in some 4,000 ha and establish about 5,000 ha newly irrigated area; and a long-term plan (2005 to 2015) to institute water management reforms in 12,000 ha and set-up 60,000 to 70,000 ha (Ministry of Agriculture, 2000). So far (2006), only about 3,500 ha of spate-irrigated land have been subject to water management reforms - no new land has been brought under spate irrigation. It is imperative to note that given the current poor economic standard of the country and the acute shortage of the relevant skilled manpower, expansion of irrigable land and reforms of the existing systems may only keep pace with the demands of the rapidly increasing population if there is substantial contribution from international development institutions.

16 A Tradition in Transition: Water Management Reforms and Spate Irrigation Systems in Eritrea
The Wadi Laba spate irrigation system was selected to pioneer the short-term water management reforms. This is because the Wadi Laba is the first spate irrigation system to be established in Eritrea around 100 years ago. It is therefore believed that some relevant data could be available and the farmers have acquired a wealth of experience that could be of valuable input to the water management reform interventions. Moreover, it is easily accessible by car and on foot, making construction of irrigation infrastructure to be carried out with minor obstacles (Ministry of Agriculture, 2000).
The Water management reforms of the Wadi Laba were accomplished by the Government of Eritrea with technical assistance from Halcrow (UK) Engineers and financial support from International Fund for Agricultural Development (IFAD). They mainly focussed on the technical features of the systems and they gave little regard to the other components of the ‘water management’ package. The replacement of the indigenous earthen and brushwood water diversion and distribution structures, Agims and Musghas (these were frequently damaged by floods with discharges of below 100 m3 s-1) with more permanent and stronger concrete headworks capable of diverting large floods (100 to 265 m3 s-1) was considered to be the core pillar of success.
As part of the water management reform package, the government also took some steps to replace the indigenous Wadi Laba land tenure system (access to land is prerequisite for having a water right in Eritrea) with the National Land Proclamation drafted in 1994. The Proclamation refers to the indigenous land tenure arrangements as obsolete, progress impeding and incompatible with the contemporary land and water development needs of the country.
The major goals (set by the Government) of the water management reform interventions in the Wadi Laba spate irrigation system were:
- to bring-about a sustainable homogenous improvement to the living conditions of the farmers in the upstream as well as the downstream service area;
- to strengthen the Ministry of Agricultural staff capability in spate irrigation development.
The specific targets were:
- doubling the production by increasing the water diversion efficiency and the total annually irrigated area from 50% and 1,200 ha (assumed under the indigenous system) to 80% and 2,600 ha;
- diverting large floods (100 to 265 m3 s-1) in a regulated manner to augment the possibility of irrigating downstream fields, while minimizing erosion and deposition of coarse sediments in canals and fields;
- reducing deforestation by curtailing the use of brushwood for maintenance of the Agims and Musghas;
- avoiding land fragmentation that is being caused by the indigenous land tenure system. Land fragmentation is considered an obstacle for land and water development efforts as it restricts mechanization.
There is limited land and water resource in Eritrea that will be even scarcer in the future if the population grows at the current pace of 3%. The scope for expansion of irrigation systems

Research Background 17
in the future is therefore finite, which makes it very important to ensure that the water management reform efforts yield the expected performance improvements. This may, however, require that the reforms are done on the basis of a sound understanding of the existing indigenous water management principles and practices. There are a number of spate irrigation systems, for example, in the Uthal Kantra (Las Bela District), Ahmadzai (Zhob District), Safi Bund (Loralai District) and the Anambar Plain in Balochistan, Pakistan that have not been utilized after being subjected to water management reforms. This because the modern structures introduced were non-coherent with the indigenous water sharing arrangements and caused conflicts among the users (Van Steenbergen, 1997). In one of the spate irrigation systems in the Anambar Plain, as the conflicts became unbearable, the concerned upstream and downstream communities reached a mutual agreement, and purposely blew up the weir and returned to their indigenous structures and water sharing arrangements (Van Steenbergen, 1997).
In recognition of the need for a proper knowledge of indigenous spate irrigation water management principles and practices, it was clearly stated: ‘understanding the functioning of the traditional spate irrigation systems in Eritrea in their totality is of high relevance for making an appropriate technical design. However, it needs detailed and prolonged studies, and if taken to their logical conclusion, would involve deferring such developments for many years whilst data are being collected. Such deferral, in the context of the development needs in Eritrea, is not desirable’ (Halcrow, 1997). It is a fact that Eritrea is among the poorest countries with 53% of its population below the poverty line (Central Intelligence Agency, 2006) and one cannot dispute the urgency of the development needs. Nonetheless, the spate irrigation development activities must be ‘sustainable’ if they are to have a long-term positive impact on improving the livelihood of the intended beneficiaries. Therefore, it is worth spending the time and resources to make a detailed study in understanding the indigenous technical, institutional and organization practices that have made the systems sustainable and continue to exist as the major livelihoods of the farming community for the past 10 decades. It is only on the basis of this understanding that proper evaluations of the water management reforms conducted in the Wadi Laba system can be made and recommendations for future spate irrigation development activities suggested. In this respect, it is also essential to draw lessons from other countries such as Yemen and Pakistan, where spate irrigation systems have been practised for several centuries.
In the spate irrigation systems in Eritrea, the flood water, which is unpredictable and unreliable in timing, volume and duration, is the major source of irrigation. Moreover, crop growth is solely dependent on residual soil moisture making the existence of deep soils with adequate moisture holding capacity an essential condition for a sustainable production system. Farmers usually construct the field bunds, Tewalis and Kifafs, by excavating soil from their irrigated fields. This removed soil would have to be constantly replaced if the spate irrigation is to continue to exist. Sediments that are brought in by the Wadi flow are the only source for the build up of the soil profile and enrich the fertility of the soil. Hence, sediments are as equally important as water in spate irrigation and the water management reforms would have to ensure that the needed sediments are delivered.
The upper catchment, which is characterized by steep mountains of as high as 3,000 m+MSL elevation and gently sloping hills and rainfed flat farmlands situated at an altitude of

18 A Tradition in Transition: Water Management Reforms and Spate Irrigation Systems in Eritrea
about 1,000 m+MSL are the sole suppliers of water, sediment and nutrients for the low-lying Wadi Laba irrigated fields. During the water management reform interventions, the following assumptions were made:
- all the flashfloods supplied by the Wadi Laba upper catchment, irrespective of their discharges, supply good quality (non saline and non sodic) irrigation water, which does not cause any damage to the soil physical characteristics and does not induce yield reduction of sorghum and maize;
- after serving for the past hundred years as the only supplier of nutrients for the irrigated fields under its command, the Wadi Laba upper catchment is still capable of providing sufficient quantity of the essential nutrients to promote optimum growth of the major crops in the area, being sorghum and maize and thus, there is not yet a need for any fertility replenishment and/or management practices.
The above assumptions have not been supported by any systematic soil and water analyses - they are simply based on the fact that poor water quality and nutrient deficiency induced symptoms have not been observed. Long-term data are needed to analyse the trend of nutrient, sediment and water quality supplies from the catchment. Such data are, however, inexistent and it is valuable that this research assesses the irrigation water quality, sediment concentrations and nutrient types and amounts the upper catchment is currently yielding. It is also important to analyse the current nutrient, salinity and sodicity status of the irrigated fields after around 100 years of sole dependence on the upper catchment.
2.3 Research Goal, Objectives and Questions
In line with the problem description presented in the above, the following overall goal, specific objectives and questions have been addressed in this research.
2.3.1 Overall Goal
To contribute to the on-going spate irrigation water management reform efforts by the Government of Eritrea and the various national and international development agencies that are aimed at enabling the existing and future spate irrigation systems to adequately mitigate the unpredictable flood water, attain the set production levels and raise the living standards of the rural poor communities above a subsistence level in a sustainable manner.
2.3.2 Specific Objectives
The specific objectives concern:
- to understand the functioning of the Wadi Laba indigenous water management practices and principles in their totality and assess their successes and limitations with regard to, among others: mitigating the unpredictability of the flood water; ensuring fair water sharing and minimizing conflicts within and among the head and tail-end users; timely operating and maintaining the infrastructure;

Research Background 19
- to assess if and how the water management reform interventions have capitalized or can build upon the strengths of the Wadi Laba indigenous water management principles and practices, while overcoming their weaknesses; to evaluate if and how the water management reforms introduced have attained or can achieve their set targets;
- to quantify the extent of the variation between the quantity of water that will remain within the soil profile of the rootzone (at the start of the planting season) in ‘fully’ and ‘partially’ irrigated fields; and assess if such variation correlates with the farmers assertions that the respective sorghum and maize grain yields of a ‘fully’ and ‘partially’ irrigated fields are about 3.5 ton ha-1 y-1 and 1.75 ton ha-1 y-1;
- to investigate if irrigation with the Wadi Laba flood waters has induced or can incur a level of salinity and sodicity in the irrigated fields that can result in significant sorghum and maize grain yield reductions and soil infiltration restrictions; and to suggest, as necessary, appropriate land, water and crop management practices that can minimize salinity and sodicty problems at a field level;
- to analyse the impact of the Wadi Laba floods on the nutrient balance of the irrigated fields so as to either recommend nutrient management interventions should the result support it or at least lay the foundation for making nutrient mapping.
2.3.3 Specific Questions
The specific questions concern:
- what were the pillars of the Wadi Laba indigenous water management principles and practices? What were their strengths and weaknesses with respect to: mitigating the unpredictability of the flood water, ensuring fair water sharing and conflict prevention and resolution within and among the upstream and the downstream farmers; timely maintaining and (re)constructing the diversion and distribution structures; improving the living conditions of the farming community;
- what were the strong and weak points of the water management reform approaches and strategies applied in the Wadi Laba irrigation system?
- what were the main structural interventions done as part of the water management reforms? What have been their technical design and layout advantages and disadvantages as compared to the indigenous ones? Have they attained their set specific targets and the ultimate goal - bringing-about a sustainable homogenous improvement to the living conditions of upstream as well as the downstream farmers? If not, can they?
- what is the magnitude of the difference between the amounts of water retained within the soil profiles of the roozone (at the onset of the growing period) in ‘fully’ and ‘partially’ irrigated fields? Does this explain the farmers’ assertion that a ‘fully’ irrigated field could yield 3.5 ton ha-1 y-1 of sorghum and maize, while a ‘partially’ irrigated field will yield only half that amount?
- are all the Wadi Laba flood sizes of good quality - non saline and non sodic? If not, what may be the magnitude of their negative impact on the soil infiltration rate and the sorghum and maize grain yields? What appropriate land, water and crop management practices could be recommended to address, the salinity and sodicity problems, if any?
20 A Tradition in Transition: Water Management Reforms and Spate Irrigation Systems in Eritrea
- are all the Wadi Laba flood categories still capable of supplying sufficient sediment and nutrients for the optimum growth of sorghum and maize? What is the current nutrient-balance of the irrigated fields? Is land fertility management a priority? If yes, how best can it be done?
- what, if necessary, technical, institutional, environmental and legal improvement measures can be recommended to make future spate irrigation water management reforms more effective? Is the implementation of the Land Proclamation (in its current status) helpful in this regard or an obstacle? Are there specific provisions that need to be modified or replaced to make the Land Proclamation a positive contributor?
2.4 Research Methods
In addressing the above objectives and questions, the following methods have been used. The methods are briefly presented here. They will, as necessary, be detailed in the respective Chapters.
- field surveys and observations, interviews and focus group discussions, practically participating in the operation and maintenance of the components of the irrigation system, attending farmers’ meeting when decisions were made regarding water sharing and conflict mitigation, were among the methods used to understand the technical, institutional and legal functioning of the Wadi Laba spate irrigation system before and after the water management reforms;
- the Soil Water Accounting Model (SWAM) developed in this research was used to compute the amount of water that remains within the sorghum and maize root zone profiles in the Wadi Laba irrigated fields that received full and partial irrigations;
- the velocity-area method (Boiten, 2000) and bottle samplers were used to estimate the discharges of different sizes of floods and their suspended sediment concentrations. The chemical anion and cation composition of the suspended sediment was determined using flame absorption and flame emission photometry, calorimetric, turbidimetric and titration methods (American Public Health Organization, 1992; Kruis, 2002);
- the salinities of the floods were determined with an electric conductivity (EC) meter. The average soil-water salinity of the root zone (ECe) that can develop due to a long-term (10 to 15 years) use of the different food categories was obtained using the ‘five-point’ method (Ayers and Westcot, 1985). The impact of salinity on sorghum and maize yields was estimated from the salinity-yield correlation equation after Grattan (1999);
- the sodicity levels of the various flood sizes and their effect on the soil infiltration rate and sorghum and maize production levels was evaluated using the existing methods - the SAR (Sodium Adsorption Ration) and RNa (adjusted Sodium Adsorption Ratio) (Allen, et al., 1998) and an alternative method suggested in this research - the RNae (average soil-water sodicity ration of the rootzone);
- the micro-Kjeldahl digestion, manual spectrophotometer and flame emission spectrophotometer methods were used to determine the total Nitrogen, the total Phosphorous and total Potassium contents of the different flood sizes and the selected fields respectively (Kruis, 2002). The nutrient balance (at field level) was assessed on

Research Background 21
the basis of the FAO (2003) and Stroovogel and Smaling (1990) approaches, which were modified in line with the nutrient inflow-outflow realities in the irrigated fields.
2.5 Conceptual and Theoretical Framework
This section discusses the conceptual and theoretical framework on the basis of which the above outlined methods were applied to attain the set goal and objectives of this research.
In her paper on: “Social Aspects of Irrigation Designs: the Interaction of Water, Technology and People”, Vincent (2005) conceptualizes irrigation as movement of water by people for crop production through infrastructure and human endeavor that requires consideration of social as well as technical dimensions of water control. She further argues that “The design of an irrigation system involves the conscious and intuitive ordering of knowledge, infrastructure and management institutions for water delivery, according to principles, practices and priorities decided by society - and not only the application of science to water conveyance and crop production. Irrigation is thus not only socially constructed in the choices of infrastructure and institutions, but also in its social requirements of use and social effects”. This analysis defines some major elements, processes and objectives of an irrigation system while apparently making the case for a “systems approach” to have a thorough understanding of the functioning of irrigation systems.
Arson (1996) explained a “system” as a group of interacting, interrelated, and interdependent components that form a complex and unified whole and thus a “systems approach” is a means of gaining insights into the whole by understanding the linkages and interactions between the elements that comprise the whole “system”. In rather similar terms, Senge & Lannon-Kim (1991) defined “systems approach” as a discipline for seeing wholes, recognizing patterns and interrelationships, and learning how to structure those interrelationships in more effective, efficient ways. In a yet analogous fashion, Stephens and Hess (1999) characterized an irrigation system as composed of subsystems that has to function as a whole if it is to achieve its objectives.
In line with the “systems approach” concepts, the Wadi Laba irrigation system was considered as having two sub-systems that would have to function as a whole if the set objectives of the water management reforms are to have a chance of being achieved on a sustainable manner while at the same time the priorities of the concerned communities are safeguarded. These two sub-systems are the upper and the lower catchments. The upper catchment provides livelihoods to its settled rainfed agriculturalists and serves as the sole supplier of floodwater, sediment and nutrients to the lower catchment. The lower catchment is where the spate irrigated fields are located and the water management reforms are being introduced. It is the main source of livelihood for the spate irrigation community. These communities, as part of their centuries old tradition, have been and still are annually migrating to the upper catchment between May and September in escape of the scorch sun, to cultivate their small (0.25 ha) rainfed farms as well as in search of fodder for their livestock. Therefore, the extent of direct exploitation of the upper catchment resources by the spate irrigation community largely depends on the ability of the upper catchment to allow adequate outflow of sediment, water and nutrients and on how effectively these
22 A Tradition in Transition: Water Management Reforms and Spate Irrigation Systems in Eritrea
resources are utilized in the lower catchment. It may thus be deduced that the sustainability of the Wadi Laba system as a whole is strongly linked to the ability of the two subsystems to interact symbiotically.
In an effort to address the set objectives of this research in accordance with the presented analysis as to what are the core elements, processes and objectives that constitute irrigation systems; and in line with outlined conceptual understanding of the Wadi Laba spate irrigation system, the research methods were tailored at, among other things, the following nature of analyses:
1. Concerning the indigenous water management system, the core principles and practices enforced by the Wadi Laba community to acquire the level of interactions among the infrastructure, the intuitions and the water rights and rules that are necessary to achieve the community’s water sharing and crop production related priorities, were analyzed;
2. The assessment of the implications of the technically oriented water management reforms was not confined to whether the reforms have or can achieve the Government set objectives. It was broadened to answer the questions:
- If and how the said objectives can be attained while the community’s water sharing values and crop production priorities are maintained;
- Should the water management reforms create new water sharing and crop production realities, do the reforms create an enabling environment for the community to adapt and ascertain its existing and/or newly set priorities;
3. The analyses of the quantity and quality of the floodwater, sediment and nutrients was not restricted to the impacts on the soils of the Wadi Laba irrigated fields, the crop production and the livelihoods of the lower catchment communities, and what best management practices can be suggested. Rather, an attempt was also made to understand what processes to what extent can affect the flow of floodwater, nutrients and sediments from the upper to the lower catchments; and what, if necessary, corrective measures can be recommended;
4. The Soil Water Accounting Model was not used to merely serve as tool for calculating how much water can be saved by avoiding unnecessary losses, but to help do so while the very core water sharing principles, practices and priorities of the community are preserved. The model also takes into account the water quality aspect;
5. The water quality (salinity and sodicity) analysis was not approached from a purely technical angle - it took into account the impacts of the exiting (indigenous) and the perceived new (after the water management reforms) water distribution realities.
The presented issues are detailed in the respective chapters that are briefly outlined below.
2.6 Set-up of this Thesis
In the following Chapter, the principles and practices of the spate irrigation system in Eritrea, Yemen and Pakistan will be discussed. Chapter 4 mainly analyses the water holding capacities and infiltration rates of the irrigated fields in the Wadi Laba spate irrigation system. It also describes the location and climate of the system, its design and layout, technical

Research Background 23
features, and the farming practices. Chapter 5 provides an extensive account of the indigenous water rights and management systems, and how these have changed following the water management reforms. In Chapter 6, the Soil Water Accounting Model (SWAM) developed in this research is explained, as are the model results, namely the amount of water that could be furnished at the beginning of the growing period in ‘fully’ and ‘partially’ irrigated fields, and its implications on water sharing and sorghum and maize yields. Chapter 7 focuses on the hydraulic performance evaluation of the irrigation system after water management reforms Chapter 8 analyzes the salinity and sodicity levels that can be induced to the irrigated fields by the long term use of the different flood sizes and assesses their impacts on infiltration rate and the sorghum and maize production levels. In Chapter 9, the effect of the various flood sizes on the nutrient-balance (at field level) is discussed. Based on the research results, the evaluation is presented in Chapter 10.

24 A Tradition in Transition: Water Management Reforms and Spate Irrigation Systems in Eritrea

Principles and Practices of Spate Irrigation Systems 25
3 Principles and Practices of Spate Irrigation Systems
The purpose of this chapter is to provide the reader with an overview of spate irrigation systems. First, a general description of spate irrigation systems is presented. This is followed by a detailed account of the main principles and practices of the spate irrigation systems in Pakistan, Yemen and Eritrea. On the basis of this, some concluding remarks are presented.
3.1 Introduction
Spate irrigation is a flood water harvesting and management system. The flood water is generated by heavy rainfall in upper catchments. It is unpredictable in occurrence and unreliable in amount. It is emitted through normally dry wadis (ephemeral streams) and is diverted and distributed using earthen, brushwood or concrete structures to irrigate low-lying fields (Mehari, et al., 2005a).
Spate irrigation is a pre-planting system where the flood season precedes the crop production period. In most spate irrigation systems in Eritrea, Yemen and Pakistan, the major floods occur between June and September, which is the time of heavy rainfall in the upper catchments. The crop growth takes place between October and February exclusively depending on the water stored in the soil. To establish a spate irrigation system:
- there should be a mountainous or hilly topography that generates run-off and adjacent low-lying fields on the same plain or at the foot of the slope to which the runoff water can be directed;
- the fields should have deep soils that are capable of storing ample moisture to supply for the crops during periods having no precipitation (Mehari, et al., 2005c).
Spate irrigation is among the oldest forms of irrigation in the arid and semi-arid regions of the world. The historically prominent areas include the Arabian Peninsula, notably Yemen and South Asia, particularly the Province of Balochistan, Pakistan where spate irrigation is believed to have existed as early as 3000 BC (UNDP/FAO, 1987). Spate irrigation has also been practised for hundreds of years in many Northeast, Northwest and East Africa countries, namely Morocco, Tunisia, Algeria, Sudan and Eritrea (FAO, 2005a).
It is difficult to give exact figures about the area under spate irrigation because the system has never had the same amount of attention as perennial irrigation from governments, non-government development institutions and the donor community. Furthermore, the actually irrigated area, being largely dependent on highly unreliable and unpredictable flood water, changes almost on a yearly basis. An estimate of the land coverage of spate irrigation systems in some countries compiled from different sources (FAO, 2005; Ahmed, 2000; Al-Shaybani, 2003 and Mehari, et al., 2005c) is presented in Table 3.1. Apart from the countries listed in

26 A Tradition in Transition: Water Management Reforms and Spate Irrigation Systems in Eritrea
Table 3.1, the existence of spate irrigation is reported from North Chile, Bolivia, Iran, Afghanistan, Mauritania, Senegal, Ethiopia, Kenya and the Northwest coast of Egypt; but there is no reliable estimate of the extent of coverage.
Table 3.1 Spate irrigated versus total irrigated areas in some countries
Country Year of data collection
Total irrigated area in ha (1)
Spate-irrigated area in ha (2)
% of total irrigated area covered by spate
irrigation (1)/(2)*100
Algeria1 1997 560,000 70,000 13
Eritrea2 2005 28,000 15,630 56
Kazakhstan1 1993 3,556,400 1,104,600 31
Libya1 1997 470,000 53,000 11
Mongolia1 1993 84,300 27,000 32
Morocco1 1997 258,200 165,000 13
Pakistan3 2000 17,580,000 1,450,000 8
Somalia1 1984 200,000 150,000 75
Sudan1 1997 1,946,000 280,000 14
Tunisia1 1997 481,520 98,320 20
Yemen4 2003 485,000 193,000 40
1FAO, 2005; 2Mehari, et al., 2005c; 3Ahmed, 2000; 4Al-Shaybani, 2003
Given their historical prominence and the fact that they had witnessed several major water management reform interventions, the spate irrigation systems in Yemen and Pakistan are singled out for discussion here.
3.2 Spate Irrigation Systems in Pakistan
Pakistan is located in Southern Asia, bordering the Arabian Sea, between India in the East, Iran and Afghanistan in the West, and China in the North. It has a total land area of 80.4 million ha and a population of 151 million. The climate is characterized by mostly hot, dry desert; temperate in Northwest; arctic in North. The terrain ranges from the flat Indus plain in the East; mountains in the North and the Northwest; and Balochistan plateau in the West (Central Intelligence Agency, 2006).
In Pakistan, spate irrigation covers nearly 1.5 million ha, which is about 8% of the total irrigated area (Table 3.1). It is locally known as Rod Kohi in the North West Frontier Province (NWFP) and Punjab province and Bandit/Sailaba in the Balochistan province. Across the country, it is often generally referred to as flood irrigation. This kind of irrigation relies on the floods of the hill torrents, which are diverted into a plain area, locally known as Damaan. In the indigenous systems, farmers divert the spate flow to their fields by constructing breachable earth bunds (called Gandas) across the rivers and/or stone/gravel spurs leading towards the centre of the river (FAO, 1997).
Balochistan, the largest province in Pakistan, has about 1.2 million ha of Sailaba irrigated land. These areas are often called falling flood irrigation areas and are located on extensive

Principles and Practices of Spate Irrigation Systems 27
tracts of land along the rivers and hill streams subject to annual inundation. They utilise the moisture retained in the root zone after the flood subsides together with sub-irrigation due to the capillary rise of groundwater and any rain (Ahmed, 2000).
There are four different water supply systems in the Sailaba irrigation, namely nullah, manda, diffuse and riverine (Hamilton and Muhammad, 1995). Nullah systems are based on a single nullah (ephemeral stream), usually one with a mountainous catchment; manda systems depend on rivers or large nullahs, which collect water from many small ephemeral streams with quite hilly catchments. Diffuse supply systems utilise large sloping areas as contributing catchments, where the runoff is collected into a shallow nullah by the time it reaches the diversion point. Riverine systems are designed to divert water from perennial streams only when a sufficient flood stage is reached for the water to flow into diversion canals (Hamilton and Muhammad, 1995). Once the water is collected, there are several alternative ways of conveying and allocating water to the land to be irrigated. Most systems have well-defined primary conveyance canals. These may deliver water directly into separately bunded fields or may use secondary canals. In the cascaded system, which covers only about 5% of the spate irrigated area in the country; the water flows sequentially from field to field. This system may have permanent overflow structures for supplying water to the next field when the water level reaches the outlet elevation. Alternatively, the bund may be manually breached at some point(s) to allow water to advance to lower-lying fields (Hamilton and Muhammad, 1995).
Water rights on Sailaba systems in Balochistan are entirely controlled by the users. The government plays no role in distributing the water or maintaining records of water use. Water is distributed between the irrigation systems’ participants according to the principle of ‘first come, first served.’ There is no formal government-sanctioned entity to manage the system. The government agencies mainly serve as facilitators such as making available the equipment necessary for the building or reconstruction of Sailaba bunds. This is unlike the spate irrigation systems in NWFP and Punjab province, where the civil administration actively intervenes in instructing the farmers to plug breaches and to connect flood canals (Van Steenbergen, 1997).
Upper portion of Dera Ismail Khan (DI Khan), Tank and Kullachi Tehsil are the three districts in NWFP where spate irrigation is still prevailing. The total area of the districts is about 9 million ha, out of which the cultivated land is 700,000 ha. Spate irrigation covers nearly 250,000 ha. In NWFP, minor spate flows occur in spring and the major floods come in summer as a result of monsoon rainfall on the Suleman range and Lakai-Marwat hills during July and August (Hamilton and Muhammad, 1995).
Spate irrigation institutions that are composed of tribal leaders, water user groups and government departments have a long history in NWFP. Water distribution and other rules that govern the management of spate irrigation systems have been documented and written by the revenue department of the British rule back in 1872. The various tribal leaders and water user groups were consulted and their opinions included before the final version of the rules and regulations were made functional. Locally, the documentation forms of the water distribution rules and the procedures followed in drafting them are called Kulliat-e-Rod-Kohi or Kulliat-e-abpaashi.
Almost all the spate irrigated areas in Pakistan lie in the most marginalized and socially low-ranking districts. This had a negative impact on the decision-making at the national level

28 A Tradition in Transition: Water Management Reforms and Spate Irrigation Systems in Eritrea
as far as resource allocation for the irrigation sector is concerned. A review of budgetary records clearly indicates that the bulk of investment in agricultural research and physical development has gone into the perennial irrigated agriculture (Nawaz, 2003). Moreover, spate irrigation is not in the curriculum of any formal educational institution of the country. The severe lack of knowledge in the academia about spate irrigation and the lack of empathy in decision makers for the marginalized communities have negatively affected both the understanding about the system and the state of support to this sector.
In spite of the fact that the government of Pakistan favours allocation of resources to perennial irrigation systems, around 74 permanent headworks have been constructed in Balochistan in the past decades (Van Steenbergen, 1997). The failure rate of these modern structures has, however, been very high for a number of reasons. The main ones include: sedimentation, discrepancy with the indigenous water rules and water sharing arrangements, lack of flexibility of the structures to cope with the unpredictable nature of the floods. An extensive evaluation of 47 modernized systems constructed in the past 30 years has revealed that only 34% still function satisfactorily, 32% have serious operational problems and 34% are completely non-functional (Van Steenbergen, 1997) (Table 3.2).
Table 3.2 Performance of government constructed spate irrigation systems in Balochistan, Pakistan (Van Steenbergen, 1997)
Functional With serious operational problems
Non-functional Date of construction
Total headworks constructed
No. % No. % No. %
Prior to 1973 20 7 35 6 30 7 35
1974 - 1984 14 4 29 2 14 8 57
After 1984 13 5 38 7 54 1 8
Total 47 16 34 15 32 16 34
The Irrigation and Power Department in Balochistan is responsible for the operation and maintenance of the modernized spate irrigation systems. The annual budget of the Department for the maintenance of the structures is on the decline. The maintenance work is limited to posting of linemen and guards, and the major repair work is done on ad-hoc basis (Van Steenbergen, 1997). This has already made many of the structures listed as ‘with serious operational problems’ in Table 3.2, non-functional. If these problems are not fixed, a number of the functional structures could soon become out of use.
3.3 Spate Irrigation Systems in the Republic of Yemen
The Republic of Yemen (ROY) is an arid to semi-arid country located in the Middle East bordering the Arabian Sea, the Gulf of Aden and the Red Sea, between Oman and Saudi Arabia. It has a total land area of about 53 million ha inhabited by roughly 19 million people. The climate is mostly desert; hot and humid along the West coast; temperate in the Western

Principles and Practices of Spate Irrigation Systems 29
mountains affected by seasonal monsoon; extraordinarily hot, dry, harsh desert in the East. The terrain has an elevation ranging from the minimum point of 0 m+MSL at the Arabian Sea to the maximum of 3,760 m+MSL at the Jabal al-Nabi Shu’ayb. It is characterized by a narrow coastal plain backed by flat-topped hills and rugged mountains; dissected upland desert plains in the centre slope into the desert interior of the Arabian Peninsula (Central Intelligence Agency, 2006).
The spate irrigation systems in Yemen cover about 193,000 ha, 40% of the total irrigated area (Table 3.1) and are the only providers of livelihood for the people living in the relatively poorer coastal areas (World Bank, 2000). The major sources of irrigation water are the wadis (ephemeral streams) that are either directly diverted to the irrigable area or are allowed to recharge the groundwater and are later on tapped using hand dug or tube wells. There are eighteen wadis in Yemen conveying water during Seif, the minor rainfall season occurring between March to May; and in Kharif, the main rainfall season which usually takes place in the months of July to September. The catchment area, rainfall and mean annual flows of the wadis are presented in Table 3.3.
Table 3.3 Basic hydrological data of some wadis in Yemen (Al-Shaybani, 2003)
Zone Wadi Catchment area
in ha Mean annual
rainfall in mm Mean annual flow in Mm3
Wadi Mawr 800,000 480 210
Wadi Surdud 200,700 650 121
Wadi Siham 400,900 500 130
Wadi Rima 200,700 570 103
Wadi Zabid 400,700 560 164
Wadi Rasyan 200,000 500 54
Western Escarpment
Wadi Mawza 100,600 400 38
Wadi Bana 700,200 359 160
Wadi Tuban 500,060 244 125 Southern Escarpment
Wadi Hassan 300,300 300 30
Wadi Aljawf 1,400,000 140 35
Wadi Adanh 1,200,600 *n.a. *n.a.
Wadi Ahwar 700,250 100 40
Wadi Mawfa’a 600,000 200 30
Wadi Beihan 3,600 150 54
Central Escarpment
Wadi Hajer 9,324 80 288
Wadi Hadramawt 113,900 63 230 Eastern Escarpment
Wadi Maselah *n.a. 200 27
*n.a. = not available
The Tihama Plain is the largest and the most important agricultural area in Yemen (International Fund for Agricultural Development, 2003). It covers all the spate irrigated areas in the Western escarpment to which most of the wadis with the largest mean annual flow volume drain. It also encompasses the Aden region in the Southern escarpment where the
30 A Tradition in Transition: Water Management Reforms and Spate Irrigation Systems in Eritrea
Wadi Tuban spate irrigation system is located. There is in total about 100,000 ha of irrigated area in the Tihama Plain, which is supplied by the conjunctive use of wadi flow (flood water) and groundwater abstraction. Of this, 33,000 ha exclusively depend on the flood water (International Fund for Agricultural Development, 2003).
For the past decades till the 1980s, historians and archaeologists had shown much more interest in the spate irrigation systems in Yemen than agricultural experts. Accordingly, there are many documents and artefacts that trace the link between the cultural and economic prosperities in the Western and the Southern escarpments of Yemen and the development of spate irrigation (Al-Shaybani, 2003). In the recent 30 years, irrigation engineers and managers showed some interest in spate irrigation and many water management activities have been carried out. Yet, the system is still poorly understood when compared to perennial irrigation systems. Spate irrigation is not part of the formal educational curriculum of the country, which has made knowledge transfer to the young and future scholars inadequate.
Traditionally, farmers in the vicinity of wadis relied on simple earthen built diversion systems and irrigation networks. The names of the indigenous diversion structures differ from one area to another depending on the size, type of building material, shapes, way of construction and location in the wadi. To mention some names, Ogmas, Obars, Atm (in coastal areas); Saqiya (in Hadramawt) and Rozzum (in some parts of the Highlands) (Al-Shaybani, 2003).
The indigenous spate irrigation systems in Yemen are classified into types I and II. Type I systems consist of temporary structures mainly Ogmas, Obars and Atm. These structures are built from earthen materials and their locations are frequently changed depending on the flood situation. They are very famous and dominant among the farmers in the coastal areas of Tihama. Ogma is an earthen embankment built across the wadi bed to divert the entire flow. Atm is also an earthen bank, but is smaller in size than Ogma and is built in the form of bunds and spurs projecting into the wadis, to divert part of the flow. Ubar is a local term used for a main canal that delivers water from the wadi directly to the fields or to a secondary canal.
The type II spate irrigation systems are composed of Sagiya (Plural: Sawaagi), permanent structures that have a good foundation made up of interlocking stones. The depth of the foundation depends on the depth of the bedrock. If the bedrock is not deeper than 1 m, the farmers prefer to dig all the way till the bed rock. If the bedrock is deeper than 1 m, the depth of the foundation is decided on the basis of local experience and knowledge of the area. The Sagiya is an Arabic word for an irrigation canal and it consists of two main parts - the Al-Quaid or Al-dameer and the head of the canal, Ras al-sagiya. The Al-quaid or Al-dameer is a term used for both the body of the canal and the diversion structure embedded within it to divert water from the wadi to the agricultural fields. These structures that are built from well-interlocked and sometimes cemented stones are widely utilized in Hadramawt and Shabwa provinces (governorate).
The type I dominates most of the indigenous spate irrigation systems in Yemen as many of the farmers who depend on spate irrigation have been and are still resource poor and can not afford to construct the type II structures. The type I structures, although cheap to construct and effective with small to medium floods (< 50 m3 s-1), with larger spates, they are often swept away (FAO, 1997). In order to better control the spate flows, a series of public sector investments, involving the construction of permanent diversion weirs and canal distribution

Principles and Practices of Spate Irrigation Systems 31
structures, have been implemented in the main wadis in the Tihama Plain in the early 1980s. Most of these systems, however, have experienced maintenance and water distribution problems because scheme designs conflicted with traditional water rights.
The modernization and expansion of spate irrigation is also threatening the successful and sustainable exploitation of the water resources in Yemen. The most serious and obvious problem is the rapid depletion of groundwater resources. Many of the downstream fields are being sold to rich farmers who can afford to dig up to 100 to 200 m to tap groundwater and grow commercial crops. Even the upstream farmers have been and are still vastly digging wells so as to harvest cash crops all year round. The uncontrolled utilization of groundwater has led to its overexploitation, which results in a decline of the groundwater table at an average annual rate of 1 m.
3.4 Spate Irrigation Systems in Eritrea
Spate irrigation is locally known as jerif in Eritrea. As stated in Chapter 2, there are 11 spate irrigation systems in the country and cover roughly 16,000 ha, about 56% of the total irrigated area (Table 3.1). Their potential is estimated at 91,000 ha, which is nearly a quarter of the total potential irrigable land.
There are no archaeological findings or artefacts that could, with certainty, enable to answer the question: when did spate irrigation start in Eritrea? Based on interviews conducted with elderly farmers, however, it can be suggested that the Yemenis have introduced the system around hundred years ago (Mehari, el al., 2005c). Although spate irrigation is believed to be the oldest among the irrigation systems in Eritrea, it is the least understood system among irrigation experts and other scholars in the country. Spate irrigation is not taught as a separate subject in the University of Asmara - the only university in Eritrea - it is only briefly mentioned in the introductory irrigation courses.
In the context of Eritrea, spate irrigation can be defined as a method of irrigation that directs large quantities of surface runoff induced by rainfall in the upland areas, which is emitted through normally dry streams or streams with a small base flow to irrigate fields in the low-lying areas. In the indigenous systems, earthen and brushwood diversion structures, the Agims, and distribution structures, the Musghas are used to divert and distribute flood waters that occur during mid June to Mid August. The fields are flooded at least twice to three times to a depth of a minimum of 50 cm during the flood season. This is necessary to enable the soil to retain enough moisture that can take the plants through the usually dry cropping season thus, minimizing the risk of poor yields. The major crops grown are sorghum and maize. In a good flood season, sorghum is harvested twice and some minor crops - pearl millet, sesame and groundnut - are grown.
Unlike the case in the spate irrigation systems in Yemen and Pakistan where conjunctive use of groundwater and surface water is practiced, in Eritrea, the flood water is the only source currently available for the spate-irrigated agriculture. The quantity and quality of the groundwater is yet to be systematically assessed. In the indigenous spate irrigation systems, the flood water is diverted from the wadis to the canals using the weir type low earthen bund and the deflector type low earthen bund structures (Mehari, et al.,
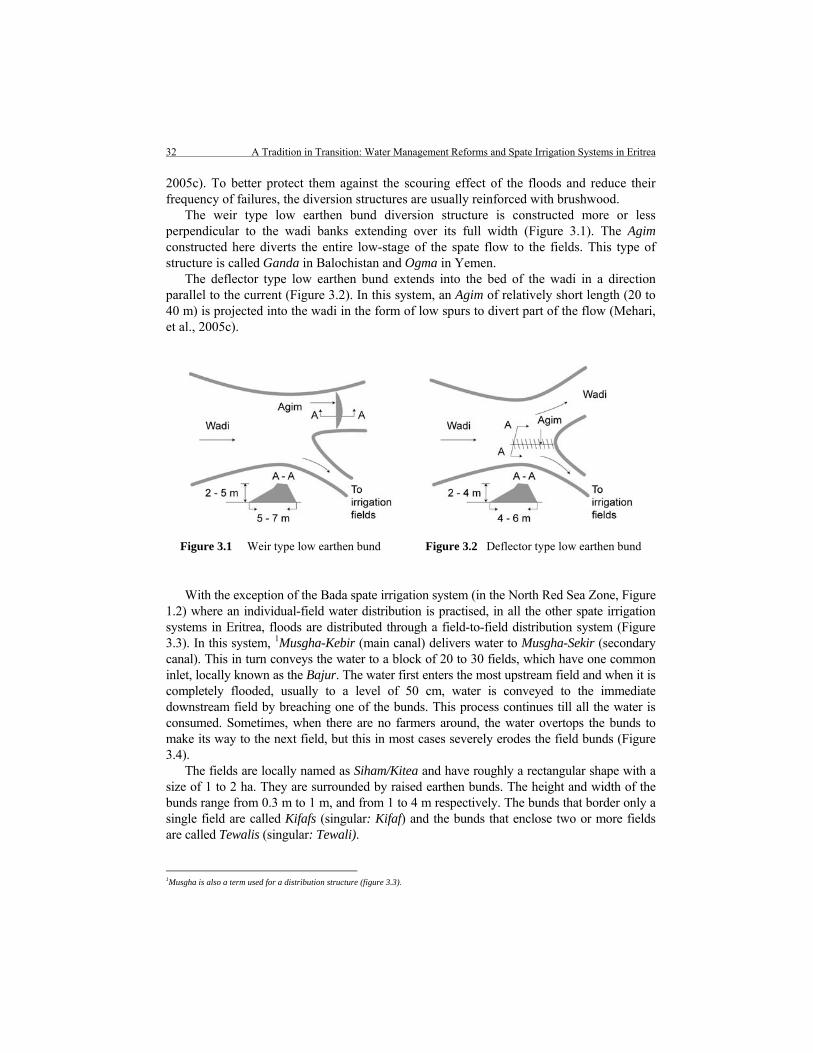
32 A Tradition in Transition: Water Management Reforms and Spate Irrigation Systems in Eritrea
2005c). To better protect them against the scouring effect of the floods and reduce their frequency of failures, the diversion structures are usually reinforced with brushwood.
The weir type low earthen bund diversion structure is constructed more or less perpendicular to the wadi banks extending over its full width (Figure 3.1). The Agim constructed here diverts the entire low-stage of the spate flow to the fields. This type of structure is called Ganda in Balochistan and Ogma in Yemen.
The deflector type low earthen bund extends into the bed of the wadi in a direction parallel to the current (Figure 3.2). In this system, an Agim of relatively short length (20 to 40 m) is projected into the wadi in the form of low spurs to divert part of the flow (Mehari, et al., 2005c).
Figure 3.1 Weir type low earthen bund Figure 3.2 Deflector type low earthen bund
With the exception of the Bada spate irrigation system (in the North Red Sea Zone, Figure 1.2) where an individual-field water distribution is practised, in all the other spate irrigation systems in Eritrea, floods are distributed through a field-to-field distribution system (Figure 3.3). In this system, 1Musgha-Kebir (main canal) delivers water to Musgha-Sekir (secondary canal). This in turn conveys the water to a block of 20 to 30 fields, which have one common inlet, locally known as the Bajur. The water first enters the most upstream field and when it is completely flooded, usually to a level of 50 cm, water is conveyed to the immediate downstream field by breaching one of the bunds. This process continues till all the water is consumed. Sometimes, when there are no farmers around, the water overtops the bunds to make its way to the next field, but this in most cases severely erodes the field bunds (Figure 3.4).
The fields are locally named as Siham/Kitea and have roughly a rectangular shape with a size of 1 to 2 ha. They are surrounded by raised earthen bunds. The height and width of the bunds range from 0.3 m to 1 m, and from 1 to 4 m respectively. The bunds that border only a single field are called Kifafs (singular: Kifaf) and the bunds that enclose two or more fields are called Tewalis (singular: Tewali).
1Musgha is also a term used for a distribution structure (figure 3.3).
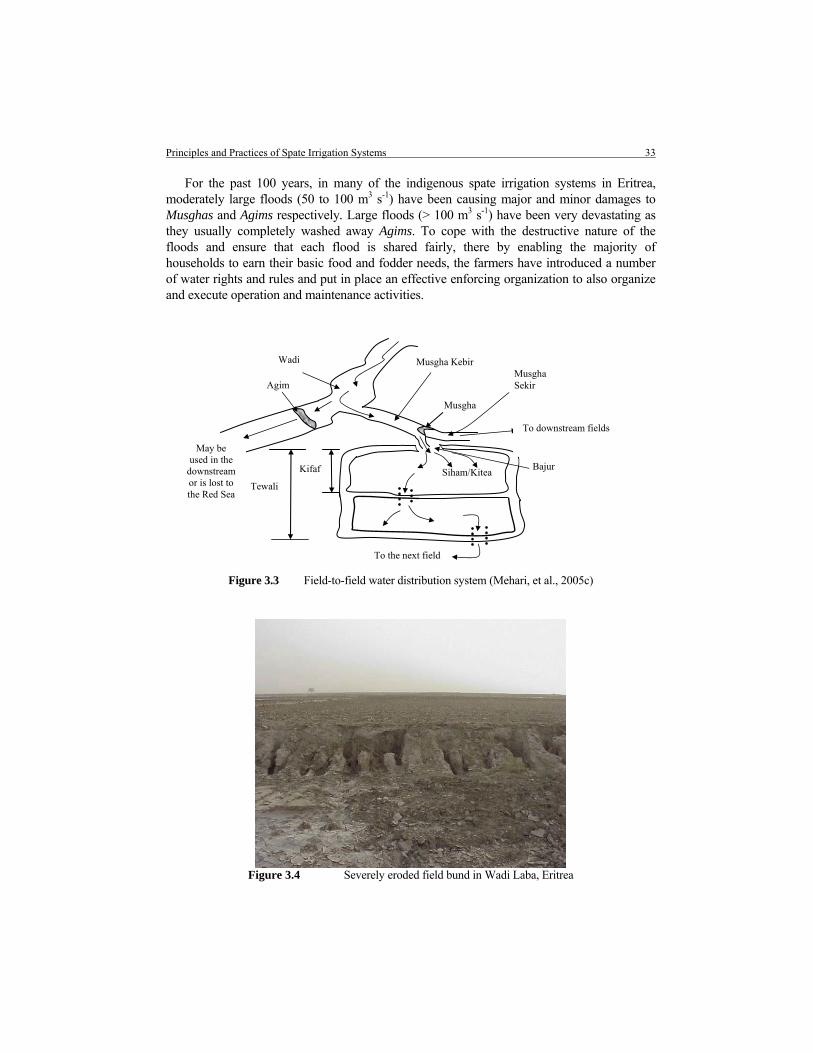
Principles and Practices of Spate Irrigation Systems 33
For the past 100 years, in many of the indigenous spate irrigation systems in Eritrea, moderately large floods (50 to 100 m3 s-1) have been causing major and minor damages to Musghas and Agims respectively. Large floods (> 100 m3 s-1) have been very devastating as they usually completely washed away Agims. To cope with the destructive nature of the floods and ensure that each flood is shared fairly, there by enabling the majority of households to earn their basic food and fodder needs, the farmers have introduced a number of water rights and rules and put in place an effective enforcing organization to also organize and execute operation and maintenance activities.
Figure 3.3 Field-to-field water distribution system (Mehari, et al., 2005c)
Figure 3.4 Severely eroded field bund in Wadi Laba, Eritrea
Siham/Kitea
Musgha Kebir
Musgha
Musgha Sekir
To downstream fields
Agim
Wadi
Kifaf
To the next field
Tewali
Bajur
May be used in the
downstream or is lost to the Red Sea

34 A Tradition in Transition: Water Management Reforms and Spate Irrigation Systems in Eritrea
The indigenous water management practices have significantly contributed to making the spate irrigation systems sustainable. They have not been able, however, to improve the living standard of the farmers beyond the subsistence level - they are still living from hand to mouth. With the primary aim of improving the livelihood of the farmers, water management reforms have been pioneered in the Wadi Laba spate irrigation system.
3.5 Concluding Remarks
As compared to the other perennial irrigation systems, spate irrigation is the least studied and the least understood among irrigation engineers and managers, and other scholars with related fields of specializations. Even in Pakistan and Yemen, where it dates back to 5,000 years, spate irrigation is not yet part of the curriculum of the academic institutions. Likewise, although spate irrigation is a century old in Eritrea, the University of Asmara does not offer a single course in spate irrigation.
The major challenges in the management of spate irrigation systems in the countries presented in the above are the unpredictability of the flood water in occurrence and amount, its high sediment load and destructive nature. Unlike the case in many of the other countries, there is not yet groundwater abstraction in Eritrea and the spate irrigation systems are entirely dependent on the surface (flood) water. This has made the flood water management task much more important, but also very difficult as each flood needs to be directly diverted and shared fairly.
In the countries listed in Table 3.1and in several others, spate irrigation serves as the major source of livelihood for the rural poor population. This fact has negatively affected the allocation of resources for the development of the indigenous spate irrigation systems. A number of the concerned governments channel most of their financial resources to the perennial irrigation systems as these have relatively reliable water sources and are perceived of having a higher sustainable return, and lesser risks and uncertainties with regard to crop production. Nevertheless, some water management reform activities have been carried out in the 1970s and 1980s particularly in Yemen and Pakistan, and recently in Eritrea, albeit with limited successes.

The Study Site: The Wadi Laba Spate Irrigation System 35
4 The Study Site: The Wadi Laba Spate Irrigation System
This chapter presents and discusses the land and water resources of the study area - the Wadi Laba spate irrigation system. It mainly focuses on the analyses of the infiltration rates and water holding capacities of the Wadi Laba soils. These are the two most important soil physical properties. The major crops, sorghum and maize, complete their entire growth cycle on the basis of the residual moisture; and the flood water is highly unpredictable in occurrence making it necessary that the large irrigation gift (50 cm) recedes timely for the next irrigation. Given its significant impact on infiltration and water holding capacity, the soil texture of the irrigated fields is discussed at length. A description of the infrastructure and the design and layout of the irrigation system before and after the water management reforms, and the crop and livestock production systems, is also provided.
The set-up of this chapter is as follows. First, it presents the location, climate and demography of the Wadi Laba irrigation system, its infrastructure and command areas and flood water resources. Next, it analyses in detail the soil texture, infiltration rate, and water holding capacity of the irrigated fields. Then, it provides an account on crop and livestock production systems. The chapter winds up with some concluding remarks.
4.1 Location, Climate and Demography
The Wadi Laba catchment (Figure 4.1) is the biggest of all the catchments that supply flood water to the 11 spate irrigation systems located on the coastal plains of Eritrea. It can be broadly divided into lower and upper sections.
Figure 4.1 Location map of Eritrea and the Wadi Laba catchment and irrigation system
Sudan
Wad
i Lab
a ir
riga
tion
syst
em
Red
Sea
Ethiopia
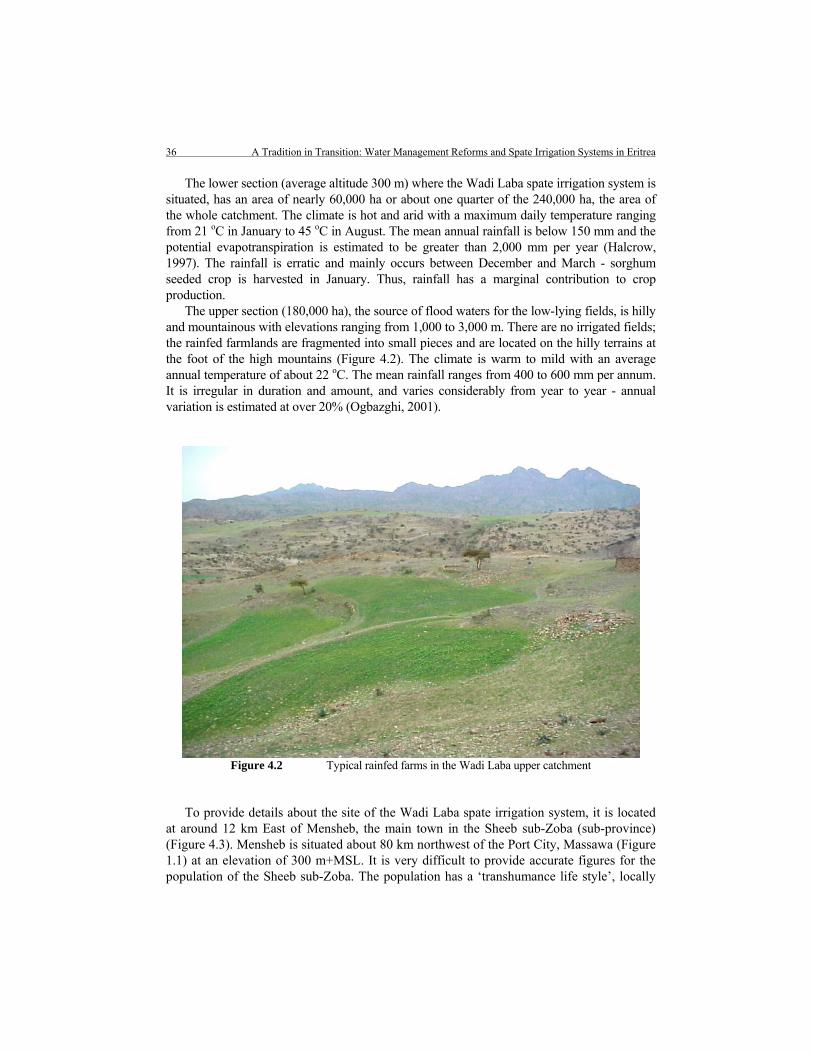
36 A Tradition in Transition: Water Management Reforms and Spate Irrigation Systems in Eritrea
The lower section (average altitude 300 m) where the Wadi Laba spate irrigation system is situated, has an area of nearly 60,000 ha or about one quarter of the 240,000 ha, the area of the whole catchment. The climate is hot and arid with a maximum daily temperature ranging from 21 oC in January to 45 oC in August. The mean annual rainfall is below 150 mm and the potential evapotranspiration is estimated to be greater than 2,000 mm per year (Halcrow, 1997). The rainfall is erratic and mainly occurs between December and March - sorghum seeded crop is harvested in January. Thus, rainfall has a marginal contribution to crop production.
The upper section (180,000 ha), the source of flood waters for the low-lying fields, is hilly and mountainous with elevations ranging from 1,000 to 3,000 m. There are no irrigated fields; the rainfed farmlands are fragmented into small pieces and are located on the hilly terrains at the foot of the high mountains (Figure 4.2). The climate is warm to mild with an average annual temperature of about 22 oC. The mean rainfall ranges from 400 to 600 mm per annum. It is irregular in duration and amount, and varies considerably from year to year - annual variation is estimated at over 20% (Ogbazghi, 2001).
Figure 4.2 Typical rainfed farms in the Wadi Laba upper catchment
To provide details about the site of the Wadi Laba spate irrigation system, it is located at around 12 km East of Mensheb, the main town in the Sheeb sub-Zoba (sub-province) (Figure 4.3). Mensheb is situated about 80 km northwest of the Port City, Massawa (Figure 1.1) at an elevation of 300 m+MSL. It is very difficult to provide accurate figures for the population of the Sheeb sub-Zoba. The population has a ‘transhumance life style’, locally

The Study Site: The Wadi Laba Spate Irrigation System 37
known as ‘Sebekh Sagm’. When literally translated the phrase ‘Sebekh Sagm’ means ‘to seasonally move from place to place’. In search of supplementary food and fodder, and to escape the scorching sun, the farmers migrate to the upper part of the catchment between June and October of each year where they have communally owned grazing areas and small (< 0.25 ha) rainfed fields.
Figure 4.3 Location map of the Wadi Laba irrigation system (Mehari, et al., 2005b)
There are no long-term data that enable to analyse the degree of intra-annual variation of the number of migrants and the reasons that could have led to such a variation. The only estimate of the number of inhabitants of the Sheeb sub-Zoba who earn their living almost entirely from crop production under the Wadi Laba spate irrigation system is done for the period October to May (Daniel, 1997) (Table 4.1). These are the months when most of the

38 A Tradition in Transition: Water Management Reforms and Spate Irrigation Systems in Eritrea
families are present in the lower catchment villages and thus, the estimate only represents the maximum population.
Table 4.1 Population statistics by village in the Sheeb sub-Zoba (Daniel, 1997)
Village name Households
number Household heads,
male Household heads,
female Estimated
population number
Bises 250 183 67 1,750
Tiluk 500 455 45 3,500
Ghineb 230 200 30 1,610
Mensheb 904 827 77 6,328
Sheeb-kethin 1,000 941 59 7,000
Dimnadige 234 197 37 1,638
Total 3,118 2,803 315 21,826
The family size of a single household in the Sheeb sub-Zoba is in the range of 6 to 8 persons, which is as large as elsewhere in the rural areas of Eritrea. Using an average of 7 persons per household, the population of the area would be about 22,000 (Table 4.1). The population growth is 3% per annum, which is also the national average.
The majority of the population in the Sheeb sub-Zoba are Muslims. They belong to the ethnic group Tigre and originate from ten different clans: Regibat, Aflanda, Bete-Asghede, Zagir, Asfada, Bete-lailit, Dobait, Adetemariam, De-deg and Ade-lim. There are also some ethnic Rashaida settlers. The local languages spoken are Tigre and Arabic.
Nearly 80% of the population are illiterate. Most of the inhabitants of the area interrupt their education at an early stage of elementary school (1st to 5th grade) primarily due to poverty of their parents and other associated cultural problems such as early marriage in the case of the female gender (Tesfay, 2001).
Mrara, Fshey, Wekiro, Wedilo, Shelshela, Adi-Ayum villages belong to the Sheeb sub-Zoba (Table 4.1). They are not, however, included in the population estimation because their inhabitants do not directly depend on the Wadi Laba spate irrigation systems for their livelihood. They rely on other spate irrigation systems, which are not the focus of this research.
4.2 Layout and Command Area of the Indigenous System
In the Wadi Laba indigenous system, there were two main canals: Sheeb-Kethin and Sheeb-Abay. At 300 m, the main Agim, the Jelwet divided the Sheeb-Abay into two secondary canals, the Ede-Abay and Errem. Along the Errem canal, at 600, 800 and 2,000 m the respective offtakes of Bises, Debret and Emdenay abstracted and conveyed water to the corresponding tertiary units with the help of Musghas. Debret had a second offtake at 800 m of the 3,000 m long Ede-Abay canal, which had the Ede-Eket offtake at its downstream end (Figure 4.4). The five major irrigation zones in the Wadi Laba - Sheeb-Khetin, Errem, Ede-
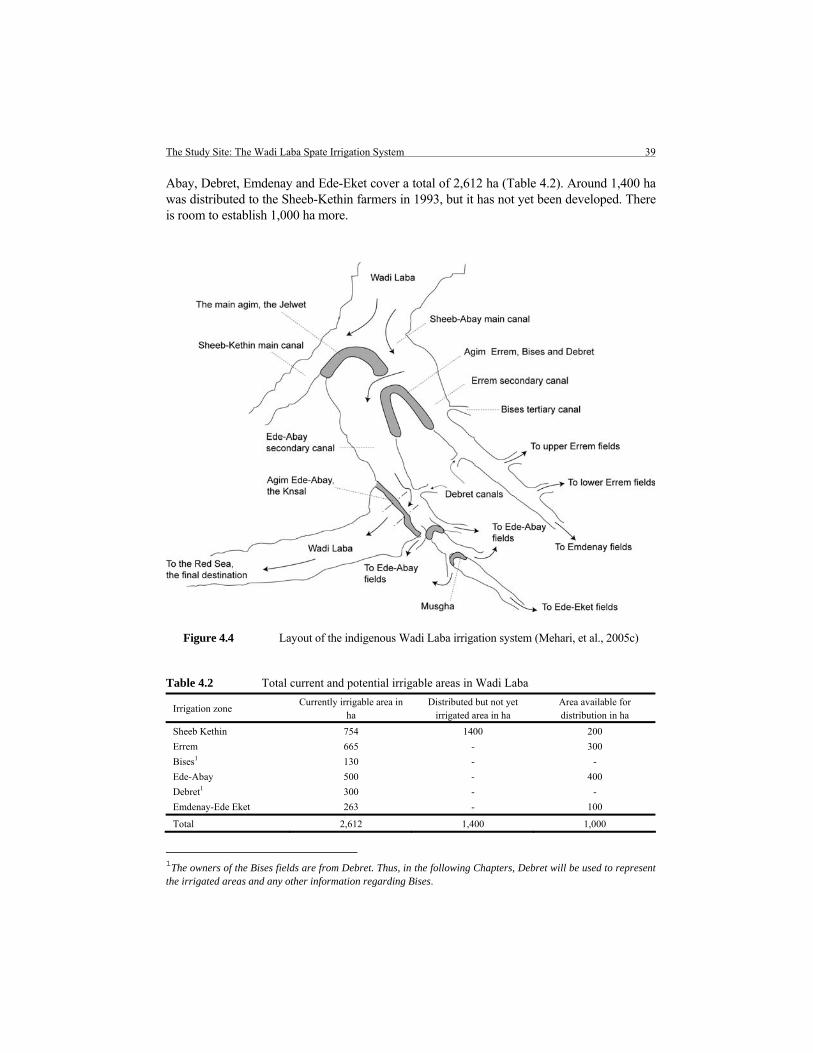
The Study Site: The Wadi Laba Spate Irrigation System 39
Abay, Debret, Emdenay and Ede-Eket cover a total of 2,612 ha (Table 4.2). Around 1,400 ha was distributed to the Sheeb-Kethin farmers in 1993, but it has not yet been developed. There is room to establish 1,000 ha more.
Figure 4.4 Layout of the indigenous Wadi Laba irrigation system (Mehari, et al., 2005c)
Table 4.2 Total current and potential irrigable areas in Wadi Laba
Irrigation zone Currently irrigable area in
ha Distributed but not yet
irrigated area in ha Area available for distribution in ha
Sheeb Kethin 754 1400 200
Errem 665 - 300
Bises1 130 - -
Ede-Abay 500 - 400
Debret1 300 - -
Emdenay-Ede Eket 263 - 100
Total 2,612 1,400 1,000
1The owners of the Bises fields are from Debret. Thus, in the following Chapters, Debret will be used to represent the irrigated areas and any other information regarding Bises.

40 A Tradition in Transition: Water Management Reforms and Spate Irrigation Systems in Eritrea
For the past century, till 1980, about 100 landlords owned the whole Wadi Laba spate irrigated areas. The remaining vast majority of the farmers earned their living as tenants. The landlord households’ possession ranged between 100 and 160 mietdera (approximately 25 to 40 ha). Mietdera is a local land area unit equivalent to a quarter of a hectare. In 1980, when the Eritrean Peoples’ Liberation Front (EPLF), the ruling party now in the country, took over the Sheeb sub-Zoba, the land was redistributed equitably to all inhabitants. At the time of redistribution, each household consisting of husband, wife and children was given four mietdera. Divorced men and women, single adults of 18 year or more, orphans who were less than 18 year of age were given two mietdera.
4.3 Indigenous Irrigation Structures
Indigenous irrigation structures are defined here as those structures, which depend on local material for their construction and are built by the engineering skills of the local farmers in the study area. According to the way they are built and to the purpose of utilisation, the structures can be classified as follows.
Spillways (Khala): In the Wadi Laba, spillways are locally called Khala. According to the FAO (1987), they are called Al-Masakchil in Yemen. The purpose of this structure is to control the distribution of water entering the fields. The structure is therefore constructed on the side of the embankments of the field canals. The width of the spillways varies between 1.5 and 3.5 m. Any discharge exceeding the capacity of the field canals will return through this structure back to the main canal(s).
Drop structures (Mefjar): Drop structures are locally termed Mefjar in the Wadi Laba spate irrigation system. They are named Al-Masagit in Yemen (FAO, 1987). This structure is used to dissipate flow energy so that scouring is minimised. It is made from stones where the gaps between the large stones are filled with smaller ones. In some instances, the drop structures are covered only with grass. The width of these drop structures varies in accordance to the size of the canals. The height varies between 0.5 to 0.7 m.
Irrigation canal (Musgha): Musgha is a local Tigre name of a canal that delivers water to the fields. Musgha Kebir (Kebir means large) is a main canal, which conveys water from the wadi to a secondary canal or directly to the fields. Musgha Sekir (Sekir means small) is a secondary canal that delivers water from the main canal to the fields or as in the cases of individual-field water distribution systems, to a tertiary canal, the Shaget. Musgha is also a term used for a structure that is either constructed in a broad U-style or for a soil band built along the middle of a canal to distribute water between two secondary or tertiary units. In Yemen, Musgha is locally called Al-Qaid (FAO, 1987).
Diversion structure (Agim): Agim is the Tigre term for a structure that blocks and guides water. In the Wadi Laba, Agim is used to divert water from the wadis to the Musgha. It is a temporary structure and is susceptible to damage by floods. When it is submerged in water, it generates strong turbulence that makes it subject to being washed away. This structure is made from local materials available near the site, such as stones, soil and brushwood. It is usually constructed across the wadi bed and extends parallel to the current flow along the

The Study Site: The Wadi Laba Spate Irrigation System 41
main canal. The common types of Agims in the Wadi Laba are stone, soil, brushwood and mixed Agims. Pure brushwood Agims are rarely constructed as there is scarcity of brushwood and trees in the nearby vicinity.
Stone Agims are constructed from stones of varying size (Figure 4.5), which are collected from the banks of the wadi. Large stones and/or boulders are laid on the selected section of the wadi or main canal. The gaps between the large stones and/or boulders are filled with smaller size stones, which in turn are pressed from above with larger stones.
Figure 4.5 Stone Agim
Soil Agims are constructed from homogeneous wadi bed material, mostly sandy soil. They are common in places where other materials such as stones, boulders and brushwood are scarce and only found far away from the diversion site. To prevent frequent scouring, boulders or brushwood are placed on the upstream end (Figure 4.6).
Figure 4.6 Soil Agim
Brushwood Agims are constructed in the middle or at the bank of the wadi and are used to divert part of the stream. The brushwood is placed in such a way that the leaves face the upstream and the sticks downstream. Wooden piles (pieces of trunk) make up their core.
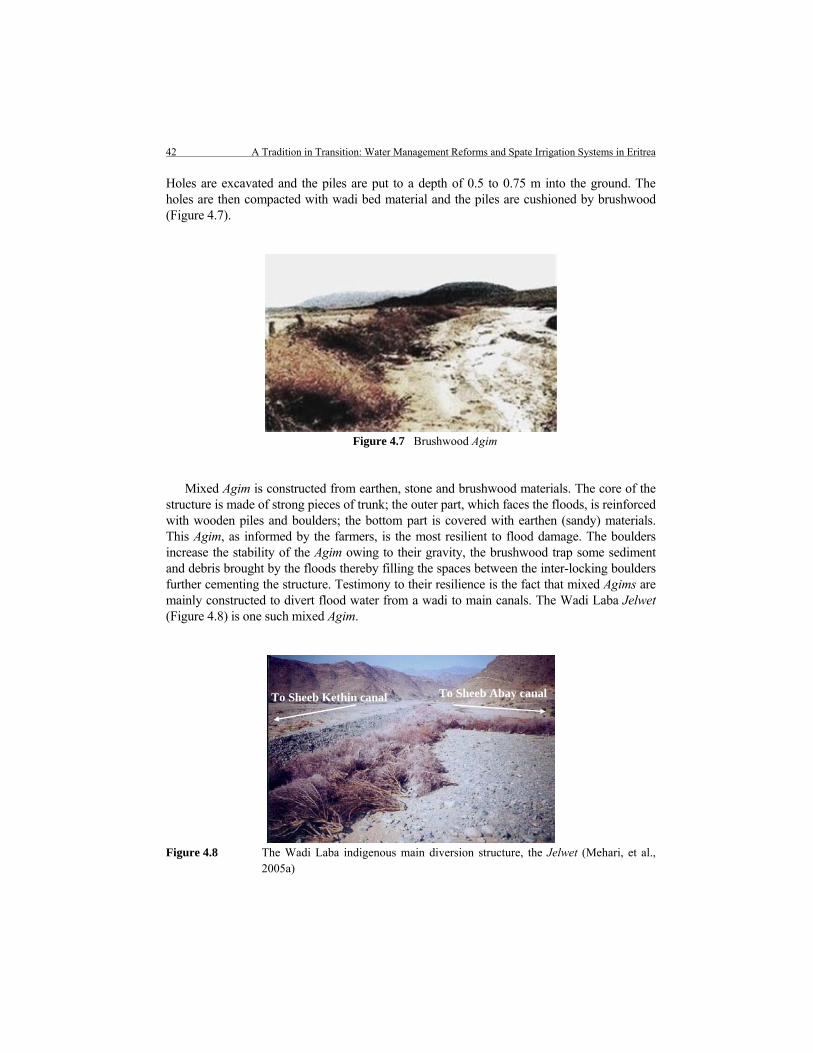
42 A Tradition in Transition: Water Management Reforms and Spate Irrigation Systems in Eritrea
Holes are excavated and the piles are put to a depth of 0.5 to 0.75 m into the ground. The holes are then compacted with wadi bed material and the piles are cushioned by brushwood (Figure 4.7).
Figure 4.7 Brushwood Agim
Mixed Agim is constructed from earthen, stone and brushwood materials. The core of the structure is made of strong pieces of trunk; the outer part, which faces the floods, is reinforced with wooden piles and boulders; the bottom part is covered with earthen (sandy) materials. This Agim, as informed by the farmers, is the most resilient to flood damage. The boulders increase the stability of the Agim owing to their gravity, the brushwood trap some sediment and debris brought by the floods thereby filling the spaces between the inter-locking boulders further cementing the structure. Testimony to their resilience is the fact that mixed Agims are mainly constructed to divert flood water from a wadi to main canals. The Wadi Laba Jelwet (Figure 4.8) is one such mixed Agim.
Figure 4.8 The Wadi Laba indigenous main diversion structure, the Jelwet (Mehari, et al.,
2005a)
To Sheeb Kethin canal To Sheeb Abay canal
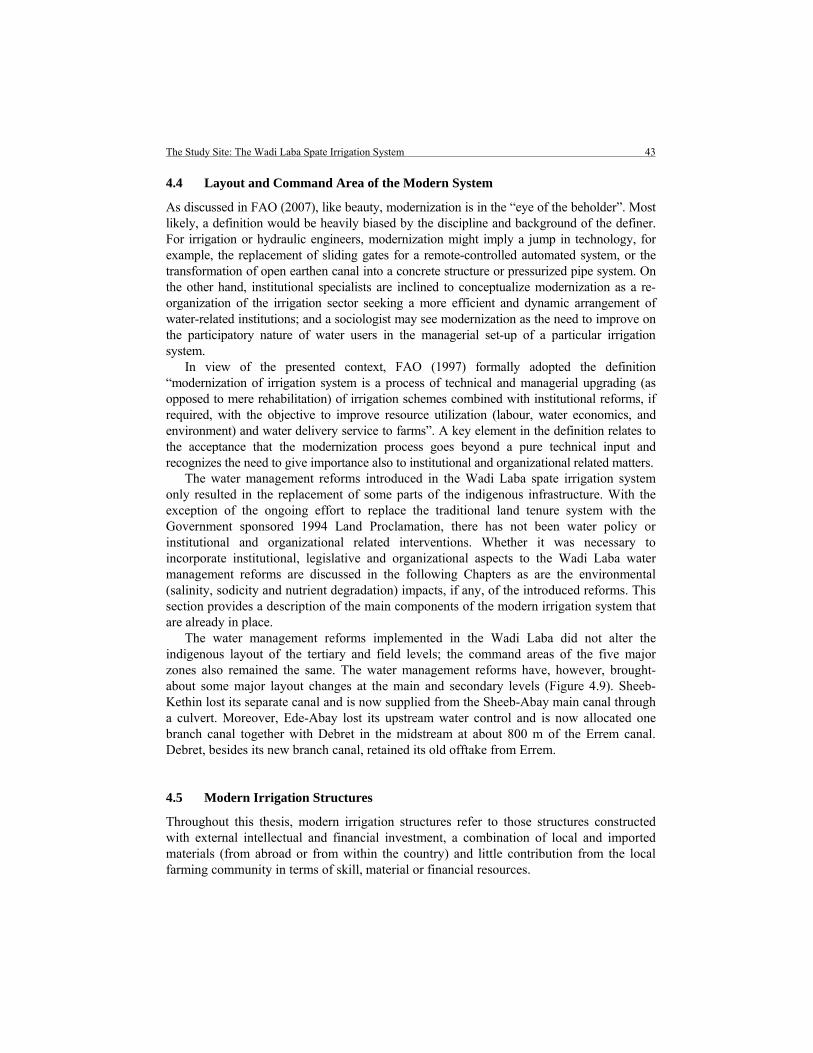
The Study Site: The Wadi Laba Spate Irrigation System 43
4.4 Layout and Command Area of the Modern System
As discussed in FAO (2007), like beauty, modernization is in the “eye of the beholder”. Most likely, a definition would be heavily biased by the discipline and background of the definer. For irrigation or hydraulic engineers, modernization might imply a jump in technology, for example, the replacement of sliding gates for a remote-controlled automated system, or the transformation of open earthen canal into a concrete structure or pressurized pipe system. On the other hand, institutional specialists are inclined to conceptualize modernization as a re-organization of the irrigation sector seeking a more efficient and dynamic arrangement of water-related institutions; and a sociologist may see modernization as the need to improve on the participatory nature of water users in the managerial set-up of a particular irrigation system.
In view of the presented context, FAO (1997) formally adopted the definition “modernization of irrigation system is a process of technical and managerial upgrading (as opposed to mere rehabilitation) of irrigation schemes combined with institutional reforms, if required, with the objective to improve resource utilization (labour, water economics, and environment) and water delivery service to farms”. A key element in the definition relates to the acceptance that the modernization process goes beyond a pure technical input and recognizes the need to give importance also to institutional and organizational related matters.
The water management reforms introduced in the Wadi Laba spate irrigation system only resulted in the replacement of some parts of the indigenous infrastructure. With the exception of the ongoing effort to replace the traditional land tenure system with the Government sponsored 1994 Land Proclamation, there has not been water policy or institutional and organizational related interventions. Whether it was necessary to incorporate institutional, legislative and organizational aspects to the Wadi Laba water management reforms are discussed in the following Chapters as are the environmental (salinity, sodicity and nutrient degradation) impacts, if any, of the introduced reforms. This section provides a description of the main components of the modern irrigation system that are already in place.
The water management reforms implemented in the Wadi Laba did not alter the indigenous layout of the tertiary and field levels; the command areas of the five major zones also remained the same. The water management reforms have, however, brought-about some major layout changes at the main and secondary levels (Figure 4.9). Sheeb-Kethin lost its separate canal and is now supplied from the Sheeb-Abay main canal through a culvert. Moreover, Ede-Abay lost its upstream water control and is now allocated one branch canal together with Debret in the midstream at about 800 m of the Errem canal. Debret, besides its new branch canal, retained its old offtake from Errem.
4.5 Modern Irrigation Structures
Throughout this thesis, modern irrigation structures refer to those structures constructed with external intellectual and financial investment, a combination of local and imported materials (from abroad or from within the country) and little contribution from the local farming community in terms of skill, material or financial resources.

44 A Tradition in Transition: Water Management Reforms and Spate Irrigation Systems in Eritrea
*OT is a new intake constructed by the Ede-Abay farmers to increase their water supply
Figure 4.9 The layout of the Wadi Laba modern spate irrigation system after water management reforms (Mehari, et al., 2005c)
The major modern structures introduced as part of the structural water management reforms are a concrete headwork that replaced the Jelwet, a gravel trap, a culvert, Secondary Canal Head Regulator Gates (SCHRGs) and a rejection weir. Apart from this, three Musghas and Agims (one in Sheeb-Kethin and two in Sheeb-Abay) that distributed water from the main to the secondary canals were converted to gabion. The two Musghas in Ede-Abay that spread water to tertiary canals (Figure 4.9) were also planned to be replaced by gabion. This has not yet been done, however, owing to water distribution related conflicts between the concerned farmers and engineers.
The design features and functions of the major modern structures are described below.

The Study Site: The Wadi Laba Spate Irrigation System 45
Concrete headwork: The concrete headwork (Figure 4.10) has three major components - the Main Canal Head Regulator Gates (MCHRGs), the scour sluice and the breaching bund. The MCHRGs convey water from the wadi to the main canals. They consist of a total of 5 intakes supplied with radial gates. Each intake is 1.5 m deep and 2 m wide. The design discharge of the intakes is 50 m3 s-1. The scour sluice, a 1.5 m deep and a 2 m wide intake with a radial gate, limits the amount of coarse sediment that enters the MCHRGs. When fully operational, its capacity is 25 m3 s-1. The breaching bund is a 110 m long and a 2 m high earthen bund. It is designed to breach at a discharge of 265 m3 s-1 so as to prevent any damage to the main concrete parts of the headwork.
Figure 4.10 The Wadi Laba modern headwork
Gravel trap: the gravel trap (Figure 4.11) is located at the immediate downstream of the MCHRGs to collect coarse sediment the scour sluice failed to remove thus minimizing sedimentation problems in the canals and fields. It has two sections. The upper section with a capacity of 24,000 m3 where the coarsest sand settles and the lower section that collects a maximum of 46,000 m3 of relatively fine sand. As it can be seen from Figure 4.11, cleaning of the gravel trap needs heavy machinery.
Culvert: As mentioned, the culvert was introduced as a replacement for the Sheeb-Kethin earthen open canal. Its two un-gated intakes (Figure 4.12) abstract water at the upper section of the gravel trap. The water is carried underneath the wadi bed for about half a kilometre to be delivered to the Sheeb-Kethin fields. The culvert was designed with a 7 m head between its inlet and outlet so as to generate a velocity of 3 m s-1 and avoid sedimentation. It was designed to divert about 25% of the discharge supplied by the MCHRGs. Thus, its design capacity is 12.5 m s-1.
Main Canal Head Regulator Gates (MCHRGs)
Scour sluice
Breaching bund

46 A Tradition in Transition: Water Management Reforms and Spate Irrigation Systems in Eritrea
Figure 4.11 The Wadi Laba gravel trap with the cleaning operation in action
Figure 4.12 The Sheeb-Kethin culvert
Secondary Canal Head Regulator Gates: Secondary Canal Head Regulator Gates (SCHRGs) are located at the tail end of the gravel trap to convey water and fine suspended sediment to the irrigated fields. Their three intakes, which have the same design features as that of the MCHRGs, supply a maximum flow of 38 m s-1.
Rejection weir: Rejection weir is a 15 m long spillway just upstream of the SCHRGs. Its crest is set at the same upper level as that of the SCHRGs so as it discharges any flow above 38 m s-1 back to the wadi.
Main Canal Head Regulator Gates

The Study Site: The Wadi Laba Spate Irrigation System 47
4.6 Water Resources
The Wadi Laba spate irrigation system receives water mainly from the Wadi (ephemeral streams) Laba, which drains in the period June to August. This is the time when there is heavy rainfall in the upper catchment
The hydrological data of the Wadi Laba (Table 4.3) is to a large extent based on annual rainfall data of some agro-ecological zones in the country with climatic features that resemble that of the Wadi Laba catchment; and secondary data from wadis in Yemen with catchment characteristics comparable to those of the Wadi Laba (Halcrow, 1997). Hence, the data should be treated with caution.
Since 1994, the Water Resource Department (WRD) of the state of Eritrea has made some attempts to install data loggers in Laba and derive some discharge values. The instruments were not, however, properly operated and tended. In most cases, the floods frequently damaged the loggers before the data were downloaded. The limited data successfully downloaded were stored in corrupt diskettes and are inaccessible (Halcrow, 1997). In preparation for the design of a headwork (Figure 4.10), the effort done in 1996 to estimate the average annual discharge of Wadi Laba using the slope-area method was also unsuccessful. This is because the year 1996 was a dry year with only 9 floods.
Table 4.3 Basic Hydrological data for Wadi Laba (Halcrow, 1997)*
Date Wadi Laba
Catchment area in km2 1,800
Length of the wadi in km 56
Highest point of catchment in m+MSL 2,625
Elevation at diversion site in m+MSL 259
Mean annual rainfall of catchment in mm 600
Mean annual flow volume of wadi in million m3 51
Mean annual flood discharge of wadi in m s-1 150
5 year flood in m s-1 265
10 year flood in m s-1 410
20 year flood in m s-1 500
50 year flood in m s-1 690
*These data should be treated with caution
4.7 Soil Resource Analyses
4.7.1 Soil Texture
Soil texture and structure, bulk and particle densities, and porosity are the major soil physical properties that determine the extent of the water-storage capacity of the soil. To this end, probably, the single most important parameter is texture. A number of studies (Thomas, et al., 2004 and Randall and Sharon, 2005) have shown that estimates of many

48 A Tradition in Transition: Water Management Reforms and Spate Irrigation Systems in Eritrea
physical, chemical, and biological characteristics of soils can be done if their texture is accurately assessed. Therefore, the texture of the Wadi Laba fields has been analysed in detail. The analysis methods available - the ‘feel’, the ‘hydrometer’ and the ‘pipette’, and the results obtained using the pipette method are discussed below.
In simple terms, soil texture is the size distribution of primary soil particles that are smaller than 2 mm. The percentages of sand (2 to 0.05 mm diameter), silt (0.05 to 0.002 mm diameter) and clay (smaller than 0.002 mm diameter) determine the textural classes of soils. A quick estimate of texture can be made in the field by the ‘feel method’ where a ball of soil is put between the thumb and the forefinger and a ribbon of soil is formed while adding water drop wise. If no ribbon is formed, it is sand to loamy sand soil; < 250 mm ribbon, sandy loam, silt loam and loam; 250 to 500 mm ribbon, sandy clay loam, silt clay loam and clay loam; > 500 mm ribbon, sandy clay, silt clay and clay. When high accuracy is needed, however, as is the case in this research, soil texture analysis would have to be done in a laboratory (Randall and Sharon, 2005).
The pipette and the hydrometer are the two dominant and widely used mechanical laboratory texture analysis methods. They are based on the principle that soil particles suspended in a solution settle down at a rate that depends on their size. Settling rate is given by Stoke’s Law (Randall and Sharon, 2005) (Equation 4.1).
( )μ
ρρ18
2gdV wbs
−= (4.1)
where Vs is settling velocity in m s-1, Pp is soil particle density in kg m-3 (2,650), Pw is water density in kg m-3 (1000), g is acceleration due to gravity in m s-2 (9.8), d is diameter of soil particle in m (fine sand, 5 *10-5; fine silt, 2*10-6), µ is water viscosity in kg m-1 s-1 (10-3).
Substituting the indicated values in Equation 4.1, all very fine sand and very fine silt sized particles require about 45 seconds and 8 hours respectively to settle a distance of 10 cm in water at room temperature. Thus, if a sample of soil in water is completely dispersed, at time zero; sand, silt and clay particles are uniformly distributed in water. At 45 seconds, the suspension above the 10 cm depth level will contain only silt and clay, and at 8 hours, only clay. In the hydrometer method, a calibrated hydrometer is inserted to the suspension at the specified times and depth to measure its density from which the contents of the different soil particles can be determined. In the pipette method, a sub-sample is extracted at the end of 45 seconds and 8 hours. It is then oven dried, weighed, and a calculation is done to determine the percentages of sand and silt.
The hydrometer method is frequently used in routine work where quick measurements are necessary and extreme accuracy is not required. The pipette method is widely believed to be more accurate, but it is time consuming (Thomas, et al., 2004). To achieve the maximum precision possible, the soil texture analysis of the Wadi Laba irrigated fields was carried out using the pipette method with organic matter pre-treatment. Twelve fields were randomly selected - four in each of the upstream (Sheeb-Kethin), midstream (Debret) and downstream (Emdenay/Ede-Eket) irrigation zones. In an effort to have a representative sample, each of the selected fields (1 ha in size) was divided into 25 small rectangles of
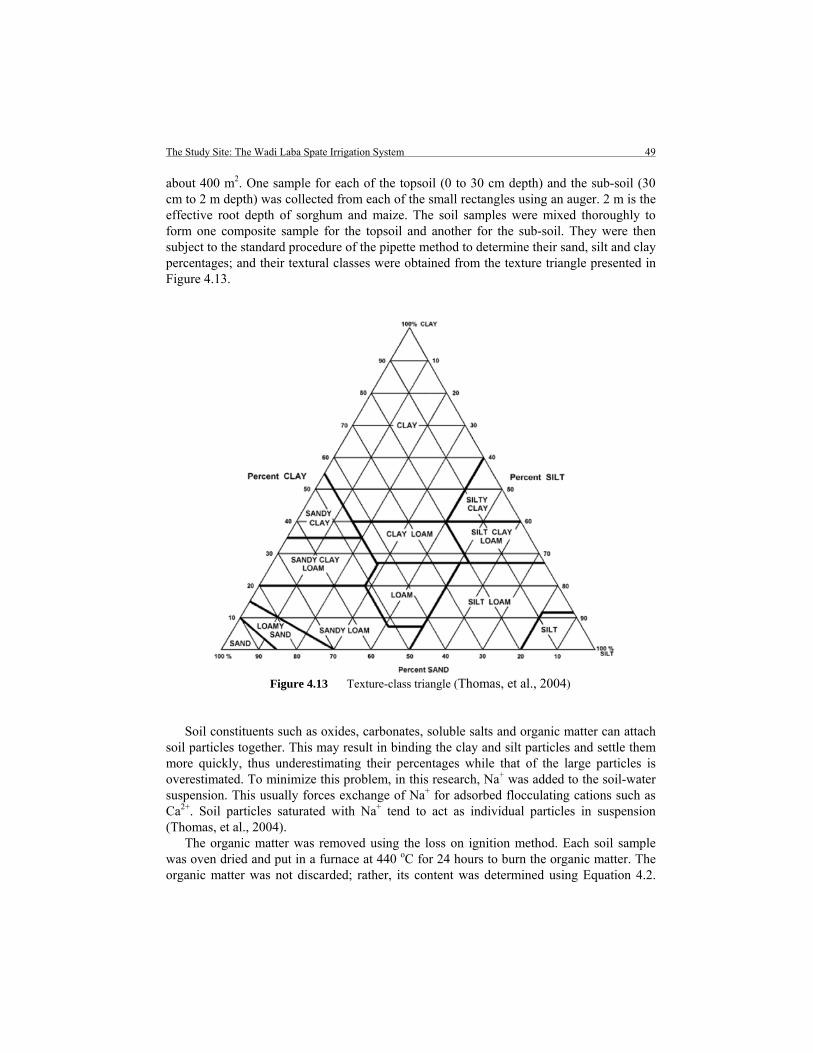
The Study Site: The Wadi Laba Spate Irrigation System 49
about 400 m2. One sample for each of the topsoil (0 to 30 cm depth) and the sub-soil (30 cm to 2 m depth) was collected from each of the small rectangles using an auger. 2 m is the effective root depth of sorghum and maize. The soil samples were mixed thoroughly to form one composite sample for the topsoil and another for the sub-soil. They were then subject to the standard procedure of the pipette method to determine their sand, silt and clay percentages; and their textural classes were obtained from the texture triangle presented in Figure 4.13.
Figure 4.13 Texture-class triangle (Thomas, et al., 2004)
Soil constituents such as oxides, carbonates, soluble salts and organic matter can attach soil particles together. This may result in binding the clay and silt particles and settle them more quickly, thus underestimating their percentages while that of the large particles is overestimated. To minimize this problem, in this research, Na+ was added to the soil-water suspension. This usually forces exchange of Na+ for adsorbed flocculating cations such as Ca2+. Soil particles saturated with Na+ tend to act as individual particles in suspension (Thomas, et al., 2004).
The organic matter was removed using the loss on ignition method. Each soil sample was oven dried and put in a furnace at 440 oC for 24 hours to burn the organic matter. The organic matter was not discarded; rather, its content was determined using Equation 4.2.
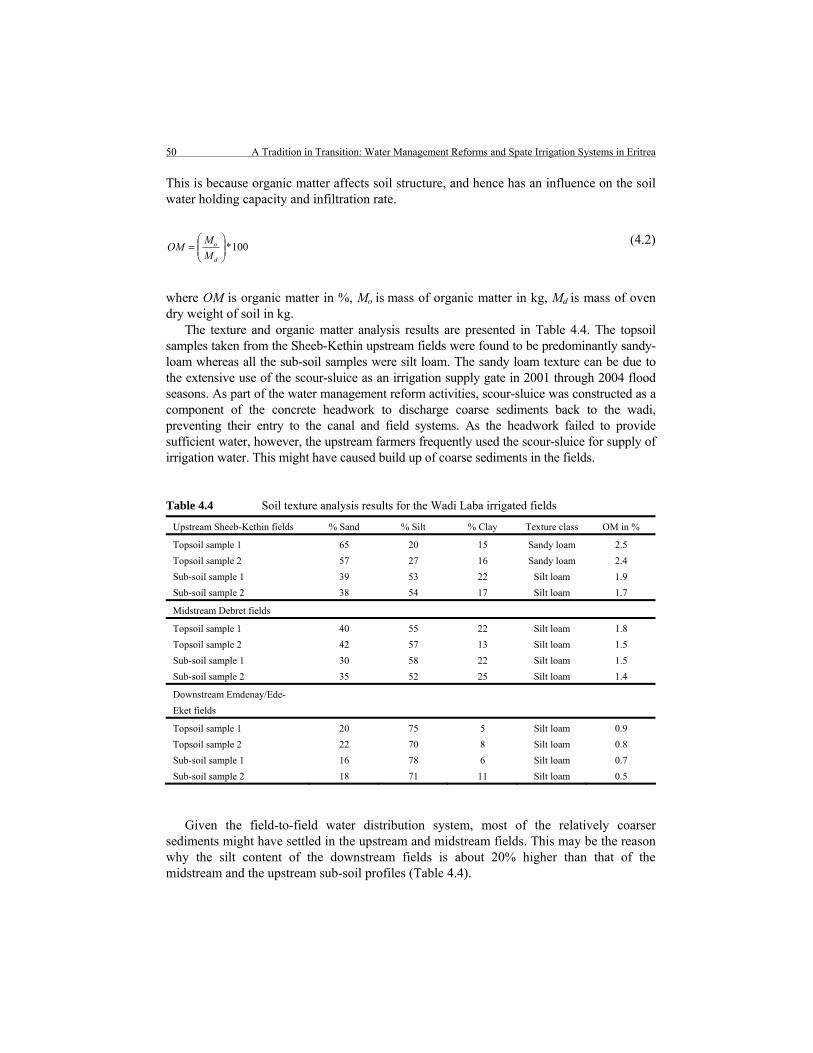
50 A Tradition in Transition: Water Management Reforms and Spate Irrigation Systems in Eritrea
This is because organic matter affects soil structure, and hence has an influence on the soil water holding capacity and infiltration rate.
100*⎟⎟⎠
⎞⎜⎜⎝
⎛=
d
o
MMOM (4.2)
where OM is organic matter in %, Mo is mass of organic matter in kg, Md is mass of oven dry weight of soil in kg.
The texture and organic matter analysis results are presented in Table 4.4. The topsoil samples taken from the Sheeb-Kethin upstream fields were found to be predominantly sandy-loam whereas all the sub-soil samples were silt loam. The sandy loam texture can be due to the extensive use of the scour-sluice as an irrigation supply gate in 2001 through 2004 flood seasons. As part of the water management reform activities, scour-sluice was constructed as a component of the concrete headwork to discharge coarse sediments back to the wadi, preventing their entry to the canal and field systems. As the headwork failed to provide sufficient water, however, the upstream farmers frequently used the scour-sluice for supply of irrigation water. This might have caused build up of coarse sediments in the fields.
Table 4.4 Soil texture analysis results for the Wadi Laba irrigated fields
Given the field-to-field water distribution system, most of the relatively coarser sediments might have settled in the upstream and midstream fields. This may be the reason why the silt content of the downstream fields is about 20% higher than that of the midstream and the upstream sub-soil profiles (Table 4.4).
Upstream Sheeb-Kethin fields % Sand % Silt % Clay Texture class OM in %
Topsoil sample 1 65 20 15 Sandy loam 2.5
Topsoil sample 2 57 27 16 Sandy loam 2.4
Sub-soil sample 1 39 53 22 Silt loam 1.9
Sub-soil sample 2 38 54 17 Silt loam 1.7
Midstream Debret fields
Topsoil sample 1 40 55 22 Silt loam 1.8
Topsoil sample 2 42 57 13 Silt loam 1.5
Sub-soil sample 1 30 58 22 Silt loam 1.5
Sub-soil sample 2 35 52 25 Silt loam 1.4
Downstream Emdenay/Ede-
Eket fields
Topsoil sample 1 20 75 5 Silt loam 0.9
Topsoil sample 2 22 70 8 Silt loam 0.8
Sub-soil sample 1 16 78 6 Silt loam 0.7
Sub-soil sample 2 18 71 11 Silt loam 0.5

The Study Site: The Wadi Laba Spate Irrigation System 51
The topsoil samples of the upstream, midstream and downstream fields have on average 2.45%, 1.65% and 0.85% of organic matter respectively. The corresponding subsoil samples have slightly lower contents at 1.8%, 1.45% and 0.6%. The lowest and highest percentages of organic matter in soils are 1 and 5 (Randall and Sharon, 2005). Hence, the upstream fields had slightly below average; and the midstream and downstream fields, low and very low percentages of organic matter respectively. Due to the field-to-field water distribution system, the upstream fields might have received more flood water in the past years, which might have given them the edge in organic matter build up
4.7.2 Total Available Water
The total available water (TAW) for plant use in the root zone is commonly defined as the range of soil moisture held at a negative apparent pressure of 100 cm (a soil moisture level called ‘field capacity,’ FC) and of 16,000 cm (called the ‘permanent wilting point’, PWP) (De Laat, 2002).
The standard field procedure for determining the FC level is to saturate the soil and allow it to drain for 24 to 48 hours. As the soil dries further, it is thought that there would only be slow and negligible gravitational drainage. In line with this procedure, after the twelve selected fields (Table 4.4) received three irrigation turns of 50 cm water depth each (according to the farmers, this is the optimum requirement), the water was first allowed to completely recede. Then, 48 hours later, all the loosely held gravitational water was assumed to have drained below the root zone and the fields were considered to be at FC. As reported in FAO (1990) and Thomas, et al., (2004), this field method is not accurate. Hence, to make a more exact determination of the FC status of the soil, saturated soil samples (the earlier discussed sampling process was followed) were collected from the twelve selected fields and a pressure plate was used to apply a suction of -100 cm. When water stopped leaving the soil at this pressure, it was considered that the FC stage was reached. All the soil samples assumed to have been at FC through the field determination method were found to be above the FC status attained by the pressure plate. The moisture content at FC was then obtained using the gravimetric method, which although it involves a more tedious and time consuming sampling process, is as accurate as the Time Domain Reflectrometry (TDR) and Neutron probe methods (Thomas, et al., 2004). In applying the gravimetric method, 100 grams of the composite sample of each of the upstream, midstream and downstream fields (Table 4.4) was oven dried at 105 oC for 24 hours and was weighed. The moisture content by weight, fraction (W) was obtained by Equation 4.3. Using a measured bulk density, this was converted to volumetric content by Equation 4.4 and was expressed as depth with Equation 4.5.
( )g
gg
DDW
W−
= (4.3)
where W is moisture content by weight (fraction), Wg is mass of the wet sample in kg, Dg is mass of the dry sample in kg.

52 A Tradition in Transition: Water Management Reforms and Spate Irrigation Systems in Eritrea
ww
b
ρρθ = (4.4)
where θ is volumetric moisture content in m3 m-3, Pb is bulk density in kg m-3, Pw is water density in kg m-3.
ERDWd *θ= (4.5)
where Wd is water content expressed as depth for the entire root zone, ERD is effective root depth (soil depth) in m.
There is no standard field method for determining soil moisture content at PWP. Due to lack of a pressure plate that can apply a suction of 16,000 cm, the soil moisture content at PWP could not also be measured in the laboratory. Thus, the widely used generalized volumetric water content (θ) value for silt loam soils (0.09 cm3 cm-3) given by Rijtema (1969) was used. This θ value, when expressed in depth (Equation 4.5), is equivalent to 9 cm m-1.
For the determination of the bulk density values used in Equation 4.4, separate undisturbed soil samples (at consecutive 25 cm depth till 2 m) were collected using the standard and commonly used core sampler. This is a metal cylinder auger sampler with a container of 50 cm3 capacity. The soil samples were then oven dried, weighed and divided by the volume to obtain the bulk density in kg m-3. Bulk density varies considerably with depth and over an irrigated field. Thus, it was measured with three replicates in each field and the average value was used.
Using the soil particle density (2,650 kg m-3) and the measured bulk density, the porosity of the soil samples was determined by Equation 4.6.
1001n ⎟⎟⎠
⎞⎜⎜⎝
⎛−=
p
b
ρρ (4.6)
where n is porosity in %. The TAW, bulk density, porosity and the water content at saturation obtained in line
with the methods and procedures discussed in the above are presented in Table 4.5. Saturation level corresponds to a 100% occupation of the total porosity with water.
The 35 cm m-1 overall average measured TAW (Table 4.5) is only slightly lower than the 37 cm m-1 generalized TAW of silt loam texture given in Annex 1 (De Laat, 2002). Though some measurement errors could have been made, the results seem to confirm that the absence of stones, the good soil structure/minimum compaction (no heavy machinery is so far used and the livestock is fed using the ‘cut and carry system’) have more than neutralized the negative impact the low organic matter content might have had on the TAW. The results also indicate that the sandy loam texture of the topsoil has not affected the overall water holding capacity of the whole profile.

The Study Site: The Wadi Laba Spate Irrigation System 53
A bulk density of 1,600 kg m-3 affects root growth, of 1,800 kg m-3 severely restricts it. All the assessed Wadi Laba fields have bulk densities lower than these values.
Table 4.5 Measured values of bulk density, total porosity and available soil water for selected Wadi Laba irrigated fields
Average water holding capacity in cm m-1 of soil depth
Selected fields and their texture* Bulk density
in kg m-3
Total
porosity in %
At saturation**
At FC (1)
At PWP (2)
TAW (1-2)
Upstream fields (top/sub soil: sandy loam/silt loam)
1,400 47 47 43 9 34
Midstream fields (silt loam) 1,300 51 51 44 9 35
Downstream fields (silt loam) 1,200 54 54 46 9 37
Overall average values 1300 51 51 44 9 35
* These are the same fields as in Table 4.4;
**Is equivalent to a situation where 100% of the total porosity is occupied with water.
4.8 Infiltration
Infiltration (soil intake) is the rate at which water enters into the soil from the surface. It is of great importance to surface irrigation design and management. It is the infiltration capacity of the soil that largely determines the irrigation application to a given field without (with minimum) runoff and/or percolation loss. In the Wadi Laba spate irrigation system, given the fact that about 50 cm of water is applied each irrigation turn and that the interval between irrigations can not be regulated - the flood waters are unpredictable in occurrence - having soils with good infiltration rates are vital to avoid excessive evaporation losses and to increase the chance that a second irrigation turn could be applied whenever it happens.
Infiltration may involve water movement in three dimensions, such as flow from a drip irrigation emitter; or two dimensions that occur in furrow irrigation. Here, infiltration is discussed as a one-dimensional vertical movement of water, which is the case in sprinkler, basin and border, and flood (spate) irrigation systems.
At the beginning of the infiltration process, when the soil profile is dry, water infiltrates rapidly. As more water is added and the soil pores become increasingly filled with water, the rate of infiltration decreases (Smedema, et al., 2004). After a few hours (this depends primarily on the soil type), the infiltration rate reaches a ‘relatively constant’ rate called the final or basic infiltration rate (Smedema, et al., 2004). A quantitative definition of 'relatively constant' is considered to be a change per hour of less than 10% of the intake.
The total amount of water infiltrated at the end of a given period is called cumulative or accumulated infiltration and is expressed by Equation 4.8 (Smedema, et al., 2004).
ntaF *= (4.8)

54 A Tradition in Transition: Water Management Reforms and Spate Irrigation Systems in Eritrea
where F is cumulative infiltration in mm or m; a is coefficient, depending upon the intake rate, a = F for t = 1; t is infiltration time in seconds or hours; n is exponent, which usually varies between 0.5 and 1.
The n-value for coarse texture (sandy) soils (high F-value) is usually 0.8 or more; it is in the range of 0.5 to 0.7 for medium textured soils (very fine sandy loam, loam and silt loam). An n-value smaller than 0.5 is indicative of heavy clay soils that form deep cracks.
The infiltration rate (f), also known as the instantaneous intake rate (IR), is defined as the rate of infiltration per unit time and is expressed in mm hr-1 or m d-1. It can be mathematically described by differentiating F with respect to time, t, which results in Equation 4.9 (Smedema, et al., 2004).
1−= nantf (4.9)
The basic infiltration rate is the main factor when deciding which irrigation method to use. Soils with a low (1 to 10 mm h-1) or medium (10 to 20 mm h-1) basic infiltration rate are suitable for surface irrigation. Those with a high rate (> 20 mm h-1) may only be suitable for sprinkler or drip irrigation. On such soils, water is absorbed too quickly and it becomes difficult to apply water uniformly and efficiently using surface irrigation.
Among the various soil properties, texture affects the soil infiltration rate the most. To this end, probably, the most comprehensive compilation done is that by FAO (1990), a summary of which is presented in Table 4.6. The basic infiltration rate increases with the increase in the size of the soil particles. It is very rapid in sandy soils; moderately rapid to rapid in sandy loam; moderately slow to moderately rapid in loam and silt loam.
Table 4.6 Guideline basic infiltration rates for various soil types (Thomas, et al., 2004)
Soil type Basic infiltration rate in
mm hr-1 Infiltration class
Sand > 30 Very rapid
Sandy loam 20 to 30 Moderately rapid to rapid
Loam to silt loam 10 to 20 Moderately slow to moderately rapid
Clay loam 5 to 10 Slow to moderately slow
Clay 1 to 5 Very slow to slow
It has to be noted, however, that fields with the same type of soil texture can show some discrepancies in infiltration rates. Among the factors that contribute to such variations are: the soil organic matter content; the degree of compaction due to tillage practices; the level of salinity and sodicity; surface crusting and cracking. Therefore, to obtain more accurate values, infiltration measurements were done in selected Wadi Laba fields. The methodologies followed and the results obtained are discussed below.
There are four commonly employed methods and instruments for the measurement of infiltration, namely double/single ring infiltrometers; ponding; blocked recirculating infiltrometer; and a deduction of infiltration from evaluation of the advance phase and the

The Study Site: The Wadi Laba Spate Irrigation System 55
tail-water (Smedema, et al., 2004). The ring infiltrometer and the ponding methods are usually applied in basins, while the other two are suitable for furrow irrigation. The ponding method introduces a considerable error due to the edge effects, which is less of a problem in the double ring infiltrometer.
In a homogenous one-layer soil, water flows relatively uniformly in the vertical direction, with very little lateral drainage. So, measurements done with a single ring infiltrometer could be as accurate as that obtained from a double ring infiltrometer. The soils in the Wadi Laba fields have developed as a result of annual deposition of different layers of sediments. In such multiple layered soils, significant lateral water flow is inevitable and hence, a double ring infiltrometer is preferable. As shown in Figure 4.14, water in the outer ring moistens a large surrounding area, creating a buffer to effectively minimize any flow of water from the inner ring in a horizontal direction.
Figure 4.14 Buffering the lateral flow below an infiltrometer (Smedema, et al., 2004)
To achieve the maximum possible accuracy, a double ring infiltrometer was used to measure infiltration in the Wadi Laba upstream, midstream and downstream fields. These are the same fields whose water holding capacity was analysed. To minimize errors, the measurements were done in three replicates for six hours each, which is long enough to give a good picture of the whole infiltration process and attain the basic infiltration rate (Thomas, et al., 2004). The final week of May 2004 was selected for the measurement period. By that time, all the tillage and other land preparation practices were completed and the fields were ready to receive the first floods that usually arrive by mid June. The idea was to have a better simulation of the actual flood water infiltration.
The widely used double ring infiltrometers have 28, 30 or 32 cm standard diameters for their inner ring; and corresponding outer ring diameters of 53, 55 or 57 cm. Infiltration rate is not systematically influenced by the size of the infiltrometer. Nevertheless, investigations have shown that a 30 cm diameter ring results in more constant values than those obtained with a smaller ring (Smedema, et al., 2004). For this reason, the 30 cm inner ring infiltrometer has been used - a larger size was not available.
Inner ring, 30 cm diameter
Impermeable layer
Buffer zone Buffer zone
Outer ring, 55 cm diameter
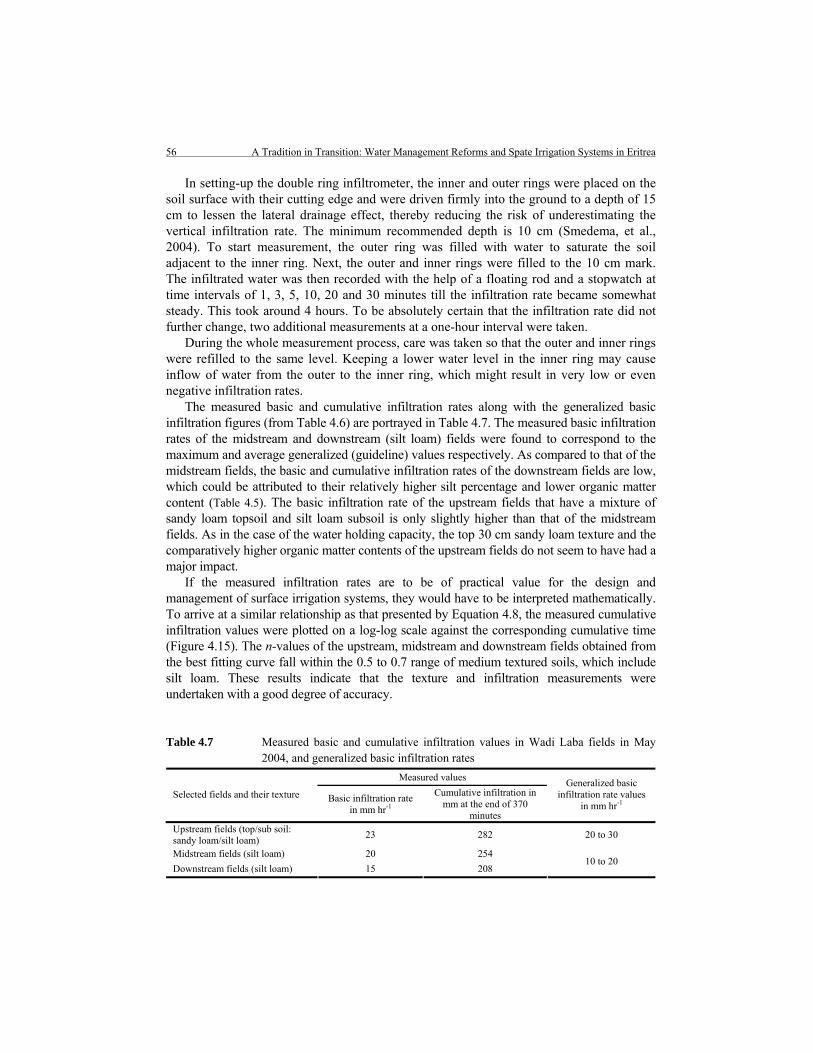
56 A Tradition in Transition: Water Management Reforms and Spate Irrigation Systems in Eritrea
In setting-up the double ring infiltrometer, the inner and outer rings were placed on the soil surface with their cutting edge and were driven firmly into the ground to a depth of 15 cm to lessen the lateral drainage effect, thereby reducing the risk of underestimating the vertical infiltration rate. The minimum recommended depth is 10 cm (Smedema, et al., 2004). To start measurement, the outer ring was filled with water to saturate the soil adjacent to the inner ring. Next, the outer and inner rings were filled to the 10 cm mark. The infiltrated water was then recorded with the help of a floating rod and a stopwatch at time intervals of 1, 3, 5, 10, 20 and 30 minutes till the infiltration rate became somewhat steady. This took around 4 hours. To be absolutely certain that the infiltration rate did not further change, two additional measurements at a one-hour interval were taken.
During the whole measurement process, care was taken so that the outer and inner rings were refilled to the same level. Keeping a lower water level in the inner ring may cause inflow of water from the outer to the inner ring, which might result in very low or even negative infiltration rates.
The measured basic and cumulative infiltration rates along with the generalized basic infiltration figures (from Table 4.6) are portrayed in Table 4.7. The measured basic infiltration rates of the midstream and downstream (silt loam) fields were found to correspond to the maximum and average generalized (guideline) values respectively. As compared to that of the midstream fields, the basic and cumulative infiltration rates of the downstream fields are low, which could be attributed to their relatively higher silt percentage and lower organic matter content (Table 4.5). The basic infiltration rate of the upstream fields that have a mixture of sandy loam topsoil and silt loam subsoil is only slightly higher than that of the midstream fields. As in the case of the water holding capacity, the top 30 cm sandy loam texture and the comparatively higher organic matter contents of the upstream fields do not seem to have had a major impact.
If the measured infiltration rates are to be of practical value for the design and management of surface irrigation systems, they would have to be interpreted mathematically. To arrive at a similar relationship as that presented by Equation 4.8, the measured cumulative infiltration values were plotted on a log-log scale against the corresponding cumulative time (Figure 4.15). The n-values of the upstream, midstream and downstream fields obtained from the best fitting curve fall within the 0.5 to 0.7 range of medium textured soils, which include silt loam. These results indicate that the texture and infiltration measurements were undertaken with a good degree of accuracy.
Table 4.7 Measured basic and cumulative infiltration values in Wadi Laba fields in May 2004, and generalized basic infiltration rates
Measured values
Selected fields and their texture Basic infiltration rate in mm hr-1
Cumulative infiltration in mm at the end of 370
minutes
Generalized basic infiltration rate values
in mm hr-1
Upstream fields (top/sub soil: sandy loam/silt loam)
23 282 20 to 30
Midstream fields (silt loam) 20 254
Downstream fields (silt loam) 15 208 10 to 20
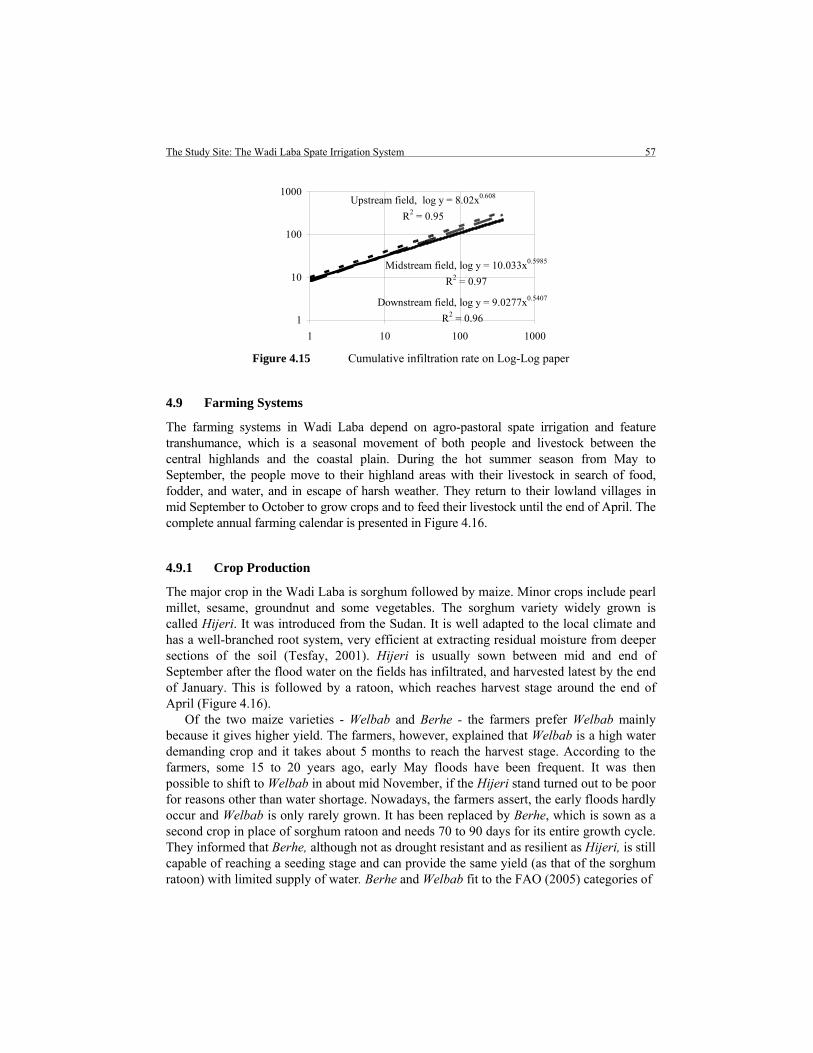
The Study Site: The Wadi Laba Spate Irrigation System 57
Midstream field, log y = 10.033x0.5985
R2 = 0.97
Upstream field, log y = 8.02x0.608
R2 = 0.95
Downstream field, log y = 9.0277x0.5407
R2 = 0.961
10
100
1000
1 10 100 1000
Figure 4.15 Cumulative infiltration rate on Log-Log paper
4.9 Farming Systems
The farming systems in Wadi Laba depend on agro-pastoral spate irrigation and feature transhumance, which is a seasonal movement of both people and livestock between the central highlands and the coastal plain. During the hot summer season from May to September, the people move to their highland areas with their livestock in search of food, fodder, and water, and in escape of harsh weather. They return to their lowland villages in mid September to October to grow crops and to feed their livestock until the end of April. The complete annual farming calendar is presented in Figure 4.16.
4.9.1 Crop Production
The major crop in the Wadi Laba is sorghum followed by maize. Minor crops include pearl millet, sesame, groundnut and some vegetables. The sorghum variety widely grown is called Hijeri. It was introduced from the Sudan. It is well adapted to the local climate and has a well-branched root system, very efficient at extracting residual moisture from deeper sections of the soil (Tesfay, 2001). Hijeri is usually sown between mid and end of September after the flood water on the fields has infiltrated, and harvested latest by the end of January. This is followed by a ratoon, which reaches harvest stage around the end of April (Figure 4.16).
Of the two maize varieties - Welbab and Berhe - the farmers prefer Welbab mainly because it gives higher yield. The farmers, however, explained that Welbab is a high water demanding crop and it takes about 5 months to reach the harvest stage. According to the farmers, some 15 to 20 years ago, early May floods have been frequent. It was then possible to shift to Welbab in about mid November, if the Hijeri stand turned out to be poor for reasons other than water shortage. Nowadays, the farmers assert, the early floods hardly occur and Welbab is only rarely grown. It has been replaced by Berhe, which is sown as a second crop in place of sorghum ratoon and needs 70 to 90 days for its entire growth cycle. They informed that Berhe, although not as drought resistant and as resilient as Hijeri, is still capable of reaching a seeding stage and can provide the same yield (as that of the sorghum ratoon) with limited supply of water. Berhe and Welbab fit to the FAO (2005) categories of

58
A T
radi
tion
in T
rans
ition
: Wat
er M
anag
emen
t Ref
orm
s an
d Sp
ate
Irri
gatio
n Sy
stem
s in
Eri
trea
Figu
re 4
.16
Ann
ual f
arm
ing
cale
ndar
in th
e W
adi L
aba
spat
e ir
riga
tion
syst
em
**W
elba
b va
riet
y w
ith lo
ng g
row
th p
erio
d of
up
to 5
mon
ths t
hat u
sed
to b
e gr
own
in th
e pa
st w
hen
the
farm
ers g
et a
n ea
rly
indi
catio
n th
at th
e so
rghu
m st
and
was
poo
r;
*Ber
he m
aize
var
iety
with
shor
t gro
wth
per
iod
of 2
.5 to
3 m
onth
s, w
hich
is c
urre
ntly
gro
wn
as a
seco
nd c
rop
follo
win
g so
rghu
m.
1 SWC
P re
fers
to S
oil a
nd W
ater
Con
serv
atio
n Pr
actic
es
Act
ivity
A
pril
May
Ju
ne
July
A
ugus
t Se
ptem
ber
Oct
ober
N
ovem
ber
Dec
embe
r Ja
nuar
y Fe
brua
ry
Mar
ch
Plou
ghin
g
1 SWC
P
- B
undi
ng
-Agi
m/
Mus
gha
-Flo
odin
g
Cro
ps
-Sow
ing
-P
est c
ontr
ol
- H
arve
stin
g
Liv
esto
ck
- C
alvi
ng
- D
isea
ses
Lab
our
- A
vaila
bilit
y
- D
eman
d
Mon
ths
Apr
il M
ay
June
Ju
ly
Aug
ust
Sept
embe
r O
ctob
er
Nov
embe
r D
ecem
ber
Janu
ary
Febr
uary
M
arch
1st P
loug
h
2nd P
loug
h
Soil
bund
ing
Rep
airi
ng A
gim
s & M
usgh
as
Floo
ding
of
fiel
ds
Sorg
hum
**
Mai
ze
Sorg
hum
ra
toon
/*m
aize
Sorg
hum
& m
aize
pes
t**
Mai
ze/
rato
on/
mai
ze*
Sorg
hum
Cal
ving
Liv
esto
ck d
isea
ses
Lab
our
avai
labi
lity
Lab
our
dem
and
Lab
our
dem
and
Lab
our
avai
labi
lity
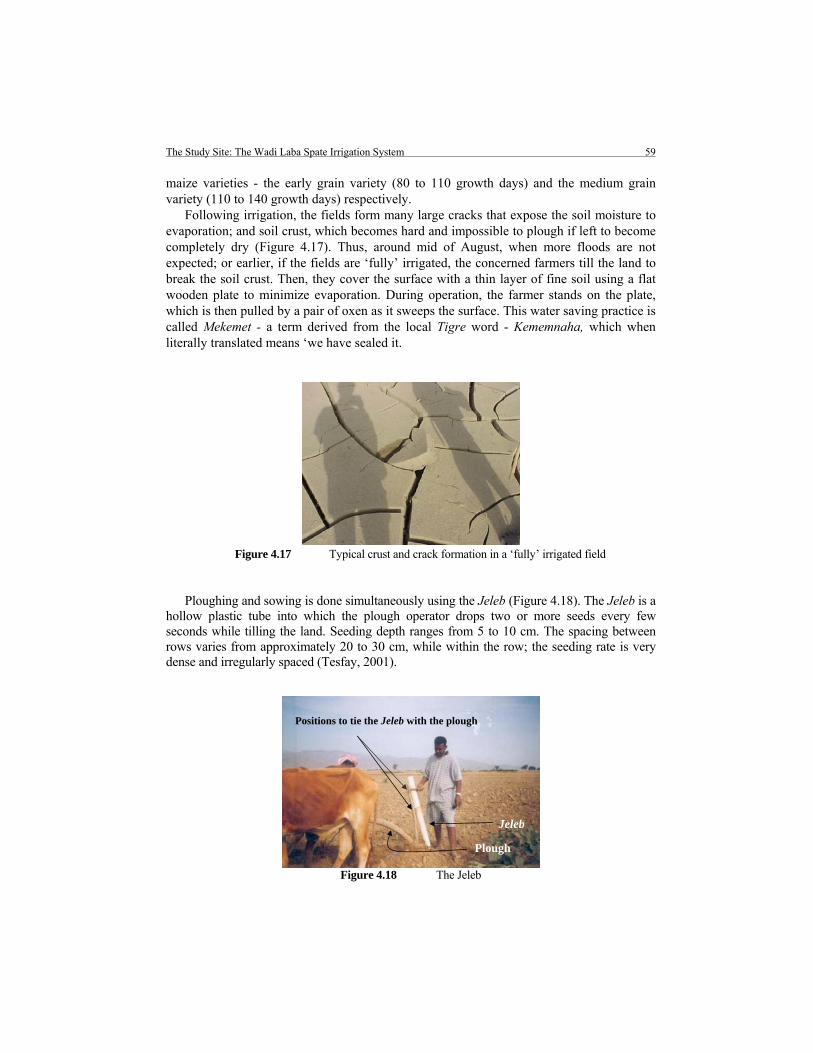
The Study Site: The Wadi Laba Spate Irrigation System 59
maize varieties - the early grain variety (80 to 110 growth days) and the medium grain variety (110 to 140 growth days) respectively.
Following irrigation, the fields form many large cracks that expose the soil moisture to evaporation; and soil crust, which becomes hard and impossible to plough if left to become completely dry (Figure 4.17). Thus, around mid of August, when more floods are not expected; or earlier, if the fields are ‘fully’ irrigated, the concerned farmers till the land to break the soil crust. Then, they cover the surface with a thin layer of fine soil using a flat wooden plate to minimize evaporation. During operation, the farmer stands on the plate, which is then pulled by a pair of oxen as it sweeps the surface. This water saving practice is called Mekemet - a term derived from the local Tigre word - Kememnaha, which when literally translated means ‘we have sealed it.
Figure 4.17 Typical crust and crack formation in a ‘fully’ irrigated field
Ploughing and sowing is done simultaneously using the Jeleb (Figure 4.18). The Jeleb is a hollow plastic tube into which the plough operator drops two or more seeds every few seconds while tilling the land. Seeding depth ranges from 5 to 10 cm. The spacing between rows varies from approximately 20 to 30 cm, while within the row; the seeding rate is very dense and irregularly spaced (Tesfay, 2001).
Figure 4.18 The Jeleb
Positions to tie the Jeleb with the plough
Jeleb
Plough

60 A Tradition in Transition: Water Management Reforms and Spate Irrigation Systems in Eritrea
According to the farmers, a field is assumed to be ‘fully’ irrigated if it receives at least three irrigation turns of 50 cm depth each; and only ‘partially’ irrigated if at most it gets two turns with 50 cm depth each. The farmers assert that if ‘fully’ irrigated, a field can annually produce 2 to 3 ton ha-1 of seeded sorghum crop, and as high as 1 to 1.5 ton ha-1 of sorghum ratoon or Berhe maize variety. If only ‘partially’ irrigated, the yields are roughly reduced to half. A field that gets only one turn, the farmers explained, would usually end up producing forage.
4.9.2 Livestock Production
Livestock production is an integral component of the Wadi Laba spate-irrigated agriculture. The dominant types of livestock in the area - oxen, camels, donkeys, cows, goats and sheep - are very important sources of livelihood for the farmers. Oxen are used for many farming activities such as ploughing and sowing; and for (re)construction and maintenance of structures and field bunds (Figure 4.19). Donkeys and camels are used to transport people, crop produce and crop residue. Cows, sheep and goats serve as a source of milk and meat mainly for home consumption. In most households, the usual breakfast is milk along with Rekif or Kicha (pan-cake locally made from sorghum or maize); the common lunch and dinner dish is porridge made of sorghum or maize along with milk (Mehari, et al., 2005b).
There is a shortage of animal feed, as the surrounding area is semi-desert. During the dry season, crop residues such as maize and sorghum stalks are removed from the fields and fed to the livestock. During the cropping season, the ‘cut and carry’ system is practised to feed the livestock. Any animal found grazing in the fields is put in Zeriba and its owner has to pay a certain amount of money to take it out. The fine is different for different animals. One head of a camel is fined about US$ 2 and one head of an ox is penalized US$ 1.5. The fine of small ruminant animals such as goat, sheep is US$ 1. Zeriba is an area, usually about half the size of a football field, encircled by thick brushwood where animals found trampling and/or grazing on food crops are locked. Literally speaking, it is a livestock prison!
Figure 4.19 Repairing a field bund in Wadi Laba
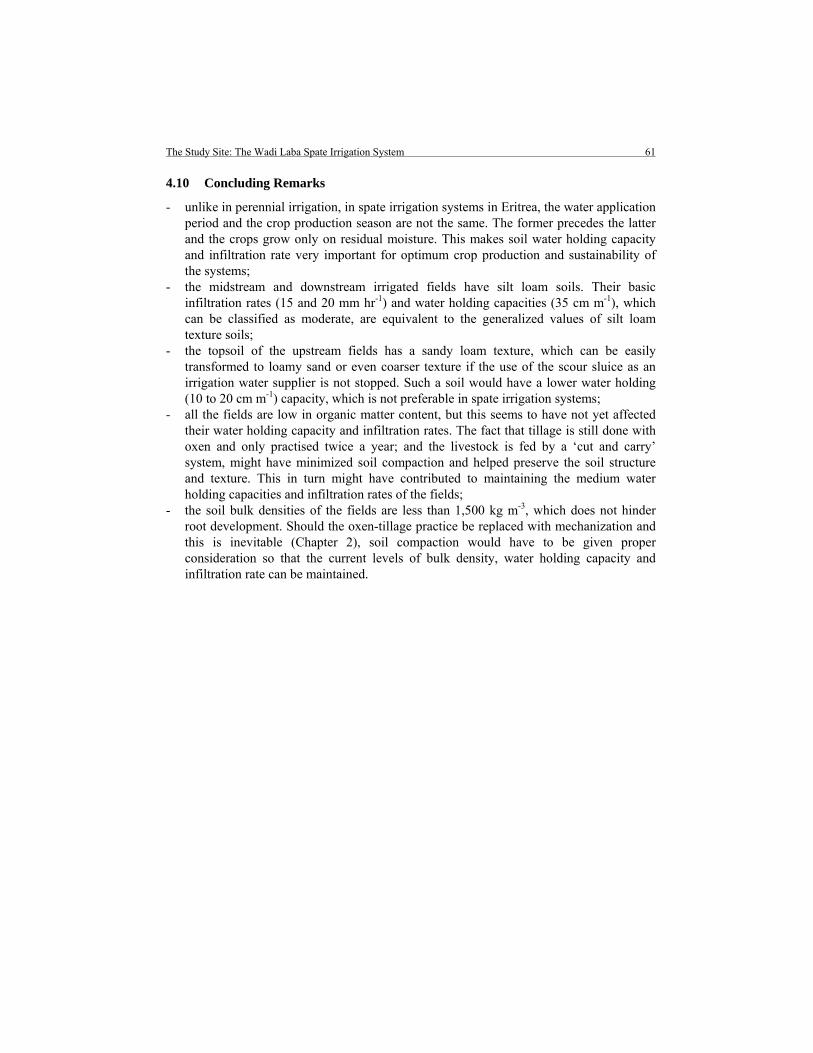
The Study Site: The Wadi Laba Spate Irrigation System 61
4.10 Concluding Remarks
- unlike in perennial irrigation, in spate irrigation systems in Eritrea, the water application period and the crop production season are not the same. The former precedes the latter and the crops grow only on residual moisture. This makes soil water holding capacity and infiltration rate very important for optimum crop production and sustainability of the systems;
- the midstream and downstream irrigated fields have silt loam soils. Their basic infiltration rates (15 and 20 mm hr-1) and water holding capacities (35 cm m-1), which can be classified as moderate, are equivalent to the generalized values of silt loam texture soils;
- the topsoil of the upstream fields has a sandy loam texture, which can be easily transformed to loamy sand or even coarser texture if the use of the scour sluice as an irrigation water supplier is not stopped. Such a soil would have a lower water holding (10 to 20 cm m-1) capacity, which is not preferable in spate irrigation systems;
- all the fields are low in organic matter content, but this seems to have not yet affected their water holding capacity and infiltration rates. The fact that tillage is still done with oxen and only practised twice a year; and the livestock is fed by a ‘cut and carry’ system, might have minimized soil compaction and helped preserve the soil structure and texture. This in turn might have contributed to maintaining the medium water holding capacities and infiltration rates of the fields;
- the soil bulk densities of the fields are less than 1,500 kg m-3, which does not hinder root development. Should the oxen-tillage practice be replaced with mechanization and this is inevitable (Chapter 2), soil compaction would have to be given proper consideration so that the current levels of bulk density, water holding capacity and infiltration rate can be maintained.

62 A Tradition in Transition: Water Management Reforms and Spate Irrigation Systems in Eritrea

Indigenous Water Rights, and Management Before and After Water Management Reforms 63
5 Indigenous Water Rights, Rules and Management Before and After Water Management Reforms
5.1 Introduction
A chief in the Nyadire sub-catchment in Zimbabwe, in pointing out to the fact that it is difficult to manage water without the infrastructure to store it, said: ‘We can not share what is running; how do we plan and manage what is not there?’ (Sithole, 2000, Van der Zaag, 2006). To cope with this same, perhaps even more difficult situation: a flood water (it is the major source of spate irrigation) unpredictable in timing, volume and duration; destructive in nature; and highly sediment laden that makes any storage impractical, the Wadi Laba farmers came-up with a comprehensive set of ‘indigenous’ water rights and rules and enforcement mechanisms. As used here, the term ‘indigenous’ refers to the fact that the water rights and rules have been drafted and are being implemented by the local community with no or limited external influence and that they (the water rights and rules) reflect the local socio-economic and cultural setting.
Hodgeson (2004) defines a water right as a right to abstract or divert and use a specified amount of water from a natural source; impound or store a specified quantity of water in a natural source behind a dam or other hydraulic structure or to use water in a natural source. Boelens (2003), however, argues that water right is more than just a simple relationship of access and usage between ‘subject’ (the user) and ‘object’ (the water). He elaborates that a water right has also a social dimension and involves an expression of power among humans that govern the nature of the relationship of “inclusion” and “exclusion” and defines the control over decision-making. He emphasizes that it is crucial to consider the two-sided relationship between water rights and power: power relations determine key properties of the distribution, the contents and the legitimacy of water rights and, in turn, water rights reproduce or restructure power relations. In the case of the homogenously poor Wadi Laba community, nonetheless, the drafting and formulation of the indigenous water rights has been primarily driven by the principles of “inclusion” of every household to access and use the very unpredictable floodwater. It has also been mainly about collective decisions in modifying the water allocation to adapt to various externalities.
This chapter discusses three main aspects with regard to the inter-linkage between flood water management and the indigenous water rights and rules, and their enforcement mechanisms. First, the water rights will be put into perspective. Spate irrigation water rights, which are different from perennial irrigation water rights, are not fixed quantities or entitlements. Instead they are operating rules that respond to a variety of circumstances, which are at the core of spate irrigation. This point is emphasized to move away from the naive and simplistic understanding of water rights, where water rights are seen as mechanisms to create distinctive ownership. In this naive understanding - that can be traced back to the work of Douglas North on early land rights (North and Thomas, 1977) and the subsequent
64 A Tradition in Transition: Water Management Reforms and Spate Irrigation Systems in Eritrea
work in the field of New Institutional Economics - property rights are seen as the main institution to claim entitlements. At policy level, water rights reform is often simplified as the intervention that will either help protect weaker interests on the strength of the property claim or alternatively help achieve better economic efficiency by facilitating trade and exchange of rights (Mehari, et al., 2005a). The point being made here is that water rights in spate irrigation (as in other fields of water management) are inseparable from the way water management is organized and that the rights are part of a bundle of responsibilities to the common group. Water rights are not something that precedes water management or can be used in isolation to change water management and water distribution.
The second aspect concerns the fact that water rights and rules differ between societies and their successes in water management largely depend on their ability to reflect the socio-economic and cultural set-up of the societies in question. It is important to understand that there are higher forces at work to determine what rules and rights are to be implemented and that water rights are not only the product of the resource system itself. The last aspect deals with if and how the water rights have changed following the introduction of the formal water management reform bundle: the replacement of the indigenous Agims and Musghas with more permanent concrete headworks; and the 1994 Land Proclamation, which is set to replace the indigenous land tenure system. Rights relate very much to operational rules and these rules change with changing infrastructure - with different possibilities for upstream control and different common maintenance requirements.
The outline of this Chapter is as follows: First, it discusses the different operational rules and practices - giving examples from different societies in Eritrea, Yemen and Pakistan. Then, it discusses the way local organizations and institutions have enforced (with various degrees of effectiveness) these water rights and rules, and have even tried to codify them. Next, it discusses if and how some of the water rights and rules have changed over the past decades and centuries under the influence of particular external investment programmes in Eritrea, Yemen and Pakistan. To start with, however, a description of the nature and categories of the Wadi Laba floods is provided.
5.2 The Wadi Laba Floods
The Wadi Laba farmers categorize the spate floods into six types: very small, small, medium, moderately-large, large and very large based on the surface area the floods cover in the Wadi and on some natural height measuring elements such as huge trees and historical large stones. The very large floods are known as Reka (Mehari, et al., 2005c), a Tigre (local) term which means generosity of water from God that irrigates all the fields together. Discharge estimations were done of several very small, small, medium, moderately-large and large category floods and they have been found to roughly correspond to smaller than 10 and the range of 10 to 25, 25 to 50, 50 to 100 and 100 to 200 m3 s-1. The design discharge of the Wadi Laba modern headwork is 265 m3 s-1. Thus, in this Chapter and throughout this thesis, the very large floods will be represented by discharges of 200 to 265 m3 s-1.
The discharge estimations were done using the velocity area method (Boiten, 2000).

Indigenous Water Rights, and Management Before and After Water Management Reforms 65
AvQ *= (5.1)
where Q is discharge in m3 s-1, v is average velocity in m3 s-1, A is wetted cross sectional area in m2.
In order to determine the velocity and the wetted area (area covered with flood water), a 70 m uniform section of the Wadi Laba was selected. The velocity was determined by using a float, which was calibrated by using a current meter during small floods. At medium and large floods, the flood has a high sediment content that hampers the revolution of the current meter. The floats were made of wood for buoyancy, but in order to give them weight so that they are not easily affected by wind, a small thin piece of metal was inserted at the centre with the tip slightly appearing at the top. The tip was dyed with white colour so as to be easily spotted while floating. During the measurements, the float was released at the upstream spot and the time it took to reach the downstream spot, which was located at 70 m, was recorded using a stopwatch. The distance was then divided by the time to obtain the average velocity in m s-1. Since the velocity was only measured at the surface of the water and this is higher than at lower depths, a correction factor of 0.7 was used. The wetted areas were obtained by measuring the water depths at width intervals of 2 m. A rope was stretched from one pole at one side to another pole at the other side. The rope was lowered during each depth decrease of the flood water so that it was constantly maintained at the water level during measurements, which were taken at the end of half an hour to start with, then every hour for 4 hours, followed by 2 hours interval for the rest 6 hours (a detailed data is provided in Annex 1). In obtaining the area from these measurements, the average of two consecutive depth measurements was multiplied by the 2 m width interval.
All the measured spates displayed some common flow characteristics, namely a rapid increase of the discharge in the first half hour and a peak with a short duration of about 10 minutes (Mehari, et al., 2005b). The peak was followed by a sharp decline in discharge for nearly half to one hour and a gradual decline and recession that extends from several hours to 3 to 4 days (Figure 5.1). Consequently, the floods provide a source of water for only a short period, and depending on the volume of the peak discharge, they can destroy the indigenous brushwood and earthen diversion structures. This, coupled with the unpredictability in timing and volume, makes flood water management a challenging task. It is worthy of note here that unlike the spate irrigation systems in Yemen, Pakistan and many other countries where conjunctive use of flood water and groundwater is practised (Chapter 3), in the entire spate irrigation systems in Eritrea (Wadi Laba included), the floods are sole major sources of irrigation water. Groundwater is only abstracted from a few scattered wells along the banks of the Wadi Laba for drinking water. Some of these wells produce saline water (> 3 dS m-1) and others do not (< 1 dS m-1) (Halcrow, 1997). Groundwater resources have not yet been studied - there is no reliable estimate of their potential (quality and quantity).
Based on the number of floods, the farmers classify the flood seasons into excellent, good, average and dry, which correspond to the occurrence of above 25, 20 to 25, 10 to 20, and below 10 spates per season, respectively. A 13-year record (Mehari, et al., 2005c) indicates that the medium and smaller floods accounted for 77% of the total number of floods (Table 5.1). From Table 5.1, it follows that in about 25% of the time, the year has been dry and in nearly 75%, the years have been average or even better; very large floods occur about once

66 A Tradition in Transition: Water Management Reforms and Spate Irrigation Systems in Eritrea
every two years; large floods occur once a year and moderately-large floods occur at least twice a year.
020406080
100120140160
0 60 120 180 240 300 360 420 480 540 600 660
Flood duration in minutes
Floo
d di
scha
rge
in m
3 s-1
Small floodMedium floodModerately-large floodLarge flood
Figure 5.1 Hydrographs of small, medium, moderately-large and large Wadi Laba floods (Mehari, et al., 2005b)
Table 5.1 The Wadi Laba flood season categories between 1992 and 2004 (Mehari, et al., 2005c)
Number of different flood categories that occurred
Year Flood season
category
Very Small
(< 10 m3 s-1)
Small (10-25 m3 s-1)
Medium (25-50 m3 s-1)
Moderate-large
(50-100 m3 s-1)
Large (100-200
m3 s-1)
Very large
(200-265 m3 s-1)
Total
1992 Excellent 6 5 13 4 3 1 32 1993 Good 7 3 10 2 1 - 23 1994 Average 3 2 6 1 - - 12 1995 Dry 2 1 3 2 - 1 9 1996 Dry 3 - 5 - 1 - 9 1997 Average 4 4 5 1 1 - 15 1998 Average 3 2 7 2 1 1 16 1999 Good 4 5 9 2 4 - 24 2000 Average 3 1 6 3 1 - 14 2001 Average 2 3 5 4 - 1 15 2002 Dry 1 1 3 3 1 - 9 2003 Good 4 4 10 3 1 1 23 2004 Excellent 4 5 12 4 2 1 28
Total 46 36 94 31 16 6 229
5.3 Water Rights and Rules in Managing Unpredictable Flood Water
To manage the unpredictable nature of flood water and reduce the risk of conflicts, several categories of water rights and rules are in place in the Wadi Laba spate irrigation system, and

Indigenous Water Rights, and Management Before and After Water Management Reforms 67
in some spate irrigation systems in Yemen and Pakistan. The most common and widely applied rights and rules relate to the following:
- demarcation of land that is entitled to irrigation; - breaching of bunds; - proportion of the flood water going to different canals and fields; - sequence in which the different canals and fields are irrigated; - depth of irrigation that each field is entitled to receive; - access to second (and third) water turns.
These categories of water rights and rules are discussed below with some relevant illustrative examples mainly from the Wadi Laba, but also from some spate irrigation systems in Yemen and Pakistan.
5.3.1 Rights and Rules on Land Demarcation
Demarcation rights and rules are common in the lowland spate irrigated areas in Eritrea, Yemen and Pakistan where water is scarce and land is abundant; yet, they are almost nonexistent in the central highlands of the countries where water is relatively more plentiful than land. Demarcation rights and rules define the boundary of the area entitled to irrigation and set priorities to access to water depending on the year of establishment of the different fields. Instead of merely regulating seasonal water supplies, the demarcation rules also predict what will happen when changes in the entire system occur. Spate systems are dynamic. Among others, changes in the course of rivers, breaching, silting up or scouring of canals, and rising of fields above irrigable command levels are frequent and can occur on a yearly basis. Demarcation rules are conservative, because, in the wake of these changes they try to re-establish the prior situation. They often protect the prior rights of downstream landowners by restricting or even prohibiting new land development upstream, which could have resulted in the diversion of flood water to new territories and a redefinition of the group of shareholders. To cite an example, in the Wadi Laba about 1,400 ha (besides the annually irrigated 2,600 ha) were distributed in 1993 in the upstream Sheeb-Kethin area. The concerned farmers were, however, clearly informed that they would have to abide by the demarcation rule: new fields can only be allocated water after all the previously established fields have received the quantity of water granted to them by the other various rules. Due to the strict adherence to this rule, only 50 ha of the 1,400 ha have been established until now (2006) and the water rights of downstream farmers have been preserved. In Eritrea, fields are considered to be fully established when they accumulate a minimum depth of about 10 cm of alluvial sediments. With a mean annual sediment deposition of about 3 cm, this would require at least three flood seasons.
5.3.2 Rights and Rules on Deliberate Breaching of Bunds
Rights and rules concerning the breaching of the bunds of diversion and distribution structures and fields are widely applied in areas where the entire river bed is blocked by

68 A Tradition in Transition: Water Management Reforms and Spate Irrigation Systems in Eritrea
earthen bunds, and access of water to downstream canals and fields depends on the breaking of these immediate upstream structures. In many cases, the earthen and brushwood bunds are constructed in such a way that they breach during large flood (> 100 m3 s-1) events. This prevents damage to many upstream structures and fields while increasing the probability of irrigation of the downstream fields.
In several spate irrigation systems in Eritrea, Yemen and Pakistan there are rules on when farmers can break bunds, for instance, once the area served by an upstream bund is fully irrigated or when a certain period of the flood season has ended. Boxes 1 and 2 present examples of some such rules from Eritrea and Pakistan.
Box 1. Rights and rules on breaking bunds in the Wadi Laba, established in 1900
In July, the peak flood month, when the large floods do not break the upstream Agims and Musghas (diversion and distribution structures), the upstream farmers have the obligation to allow the downstream farmers to break them purposely to allow the flow of water to their fields. July floods are considered to be rich in nutrients and all farmers are entitled to have a share. It is the responsibility of both the downstream and upstream farmers to timely maintain the structures to increase the probability of diverting the next flood(s).
In August, where floods are assumed to be low in nutrients, the upstream farmers are not obliged to allow the breakage of their bunds by the downstream users.
If an upstream field receives an irrigation depth of a knee height, about 50 cm (see rule on depth of irrigation), the landowner of the immediate downstream field has the right to break the relevant bund and irrigate his field. If the downstream field holder is not on site during the irrigation period, the upstream farmer is not obliged to break his bund.
Box 2. Rights and rules on Nari system, Kacchi, Pakistan, prepared in 1917 on revision of old rules (Van Steenbergen, 1997)
From 10 May to 15 August, the landowners of the upper Nari are allowed to make gandas (earthen bunds) in the Nari river.
When the land served by one ganda in the Upper Nari is fully irrigated, the landowners in that ganda must allow landowners of the next ganda to break it.
After 15 August, the landowners of the Lower Nari are allowed to make a ganda in the Nari river. Landowners in the upper Nari are not allowed to irrigate their land during this period or let the water to be wasted. Water is not allowed to flow to the low-lying areas of east and west of the Nari river. Guide bunds will prevent water flowing to these areas. All landowners will contribute towards these bunds with farmers in the Lower Nari paying twice the amount per hectare in case bunds on the upper Nari are broken.

Indigenous Water Rights, and Management Before and After Water Management Reforms 69
5.3.3 Rights and Rules on Flood Water Division
The rights and rules on flood water division guide the distribution of water among different canals. In the indigenous systems in Eritrea, both proportional and rotational distribution of flood water are practised among the main and branch canals. During medium and larger (50 to 265 m3/s) floods, proportional distribution is used. This has a dual purpose. Firstly, it irrigates two or more different areas at a same time. Secondly, by dividing the flow, it minimizes collateral damages such as destruction of structures and erosion of field bunds. During very small and small floods (≤ 25 m3/s), rotational distribution is the choice. The flow of these floods, if divided, may not have the strength to reach even the most upstream fields.
In many indigenous spate irrigation systems, flow division is made flexible in order to adjust to changing bed levels of the wadi and canals, and to variations of the flow. One example of a flexible flow division was the Wadi Laba indigenous distribution structure (Figure 4.8). The structure, which was locally called Jelwet, is constructed from earthen (soil and stone) materials; and its downstream section was reinforced with brushwood that could be easily moved in and outwards to change its orientation as needed. The structure divided the flow from the wadi to two main canals - Sheeb-Kethin and Sheeb-Abay (Figure 4.4). The management of the structure was the sole responsibility of the farmer leaders of the five main irrigation zones in Wadi Laba - Sheeb-Khetin, Errem, Ede-Abay, Debret and Emdenay/Ede-Eket. Prior to each anticipated flood event, all the five leaders gathered on the site. Taking into account the size of the different areas irrigated in the previous floods, they made a collective decision on how to adjust the structure so that the flows to each area would be fair.
5.3.4 Rights and Rules on Sequence
The rights and rules on sequence supplement the rights and rules on the division of flood water. They clearly spell out which main and branch canals have priority right to water, and which fields are entitled to receive water first. The sequence usually adjusts to the size of the floods. In the indigenous Wadi Laba spate irrigation system, the underlining rule is: upstream canals and fields have absolute priority right to the small and medium floods, and occasionally to the moderately-large floods; midstream fields to the moderately-large and sometimes to the large floods; downstream fields to the large and very large floods. This rule created a perception of fairness of water distribution among the farmers and strengthened the degree of cooperation among them. Most of the indigenous structures are constructed from earthen and brushwood materials. They are susceptible to frequent destruction by flood water. The downstream and upstream farmers depend on one another for timely maintenance of the structures.
In the indigenous spate irrigation systems in the Tihama Plain, Yemen, the fundamental sequence rule, locally called al aela fil aela, (This Arabic phrase when literally translated means ‘the top is always at the top’; in this case, at the top list to get water) grants an absolute priority right to the upstream farmers regardless of the size of the flow. The downstream farmers are not, however, denied the right to surplus water after the upstream farmers have withdrawn a sufficient quantity of water in accordance with their right. This rule might seem very unfair to the downstream farmers and might give the impression that the upstream

70 A Tradition in Transition: Water Management Reforms and Spate Irrigation Systems in Eritrea
farmers have been utilizing almost all the flood water. That was not usually the case. The indigenous structures have been frequently breached by large floods providing ample water to the downstream farmers, which in some years was more than the quantity of water received by the upstream.
5.3.5 Rules on Depth of Irrigation
The rules on depth of irrigation water are not common in spate irrigated areas in Pakistan, but are standard practices in Eritrea and Yemen where the field-to-field water distribution system is practised. In this distribution system, a farmer takes his turn, as soon as his neighbour completes the inundation of his land. He does so by breaking a relevant section of the bund surrounding the field of the upstream landowner. In this practice, fierce competitions usually arise among neighbours, which in many cases lead to conflicts. Probably, the rules on water depth were introduced mainly to mitigate such conflicts. In contrast, when each field (usually of very large size) is fed by its own separate intake, as is the case in many spate irrigation systems in Pakistan, such conflicts are rare, which might be the reason why the rules on the depth of inundation are unusual.
The rules on depth of irrigation can be viewed as complementary to the rights and rules on sequence because they quantify the amount of water a certain field could receive during its turn. In Wadi Laba and the Tihama Plain, the rule on irrigation depth states that each field is entitled to a depth of a knee-height (about 50 cm) at each turn. When the rule was first introduced 100 years ago, the farmers attempted to ensure its implementation by limiting the height of the field bunds to around 50 cm. With time, however, this became impractical. The sediments deposited in the fields are the only sources for maintaining the field bunds. Nevertheless, the degree of damage done to the bunds is not the only factor that determines the amount of sediments to be removed from the fields. Even when there is no maintenance work to be done, certain quantities of sediments need to be removed from some fields in order to keep the field level within that of the irrigable command area of the concerned structures and canals. The excavated sediments are re-deposited in the only convenient disposal places - the field bunds. This has resulted in irregularities in the height of many field bunds. In the Wadi Laba and the Tihama, the height of field bunds ranges from 0.50 m to 1 m.
The Wadi Laba farmers explained that the rule on breaking bunds, when first introduced a little over a 100 years ago only referred to the breaking of the bunds of the diversion and division structures. It was only 10 years later that it was modified to include the breaking of field bunds when the farmers realized that it was impractical to standardize and limit the maximum height of field bunds to 0.50 m.
5.3.6 Rules on Second and Third Turns
Several crops, such as sorghum, wheat and cotton, can survive on one turn of water application; but they give significantly higher returns when irrigated more than once (Mehari, et al., 2005a). In the Wadi Laba, the farmers believe that a field irrigated trice can produce 4.5 ton/ha.y of sorghum or sorghum and maize, which is twice the yield from a field that receives

Indigenous Water Rights, and Management Before and After Water Management Reforms 71
only two turns. Hence, to ensure that the majority of the fields receive at least two turns, thus guaranteeing most of the households to earn the minimum possible yield of food crops, a rule was introduced in the 1920s that defined the access to second turns. The rule states that regardless of its location, the type of crop grown in it, and the social and economic status of its owner, a field is allowed a second turn only after all the other fields that are entitled to irrigation (in line with the rule on demarcation) have received one turn. This rule has, however, some practical shortcomings. The degree to which it is possible to honour it depends on the size of the flood. If the floods are small with no strength to reach the dry fields (especially under the prevailing field-to-field system), the only option would be to apply them to the area, which is already irrigated.
In Wadi Tuban, Yemen and Rod Kanwah, Pakistan, the rules on second turns are different from those in Wadi Laba. They limit the access to second turns only to the most important subsistence crops, wheat in Pakistan and red sorghum in Yemen (Van Steenbergen, 2004).
5.4 Enforcement of Water Rights and Rules
The type of enforcement strategies and the degree to which the water rights and rules can be enforced vary mainly depending on the social structure of the communities and the level of the overall governance in the area. In many spate irrigation systems in Eritrea, Yemen and Pakistan, the enforcement of water rights and rules can be related to the following three factors (Mehari, et al., 2005a):
- local organizations and institutions; - relationship between water rights and rules, and maintenance; - codification.
5.4.1 Local Organizations and Institutions
For 600 years until the 1970s, the enforcement of the water rights and rules in many spate systems in Yemen had been the responsibility of the local ‘Sheikhs al-wadis’ who were appointed by, and who worked under the direct and strict instructions of, the local Sultans. ‘Sheikh (plural: Sheiks) in Arabic usually refers to ‘religious leader’ In this case, however, ‘Sheikh’ means ‘chief’ who may or may not have any religious ranks. Hence, ‘Sheikhs al-wadis’ refers to ‘chiefs of the wadis.’ ‘Sultan’ (plural: Sultans) is also an Arabic word and as used here, roughly means ‘supreme leader.’
Many communities comprising several tribes in the Tihama Plain, Yemen have depended on spate irrigation for their livelihood. The Sheikhs and Sultans who had the leading role in the enforcement of the water rights and rules always belonged to the tribe that had the largest number of members, the most powerful in terms of material and capital wealth, and believed to be the most native in the area. Sheikhs and Sultans were very respected and feared leaders. Their leadership was passed to the eldest son on a hierarchical basis. In the Muslim spate irrigation communities in Yemen, a female had no right to be a Sultan or a Sheikh.
In Yemen, there were no other people or institutions that could challenge the ruling of the Sultans and Sheikhs regarding the implementation of the local water rights and rules. They

72 A Tradition in Transition: Water Management Reforms and Spate Irrigation Systems in Eritrea
had the final word, which all members of all the tribes within the concerned communities had to abide by, either willingly or unwillingly. Many of the interviewed elderly farmers in Wadi Tuban, Zabid, Mawr and Siham explained that the Sheikhs and Sultans were authoritarian, but gave them credit for their effectiveness in safeguarding the water rights of the downstream farmers. To exemplify, in Wadi Tuban, the Sheikh-al-wadi had the full power to impose sanctions on upstream farmers who took water in violation of the rules and/or without his permission. The sanctions, which were frequently applied upon approval by the Sultan, included the following:
- the concerned farmers were not allowed to grow any crop on their fields, and the immediate downstream farmers had the right to grow crops on the irrigated fields of their upstream neighbours;
- if crops were already cultivated, the yields had to be given to the immediate downstream farmers.
The interviewed farmers informed that mainly due to the high degree of heterogeneity in the level of power of the tribes, conflicts in the Tihama Plain were very intense and serious. The Sultans and Sheikhs were not able to prevent the occurrence of such conflicts but they were often successful in settling them.
Following huge investments in the 1980s in structurally modernizing the indigenous spate irrigation systems in Yemen in general and in the Tihama Plain in particular, and the introduction of formal government rules and the collectivization of agriculture in South Yemen, the task of managing the secondary and tertiary levels of the spate irrigation systems was transferred from the Sultans and Sheikhs to government employees and staff in agricultural cooperatives and that of the main system to the Tihama Development Authority (TDA). Over the years, the cooperatives faced reduced funding inflows and erosion of authority, and these led to their inability to handle the water management task adequately. As indicated by the interviewed elderly farmers and reported by Al-Eryani and Al-Amrani (1998), after the reunification of Southern and Northern Yemen, the central government further diminished the role of the cooperatives without putting in place an alternative institution that could better handle the spate irrigation management, effectively creating a governance vacuum. As a result, conflicts between upstream and downstream users intensified. The TDA as well suffered from severe under funding, lack of vigour, and corruption, and did not cope with the job. 20 years on, much of the concrete infrastructure is in bad shape (many gates are broken and non-operational, several scour sluices are fully blocked, capacity of a number of main canals is substantially reduced by sedimentation) and the distribution of water from the main to the secondary canals is controlled by a few powerful (economically, politically or financially) individual land lords (Al-Eryani and Al-Amrani, 1998).
The social structure of the Wadi Laba communities differed significantly from that of the Tihama communities in Yemen. The Wadi Laba communities did not comprise a dominant tribe and had no Sultans or Sheikhs with absolute authority to enforce water rights and rules. Almost all members of the Wadi Laba communities were largely homogenous in terms of landownership, and material and capital wealth. Each of their landholding ranged from 0.5 to

Indigenous Water Rights, and Management Before and After Water Management Reforms 73
2 ha, with the majority of the households owning about 1 ha. Nearly all were poor, living from hand to mouth.
For 100 years, till 2001, the authority of enforcing the water rights and rules in the Wadi Laba was shared among the farmers’ organization and the government institutions - the Local Administration and the Local Ministry of Agriculture (Figure 5.2).
Ministry of Agriculture, *NRS Zone
Local Administration, *NRS Zone
Local Administration, Sheeb sub-Zone
Ministry of Agriculture, Sheeb sub-Zone
Irrigation committee
Board of village elders
Sheeb-Kethin group Ede-Abay groupErrem group Debret group Emdenay & Ede-Eket group
32 Sub-groups 21 Sub-groups 10 Sub-groups 8 Sub-groups 6 Sub-groups
770 households, 665 ha
1,000 households,
754 ha
490 households, 500 ha
455 households, 430 ha
280 households, 263 ha
*NRS refers to the Northern Red Sea; an average household has 7 members
Figure 5.2 The Wadi Laba farmers’ organization and its links to government institutions (Mehari, et al., 2005b)
The farmers’ organization (Figure 5.2) came into being around the 1900s and its key players were the Teshkil (Plural: Teshakil), Ternafi (Plural: Ternefti) and Abay-Ad. Teshkil is a local term that means a ‘sub-group leader.’ The Teshkil commanded a group of 30 to 50 households who usually irrigated through one branch canal. The Teshkil was responsible for implementing all the water rights and rules that apply to the farmers within his command. It was only on his request or on a request of a group of farmers unsatisfied with his judgement in, for example, resolving some conflicts that the respective Ternafi could interfere. Ternafi is also a local term that refers to a ‘group leader.’ The Ternafi had the authority to enforce rules and rights that govern the sharing of water among two or more groups of farmers led by a
74 A Tradition in Transition: Water Management Reforms and Spate Irrigation Systems in Eritrea
Teshkil. When conflicts arose between upstream and downstream farmers due to, for instance, the improper location and/or adjustment of a certain structure, and the Ternafi failed to satisfactorily solve them, he could first request the irrigation committee (comprises of all the five Ternefti), then the Abay-Ad (board of village elders) and finally the Local Administration as the last chance for mediation. The Abay-Ad was a group of old men widely respected for their skill and impartiality in solving conflicts. Two or more Teshakils could also make the same request if the Ternafi did not do so. In solving conflicts, the Local Administration visited the site with experts from the Local Ministry of Agriculture and gave a verdict, which was final and binding.
The concerned farmers elected the Teshakil and Ternefti. There was no time limit on the number of terms and years they could serve. If most farmers concluded that they were not performing well, however, they could remove them from their power by a simple majority vote. As was the case in Yemen, in the Muslim communities in the Wadi Laba, females were not allowed to have any leadership position or to participate in any decision making in issues that affected the water management in the Wadi Laba spate irrigation system. The cultural and social beliefs that led to such a restriction in women’s participation are still in place.
Unlike the Sultans and Sheikhs, the Ternefti and Teshakil had no power to impose harsh sanctions against those who violated the rules. Nevertheless, the Wadi Laba farmers’ organization was able to successfully enforce the water rights and rules, protect the rights of the downstream farmers and minimize conflicts. Among the factors that led to this achievement have been the existence of the homogenous society that strongly believed in equity of water distribution; the fact that the Ternefti and Teshakil were democratically elected and were largely viewed as ‘accountable’ by their customers - the farmers; and the unambiguous sharing of responsibilities between the leaders of the farmers’ organization and those in the government institutions.
Here, ‘accountable,’ means that the farmer leaders effectively understand and represent the specific interests of the farmers. The degree of ‘accountability’ of any farmers’ organization leaders greatly depends on the following:
- the nature of the relationship of the farmers’ organizations with the respective government institutions involved in the management of the system;
- the nature of the farmers’ organizations themselves.
The nature of the relationships between farmers’ organizations and the government institutions ranges from ‘autonomy’ to ‘dependence’ in both the ‘financial’ and ‘organizational’ dimension (Hunt, 1990). The more autonomous the farmers’ organizations the less their leaders are influenced by higher officials in the government offices and the more accountable they are to their customers - the local farmers. The Wadi Laba farmers’ organization could be considered fully autonomous in the ‘organizational dimension’ - the ‘organizational control of water’ - as it was entirely responsible for making all decisions on how water should be shared and it was only on their request that government institutions interfered. They could also be assumed as largely autonomous in the ‘financial dimension’ because most of the maintenance work of the indigenous structures had been largely accomplished by mobilizing the human labour and draft animals of the local communities.

Indigenous Water Rights, and Management Before and After Water Management Reforms 75
The government institutions provided only some materials such as shovels and spades - even that on a request from the organization.
The “nature of farmers’ organizations” refers to how inclusive the organizations are of the various wealth groups and the male and the female gender members of the community, and how representative their leaders are. There was no big gap between the rich and the poor in the Wadi Laba communities and hence the wealth category did not apply. As stated earlier, the female members of the society, although allowed to be members of the organization, did not have decision-making voices and they were not allowed to elect or be elected. This exclusion of the females did not, however, affect the accountability of the organizations and their leaders as far as their activities in enforcement of water rights and rules were concerned. The household heads, usually the men, were fully represented in the organization, and it was they who actually owned the land and who made all the decisions on behalf of all the household members. Even in the case of the nearly 10% female-headed households in Wadi Laba (widowed or divorced women) it was the close male relatives of the women who served as representatives of the households in making all the necessary decisions.
5.4.2 Relationship between Water Rights and Rules, and Maintenance
The links between the water rights and rules, and the organization and execution of maintenance tasks can be categorized into three aspects. To start with the first aspect, in many spate irrigation systems, the right to flood water is tantamount to one’s contribution to maintenance of main and branch canals and structures. If one fails to contribute, one can simply not be allowed to irrigate his field. This was a common practice in the indigenous systems in the Tihama, Yemen, but nonexistent in the Wadi Laba indigenous spate irrigation system. As mentioned, most of the Wadi Laba communities engaged in spate irrigation were homogenously poor and their livelihood largely depended on their spate-irrigated fields. There was a strong belief in the society that prohibiting a certain field access to water, because its owner - the household head - failed to report for maintenance duty, is not the right decision. Such an action was viewed as depriving the whole family of their very basic food for a mistake done by one of its members - the household head. Hence, in the Wadi Laba, contributing labour was not a prerequisite for preserving one’s water right. The second aspect of the link relates to the water rights and rules, and ‘the critical mass’ - the minimum amount of labour and materials needed for maintenance. In the indigenous Wadi Laba and the Tihama spate irrigation systems, the maintenance task was largely dependent on human labour and draught animals. In such a situation, a large task force was required, which could only be made available through strong cooperation between upstream and downstream farmers. The fact that tail-end farmers were interested in sharing the burden of maintenance only if they were not systematically deprived of their water right, made ‘the critical mass factor’ vital for serving as a check on too large an inequity in water sharing. To come to the third aspect of the link, water-sharing rights and rules, in particular the rules on demarcation help to identify the group of farmers entitled to flood water and who have an interest in jointly undertaking the necessary maintenance job. Without the demarcation rules, it is very difficult to form a group of partners, making the organization and cost sharing of the recurrent maintenance work problematic.

76 A Tradition in Transition: Water Management Reforms and Spate Irrigation Systems in Eritrea
5.4.3 Codification of Rules
In the Wadi Laba spate irrigation system, whether in the relevant government institutions or the farmers’ organizations, there are no complete records of water rights and rules. In most cases, however, the rules and rights are presented in plain unambiguous language, which has helped to easily and correctly disseminate them among large (about 3,000 household) communities via word of mouth. In Wadi Zabid, the Tihama Plain in Yemen, the renowned Islamic Scholar, Sheikh Bin Ibrahim Al-Gabarty, is believed to have first recorded the rules and rights for distributing flood water about 600 years ago (Mehari, et al., 2005a). Rights and rules on flood water distribution in the Suleman range in Pakistan were codified by the revenue administration during the period of the British rule in 1872 (Van Steenbergen, 1997). The documents, which are still available in a register, the Kulyat Rodwar, contain a list of all villages responsible for contributing labour for maintenance of the various bunds. The document also identifies a special functionary who was responsible for enforcing the rules. The Kulyat Rodwar and the rights and responsibilities contained therein have not been updated, but the creation of these functionaries serves to keep the system flexible, as it allows the build-up of an institutional memory of ‘jurisprudence.’
There is a large added value in codifying water rights and rules into written documents such as laws and regulations. It could serve at least as a basis for clarifying disagreements in interpretations and introducing a neutral factor in any dispute. The continued use made of the Kulyat Rodwar registry in Pakistan is a proof of the importance and relevance of codifying. Yet, codifying water rights and rules may not as such be sufficient to ensure that they are observed or to mitigate conflicts. The ubiquitous disputes in Wadi Zabid, where powerful parties stand accused of violating the water rights and rules in spite of the presence of the more than six-centuries-old records and the hardly existent vehement conflicts in Wadi Laba, although none of the rules and rights is codified, illustrate the point.
5.5 Modifying and Changing Water Rights and Rules, and their Implications
If water rights and rules in spate irrigation systems are to continue to perform, they must necessarily adjust to new situations created by various factors - new land development, new land and water policies, changes in cropping pattern, structural modernization (infrastructural investment), and shift in power relations and change in levels of enforcement.
The following paragraphs discuss, with the help of examples from Eritrea, Yemen and Pakistan, the consequences of tailoring/not tailoring some of the water rights and rules and the managing organizations in response to some of the mentioned factors.
To start with the case from Eritrea, in the Wadi Laba, due to an increase in the number of inhabitants, the land under spate irrigation expanded from about 1,400 ha to nearly 2,600 ha between 1900 and 1990. As a result, the farmers explained that for 20 years (1960 to 1980) they consistently witnessed that even during the best flood seasons, their existing rules failed to guarantee that all the fields received at least a single turn. To deal with this new reality, by around the mid 1980s, the farmers added a phrase to the ‘water right on sequence’ - ‘in a new flood season, dry fields first.’ Its full interpretation is that regardless of the location of the fields, in a new flood season, the fields that did not get a single irrigation turn in the previous

Indigenous Water Rights, and Management Before and After Water Management Reforms 77
flood season are irrigated once before any of the other fields get a turn. An overwhelming majority of the interviewed farmers seemed content with the impact this modification had in preserving the perception of the fairness of water distribution that existed prior to the land expansion.
To provide another example from Wadi Laba, the structural modernization that was completed in 2001 replaced the flexible main indigenous structure, the Jelwet (Figure 4.8) with rigid permanent headworks (Figure 4.10) and many other secondary earthen distribution structures with gabions. The modern structures necessitate a different type of maintenance. They do not depend on labour and the collection of brushwood, but instead require earthmoving machinery, such as loaders, bulldozers and trucks, which in turn call for different organizations, managerially, financially and technically. The main factor in the past that was a key to the enforcement of the water rights and rules during the indigenous systems was ‘the critical mass’ - the need for a large number of farmers who would work on collective maintenance. These different maintenance requirements are changing the way that water distribution is organized. In the 2004 flood season, for example, 15 instances were witnessed when the upstream farmers utilized large floods and irrigated their fields two to three times before downstream fields got a single turn. These caused a lot of conflicts. The most downstream 260 ha did not receive a single turn in 2002, 2003 and 2004. The water right on sequence was not applied, partly also because the new infrastructure attenuated the floods and effectively reduced the big floods, which were the ones that served the tail areas previously.
Over 30 years of management of spate systems by large government irrigation institutions in Yemen have proven that such institutions have difficulty in handling the task all by themselves. Some of the factors include: poorly defined sharing of responsibilities and the long communication lines, which lead to a slow decision-making process; lack of adequate funding; and little ‘accountability’ towards the bulk of users. More than anything, the chronic under-funding of maintenance and the loss of vigour in the operation and maintenance departments were the undoing. It left a vacuum where it was not clear who was responsible for water distribution, with no one doing the hard work of timely maintenance.
If the relatively fair distribution of the flood water that existed prior to water management reforms is to be preserved and the economic homogeneity of the Wadi Laba communities largely conserved, the farmers’ organization, which has run the system for over 100 years and has a good knowledge of flood water management practices must continue to take the lead role. To perform this task, the farmers’ organization needs to have financial and organizational autonomy and hence its accountability. Great strides have been made with the establishment of the Wadi Laba organization with almost full membership of all farmers and the universal endorsement of its by-laws. The leadership of this organization is very much based on the time-tested system of Ternefti and Tesahkil. The main challenges in the coming period are the internal organization, the collection of adequate funding (also in an occasional disaster year), the running of earthmoving equipment and the operational fine-tuning of the modernized system. To meet these challenges it may be imperative that the following aspects are considered:
1. establishing a water fee system: the farmers would have to decide on the monthly or annual fee to be contributed, but this fee needs at least to cover the routine operation and maintenance costs. The fees would have to go directly to the organization coffers. To
78 A Tradition in Transition: Water Management Reforms and Spate Irrigation Systems in Eritrea
collect and manage the fees, the organization needs to enlist a treasurer and a secretary at each sub-group, group, and irrigation committee level;
2. providing a legal status to the organization: it is true that the organization is officially recognized at the sub-provincial level - official in a sense that the sub-provincial Local Government and the Ministry of Agriculture acknowledge the organization as an important partner in the management of the spate irrigation system. Nevertheless, the organization cannot yet be considered as having a full legal status. Its establishment and existence are not yet supported by any official decree or law. It also does not have the legal authority to, for instance, own or hire assets such as machinery, which is vital for timely repair, operation and maintenance; operate independent bank accounts, and this is important for financial accountability; make direct contacts with internal and external funding agencies, which is required in emergency situations if and when a major part of the concrete structure is damaged and its repair can not be covered from the water fee collected;
3. having in place clear policy with regard to the ownership of the modern infrastructure: Eritrea is yet to draft a comprehensive national or provincial water policy. It is essential that any future water policy clearly specifies who owns the (Wadi Laba) modern structures and for that matter any other donor funded infrastructure. To illustrate with an example from Tanzania, the failure of the 1992 National Water Policy and the 1974 and 1997 Acts to clearly define the ownership of the water infrastructure constructed with donor money has largely contributed to the poor management and underperformance of many rural water supply projects (Kabudi, 2005). The latest, the 2002 National Water Policy of Tanzania, does direct that communities should be the owners of the infrastructure in their vicinity. But, it has not adequately addressed the problem as it vests the ownership on higher level - (sub)-catchment organizations. The management of any infrastructure would be better served if the immediate user organization is recognized as having the ultimate authority;
4. avoiding the creation of dual organizational structures (traditional and formal): the move made by the sub-provincial Ministry of Agriculture to put only two of the five group leaders in charge of the whole Wadi Laba irrigation system amounted to almost the creation of a formal structure alongside the existing indigenous organizational set-up. This intervention was counterproductive. The two group leaders were not elected (they were selected by Government officials) and were not fully representative of the ethnic diversity of the Wadi Laba community. Consequently, the orders of the selected group leaders were largely ignored. Other than being catalysts for straining the relationship between the respective Ministry of Agriculture staff and the farmers’ organization, the selected group leaders have had little, if any, positive impact on the floodwater management. It may be advisable that the Ministry of Agriculture and other concerned Government bodies focus their efforts on crafting farmers’ organizations on earlier local organizations and avoid creating dual structures (traditional and formal);
5. providing tailor-made training: The sub-provincial Local Government and Ministry of Agriculture would have to provide trainings that, among other things, strengthen the abilities of the farmers and their leaders to operate and maintain the modern infrastructure; prepare simple financial balance sheets as well as work plans and reports

Indigenous Water Rights, and Management Before and After Water Management Reforms 79
for operation and maintenance and other farming activities. The trainings need also entrench financial accountability at all hierarchies of the organization. It has to be noted that lack of financial accountability was the major cause for the downfall of many cooperatives and farmers’ organizations in Tanzania (Mehari and Van Koppen, 2006).
Another related issue that needs consideration is the impact of the 1994 Land Proclamation on the Wadi Laba spate irrigation management. For the past 100 years, till 2001, the Wadi Laba communities did not rely on national or provincial laws and policies to manage their indigenous spate irrigation system; nor did they bother to clarify what impact those policies and laws could have had on flood water management. Since the structural water management reforms in 2000, however, some farmers and their leaders are frequently asking the question: after the huge financial investments, will the government still allow us to continue to own and utilize ‘our’ land and flood water? The urgency to get an answer to this question emanates from the perceived fear of the farmers that the government may implement the ‘1994 Land Proclamation’ to dispossess them of the land they had considered theirs for decades. In Eritrea in general, and in the Wadi Laba spate irrigated areas in particular, owning or having land usufructuary right is a prerequisite to secure a water right for agricultural production.
For generations, the Wadi Laba farmers have practised the traditional land tenure system, the Risti (literally translated, inherited land from the founding fathers). Under this tenure system, ownership of land in a certain village or villages is vested on the Enda (plural: Endas) - the extended family that has direct lineage to the founding fathers of the village(s). The system highly discriminates women. Besides, as it allows partitioning of the land through inheritance, it may also cause land fragmentation and render the farm plots economically non-feasible. However, the major tenets of the Risti (Box 3) collectively provide a strong sense of land and hence water security to the eligible landholders.
The provision of the Land Proclamation that grants the government absolute power and right of land appropriation (Box 4) is the one frequently singled-out by almost all the
Box 3. The main tenets of the Risti land tenure system in Wadi Laba The Enda holds a lifetime ownership of land within the territories of its native village(s). The land is distributed equally among the male Enda members. Only widowed women are allowed to own half of the parcel of land granted to men.
An individual member of the Enda has the right to utilize his plot for the production of whatever crops he wants. He has also an absolute right to bequeath his land to his sons, lease or mortgage it. He can only sell the land with the consent of the extended family - mainly the father, grandfather and the first cousins.
The village assembly, the Baito, together with the Wadi Laba farmers’ organization are responsible for screening those eligible for the Risti land, distributing the available land equally among the eligible, and carrying out other related land administration tasks. They, however, have neither the right nor the power to confiscate a land allocated to a verified Enda member.
80 A Tradition in Transition: Water Management Reforms and Spate Irrigation Systems in Eritrea
interviewed Wadi Laba farmers who expressed fear and nervousness with regard to their land and water security. The majority of the farmers believe that the government would alter the cropping pattern from the current entire focus on food crops to high-value cash crops to boost national production and recover the nearly US$ 4 million investment made for the modernization of the Wadi Laba system. In an attempt to justify this assertion, the farmers point to the continuous push that they claim is being made by the Local Government and the Local Ministry of Agriculture to introduce a cotton crop, despite their reservations. The farmers foresee that in the near future their status will be turned from landowners (users) into daily labourers under government payroll. They contend that although they trust the government will do all it can to provide reasonable compensation should it confiscate their land; no compensation will have a comparable value, as they attach a lot of pride to the land they currently own. The farmers argue that they should be the ones to decide whether or not to hand over their land once the government reveals its compensation plans.
The farmers’ analyses of the post water management reform situation of their irrigation system, although it seems to have evolved from a genuine perception of land and hence water insecurity, may as well end up being just a logical speculation. The government has clearly stated that the objective of the structural reform of the Wadi Laba system is to improve the
Box 4. Some of the provisions of the 1994 Land Proclamation The Government of the State of Eritrea is the sole owner of all land of the country.
All citizens of Eritrea above the age of 18 are eligible to usufructuary right regardless of sex, race, clan, Enda or beliefs. Any individual may lease his/her usufructuary right over the land in whole or in part, but under no circumstance can he/she sell the land.
To preserve the economic viability of farmlands, partitioning of land through inheritance is prohibited.
A Land Administration Body (LAB) consisting of a representative of the Governments’ Land Commission (GLC), members of the village assembly and farmers’ organization leaders, and different local government bodies is responsible for classifying land and distributing it equally to the eligible by virtue of the proclamation and to those who make a living by farming. The LAB is a subordinate executive body with respect to land distribution and it carries its functions under strict orders and directives from the GLC.
The government or its appropriate government body has the absolute right and the power to expropriate land that people (regardless of their clan, Enda, race, sex, beliefs) have been settling on or have been using for agricultural or other activities, for purposes of various development and capital investment projects aimed at boosting national reconstruction or other similar objectives. This provision further states that compensation will be given whenever a land is confiscated, but it does not elaborate what such compensation will be, who decides on the nature of such compensation and whether or not the individual landholder or the farmers’ organizations that represent him can challenge any compensation arrangements made by the GLC.
Indigenous Water Rights, and Management Before and After Water Management Reforms 81
living standards of the concerned communities; and that it will ultimately entrust the operation and management responsibility of the systems to the farmers’ organization. If this noble objective is to be translated to reality, however, real and active farmers’ participation throughout the ground-laying process and activities (this has yet to start properly) for the management transfer are vital. Nevertheless, such farmers’ participation may not be achieved unless the land and water insecurities perceived by the farmers - justified or not - are addressed. To this end, introducing some complementary (to the Land Proclamation), easily understandable provincial/sub-provisional legislations may be useful. Among others, the legislations may spell out: in the post water management era, what kind of land and water user rights do the spate irrigation communities have? What decision-making power do these user rights bestow on the farmers’ organization as far as the cropping system, modifying/changing water rights and rules, and other important land and water utilization activities are concerned? Do the farmers’ organization and the communities as a whole have any new obligations they need to fulfil if they are to retain these rights? If yes, what are they?
To come to the example from Yemen, in Wadi Zabid, Siham and Mawr spate irrigation systems, the structural modernizations done in the 1980s replaced the indigenous earthen and brushwood structures with concrete headworks. This resulted in almost complete control of the flood water by the upstream users. Although the ‘al aela fil aela’ rule granted an absolute priority right to the upstream farmers, as mentioned earlier, it did not usually cause unfairness of water distribution during the indigenous systems. This was because the indigenous structures were frequently washed away delivering water to the downstream. In contrast, the concrete headworks seldom breach. Hence, applying the ‘al aela fil aela’ rule effectively led to the ‘capture’ of the flood water by the upstream. Due to mainly the vacuum of governance created after the fall of the Sultans and Sheikhs, who were replaced by ‘weak’ Local Governments, the ‘al aela fil aela’ rule was not modified to meet the demands of the new reality. Instead, the upstream farmers strictly applied it. Moreover, encouraged by the abundance of water furnished to them and the absence of any effective countervailing power, the upstream farmers shifted from the cultivation of food crops to the more water-demanding highly profitable banana crop on the basis of conjunctive use of groundwater and spate flow. This further reduced the amount of water that could have reached downstream. The Local Government did not interfere to stop this change in cropping pattern. The ultimate consequence is that many of the downstream fields are now abandoned and their owners are earning their living on a crop-sharing arrangement by serving as daily labourers in the fields of the now rich upstream landlords. In Wadi Zabid, where the crop-sharing arrangement is more common, the tenants do all the labour work (from planting till harvest) for a return of a quarter of the harvest in kind.
The term ‘weak’ here refers to a Local Government which lacks in-depth knowledge of local water rights and laws, and approaches and strategies to enforce them; accountability to the poor segments of the farmers; and the power to correct some unfair land and water utilization decisions taken by some individuals or communities.
As to the example from Pakistan, in Anambar Plain in Balochistan, one of the introduced modern weirs significantly changed the indigenous water distribution system (Van Steenbergen, 1997 and Mehari, et al., 2005a). The weir was constructed to divert spate flows to upstream fields. It performed this function, but it also considerably reduced the base flow
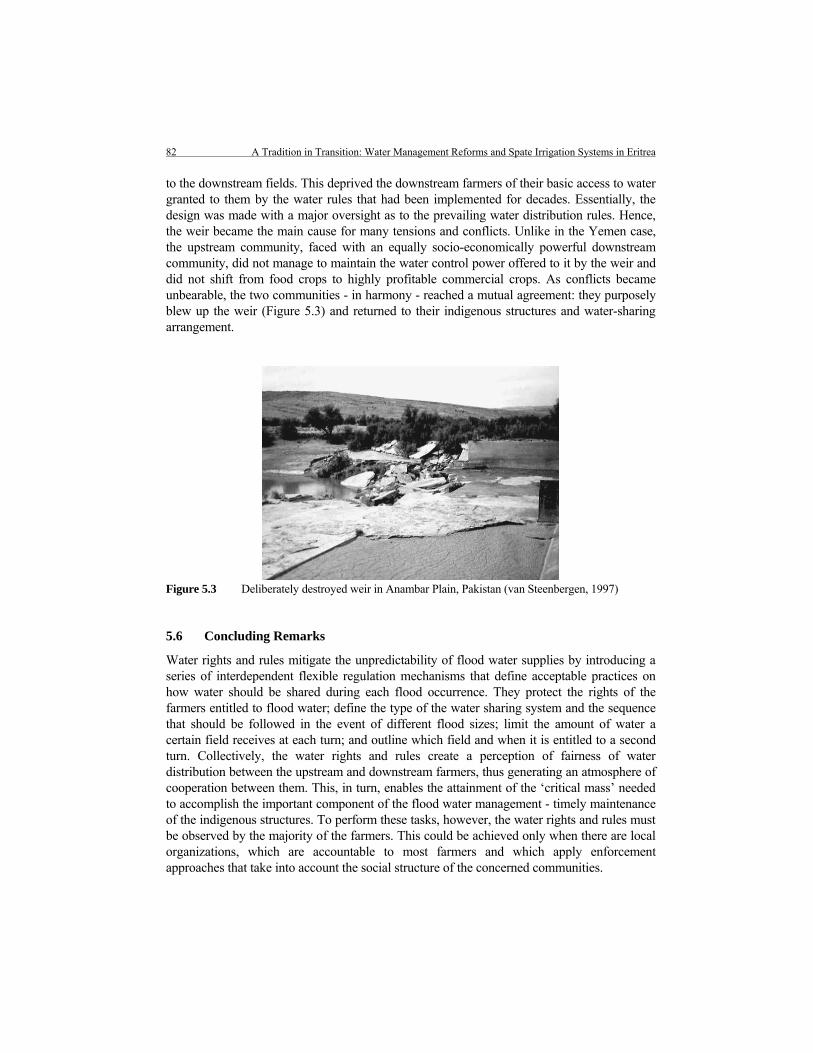
82 A Tradition in Transition: Water Management Reforms and Spate Irrigation Systems in Eritrea
to the downstream fields. This deprived the downstream farmers of their basic access to water granted to them by the water rules that had been implemented for decades. Essentially, the design was made with a major oversight as to the prevailing water distribution rules. Hence, the weir became the main cause for many tensions and conflicts. Unlike in the Yemen case, the upstream community, faced with an equally socio-economically powerful downstream community, did not manage to maintain the water control power offered to it by the weir and did not shift from food crops to highly profitable commercial crops. As conflicts became unbearable, the two communities - in harmony - reached a mutual agreement: they purposely blew up the weir (Figure 5.3) and returned to their indigenous structures and water-sharing arrangement.
Figure 5.3 Deliberately destroyed weir in Anambar Plain, Pakistan (van Steenbergen, 1997)
5.6 Concluding Remarks
Water rights and rules mitigate the unpredictability of flood water supplies by introducing a series of interdependent flexible regulation mechanisms that define acceptable practices on how water should be shared during each flood occurrence. They protect the rights of the farmers entitled to flood water; define the type of the water sharing system and the sequence that should be followed in the event of different flood sizes; limit the amount of water a certain field receives at each turn; and outline which field and when it is entitled to a second turn. Collectively, the water rights and rules create a perception of fairness of water distribution between the upstream and downstream farmers, thus generating an atmosphere of cooperation between them. This, in turn, enables the attainment of the ‘critical mass’ needed to accomplish the important component of the flood water management - timely maintenance of the indigenous structures. To perform these tasks, however, the water rights and rules must be observed by the majority of the farmers. This could be achieved only when there are local organizations, which are accountable to most farmers and which apply enforcement approaches that take into account the social structure of the concerned communities.
Indigenous Water Rights, and Management Before and After Water Management Reforms 83
The water rights and rules would have to be drafted and implemented in a way that meets the flood water management needs in a given situation. They need to be constantly tailored and the enforcement organizations and the strategies they use are timely adjusted to cope with changes in events in time, if the above-stated achievements are to be sustainable. Should this not be done, as was the case in the Wadi Laba and in some spate irrigation systems in Yemen and Pakistan, the water rights and rules can end up being frequently violated and become a source of unfairness of water distributions and conflicts that, in turn, could result in the following: - pave the way for disintegration of the long established local farmers’ organizations; and
cause the creation of a gap between the poor and the rich in what were rather wealth-wise homogenous societies;
- accelerate the downfall of downstream farmers, leaving them unprotected against the excessive capture of the flood water by the upstream farmers;
- deliberate destruction of investments. In indigenous spate irrigation systems, floodwater sharing and maintenance are done
according to local (indigenous) water rights and rules and they are sufficient. Once the systems are subjected to structural water management reforms, however, national/provincial/sub-provincial water policies and legislations become a core component of the floodwater management bundle. These laws and legislations (they are yet to be drafted in Eritrea) are vital to providing farmers’ organizations the legal recognition and legal authorities they need to collect and manage water fees, run independent bank accounts, make direct contacts with funding agencies, own or hire machinery and other necessary assets for water management. These activities would ultimately contribute to making the farmers’ organizations financially and organizationally autonomous. Ensuring financial and organizational autonomy requires more than legislation however - it also necessitates sincere efforts to graft farmers’ organizations on earlier local organizations and avoid creating dual structures (traditional and formal). It further calls for supporting the organizations through training modules that, among other things, entail book keeping, financial accountability as well as a technical package with clear guidelines on how to operate and maintain the different components of the modern infrastructure.
Apart from the presented measures, targeted provincial/sub-provincial legislations are also needed in the case of Wadi Laba to alleviate the land and water insecurities perceived by the farmers as being incurred by the 1994 Land Proclamation. Addressing the said insecurity would lay the ground for an active participation of the farmers and their organization in the development and management of the spate irrigation system. The legislations would have to clarify that following the water management reforms: - what kind of land and water user rights do the spate irrigation communities still have? - what decision-making power do these user rights confer on the farmers’ organization with
regard to modifying/changing the cropping system, the water rights and rules, and other important land and water utilization activities?
- what obligations, if any, do the farmers’ organization and the communities as a whole need to fulfil to retain the said rights?

84 A Tradition in Transition: Water Management Reforms and Spate Irrigation Systems in Eritrea
Modeling Soil Moisture and Assessing its Impacts on Water Sharing and Crop Yield 85
6 Modeling Soil Moisture and Assessing its Impacts on Water Sharing and Crop Yield
6.1 Introduction
Since the 1900s, the Wadi Laba farmers have been striving to secure at least three and at most four irrigation turns of 50 cm each at the earliest possible period of the flood/irrigation season. This endeavour has been mainly driven by the following two factors: - the flood season (June to August) precedes the cropping season (September to April)
and sorghum and maize, being the major crops in the area, complete their entire growth cycle based on the soil moisture stored in the root zone. The floods, which are the only major source of irrigation water, are unpredictable in timing, volume and duration;
- the farmers believe that a field that receives three irrigation turns could produce 2 to 3 ton ha-1 y-1 of seeded sorghum crop, and 1 to 1.5 ton ha-1 y-1 of sorghum ratoon or maize as a second crop; a fourth irrigation turn guarantees this yield and could possibly raise it by about 1 ton ha-1 y-1; two irrigation turns result in only half the yield. ‘Fairness’ is the underlining water sharing principle in the Wadi Laba spate irrigation
system. In an attempt to balance between ensuring ‘fairness’ on the one hand and the desire to secure at least three turns on the other, the farmers have introduced a number of water rights and rules that guide when and from what size of floods a certain field is entitled to a second or more irrigation turns. The successes in implementing the water rights and rules have been high till the year 2000 when the farmers relied heavily on each other for the timely maintenance of the indigenous earthen and brushwood structures that were frequently damaged by floods. Following the replacement of the indigenous structures with a concrete headwork in 2000, however, the water rights and rules have been frequently violated.
The soils of the Wadi Laba are the result of successive silt loam alluvial deposition in the past 100 years and are now 2.5 to 3 m deep (International Fund for Agricultural Development, 1995). The soils can retain a Total Available Water (TAW) of 35 cm m-1, which is equivalent to the 37 cm m-1 general TAW value of silt loam soils (De Laat, 2002). This implies that the soils could retain a maximum TAW of 105 cm within the 3 m deep soil profile and 70 cm within the 2 m deep effective rootzone of sorghum and maize. To furnish these TAW amounts by the onset of the cropping season, the irrigation supplied during the flood season should first account for the two major sources of water losses - bare soil evaporation and deep percolation. These losses were estimated with the Soil Water Accounting Model (SWAM) developed as part of this research thereby answering the following questions: - what is the difference in the amount of soil moisture retained by a certain field at the
start of the cropping season, if the field receives two, three or four turns of 50 cm each during the flood season?

86 A Tradition in Transition: Water Management Reforms and Spate Irrigation Systems in Eritrea
- does the difference in the amount of soil moisture support the farmers’ assertion that a field that gets two turns yields 1 to 2 ton ha-1 y-1 of seeded sorghum crop, and 0.5 to 0.75 ton ha-1 y-1 of sorghum ratoon or maize as a second crop; a third irrigation turn could result in doubling of the yield; and a fourth turn could further increase the yield by 1 ton ha-1 y-1?
- can the difference in the amount of soil moisture in any way contribute towards the improvement of the content and enforcement of the indigenous water sharing rights and rules?
The well established and widely used Soil Water Atmosphere Plant (SWAP) model (Kroes and Van Dam, 2003) was used to validate the findings of the SWAM model.
This Chapter is divided as follows. First, it discusses the conceptual background and the computation procedure of the input data of the SWAM and SWAP models. Then, it presents and analyses the results of the models. Finally, it draws some concluding remarks.
6.2 The Soil Water Accounting Model (SWAM)
6.2.1 Conceptual Background
The Soil Water Accounting Model (SWAM) was primarily developed to estimate how much of the water supplied during the flood season will be retained by the soil of the spate irrigated fields (within a depth accessible by the plants) at the onset of the planting season. As the discussions below will reveal, however, the model could also be adapted for any spate and perennial irrigated fields.
The model is based on the following concepts:
1. running water balance of the root zone. (Application of the water balance equation per time step).
2. uniform distribution of the moisture content (θ) in the root zone with the depth (z), or dθ/dz = 0.
3. the percolation rate at the lower boundary equals the hydraulic conductivity in the root zone.
On the basis of the approach of De Laat (1995), the water balance is expressed in terms of saturation deficit S (cm). The saturation deficit is the amount of water required to saturate the root zone. Since the moisture content θ (cm3 cm-3) is constant with the depth, the saturation deficit at time t for a root zone with a depth of Dr (cm) and porosity n (cm3 cm-3) is defined as
DrnS tt )( θ−= (6.1)
This equation may be rewritten as

Modeling Soil Moisture and Assessing its Impacts on Water Sharing and Crop Yield 87
DrS
n tt −=θ (6.2)
The lower boundary flux D (cm d-1) at time t depends on the moisture content θt as follows
)( tt kD θ= (6.3)
The water balance of the root zone is written as
)( 2/12/12/12/11 +++++ −−+Δ+= tttttt EDIPtSS (6.4)
where Δt is the time step (usually one day), E is the evaporation flux, P is the precipitation flux and I the irrigation flux across the upper boundary in cm d-1. The fluxes during the time step are constant and should, to be numerically correct, apply to the situation halfway Δt. This is no problem for the observed quantized data such as P, I and also E when specified by the user. The lower boundary flux D should strictly speaking be computed from the average moisture content during the time step
2/)( 12/1 ++ += ttt θθθ (6.5)
Since θt+1 is to be computed with (6.2) for St+1, an iteration is required to solve (6.4) in combination with (6.3) and (6.5). In view of the simplifications already made to model the moisture situation in the root zone, the assumption that Dt+1/2 can be estimated from θt rather than from θt+1/2 will not have a large impact on the performance of the model. It does, however, facilitate the set up of the algorithm in a simple EXCEL spreadsheet. The same applies for the evaporation E when estimated from the moisture content (or matric pressure) in the root zone as discussed below. Surface runoff is considered negligible, thus P and I are considered to infiltrate completely. When the root zone is saturated and P + I > D + E water will be standing on the surface (ΔS is negative) until infiltration in subsequent days.
Richards’ equation for flow in vertical direction only may be written as
( )⎭⎬⎫
⎩⎨⎧
⎟⎠⎞
⎜⎝⎛ +
∂∂
∂∂=
∂∂ 1
zhk
ztθθ (6.6)
where the coordinate direction z is taken positive upwards. For steady flow ∂θ/∂t = 0 and (6.6) reduces to Darcy’s law
88 A Tradition in Transition: Water Management Reforms and Spate Irrigation Systems in Eritrea
( ) ⎟⎠⎞
⎜⎝⎛ +−= 1
dzdhkqz θ (6.7)
where qz is the steady vertical flow in cm d-1. The assumption in the SWAM model that in the root zone dθ/dz = 0 means that dh/dz = 0. It follows from (6.7) that the soil moisture situation in the root zone can be described by a steady downward flow, which is equal to the hydraulic conductivity. This flow rate is also the lower boundary flux D or the deep percolation loss. It is assumed that there is an instantaneous reaction of deep percolation to irrigation.
6.2.2 Model Inputs and Outputs
The model requires the following input data: - time invariant data:
o depth of the rootzone, Dr in cm; o time step, ∆t in day; o soil moisture characteristic, θ(h); o hydraulic conductivity relation, k(h); o saturation deficit relation, S(θ) or S(h)
- time variant data: o precipitation P in cm d-1; o irrigation interval T in day; o irrigation gift I in cm d-1; o Penman open water evaporation Epen or reference crop evapotranspiration ETo in cm d-1.
The main outputs of the model are: - deep percolation D in cm d-1; - actual bare soil evaporation Ea in cm d-1; - saturation deficit of the rootzone S in cm; - soil moisture storage of the rootzone SMS in cm.
6.2.3 Computation Procedure
The model is set up in an EXCEL spreadsheet and comprises the following steps:
1. the soil moisture characteristic and the hydraulic conductivity relation are specified in a table. This study uses the soil physical data of silt loam as published by Rijtema (1969), which data are based on a worldwide survey;
2. the initial saturation deficit in the root zone S0 is specified and the corresponding moisture content is found from (6.2). In this study S0 is taken on the day before the Wadi Laba fields received the first irrigation gift, which is June 14. It was computed from

Modeling Soil Moisture and Assessing its Impacts on Water Sharing and Crop Yield 89
oo SMSnDrS −= * (6.8)
where Dr = 200 cm, n = 0.509 cm3 cm-3 (Rijtema, 1969) and SMS0 is the initial Soil Moisture Storage of the root zone, which was found equal to 22.5 cm. Substituting these values in (6.8) yields S0 = 79.3 cm. In this study SMS0 was obtained from observations using the gravimetric method at 12 sites selected from upstream, midstream and downstream fields;
3. the model was applied during a period when the soil was bare. The actual bare soil evaporation Ea was estimated with the equation of Penman for open water evaporation Epen and a reduction factor α, which is a function of the matric pressure in the root zone h (De Laat, 1995).
pensa EhE *)(α= (6.9)
where the following relation between sα and h is used for h < -10 cm
)000,16log()1log(1)( hhs
−−=α (6.10)
For h > -10 cm (very wet situation) the value of α reaches a maximum equal to 0.75. Hence, the evaporation from bare soil E varies from zero for the wilting point situation to 75 % of the open water evaporation Epen under very wet conditions. In (6.4) E applies for the pressure in the root zone halfway the time step, but to avoid iteration procedures, Et+½ is calculated based on the value of h that corresponds to θt. Epen values were derived from observed Class A pan evaporation data (Epan). The pan coefficient (Kpan) varies from 0.65 for low relative humidity (RH) values (40 < RH < 70 %) to 0.75 for RH > 70 % (Allen et al., 1998);
4. The hydraulic conductivity k can be interpolated from the hydraulic conductivity relationship k(θ) for the moisture content of the previous time step θt. The lower boundary flux D is set equal to this k-value.
5. the irrigation gift and interval calculations can be done based upon the standard crop and irrigation water requirement approaches (Allen et al., 1998);
6. St+1 can be obtained from (6.4), where D and E are based on the soil moisture situation at time t. In the study area, the precipitation P is negligible during the considered simulation period;
7. The moisture content at the end of the time step θt+1 can be computed with (6.2) for St+1;
8. Steps 3 to 7 are repeated for subsequent time steps.
The time invariant input data for silt loam soils of the Wadi Laba irrigated fields following the above procedure are presented in Table 6.1.

90 A Tradition in Transition: Water Management Reforms and Spate Irrigation Systems in Eritrea
Table 6.1 The Wadi Laba silt loam soils’ input data for the Soil Water Accounting Model (SWAM)
*Matric pressure in the rootzone h in
cm
pF = log |h| *Volumetric
water content θ in cm3 cm-3
**Soil Moisture Storage SMS in
the rootzone in cm
***Saturation deficit S in the
root zone in cm
*Hydraulic conductivity in the rootzone k
in cm d-1 -1 0.00 0.509 101.8 0.00 6.50E+00
-10 1.00 0.497 99.4 2.40 5.32E+00 -20 1.30 0.487 97.4 4.40 4.36E+00 -31 1.49 0.484 96.8 5.00 3.50E+00 -50 1.70 0.474 94.8 7.00 2.39E+00 -100 2.00 0.461 92.2 9.60 8.80E-01 -250 2.40 0.400 80.0 21.80 4.40E-02 -500 2.70 0.279 55.8 46.00 7.90E-03 -1000 3.00 0.205 41.0 60.80 3.00E-03 -2500 3.40 0.150 30.0 71.80 8.30E-04 -5000 3.70 0.125 25.0 76.80 3.10E-04 -10000 4.00 0.103 20.6 81.20 1.20E-04 -16000 4.20 0.092 18.4 83.40 6.20E-05
*Aadapted from Rijtema (1969) **SMS = Dr* θ; where Dr, the root zone depth of sorghum and maize crops in the Wadi Laba, is 200 cm ***S = SMS at saturation level (pF=0) –SMS at any other given pF
With regard to the time variant data, the Penman open water evaporation Epen values for the flood irrigation period June to September are 0.67, 0.75, 0.83 and 0.65 cm d-1 respectively (Appendix 2 provides details). In this same period, as indicated earlier, the precipitation P is negligible. The irrigation gift I is 50 cm, which is set by mutual agreement among the farmers. This supply comes mainly from the floodwater, which is highly unpredictable in timing and duration making it impossible to have a well-defined irrigation schedule or interval, T. In this study, therefore, three irrigation schedule scenarios were formulated:
- Highly likely scenario: a field receives two irrigation turns in July and a third in either June or August on a bi-weekly interval between any two turns; or it gets one turn in each of the three months;
- Less likely scenario: a field is irrigated twice in either June or August and once in July at an interval of 15 days between any two irrigations; or it is irrigated thrice in July;
- Unlikely, yet possible scenario: a field gets two or three irrigations in June or August at a weekly interval between any two supplies.
These scenarios are based on the farmers’ observations, that:15 June to 15 August is the effective flood season; July is the month when at least 50% of the total annual number of floods occurs; very rarely does a field get a second turn before a two week interval.
An overview of combination of detailed irrigation schedules for the scenarios is presented in Table 6.2.

Modeling Soil Moisture and Assessing its Impacts on Water Sharing and Crop Yield 91
Table 6.2 Scenarios and irrigation schedule combinations for the Wadi Laba fields Flood months
June July August Irrigation schedule scenarios and combinations
15 30 1 15 30 1 15
Highly likely scenario Three irrigation turns I I I
I I I I I I I I I I I I I I I I I I I I I I I I I I I I I I I I I I I I I I I I I I I I I
Two irrigation turns I I I I I I I I I I I I I I I I I I I I I I I I I I I I I I I I I I
Less likely scenario Three irrigation turns I I I
I I I I I I I I I I I I I I I I I I
Two irrigation turns I I I I
Unlikely, yet possible scenario 15 22 30 1 7 15
Three irrigation turns I I I I I I
Two irrigation turns I I I I I I I I
“I” is irrigation gift of 50 cm

92 A Tradition in Transition: Water Management Reforms and Spate Irrigation Systems in Eritrea
6.3 The Soil Water Atmosphere Plant Model (SWAP)
The Soil Water Atmosphere Plant model (SWAP) is a physically based, comprehensive agro-hydrological model that simulates the relationship between soil, weather and plant (Kroes and Van Dam, 2003). The core of the model is based on Richards’ equation and SWAP models the soil water movement under unsteady flow conditions.
In this study, the SWAP model was used as a benchmark to assess if and to what extent the assumptions of the SWAM have affected its estimations of the deep percolation and bare soil evaporation losses, and hence the final Soil Moisture Storage (SMSf) - the moisture stored in the rootzone by a Wadi Laba field at the start of the growing period.
The model was used with a daily time step. Since 50 cm is too large a gift to be applied in one day - it was supplied in three consecutive days in the order of 20, 20 and 10 cm. The model simulates the bottom flux (deep percolation) using the θ(h) and k(θ) functions developed by Van Genuchten (1980), Van Genuchten and Leij (1992) and Mualem (1976). It requires that α and n, the shape parameters of the soil moisture characteristic curve as well as λ, the exponent of the hydraulic conductivity function, are specified. For medium textured soils such as the Wadi Laba silt loam soils, the estimated α, n and λ values are 0.0094 cm-1, 1.40 and -1.382 respectively (Kroes and Van Dam, 2003).
With regard to evaporation, SWAP can choose between the empirical functions of Black et al. (1969) or Boesten and Stroosnijder (1986). Since simulation in this study was predominantly carried out during a drying cycle, the equation of Black et al. (1969), which calculates the cumulative actual evaporation during the dry period, was used. The equation is written as
drytEa 1β=∑ (6.11)
where ΣEa is cumulative actual evaporation in cm, β1 is a soil specific parameter in cm d-1/2 that characterizes the evaporation process, tdry is the time (day) after a significant amount of rainfall or irrigation, Pmin.
SWAP resets tdry to zero if the net irrigation exceeds Pmin. For β1, the recommended value of 0.35 cm d-0.5 for very large irrigation gift applications and medium sized textures such as the Wadi Laba silt loam soils is used. Pmin is zero.
The SWAP model also requires setting the initial soil moisture condition and the bottom boundary condition to simulate evaporation and bottom flux. The initial soil moisture is set in terms of soil depth (2 m) and the matric pressure, h. An h value of -6,000 cm corresponding to 22.47 cm of SMS was used. As indicated earlier, the measured rootzone SMS at the onset of the flood season was 22.5 cm. For the bottom boundary condition, the SWAP provides several options. The ‘free drainage profile option’ is suitable for the Wadi Laba irrigated fields as its key requirements are: at least a 2.5 m deep soil profile and a deep groundwater table with negligible influence on the vertical flux.
The discussed input data as well as the simulation period, irrigation applications, rooting depths, numerical solutions of Richard’s equation are presented in Appendix 3 in the format used by the SWAP model.
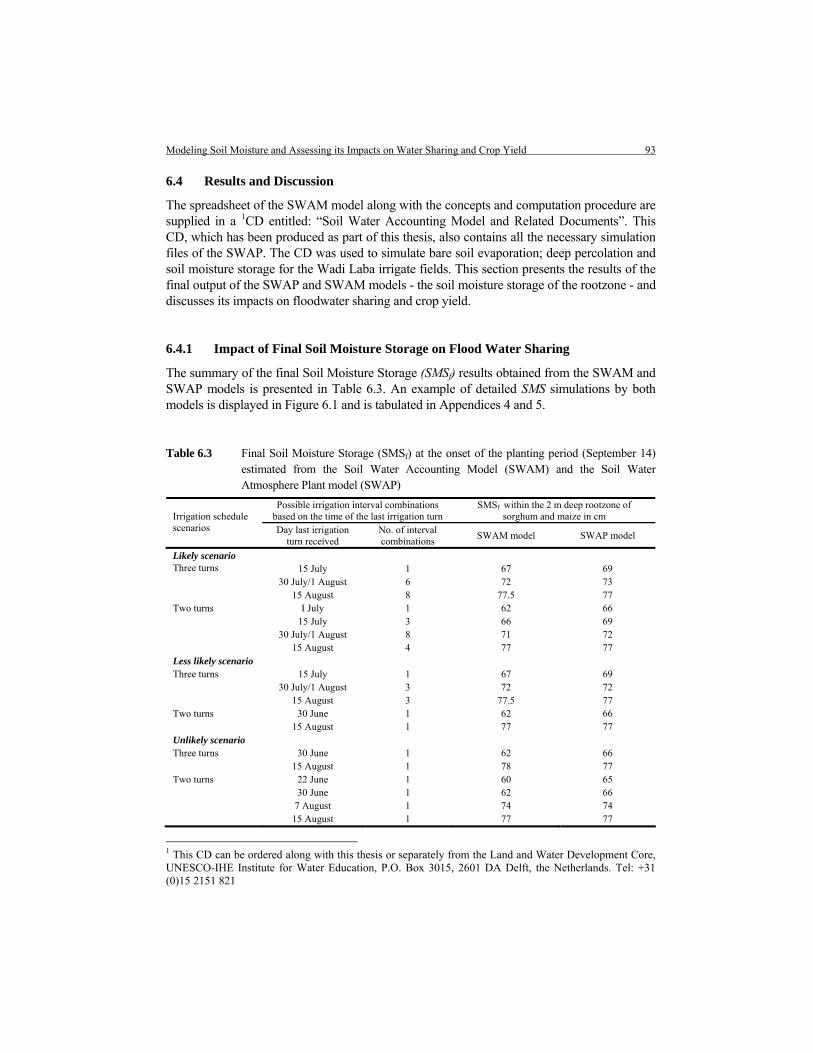
Modeling Soil Moisture and Assessing its Impacts on Water Sharing and Crop Yield 93
6.4 Results and Discussion
The spreadsheet of the SWAM model along with the concepts and computation procedure are supplied in a 1CD entitled: “Soil Water Accounting Model and Related Documents”. This CD, which has been produced as part of this thesis, also contains all the necessary simulation files of the SWAP. The CD was used to simulate bare soil evaporation; deep percolation and soil moisture storage for the Wadi Laba irrigate fields. This section presents the results of the final output of the SWAP and SWAM models - the soil moisture storage of the rootzone - and discusses its impacts on floodwater sharing and crop yield.
6.4.1 Impact of Final Soil Moisture Storage on Flood Water Sharing
The summary of the final Soil Moisture Storage (SMSf) results obtained from the SWAM and SWAP models is presented in Table 6.3. An example of detailed SMS simulations by both models is displayed in Figure 6.1 and is tabulated in Appendices 4 and 5.
Table 6.3 Final Soil Moisture Storage (SMSf) at the onset of the planting period (September 14) estimated from the Soil Water Accounting Model (SWAM) and the Soil Water Atmosphere Plant model (SWAP)
Possible irrigation interval combinations based on the time of the last irrigation turn
SMSf within the 2 m deep rootzone of sorghum and maize in cm Irrigation schedule
scenarios Day last irrigation turn received
No. of interval combinations SWAM model SWAP model
Likely scenario 15 July 1 67 69
30 July/1 August 6 72 73 Three turns
15 August 8 77.5 77 Two turns I July 1 62 66 15 July 3 66 69 30 July/1 August 8 71 72 15 August 4 77 77 Less likely scenario Three turns 15 July 1 67 69 30 July/1 August 3 72 72 15 August 3 77.5 77 Two turns 30 June 1 62 66 15 August 1 77 77 Unlikely scenario Three turns 30 June 1 62 66 15 August 1 78 77 Two turns 22 June 1 60 65 30 June 1 62 66 7 August 1 74 74 15 August 1 77 77
1 This CD can be ordered along with this thesis or separately from the Land and Water Development Core, UNESCO-IHE Institute for Water Education, P.O. Box 3015, 2601 DA Delft, the Netherlands. Tel: +31 (0)15 2151 821
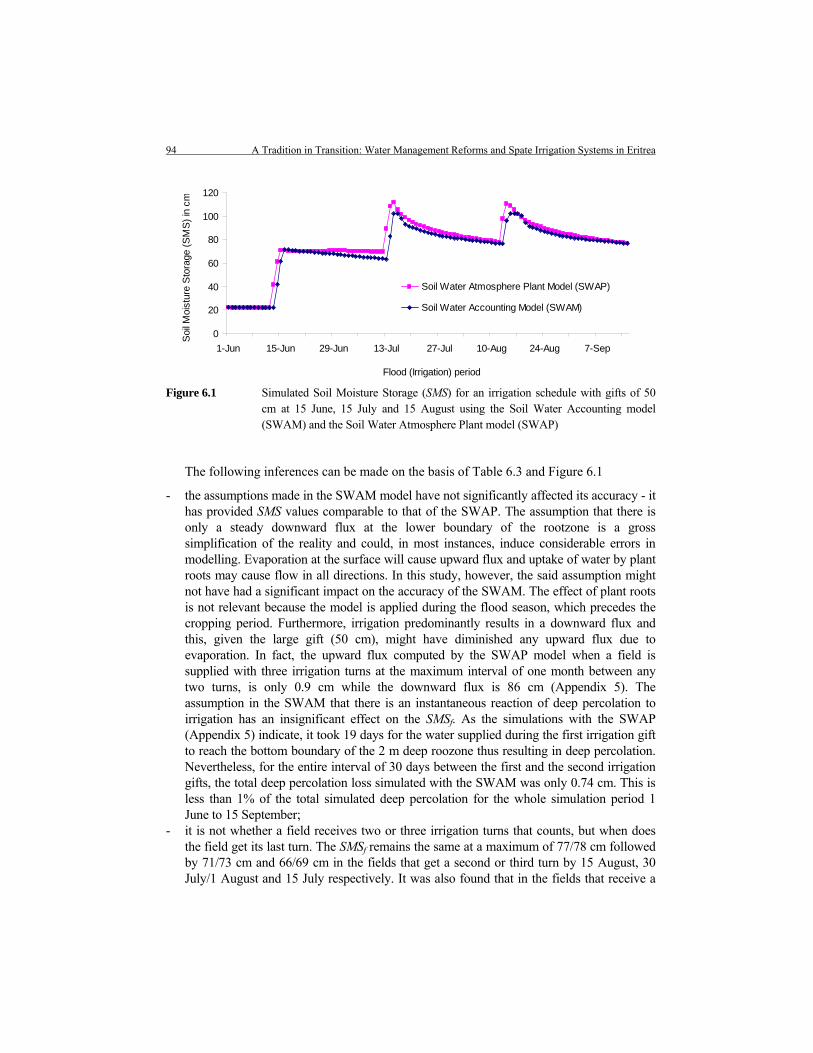
94 A Tradition in Transition: Water Management Reforms and Spate Irrigation Systems in Eritrea
0
20
40
60
80
100
120
1-Jun 15-Jun 29-Jun 13-Jul 27-Jul 10-Aug 24-Aug 7-Sep
Flood (Irrigation) period
Soil
Moi
stur
e S
tora
ge (S
MS)
in c
m
Soil Water Atmosphere Plant Model (SWAP)
Soil Water Accounting Model (SWAM)
Figure 6.1 Simulated Soil Moisture Storage (SMS) for an irrigation schedule with gifts of 50
cm at 15 June, 15 July and 15 August using the Soil Water Accounting model (SWAM) and the Soil Water Atmosphere Plant model (SWAP)
The following inferences can be made on the basis of Table 6.3 and Figure 6.1
- the assumptions made in the SWAM model have not significantly affected its accuracy - it has provided SMS values comparable to that of the SWAP. The assumption that there is only a steady downward flux at the lower boundary of the rootzone is a gross simplification of the reality and could, in most instances, induce considerable errors in modelling. Evaporation at the surface will cause upward flux and uptake of water by plant roots may cause flow in all directions. In this study, however, the said assumption might not have had a significant impact on the accuracy of the SWAM. The effect of plant roots is not relevant because the model is applied during the flood season, which precedes the cropping period. Furthermore, irrigation predominantly results in a downward flux and this, given the large gift (50 cm), might have diminished any upward flux due to evaporation. In fact, the upward flux computed by the SWAP model when a field is supplied with three irrigation turns at the maximum interval of one month between any two turns, is only 0.9 cm while the downward flux is 86 cm (Appendix 5). The assumption in the SWAM that there is an instantaneous reaction of deep percolation to irrigation has an insignificant effect on the SMSf. As the simulations with the SWAP (Appendix 5) indicate, it took 19 days for the water supplied during the first irrigation gift to reach the bottom boundary of the 2 m deep roozone thus resulting in deep percolation. Nevertheless, for the entire interval of 30 days between the first and the second irrigation gifts, the total deep percolation loss simulated with the SWAM was only 0.74 cm. This is less than 1% of the total simulated deep percolation for the whole simulation period 1 June to 15 September;
- it is not whether a field receives two or three irrigation turns that counts, but when does the field get its last turn. The SMSf remains the same at a maximum of 77/78 cm followed by 71/73 cm and 66/69 cm in the fields that get a second or third turn by 15 August, 30 July/1 August and 15 July respectively. It was also found that in the fields that receive a

Modeling Soil Moisture and Assessing its Impacts on Water Sharing and Crop Yield 95
third turn by mid August, a fourth turn, regardless of when it is applied, does not increase the SMSf, which remains at around 78 cm. In the fields irrigated for a third time by 30 July/1 August, a fourth turn would have to be applied between 10 and 15 August to increase the SMSf by only 5 cm to a maximum of 78 cm. The corresponding increase is more significant at 10 and 17 cm in the very rare cases when a field gets a third turn by 15 July and 22 to 30 June respectively;
- In the ‘likely’ and ‘unlikely’ irrigation scenarios, a field irrigated thrice has an advantage over that irrigated twice - the former has a 50% chance of conserving 77/78 cm of water as compared to 25% in the case of the latter. Such probabilities in the ‘less likely’ irrigation schedule scenario are 50% and 43% in favour of the field that gets two irrigation turns;
- the maximum SMSf (77/78 cm), is much less than the 92 cm water holding capacity of the Wadi Laba fields at field capacity, pF 2 (Table 6.1). The field capacity soil moisture can only be attained if a field receives a third or a fourth turn between end of August and mid September, which is highly unlikely. After securing three turns, the farmers use Mekemet (Chapter 4) by mid August to seal their fields against evaporation loss almost being certain that no more floods would come.
The presented analyses could positively contribute to improving the content and enforcement of the two existing water rights and rules the farmers consider as key to ensuring fair distribution within and among the upstream, midstream and downstream fields. These are:
- the water right and rule on second, third and fourth turn, which states that a certain field is entitled to a second, third and fourth turn, only after all other fields receive one, two and three turns respectively;
- the water right and rule with regard to the different flood categories, which allocates the small and medium floods (10 to 50 m3 s-1), and occasionally the moderately-large floods (50 to 100 m3 s-1) to the upstream fields; the moderately-large and sometimes the large floods (100 to 200 m3 s-1) to the midstream fields; the large, and very large floods (200 to 260 m3 s-1) to the downstream fields.
In the indigenous Wadi Laba spate irrigation system, where the earthen and brushwood structures (Agims and Musghas) diverted and distributed the flood water, the above two water rights and rules were by and large observed. Medium and larger floods have frequently destroyed the indigenous structures thereby increasing the likelihood of safeguarding the rights of the midstream and downstream fields to the large floods. The frequent failure of the indigenous structures also meant that the upstream farmers had to depend on the midstream and downstream farmers for timely maintenance. This interdependence had served as a catalyst in forcing the upstream farmers to, in most cases, let the large floods pass to the downstream when, given the field-to-field water distribution system (Chapter 3), they could have at least partially made use of the floods.
Following the water management reforms in 2000 that replaced the Agims and Musghas with a stronger concrete headwork, the frequency of failure of the main structures has significantly reduced and with it the interdependence among the farmers for timely maintenance. As a result, upstream farmers are often using large floods whenever they can

96 A Tradition in Transition: Water Management Reforms and Spate Irrigation Systems in Eritrea
and this coupled with the fact that such floods are scarce (Table 5.1) has limited the access to flood water by the downstream, but also the midstream fields. The practice of the rule on irrigation turns is increasingly becoming confined to the upstream and to some extent to the midstream fields.
Technical interventions such as providing separate offtakes to the midstream and downstream fields and changing the field-to-field water distribution system to a “group-of-fields’ distribution system could increase the chance that the midstream and downstream fields exercise their right to the large floods. It could also enable the irrigation of the fields using medium floods, which as indicated in Table 5.1, account for a third to half of the total number of the floods that annually occur. The in the above presented analyses of the SMSf complement such a technical intervention because they lead to the following conclusion: using a certain flood, be it of medium or larger category, to provide a third or fourth turn of 50 cm to a field that has secured its second or third turn by the end of July and has conserved SMSf of 71 to 73 cm, would increase its SMSf by a maximum of 5 cm - about 90% of the applied water would be lost. Utilizing the flood water to supply a second or third turn to a midstream/downstream field and ensure that the field retains SMSf of at least 71 cm would have two-fold advantages. It would lead to a better water use efficiency, and most importantly, it would contribute towards realizing ‘fairness’ - the underlining principle behind the drafting and enforcement of the indigenous Wadi Laba water sharing rights and rules.
6.4.2 Effect of Final Soil Moisture Storage on Sorghum and Maize Yields
The discussion in the previous section has revealed that there is hardly any difference among the SMSf retained (at the onset of the planting season) by the fields irrigated twice, thrice or four times as long as the last irrigation date is about the same. The question to be addressed here is can the SMSf values of 67.5, 72 and 77.5 cm (Table 6.3) produce the maximum yield of 2 to 3 ton ha-1 y-1 of sorghum seeded and 1 to 1.5 ton ha-1 y-1 of sorghum ratoon or maize grown as a second crop? Before addressing this question, however, it is logical to first discuss whether such a yield is possible if there were sufficient water supply.
The above noted total yield of sorghum is within the yield range reported by FAO (2005). Under optimum water depth application (40 to 60 cm, depending on growth length and climate) and the right temperature conditions, sorghum yield ranges from 3.5 to 5 ton ha-1 y-1. Low temperatures (< 15 °C) during flowering and yield formation, and high temperatures (> 40 °C) lead to poor seed set, problems with ripening and reduced yields (FAO, 2005). In the Wadi Laba, flowering and yield formation occur in the period mid November to beginning of January (sorghum seeded crop), and February to April (sorghum ratoon or maize crop) when the mean monthly temperature ranges from 21 to about 37 °C. Throughout the year, the average monthly temperature is well above 15 °C.
As to maize, it is potentially the highest yielding grain crop among cereals. A medium maturity variety produces 6 to 9 ton ha-1 y-1 if supplied with 50 to 80 cm of water and the temperature is maintained between 20 and 45 oC. It is, however, more susceptible to water stress as compared to sorghum. Limitation of water supply during the flowering period causes 50 to 100% reduction in yield (FAO, 2005). Research on early maturity maize varieties, such as the Berhe in Wadi Laba (Chapter 4) has been relatively rare - they have
Modeling Soil Moisture and Assessing its Impacts on Water Sharing and Crop Yield 97
been considered as having lower yield as compared to the medium maturity varieties (Alexander and Bindiganavile, 2004). They have, however, recently received more attention in many arid and semi arid areas because they are increasingly being viewed as the major bridge of the ‘hungry season’- providers of an early harvest before the harvest of the full season (medium maturity maize) occurs. They are also increasingly being identified as ideal for an off season planting in a drying riverbed (Alexander and Bindiganavile, 2004); perhaps one might add - in a drying soil profile in the Wadi Laba irrigated fields. An extensive research was done in Zimbabwe in 2003 that identified 12 best and 12 worst yielding hybrids of early maturity maize (65 to 85 growth days). Under optimum water depth conditions (40 to 50 cm), the yield of the 24 varieties ranged from 6 to 11 ton ha-1 y-1 and under drought conditions (when supplied with half of their optimum water requirement) from 0.6 to 2.9 ton ha-1 y-1 (Alexander and Bindiganavile, 2004). The maize yield reported by the Wadi Laba farmers (1 to 1.5 ton ha-1 y-1) falls within the latter range.
The discussion presented underlines that the temperature conditions in the Wadi Laba are conducive for sorghum and maize production and if the required amount of water is supplied, the yields reported by the farmers are attainable. The following paragraphs will assess whether the SMSf values of 67.5, 72 and 77.5 cm meet the ETm (net maximum crop water requirement for evapotranspiration) of sorghum seeded, sorghum ratoon and maize grown as a second crop.
At Wilting Point (WP), and this corresponds to an h value of -16,000 cm, the rootzone SMS of the Wadi Laba fields is 18 cm (Table 6.1). Thus, the TAW quantities that correspond to SMSf values of 67.5, 72 and 77.5 cm are 49.5, 54 and 59.5 cm respectively. However, soil water near the WP is not readily available and many crops will be stressed at these low soil water contents. For this reason, a factor called the Management Allowable Depletion (MAD) also referred to as Maximum Allowable Depletion or Readily Available Moisture (RAM) is defined (FAO, 2005). The value of MAD/RAM is given as a percentage p of the TAW that could be safely depleted before a crop shows soil moisture stress that induces yield loss. The value of p depends on the degree of the inherent resistance of a crop to water stress and the evaporative demand, ETm. At ETm of 5 mm d-1 and this is the average ETm during the growing period of sorghum and maize (Table 6.4), the MAD/RAM of the crops is 70% of the TAW (Allen et al., 1998). It is worthy to note, however, that this p value refers to high yielding sorghum and maize varieties, which are less resistant to water stress as compared to local varieties (Allen et al., 1998). The sorghum Hijeri and maize Berhe varieties grown in the Wadi Laba are well adapted to the local climate and extremely resistant to water stress conditions (Chapter 4). Hence, the highest p value of 87.5% (Allen et al., 1998) is more representative, and this results in MAD/RAM values of 43, 47 and 52 cm.
According to the ETo calculated by Penman-Monteith on the basis of 10 years climatic data of the study area and the ETo directly measured using a Class A pan in 2002 and 2004, the average net ETm for one harvest of a seeded sorghum, sorghum ratoon and maize second crop were 42, 31 and 40 cm respectively (Table 6.4). Hence, all the stated MAD/RAM values sufficiently meet the ETm of the seeded sorghum, but furnish only 1 to 10 cm of water for either the sorghum ratoon or the maize grown as a second crop. Nevertheless, the growth period of sorghum ratoon and maize (January to April) coincides with the rainfall season. Assuming that 80% of the 150 mm estimated annual rainfall to be effective; the minimum and

98
A tr
aditi
on in
Tra
nsiti
on: W
ater
Man
agem
ent R
efor
ms a
nd In
dige
nous
Spa
te Ir
rigat
ion
Syst
ems i
n Er
itrea
Tabl
e 6.
4
Estim
ated
net
wat
er re
quire
men
t (ET
m) o
f sor
ghum
and
mai
ze in
the
Wad
i Lab
a sp
ate
irrig
atio
n sy
stem
Gro
wth
per
iod
(f
ield
reco
rded
) 1 ET
o-1
2 ETo-
2
3 k c
ETm
-1
(ET o
-1*k
c) ET
m-2
(E
T o-2
*kc)
Ave
rage
ET m
(E
T m-1
+ E
T m-2
)/2
Cro
p ty
pe
Gro
wth
stag
e
Dat
e D
ays
mm
d-1
m
m
mm
d-1
m
m
m
m
mm
m
m
Initi
al
21/9
– 7
/10
17
6.9
117
6.1
104
0.4
47
41
44
Dev
elop
men
t 8/
10 –
7/1
1 31
5.
9 18
3 5.
2 16
1 0.
75
137
121
129
Mid
seas
on
8/11
– 1
0/12
33
4.
7 15
5 4.
2 13
9 1.
15
178
159
169
Sorg
hum
(H
ijeri
loca
l va
riety
) see
ded
crop
La
te se
ason
11
/12
to 3
/01
24
4 96
4.
4 10
6 0.
8 77
84
81
To
tal
105
55
1
510
43
9 40
5 42
3 In
itial
1/
2 –
7/2
7 4.
1 29
4.
5 32
0.
4 11
13
12
D
evel
opm
ent
8/2
– 27
/2
20
4.1
82
4.5
90
0.75
62
68
65
M
id se
ason
28
/2 –
27/3
28
5.
3 14
8 5.
1 14
3 1.
15
171
164
167
Sorg
hum
(H
ijeri
loca
l va
riety
) rat
oon
crop
La
te se
ason
28
/3 to
10/
04
14
6.2
87
5.7
80
0.8
69
64
67
Tota
l
69
346
34
5
313
309
311
Initi
al
1/2
– 14
/2
14
4.1
57
4.5
63
0.5
29
32
30
Dev
elop
men
t 15
/2 –
13/
3 27
4.
7 12
7 4.
8 13
0 0.
85
108
110
109
Mid
seas
on
14/3
– 1
1/4
29
5.7
165
5.4
157
1.2
198
188
193
Mai
ze
(Ber
he lo
cal
varie
ty)
Late
seas
on
10/4
– 2
1/04
12
6.
6 79
6
72
0.9
71
65
68
Tota
l
82
428
42
2
406
395
400
1 Estim
ated
usin
g Pe
nman
-Mon
teith
on
the
basis
of a
10-
year
clim
atic
dat
a of
the
study
are
a; th
e cl
imat
ic d
ata
is pr
esen
ted
in A
ppen
dix 2
2 O
btai
ned
from
Cla
ss A
pan
mea
sure
men
ts (d
etai
led
data
in A
ppen
dix
2). P
an c
oeffi
cien
ts: K
pan i
s 0.
65 fo
r m
ean
Rela
tive
Hum
idity
(RH
) of 4
0 to
70%
, and
Kpa
n is
0.75
for
RH >
70%
(A
llen
et a
l., 1
998)
. In
Wad
i Lab
a, R
H ra
nges
from
40
to 7
0% in
Sep
tem
ber a
nd O
ctob
er, a
nd is
> 7
0% fo
r the
rest
of th
e cr
op p
rodu
ctio
n pe
riod;
3 Ad
apte
d fro
m B
rouw
er a
nd H
eibl
oem
, 198
6.

Modeling Soil Moisture and Assessing its Impacts on Water Sharing and Crop Yield 99
maximum available soil moisture would be 13 cm and 22 cm respectively. This is 9 to 18 cm, and 18 to 27 cm short of the optimum 31 cm sorghum ratoon and 40 cm maize ETm requirements respectively. Taking the above noted water supply deficits to be uniformly distributed over the entire growth season, the corresponding yield reductions as obtained from Equation 6.12 (Allen et al., 1998) would be 26% to 52%; and 56% to 84% of the maximum possible sorghum and maize yields respectively. Considering the lowest range of such a maximum yield, which is 3.5 ton ha-1 y-1 (sorghum) and 6 ton ha-1 y-1 (maize) - the actual sorghum ratoon and maize yields under the water deficit conditions would range from 1.7 to 2.6 ton ha-1 y-1; and 0.9 to 2.6 ton ha-1 y-1 respectively. It is unlikely that the water deficit would occur during the flowering stage, as it is the time when much of the rainfall would come. It may thus be concluded that the optimum yield of 4.5 ton ha-1 y-1 reported by the farmers is attainable even if a certain field receives only two turns.
⎟⎟⎠
⎞⎜⎜⎝
⎛−=⎟⎟
⎠
⎞⎜⎜⎝
⎛−
m
ay
m
a
ETET
kYY
11 (6.12)
where ky is yield response factor, which is 0.9 and 1.25 for sorghum and maize respectively (Allen et al., 1998); Ya is actual yield in ton ha-1 y-1: the yield under a given soil moisture condition; Ym is maximum yield in ton ha-1 y-1: the yield when water is not a limiting factor; ETa is actual evapotranspiration in cm or mm: the amount of water actually available for crop production, and this, as indicated in the above, ranges from 13 to 22 cm; ETm is maximum evapotranspiration in cm or mm: the amount of water needed for Ym, which is 31 cm and 40 cm for sorghum ratoon and maize respectively (Table 6.4).
6.5 Concluding Remarks
- the SWAM model, though based on many assumptions that simplify the reality of the soil-water flow in the soil-water-air system, provided SMSf values for the Wadi Laba silt loam soils comparable to that obtained from the well established and more detailed SWAP Model. The SWAM is a simple spreadsheet model with an easy understandable user-interface, concepts and computational procedures. It can be a useful water management tool for irrigation technicians in Eritrea and most probably in other countries that have a limited modeling know-how and application experience, and are operating under data scarce conditions;
- in the indigenous Wadi Laba spate irrigation system, three irrigation turns might have provided more guarantee (as compared to two turns) that a field would yield 2 to 3 ton ha-1 y-1 of seeded sorghum and 1 to 1.5 ton ha-1 y-1 of sorghum ratoon or maize grown as a second crop - the maximum/desired yield reported by the farmers. Given the frequent failure of the indigenous structures, and the adherence to the water rights and rules on second and third irrigation turns, it might have been highly probable that the fields received the third irrigation turn in August, which implies that the fields would retain the maximum SMSf of 78 cm;
100 A Tradition in Transition: Water Management Reforms and Spate Irrigation Systems in Eritrea
- to maintain ‘fairness’ in water sharing in the modernized Wadi Laba spate irrigation system, the existing water right on the size of floods would have to be modified to: regardless of the size of the flood, if the upstream and/or the midstream fields receive three turns by mid or end of July, the subsequent flood water should be conveyed to the downstream fields. As indicated by the SWAM and SWAP models, a field that receives two or three turns by mid or end of July (this is highly possible in the upstream fields and to some extent in the midstream fields, because the modern structures rarely fail and the water right and rule on second and third turns is being violated), can conserve soil moisture sufficient for producing the above noted maximum/desirable yield;
- a fourth irrigation turn supplied at any time during the effective irrigation period from 15 June to 15 August could not realize the perceived (by the farmers) additional 1 ton ha-1 y-1 sorghum/maize yield.

Hydraulic Performance Evaluation after Water Management Reforms 101
7 Hydraulic Performance Assessment after Water Management Reforms
7.1 Introduction
Bos (2000) defined performance assessment as the systematic observation, documentation and interpretation of the management of a certain irrigation and drainage project with the objective of ensuring that the input of resources, water delivery schedules, intended outputs and required actions proceed as planned. This definition was endorsed by several irrigation engineers, managers and institutional experts during the joint International Program for Technology and Research in Irrigation and Drainage (IPTRID), Food and Agricultural Organization (FAO) and the World Bank workshop on “Performance Indicators and Benchmarking” that was held in Rome, Italy in 2000. In this same workshop, the basic difference between benchmarking and performance assessment was also drawn. It was agreed that benchmarking assesses performance - internally against its own norms and standards and externally against key competitors’ standards. Performance assessment on the other hand (in a typical case) assesses the performance against internally set standards, but considers the irrigation system in a more comprehensive way. Benchmarking was thus considered a part of performance assessment, but distinct in terms of its function and methodology. In this thesis, performance assessment was preferred to benchmarking as the objective was to provide a thorough technical, institutional and environmental (salinity, sodicity and nutrient degradation) assessment of the Wadi Laba spate irrigation system.
As discussed in detail by Schultz and Wrachien (2002), performance assessment is an increasingly relevant concept in present-day irrigation. This is because the gradual deterioration of many of the large-scale irrigation systems developed in the second half of the 20th century is starting to become apparent making it necessary for properly evaluating the performance of these systems before, during and after their modernization. In many (semi)arid regions to which Eritrea belongs, there is limited scope for irrigation expansion in the future (Uphoff, 1991). Thus, it is imperative that the short (1998 to 2003) and long (2005 to 2015) term efforts to reform spate irrigation water management in Eritrea at the least yield the expected performance improvements. Therefore, assessing the performance of the Wadi Laba spate irrigation system that pioneered the water management reforms and recommending, as necessary, relevant improvement measures is timely and necessary.
To carry out an irrigation performance assessment, one should necessarily identify some indicators or set guiding questions. Many indicators are described in literature (see for example: Rao, 1993; Perry, 1995; Schultz and Wrachien, 2002 and Bos, et al., 2005). Nevertheless, given the variation in the types of irrigation systems, in their physical, social, and economic conditions, there is not a universal indicator (set of indicators) that one can adhere to. As rightly argued by Gillot and Bird (1992), the methods and the nature of indicators required are often dependent on the objective of the assessment. In the case of Wadi Laba, the major drive for undertaking the performance assessment was to find out if and

102 A Tradition in Transition: Water Management Reforms and Spate Irrigation Systems in Eritrea
how the water management reform interventions achieved or can attain their set targets, which are outlined below in a hypothesis and question format:
Hypothesis - the concrete headworks and the design and layout introduced by the water management
reforms sufficiently mitigate the unpredictability in occurrence, volume and duration, and the destructive nature of all the different flood sizes thereby supplying three irrigation turns of 50 cm each to the whole 2,600 ha land in an average season at insignificant consequences to the environment (limited deforestation).
Research questions - was there an increase in the annually irrigated area from 1,200 ha to 2,600 ha during an
average flood season? - did the concrete head-works that replaced the indigenous diversion and distribution
structures (Agims and Musghas) improve the reliability and regularity of diverting large floods and distributing them to the downstream fields?
- did the newly introduced design and layout enable the distribution of water in accordance to the indigenous water rights and rules and ensure fair water sharing within and among the head and tail-end farmers?
- did the reforms have an impact on reducing deforestation and relieving the farmers from their indigenous intensive operation and maintenance tasks?
This Chapter will attempt to provide answers to the above presented hypothesis with a focus on the modern technical features and their degree of coherence with the indigenous water rights and water sharing arrangements. The institutional aspects have been discussed (Chapter 5) and the environmental issues will be detailed in the following Chapters.
The set-up of this Chapter is as follows: first, a brief assessment of the initial phase of the water management reforms is presented. Then, the factors that led to the extent and distribution of the actually irrigated area are discussed. Next, the strengths and limitations of the concrete headwork and the new design and layout are analyzed as far as the achievement of the above noted targets is concerned. Finally, some conclusions and recommendations are drawn.
7.2 Assessment of the Initial Phase of the Water Management Reforms
In May 1994, the Ministry of Agriculture of the State of Eritrea invited the International Fund for Agricultural Development (IFAD) to make an exploratory visit to the Wadi Laba spate irrigation system. Convinced that there is a need and potential for development in the area, IFAD officially signed a loan agreement with the Government of Eritrea initiating the Eastern Lowland Wadi Development Project (ELWDP).
The ELWDP project comprises of four major components - spate irrigation (focus of this thesis), domestic water supplies, agricultural and livestock developments, and project coordination. In August 1996, the Ministry commissioned Halcrow and Partners Ltd (UK) to implement the spate irrigation development component. Accordingly, Halcrow conducted a 2-year study, which produced a detailed structural design and system layout (Halcrow, 1998).
Hydraulic Performance Evaluation after Water Management Reforms 103
It is stated that: ‘the success of the spate irrigation development effort is largely contingent on its being unreservedly adopted by the farmers as their own together with their full acceptance of the responsibility for its operation and maintenance commitments. To engender such an attitude requires a ‘participative approach’ such that the farmers are empowered to influence the planning, design and operation of the irrigation system’ (Halcrow, 1997). This approach and strategy, however, largely remained on paper.
The studies conducted between 1996 and 1998 to select the design of the diversion and distribution structures and system layout, gave hardly any room for a ‘participative approach’. All the interviewed farmers explained that during the study phase of the project, let alone to have an influence on the planning, design and layout of the various components of the head-works, they were even not sufficiently passively informed about the dimensions and uses of these structures. It is only after all the work had been accomplished that the farmers were invited to look at the ‘model’ of the Wadi Laba headwork components and their layout. That was, the farmers claim, the first time they got the chance to have some vague idea about what was to replace their Agims. In that demonstration, some farmers raised several questions and concerns with respect to: the dimensions of the main canal head regulator gates which they claimed were too narrow; the design and site of the Sheeb-Kethin culvert and the Ede-Abay and Debret branch canal, questioning their coherence with their water sharing practice; the layout of the breaching bund, expressing their fear that once destroyed, there is no possibility to make use of the water. These concerns at the least deserved further investigation at that time. No such an attempt was done and the design and layout were not subject to any revision.
In an apparent explanation as to why the farmers concerns were not considered and no study was conducted to investigate their implications on the design and layout of the system, it was stated: ‘understanding the functioning of the traditional water distribution of spate irrigation systems in their totality is highly relevant to make an appropriate technical design. However, it needs detailed and prolonged studies, and if taken to their logical conclusion, would involve deferring developments for years whilst data are being collected. Such deferral, in the context of the development needs in Eritrea, is not desirable’ (Halcrow, 1997). One cannot dispute the fact that Eritrea is among the poorest countries with 53% of its population below the poverty line (Central Intelligence Agency, 2006) and thus, unnecessary delay of development projects in the country may be unjustified. This Chapter does not intend to dwell on the question: was there no time during the whole process of the water management reforms to make a thorough assessment of the indigenous water management and agronomic practices? Had the necessary resources (material and human) been allocated, the indigenous practices could have been studied prior or at least in parallel with the technical study that lasted for two years. The central question here is: did the lack of a sound understanding of the indigenous water management principles and practices significantly affect the performance of the new design and layout, and the components of the concrete head-works? Or was its impact marginal? These and other related questions are addressed in the following sections.
7.3 Extent and Distribution of Irrigated Area
In 2002, a dry year, the Wadi Laba brought 9 floods. The third flood (180 m3 s-1) completely destroyed the breaching bund that was designed to breach during the occurrence of a 5-year

104 A Tradition in Transition: Water Management Reforms and Spate Irrigation Systems in Eritrea
return flood (265 m3 s-1) or larger floods. It was not timely repaired and the 6 spates that followed were lost. As a result, the actual irrigated area was only 300 ha or nearly 12% of the total area expected to be irrigated.
The year 2003 had a good flood season with a total of 23 floods; 5 of which were large. As in 2002, a flood with a discharge of about 165 m3 s-1 swept away the breaching bund and almost all the large floods were lost. This, along with the other factors discussed in the next section, contributed to the poor performance of the system (Table 7.1).
Table 7.1 Total irrigable and actual irrigated areas in the Wadi Laba system in 2003 Fully irrigated
area Partially irrigated
area Dry area
Irrigation zones Total
irrigable area in ha
No. of benefiting households ha % ha % ha %
Sheeb Kethin 754 1,000 370 49 0 0 384 51
Errem 665 770 485 73 100 15 80 12
Ede-abay 500 490 265 53 200 40 35 7
Debret 430 455 340 79 35 8 55 13
Emdenay/Ede Eket 263 280 0 0 0 0 263 100
Total 2,612 2,995 1,460 56 335 13 817 31
As it can be read from Table 7.2, the ‘fully’ irrigated area (received three turns) was only 1,460 ha, the ‘partially’ irrigated area (got one to two turns) stood at 335 ha and the rest (817 ha) was left dry. This is far less than the set target of 2,600 ha; and according to the farmers somewhat short of what would have normally been irrigated when the indigenous system operated at its best. The farmers explained that during an average and good/excellent flood seasons, when they managed to ‘timely’ repair the Musghas and Agims, they were able to ‘fully’ irrigate 60 to 80% of the 2,600 ha.
The 28 floods (7 large) that occurred during the excellent 2004 flood season managed to fully irrigate only 1,550 ha (Table 7.2), which is well below the 2,600 ha target. Due to failure of the breaching bund by a flood with an estimated discharge of 190 m3 s-1, 5 of the 7 large floods were not utilized.
Table 7.2 Total irrigable and actual irrigated areas in the Wadi Laba system in 2004 Fully irrigated
area Partially irrigated
area Dry area
Irrigation zones Total
irrigable area in ha
No. of benefiting households ha % ha % ha %
Sheeb Kethin 754 1,000 400 53 0 0 354 47
Errem 665 770 540 81 100 15 25 4
Ede-abay 500 490 275 55 150 30 75 15
Debret 430 455 335 78 45 10 50 12
Emdenay/Ede Eket 263 280 0 0 0 0 263 100
Total 2,612 2,995 1,550 59 295 11 767 30
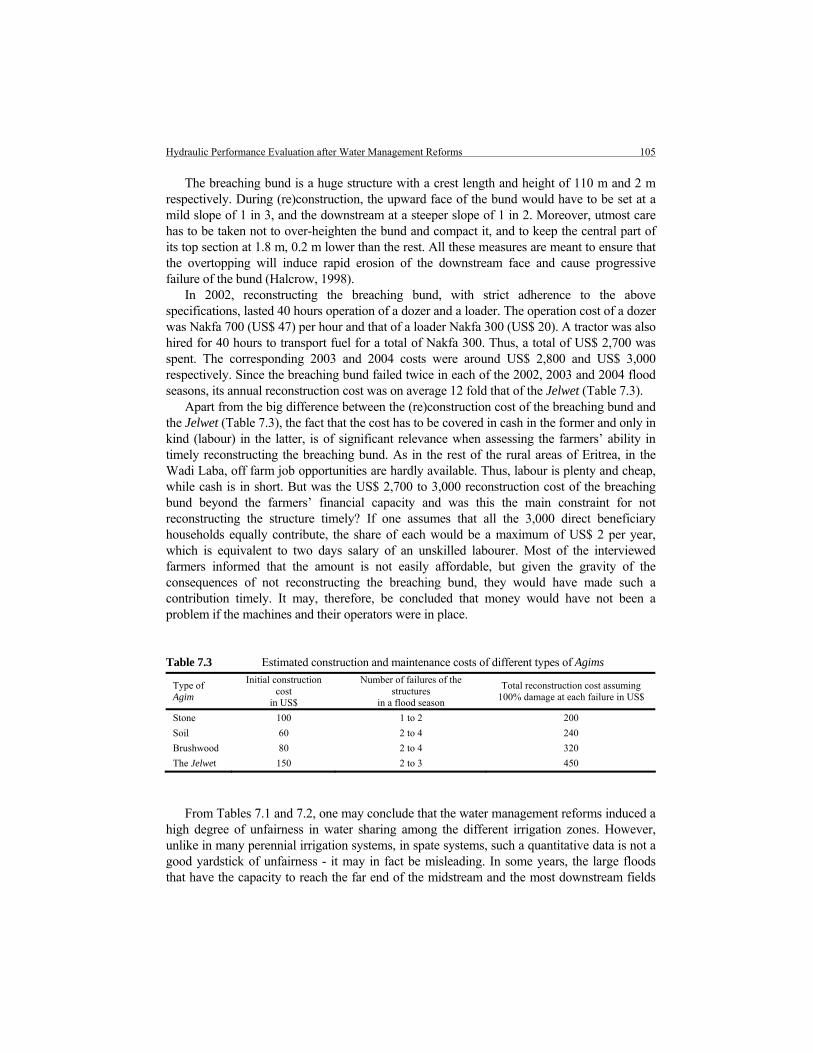
Hydraulic Performance Evaluation after Water Management Reforms 105
The breaching bund is a huge structure with a crest length and height of 110 m and 2 m respectively. During (re)construction, the upward face of the bund would have to be set at a mild slope of 1 in 3, and the downstream at a steeper slope of 1 in 2. Moreover, utmost care has to be taken not to over-heighten the bund and compact it, and to keep the central part of its top section at 1.8 m, 0.2 m lower than the rest. All these measures are meant to ensure that the overtopping will induce rapid erosion of the downstream face and cause progressive failure of the bund (Halcrow, 1998).
In 2002, reconstructing the breaching bund, with strict adherence to the above specifications, lasted 40 hours operation of a dozer and a loader. The operation cost of a dozer was Nakfa 700 (US$ 47) per hour and that of a loader Nakfa 300 (US$ 20). A tractor was also hired for 40 hours to transport fuel for a total of Nakfa 300. Thus, a total of US$ 2,700 was spent. The corresponding 2003 and 2004 costs were around US$ 2,800 and US$ 3,000 respectively. Since the breaching bund failed twice in each of the 2002, 2003 and 2004 flood seasons, its annual reconstruction cost was on average 12 fold that of the Jelwet (Table 7.3).
Apart from the big difference between the (re)construction cost of the breaching bund and the Jelwet (Table 7.3), the fact that the cost has to be covered in cash in the former and only in kind (labour) in the latter, is of significant relevance when assessing the farmers’ ability in timely reconstructing the breaching bund. As in the rest of the rural areas of Eritrea, in the Wadi Laba, off farm job opportunities are hardly available. Thus, labour is plenty and cheap, while cash is in short. But was the US$ 2,700 to 3,000 reconstruction cost of the breaching bund beyond the farmers’ financial capacity and was this the main constraint for not reconstructing the structure timely? If one assumes that all the 3,000 direct beneficiary households equally contribute, the share of each would be a maximum of US$ 2 per year, which is equivalent to two days salary of an unskilled labourer. Most of the interviewed farmers informed that the amount is not easily affordable, but given the gravity of the consequences of not reconstructing the breaching bund, they would have made such a contribution timely. It may, therefore, be concluded that money would have not been a problem if the machines and their operators were in place.
Table 7.3 Estimated construction and maintenance costs of different types of Agims
Type of Agim
Initial construction cost
in US$
Number of failures of the structures
in a flood season
Total reconstruction cost assuming 100% damage at each failure in US$
Stone 100 1 to 2 200
Soil 60 2 to 4 240
Brushwood 80 2 to 4 320
The Jelwet 150 2 to 3 450
From Tables 7.1 and 7.2, one may conclude that the water management reforms induced a high degree of unfairness in water sharing among the different irrigation zones. However, unlike in many perennial irrigation systems, in spate systems, such a quantitative data is not a good yardstick of unfairness - it may in fact be misleading. In some years, the large floods that have the capacity to reach the far end of the midstream and the most downstream fields

106 A Tradition in Transition: Water Management Reforms and Spate Irrigation Systems in Eritrea
may not occur. Under these situations, regardless of the type of the irrigation infrastructure one puts in place, many fields may remain partially or completely dry. Therefore, irrespective of where and how much area was irrigated, if the Wadi Laba irrigation infrastructure had succeeded in distributing the flood water in line with the water rights and rules and the water sharing arrangements agreed upon by the majority of the farmers, it would still be considered fair and the farmers would be satisfied. Was this the case? The following section attempts to provide the answer.
7.4 Design and Layout, and Water Supply and Distribution
In the indigenous system, water was distributed from the Wadi to the two main canals: Sheeb-Kethin and Sheeb-Abay (Figure 4.4) proportionally during medium and larger floods at a 1:4 ratio. Given the unpredictable and destructive nature of the floods, however, this was not fixed. It altered almost after each flood based on the extent of the respective areas irrigated. At times, the proportion was 1:1 and even 4:1. The presence of the Jelwet (Figure 4.8), which could be easily re-oriented, made the adoption of this flexible distribution possible. With the introduction of the concrete head-works (Figure 4.10), such flexibility was lost and the water distribution effectively shifted to a fixed proportion. This would necessarily require that all the diversion and distribution structures and the main components of the headwork - the breaching bund, the culvert, the scour sluice and the gravel trap - function in line with their design requirements. Nevertheless, as we shall discuss, this has not been the case.
From the Sheeb-Abay main canal, during medium and larger floods, the flow was distributed between the two secondary canals (Errem and Ede-Abay) at a 1:1 ratio. Although the irrigable area of Errem (665 ha) is larger than that of Ede-Abay (500 ha), the farmers explained that the flow was equally distributed to compensate for the longer delivery time needed in Ede-Abay. The Ede-Abay canal is about 3 km long whereas the Errem canal is nearly 2 km. As in the case of the main system, the proportionality here was also flexible. During small floods, an equal-turn rotation was practised between the canals.
Within and among the tertiary canals, the distribution of the flood water was guided by the water right on sequence: ‘the upstream farmers have a priority right only to medium and smaller floods, and the midstream and downstream farmers have an equal priority right to moderately large and large floods respectively.’
At field level, the flood water was conveyed from head to tail-end and from field-to-field. The farmers applied the water rights and rules on irrigation depth and turns, which state that ‘each field is entitled to a knee height (about 50 cm) irrigation at each spate;’ and ‘during a second, third and fourth turn, a field receives water only after all other fields have got one, two and three turns’. The aim was to limit the amount and frequency of irrigation water utilization by any individual farmer thereby increasing the probability of each field being irrigated.
To come to the layout put in place after the water management reforms (Figure 4.9), Sheeb-Kethin lost its separate main canal and its upstream water right status, and is now supplied from the Errem canal through a culvert. The culvert crosses the 500 m wide section of Wadi Laba before it emerges at the right bank of the Wadi to deliver water to the Sheeb-Kethin fields. The culvert was designed with a 7 m head between its inlet and outlet so as to

Hydraulic Performance Evaluation after Water Management Reforms 107
generate a velocity of 3 m s-1 and to avoid sedimentation. This did not materialize, however. As shown in Figure 7.1, the culvert suffered serious blockage of its outlet throughout the flood season. Placing the culvert intake at the upper reach of the gravel trap has exacerbated the sedimentation problem. This reach is designed to accommodate more than 50% of the pebbles, gravel and coarse sand sediment entering the gravel trap (Halcrow, 1998).
Figure 7.1 Fully blocked outlet of the Wadi Laba culvert
As a result of the discussed change in the irrigation system layout and the sedimentation problems of the culvert, the Sheeb-Kethin farmers did not receive their fixed 25% share of water and only irrigated about 50% of their total area (Tables 7.1 and 7.2). Even this would not have been possible if the farmers had not:
- constructed a stone and a brushwood Agim at the right bank of the Wadi and diverted a major portion of the water that was discharged back to the Wadi whenever the breaching bund failed;
- built a brushwood Agim in the Wadi bed and guided water from the scour sluice for about 1 km and diverted it to their fields.
At a full operation, the capacity of the scour sluice is 25 m3 s-1. This flow can easily reach the upstream fields and significantly benefit the concerned farmers. The use of this water is not, however, without risk - it has a high content of coarse sand, which can over time buildup a sandy soil profile. In just four years (from 2001 to 2004), the most upstream fields in Sheeb-Kethin accumulated a 20 cm layer of sediment. The annual average estimated sedimentation rate is 3 cm (International Fund for Agricultural Development, 1995). The soil texture analysis carried out in selected upstream fields after the 2004 flood season has revealed that their top 30 cm profile is of sandy loam texture. In contrast, the topsoil samples taken from the mid and downstream fields, which have not been irrigated by the scour sluice, were found to be of silt loam textures. If the use of the scour sluice as a supplier of irrigation water is continued, it is possible that over time, the topsoil of the fields could have loamy sand or even a coarser texture. Such soils have a low (< 20 cm m-1) total available water holding capacity; and this could have a negative impact on crop yield. As discussed, in spate irrigation systems,

108 A Tradition in Transition: Water Management Reforms and Spate Irrigation Systems in Eritrea
crops complete their entire growth cycle mainly based on the soil moisture stored in the rootzone prior to the planting date.
The use of the scour sluice has also a negative effect on the environment. The water it supplies has to be guided though the Wadi bed for about 1 km and any Agim used for that purpose needs to be re-enforced with brushwood. The farmers informed that the amount of brushwood being used per year is almost the same as that utilized for the annual (re)construction of the Jelwet.
It seems to be advisable that the use of the scour sluice for irrigation purposes would have to be limited or stopped. This would, however, require that the farmers be supplied with an alternative source. To this end, construction of a second head regulator gate at the other end of the Wadi may be recommended. This, besides restoring the indigenous water rights of the Sheeb-Kethin farmers, can enable to fill the existing gap between water supply and demand. The existing gates may not deliver sufficient water even if there is no shortage at the source. This is because the design discharge of the gates is determined on the basis of a net crop water requirement (ETc) of 3,800 m3 ha-1 y-1. This value is too low as it considers only a ‘single cropping season. In the Wadi Laba irrigation system, the farmers harvest at least twice - sorghum seeded crop followed by ratoon or maize crop, and the total annual ETc ranges from 7,300 to 8,200 m3 ha-1 y-1 (Chapter 6).
Some may argue that having two sets of head regulator gates could make the control of sedimentation upstream of the gates difficult. Yes, it may. But the culvert is a worse alternative because not only that it has not avoided the sedimentation problem, but also, unlike the head regulator gate, it does not allow farmers to change the proportionality of water by constructing Agims and Musghas in the Wadi bed. It is worthy of note that if a head regulator gate was constructed instead of the culvert, the system would not have been much more expensive. The culvert cost was around US$ 1 million and that of the head regulator gate constructed to irrigate 742 ha (Sheeb-Kethin command area is 754 ha) in the Wadi Mai-ule spate irrigation system (5 km from Wadi Laba) was around US$ 1.1 million (Halcrow, 1997).
Another intervention that could help increase the supply of water from the main system to the secondary canals is raising the crest level of the rejection weir (downstream of the gravel trap) by earthen material or brushwood. The gravel trap, which has a capacity of 60,000 m3, is usually filled (as was the case in 2003 and 2004) with sediment brought by two large floods. Dozers and loaders cannot operate under wet conditions and hence the gravel trap cannot be cleaned in the middle of the flood season. As stated, the main canal head regulator gates may generate a turbulent flow of 85 m3 s-1 in the gravel trap during large floods and this need to be rejected to the Wadi to prevent scouring and erosion (Halcrow, 1998). Nevertheless, such a flow will in no time demolish the raised earthen/brushwood portion of the rejection weir crest.
In the case of the Errem, Ede-Abay and Debret canals, the Ede-Abay lost its upstream water control and is now a branch canal together with Debret in the midstream at about 800 m of the Errem canal (Figure 4.9). This gave Errem an upper hand, and Debret became at equal footing with Ede-Abay. This greatly contributed to the reality that when Errem irrigated 70 to 80%, Ede-Abay only managed a little over 50% of its area. Being disappointed with the water delivery performance of their branch canal, the Ede-Abay farmers constructed a new offtake in 2003 at a further upstream site (this is marked ‘OT’ in figure 4.9), directly diverting water

Hydraulic Performance Evaluation after Water Management Reforms 109
from the Wadi. This new offtake enabled the farmers to partially irrigate 150 ha. Debret, besides its new branch canal, retained its old offtake from Errem and irrigated about 80% of its total area.
The new offtake constructed by the Ede-Abay farmers had some negative consequences. The downstream Musghas could not resist the combined strength of the flood coming from the main inlet the farmers share with Debret and the offtake. The Musghas were washed away in 2003 and 2004 and according to the farmers, reconstructing them called for the investment of about a quarter of the quantities of brushwood, human labour and draught animal power used to be annually spent for rebuilding the Jelwet. The farmers did cut some sections of the earthen banks of the concerned canals and safely discharged the extra water back to the Wadi, protecting the respective fields from erosion. Only one field was affected with sand intrusion and rill erosion.
The Ede-Abay Musghas, immediately downstream of the new offtake, have so far not been replaced with gabions, despite the fact that such a plan dates back to 1998. This is mainly due to the standoff created between the farmers and the engineers as the result of the poor performance of the Ede-Abay branch canal. The concerned engineers hold the opinion that Agim Knsal (Figure 4.9) should be demolished if they are to invest in changing the Musghas to gabions. They assert that as long as Agim Knsal is in place, the farmers will divert large quantities of water via their new offtake causing damage to the gabions. The farmers on the other hand insist that they will not allow Agim Knsal to be destroyed, because they claim that the main gates do not supply enough water, and when the breaching bund fails, they would necessarily need Agim Knsal to divert supplementary water directly from the Wadi. Given the fact that the breaching bund was damaged twice in each of 2002, 2003, and 2004, the line of reasoning of the farmers is logical and understandable. A possible win-win solution that can pave the way for the construction of the gabions may be to use Agim Knsal as a rejection weir. This will give the farmers the possibility to abstract water whenever they need and the engineers some degree of control of the amount of water diverted. Most farmers in Eritrea, including those in the Wadi Laba are familiar with the construction, repair and maintenance needs of gabion structures. Gabions are widely used throughout the country for erosion control measures on hills and mountains, roadsides, rainfed and irrigated farms. Most of these structures have been built by farmers on a food-for-work and/or cash-for-work program.
The Emdenay-Ede-Eket fields were the most affected by the new design and layout. In spite of the fact that in 2003 and 2004 there were 6 and 7 moderately large and larger floods that could have supplied water to the fields, not even a single ha was irrigated. In both years, the large floods with estimated discharges of 165 and 190 m3 s-1 that came prior to the other 5 and 6 floods, washed-away the breaching bund, and nearly their entire flow was discharged back to the Wadi. The breaching bund was not repaired in time to divert the other large floods. Such floods also used to wash away the Jelwet, but then, the indigenous lay out (Figure 4.4) gave the farmers the possibility to safely guide the water all the way to the downstream fields. The new layout (Figure 4.9) neither retained this possibility nor provided an alternative. The best alternative could be to construct supplementary gabion offtakes at the farthest midstream and downstream sites.
110 A Tradition in Transition: Water Management Reforms and Spate Irrigation Systems in Eritrea
The inadequate operation of the scour sluice was among the main factors that contributed to the failure of the breaching bund at discharges below its design capacity. The gate operators were given a strict operation rule - leave the scour sluice gate closed and gradually open it depending on the discharge of the flow (Halcrow, 1998). In theory, it is a perfect strategy because it was meant to ensure that all low flows could be diverted. In practice, however, it is counter productive. It is difficult to tell beforehand whether the flood will be small or large. Even if you rightly guess, as some times the farmers do, that the flood is large, it takes at least 30 minutes to fully open the gate (with four operators) whereas the peak discharge of the floods that are usually responsible for the damage of the breaching bund, only stays 10 to 15 minutes. An effective solution could be leaving the scour sluice gate t o (0.75 to 1 m) open and gradually closing it as the flow discharge declines. The farmers and the site engineers have fully endorsed this strategy.
Another factor that has led to the failure of the breaching bund at low discharges and that is likely to cause an increase in the frequency of such a failure is the sediment deposition on the upstream side of the breaching bund. This reduces the height of the breaching bund and exposes it to be overtopped and washed away by floods much smaller than those the bund is designed to endure. Installing a second head regulator gate will indirectly contribute to minimizing this upstream sedimentation induced failure of the breaching bund. The Sheeb-Kethin and Sheeb-Abay farmers will most likely construct a broad U-Shaped Agim (similar to the Jelwet) upstream of the headwork to change the proportionality of water distribution on mutual agreement. This Agim, which will most likely be constructed from the deposited sediment, will serve as a first defence line for the breaching bund.
7.5 Concluding Remarks
The hypothesis stated at the beginning of this Chapter was falsified; the water management reforms did not achieve their set targets:
- in an ‘excellent season’, the fully irrigated area was 1,550 ha. This is 60% of the 2,600 ha planned to be fully irrigated in an ‘average’ season;
- reliability and regularity of supplying large floods to downstream fields did not improve. The downstream Emdenay/Ede-Eket fields remained dry in an excellent flood season;
- the introduced design and layout was not coherent with the indigenous water sharing arrangements, and this contributed to unfairness in water distribution. When Ede-Abay and Sheeb-Kethin irrigated 50% of their areas; Errem and Debret managed to irrigate 70 to 80%;
- there was no noticeable environmental benefit - the scale of deforestation did not decline. The measures taken by farmers to increase their water supply, which were triggered by the inability of the main gates to deliver the needed quantity, resulted in damage of some Agims and Musghas the reconstruction of which called for almost the same amount of brushwood that was utilized for the Jelwet.
These limitations may be addressed by adopting the interventions:
- replacing the Sheeb-Kethin culvert with a head regulator gate. This can fill the existing nearly 4,000 m3 ha-1 y-1gap between the water supply and demand; restore the upstream

Hydraulic Performance Evaluation after Water Management Reforms 111
water right status of the farmers, limit the use of the scour sluice and hence minimize the associated sedimentation and environmental problems; reduce the recurrent failure of the breaching bund;
- introducing separate gabion intakes to divert large floods directly from the canals, and the Wadi when, for example, the breaching bund fails, to the farthest midstream and the most downstream Emedenay/Ede-Eket fields. The Wadi Laba farmers are familiar with the construction and maintenance needs of gabion structures;
- converting the Ede-Abay Agim Knsal into a rejection weir and the earthen Musghas downstream of the Agim into gabions. This will not restore the upstream status of the Ede-Abay farmers, but can enable the farmers to continue to use the offtake they constructed in 2003 to divert supplementary water with less collateral damage to the downstream Musghas;
- raising the crest level of the rejection weir with earthen/brushwood materials to avoid unnecessary loss of water due to the filling of the gravel trap at the middle of the flood season.
The following additional measures and these are based on the final Residual Soil Moisture (RSMf) simulation results obtained from the SWAM (Chapter 6), could supplement the above noted technical interventions with regard to the improvement of the supply and distribution of flood water:
- limiting the maximum number of irrigation turns to two. This could have saved 7.75 million m3 from the 1,550 ha that were irrigated thrice in the excellent year 2004. This amount can sufficiently irrigate 775 ha.
- modifying the existing water right on sequence to: regardless of the size of the floods, if upstream and midstream fields receive two turns by mid to end of July, the floods would have to be allowed to flow downstream. This could make it possible for the midstream and downstream fields to utilize medium and smaller floods. These floods, according to the 1992 to 2004 record (Table 5.1), accounted for 77% of the total 229 floods that occurred.
It is important to note that enforcing the presented flood water management improvement measures may only at best achieve the set targets at an average and better flood seasons. In the dry flood seasons, which accounted for 25% of the time in the period 1992 to 2004, when there has not been sufficient water to irrigate the whole area and when at most one or two large floods that can reach the downstream area have occurred, attainment of the targets necessarily requires supplementing the flood water with groundwater. To the present day, there is no groundwater abstraction in the Wadi Laba area, except for drinking purposes from a few scattered shallow wells on the banks of the Wadi. Some of these wells are highly saline (> 3 dS m-1) whereas others are of good quality (< 1 dS m-1). The groundwater potential (quantity and quality) has not been systematically studied - it is worthy making investment to that end.

112 A Tradition in Transition: Water Management Reforms and Spate Irrigation Systems in Eritrea

Salinity and Sodicity Impact Assessment on Crop Yield and Soil Infiltration Rate 113
8 Salinity and Sodicity Impact Assessment on Crop Yield and Soil Infiltration Rate
The main hypothesis tested and the research questions addressed in this chapter are:
Hypothesis - all the flashfloods supplied by the Wadi Laba upper catchment, irrespective of their
discharges, supply good quality - non saline and non sodic - irrigation water, which does not incur yield reduction of the major crops, being sorghum and maize; and cause soil infiltration restrictions.
Research questions - what are the rootzone soil salinity and sodicity levels that can be induced by a long-term
(15 to 20 years) use of the different categories of Wadi Laba floods? - what is the impact, if any, of the rootzone soil salinity and sodicity on sorghum and maize
crop yields and the infiltration rates of the Wadi Laba irrigated fields? - which, if necessary, land, water and crop management practices could be put in place to
minimize salinity and sodicity problems at field level?
This chapter also discusses an alternative approach for assessing irrigation induced sodicity build up in the soil profile and its effects on infiltration rate and crop yield.
8.1 Introduction
The water management reforms introduced in the Wadi Laba to double crop production by increasing the annually irrigated area from 1,200 to 2,600 ha mainly focused on water ‘quantity’ management. Water ‘quality’ management has been ignored and the risk of soil salinization and sodium build-up has not been adequately assessed. Salinity and sodicity are among the major problems threatening the sustainability of irrigated agriculture; particularly in the arid and semi-arid regions of the world to which the Wadi Laba area belongs. Of the current 270 million ha of irrigated area, 60 million ha (22%) are salt-affected soils (Hofwegen and Svendsen, 2000). The term salt-affected refers to saline or sodic soils.
Salinity and sodicty problems exist if salts accumulate in the rootzone to a concentration that adversely affects crop growth; make soils difficult to work; and even induce an irreversible damage to the soil structure significantly curbing infiltration rate (Maas and Grattan, 1999). Water soluble and readily transportable salts are the ones that contribute to a salinity problem. Generally, in irrigated areas, these salts often originate from a saline, shallow groundwater table (within 2 to 5 m of the surface), or from salts in the applied water (Ayers and Westcot, 1985; Tanji, 1990). In the Wadi Laba irrigated fields, the groundwater
114 A Tradition in Transition: Water Management Reforms and Spate Irrigation Systems in Eritrea
table lies at about 20 m (Natural Resources Consulting Engineering, 1996) and hence the only source of salinity, if any, is the flood water.
There is a shared perception among the majority of the farmers and irrigation specialists that the flash floods supplied by the Wadi Laba are a source of good quality irrigation water, which does not cause soil salinization and sodicity to a level that would reduce the yields of sorghum and maize, and limit soil infiltration rate. This assertion is merely based on the assumption that salinity and sodicity related symptoms have not been observed during the non-drought times. These symptoms are similar with that of drought, such as wilting, or a darker, bluish-green colour and sometimes thicker, waxier leaves (salinity); leaf burn, scorch and dead tissue along the outside edges of leaves (sodicity) (Ayers and Westcot, 1985). Soil salinization and sodicity can take several years to reach levels that have a noticeable effect. Moreover, moderate salt effects could go entirely unnoticed because of a uniform reduction in growth across an entire field. Therefore, could it be that the moderately-large and smaller floods (< 100 m3 s-1) that have been mainly utilized in the indigenous Wadi Laba system have low or at most medium salinity levels? And do the large (> 100 m3 s-1) floods that have been utilized since 2000 following the replacement of the indigenous earthen/brushwood structures with concrete headworks have medium to high salinity, but that the time of their utilization has been too short to have a noticeable impact? To address these questions, systematic salinity and sodicity analysis of the floods was undertaken and the results are presented and discussed in this Chapter.
8.2 Salinities of the Flood Water and the Suspended Sediments
Of the 41 medium and larger floods that occurred during the 2002, 2003 and 2004 flood seasons (Table 5.1), the discharges of 28 floods were measured using the velocity-area method (Chapter 5). Since every two of the measured 18 medium floods had almost the same discharge, their discharges and all their corresponding analyses results were averaged. The two very large floods (> 200 m3 s-1) were laden with debris, shrubs and trees, making velocity measurements extremely dangerous. The eight medium and three moderately large floods that occurred between 12:00 PM and 4:00 AM were not measured since, for security reasons, no one was allowed to work in the field at that time of the night. The 19 small and very small floods (Table 5.1) were not considered for measurement because they were too small to supply any water even to the upstream fields.
To determine the salinity of the Wadi Laba floods, water samples were taken at 20%, 60% and 80% of the total water depth from the surface. The samples were taken along the right bank, the deepest part of the cross-section. Eight samples were taken during the first 10 hours of the flow (Figure 5.1) - at an interval of half an hour in the first hour, then every hour for the next 3 hours and at 2 hours interval for the remaining time. They were combined to form one composite sample of 0.5 l; then the sample was thoroughly mixed and the salinity (ECw) was determined with an Electrical Conductivity (EC) meter after the value remained constant for at least five minutes. ECw increased linearly with increasing discharges (Figure 8.1): the relationship, determined by linear regression, was y = ax + b. This equation was used to estimate ECw for the very large floods (> 200 m3 s-1). The measured and estimated ECw are presented in Table 8.1.

Salinity and Sodicity Impact Assessment on Crop Yield and Soil Infiltration Rate 115
y = 0.01x + 0.12
R2 = 0.95
0.000
0.250
0.500
0.750
1.000
1.250
1.500
1.750
2.000
0 25 50 75 100 125 150 175 200
Discharge in m3 s-1
EC
w in
dS
m-1
Figure 8.1 Correlation between ECw and flood discharge (Mehari, et al., 2006)
Table 8.1 Measured and calculated ECw values of the Wadi Laba flood samples (Mehari, et al., 2006)
Flood size Discharge in m3 s-1 EC in dS m-1 **Salinity level
25 0.15
28 0.29
31 0.37
35 0.45
36 0.50
38 0.38
40 0.47
41 0.48
Medium
45 0.50
58 0.65
None
60 0.71
65 0.75
70 0.81
75 0.72
85 0.83
Moderately-large
100 0.90
Slight
120 1.33 180 1.44 Large
200 1.88
Slight to moderate
205 *2.17 225 *2.37
245 *2.57 Very large
265 *2.77
Slight to moderate
*ECw calculated from )12.001.0( += xy (Figure 8.1); ** Classification is based on the irrigation water quality
guidelines given in Table 3, Ayers and Westcot, 1985.
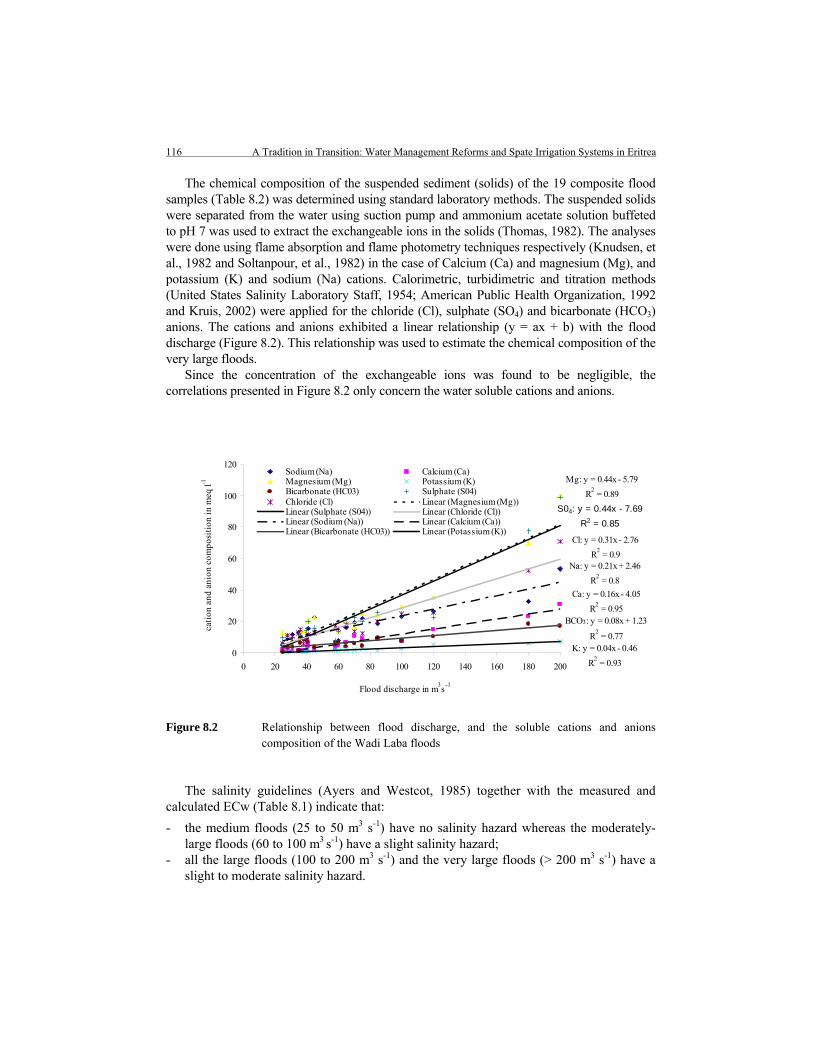
116 A Tradition in Transition: Water Management Reforms and Spate Irrigation Systems in Eritrea
The chemical composition of the suspended sediment (solids) of the 19 composite flood samples (Table 8.2) was determined using standard laboratory methods. The suspended solids were separated from the water using suction pump and ammonium acetate solution buffeted to pH 7 was used to extract the exchangeable ions in the solids (Thomas, 1982). The analyses were done using flame absorption and flame photometry techniques respectively (Knudsen, et al., 1982 and Soltanpour, et al., 1982) in the case of Calcium (Ca) and magnesium (Mg), and potassium (K) and sodium (Na) cations. Calorimetric, turbidimetric and titration methods (United States Salinity Laboratory Staff, 1954; American Public Health Organization, 1992 and Kruis, 2002) were applied for the chloride (Cl), sulphate (SO4) and bicarbonate (HCO3) anions. The cations and anions exhibited a linear relationship (y = ax + b) with the flood discharge (Figure 8.2). This relationship was used to estimate the chemical composition of the very large floods.
Since the concentration of the exchangeable ions was found to be negligible, the correlations presented in Figure 8.2 only concern the water soluble cations and anions.
Mg: y = 0.44x - 5.79
R2 = 0.89
S04: y = 0.44x - 7.69R2 = 0.85
Cl: y = 0.31x - 2.76
R2 = 0.9
Na: y = 0.21x + 2.46
R2 = 0.8
Ca: y = 0.16x - 4.05
R2 = 0.95
BCO3: y = 0.08x + 1.23
R2 = 0.77
K: y = 0.04x - 0.46
R2 = 0.93
0
20
40
60
80
100
120
0 20 40 60 80 100 120 140 160 180 200
Flood discharge in m3s
-1
cati
on a
nd a
nion
com
posi
tion
in m
eq l
-1
Sodium (Na) Calcium (Ca)Magnesium (Mg) Potassium (K)Bicarbonate (HC03) Sulphate (S04)Chloride (Cl) Linear (Magnesium (Mg))Linear (Sulphate (S04)) Linear (Chloride (Cl))Linear (Sodium (Na)) Linear (Calcium (Ca))Linear (Bicarbonate (HC03)) Linear (Potassium (K))
Figure 8.2 Relationship between flood discharge, and the soluble cations and anions composition of the Wadi Laba floods
The salinity guidelines (Ayers and Westcot, 1985) together with the measured and calculated ECw (Table 8.1) indicate that:
- the medium floods (25 to 50 m3 s-1) have no salinity hazard whereas the moderately-large floods (60 to 100 m3 s-1) have a slight salinity hazard;
- all the large floods (100 to 200 m3 s-1) and the very large floods (> 200 m3 s-1) have a slight to moderate salinity hazard.

Salin
ity a
nd S
odic
ity I
mpa
ct A
sses
smen
t on
Cro
p Y
ield
and
Soi
l Inf
iltra
tion
Rat
e 11
7
Tabl
e 8.
2 M
easu
red
chem
ical
com
posi
tion
of th
e sa
tura
tion
extr
act o
f the
sus
pend
ed s
edim
ents
of t
he d
iffe
rent
Wad
i Lab
a fl
ood
cate
gori
es
(Meh
ari,
et a
l., 2
006)
As c
ompa
red
to th
e ty
pica
l ana
lytic
al d
ata
for d
iffer
ent s
alt a
ffect
ed so
ils (S
med
ema,
et a
l., 2
004)
; * a
re n
on sa
line
wher
e as
**
are s
alin
e. *
** C
hem
ical
com
posit
ion
estim
ated
from
Fig
ure
8.2
Floo
d ca
tego
ry
Dis
char
ge
(m3 s
-1)
Sodi
um
(Na)
C
alci
um (
Ca)
M
agne
sium
(M
g)
Pota
ssiu
m
(K)
Tot
al
catio
ns
Bic
arbo
nate
(H
C0 3
) Su
lpha
te
(SO
4)
Chl
orid
e (C
l)
Tot
al a
nion
s
meq
l-1
25.0
5.
1 2.
3 12
.8
0.7
20.9
0.
5 9.
5 5.
6 15
.6
28.0
9.
3 1.
8 10
.8
0.6
22.5
3.
5 11
.4
11.3
26
.2
31.0
11
.7
0.7
7.9
1.0
21.3
3.
8 9.
4 10
.5
23.7
35
.0
13.0
1.
4 9.
0 1.
1 24
.5
1.3
12.5
12
.6
26.4
36
.0
10.3
1.
4 12
.3
1.1
25.1
6.
4 10
.8
14.8
32
.0
38.0
8.
3 1.
5 13
.8
1.0
24.6
8.
4 8.
6 5.
9 22
.9
40.0
9.
6 1.
4 13
.6
1.3
25.9
8.
0 14
.5
7.5
30.0
41
.0
15.2
4.
4 20
.0
1.1
40.7
6.
8 19
.5
11.8
38
.1
Med
ium
45.0
22
.3
1.6
22.2
1.
1 47
.2
3.5
15.8
12
.5
31.8
A
vera
ge
35.4
11
.6
1.8
13.6
1.
0 *2
8.1
4.7
12.4
10
.3
*27.
4 58
.0
4.0
3.2
16.9
1.
6 25
.7
6.8
7.6
16.8
31
.2
60.0
7.
5 4.
9 13
.5
1.3
27.2
6.
5 13
.4
15.3
35
.2
65.0
16
.2
6.5
19.6
1.
7 44
.0
4.0
21.6
18
.1
43.7
70
.0
19.3
10
.8
16.6
1.
9 48
.6
5.8
22.4
13
.5
41.7
75
.0
21.3
8.
9 25
.1
2.5
57.8
4.
3 19
.9
12.3
36
.5
85.0
18
.5
8.6
23.9
1.
4 52
.4
9.2
25.5
19
.8
54.5
Mod
erat
ely
-lar
ge
100.
0 23
.0
7.5
29.0
2.
7 62
.2
7.5
23.3
24
.6
55.4
A
vera
ge
73.3
15
.7
7.2
20.7
1.
9 *4
5.4
6.3
19.1
17
.2
**42
.6
120.
0 26
.5
15.0
35
.3
5.4
82.2
10
.3
22.5
25
.7
58.5
18
0.0
32.8
23
.5
69.8
6.
0 13
2.1
18.4
77
.3
52.5
14
8.2
Lar
ge
200.
0 53
.3
30.8
99
.7
7.2
191.
0 17
.1
98.5
70
.9
186.
5 A
vera
ge
166.
7 37
.5
23.1
68
.3
6.2
**13
5.1
15.3
66
.1
49.7
**
131.
1 20
5 45
.5
28.8
84
.4
7.7
166.
4 17
.6
82.5
60
.8
160.
9 22
5 49
.7
32.0
93
.2
8.5
183.
4 19
.2
91.3
67
.0
177.
5 24
5 53
.9
35.2
10
2.0
9.3
200.
4 20
.8
100.
1 73
.2
194.
1 **
*Ver
y la
rge
265
58.1
38
.4
110.
8 10
.1
217.
4 22
.4
108.
9 79
.4
210.
7 A
vera
ge
235
51.8
33
.6
97.6
8.
9 19
1.9
20.0
95
.7
70.1
**
185.
8

118 A Tradition in Transition: Water Management Reforms and Spate Irrigation Systems in Eritrea
The high salinity of the large floods may be attributed to the composition of the Wadi Laba upper catchment. Another reason could be the salinization of the wadi banks consequent to the wetting by the frequent small floods and the subsequent concentration of salts as the banks dry. As the flow increases, erosion of the banks and in turn, the suspended solids in the flow increase and the dissolution of the entrained salts on and within the suspended solids.
According to the interviews held with the farmers and personal observations during a number of flood events, floods with a discharge greater than 50 m3 s-1 occur when there is rainfall on the highest altitudes (3,000 m+MSL). Floods with a discharge between 10 and 50 m3 s-1 happen when the hilly sections of the catchment at low to medium altitude (1,000 to 2,000 m+MSL) receive rainfall. The high salinity level in the large floods indicates that the mountainous area is relatively richer in salt bearing minerals than the hilly areas. This is not a wild assumption. As compared to the typical analytical data for different types of salt-affected soils (Smedema et al., 2004), the chemical composition of the large floods (Table 8.2) suggests that the floods originated from a saline area. The content of each of the cations (Ca++, Mg++, Na+ and K+) and anions (Cl-, SO-
4 and HCO-3) in the sediment was found to be greater
than 130 meq l-1. Cl- and SO-4, the two major sources of salinity accounted for nearly 66 and
50 meq l-1 respectively. It has to be noted that the high sediment load that exceeds 60,000 ppm may have also contributed to the higher salinity content of the large floods.
8.3 Average Soil Water Salinity in the Rootzones of Sorghum and Maize
Following irrigation with saline water, salt concentration builds up due to plants extracting water but leaving salts behind in a greatly reduced volume of soil-water. As crops use water, the upper rootzone becomes depleted and the zone of readily available water moves toward the deeper parts as the time interval between irrigations is extended. The crop does not respond to the extreme low or high salinity levels in the root zone but integrates water availability and takes water from wherever it is most readily available. For crops irrigated infrequently, as is normal in spate irrigation systems, the crop yield is best correlated with the average soil-water salinity of the rootzone (ECe) (Shalhevet, 1994 and Grattan, 1999).
The five-point method (Ayers and Westcot, 1985) was used to estimate the ECe from the ECw in Table 8.1. When using this method the following basic assumptions have been made:
- the soil profile, till the 2 m effective root zone depth of sorghum and maize, has four quarters (Figure 8.3) with a crop water use pattern of 40-30-20-10%. This means the crop will get 40% of its ET demand from the upper quarter of the root zone, 30% from the next quarter, 20% from the next, and 10% from the lowest quarter. Crop water use will increase the salt concentration of the soil-water, which drains into the next quarter of the rootzone;
- the rainfall is not a source of water for the crop, sufficient water has been applied to establish a steady state salinity distribution within each quarter during the whole crop season, and that the salinity of the applied water does not change with time.

Salinity and Sodicity Impact Assessment on Crop Yield and Soil Infiltration Rate 119
ECsw1
ECsw2
ECsw3
ECsw4
S org
hum
/mai
ze e
ffec
tive
root
dep
th,
2 m
1st quarter
2 nd quarter
3 rd quarter
4 th quarter
Drainage water, ECsw4
Soil surface ECsw0
Soil surface
Figure 8.3 Layout of the soil profile quarters and the five salinity measurement points (Ayers and Westcot, 1985)
ECe was found by taking the average of the soil-water salinities estimated at five points in the rootzone. These are: soil water salinities at the soil surface, ECsw0; bottom of the upper quarter, ECswl; bottom of the second quarter, ECsw2; bottom of the third quarter, ECsw3 and bottom of the fourth quarter or the soil-water draining from the root zone, ECsw4 (Figure 8.3). Estimation of the soil water salinities required determination of leaching fractions based on the total applied amount of water and the evapotranspiration, ETc. The maximum annual ETc for an optimum crop yield is approximately 822 mm (Chapter 6). Based on this ETc and a reasonable range in depths of applied water, a choice of leaching fractions, LF, from 0.1 to 0.3 seems to be realistic. This range in LF is consistent with the present irrigation practices in Wadi Laba. The farmers consider a certain field to be ‘fully’ irrigated if it receives at least three irrigation turns of 50 cm depth. According to simulation with the SWAP model (Chapter 6), in a field irrigated thrice, total water loss due to evaporation was on average 90 mm. Therefore, an applied water depth that contributes to leaching, 1,410 mm (1,500 -90) and the maximum ETc of 822 mm result in a leaching fraction of about 0.4 ((1,410 – 822)/1,410). A ‘partially’ irrigated field gets one to two turns of 50 cm depth each, which result in a leaching fraction of 0.1 ((930-822)/930). The water loss due to evaporation obtained from the SWAP model was on average 70 mm.
Below is an example of estimating the soil water salinities using the 0.1 LF for the 25 m3 s-1 discharge flood with an ECw of 0.15 dS m-1.
Step 1: The applied water (AW), which needs to meet both the ETc (822 mm) and the LF (0.1) was determined from Equation 8.1.
mmLF
ETAW 9131
=−
= (8.1)

120 A Tradition in Transition: Water Management Reforms and Spate Irrigation Systems in Eritrea
Step 2: The salinity of the soil-water draining from the bottom of each root zone quarter was obtained by determining the leaching fraction for that quarter (Equation 8.2) and then calculating the soil-water salinity using Equation 8.3.
appliedWaterleachedWaterLF = (8.2)
Using Equation 8.2, the leaching fraction at the bottom of the first quarter,
64.0913
)822(4.09131 =−=LF
mdSLFECwECsw /23.01
1
== (ECw = 0.15) (8.3)
Step 2 was repeated to calculate ECsw2, ECsw3 and ECsw4. Since, at the surface, the ‘water leached’ and the ‘water applied’ (Equation 8.2) are nearly equal, ECsw0 is assumed to be the same as ECw. The ECe ((ECw0+.....+ECsw4)/5) values are presented in Table 8.3.
8.4 Impact of Average Soil Water Salinity on Sorghum and Maize Yield
Yield reductions occur when salts accumulate in the root zone causing water stress for a significant period of time to such an extent that the crop is no longer able to extract sufficient water. The long-term impact of ECe on the grain yields of sorghum and maize (Table 8.3) was assessed by using Equation 8.4 (Maas and Grattan, 1999).
)(100 tECsY er −−= (8.4)
where Yr is crop yield relative to the maximum crop yield for non-saline conditions in %, t is the threshold salinity in dS m-1 above which yield reduction occurs, s is yield loss per unit increase in salinity beyond t in % per dS m-1, ECe is average salinity of a saturated paste extract in the rootzone in dS m-1.
For the same crop, there are different s and t figures developed (Ayers and Westcot, 1985 and Maas and Grattan, 1999) to reflect the various climatic factors under which the crop is grown. Most crops can tolerate greater salt stress if the weather is cool and humid than when it is hot and dry. To get the most accurate estimate of the possible yield reduction, the s and t values after Maas and Grattan (1999) were used in this research. These values were developed for hot-arid coastal areas, which have similar climatic conditions to that of the Wadi Laba irrigated area. According to Maas and Grattan (1999), sorghum belongs to the moderately salt-tolerant group and has t and s values of 6.8 dS m-1 and 16% per dS m-1 respectively;
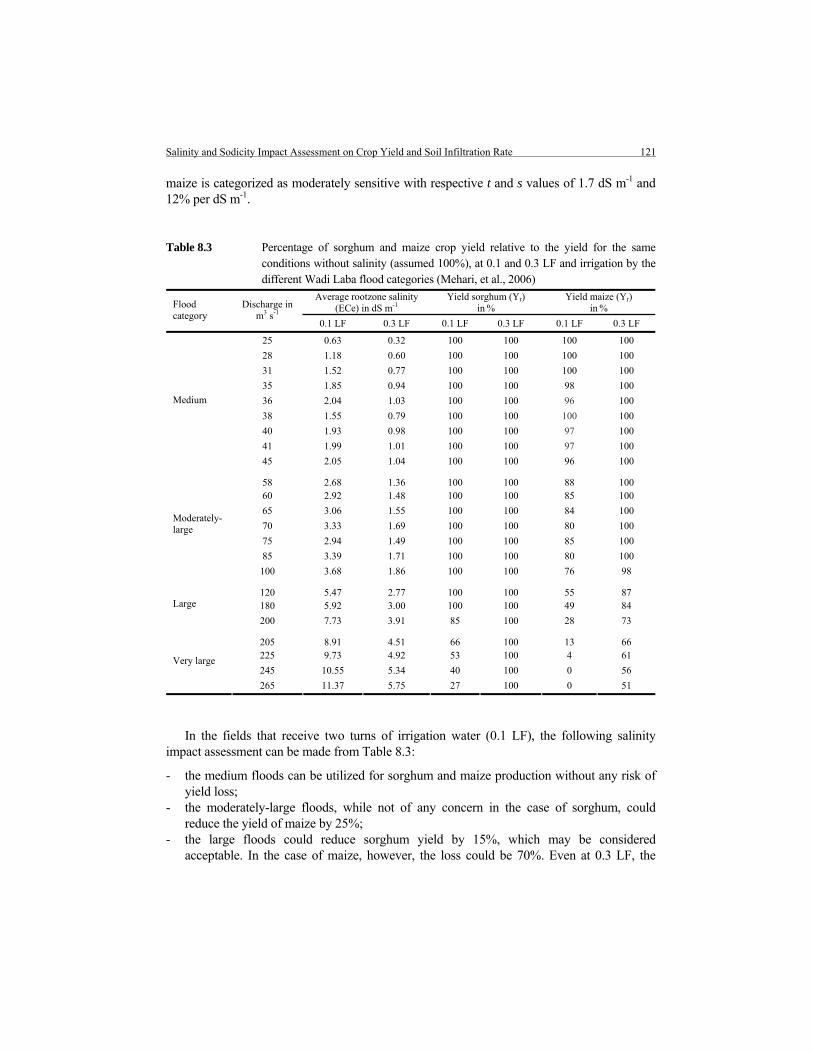
Salinity and Sodicity Impact Assessment on Crop Yield and Soil Infiltration Rate 121
maize is categorized as moderately sensitive with respective t and s values of 1.7 dS m-1 and 12% per dS m-1.
Table 8.3 Percentage of sorghum and maize crop yield relative to the yield for the same conditions without salinity (assumed 100%), at 0.1 and 0.3 LF and irrigation by the different Wadi Laba flood categories (Mehari, et al., 2006)
Average rootzone salinity (ECe) in dS m-1
Yield sorghum (Yr)
in % Yield maize (Yr)
in % Flood category
Discharge in m3 s-1
0.1 LF 0.3 LF 0.1 LF 0.3 LF 0.1 LF 0.3 LF
25 0.63 0.32 100 100 100 100
28 1.18 0.60 100 100 100 100
31 1.52 0.77 100 100 100 100
35 1.85 0.94 100 100 98 100
36 2.04 1.03 100 100 96 100
38 1.55 0.79 100 100 100 100
40 1.93 0.98 100 100 97 100
41 1.99 1.01 100 100 97 100
Medium
45 2.05 1.04 100 100 96 100
58 2.68 1.36 100 100 88 100 60 2.92 1.48 100 100 85 100
65 3.06 1.55 100 100 84 100
70 3.33 1.69 100 100 80 100
75 2.94 1.49 100 100 85 100
85 3.39 1.71 100 100 80 100
Moderately-large
100 3.68 1.86 100 100 76 98
120 5.47 2.77 100 100 55 87 180 5.92 3.00 100 100 49 84 Large
200 7.73 3.91 85 100 28 73
205 8.91 4.51 66 100 13 66 225 9.73 4.92 53 100 4 61
245 10.55 5.34 40 100 0 56 Very large
265 11.37 5.75 27 100 0 51
In the fields that receive two turns of irrigation water (0.1 LF), the following salinity impact assessment can be made from Table 8.3:
- the medium floods can be utilized for sorghum and maize production without any risk of yield loss;
- the moderately-large floods, while not of any concern in the case of sorghum, could reduce the yield of maize by 25%;
- the large floods could reduce sorghum yield by 15%, which may be considered acceptable. In the case of maize, however, the loss could be 70%. Even at 0.3 LF, the

122 A Tradition in Transition: Water Management Reforms and Spate Irrigation Systems in Eritrea
floods could incur a yield loss of 25% and may thus be considered unsuitable for maize production;
- the very large floods could cause 75% and 100% yield reduction of sorghum and maize respectively. These floods may be used for sorghum production only in those fields that receive three irrigation turns. They are not suitable for maize since even at 0.3 LF, the salinity in the rootzone will halve the yield.
The presented analysis, however, assumes that a field is irrigated by one single flood-category. Although the practicality of this assumption cannot be ruled out, the relatively more likely event is that a field is irrigated by a combination of two or three different flood categories. The water management reforms that replaced the indigenous structures with modern headworks have not changed the indigenous water rights and water-sharing arrangements. Therefore, one needs to consider the consequences of the indigenous water right on sequence (Chapter 5) in the salinity assessment. This water right allocates the small and medium floods, and occasionally the moderately-large floods to the upstream fields; the moderately-large and sometimes the large floods to the midstream fields, and the large and very large floods to the downstream fields. Based on these allocations some additional salinity impacts can be deduced (Table 8.3):
- sorghum and maize yields in the upstream fields will not decline regardless of whether they are irrigated twice or three times;
- sorghum yield in the midstream fields that receive two irrigation turns may not decrease, but maize yield could decline by 30% to 50%. If the fields get three irrigation turns, the maximum maize yield loss would be about 10%, assuming that two thirds of the yield come from the moderately-large and one third from the large floods;
- the downstream fields will be the most affected fields by salinity. With two irrigation turns using only very large floods, the sorghum and maize yields may decrease 70% and 100% respectively; if equal quantities of large and very large floods are utilized, the yield losses could be 45% and 85%, while if only large floods are used, the losses could be 15% and 70%. With three irrigation turns, there would be no sorghum yield losses; but the maize yield could decline by 50% when very large floods would be the only source, 35% and 45% if large and very large floods are applied in a 2:1 and 1:2 ratios; and 30% if the large floods should supply all three irrigation turns.
This analysis shows that a strict adherence to the existing water sharing arrangements could contribute to high maize and sorghum yield losses in the downstream fields. However, violation of the present arrangements could have a much larger negative effect. Currently, water is distributed on a field-to-field basis (Chapter 3) and this is convenient for the upstream farmers to utilize the few large floods, especially in times of drought. This practice leaves many downstream fields dry and at best, partially irrigated, thereby exposing them to the highest yield losses. Increasing the irrigation gift from 50 to 60 cm, a two irrigation turn would provide almost a 0.3 LF and hence lower the impact of salinity, while making considerable water saving. For instance, 4.7 million m3 could have been saved from the 1,550 ha that were irrigated thrice in 2004. If this amount of water, which can irrigate an additional 390 ha, is to have a chance of reaching the downstream, however, the measures that would have to be taken may include:
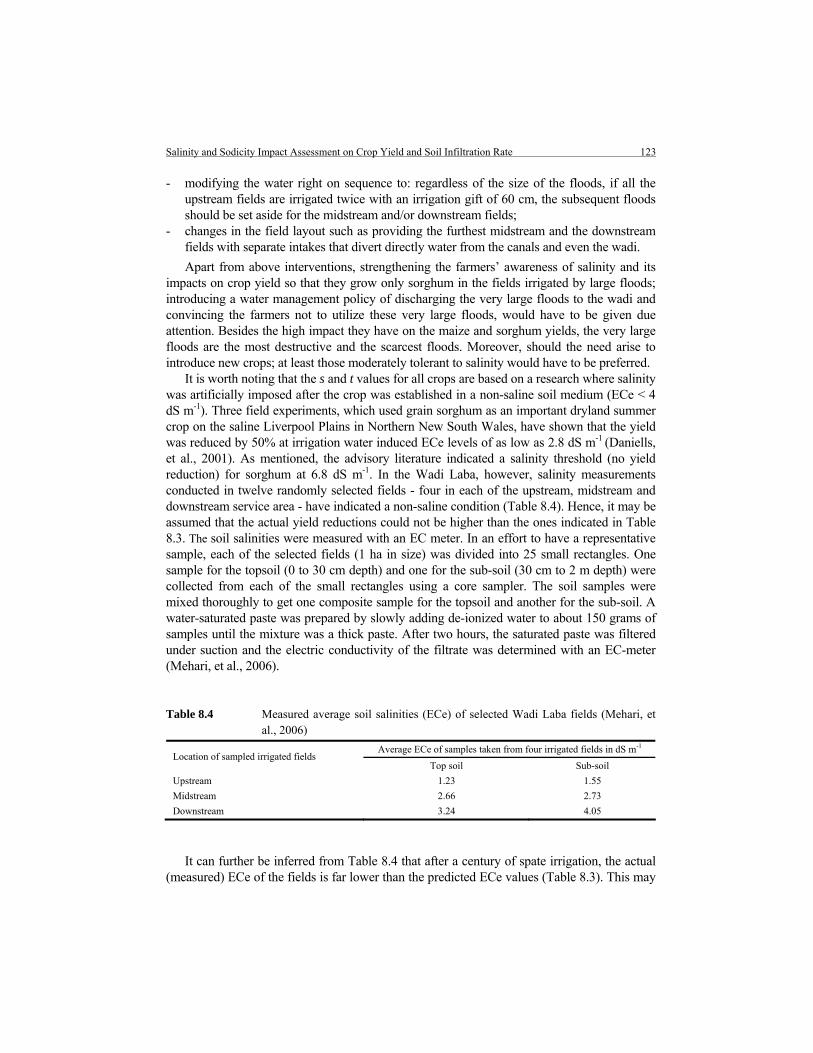
Salinity and Sodicity Impact Assessment on Crop Yield and Soil Infiltration Rate 123
- modifying the water right on sequence to: regardless of the size of the floods, if all the upstream fields are irrigated twice with an irrigation gift of 60 cm, the subsequent floods should be set aside for the midstream and/or downstream fields;
- changes in the field layout such as providing the furthest midstream and the downstream fields with separate intakes that divert directly water from the canals and even the wadi.
Apart from above interventions, strengthening the farmers’ awareness of salinity and its impacts on crop yield so that they grow only sorghum in the fields irrigated by large floods; introducing a water management policy of discharging the very large floods to the wadi and convincing the farmers not to utilize these very large floods, would have to be given due attention. Besides the high impact they have on the maize and sorghum yields, the very large floods are the most destructive and the scarcest floods. Moreover, should the need arise to introduce new crops; at least those moderately tolerant to salinity would have to be preferred.
It is worth noting that the s and t values for all crops are based on a research where salinity was artificially imposed after the crop was established in a non-saline soil medium (ECe < 4 dS m-1). Three field experiments, which used grain sorghum as an important dryland summer crop on the saline Liverpool Plains in Northern New South Wales, have shown that the yield was reduced by 50% at irrigation water induced ECe levels of as low as 2.8 dS m-1 (Daniells, et al., 2001). As mentioned, the advisory literature indicated a salinity threshold (no yield reduction) for sorghum at 6.8 dS m-1. In the Wadi Laba, however, salinity measurements conducted in twelve randomly selected fields - four in each of the upstream, midstream and downstream service area - have indicated a non-saline condition (Table 8.4). Hence, it may be assumed that the actual yield reductions could not be higher than the ones indicated in Table 8.3. The soil salinities were measured with an EC meter. In an effort to have a representative sample, each of the selected fields (1 ha in size) was divided into 25 small rectangles. One sample for the topsoil (0 to 30 cm depth) and one for the sub-soil (30 cm to 2 m depth) were collected from each of the small rectangles using a core sampler. The soil samples were mixed thoroughly to get one composite sample for the topsoil and another for the sub-soil. A water-saturated paste was prepared by slowly adding de-ionized water to about 150 grams of samples until the mixture was a thick paste. After two hours, the saturated paste was filtered under suction and the electric conductivity of the filtrate was determined with an EC-meter (Mehari, et al., 2006).
Table 8.4 Measured average soil salinities (ECe) of selected Wadi Laba fields (Mehari, et al., 2006)
Average ECe of samples taken from four irrigated fields in dS m-1 Location of sampled irrigated fields
Top soil Sub-soil
Upstream 1.23 1.55
Midstream 2.66 2.73
Downstream 3.24 4.05
It can further be inferred from Table 8.4 that after a century of spate irrigation, the actual (measured) ECe of the fields is far lower than the predicted ECe values (Table 8.3). This may

124 A Tradition in Transition: Water Management Reforms and Spate Irrigation Systems in Eritrea
not be due to an allocation of larger amounts of water for leaching than that used in Table 8.3. As acknowledged by the farmers, even during an excellent flood season that has a probability of occurrence of only 25% (Table 5.1), a maximum of 80% of all the Wadi Laba fields have been fully irrigated. The more reasonable explanation may thus be that till the year 2000 the Wadi Laba system relied on earthen and brushwood diversion structures that could withstand (without failing) floods of a maximum of 100 m3 s-1. Thus, the large and very large floods, which are relatively rare in occurrence as compared to the other flood categories, may have only seldom made their way to the fields.
8.5 Hazard Assessment of Sodium Toxicity
Sodicity affects plant growth in two ways: it causes toxicity and poor soil infiltration rates. The toxicity part is discussed in this section; the infiltration aspect will be addressed in the next section.
A toxicity problem is different from a salinity problem in that it occurs within the plant itself and is not caused by water shortage. Sodium toxicity normally results when sodium ions are taken up with the soil-water and accumulate in the leaves during water transpiration to an extent that this results in damage to the plant. The degree of damage depends upon time, concentration, crop sensitivity and crop water use, and if damage is severe enough, crop yield is reduced (Ayers and Westcot, 1985). An extended period of time (months or even years) is normally required before accumulation reaches toxic concentrations. Leaf tissue analysis is commonly used to confirm or monitor sodium toxicity but when the focus is to assess and predict the degree of sodium toxicity that might develop in the plants due to only irrigation, as is the case here, soil-water analyses would have to be carried out.
The basic parameter used to evaluate the sodium toxicity hazard induced by long term (15 to 20 years) use of irrigation water is the SAR (Sodium Adsorption Ratio), and is given by Equation 8.5 (Richards, 1954).
2mgCa
NaSAR+
= (8.4)
where SAR is Sodium Adsorption Ratio, Na is sodium in water in meq l-1, Ca is calcium in water in meq l-1, Mg is magnesium in water in meq l-1.
The Ca, Mg and Na concentrations of all the 19 Wadi Laba flood samples were measured using the earlier mentioned flame absorption and flame emission photometry. A good linear correlation was obtained between the flood discharge and the measured Ca, Mg and Na concentrations of the medium, moderately-large and large floods (Figure 8.4). The equations
)( baxy += in Figure 8.4 were used to estimate the Ca, Mg and Na concentrations of the
very large floods.

Salinity and Sodicity Impact Assessment on Crop Yield and Soil Infiltration Rate 125
y = 0.04x - 0.46
R2 = 0.80
y = 0.09x + 1.11
R2 = 0.75
y = 0.13x - 3.78
R2 = 0.83
0
5
10
15
20
25
0 20 40 60 80 100 120 140 160 180 200
Discharge in m3 s-1
Na.
Ca
and
Mg
conc
entr
atio
ns in
meq
l-1
Na concentration in meq/lCa concentration in meq/lMg concentration in mqe/lLinear (Na concentration in meq/l)Linear (Mg concentration in mqe/l)Linear (Ca concentration in meq/l)
Figure 8.4 Discharge - sodium (Na), calcium (Ca) and magnesium (Mg) correlation
All the Wadi Laba flood categories have SAR values less than 3 meq l-1 (Table 8.5), which, according to the toxicity guidelines (Ayers and Westcot, 1985) indicates that the long term use of the floods would not incur sodium toxicity to plants. Although the large and very large floods have high Na concentrations, their Ca and Mg contents are sufficient enough to neutralize the Na effect.
Another commonly used toxicity assessing parameter is the ESP (Exchangeable Sodium Percentage). ESP is a measure of the preponderance of sodium in the cation exchange complex of the soil and is related to SAR by Equation 8.6 (Ayers and Westcot, 1985). In simple terms, the difference between ESP and SAR is that the former measures sodicity in the soil, and the latter in water.
9874.001475.0
)0126.001475.0(100
+−=
SARSARESP (8.6)
Using Equation 8.6 the maximum ESP obtained for the very large floods (see SAR values in Table 8.5) was 1.6%. According to Ayers and Westcot (1985), crops are categorized into sensitive (including maize), semi-tolerant (comprising sorghum) and tolerant if they develop toxicity symptoms at ESP of 5 to 15, 15 to 40, and greater than 40% respectively. Therefore, the long-term use of all the Wadi Laba floods is unlikely to lead to toxicity levels that can result in maize and sorghum yield reductions.

126 A Tradition in Transition: Water Management Reforms and Spate Irrigation Systems in Eritrea
Table 8.5 SAR values of Wadi Laba flood samples obtained from measured and estimated Sodium (Na), Calcium (Ca) and Magnesium (Mg) concentrations
Na concentration Ca concentration Mg concentration Flood
category
Discharge
in m s-1 mg l-1 *meq l-1 mg l-1 *meq l-1 mg l-1 *meq l-1
SAR
25 16 0.7 46 2.3 1 0.1 0.64
28 14 0.6 36 1.8 100 8.3 0.27
31 23 1.0 14 0.7 80 6.7 0.52
35 25 1.1 28 1.4 36 3.0 0.74
36 25 1.1 28 1.4 100 8.3 0.50
38 23 1.0 30 1.5 40 3.3 0.65
40 30 1.3 28 1.4 40 3.3 0.85
41 25 1.1 88 4.4 50 4.2 0.53
Medium
45 25 1.1 32 1.6 28 2.3 0.79
58 37 1.6 38 1.9 48 4.0 0.93 60 30 1.3 42 2.1 90 7.5 0.59
65 39 1.7 50 2.5 50 4.2 0.93
70 44 1.9 30 1.5 100 8.3 0.86
75 58 2.5 78 3.9 88 7.3 1.06
85 32 1.4 44 2.2 38 3.2 0.85
Moderately
-large
100 62 2.7 150 7.5 160 13.3 0.84
120 124 5.4 300 15.0 180 15.0 1.39 180 138 6.0 380 19.0 190 15.8 1.44 Large
200 166 7.2 468 23.4 220 18.3 1.58
205 178 7.7 457 22.9 235 19.6 1.68 225 196 8.5 509 25.5 256 21.4 1.76
245 215 9.3 561 28.1 278 23.2 1.85
Very
large**
265 233 10.1 613 30.7 300 25.0 1.92
*Milli-equivalent per litre (meq l-1) = milligram/litre (mg l-1)/equivalent weight. Equivalent weight of an element is its atomic weight/ its valence. The equivalent weighs of Na, Mg and Ca are 23/1, 24/2 and 40/2g respectively; **Estimated from the linear equations )( baxy += in Figure 8.4.
8.6 Analyses of Sodium Induced Infiltration Restrictions
The role of high sodium concentrations in resulting in poor soil infiltration rate can be understood by looking into the binding mechanisms involving the negatively charged colloidal clays and organic matter of the soil; the associated ‘envelope’ of the electro-statically adsorbed cations; and the manner in which exchangeable sodium electrolyte concentrations affect this interaction (Ritzema, 1994). The counter-ions in the ‘envelop’ are subject to two opposing processes: they are attracted to the negatively charged clay and organic matter surfaces by electrostatic forces; they tend to diffuse away from these surfaces, where their concentration is higher, into a bulk of the solution where their concentration is generally lower. These two opposing processes result in an approximately exponential decrease in counter-ion concentration with distance from the surfaces in the bulk solution (Ritzema, 1994). Divalent cations, like calcium and magnesium are attracted

Salinity and Sodicity Impact Assessment on Crop Yield and Soil Infiltration Rate 127
to negatively charged surfaces with a force twice as great as monovalent cations like sodium. Hence, the cation ‘envelope’ in the divalent system is more compressed towards the particle surfaces.
The associations of individual clay and silt particles and organic matter with each other and with other particles to form aggregates are diminished when the cation ‘envelope’ is expanded (with reference to the surface particles) and are enhanced when it is compressed. As the packing of aggregates is more porous than that of individual particles, the infiltration rate is higher in aggregate conditions and hence in soils where sodium concentrations relative to that of calcium and magnesium are low. High sodium content of soil-water can reduce the infiltration rate by up to 20% (Rhoades, 1982 and Ritzema, 1994), thus depriving the crop of sufficient supply of water between irrigations.
Sodicity and salinity would have to be considered together to make a proper evaluation of the effect of irrigation water on soil infiltration rate. This is because, like water with high sodium content, low salinity water (less than 0.5 dS m-1) and especially below 0.2 dS m-1 has a soil-dispersing effect. Irrigation water with low salt content is corrosive and tends to leach surface soils free of soluble minerals and salts, especially calcium, reducing their strong stabilizing influence on soil aggregates and soil structure (Ayers and Westcot, 1985). Very low salinity water (ECw < 0.2 dS m-1) almost invariably results in water infiltration problems, regardless of its sodicity level.
Although the SAR has been the most widely applied method to evaluate irrigation water induced soil infiltration problem, in many recent reports and journal articles, it is increasingly becoming reported as RNa (adjusted Sodium Adsorption Ratio). Unlike the SAR, the RNa takes into account changes in calcium in the soil water that occur because of changes in solubility of calcium resulting from precipitation or dissolution during or following an irrigation. Sodium always remains soluble. Whether concentrated from withdrawal of water by the crop between long irrigation intervals, diluted with applied water, or leached away in drainage, outside influences have little effect on sodium solubility or precipitation (Ayers and Westcot, 1985 and Shalhevet, 1994). Calcium, however, does not remain completely soluble or in constant supply but is continuously changing until an equilibrium is established. Calcium changes occur due to dissolution of soil minerals into the soil-water thus raising its calcium content, or because of precipitation from soil-water, usually as calcium carbonate, thus reducing the calcium. Dissolution is encouraged by dilution and by carbon dioxide dissolved in the soil-water. Precipitation may take place because of the presence of sufficient calcium along with enough carbonate, bicarbonate or sulphate to exceed the solubility of calcium carbonate (limestone) or calcium sulphate (gypsum). Soon after irrigation, dissolution or precipitation may occur, changing the supply of calcium and establishing equilibrium at a new calcium concentration, different to that in the applied water.
Therefore, owing to the above presented facts, besides the SAR, the RNa was used to assess the impact of the different categories of the Wadi Laba floods as far as the infiltration capacity of the irrigated fields is concerned. The RNa was calculated using Equation 8.7 (Suarez, 1981).
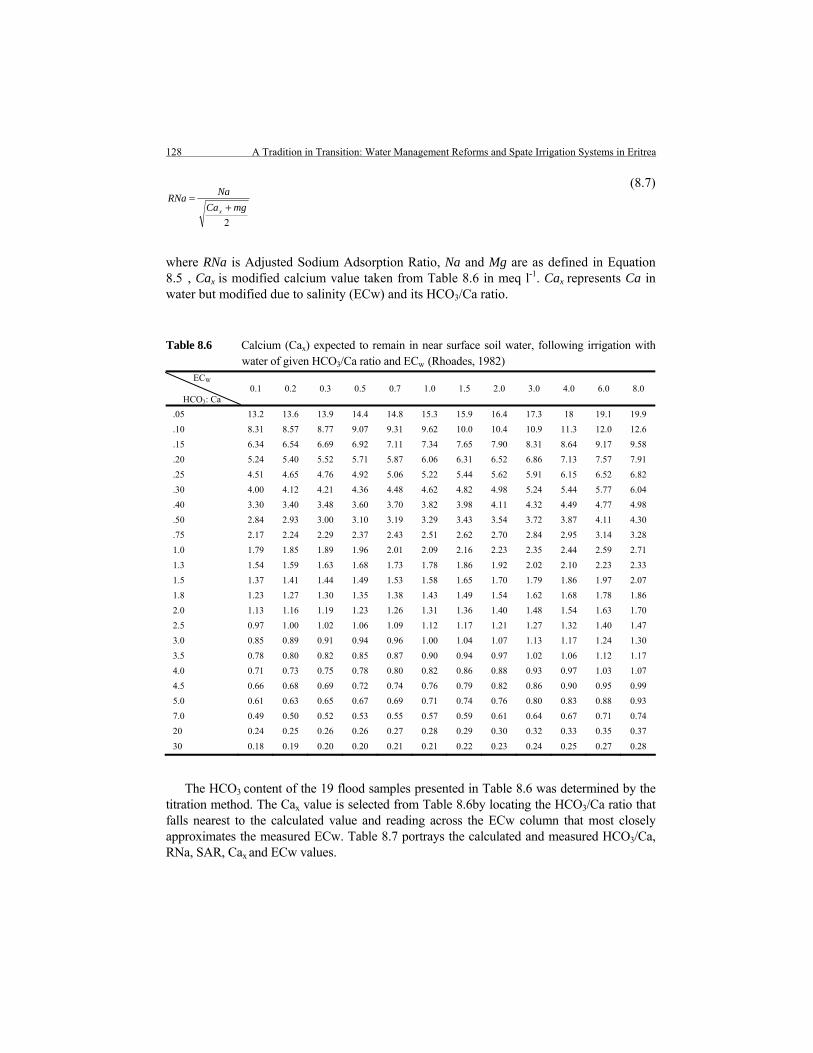
128 A Tradition in Transition: Water Management Reforms and Spate Irrigation Systems in Eritrea
2
mgCaNaRNax +
= (8.7)
where RNa is Adjusted Sodium Adsorption Ratio, Na and Mg are as defined in Equation 8.5 , Cax is modified calcium value taken from Table 8.6 in meq l-1. Cax represents Ca in water but modified due to salinity (ECw) and its HCO3/Ca ratio.
Table 8.6 Calcium (Cax) expected to remain in near surface soil water, following irrigation with water of given HCO3/Ca ratio and ECw (Rhoades, 1982)
ECW
HCO3: Ca 0.1 0.2 0.3 0.5 0.7 1.0 1.5 2.0 3.0 4.0 6.0 8.0
.05 13.2 13.6 13.9 14.4 14.8 15.3 15.9 16.4 17.3 18 19.1 19.9
.10 8.31 8.57 8.77 9.07 9.31 9.62 10.0 10.4 10.9 11.3 12.0 12.6
.15 6.34 6.54 6.69 6.92 7.11 7.34 7.65 7.90 8.31 8.64 9.17 9.58
.20 5.24 5.40 5.52 5.71 5.87 6.06 6.31 6.52 6.86 7.13 7.57 7.91
.25 4.51 4.65 4.76 4.92 5.06 5.22 5.44 5.62 5.91 6.15 6.52 6.82
.30 4.00 4.12 4.21 4.36 4.48 4.62 4.82 4.98 5.24 5.44 5.77 6.04
.40 3.30 3.40 3.48 3.60 3.70 3.82 3.98 4.11 4.32 4.49 4.77 4.98
.50 2.84 2.93 3.00 3.10 3.19 3.29 3.43 3.54 3.72 3.87 4.11 4.30
.75 2.17 2.24 2.29 2.37 2.43 2.51 2.62 2.70 2.84 2.95 3.14 3.28
1.0 1.79 1.85 1.89 1.96 2.01 2.09 2.16 2.23 2.35 2.44 2.59 2.71
1.3 1.54 1.59 1.63 1.68 1.73 1.78 1.86 1.92 2.02 2.10 2.23 2.33
1.5 1.37 1.41 1.44 1.49 1.53 1.58 1.65 1.70 1.79 1.86 1.97 2.07
1.8 1.23 1.27 1.30 1.35 1.38 1.43 1.49 1.54 1.62 1.68 1.78 1.86
2.0 1.13 1.16 1.19 1.23 1.26 1.31 1.36 1.40 1.48 1.54 1.63 1.70
2.5 0.97 1.00 1.02 1.06 1.09 1.12 1.17 1.21 1.27 1.32 1.40 1.47
3.0 0.85 0.89 0.91 0.94 0.96 1.00 1.04 1.07 1.13 1.17 1.24 1.30
3.5 0.78 0.80 0.82 0.85 0.87 0.90 0.94 0.97 1.02 1.06 1.12 1.17
4.0 0.71 0.73 0.75 0.78 0.80 0.82 0.86 0.88 0.93 0.97 1.03 1.07
4.5 0.66 0.68 0.69 0.72 0.74 0.76 0.79 0.82 0.86 0.90 0.95 0.99
5.0 0.61 0.63 0.65 0.67 0.69 0.71 0.74 0.76 0.80 0.83 0.88 0.93
7.0 0.49 0.50 0.52 0.53 0.55 0.57 0.59 0.61 0.64 0.67 0.71 0.74
20 0.24 0.25 0.26 0.26 0.27 0.28 0.29 0.30 0.32 0.33 0.35 0.37
30 0.18 0.19 0.20 0.20 0.21 0.21 0.22 0.23 0.24 0.25 0.27 0.28
The HCO3 content of the 19 flood samples presented in Table 8.6 was determined by the titration method. The Cax value is selected from Table 8.6by locating the HCO3/Ca ratio that falls nearest to the calculated value and reading across the ECw column that most closely approximates the measured ECw. Table 8.7 portrays the calculated and measured HCO3/Ca, RNa, SAR, Cax and ECw values.
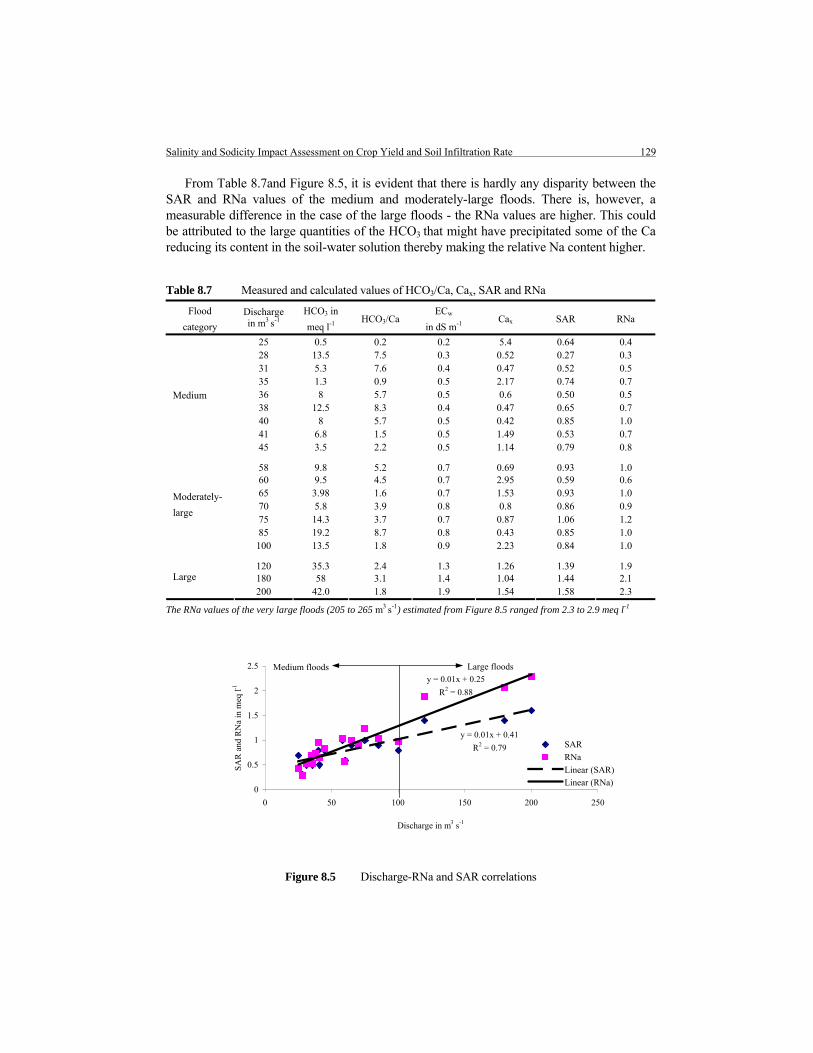
Salinity and Sodicity Impact Assessment on Crop Yield and Soil Infiltration Rate 129
From Table 8.7and Figure 8.5, it is evident that there is hardly any disparity between the SAR and RNa values of the medium and moderately-large floods. There is, however, a measurable difference in the case of the large floods - the RNa values are higher. This could be attributed to the large quantities of the HCO3 that might have precipitated some of the Ca reducing its content in the soil-water solution thereby making the relative Na content higher.
Table 8.7 Measured and calculated values of HCO3/Ca, Cax, SAR and RNa
Flood
category
Discharge in m3 s-1
HCO3 in
meq l-1 HCO3/Ca
ECw
in dS m-1 Cax SAR RNa
25 0.5 0.2 0.2 5.4 0.64 0.4 28 13.5 7.5 0.3 0.52 0.27 0.3 31 5.3 7.6 0.4 0.47 0.52 0.5 35 1.3 0.9 0.5 2.17 0.74 0.7 36 8 5.7 0.5 0.6 0.50 0.5 38 12.5 8.3 0.4 0.47 0.65 0.7 40 8 5.7 0.5 0.42 0.85 1.0 41 6.8 1.5 0.5 1.49 0.53 0.7
Medium
45 3.5 2.2 0.5 1.14 0.79 0.8
58 9.8 5.2 0.7 0.69 0.93 1.0 60 9.5 4.5 0.7 2.95 0.59 0.6 65 3.98 1.6 0.7 1.53 0.93 1.0 70 5.8 3.9 0.8 0.8 0.86 0.9 75 14.3 3.7 0.7 0.87 1.06 1.2 85 19.2 8.7 0.8 0.43 0.85 1.0
Moderately-
large
100 13.5 1.8 0.9 2.23 0.84 1.0
120 35.3 2.4 1.3 1.26 1.39 1.9 180 58 3.1 1.4 1.04 1.44 2.1 Large
200 42.0 1.8 1.9 1.54 1.58 2.3
The RNa values of the very large floods (205 to 265 m3 s-1) estimated from Figure 8.5 ranged from 2.3 to 2.9 meq l-1
Figure 8.5 Discharge-RNa and SAR correlations
y = 0.01x + 0.41
R2 = 0.79
y = 0.01x + 0.25
R2 = 0.88
0
0.5
1
1.5
2
2.5
0 50 100 150 200 250
Discharge in m3 s-1
SAR
and
RN
a in
meq
l-1
SARRNaLinear (SAR)Linear (RNa)
Large floodsMedium floods
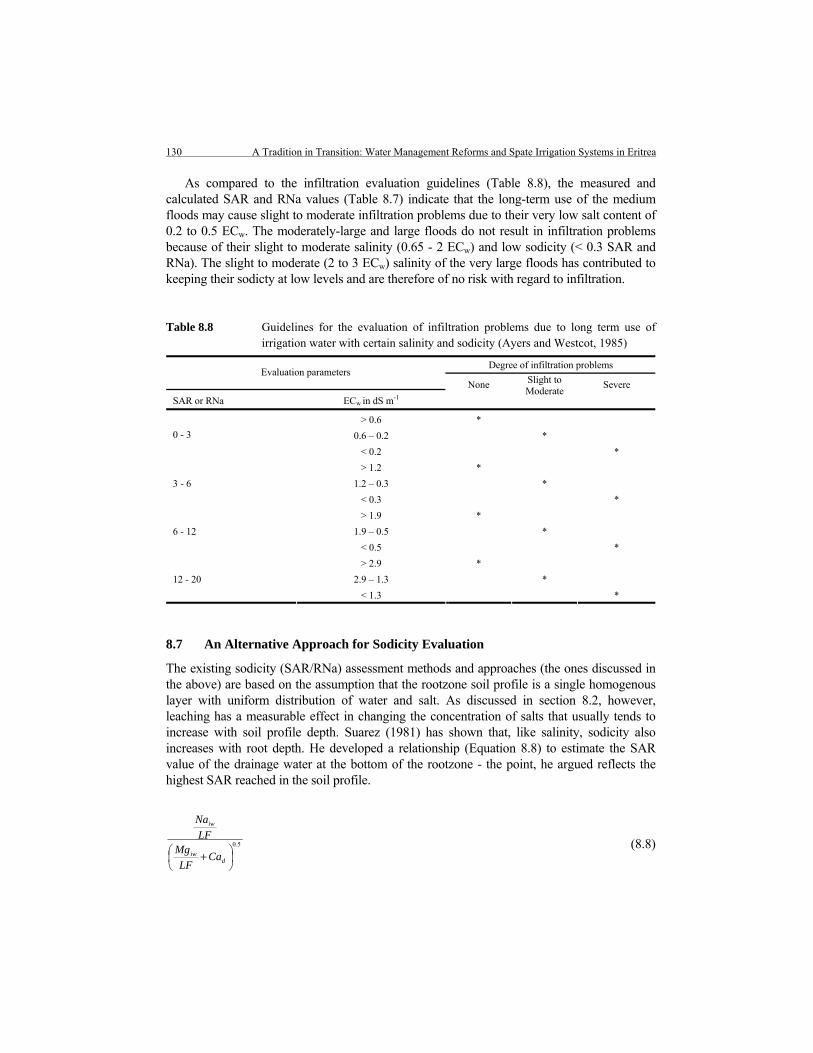
130 A Tradition in Transition: Water Management Reforms and Spate Irrigation Systems in Eritrea
As compared to the infiltration evaluation guidelines (Table 8.8), the measured and calculated SAR and RNa values (Table 8.7) indicate that the long-term use of the medium floods may cause slight to moderate infiltration problems due to their very low salt content of 0.2 to 0.5 ECw. The moderately-large and large floods do not result in infiltration problems because of their slight to moderate salinity (0.65 - 2 ECw) and low sodicity (< 0.3 SAR and RNa). The slight to moderate (2 to 3 ECw) salinity of the very large floods has contributed to keeping their sodicty at low levels and are therefore of no risk with regard to infiltration.
Table 8.8 Guidelines for the evaluation of infiltration problems due to long term use of irrigation water with certain salinity and sodicity (Ayers and Westcot, 1985)
Degree of infiltration problems Evaluation parameters
SAR or RNa ECw in dS m-1
None
Slight to Moderate
Severe
> 0.6 *
0.6 – 0.2 * 0 - 3
< 0.2 *
> 1.2 *
1.2 – 0.3 * 3 - 6
< 0.3 *
> 1.9 *
1.9 – 0.5 * 6 - 12
< 0.5 *
> 2.9 *
2.9 – 1.3 * 12 - 20
< 1.3 *
8.7 An Alternative Approach for Sodicity Evaluation
The existing sodicity (SAR/RNa) assessment methods and approaches (the ones discussed in the above) are based on the assumption that the rootzone soil profile is a single homogenous layer with uniform distribution of water and salt. As discussed in section 8.2, however, leaching has a measurable effect in changing the concentration of salts that usually tends to increase with soil profile depth. Suarez (1981) has shown that, like salinity, sodicity also increases with root depth. He developed a relationship (Equation 8.8) to estimate the SAR value of the drainage water at the bottom of the rootzone - the point, he argued reflects the highest SAR reached in the soil profile.
(8.8) 5.0
⎟⎠⎞
⎜⎝⎛ + d
iw
iw
CaLF
MgLF
Na

Salinity and Sodicity Impact Assessment on Crop Yield and Soil Infiltration Rate 131
where SARd is sodium adsorption ratio of drainage water at the bottom of the rootzone; LF is leaching fraction at the bottom of the rootzone; Naiw is sodium concentration in the irrigation water in meq l-1; Mgiw is magnesium concentration in the irrigation water in meq l-1; Cad is calcium concentration in the drainage water in meq l-1, which is the same as the Cax described in Equation 8.7
Equation 8.8 was modified to Equation 8.9 and as in the case of salinity, the soil water sodicity at the bottom of the first, second, third and fourth quarter and thus, the average soil-water sodicity of the rootzone (RNae) was determined using 0.1and 0.3 LF.
(8.9)
where RNasw1is sodicity of the soil-water at the bottom of the first quarter, LF1 is leaching fraction at the bottom of the first quarter.
It is true, as argued by Ayers and Westcot (1985) and several others, that the rate of infiltration to a large extent depends on the top-soil aggregate porosity and to this end, the SAR and RNa together with the ECw (Table 8.9) could adequately assess infiltration restrictions caused by high sodium concentrations. However, hydraulic conductivity, the rate of movement of water in the soil, which depends on the sub-soil aggregate stability and porosity, has considerable influence on the infiltration rate. Therefore, RNae, in combination with ECe would give a more accurate assessment of the infiltration problems induced by long term use of irrigation water with high sodium content. Moreover, when it comes to sodium toxicity, since as discussed in section 8.2, plants usually take water from any depth in the soil profile where it is more readily available, the RNae is clearly a better parameter than the RNa.
The measured RNae of the medium, moderately-large and large floods and the corresponding flood discharges correlated linearly )( baxy += (Figure 8.6). This relationship was used to calculate the RNae of the very large floods.
y = 0.02x + 0.56
R2 = 0.8
y = 0.03x + 0.66
R2 = 0.88
0.0
1.0
2.0
3.0
4.0
5.0
6.0
0 25 50 75 100 125 150 175 200 225
Flood discharge in M3/s
RN
ae in
meq
l-1
Rnae 0.1 LFRNae 0.3 LFLinear (RNae 0.3 LF)Linear (Rnae 0.1 LF)
Figure 8.6 Correlation between RNae and the Wadi Laba flood discharge
5.0
1
11
⎟⎟⎠
⎞⎜⎜⎝
⎛+
=
xiw
iw
CaLF
Mg
LFNa
RNasw

132 A Tradition in Transition: Water Management Reforms and Spate Irrigation Systems in Eritrea
Gauging the measured and calculated RNae and ECe (Table 8.9) against the guideline values in Table 8.8, the following can be concluded:
- the RNae values are twice to thrice that of the RNa, but they still indicate that the Wadi Laba floods do not incur infiltration problems. This is because the rate of increase in ECe was higher than that in RNae;
- the RNae of the large and very large floods, as used in Equation 8.6 could result in an ESP of 5 to 9%. This is much higher than the maximum 3% ESP obtained from the RNa, and indicates possible sodium toxicity problem in maize.
Table 8.9 Calculated RNae, ECe and RNa that can be induced by the long-term (15 to 20 years) use of the Wadi Laba flood categories
*Average rootzone sodicity,
RNae
**Average rootzone salinity,
ECe, in dS m-1 Flood
category
Discharge in
m3 s-1 0.1 LF 0.3 LF 0.1 LF 0.3 LF
***RNa
25 1.2 1.0 0.63 0.32 0.4 28 0.7 0.6 1.18 0.60 0.3 31 1.3 1.1 1.52 0.77 0.5 35 1.8 1.5 1.85 0.94 0.7 36 1.3 1.1 2.04 1.03 0.5 38 1.8 1.5 1.55 0.79 0.7 40 2.3 2.0 1.93 0.98 1 41 1.6 1.4 1.99 1.01 0.7
Medium
45 2.1 1.8 2.05 1.04 0.8
58 2.6 2.2 2.68 1.36 1 60 1.4 1.2 2.92 1.48 0.6 65 2.5 2.1 3.06 1.55 1 70 2.2 1.8 3.33 1.69 0.9 75 3.0 2.5 2.94 1.49 1.2 85 2.6 2.1 3.39 1.71 1
Moderately -
large
100 2.4 2.0 3.68 1.86 1
120 4.6 3.9 5.47 2.77 1.9 180 5.0 4.2 5.92 3.00 2.1 Large
200 5.6 4.7 7.73 3.91 2.3
205 5.8 4.9 8.91 4.51 2.3 225 6.3 5.3 9.73 4.92 2.5 245 6.8 5.7 10.55 5.34 2.7
Very large
265 7.3 6.1 11.37 5.75 3.0
*RNae of the very large floods (200 to 265 m3 s-1) were estimated from Figure 8.6 ; **From Table 8.3; ***From Table 8.7
8.8 Concluding Remarks
In the post structural water management reform era, the hypothesis stated at the beginning of this chapter may only be partially correct.
The failure of the indigenous earthen and brushwood structures to divert large floods (> 100 m3 s-1) may have cost substantial maize and sorghum production in the Wadi Laba area,
Salinity and Sodicity Impact Assessment on Crop Yield and Soil Infiltration Rate 133
and at times incurred livelihood hardships to the farmers. However, a positive aspect is that the indigenous structures have maintained the salinity of the fields at sustainable levels.
The water management reforms that led to the replacement of the indigenous structures with concrete headworks to divert large floods in a controlled manner may not attain their ultimate objective of doubling the yields (especially of maize) unless the salinity problem is adequately addressed. The slightly to moderately saline large floods, which supply water mainly to the downstream fields, may have a significant impact on the maize yield, but also on that of sorghum. In the worst scenario, when a field receives two irrigation turns from the very large (200 to 260 m3 s-1) floods, sorghum and maize yields could decrease 75% and 100% respectively; in the case of large floods (100 to 200 m3 s-1), by 15% and 70%. In the best scenario, when a field is irrigated thrice with the large floods, only maize yield could decline by 30%. Some of the recommendations to minimize yield losses include limiting the number of irrigation turns to two turns of 60 cm water depth each; modifying the water right on sequence to: irrespective of the size of the floods, if the upstream fields receive two turns at an irrigation gift of 60 cm, the subsequent floods should be diverted to the midstream and/or the downstream fields; providing separate intakes for the furthest midstream and downstream farmers in view of their right on large floods; the growth of maize only on the fields that are irrigated by small to moderately large floods (< 100 m3 s-1) and the restriction of large floods for sorghum. Other recommendations are the diversion of very large floods to the wadi and the prioritization of moderately salt tolerant, new crops. It is remarkable to mention that even the medium and moderately large floods with an average ECw of about 0.6 dS m-1, when applied at the rate of 8,220 m3 ha-1 y-1, may add nearly 5 ton of salt to the soil. If this is not flushed out of the rootzone, salinity problems could rapidly build up. Thus, budgeting at least 10% of the applied flood water for leaching is a must-do water management task.
The exiting sodicity assessment method (RNa/SAR), which assumes homogenous distribution of salts throughout the rootzone profile, could underestimate the impact of sodicity on plant toxicity and infiltration rate, and thus on crop yield. The suggested approach (RNae) that divides the soil profiles into four quarters and considers uniform distribution of salts within each quarter resulted in sodium concentrations two to three fold that obtained by the RNa/SAR.
The RNa/SAR and the RNae have shown that the Wadi Laba floods do not cause infiltration problems and sorghum crop toxicity. However, the maximum toxicity index, the ESP, obtained using the RNae approach was 9% to 3% that derived from the RNa method. Sodium toxicity in maize crop could occur at an ESP of 5 to 15%.
The main contributions of this chapter for future spate irrigation development are:
- considering salinity and sodicity as part of the economic and technical package for deciding the maximum design discharge cap;
- alternative sodicity assessment method, the RNae.

134 A Tradition in Transition: Water Management Reforms and Spate Irrigation Systems in Eritrea
Nutrient and Sediment Yield Analyses for the floodwater and Irrigated Fields 135
9 Nutrient and Sediment Yield Analyses for the Flood Water and Irrigated Fields
This chapter will test the hypothesis:
- the suspended sediments supplied by each of the medium (25 to 50 m3 s-1), moderately-large (50 to 100 m3 s-1), large (100 to 200 m3 s-1) and very large (200 to 265 m3 s-1) Wadi Laba floods can provide a field with nutrients sufficient for the maximum seeded and ratoon sorghum grain (4,500 kg ha-1 y-1) and forage (2,000 kg ha-1 y-1) yields and hence there is no need for any fertility replenishment and management.
Putting it in a different way, the above hypothesis reads:
- under the current indigenous water sharing arrangements, which allocate: the medium floods and occasionally the moderately-large floods to the upstream fields; the moderately-large and seldom the large floods to the midstream fields; the large and very large floods to the downstream fields; all the Wadi Laba fields are unlikely to exhibit negative nutrient balances.
9.1 Introduction
For the past 100 years, the Wadi Laba floods have been and are still the only source of the essential nutrients for the low-lying irrigated fields. During the water management reform interventions, it was assumed that the Wadi Laba floods deliver sufficient nutrients and that there is no need for any artificial fertility replenishment. This assumption is, however, merely based on the fact that nutrient deficiency symptoms have not been observed. It is imperative to note that slight and moderate nutrient deficiency symptoms could go unnoticed and sometimes be confused with other complex field events, such as salt damage, disease and drought (Jones, 2003). Thus, it is only by conducting systematic soil and water analysis (this was done in this research) that one can conclusively determine whether or not the Wadi Laba floods have been and are still supplying the needed quantity and quality of nutrients for the above noted optimum sorghum production.
Although it can not be supported with concrete figures (as no long-term data exist so far), from the interviews conducted with the farmers, it can be inferred that during the past 100 years, significant depletion of macro nutrients may have taken place from the Wadi Laba upper catchment - the source of the flood waters. The majority of the interviewed elderly farmers explained that the yield from their rainfed fields in the upper catchment (highlands) decreased from as high as 1 ton ha-1 y-1 before about 50 years to almost none, as many fields currently only produce forage even during the best rainfall seasons. The farmers attribute this mainly to erosion that has constantly removed the top and relatively fertile soil. They also explained that the vegetation cover of the area has reduced by over

136 A tradition in Transition: Water Management Reforms and Spate Irrigation Systems in Eritrea
60%, which they consider is further exacerbating the erosion of their fields that lay at the foot of the mountains. Though, as assumed, it may be correct that there is not yet nutrient deficiency at the Wadi Laba irrigated fields, the expressed (by the farmers) trend of nutrient impoverishment of the upper catchment is an indication that nutrient status of the irrigated fields may have been declining.
The nutrient depletion issue at the upper catchment has not been given much attention till as recent as the past five years because the owners of the rainfed farmlands and the majority of the inhabitants of the upper catchment villages have mainly been those who have irrigated lands at the lower catchment. These farmers largely depend for their food crops on the irrigated lands, and the upper catchment fields were only used as suppliers of supplementary food and fodder needs. The permanent settlers, who entirely make their livelihood from the resources of the upper catchment, have been insignificant in number. In the past 5 years, however, the number of permanent inhabitants has tremendously increased and is still on the rise. The Government of the State of Eritrea encourages grouping of scattered villages for administrative, better land utilization and other development reasons. The upper catchment is thus increasingly becoming viewed not only as the supplier of nutrients and sediments for the low-lying spate irrigated areas, but also as the resource base for providing livelihood to its permanent settlers.
In view of the above stated realities, the Ministry of Agriculture of Eritrea has drafted plans to introduce soil and water conservation measures such as terraces to minimize the degradation of the gentle and steep mountains. If this intervention is followed though, it is inevitable that it will have a direct negative effect on the annual nutrient and sediment supplied to the spate irrigated fields at the lower catchments. In order to assess the magnitude of such an impact and recommend appropriate scale of involvement, nonetheless, it is indispensable to first reliably answer the question: does the upper catchment currently supply floods that contain sediments with sufficient quantities and qualities of nutrients that can at least balance the nutrient outflow from the irrigated fields? This question is the subject of this Chapter. To start with, however, a conceptual note on the essential nutrients and their depletion status in the African soils is given.
9.2 Depletion Status of Nutrients in African Soils: A Conceptual Note
Obtaining optimum crop yields requires more than just providing the right amount and quality of water at the right moment - it also necessitates an optimum supply of the 16 ‘essential’ nutrient elements (Table 9.1). An element is considered ‘essential’ for plant growth if it meets the following criteria (Jones, 2003):
- the plant can not complete its life cycle in the absence of the element; - the action of the element must be specific, with no other element being able to
completely substitute it; - the element must be a constituent of the metabolic activity or at least be required for the
activity of an essential enzyme.
The essential elements (Table 9.1) are broadly divided into non-mineral and mineral elements. The non-mineral elements - carbon, hydrogen and oxygen, are usually abundantly
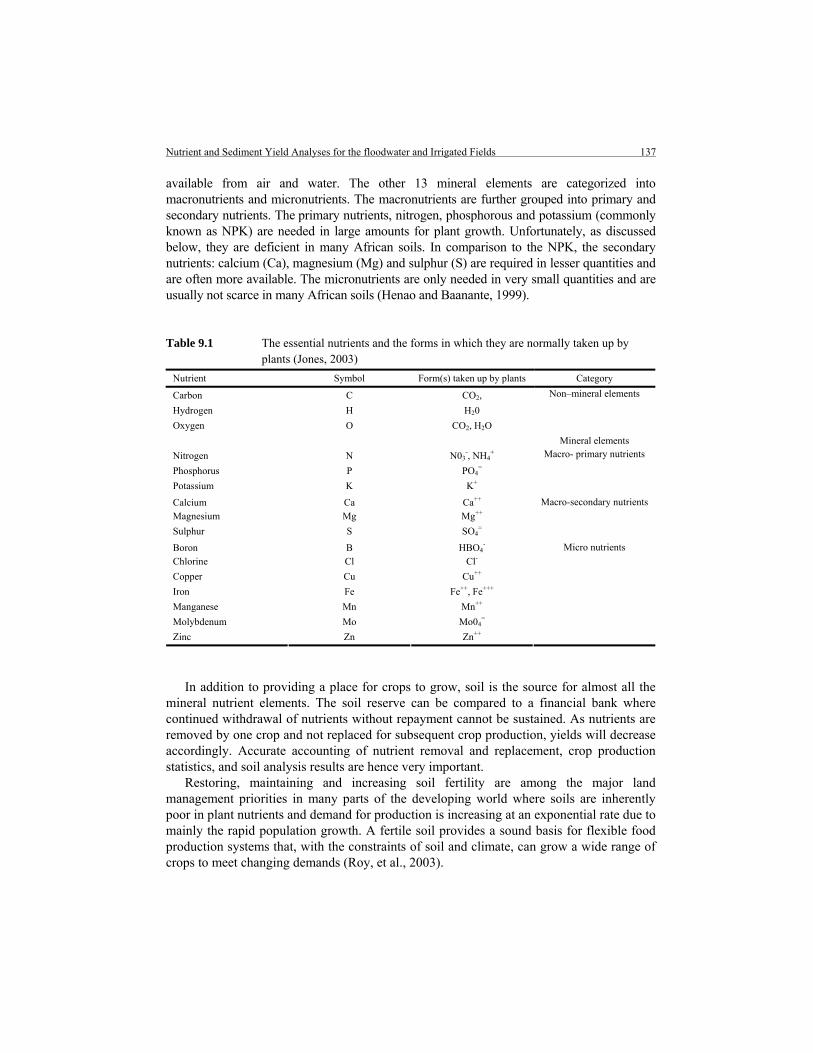
Nutrient and Sediment Yield Analyses for the floodwater and Irrigated Fields 137
available from air and water. The other 13 mineral elements are categorized into macronutrients and micronutrients. The macronutrients are further grouped into primary and secondary nutrients. The primary nutrients, nitrogen, phosphorous and potassium (commonly known as NPK) are needed in large amounts for plant growth. Unfortunately, as discussed below, they are deficient in many African soils. In comparison to the NPK, the secondary nutrients: calcium (Ca), magnesium (Mg) and sulphur (S) are required in lesser quantities and are often more available. The micronutrients are only needed in very small quantities and are usually not scarce in many African soils (Henao and Baanante, 1999).
Table 9.1 The essential nutrients and the forms in which they are normally taken up by plants (Jones, 2003)
Nutrient Symbol Form(s) taken up by plants Category
Carbon C CO2,
Hydrogen H H20
Oxygen O CO2, H2O
Non–mineral elements
Mineral elements
Nitrogen N N03-, NH4
+
Phosphorus P PO4=
Potassium K K+
Macro- primary nutrients
Calcium Ca Ca++ Magnesium Mg Mg++
Sulphur S SO4=
Macro-secondary nutrients
Boron B HBO4-
Chlorine Cl Cl-
Copper Cu Cu++
Iron Fe Fe++, Fe+++
Manganese Mn Mn++
Molybdenum Mo Mo04=
Zinc Zn Zn++
Micro nutrients
In addition to providing a place for crops to grow, soil is the source for almost all the mineral nutrient elements. The soil reserve can be compared to a financial bank where continued withdrawal of nutrients without repayment cannot be sustained. As nutrients are removed by one crop and not replaced for subsequent crop production, yields will decrease accordingly. Accurate accounting of nutrient removal and replacement, crop production statistics, and soil analysis results are hence very important.
Restoring, maintaining and increasing soil fertility are among the major land management priorities in many parts of the developing world where soils are inherently poor in plant nutrients and demand for production is increasing at an exponential rate due to mainly the rapid population growth. A fertile soil provides a sound basis for flexible food production systems that, with the constraints of soil and climate, can grow a wide range of crops to meet changing demands (Roy, et al., 2003).
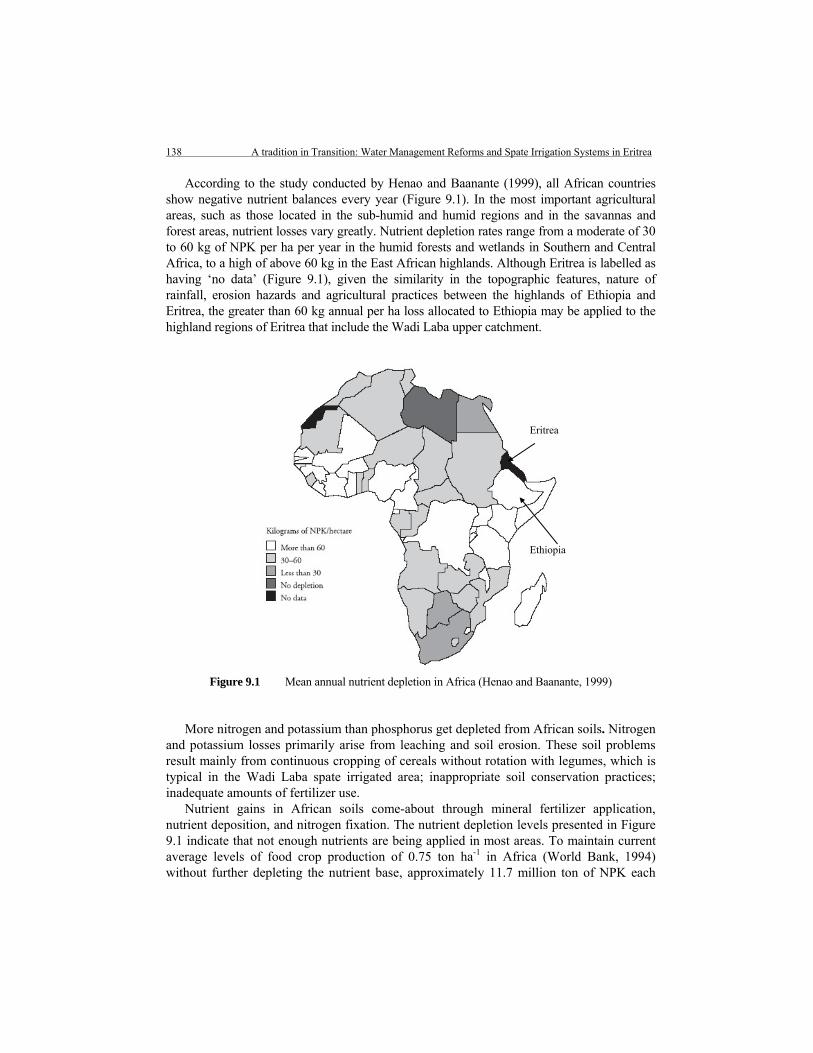
138 A tradition in Transition: Water Management Reforms and Spate Irrigation Systems in Eritrea
According to the study conducted by Henao and Baanante (1999), all African countries show negative nutrient balances every year (Figure 9.1). In the most important agricultural areas, such as those located in the sub-humid and humid regions and in the savannas and forest areas, nutrient losses vary greatly. Nutrient depletion rates range from a moderate of 30 to 60 kg of NPK per ha per year in the humid forests and wetlands in Southern and Central Africa, to a high of above 60 kg in the East African highlands. Although Eritrea is labelled as having ‘no data’ (Figure 9.1), given the similarity in the topographic features, nature of rainfall, erosion hazards and agricultural practices between the highlands of Ethiopia and Eritrea, the greater than 60 kg annual per ha loss allocated to Ethiopia may be applied to the highland regions of Eritrea that include the Wadi Laba upper catchment.
Figure 9.1 Mean annual nutrient depletion in Africa (Henao and Baanante, 1999)
More nitrogen and potassium than phosphorus get depleted from African soils. Nitrogen and potassium losses primarily arise from leaching and soil erosion. These soil problems result mainly from continuous cropping of cereals without rotation with legumes, which is typical in the Wadi Laba spate irrigated area; inappropriate soil conservation practices; inadequate amounts of fertilizer use.
Nutrient gains in African soils come-about through mineral fertilizer application, nutrient deposition, and nitrogen fixation. The nutrient depletion levels presented in Figure 9.1 indicate that not enough nutrients are being applied in most areas. To maintain current average levels of food crop production of 0.75 ton ha-1 in Africa (World Bank, 1994) without further depleting the nutrient base, approximately 11.7 million ton of NPK each
Ethiopia
Eritrea
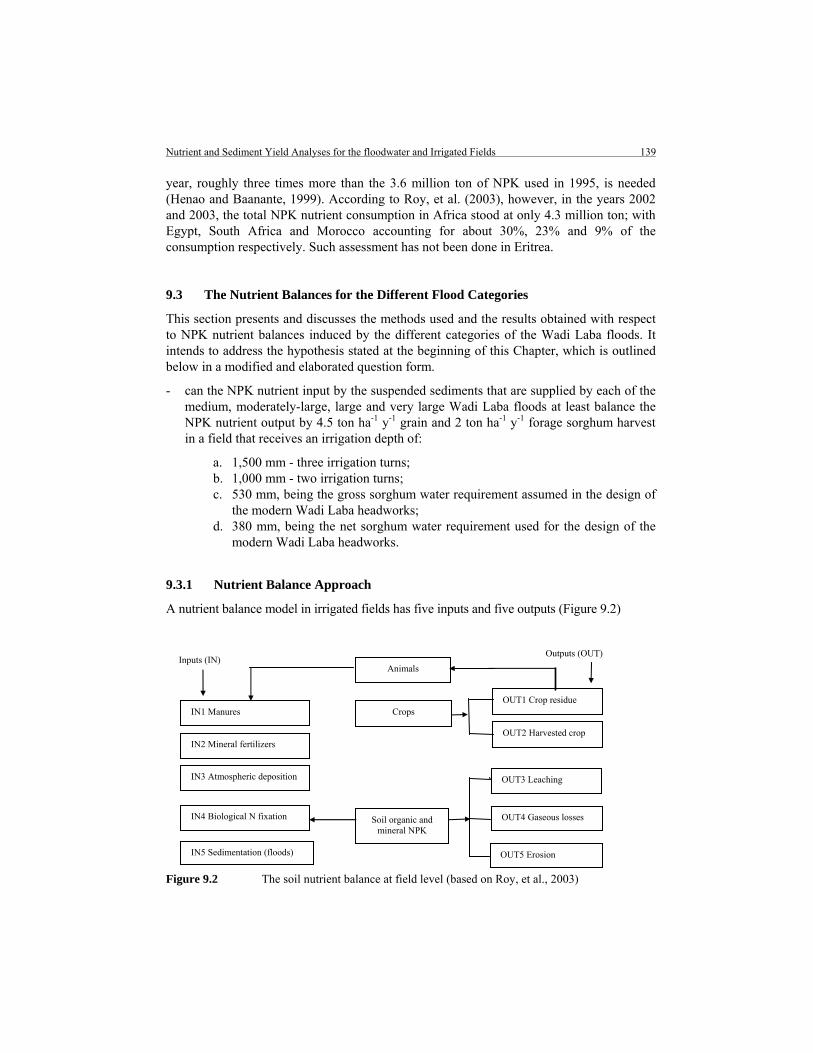
Nutrient and Sediment Yield Analyses for the floodwater and Irrigated Fields 139
year, roughly three times more than the 3.6 million ton of NPK used in 1995, is needed (Henao and Baanante, 1999). According to Roy, et al. (2003), however, in the years 2002 and 2003, the total NPK nutrient consumption in Africa stood at only 4.3 million ton; with Egypt, South Africa and Morocco accounting for about 30%, 23% and 9% of the consumption respectively. Such assessment has not been done in Eritrea.
9.3 The Nutrient Balances for the Different Flood Categories
This section presents and discusses the methods used and the results obtained with respect to NPK nutrient balances induced by the different categories of the Wadi Laba floods. It intends to address the hypothesis stated at the beginning of this Chapter, which is outlined below in a modified and elaborated question form.
- can the NPK nutrient input by the suspended sediments that are supplied by each of the medium, moderately-large, large and very large Wadi Laba floods at least balance the NPK nutrient output by 4.5 ton ha-1 y-1 grain and 2 ton ha-1 y-1 forage sorghum harvest in a field that receives an irrigation depth of:
a. 1,500 mm - three irrigation turns; b. 1,000 mm - two irrigation turns; c. 530 mm, being the gross sorghum water requirement assumed in the design of
the modern Wadi Laba headworks; d. 380 mm, being the net sorghum water requirement used for the design of the
modern Wadi Laba headworks.
9.3.1 Nutrient Balance Approach
A nutrient balance model in irrigated fields has five inputs and five outputs (Figure 9.2)
Figure 9.2 The soil nutrient balance at field level (based on Roy, et al., 2003)
OUT1 Crop residue
OUT2 Harvested crop
OUT3 Leaching
OUT4 Gaseous losses
OUT5 Erosion
Inputs (IN) Outputs (OUT)
IN3 Atmospheric deposition
IN2 Mineral fertilizers
IN1 Manures
IN4 Biological N fixation
IN5 Sedimentation (floods)
Animals
Crops
Soil organic and mineral NPK

140 A tradition in Transition: Water Management Reforms and Spate Irrigation Systems in Eritrea
In the Wadi Laba spate irrigation system, the only source of nutrient input is sedimentation (IN5), which is delivered by the floods. The farmers do not use manure or mineral fertilizers. The fact that the fields are continuously cropped with sorghum and maize and not alternated with legume plants makes biological N-fixation hardly possible. Nutrient input through atmospheric deposition can also be considered negligible. It is true that in the months of June, July and August (the flood season), dust storms, locally called Kamsin are common. Kamsin can erode the irrigated fields and/or enrich them with deposition of soil particles. Even if it is assumed that they will have only a deposition effect, their contribution is still insignificant. This is because the most widely applied and reliable methods for determining the nutrient input through atmospheric deposition, the ‘multiple regression analyses by Stroorvogel and Smaling (1990) and Roy, et al. (2003) depend on rainfall (Equations 9.1, 9.2 and 9.3). There is hardly any rainfall in the Wadi Laba lower catchment during the flood season.
5.0)(*1.0 RFN = (9.1)
5.052 )(*053.0)( RFOPP = (9.2)
5.02 )(*11.0)( RFOKK = (9.3)
where RF is rainfall in mm, while N, P and K are expressed in kg ha-1. On the output side, the crop residue (OUT1), the harvested product (OUT2) and
leaching (OUT3) are the only processes resulting in nutrient depletion of the Wadi Laba fields. As argued by Elias, et al. (1998), gaseous loss of N can take place through volatilization if crop residues are burned in the fields. Such activity is not practiced in the Wadi Laba irrigation system. The farmers remove nearly 100% of the crop residues to feed their livestock through the ‘cut-and-carry’ grazing system (Chapter 4). Given the flat topography of the fields, nutrient removal through erosion is also very minimal. It has been reported that the loss of nutrients in naturally flooded or irrigated land is negligible (Roy, et al., 2003). It follows from the above discussions; therefore, the nutrient balance of the Wadi Laba fields is as presented in Equation 9.4.
)321(5 OUTOUTOUTINBalanceNutrient ++−= (kg ha-1 y-1) (9.4)
Quantification of Nutrients’ Input (IN5)
The total N, P and K nutrient element concentrations of the medium, moderately-large and large Wadi Laba floods were measured by the standard laboratory methods - the macro-Kjeldahl, the ascorbic acid spectrophotometer and the flame emission spectrophotometer respectively (Kruis, 2002). The suspended sediment concentration of the flood samples was computed using the gravimetric method (Chapter 4).
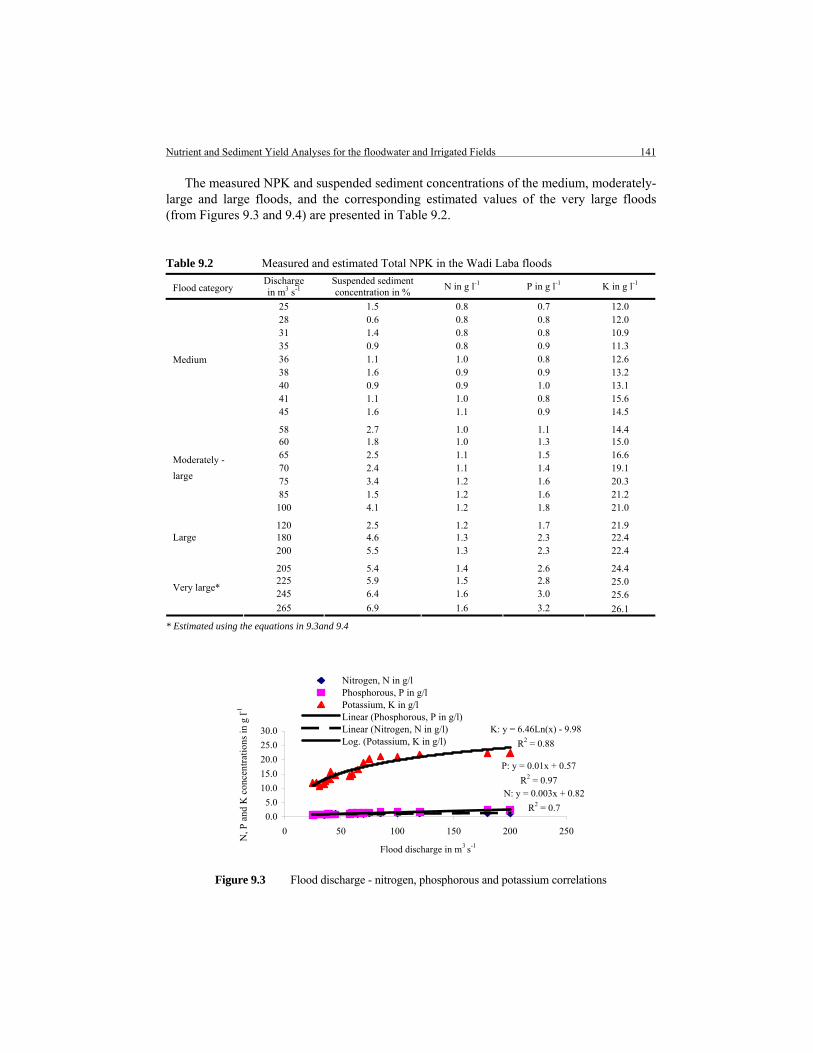
Nutrient and Sediment Yield Analyses for the floodwater and Irrigated Fields 141
The measured NPK and suspended sediment concentrations of the medium, moderately-large and large floods, and the corresponding estimated values of the very large floods (from Figures 9.3 and 9.4) are presented in Table 9.2.
Table 9.2 Measured and estimated Total NPK in the Wadi Laba floods
Flood category Discharge in m3 s-1
Suspended sediment concentration in %
N in g l-1 P in g l-1 K in g l-1
25 1.5 0.8 0.7 12.0 28 0.6 0.8 0.8 12.0 31 1.4 0.8 0.8 10.9 35 0.9 0.8 0.9 11.3 36 1.1 1.0 0.8 12.6 38 1.6 0.9 0.9 13.2 40 0.9 0.9 1.0 13.1 41 1.1 1.0 0.8 15.6
Medium
45 1.6 1.1 0.9 14.5
58 2.7 1.0 1.1 14.4 60 1.8 1.0 1.3 15.0 65 2.5 1.1 1.5 16.6 70 2.4 1.1 1.4 19.1 75 3.4 1.2 1.6 20.3 85 1.5 1.2 1.6 21.2
Moderately -
large
100 4.1 1.2 1.8 21.0
120 2.5 1.2 1.7 21.9 180 4.6 1.3 2.3 22.4 Large 200 5.5 1.3 2.3 22.4
205 5.4 1.4 2.6 24.4 225 5.9 1.5 2.8 25.0 245 6.4 1.6 3.0 25.6
Very large*
265 6.9 1.6 3.2 26.1
* Estimated using the equations in 9.3and 9.4
Figure 9.3 Flood discharge - nitrogen, phosphorous and potassium correlations
P: y = 0.01x + 0.57
R2 = 0.97N: y = 0.003x + 0.82
R2 = 0.7
K: y = 6.46Ln(x) - 9.98
R2 = 0.88
0.0
5.0
10.0
15.0
20.0
25.0
30.0
0 50 100 150 200 250
Flood discharge in m3 s-1
N, P
and
K c
once
ntra
tions
in g
l-1
Nitrogen, N in g/lPhosphorous, P in g/lPotassium, K in g/lLinear (Phosphorous, P in g/l)Linear (Nitrogen, N in g/l)Log. (Potassium, K in g/l)
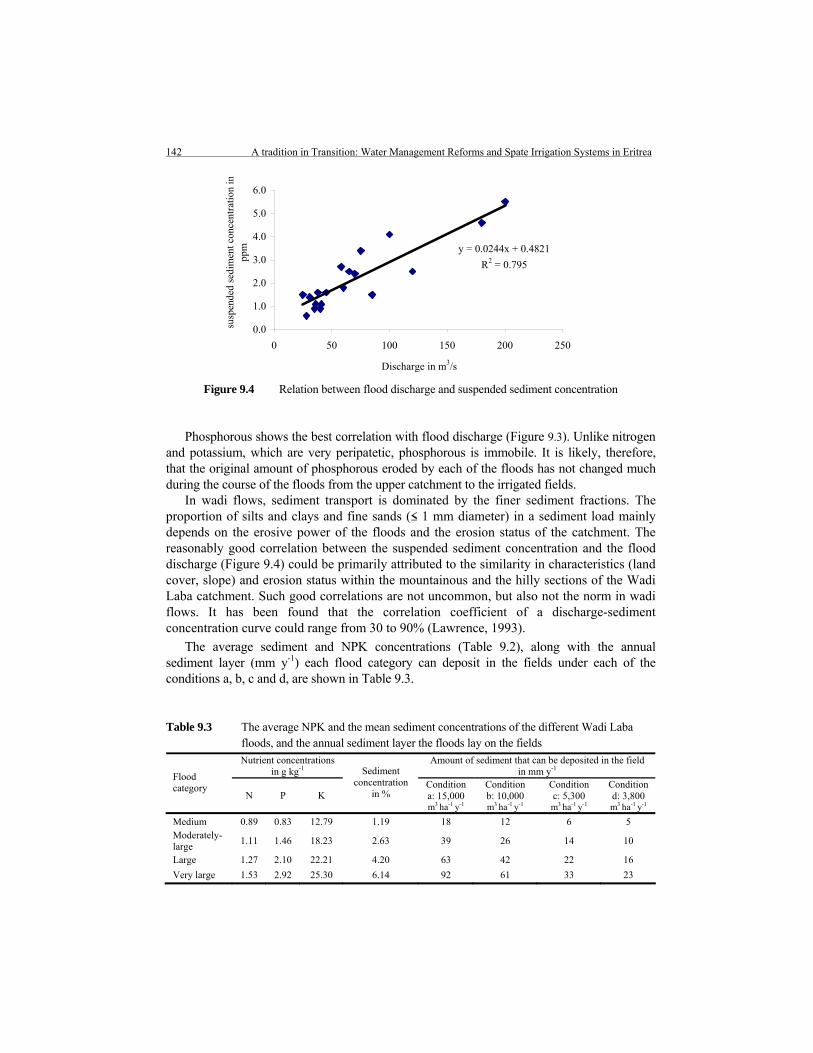
142 A tradition in Transition: Water Management Reforms and Spate Irrigation Systems in Eritrea
Figure 9.4 Relation between flood discharge and suspended sediment concentration
Phosphorous shows the best correlation with flood discharge (Figure 9.3). Unlike nitrogen and potassium, which are very peripatetic, phosphorous is immobile. It is likely, therefore, that the original amount of phosphorous eroded by each of the floods has not changed much during the course of the floods from the upper catchment to the irrigated fields.
In wadi flows, sediment transport is dominated by the finer sediment fractions. The proportion of silts and clays and fine sands (≤ 1 mm diameter) in a sediment load mainly depends on the erosive power of the floods and the erosion status of the catchment. The reasonably good correlation between the suspended sediment concentration and the flood discharge (Figure 9.4) could be primarily attributed to the similarity in characteristics (land cover, slope) and erosion status within the mountainous and the hilly sections of the Wadi Laba catchment. Such good correlations are not uncommon, but also not the norm in wadi flows. It has been found that the correlation coefficient of a discharge-sediment concentration curve could range from 30 to 90% (Lawrence, 1993).
The average sediment and NPK concentrations (Table 9.2), along with the annual sediment layer (mm y-1) each flood category can deposit in the fields under each of the conditions a, b, c and d, are shown in Table 9.3.
Table 9.3 The average NPK and the mean sediment concentrations of the different Wadi Laba floods, and the annual sediment layer the floods lay on the fields Nutrient concentrations
in g kg-1 Amount of sediment that can be deposited in the field
in mm y-1 Flood category
N P K
Sediment concentration
in % Condition a: 15,000 m3 ha-1 y-1
Condition b: 10,000 m3 ha-1 y-1
Condition c: 5,300 m3 ha-1 y-1
Condition d: 3,800 m3 ha-1 y-1
Medium 0.89 0.83 12.79 1.19 18 12 6 5 Moderately- large
1.11 1.46 18.23 2.63 39 26 14 10
Large 1.27 2.10 22.21 4.20 63 42 22 16
Very large 1.53 2.92 25.30 6.14 92 61 33 23
y = 0.0244x + 0.4821
R2 = 0.795
0.0
1.0
2.0
3.0
4.0
5.0
6.0
0 50 100 150 200 250
Discharge in m3/s
susp
ende
d se
dim
ent c
once
ntra
tion
in
ppm

Nutrient and Sediment Yield Analyses for the floodwater and Irrigated Fields 143
As explained in Chapter 8, the moderately-large, large and very large floods occur when there is rainfall across the highest mountain range (3,000 m+MSL) in the upper catchment area. The small and medium floods on the other hand happen when only the hilly, low to medium altitude (1,000 to 2,000 m+MSL) sections of the catchment receive rainfall. The relatively large difference between the P and K contents (as compared to that of N) of the various flood categories (Table 9.3) may therefore be an indication that the mountainous area is richer in P and K than the hilly locale.
As gauged against the guideline figures (Table 9.4), the measured P and K reserves of all the Wadi Laba floods fall into the medium to high rating and this may be a reflection of the fact that the upper catchment as a whole has a substantial amount of P and K. There are some exploratory geological investigations done that suggest the upper catchment contains measurable quantities of K and P rich minerals such as ‘micas’ and ‘apatites’ (Halcrow, 1997). Appraised against the guideline values in Table 9.4, the N content of all the Wadi Laba floods is low and this may be an indication that the whole upper catchment is homogenously poor in N bearing minerals.
Table 9.4 General guideline values for NPK (Landon, 1991and Roy, et al., 2003) Nutrient type Nutrient amount in the soil profile in g kg-1 Rating
> 5 High
2 to 5 Medium Total N
< 2 Low
> 1 High 0.2 to 1 Medium Total P
< 0.2 Low
> 15 High 5 to 15 Medium Total K
< 5 Low
If the existing indigenous water sharing rules are followed, it can be inferred from Table 9.3 that the annual rise in the upstream fields could range from 5 to 18 mm; in the midstream fields, from 11 to 42 mm (assuming a moderately-large: large flood irrigation contribution of 90:10); in the downstream fields, from 17 to 66 mm (considering a 90:10 irrigation supply share between large and very large floods). Kahlown and Hamilton (1996) and Ratsey (2004) reported annual field rise of 139 mm in the Gash spate systems in Eastern Sudan and 50 mm in the Balochistan mountain systems.
The maximum of 6% (60,000 ppm) sediment concentration (Table 9.3) is not an exception. In the Wadi Zabid and Wadi Tuban, Yemen, nearly up to a 100,000 ppm concentration has been recorded for floods in the order of the very large category (Tahir and Noman, 2002).
It is customary to report nutrient balance in kg ha-1 y-1. Thus, assuming a homogenous distribution of NPK nutrients within the newly deposited sediment layer (Table 9.3), Equation 9.5 was used to compute the nutrient inflow (IN5) in kg ha-1 y-1.

144 A tradition in Transition: Water Management Reforms and Spate Irrigation Systems in Eritrea
10*)**(5 ADSLPSNCIN b= (9.5)
where IN5 is NPK nutrient input by each of the Wadi Laba flood category; SNC is soil nutrient content, average NPK values of each flood category in g kg-1; Pb is soil bulk density in kg m-3, which is on average 1,300 kg m-3 for the Wadi Laba fields (Table 4.5); ADSL is annually deposited sediment layer to a field in m y-1, 10 is to convert g m-2 y-1 into kg ha-1 y-1.
Quantification of Nutrients’ Outputs
The NPK OUT1 and OUT2 were estimated in kg ha-1 y-1 by using Equations 9.6 and 9.7 (Roy, et al., 2003).
yieldresiduecropofcontentsOKKandOPPNOUT *)()(,1 22= (9.6)
yieldproductharvestedofcontentsOKKandOPPNOUT *)()(,2 22= (9.7)
P and K contents in plant material are expressed in units of P2O5 (44% P) and K2O (83% K). In low crop management irrigated sorghum fields such as those in the Wadi Laba, the N, P2O5 and K2O contents in OUT1 are 14, 13 and 40 g kg-1; and in OUT2; 15, 13 and 5 g kg-1 respectively (Stroovogel and Smaling, 1990 and Roy, et al., 2003).
Unlike the case in OUT1 and OUT2, there are no well-developed and tested regression equations to determine the magnitude of nutrient loss through leaching, OUT3 (Roy, et al., 2003). There are, however, two multiple regressions (these were used) that show leaching to correlate positively with rainfall and IN1 and IN2; and negatively with the total uptake of N and K (Equations 9.8 and 9.9). P is often bound tightly by soil particles and is hence assumed unsusceptible to any leaching process.
UNININRNOUT 1.0)21(3.0)0007.00021.0(3.2,3 −++++= (kg ha-1 y-1) (9.8)
UKININROKOUT 1.0)21(5.0)002.00011.0(6.0,3 2 −++++= (kg ha-1 y-1) (9.9)
For the Wadi Laba spate irrigated area where RF (rainfall), IN1 and IN2 are negligible, the above OUT3 equations can be simplified into Equations 9.10 and 9.11.
UNNOUT 1.03.2,3 −= (9.10)
UKOKOUT 1.06.0,3 2 −= (9.11)
UN and UK refer to crop (in this case sorghum) N and K uptake in kg ha-1 y-1. They were computed using Equations 9.6 and 9.7.
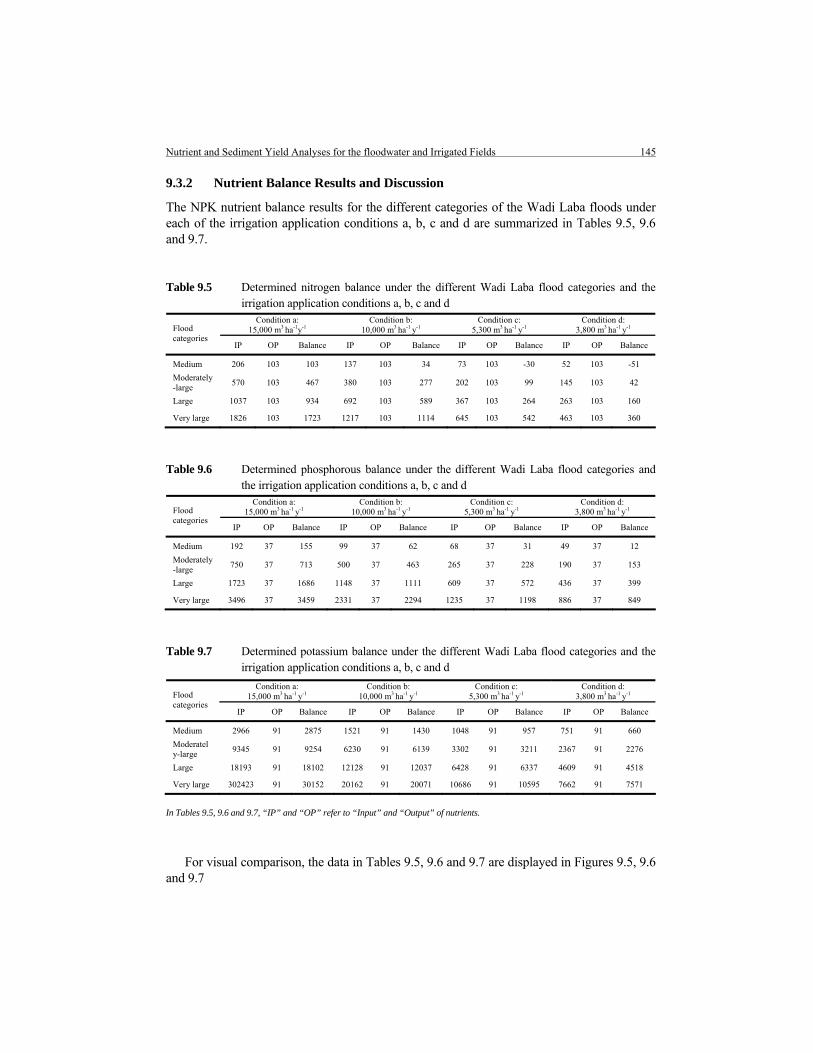
Nutrient and Sediment Yield Analyses for the floodwater and Irrigated Fields 145
9.3.2 Nutrient Balance Results and Discussion
The NPK nutrient balance results for the different categories of the Wadi Laba floods under each of the irrigation application conditions a, b, c and d are summarized in Tables 9.5, 9.6 and 9.7.
Table 9.5 Determined nitrogen balance under the different Wadi Laba flood categories and the irrigation application conditions a, b, c and d
Condition a: 15,000 m3 ha-1y-1
Condition b: 10,000 m3 ha-1 y-1
Condition c: 5,300 m3 ha-1 y-1
Condition d: 3,800 m3 ha-1 y-1 Flood
categories IP OP Balance IP OP Balance IP OP Balance IP OP Balance
Medium 206 103 103 137 103 34 73 103 -30 52 103 -51
Moderately-large
570 103 467 380 103 277 202 103 99 145 103 42
Large 1037 103 934 692 103 589 367 103 264 263 103 160
Very large 1826 103 1723 1217 103 1114 645 103 542 463 103 360
Table 9.6 Determined phosphorous balance under the different Wadi Laba flood categories and the irrigation application conditions a, b, c and d
Condition a: 15,000 m3 ha-1 y-1
Condition b: 10,000 m3 ha-1 y-1
Condition c: 5,300 m3 ha-1 y-1
Condition d: 3,800 m3 ha-1 y-1 Flood
categories IP OP Balance IP OP Balance IP OP Balance IP OP Balance
Medium 192 37 155 99 37 62 68 37 31 49 37 12
Moderately-large
750 37 713 500 37 463 265 37 228 190 37 153
Large 1723 37 1686 1148 37 1111 609 37 572 436 37 399
Very large 3496 37 3459 2331 37 2294 1235 37 1198 886 37 849
Table 9.7 Determined potassium balance under the different Wadi Laba flood categories and the irrigation application conditions a, b, c and d
In Tables 9.5, 9.6 and 9.7, “IP” and “OP” refer to “Input” and “Output” of nutrients.
For visual comparison, the data in Tables 9.5, 9.6 and 9.7 are displayed in Figures 9.5, 9.6 and 9.7
Condition a: 15,000 m3 ha-1 y-1
Condition b: 10,000 m3 ha-1 y-1
Condition c: 5,300 m3 ha-1 y-1
Condition d: 3,800 m3 ha-1 y-1 Flood
categories IP OP Balance IP OP Balance IP OP Balance IP OP Balance
Medium 2966 91 2875 1521 91 1430 1048 91 957 751 91 660
Moderately-large
9345 91 9254 6230 91 6139 3302 91 3211 2367 91 2276
Large 18193 91 18102 12128 91 12037 6428 91 6337 4609 91 4518
Very large 302423 91 30152 20162 91 20071 10686 91 10595 7662 91 7571
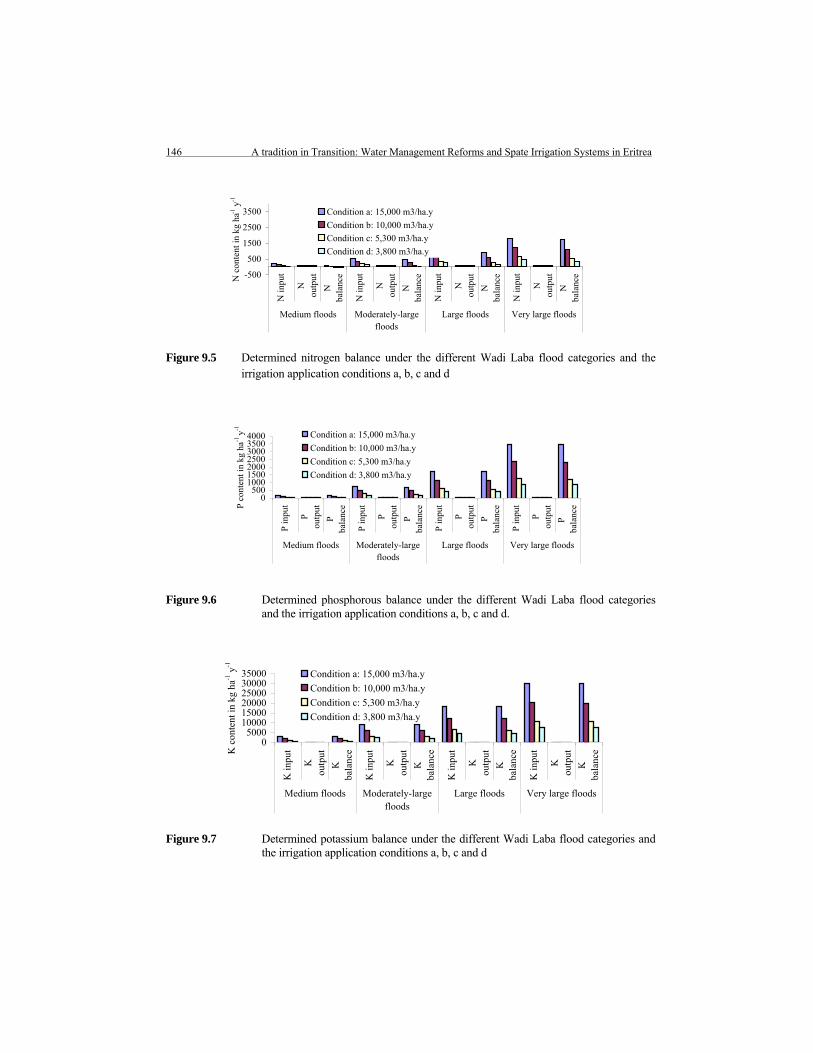
146 A tradition in Transition: Water Management Reforms and Spate Irrigation Systems in Eritrea
Figure 9.5 Determined nitrogen balance under the different Wadi Laba flood categories and the
irrigation application conditions a, b, c and d
Figure 9.6 Determined phosphorous balance under the different Wadi Laba flood categories
and the irrigation application conditions a, b, c and d.
Figure 9.7 Determined potassium balance under the different Wadi Laba flood categories and
the irrigation application conditions a, b, c and d
-500
500
1500
2500
3500
N in
put
Nou
tput
Nba
lanc
e
N in
put
Nou
tput
Nba
lanc
e
N in
put
Nou
tput
Nba
lanc
e
N in
put
Nou
tput
Nba
lanc
e
Medium floods Moderately-largefloods
Large floods Very large floods
N c
onte
nt in
kg
ha-1
y-1
Condition a: 15,000 m3/ha.y
Condition b: 10,000 m3/ha.y
Condition c: 5,300 m3/ha.y
Condition d: 3,800 m3/ha.y
0500
1000150020002500300035004000
P in
put
Pou
tput
Pba
lanc
e
P in
put
Pou
tput
Pba
lanc
e
P in
put
Pou
tput
Pba
lanc
e
P in
put
Pou
tput
P ba
lanc
e
Medium floods Moderately-largefloods
Large floods Very large floods
P co
nten
t in
kg h
a-1 y-1
Condition a: 15,000 m3/ha.y
Condition b: 10,000 m3/ha.y
Condition c: 5,300 m3/ha.y
Condition d: 3,800 m3/ha.y
05000
100001500020000250003000035000
K in
put
Kou
tput
Kba
lanc
e
K in
put
Kou
tput
Kba
lanc
e
K in
put
Kou
tput
Kba
lanc
e
K in
put
Kou
tput
Kba
lanc
e
Medium floods Moderately-largefloods
Large floods Very large floods
K c
onte
nt in
kg
ha-1
y-1
Condition a: 15,000 m3/ha.y
Condition b: 10,000 m3/ha.y
Condition c: 5,300 m3/ha.y
Condition d: 3,800 m3/ha.y

Nutrient and Sediment Yield Analyses for the floodwater and Irrigated Fields 147
9.4 Nutrient Balances of the Irrigated Fields
Nutrient balance measurements were conducted in 2002 and 2004 in twelve randomly selected fields - four in each of the upstream, midstream and downstream sites of the Wadi Laba irrigation system (these are the same fields as those tested for salinity, Chapter 8). In an effort to have a representative soil sample, each of the selected fields (1 ha in size) was divided into 25 small rectangles of about 400 m2. Since nutrients are extracted along with water, 40:30:20:10 nutrient uptake pattern was assumed and the soil profile was divided into four quarters as in Figure 8.3. From each quarter and the small rectangle, soil samples were taken using an auger. The samples were then mixed thoroughly to form one composite sample for each of the quarters (0 to 50, 50 to 100, 100 to 150, 150 to 200 cm depth). All samples were taken at the end of the flood season (just before sowing) so as to have a clear picture of the amount of nutrients available for the following crops.
The soil nutrient analyses were carried using the same methods as those of the flood samples. Since it has an impact on nutrient availability, the soil pH was also measured in a saturated soil-paste-extract using a pH meter. The method used for preparing saturated soil-paste-extract is as discussed in Chapter 8.
The measured NPK and pH values of the selected Wadi Laba fields are given in Tables 9.8 and 9.9. All the fields were found to have a more or less neutral pH allowing sufficient uptake of all nutrients. NPK are readily available and can easily be abstracted by most crops (including Sorghum and Maize) at a pH range of 6.5 to 8.5 (Jones, 2003).
Tables 9.8 Measured NPK of the Wadi Laba irrigated fields (our survey, 2002)
Sampling site and depth N in g kg-1 P in g kg-1 K in g kg-1 pH
Upstream field
0 to 50 cm 1.28 0.89 8.77 7.5
50 to 100 cm 0.95 0.79 8.58 8
100 to 150 cm 0.89 0.56 7.01 7.6
150 to 200 cm 0.73 0.33 7.60 7.7
Average 0.96 0.63 7.99
Midstream field
0 to 50 cm 1.30 1.25 12.50 6.8
50 to 100 cm 1.09 0.91 11.91 6.9
100 to 150 cm 0.90 0.83 11.32 7.9
150 to 200 cm 0.80 0.76 11.12 7.3
Average 1.02 0.93 11.71
Downstream fields
0 to 50 cm 1.25 0.50 8.62 7.4
50 to 100 cm 0.96 0.45 7.15 6.6
100 to 150 cm 0.87 0.39 6.57 8.3
150 to 200 cm 0.68 0.32 6.13 8.2
Average 0.94 0.41 7.12
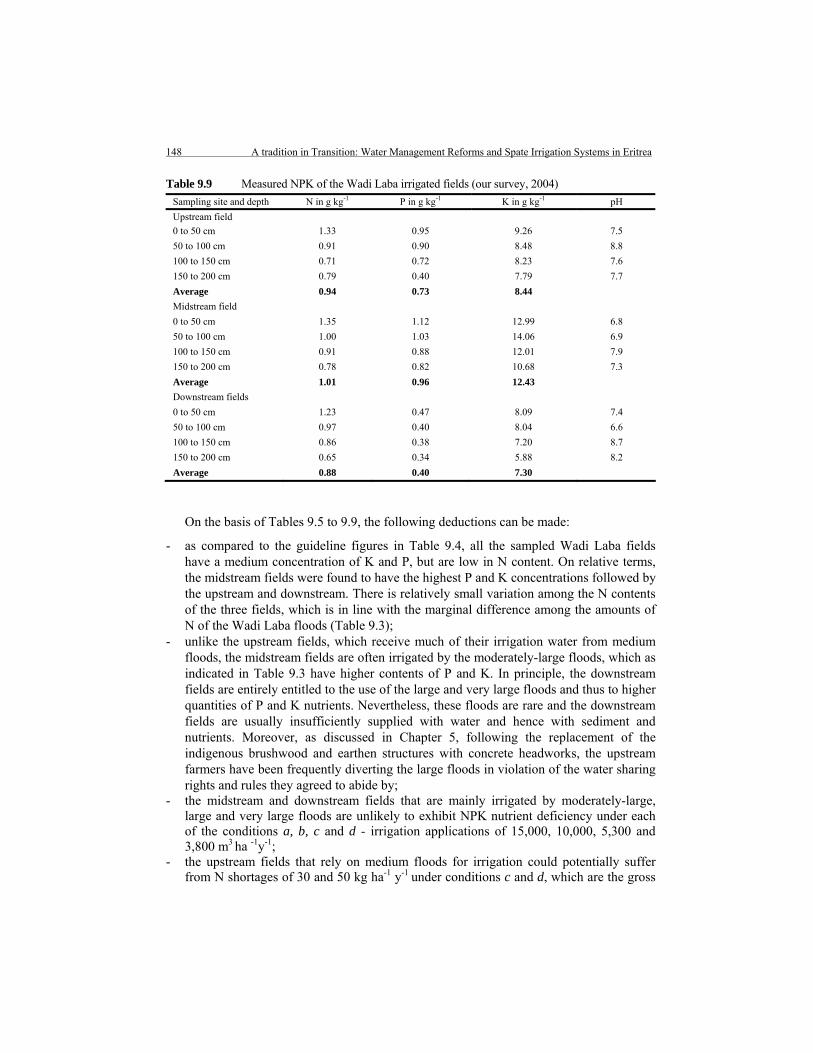
148 A tradition in Transition: Water Management Reforms and Spate Irrigation Systems in Eritrea
Table 9.9 Measured NPK of the Wadi Laba irrigated fields (our survey, 2004)
Sampling site and depth N in g kg-1 P in g kg-1 K in g kg-1 pH
Upstream field
0 to 50 cm 1.33 0.95 9.26 7.5
50 to 100 cm 0.91 0.90 8.48 8.8
100 to 150 cm 0.71 0.72 8.23 7.6
150 to 200 cm 0.79 0.40 7.79 7.7
Average 0.94 0.73 8.44 Midstream field
0 to 50 cm 1.35 1.12 12.99 6.8
50 to 100 cm 1.00 1.03 14.06 6.9
100 to 150 cm 0.91 0.88 12.01 7.9
150 to 200 cm 0.78 0.82 10.68 7.3
Average 1.01 0.96 12.43 Downstream fields
0 to 50 cm 1.23 0.47 8.09 7.4
50 to 100 cm 0.97 0.40 8.04 6.6
100 to 150 cm 0.86 0.38 7.20 8.7
150 to 200 cm 0.65 0.34 5.88 8.2
Average 0.88 0.40 7.30
On the basis of Tables 9.5 to 9.9, the following deductions can be made:
- as compared to the guideline figures in Table 9.4, all the sampled Wadi Laba fields have a medium concentration of K and P, but are low in N content. On relative terms, the midstream fields were found to have the highest P and K concentrations followed by the upstream and downstream. There is relatively small variation among the N contents of the three fields, which is in line with the marginal difference among the amounts of N of the Wadi Laba floods (Table 9.3);
- unlike the upstream fields, which receive much of their irrigation water from medium floods, the midstream fields are often irrigated by the moderately-large floods, which as indicated in Table 9.3 have higher contents of P and K. In principle, the downstream fields are entirely entitled to the use of the large and very large floods and thus to higher quantities of P and K nutrients. Nevertheless, these floods are rare and the downstream fields are usually insufficiently supplied with water and hence with sediment and nutrients. Moreover, as discussed in Chapter 5, following the replacement of the indigenous brushwood and earthen structures with concrete headworks, the upstream farmers have been frequently diverting the large floods in violation of the water sharing rights and rules they agreed to abide by;
- the midstream and downstream fields that are mainly irrigated by moderately-large, large and very large floods are unlikely to exhibit NPK nutrient deficiency under each of the conditions a, b, c and d - irrigation applications of 15,000, 10,000, 5,300 and 3,800 m3 ha -1y-1;
- the upstream fields that rely on medium floods for irrigation could potentially suffer from N shortages of 30 and 50 kg ha-1 y-1 under conditions c and d, which are the gross
Nutrient and Sediment Yield Analyses for the floodwater and Irrigated Fields 149
and net optimum sorghum irrigation requirements used for the design of the Wadi Laba modern headworks. It can be rightly argued that the 30 and 50 kg ha-1 y-1 N deficiencies may have never taken place in reality. A field that receives a single irrigation turn (about 5,000 m3 ha-1 y-1) would only yield forage (Chapter 4). If even the optimum forage production of 2,000 kg ha-1 y-1 is used, the annual N input would surpass the output by 45 and 24 kg ha-1 y-1. The negative N balances, however, underline one important point. The Wadi Laba modern headworks do not only supply insufficient irrigation (net water annual requirement is about 8,200 m3 ha-1 y-1), but does not also provide the optimum sorghum N needs;
- two irrigation turns (10,000 m3 ha-1 y-1) supply sufficient NPK for the optimum yield - 4.5 and 2 ton ha-1 y-1 of sorghum grain and forage;
- despite the fact that the N content of the sampled flood waters and the irrigated fields was found to be low, the N-balance is still in the positive territory mainly because of the magnitude of the sediment concentration of the floods and hence the quantity of the sediment annually deposited in the fields. If the Government plan to introduce soil and water conservation measures in the upper catchment is implemented and this leads to a 50% reduction of the sediment concentrations of the floods, the N-balance of the upstream fields would be zero and -34 kg ha-1 y-1 under the conditions a and b respectively. Whereas under the c and d conditions, the depletion levels could increase to 66 and 77 kg ha-1 y-1, which are very high (Figure 9.1), and the phosphorous balance would enter a negative territory at 3 and 11 kg ha-1 y-1. Should the sediment concentrations be reduced by three quarters, under a and b conditions, the upstream fields would only be respectively furnished with 50% and 30% of the nitrogen needed for optimum sorghum yield. The corresponding supplies under c and d conditions would be 10% in the upstream fields and 50% in the midstream fields;
- if the proposal to limit the irrigation application to two turns of 6,000 m3 ha-1 y-1 (Chapter 6) is followed through, under the scenario of 50% reduction of sediment concentration of the floods, the N supply to the upstream fields would be deficient by 21 kg ha-1 y-1, which is considered low. At 75% sediment reduction, the N supply shortage would be 60% of what is needed for optimum production.
9.5 Concluding Remarks
The veracity of hypothesis stated at the beginning of this Chapter, which is an echo of the assumption made during the water management reform - the Wadi Laba floods could furnish sufficient quantity of nutrients for the optimum sorghum grain and forage production of 4.5 and 2 ton ha-1 y-1 and thus there is no need for fertility replenishment - could be interpreted as follows:
- under the current sediment concentrations of the floods, the hypothesis is fully true under conditions a and b;15,000 and 10,000 m3 ha-1 y-1 respectively, and the suggested irrigation supply of 12,000 m3 ha-1 y-1. The hypothesis could, however, be falsified under conditions c and d as the medium floods would respectively supply only about 70 and 50% of the N required for the optimum sorghum production;
- at some future point in time when the sediment concentrations of the floods would be half of what it currently is, the hypothesis would be wholly true under condition a; but
150 A tradition in Transition: Water Management Reforms and Spate Irrigation Systems in Eritrea
only partially true under the 12,000 m3 ha-1 y-1 water supply and the conditions b, c and d since the N input by the medium floods would be short by about 21, 35, 70 and 80 kg ha-1 y-1 respectively of what is needed for the optimum sorghum yield;
- at some further point in time when the current sediment concentrations of the floods would be reduced by three quarter, the hypothesis would only be partially true under the irrigation amount of 12,000 m3 ha-1 y-1 and all the conditions a, b, c and d. This is because the upstream fields that get their supply from mainly the medium floods would be respectively furnished with only 40, 50, 30, 15 and 10% of the total kg ha-1 y-1 N required for the optimum sorghum production.
The N supply by the medium and small floods, and these floods accounted for about 77% of the total 229 floods that occurred between 1992 and 2004, is of major concern. For the reasons outlined earlier, it is inevitable that the government will embark on its soil and water conservation measures in the upper catchment. This, as predicted in the above could at ‘some time’ in the future lead to N deficiency of at least 50% of what is needed to harvest the optimum sorghum yield. That ‘some time’ may not be very distant because the severity of land fertility degradation in the upper catchment is already acknowledged by the government, and economic conditions permitting, soil and water conservation measures are likely to be implemented at a fast pace and a large scale. This could, in a short period of time, lead to two or three fold reduction in the sediment concentration of the floods making artificial fertilizer application (particularly that of N) a necessity to sustain the optimum sorghum production in the spate irrigated fields. The flood water-sediment-nutrient analyses presented here may serve as a basis for triggering the coordination between the soil and water conservation activities in the upper catchment on the one hand, and the field experiments and awareness creation campaigns with regard to soil fertility management practices in the spate irrigated fields on the other. It is remarkable to note that fertility management in the Wadi Laba would not be only a technical and an economical challenge, but also a social challenge. Technically, effective fertilizer application is difficult. Given the fact that large uncontrolled quantity of water is applied at each irrigation turn, fertilizer losses could be high. This could in turn pose an economical challenge - ensuring each additional US$ fertilizer input results in a sorghum yield US$ profit margin. As to the social challenge, it would need a lot of training and educational campaigns, and concrete on-site field experiment that shows tangible favorable results to convince the Wadi Laba farming communities to adopt a certain artificial fertility management approach. The communities have never used fertilizers for the past hundred years; they still strongly believe that their fields are fertile as they are naturally replenished with alluvial sediments brought by the floods.
Another contribution of the presented flood water-sediment-nutrient analyses could be that it may perhaps create, among the respective soil and irrigation experts and technicians in the area, the need to monitor the flood water-sediment-nutrient correlation. This could in turn help, as necessary, plan gradual field nutrient management interventions. The simplified nutrient output and input equations and the nutrient balance approach outlined in this Chapter may help the soil and irrigation experts and technicians to relatively easily undertake the said monitoring task.
Evaluation 151
10 Evaluation
10.1 The Wadi Laba Indigenous Water Management System: Successes and Limitations
The Wadi Laba indigenous water management system had two major objectives:
- supplying a field with at least three and at most four irrigation turns of 50 cm each so as to guarantee sorghum or sorghum and maize yield of 4.5 ton ha-1 y-1;
- promoting fair flood water sharing within and among the upstream, midstream and downstream irrigated areas.
To cope with the unpredictability in occurrence and destructive nature of the flood water, and to attain the stated objectives, the farmers put in place a set of water rights and rules as the main pillar of their water management system. The two most important water rights and rules were:
- Water right on sequence. This water right adjusts to the size of floods and allocates medium and smaller floods (≤ 50 m3 s-1) and occasionally moderately-large floods (50 to 100 m3 s-1) to the upstream fields; moderately-large and sometimes large floods (100 to 200 m3 s-1) to the midstream fields; large, and very large floods (200 to 265 m3 s-1) to the downstream fields;
- Water right on irrigation turns. This water right states that a certain field can get a second, third and fourth turn, only after all other fields receive one, two and three turns respectively. It further directs that in a new year, regardless of their location, the fields that remained dry in the previous year should get one turn before any of the other fields.
In the indigenous layout, once the medium and large floods destroyed the indigenous diversion and distribution structures (Agims and Musghas), there were structures and canals to guide the water back to the farthest midstream and downstream fields. The upstream farmers, although given the field-to-field water distribution system, they could have used the large floods, they often allowed the floods to flow downstream. The unpredictability of the flood water is such that failure to timely maintain the main Agims and Musghas could effectively mean that there may not be a next irrigation. Sufficient human labour and animal draught resources for maintenance could be made available only when the midstream and downstream farmers also contributed. These farmers were willing to contribute only if they were not systematically deprived of their water rights.
Another key pillar of the indigenous water management system was the farmers’ organization. This organization was led by sub-group leaders (Teshakil) at the tertiary level, group leaders (Ternefti) at the secondary level and the irrigation committee at main system level. Irrigation committee comprises of the five Ternefti responsible for the five irrigation zones, from upstream to downstream: Sheeb-Kethin, Ede-Abay, Errem, Debret and Emdenay/Ede-Eket. The organization was effective in organizing and executing the timely
152 A Tradition in Transition: Water Management Reforms and Spate Irrigation Systems in Eritrea
operation and maintenance of the indigenous structures, enforcement of the water rights and rules and resolution of conflicts. To this end, the major factors were:
- the full autonomy of the farmers’ organization with respect to the organizational control of water. The organization was entirely responsible for making all decisions on how water should be distributed;
- the near-complete financial autonomy of the farmers’ organization. The operation, (re)construction and maintenance of the system’s infrastructure was primarily accomplished by mobilizing the human labour and draught animals of the farming communities. The relevant government institutions provided some materials such as shovels, spades and occasionally bulldozers only on a request from the organization;
- the strong belief in equity of the socio-economically homogenous Wadi Laba community (land holding per household was about 1 ha);
- the fact that the Ternefti and Teshakil were elected by the farmers.
The two pillars of the indigenous water management system did not fully succeed in mitigating the unpredictability and destructive nature of the floods. They only partially achieved their stated objectives:
- a maximum of 60 and 80% of the total 2,600 ha received three or four turns in an average and good/excellent seasons respectively. Good and bad production years alternated, and the farming community remained poor, living from hand to mouth, albeit homogenously;
- did not manage to fully realize ‘physical’ fairness, but instilled a ‘perception’ of fairness in water sharing. This encouraged cooperation among the farming community. As a result, during the past 100 years (1900 to 2000) when many devastating floods occurred, erosion and intrusion of coarse sediment to the canals and fields was largely prevented.
These achievements had, however, come at some cost to the environment. The use of brushwood for frequent maintenance of the Agims and the Musghas was a major contributor to the 60% reduction in vegetation cover in the area. The elderly farmers explained that in the 1950s, they only walked about 15 minutes to fetch brushwood, where as now, the shortest walking distance is 90 minutes.
10.2 Water Management Reforms in the Wadi Laba: Expectations and Realities
The water management reforms introduced concrete headworks in 2000. This replaced the major Agims and Musghas, which diverted and distributed water from the Wadi to the two main canals - the Sheeb-Kethin, and Sheeb-Abay, a common canal for the other four irrigation zones. The 1994 Land Proclamation was also implemented as a replacement to the indigenous land tenure system, the Risti. Literally translated, Risti, a local (Tigrigna) term, means that ownership of land in a village is vested on the Enda - the extended family that has direct lineage to the founding fathers of the village. The water management reforms had not, however, changed the field-to-field water distribution system; they neither modified the existing water sharing rights and rules, nor formulated and enforced new ones.
The major components of the concrete headworks are: main and secondary canal gates, culvert, scour sluice, gravel trap and breaching bund. The culvert replaced the Sheeb-Kethin

Evaluation 153
open earthen canal. The scour sluice prevents coarse sediments from entering the main gates. The gravel trap collects the coarse sediment the scour sluice failed to remove. The breaching bund, the only earthen structure, is designed to fail at a 5-year return flood or a discharge of 265 m3 s-1 thus, minimizing damage to the concrete parts of the headworks.
The stated objectives of the water management reforms were:
- providing three irrigation turns of 50 cm each to all the 2,600 ha in an average season; - diverting large and very large floods in a reliable and regulated manner thereby
increasing the possibility of irrigating downstream fields, while minimizing erosion and deposition of coarse sediments in canals and fields;
- reducing deforestation by limiting the use of brushwood for (re)construction and maintenance of the Agims and Musghas;
- avoiding land fragmentation that is being caused by the Risti.
The Wadi Laba upper catchment, which is characterized by mountainous and hilly terrain, is the sole supplier of water, sediment and nutrients for the low-lying irrigated fields. During the water management reforms, it was assumed that the upper catchment delivers flood waters of good quality (non-saline and non-sodic). It was also considered that the suspended sediments brought-along by the floods adequately replenish the annual depletion of macro nutrients, namely Nitrogen, Phosphorous and Potassium (NPK).
In this study, three hypotheses that reflect the objectives and the underlying assumptions of the water management reforms were evaluated:
1. the concrete headworks and their design and layout mitigate the unpredictability and destructive nature of all the different flood sizes and provide three irrigation turns of 50 cm each to the 2,600 ha; the 1994 Land Proclamation addresses the legal loophole of the Rsiti that cause land fragmentation;
2. irrespective of their discharges, all the floods supplied by the upper catchment are non saline and non-sodic and therefore do not restrict infiltration rates or cause toxicity, and do not induce yield reduction of sorghum and maize, the major crops in the Wadi Laba;
3. the suspended sediments of the small, medium and large floods delivered by the upper catchement provide NPK nutrients sufficient for 4.5 and 2 ton ha-1 y-1 sorghum grain and forage productions respectively.
Hypothesis 1 Hypothesis 1, which is an echo of the stated objectives of the water management reforms, was found to be not correct. The realities after the water management reforms were:
- in an ‘excellent season’, only 1,550 ha received three turns; - the downstream Emdenay/Ede-Eket fields remained dry in an excellent flood season; - the scale of deforestation did not decline; - the 1994 Land Proclamation is yet to prevent fragmentation of land, but has already
created a feeling of land and water insecurity among the farmers. This in turn is making many farmers reluctant to participate in operation and maintenance activities thus putting the sustainability of the irrigation system at risk.
These realities were mainly the result of:
154 A Tradition in Transition: Water Management Reforms and Spate Irrigation Systems in Eritrea
- estimating the design discharge of the main canal head regulator gates on the basis of a single cropping season or net crop water requirement of 380 mm. In the Wadi Laba, farmers harvest at least twice a year, the seeded and ratoon sorghum or seeded sorghum and maize grown as a second crop, and these on average require 780 mm;
- replacing the Sheeb-Kethin canal with a culvert. This deprived the farmers of their right to divert water directly from the wadi. The culvert also suffered from sedimentation problems. Only about half of the 754 ha was irrigated in an excellent season;
- re-location of the Ede-Abay canal from upstream to a further midstream where it abstracts water from a joint branch canal with Debret. This caused about 50% of the 500 ha to remain dry in an excellent season;
- the fact that the breaching bund was damaged twice a year and that it was not timely maintained, which led to the discharging of almost all large floods back to the Wadi. The new layout did not cater for the re-diversion of the floods to the midstream and downstream fields;
- the construction of an additional intake by Ede-Abay and the use of the scour sluice by Sheeb-Kethin for supplementary water supply. These structures required brushwood for their reinforcements; and the additional water they diverted caused damage to some downstream Agims and Musghas. The total amount of brushwood being used is almost the same as that utilized prior to the introduction of the concrete headworks;
- the provision of the Land Proclamation that prohibits partition of land through inheritance could have limited land fragmentation. This is, however, overshadowed by the other provision that bestows an absolute power on the government to expropriate land that people have been using for agricultural or other activities, for purposes of various national development projects. This is in sharp contrast to the provision of the Risti that guarantees land and water security by clearly spelling out that no institution or individual has the power to confiscate a land allocated to a verified Enda member.
These limitations may be addressed by the following interventions:
- replacing the Sheeb-Kethin culvert with a head regulator gate alongside the existing gates so that it can supply water directly from the Wadi and restore the upstream water right of the farmers. The head regulator would have to be designed to fill the current nearly 4,000 m3 ha-1 y-1 gap between the water supply and demand;
- providing the farthest midstream and the Emdenay and Ede-Eket downstream fields with separate gabion intakes to enable them to divert flood water directly from the canals, and even the Wadi , when, for instance, the breaching bund fails;
- replacing the existing field-to-field water distribution with a ‘group of fields’ water distribution system;
- supplementing the Land Proclamation with (sub) provisional laws that clarify what the land and water rights and obligations of the farmers are in the post water management reform era;
- avoidance of Government interference in issues such as forcible change of the cropping pattern from the sorghum and maize crops to a commercial cotton crop. These types of interferences, rightly or wrongly, are interpreted by the farmers as being steps by the Government towards an eventual reclaiming of their land and water resources.

Evaluation 155
The following additional measures may complement the presented technical interventions in improving the supply and distribution of the flood water:
- limiting the maximum number of irrigation turns to two. This could have saved 7.75 million m3 from the 1,550 ha that were irrigated thrice in the excellent year 2004. This amount can sufficiently irrigate 775 ha;
- modifying the existing water right on sequence to: regardless of the size of the floods, if upstream and midstream fields receive two turns by mid to end of July, the floods would have to be allowed to flow downstream. This could make it possible for the midstream and downstream fields to utilize medium and smaller floods. These floods, according to the 13-year record (1992 to 2004), accounted for 77% of the total 229 floods that occurred.
These last two recommendations are made on the basis of the major conclusion drawn from the Soil Moisture Storage (SMS) simulation results obtained from the Soil Water Accounting Model that was developed as part of this research. The conclusion was that regardless of whether a field receives three or two turns, the SMS remains almost the same at 66 cm, 71 cm and 76 cm if the field gets its last turn by 15 July, 30 July and 15 August respectively. The 66 cm water depth (with minor contribution from rainfall) sufficiently supports 4.5 ton ha-1 y-1 of sorghum or sorghum and maize. SMS is the amount of water a certain field can retain at the onset of the planting season (September 15) following irrigation during the flood season (15 June to 15 August).
On the institutional front, great strides have been made with the establishment of the Wadi Laba organization with almost full membership of all farmers and the universal endorsement of its by-laws. The leadership of this organization is very much based on the time-tested system of Ternefti and Tesahkil and are capable of addressing the water management aspects related to the “organization control” of water. The main challenges in the coming period are the internal organization, the collection of adequate funding (also in an occasional disaster year) to meet higher maintenance and repair costs, the running of earthmoving equipment and the operational fine-tuning of the modernized system. To provide an example concerning the repair cost, the earthen breaching bund of the modern headwork alone required annually between US$ 5,400 and US$6,000, which is about 12 times that of the major Agims.
To meet the presented challenges, the following interventions may be necessary:
1. establishing a water fee system: the monthly or annual fee to be contributed would have to be decided by the farming community, but it should at least cover operation and maintenance costs. The fees would have to go directly to the organization coffers. To collect and manage the fees, the organization needs to enlist a treasurer and a secretary at each sub-group and group, and the irrigation committee levels;
2. providing a legal status to the Wadi Laba organization: the establishment and existence of the organization would have to be supported by an official decree or law. Further, the organization needs to be given the legal authority to, for instance, operate independent bank accounts, which is important for financial accountability; make direct contacts with internal and external funding agencies, and this is essential in emergency situations if and when a major part of the concrete structure is damaged and its repair can not be covered

156 A Tradition in Transition: Water Management Reforms and Spate Irrigation Systems in Eritrea
from the water fee collected; own or hire assets such as machinery to help in timely repair and maintenance of the infrastructure;
3. putting in place clear policy directives with regard to the ownership of the modern infrastructure: Eritrea is yet to draft a comprehensive national or provincial water policy. But it is imperative that any future water policy clearly vests ownership of the Wadi Laba modern infrastructure on the Wadi Laba farmers’ organization. It has to be noted that lack in clarity with regard to the ownership of the infrastructure constructed with donor money has considerably contributed to the poor management and underperformance of several rural water development projects in Tanzania;
4. avoiding the creation of dual structures (traditional and formal): the sub-provincial Ministry of Agriculture would have to refrain from instituting leaders and organizations parallel to the existing Wadi Laba organization. It has already been proven that such interventions, other than being catalysts for straining the relationship between the Ministry of Agriculture staff and the farmers’ organization; they had produced no noticeable positive impact on the floodwater management. It may be advisable that the Ministry of Agriculture and other concerned Government bodies focus their efforts on formulating and implementing training modules that strengthen the abilities of the existing organization and its leadership in repair, operation and maintenance of the modern irrigation infrastructure; preparing simple financial balance sheets as well as work plans and reports for operation and maintenance and other farming activities. The trainings would also have to help bring-about financial accountability at all ladders of the organization. Lack of financial accountability was the major cause for the downfall of many cooperatives and farmers’ organizations in Tanzania.
Hypothesis 2 Hypothesis 2 was found to be partially false with regard to salinity, but nearly fully true as far as sodicity is concerned.
The moderately-large, large and very large floods were slightly, and moderately saline. In view of the existing water rights on sequence and the fact that three and two irrigation turns furnish 0.1 and 0.3 leaching fractions respectively, the impact analyses of the floods on sorghum and maize yields revealed:
- in a midstream field that received two turns, there would be no sorghum yield reduction, but that of maize could decline by 30 to 50%. A three irrigation turn - two from moderately-large and the third from large flood - could limit the maize yield loss to 10%;
- if a downstream field receives two irrigation turns from large floods, sorghum and maize yields could decrease 15% and 70% respectively; in the case of very large floods, by 75% and 100%. If the field is irrigated thrice, only maize yield would decline by 30% (large floods) and 50% (very large floods).
To minimize the salinity induced sorghum and maize yield losses, the following may be considered:
- modifying the water right on sequence and providing separate intakes for midstream/ downstream fields;
- limiting the maximum irrigation application to two turns of 6,000 m3 ha-1 y-1 each. This provides 0.3 leaching fraction;
Evaluation 157
- strengthening the farmers’ awareness of salinity and its impacts on crop yield so that they grow only sorghum in the fields irrigated by large floods;
- introducing a water management policy of discharging the very large floods to the Wadi and convincing the farmers not to use them;
- opting for crops that are at least moderately tolerant to salinity if and when the need arises to introduce new crops.
As to sodicity, the existing adjusted Sodium Adsorption Ratio (RNa) method and the Rootzone Average Sodicity Ratio (RNae) approach suggested in this research have shown that all the different flood sizes do not cause infiltration problems. However, the Exchangeable Sodium Percentage (ESP) obtained from the RNae was 9% while that derived from the RNa was only 1.6%. A soil with an ESP values in the range of 5 to 10% indicate a sodic soil and this can cause toxicity in sensitive crops such as maize. Even sorghum, a semi-tolerant crop can suffer from sodium toxicity at 15% ESP.
Hypothesis 3 On the basis of the flood-sediment-nutrient analyses results, hypothesis 3 was found to be false only with respect to medium floods and nitrogen nutrient under the scenario that the Government will implement soil and water conservation measures in the upper catchment and that this would lead to a reduction in the sediment concentration of the floods.
Assuming that the current sediment concentration of the medium floods would be halved at some future point in time, the nitrogen balances would be 0, -20 and -35 kg ha-1 y-1 in a field that receives 15,000, 12,000 and 10,000 m3 ha-1.y-1 respectively. The corresponding nitrogen balances at 75% reduction of sediment concentration would be -50, -60 and-70 kg ha-1 y-1. Nitrogen balances of up to -30 kg ha-1 y-1 are considered low, but are indicative of the need to carefully monitor the impacts on yield. Nitrogen balances in the range of 30 to 60 and above 60 kg ha-1 y-1 are assumed moderate and high and suggest that artificial nutrient replenishment is required.
The scenario that the Government will introduce soil and water conservation is not a pure speculation; it is rather based on some facts. In the past 5 years, due to the campaign led by the Government to group scattered villages for administrative and other reasons, the number of inhabitants that directly rely on the rainfed farms in the upper catchment has increased and is on the rise. Moreover, the sorghum production in the rainfed farms has decreased from a maximum of about 1 ton ha-1 y-1 in the 1950s to almost zero, as since 2000, the fields have been producing only forage. This decline in production is attributed to nutrient degradation induced by erosion of the fertile top soil. Accordingly, the Government has already planned a number of soil and water conservation measures, which resources permitting could be implemented at a fast pace and a large scale.
Therefore, the time when the sediment concentration of the floods would be reduced by half or three quarter and hence the time when there would be a need to embark on identifying suitable artificial nitrogen replenishment methods may not be remote. This is also because a lot of training and educational campaigns and concrete on-site field experiments that show tangible favourable results would be required to convince the farmers to adopt a certain artificial fertility management approach. The farmers have never used fertilizers for the past

158 A Tradition in Transition: Water Management Reforms and Spate Irrigation Systems in Eritrea
100 years; they still strongly believe that their fields are fertile as they are naturally replenished with alluvial sediments brought by the floods.
10.3 Further Research
As a contribution to the ongoing efforts to make spate irrigation systems competitive and reliable sources of livelihood at above subsistence levels, the following research themes are recommended for further investigations:
1. systematic assessment of groundwater potential, and development of a package of good alternative management practices for conjunctive use of groundwater and floodwater under different physical settings and social fabrics;
2. identifying, understanding, documenting and evaluating the best indigenous design approaches with regard to floodwater harnessing, diversion and distribution;
3. developing a down-to-earth computer model (that can be easily used by water management technicians and understood by decision makers) to assess the implications of different land use practices in upper catchments on the quantity and quality of floodwater, nutrient and sediment flow to low-lying spate irrigated fields;
4. understanding the historical evolution of the farmers’ institutions that have been and are still managing spate irrigation systems in some 20 countries as well as their core guiding floodwater management principles that reflect the ethnic and cultural diversity of the respective societies.
5. breeding of local and non-local crop varieties with the objective of producing drought resistant, short maturity and good yielding hybrid varieties.
10.4 Concluding Remarks: The Way Forward
The very existence of spate irrigation systems (Wadi Laba included) as major sources of food production to a large extent depends on whether or not the water management reforms make the systems competitive and credible sources of livelihood so that future generations will be encouraged to practice the systems and invest into their development. To this end, the discussed technical, institutional, legal and environmental flood water management measures are vital and they would have to be taken as one package so that their interdependences and collective impacts on crop production can be better understood and evaluated. It is important to note, however, in some spate irrigation systems, enforcing the said flood water management measures in an integrated form may only at best enable the water management reforms to achieve their set targets at an average and better flood seasons. For instance, in the Wadi Laba dry flood seasons, which accounted for 25% of the time in the period 1992 to 2004, when there has not been sufficient water to irrigate the whole area and when at most one or two large floods that can reach the downstream area have occurred, attainment of the targets necessarily requires supplementing the flood water with groundwater. To the present day, there is no groundwater abstraction in the Wadi Laba area, except for drinking purposes from a few scattered shallow wells on the banks of the Wadi. Some of these wells are highly saline (> 3 dS m-1) whereas others are of good quality (< 1 dS m-1). The groundwater potential (quantity and quality) has not been systematically studied - it is worthy making investment to that end.

References 159
References
Ahmed, S., 2000. Indigenous water harvesting systems in Pakistan. Water Resources Research Institute (WRRI), National Agricultural Research Centre (NARC), Islamabad, Pakistan [online]. Availabe at: http://www.wca-infonet.org/id/136523 (Accessed 25 June, 2006).
Al-Eryani, M., Al-Amrani, M., 1998. Social and organizational aspects of the operation and maintenance of spate irrigation systems in Yemen. In: Participatory Irrigation Management (PIM) in Surface Irrigation Systems; Proceeding of the World Bank Sponsored PIM seminar, Hudaidah, Republic of Yemen, 22 - 27 November, 1998.
Alexander, P., Bindiganavile, V., 2004. Combining ability of International Wheat and Maize Improvement Centre (CIMMYT) early maturing maize (Zea mays L.) germplasm under stress and non-stress conditions and identification of testers. In: New Directions for a Diverse Planet; Proceedings of the 4th International Crop Science Congress, Brisbane, Australia, 26 September -1 October, 2004.
Allen, R.G., Pereira, L.S., Raes, D., Smith, M., 1998. Crop evapotranspiration: Guidelines for computing crop water requirements. FAO Irrigation and Drainage Paper 56, FAO, Rome.
Al-Shaybani, S.R., 2003. Overview of non-modernized spate irrigation systems in Yemen [online]. Availabe at: http://www.spate-irrigation.org (Accessed 10 July, 2006).
American Public Health Organization, 1992. Standard methods for examination of water and wastewater, 18th edition, p. 3-95.
Arson, D., 1996. Systems thinking [online]. Availabe at: http://www.thinking.net (Accessed 5 February, 2007).
Ayers, R.S., Westcot, D.W., 1985. Water quality for agriculture. FAO Irrigation and Drainage Paper 29 Rev. 1, FAO, Rome.
Black, T.A., Gardner, W.R., Thurtell, G.W., 1969. The prediction of evaporation, drainage and soil water storage for a bare soil. Soil Science Society American Journal 33:655-660.
Boelens, R., 2003. Local rights and legal recognition: The struggle for indigenous water rights and the cultural politics of participation. In: Water and Indigenous Peoples; Proceeding of the Third World Water Forum, Kyoto, Japan, 16-23 March 2003.
Boesten, J.J.T.I., Stroosnijder, L., 1986. Simple model for daily evapotranspiration from fallow tilled soil under spring conditions in a temperate climate. Netherlands Journal of Agricultural Science 34: 75-90.
Boiten, W., 2000. Hydrometry. International Institute for Infrastructure, Hydraulic and Environmental Engineering, IHE, Delft. Lecture Note Series, Balkema, Rotterdam, ISBN: 9054104198.
Bos, M.G., Burton, M.A., Molden, D.J., 2005. Irrigation and drainage performance assessment: Practical guidelines. CABI, Wallingford, Oxfordshire, OX10 8DE, UK, ISBN: 9780851999678, 166 pp.
Bos, R., 2000. International Commission on Irrigation and Drainage (ICID) guidelines on performance assessment. In: Performance Indicators and Benchmarking; Proceeding of

160 A Tradition in Transition: Water Management Reforms and Spate Irrigation Systems In Eritrea
International Program for Technology and Research in Irrigation and Drainage (IPTRID), FAO and World Bank Joint Workshop, Rome, Italy, 3-4 August, 2000.
Brouwer, C., Heibloem, M., 1986. Irrigation water management training manual no. 3: Irrigation water management: Irrigation water needs. FAO, International Support Program for Irrigation Water Management, Land and Water Development Division, Rome.
Central Intelligence Agency, 2006. The World fact book [online]. Available at http://www.cia.gov/cia/publications/factbook (accessed 30 April, 2006).
Connell, D., 2005. Building a New Nation: Collected articles on the Eritrean Revolution (1983-2002). Red Sea Press, ISBN: 1569021988.
Daniel, A.M., 1997. A preliminary report on a pre-project Sheeb socio-economic study: A strategy for rural development, Vol.1 (a) and (b), Ministry of Agriculture, P.O. Box 1048, Asmara, Eritrea, 185 pp.
Daniells, I.G., Holland, J.F., Young, R.R., Alston, C.L., Bernard, A.L., 2001. Relationship between yield of grain sorghum (Sorghum bicolor) and soil salinity under field conditions. Australian Journal of Experimental Agriculture 41: 211-217.
De Laat, P.J.M., 2002. Soil-Water-Plant relations. Lecture Notes. UNESCO-IHE Institute for Water Education, P.O. Box 3015, 2601 DA Delft, the Netherlands, 161 pp.
De Laat, P.J.M., 1995. Design and operation of a subsurface irrigation scheme with MUST. In: L.S., Pereira et al., 1995 (Eds.), Crop water simulation models in practice, Wageningen Pers: 123-140pp.
De Laat, P.J.M., 1992. MUST. A pseudo steady state approach to simulating flow in unsaturated media. ICID Bulletin 41.2.
Elias, E., Morse, S., Beshlaw, D.G.R, 1998. Nitrogen and phosphorous balance of Kindokoisha farms in southern Ethiopia. Agriculture, Ecosystem and Environment 71, 113 pp.
FAO, 2007. Survey on modernization of irrigation schemes [online]. Available at www.fao.org/ag/agL/AGLW/watermanagement/modernis.stm#background (accessed 10 February, 2007).
FAO, 2006. Eritrea-maps. FAO country profiles and mapping information system [online]. Available at www.fao.org/countryprofiles/maps/eritrea (accessed 14 June, 2006).
FAO, 2005. Crop water management. FAO Land and Water Development Division [online]. Available at http://www.fao.org/ag/aGL/aglw/cropwater/maize (accessed 22 September, 2005).
FAO, 2005. Water managed areas and irrigation. FAO’s Information System on Water and Agriculture [online]. Available at www.fao.org/AG/AGL/AGLW/aquastat (accessed 15 April, 2005).
FAO, 2004. Study on livelihood systems in Eritrea: Strengthening and expansion of the national food information system of Eritrea. Project GCPS/ERI/002/ITA, FAO, Rome, Italy.
FAO, 1997. Agro ecological zone map of Eritrea. Department of Land at the Ministry of Land, Water and Environment. Project FAO/TCP/ERI/4554 (A), Field document no. 2, 67 pp.
FAO. 1997. Modernization of irrigation schemes. In: Past Experiences and Future Options; Proceedings of the Expert Consultation, Bangkok, November 1996.

References 161
FAO, 1994. Agriculture Sector Review and Project Identification for Eritrea (3 Volumes). Report prepared for the government of Eritrea. FAO, Rome, 126 pp.
FAO, 1987. Spate Irrigation: Proceedings of the sub-Regional Expert's Consultation on Wadi Development for Agriculture in the Natural Yemen, United Nations Development Program(UNDP)/FAO, Aden, Republic of Yemen, 6-10 December, 1987, 180 pp.
Gillot, P.W., Bird, J.D., 1992. Review of performance indicators for irrigation management: Adequacy and equity. HR Wallingford Report OD/TN 95, Hydraulic Research, Wallingford, UK, p. 28-37.
Grattan, S.R., 1999. Irrigation water salinity and crop production. University of California, Agricultural and Natural Resources, Publication 8066. California, USA.
Halcrow W., 1998. Design report. Eastern Lowlands Wadi Development Project (ELWDP). Ministry of Agriculture, P.O. Box 1048, Asmara, Eritrea, p. 54-75.
Halcrow, W., 1997. Inception report. Eastern Lowlands Wadi Development Project (ELWDP). Ministry of Agriculture, P.O. Box 1048, Asmara, Eritrea, 50 pp.
Hamilton, R., Muhammad, A.K., 1995. Sailaba irrigation practices and practices. Arid Soil Research and Rehabilitation. University of Idaho, ID 83844-2334, USA.
Henao, J., Baanante, C., 1999. Estimating rates of nutrient depletion in soils of agriculture lands in Africa. Muscle Shoals, US, International Fertilizer Development Centre, ISBN: 088090125X.
Hodgeson, S., 2004. Land and water - the rights interface. FAO Legal Papers No. 36 [online]. Available at http://www.fao.org/legal/prs-ol/lpo36.pdf (accessed 5 February, 2007).
Hunt, R.C., 1990. Organizational control over water: The positive identification of a social constraint on farmer participation. In: Young and Sampath, 1990 (Eds.), Social, economic, and institutional issues in Third World Irrigation Management, pp. 141-154. Westview Press, Boulder, Colorado, USA, 414 pp.
International Commission on Irrigation and Drainage (ICID), 2002. Updated statistics on irrigation and drainage in the world, New Delhi, India [online]. Available at www. icid.org/index_e.html (accessed 25 May, 2006).
International Fund for Agricultural Development (IFAD), 2003. The Republic of Yemen: Tihama Environmental Protection Project. Interim evaluation report no. 1360 YE, IFAD, Via del Serafico, 10700142 Rome, Italy, 99 pp.
International Commission on Irrigation and Drainage (ICID), 2002. Multilingual technical dictionary on irrigation and drainage (CD ROM). International Commission on Irrigation and Drainage, New Delhi, ISBN: 81-85068-78-X.
International Fund for Agricultural Development (IFAD), 1995. Appraisals report on Eastern Lowland Wadi Development Project (ELWDP). Ministry of Agriculture, P.O. Box 1048, Asmara, Eritrea and IFAD, Via del Serafico, 10700142, Rome, Italy, 52 pp.
International Glossary of Hydrology, 2007. Glossary of hydrology, water resources management, soil science, meteorology, and statistics and modeling [online]. Available at http://webworld.unesco.org/water/ihp/db/glossary/glu/HINDENT.HTM (accessed 5 February, 2007).
International Program for Technology and Research in Irrigation and Drainage (IPTRID), FAO and World Bank, 2000. Report on the performance indicators and benchmarking workshop, Rome, Italy, 14pp.

162 A Tradition in Transition: Water Management Reforms and Spate Irrigation Systems In Eritrea
Jones, J.B., 2003. Agronomic handbook: management of crops, soils, and their fertility. Boca Raton, Fla., CRC Press, ISBN: 0849308976, 530 pp.
Kabudi, P.J., 2005. Challenges of legislating for water utilisation in rural Tanzania: Drafting new laws. In: African Water Laws: Plural Legislative Frameworks for Rural Water Management in Africa; Proceedings of the International Water Management Institute Workshop, Johannesburg, South Africa, 26 - 28 January, 2005 (Selected for a book chapter, in press).
Kahlown, M.A., Hamilton, J.R., 1996. Sailaba irrigation practices and prospects. Arid Soil Research and Rehabilitation 10: 179-191.
Knudsen, D., Peterson, G.A., Pratt, P.F., 1982. Lithium, sodium and potassium, p. 225-246. In: A.L., Page et al., 1982 (Eds.), Methods of soil analysis: Part 2. Chemical and microbiological properties. ASA Monograph Number 9.
Kroes, J.G., Van Dam, J.C, (Eds), 2003. Reference manual. Soil Water Atmosphere Plant Model (SWAP) version 3.0.3. Wageningen, Alterra, Green World Research, Alterra-project 230427, report 773, 211 pp, ISBN: 15667197.
Kruis, F., 2002. Environmental chemistry selected analytical methods: Laboratory manual. UNESCO-IHE Institute for water Education, Delft, the Netherlands, 92 pp.
Landon, J.R., 1991. Booker tropical soil manual: A handbook for soil survey and agricultural land evaluation in tropics and sub-tropics. Longman Science & Technology, London, UK, ISBN: 0470205210, 474 pp.
Lawrence, P., 1993. Flood irrigation: Sediment control and transport. Preliminary design guide. Balochistan Minor Irrigation and Development Project. Government of Balochistan. Phase II Preparation Studies. HR Wallingford, Halcrow, in association with ULG Consultants, Euroconsult, NESPAK. Technical Assistance Team, Queta, Balochistan, 25 pp.
Leipzig, 1996. Eritrea: Country report. In: Plant Genetic Resources; Proceeding of the International Technical Conference, Asmara, Eritrea.15-28 January, 1996.
Maas, E.V., Grattan, S.R., 1999. Crop yields as affected by salinity, p. 55-108. In R.W., Skaggs and van Schilfgaarde J., 1999 (Eds.), Agricultural drainage. Agronomy Monograph 38. ASA, CSSA, SSSA, Madison WI.
Mehari, A., Schultz, B., Depeweg, H., 2006. Salinity impact assessment on crop yield for the Wadi Laba spate irrigation system in Eritrea. Agricultural Water Management 85. 1&2: 27-37.
Mehari, A., Schultz, B., Depeweg, H., 2005b. Where indigenous water management practices overcome failures of structures. Irrigation and Drainage 54.1: 1-14.
Mehari, A., Schultz, B., Depeweg, H., 2005c. Hydraulic performance evaluation of the spate irrigation systems in Eritrea. Irrigation and Drainage 54.4: 1-18.
Mehari, A., Schultz, B. and Depeweg, H., 2004. If and how expectations can be met? An evaluation of the modernized Wadi Laba irrigation system in Eritrea. In: Food Production and Water: Social and Economic Issues of Irrigation and Drainage; Proceeding of the 55th International Commission on Irrigation and Drainage (ICID) Conference, Moscow, Russia, 4 - 12 September, 2004.
Mehari, A., Schulz, B., Depeweg, H., 2003. Water sharing and conflicts in the Wadi Laba Spate Irrigation System, Eritrea. In: The Consensus to Resolve Irrigation and Water Use
References 163
Conflicts in the Euro-Mediterranean Region; Proceeding of the 20th International Commission on Irrigation and Drainage Conference, Montpellier, France 14 to 19 January.
Mehari, A., Depeweg, H., Stillhardt, B., 2003. Potentials and constraints of smallholder irrigation technology for the highlands in Eritrea. Mountain Research and Development Journal 23.1: 27-31.
Mehari, A., Van Koppen, B., 2006. Impact assessment of the formal water management Approach in the Mkoji sub-catchment, Tanzania. International Water management Institute (IWMI), Colombo, Srilanka (Technical report, in press).
Mehari, A., Van Steenbergen, F., Schultz, B., 2005a. Water rights and rules and management in spate irrigation systems in Eritrea, Yemen and Pakistan. In: African Water Laws: Plural Legislative Frameworks for Rural Water Management in Africa; Proceedings of the International Water Management Institute Workshop, Johannesburg, South Africa, 26 - 28 January, 2005 (Selected for a book chapter, in press).
Ministry of Agriculture (MOA), 2000. Annual report on past and planned irrigation development projects. MOA, P.O. Box 1048, Asmara, Eritrea, 40 pp.
Ministry of Water and Livestock Development. 2002. National Water Policy (NAWAPO). Ministry of Water and Livestock Development, P.O. Box 456, Dodoma, Tanzania, 88pp.
Mualem, Y., 1976. A new model for predicting the hydraulic conductivity of unsaturated porous media. Water Resources Research 12: 513-522.
Natarajan, M., 1999. Report on production and farming systems agronomy: Strengthening the agricultural research and extension in Eritrea. Project no. GCP/ERI/ITA, FAO branch, Asmara, Eritrea, 50 pp.
Natural Resources Consulting Engineering (NRCE), 1996. Final report on the reconnaissance study of water based agricultural development potential in Eastern Eritrea. NRCE, 131 Lincoln Avenue Suite 300, Fort Collins, Colorado 80524, 202 pp.
Nawaz, K., 2003. Spate irrigation in Dera Khazi Khan, Pakistan [online]. Available at http://www.spate-irrigation.org (accessed 5 July, 2006).
North, D.C., Thomas R.P., 1977. The first economic revolution. The Economic History Review 30: 229-241.
Ogbazghi, W., 2001. The distribution and regeneration of Boswellia papyrifera. Tropical Resources Management Papers No. 35, Wageningen University, the Netherlands, 140 pp.
Perry, C.J., 1995. Determinants of function and dysfunction in irrigation performance. Water Resource Development 11.1: 11-24.
Randall, J.S., Sharon, A., 2005. Soils: Genesis and geomorphology. Cambridge University Press, UK, ISBN: 0521812011, 832 pp.
Rao, P.S., 1993. Review of selected literature on indicators of irrigation performance. International Water Management (IWMI) Research Paper No. 13. International Water Management Institute, Colombo, Srilanka.
Ratsey, J., 2004. Engineering in modernized spate irrigation systems. In: P., Lawrence and F., Van Steenbergen, 2004 (Eds.), Improving community spate irrigation, HR Wallingford, Report OD 154, 2005, 258 pp.

164 A Tradition in Transition: Water Management Reforms and Spate Irrigation Systems In Eritrea
Rhoades, J.D., 1982. Reclamation and management of salt-affected soils after drainage. In: Rationalization of Water and Soil Research and Management; Proceeding of First Annual Western Provincial Conference, Alberta, Canada, 14-25 May, 1982.
Richards, L.A., 1954. Diagnosis and improvement of saline and alkali soils. USDA Agricultural Handbook No. 60, US Department of Agriculture, Washington DC. 160 pp.
Richards, L.A., 1931. Capillary conduction of liquids through porous mediums. Physics Journal 1:318-333.
Rijtema, P.E., 1969. Soil moisture forecasting. The Institute for Land and Water Management Research (ICW) nota 513, Wageningen, 18 pp.
Ritzema, H.P., 1994. Subsurface flow to drains. In H.P., Ritzema, 1994 (Ed.), Drainage principles and applications. Alterra-International Land Reclamation Institute (ILRI) publication, No. 16, second edition, Wageningen University and Research, the Netherlands, p. 263-304.
Robbins, C.W., Wiegand, C.L., 1990. Field and laboratory measurements. Chapter 10. In: Tanji, K.K., 1990 (Ed.), Agricultural salinity assessment and management. ASCE Manuals and Reports on Engineering Practices, No.71, ASCE, New York. p. 201 - 219.
Roy, R.N., Misra, R.V., Lesschen, J.P., Smaling, E.M., 2003. Assessment of soil nutrient balance. FAO Fertilizer and Plant Nutrition Bulletin No. 14, ISBN: 9251050384, 101pp.
Schultz, B., Thatte, C., Labhsetwar, V., 2005. Irrigation and Drainage: main contributors to global food production. Irrigation and Drainage 54: 263 – 278.
Schultz, B., 2003. Irrigation and drainage: Present and potential role in food protection and sustainable rural development. In: Proceedings of the World Bank sponsored World Water Week, Washington, D.C, 4- 6 March 2003.
Schultz, B., De Wrachen D., 2002. Irrigation and drainage systems: Research and development in the 21st century. Irrigation and Drainage 51: 311-327.
Schultz, B., 2001. Irrigation, drainage and flood protection in a rapidly changing world. Irrigation and Drainage 50.4: 261-277.
Senge, P., Lannon-Kim, C., 1991. The Systems Thinker Newsletter, V.2, N.5. P.O. Box 1281, Kendall Square, Cambridge, MA.
Shalhevet, J., 1994. Using water of marginal quality for crop production: major issues. Agricultural Water Management 25:233-239
Sithole, B., 2000. Telling it like it is: Devolution in the water reform process in Zimbabwe. In: Constituting the Common: Crafting Sustainable Commons in the New Millennium; Proceedings of the 8th Biennial Conference of the International Association for the Study of Common Property (IASCP), Bloomington, Indiana, USA, 31 May - 4 June 2000.
Smedema, K.L., Voltman, F.W., Rycroft, W.D., 2004. Modern land drainage: Planning, design and management of agricultural drainage. A.A. Balkema Publishers, Taylor and Francis, the Netherlands, ISBN: 9058095541, 446 pp.
Soltanpour, P.N, Benton, J.J., Workman, S.M., 1982. Optical emission spectrometry, p. 29-65. In: A.L., Page et al., 1982 (Eds.), Methods of soil analysis: Part 2. chemical and microbiological properties. Monograph Number 9 (2nd edition), ASA, Madison, WI.
Stephens, W., Hess, T., 1999. System approaches to water management research. Agricultural Water Management 40:3-13.

References 165
Stillhard, B., Gebru, B., Mehari, A., 2003. A feasibility study on the introduction of micro irrigation technology in Eritrea. Centre for Development and Environment (CDE), University of Bern, Switzerland, ISBN: 3-906151-72-7 (Technical Report).
Stroovogel, J.J., Smalling, E.M.A., 1990. Assessment of soil nutrients depletion in sub-Saharan Africa: Volume I-IV, Report 28, the WINAND Staring Centre (SC-DLO) Wageningen, the Netherlands.
Suarez, D.L., 1981. Relation between pH and Sodium Adsorption Ratio (SAR) and an alternate method of estimating SAR of soil or drainage waters. Soil Science Society of America Journal 45:469-475.
Tahir, T.M., Noman, A.A., 2002. Sediment problems of irrigation canals: Field studies to assess the changes in canals profiles and cross-sections. Journal of Science and Technology 7. 2: 25-48.
Tanji, K.K., 1990. The nature and extent of agricultural salinity problems. p. 1 - 17. In K.K., Tanji, 1990 (Ed.), Agricultural salinity assessment and management. ASCE manuals and reports on engineering practices No. 71. Am. Soc. Civil Engineers, New York.
Tesfai, M., 2001. Soil and water management in spate irrigation systems in Eritrea. Tropical resource management paper no. 36, Wageningen, the Netherlands.
Thomas, G.W., 1982. Exchangeable cations. p 159-165. In: A.L. Page et al. (Ed.), Methods of soil analysis: Part 2. Chemical and microbiological properties. ASA Monograph Number 9.
Thomas, W.L., Robert, G.S., Richard, R.T., Howard, W.N., 2004. Soil water monitoring and measurement. A Pacific Northwest Publication, Washington State University, Oregon, Idaho [online]. Available at http://cru.cahe.wsu.edu/CEPublications (accessed 17 August, 2006).
United Republic of Tanzania. 1997. Water Utilization (General) Regulations of 1997. Dar-es-Salaam, the United Republic of Tanzania.
United Republic of Tanzania. 1974. Water Utilization (Control and Regulation) Act of 1974. Dar-es-Salaam, the United Republic of Tanganyika.
United Republic of Tanzania Subsidiary Legislation of 1974. Government Notice No. 347 of 1994 under section 38(2) of the Water Utilization (Control and Regulation) Act No. 42 of 1974. Dar-es-Salaam, the United Republic of Tanzania.
U.S. Salinity Laboratory Staff, 1954. Carbonate and bicarbonate by titration with acid. p. 98. In: L. A., Richards, 1954 (Ed.), Diagnosis and improvement of saline and alkali soils. USDA Agricultural Handbook 60. U.S. Government Printing Office, Washington, D.C.
Van Der Zaag, P., 2006. Water’s vulnerable value in Africa. Value of Water Research Report Series No. 22, UNESCO-IHE Institute for Water Education, Delft, the Netherlands; University of Twente, Enschede, the Netherlands; Delft University of Technology, Delft the Netherlands.
Van Genuchten, M.Th., Leij, F.J., 1992. Estimating the hydraulic properties of unsaturated soils. In: Indirect Methods for Estimating Hydraulic Properties of Unsaturated Soil; Proceeding of the Department of Soil and Environmental Sciences and the Department

166 A Tradition in Transition: Water Management Reforms and Spate Irrigation Systems In Eritrea
of Soils and Environmental Sciences, University of California, International Workshop, Riverside, California 14 - 20, 1992.
Van Genuchten, M.Th., 1980. A closed form equation for predicting the hydraulic conductivity of unsaturated soils. Soil Science Society American Journal 44:892898.
Van Hofwegen, P., Svendsen, M., 2000. A vision of water for food and rural development. World vision water report [online]. Available at www/worldwatercouncil.org/vision/documents (accessed 23 May, 2006).
Van Steenbergen, F., 1997. Understanding the sociology of spate irrigation: Cases from Balochistan. Journal of Arid Environments 35: 349-365.
Vincent, L, 2005. Social aspects of irrigation designs: the interaction of water, technology and people. In: E., Tielkes et al., 2005 (Eds.), The global food & product chain - dynamics, innovations, conflicts, strategies: International research on food security, natural resource management and rural development; Universität Hohenheim, Tropenzentrum, Centre for Agriculture in the Tropics and Subtropics, Stuttgart, Germany, ISBN: 3-00-017063-4.
World Bank, 1994. Eritrea. Options and strategies for growth, Vol. II report no. 12930 ER, Eritrea, Washington, D.C. USA, p. 59-89.
World Bank, 2000. Project appraisal document: Irrigation improvement project in the Republic of Yemen. [online]. Available at http://www.wca-infonet.org/id/133288 (Accessed 25 June, 2006).
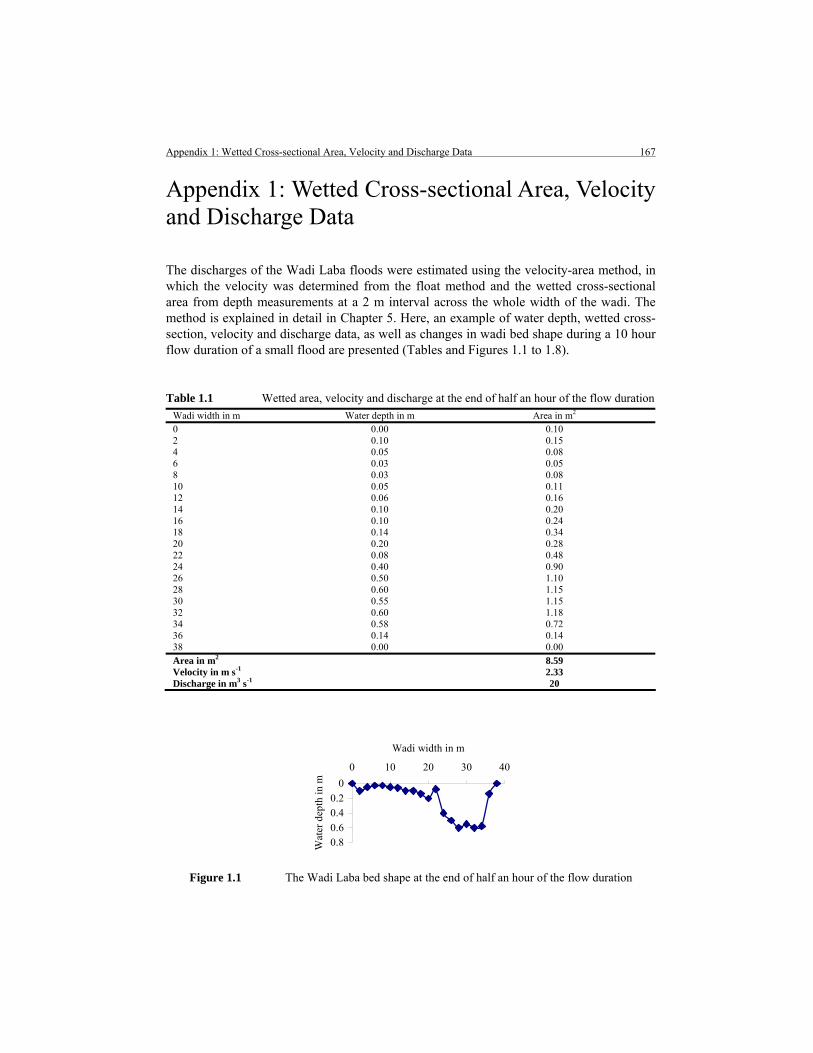
Appendix 1: Wetted Cross-sectional Area, Velocity and Discharge Data 167
Appendix 1: Wetted Cross-sectional Area, Velocity and Discharge Data
The discharges of the Wadi Laba floods were estimated using the velocity-area method, in which the velocity was determined from the float method and the wetted cross-sectional area from depth measurements at a 2 m interval across the whole width of the wadi. The method is explained in detail in Chapter 5. Here, an example of water depth, wetted cross-section, velocity and discharge data, as well as changes in wadi bed shape during a 10 hour flow duration of a small flood are presented (Tables and Figures 1.1 to 1.8).
Table 1.1 Wetted area, velocity and discharge at the end of half an hour of the flow duration Wadi width in m Water depth in m Area in m2 0 0.00 0.10 2 0.10 0.15 4 0.05 0.08 6 0.03 0.05 8 0.03 0.08 10 0.05 0.11 12 0.06 0.16 14 0.10 0.20 16 0.10 0.24 18 0.14 0.34 20 0.20 0.28 22 0.08 0.48 24 0.40 0.90 26 0.50 1.10 28 0.60 1.15 30 0.55 1.15 32 0.60 1.18 34 0.58 0.72 36 0.14 0.14 38 0.00 0.00 Area in m2 8.59 Velocity in m s-1 2.33 Discharge in m3 s-1 20
00.20.40.60.8
0 10 20 30 40
Wadi width in m
Wat
er d
epth
in m
Figure 1.1 The Wadi Laba bed shape at the end of half an hour of the flow duration
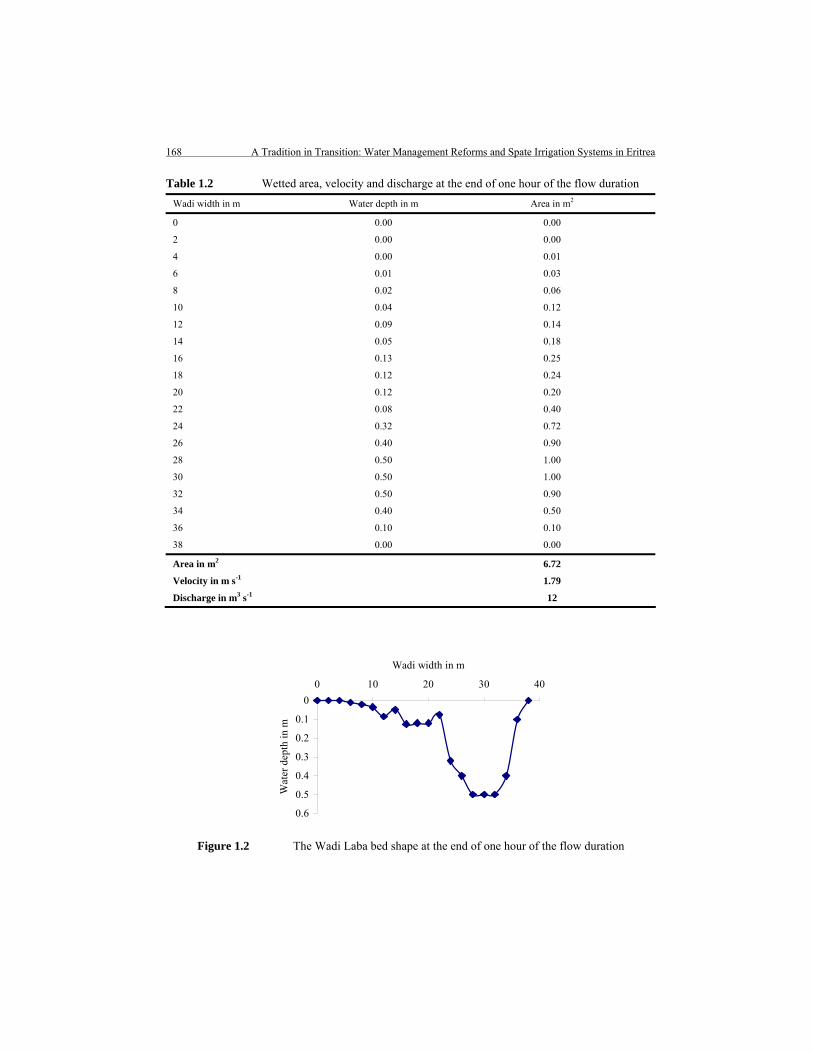
168 A Tradition in Transition: Water Management Reforms and Spate Irrigation Systems in Eritrea
Table 1.2 Wetted area, velocity and discharge at the end of one hour of the flow duration
Wadi width in m Water depth in m Area in m2
0 0.00 0.00
2 0.00 0.00
4 0.00 0.01
6 0.01 0.03
8 0.02 0.06
10 0.04 0.12
12 0.09 0.14
14 0.05 0.18
16 0.13 0.25
18 0.12 0.24
20 0.12 0.20
22 0.08 0.40
24 0.32 0.72
26 0.40 0.90
28 0.50 1.00
30 0.50 1.00
32 0.50 0.90
34 0.40 0.50
36 0.10 0.10
38 0.00 0.00
Area in m2 6.72
Velocity in m s-1 1.79
Discharge in m3 s-1 12
0
0.1
0.2
0.3
0.4
0.5
0.6
0 10 20 30 40
Wadi width in m
Wat
er d
epth
in m
Figure 1.2 The Wadi Laba bed shape at the end of one hour of the flow duration
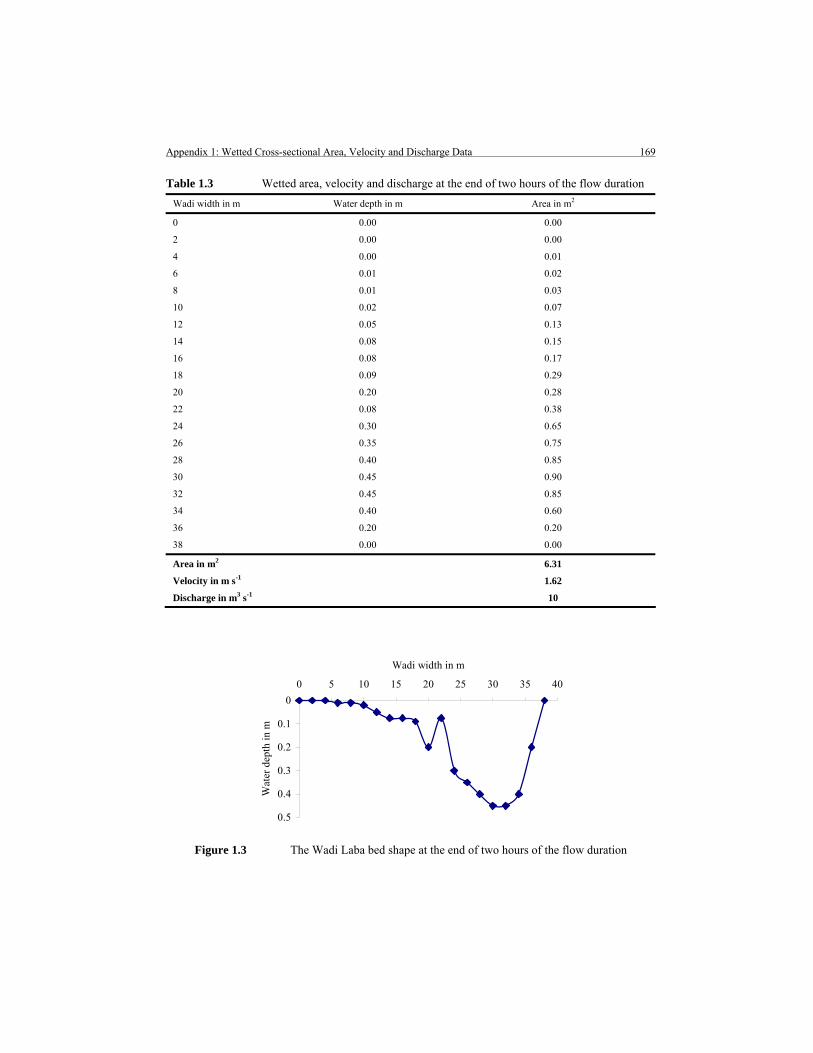
Appendix 1: Wetted Cross-sectional Area, Velocity and Discharge Data 169
Table 1.3 Wetted area, velocity and discharge at the end of two hours of the flow duration
Wadi width in m Water depth in m Area in m2
0 0.00 0.00
2 0.00 0.00
4 0.00 0.01
6 0.01 0.02
8 0.01 0.03
10 0.02 0.07
12 0.05 0.13
14 0.08 0.15
16 0.08 0.17
18 0.09 0.29
20 0.20 0.28
22 0.08 0.38
24 0.30 0.65
26 0.35 0.75
28 0.40 0.85
30 0.45 0.90
32 0.45 0.85
34 0.40 0.60
36 0.20 0.20
38 0.00 0.00
Area in m2 6.31
Velocity in m s-1 1.62
Discharge in m3 s-1 10
0
0.1
0.2
0.3
0.4
0.5
0 5 10 15 20 25 30 35 40
Wadi width in m
Wat
er d
epth
in m
Figure 1.3 The Wadi Laba bed shape at the end of two hours of the flow duration

170 A Tradition in Transition: Water Management Reforms and Spate Irrigation Systems in Eritrea
Table 1.4 Wetted area, velocity and discharge at the end of three hours of the flow duration
Wadi width in m Water depth in m Area in m2
0 0.00 0.00
2 0.00 0.00
4 0.00 0.00
6 0.00 0.01
8 0.01 0.02
10 0.01 0.05
12 0.04 0.09
14 0.05 0.11
16 0.06 0.14
18 0.08 0.23
20 0.15 0.21
22 0.06 0.26
24 0.20 0.48
26 0.28 0.63
28 0.35 0.75
30 0.40 0.80
32 0.40 0.70
34 0.30 0.45
36 0.15 0.15
38 0.00 0.00
Area in m2 5.08
Velocity in m s-1 1.52
Discharge in m3 s-1 7.7
0
0.1
0.2
0.3
0.4
0.5
0 5 10 15 20 25 30 35 40
Wadi width in m
Wat
er d
epth
in m
Figure 1.4 The Wadi Laba bed shape at the end of three hours of the flow duration

Appendix 1: Wetted Cross-sectional Area, Velocity and Discharge Data 171
Table 1.5 Wetted area, velocity and discharge at the end of four hours of the flow duration
Wadi width in m Water depth in m Area in m2
0 0.00 0.00
2 0.00 0.00
4 0.00 0.00
6 0.00 0.00
8 0.00 0.01
10 0.01 0.04
12 0.03 0.07
14 0.04 0.09
16 0.05 0.11
18 0.06 0.16
20 0.10 0.15
22 0.05 0.20
24 0.15 0.35
26 0.20 0.45
28 0.25 0.60
30 0.35 0.65
32 0.30 0.55
34 0.25 0.35
36 0.10 0.10
38 0.00 0.00
Area in m2 3.88
Velocity in m s-1 1.48
Discharge in m3 s-1 5.7
00.05
0.10.15
0.20.25
0.30.35
0.4
0 5 10 15 20 25 30 35 40
Wadi width in m
Wat
er d
epth
in m
Figure 1.5 The Wadi Laba bed shape at the end of four hours of the flow duration
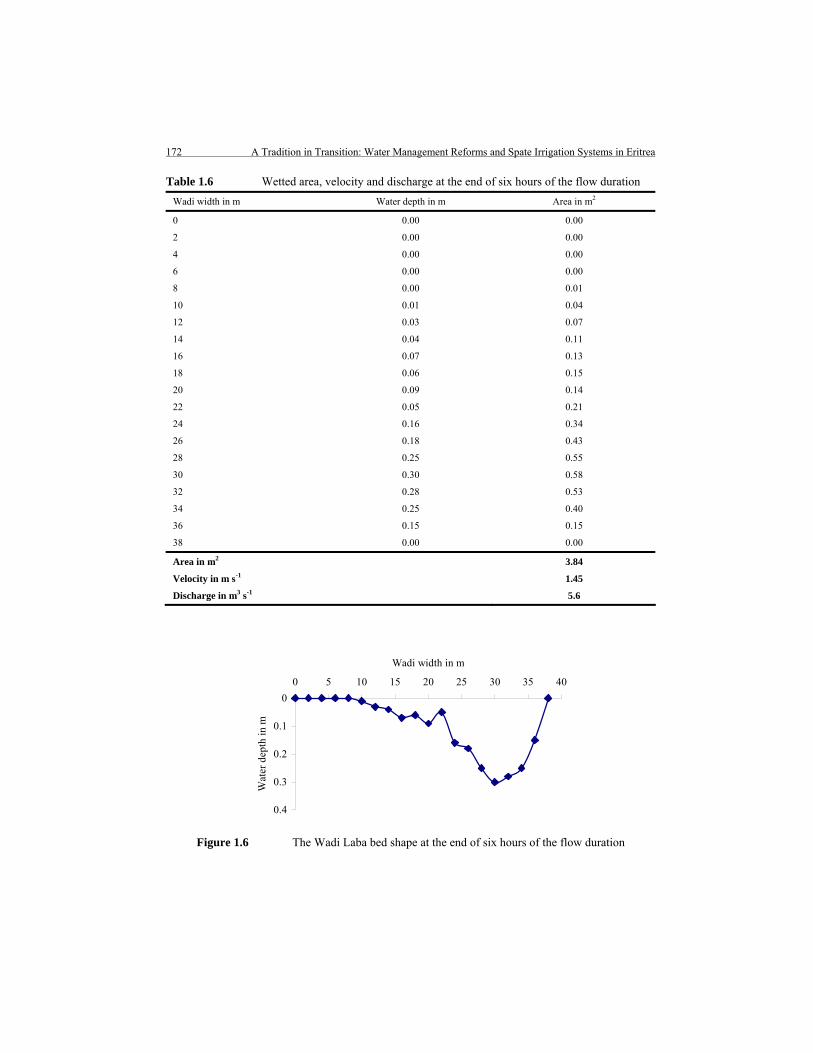
172 A Tradition in Transition: Water Management Reforms and Spate Irrigation Systems in Eritrea
Table 1.6 Wetted area, velocity and discharge at the end of six hours of the flow duration
Wadi width in m Water depth in m Area in m2
0 0.00 0.00
2 0.00 0.00
4 0.00 0.00
6 0.00 0.00
8 0.00 0.01
10 0.01 0.04
12 0.03 0.07
14 0.04 0.11
16 0.07 0.13
18 0.06 0.15
20 0.09 0.14
22 0.05 0.21
24 0.16 0.34
26 0.18 0.43
28 0.25 0.55
30 0.30 0.58
32 0.28 0.53
34 0.25 0.40
36 0.15 0.15
38 0.00 0.00
Area in m2 3.84
Velocity in m s-1 1.45
Discharge in m3 s-1 5.6
0
0.1
0.2
0.3
0.4
0 5 10 15 20 25 30 35 40
Wadi width in m
Wat
er d
epth
in m
Figure 1.6 The Wadi Laba bed shape at the end of six hours of the flow duration
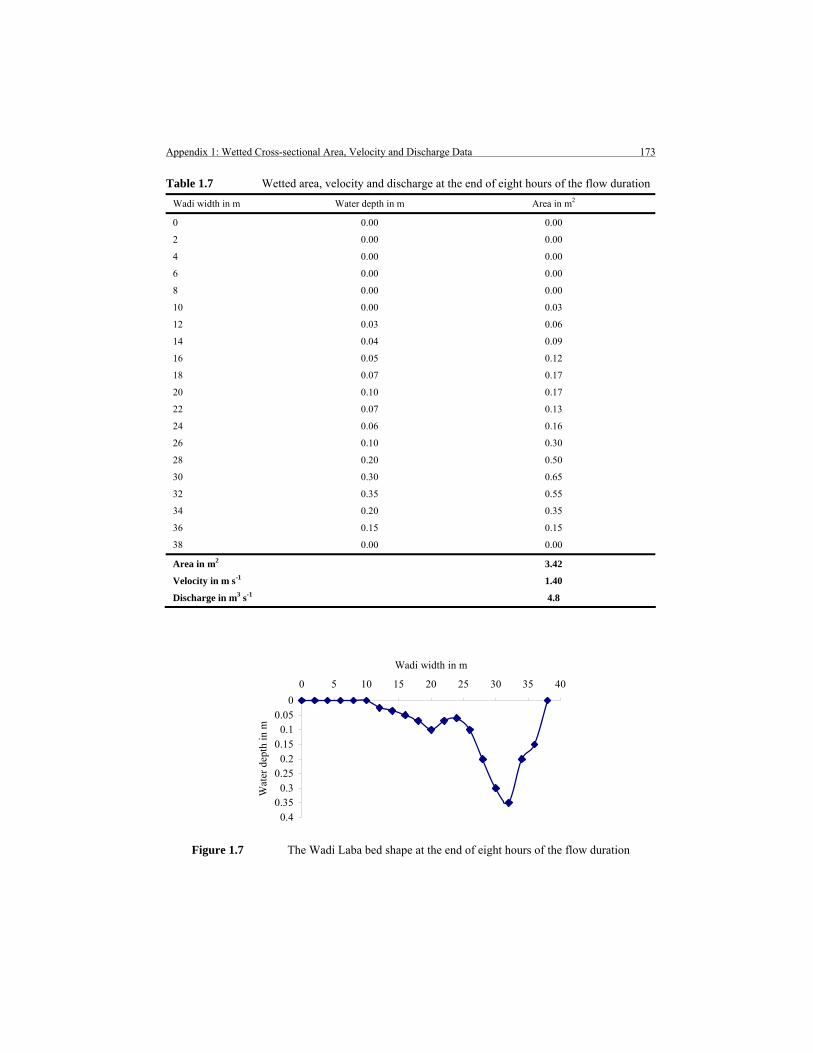
Appendix 1: Wetted Cross-sectional Area, Velocity and Discharge Data 173
Table 1.7 Wetted area, velocity and discharge at the end of eight hours of the flow duration
Wadi width in m Water depth in m Area in m2
0 0.00 0.00
2 0.00 0.00
4 0.00 0.00
6 0.00 0.00
8 0.00 0.00
10 0.00 0.03
12 0.03 0.06
14 0.04 0.09
16 0.05 0.12
18 0.07 0.17
20 0.10 0.17
22 0.07 0.13
24 0.06 0.16
26 0.10 0.30
28 0.20 0.50
30 0.30 0.65
32 0.35 0.55
34 0.20 0.35
36 0.15 0.15
38 0.00 0.00
Area in m2 3.42
Velocity in m s-1 1.40
Discharge in m3 s-1 4.8
00.05
0.10.15
0.20.25
0.30.35
0.4
0 5 10 15 20 25 30 35 40
Wadi width in m
Wat
er d
epth
in m
Figure 1.7 The Wadi Laba bed shape at the end of eight hours of the flow duration
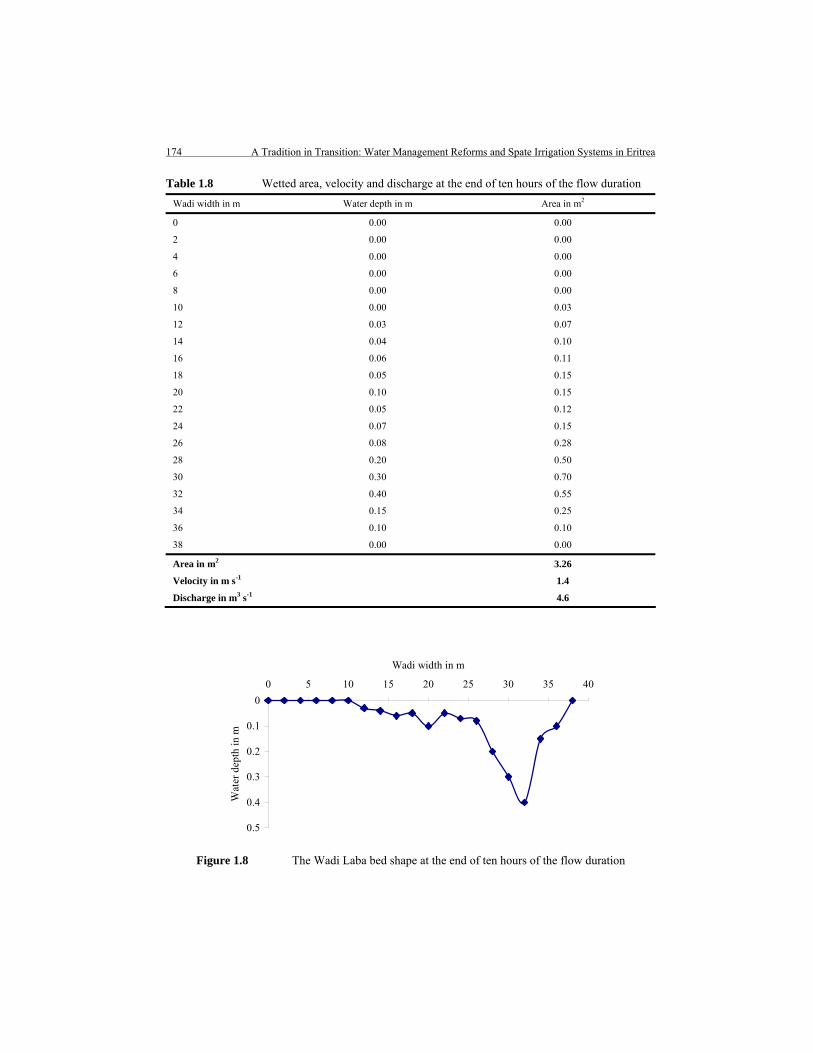
174 A Tradition in Transition: Water Management Reforms and Spate Irrigation Systems in Eritrea
Table 1.8 Wetted area, velocity and discharge at the end of ten hours of the flow duration
Wadi width in m Water depth in m Area in m2
0 0.00 0.00
2 0.00 0.00
4 0.00 0.00
6 0.00 0.00
8 0.00 0.00
10 0.00 0.03
12 0.03 0.07
14 0.04 0.10
16 0.06 0.11
18 0.05 0.15
20 0.10 0.15
22 0.05 0.12
24 0.07 0.15
26 0.08 0.28
28 0.20 0.50
30 0.30 0.70
32 0.40 0.55
34 0.15 0.25
36 0.10 0.10
38 0.00 0.00
Area in m2 3.26
Velocity in m s-1 1.4
Discharge in m3 s-1 4.6
0
0.1
0.2
0.3
0.4
0.5
0 5 10 15 20 25 30 35 40
Wadi width in m
Wat
er d
epth
in m
Figure 1.8 The Wadi Laba bed shape at the end of ten hours of the flow duration
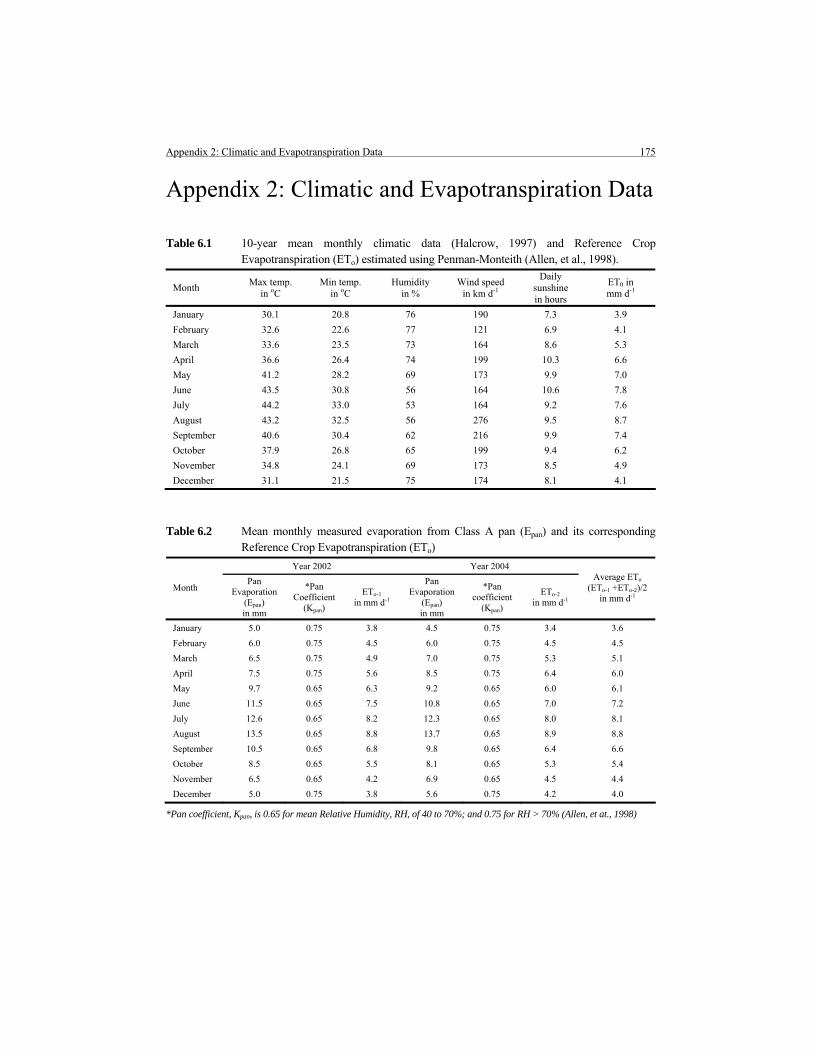
Appendix 2: Climatic and Evapotranspiration Data 175
Appendix 2: Climatic and Evapotranspiration Data
Table 6.1 10-year mean monthly climatic data (Halcrow, 1997) and Reference Crop Evapotranspiration (ETo) estimated using Penman-Monteith (Allen, et al., 1998).
Month Max temp.
in oC Min temp.
in oC Humidity
in % Wind speed
in km d-1
Daily sunshine in hours
ET0 in mm d-1
January 30.1 20.8 76 190 7.3 3.9
February 32.6 22.6 77 121 6.9 4.1
March 33.6 23.5 73 164 8.6 5.3
April 36.6 26.4 74 199 10.3 6.6
May 41.2 28.2 69 173 9.9 7.0
June 43.5 30.8 56 164 10.6 7.8
July 44.2 33.0 53 164 9.2 7.6
August 43.2 32.5 56 276 9.5 8.7
September 40.6 30.4 62 216 9.9 7.4
October 37.9 26.8 65 199 9.4 6.2
November 34.8 24.1 69 173 8.5 4.9
December 31.1 21.5 75 174 8.1 4.1
Table 6.2 Mean monthly measured evaporation from Class A pan (Epan) and its corresponding Reference Crop Evapotranspiration (ETo)
Year 2002 Year 2004
Month Pan
Evaporation (Epan) in mm
*Pan Coefficient
(Kpan)
ETo-1 in mm d-1
Pan Evaporation
(Epan) in mm
*Pan coefficient
(Kpan)
ETo-2 in mm d-1
Average ETo
(ETo-1 +ETo-2)/2 in mm d-1
January 5.0 0.75 3.8 4.5 0.75 3.4 3.6
February 6.0 0.75 4.5 6.0 0.75 4.5 4.5
March 6.5 0.75 4.9 7.0 0.75 5.3 5.1
April 7.5 0.75 5.6 8.5 0.75 6.4 6.0
May 9.7 0.65 6.3 9.2 0.65 6.0 6.1
June 11.5 0.65 7.5 10.8 0.65 7.0 7.2
July 12.6 0.65 8.2 12.3 0.65 8.0 8.1
August 13.5 0.65 8.8 13.7 0.65 8.9 8.8
September 10.5 0.65 6.8 9.8 0.65 6.4 6.6
October 8.5 0.65 5.5 8.1 0.65 5.3 5.4
November 6.5 0.65 4.2 6.9 0.65 4.5 4.4
December 5.0 0.75 3.8 5.6 0.75 4.2 4.0
*Pan coefficient, Kpan, is 0.65 for mean Relative Humidity, RH, of 40 to 70%; and 0.75 for RH > 70% (Allen, et at., 1998)

176 A Tradition in Transition: Water Management Reforms and Spate Irrigation Systems in Eritrea

Appendix 3: The Soil Water Atmosphere Plant Model (SWAP) Input Data 177
Appendix 3: The Soil Water Atmosphere Plant model (SWAP) Input Data
Simulation period TSTART = 01-jun-2006 ! Start date of simulation run [dd-mm-yyyy] TEND = 15-sep-2006 ! End date of simulation run [dd-mm-yyyy]
Output dates
Output times for water and solute balances
SWYRVAR = 0 ! Switch, output at fixed or variable dates: ! SWYRVAR = 0: each year output of balances at the same date
SWYRVAR = 1 ! Output of balances at different dates If SWYRVAR = 0 ! Specify fixed date DATEFIX = 15-09 ! Specify day and month for output of yearly balances, [dd-mm]
Output files
SWVAP = 1 ! Switch, output profiles of moisture and solute, [Y=1, N=0] SWATE = 0 ! Switch, output file with soil temperature profiles, [Y=1, N=0] SWBLC = 1 ! Switch, output file with detailed yearly water balance, [Y=1,
N=0] SWDRF = 1 ! Switch, output drainage fluxes, for extended drainage, [Y=1,
N=0] SWSWB = 1 ! Switch, output surface water reservoir, for extended drainage, [Y=1, N=0]
Meteorology data
METFIL = 'wadilaba' ! File name of meteorological data without extension .YYY ! Extension equals last 3 digits of year number, e.g. 2006 has extension .006
SWETR = 1 ! Switch, use reference ET values of meteo file [Y=1, N=0]
Irrigation applications
SWIRFIX = 1 ! Switch for fixed irrigation applications ! SWIRFIX = 0: no irrigation applications are prescribed ! SWIRFIX = 1: irrigation applications are prescribed
If SWIRFIX = 1 SWIRGFIL = 0 ! Switch for file with fixed irrigation applications
! SWIRGFIL = 0: data are specified in the .swp file ! SWIRGFIL = 1: data are specified in a separate file

178 A Tradition in Transition: Water Management Reforms and Spate Irrigation Systems in Eritrea
If SWIRGFIL = 0, specify information for each fixed irrigation event (max. MAIRG): ! IRDATE = date of irrigation, [dd-mm-yyyy] ! IRDEPTH = amount of water, [0.0..100.0 cm, R]
! IRCONC = concentration of irrigation water, [0.0..1000.0 mg cm-3, R] ! IRTYPE = type of irrigation: sprinkling = 0, surface = 1
RDATE* IRDEPTH IRCONC IRTYPE 13-jun-2005 20.0 1000.0 1 14-jun-2005 20.0 1000.0 1 15-jun-2005 10.0 1000.0 1 13-jul-2005 20.0 1000.0 1 14-jul-2005 20.0 1000.0 1 15-jul-2005 10.0 1000.0 1 13-aug-2005 20.0 1000.0 1 14-aug-2005 20.0 1000.0 1 15-aug-2005 10.0 1000.0 1
* This is one of the several possible irrigation schedules presented in Chapter 6, Table 6.2
Soil and water data
Initial moisture condition
SWINCO = 1 ! Switch, type of initial moisture condition: ! 1 = pressure head as function of depth is input ! 2 = pressure head of each compartment is in hydrostatic equilibrium
with initial groundwater level ! 3 = read final pressure heads from previous Swap simulation
If SWINCO = 1, specify initial pressure head H [-1.d10..1.d4 cm, R] as function of soil depth ZI [-10000..0 cm, R], maximum MACP data pairs:
ZI H -0.5 -5950.0 -195.0 -5950.0
Soil evaporation
SWCFBS = 0 ! Switch for use of coefficient CFBS for soil evaporation [Y=1, N=0] ! 0 = CFBS is not used ! 1 = CFBS used to calculate potential evaporation from reference evapotranspiration
SWREDU = 1 ! Switch method for reduction of potential soil evaporation: ! 0 = reduction to maximum Darcy flux ! 1 = reduction to maximum Darcy flux and to maximum Black (1969)
COFRED = 0.35 ! Soil evaporation coefficient of Black, [0..1 cm d-1/2, R], or Bo/Str., [0..1 cm-1/2, R] RSIGNI = 0.5 ! Minimum rainfall to reset models Black and Bo/Str., [0..1 cm d-1, R]

Appendix 3: The Soil Water Atmosphere Plant Model (SWAP) Input Data 179
Vertical discretization of soil profile
ISOILLAY = number of soil layer, start with 1 at soil surface, [1..MAHO, I] ISUBLAY = number of sub layer, start with 1 at soil surface, [1..MACP, I] HSUBLAY = height of sub layer, [0.0..1000.0 cm, R] HCOMP = height of compartments in this layer, [0.0..1000.0 cm, R] NCOMP = number of compartments in this layer (=HSUBLAY/HCOMP
[1..MACP, I] ISOILLAY ISUBLAY HSUBLAY HCOMP NCOMP 1 1 40.0 1.0 40 1 2 60.0 2.0 30 1 3 70.0 5.0 20 1 4 80.0 10.0 10
Soil hydraulic functions
ISOILLAY1 = Number of soil layer, as defined above ORES = Residual water content, [0..0.4 cm3 cm-3, R] OSAT = Saturated water content, [0..0.95 cm3 cm-3, R] ALFA = Shape parameter alfa of main drying curve, [0.0001..1 cm-1, R] NPAR = Shape parameter n, [1..4 -, R] KSAT = Saturated vertical hydraulic conductivity, [1.d-5..1000 cm d-1, R] LEXP = Exponent in hydraulic conductivity function, [-25..25 -, R] ALFAW = Alfa parameter of main wetting curve in case of hysteresis,
[0.0001..1 cm-1, R]
ISOILLAY1 ORES OSAT ALFA NPAR KSAT LEXP ALFAW
1 0.00 0.45 0.0094 1.400 18.50 -1.382 0.0094
Maximum rooting depth
RDS = 200.0 ! Maximum rooting depth allowed by the soil profile, [1..5000 cm, R]
Numerical solution of Richards' equation
DTMIN = 1.0d-7 ! Minimum timestep, [1.d-8..0.1 d, R] DTMAX = 0.2 ! Maximum timestep, [0.01..0.5 d, R] THETOL = 0.001 ! Maximum dif. water content between iterations, [1.d-
5.0.01 cm3 cm-3, R] CritDevMasBalDt = 0.01 ! Critical Deviation in water balance of timestep [1.0d-
5..100.0 cm, R] MSTEPS = 100000 ! Maximum number of iteration steps to solve Richards'
2..100000 -, I] SWBALANCE = 0 ! Switch to allow compensation of water balance, [Y=1,
N=0] (use of SWBALANCE=1 is not recommended in this version, not tested yet!)

180 A Tradition in Transition: Water Management Reforms and Spate Irrigation Systems in Eritrea
Bottom boundary condition SWBBCFILE = 0 ! Switch for file with bottom boundary conditions:
! SWBBCFILE = 0: data are specified in the .swp file ! SWBBCFILE = 1: data are specified in a separate file
If SWBBCFILE = 0, select one of the following options:
!1 Prescribe groundwater level !2 Prescribe bottom flux !3 Calculate bottom flux from hydraulic head of deep aquifer !4 Calculate bottom flux as function of groundwater level !5 Prescribe soil water pressure head of bottom compartment !6 Bottom flux equals zero !7 Free drainage of soil profile !8 Free outflow at soil-air interface
SWBOTB = 7 ! Switch for bottom boundary [1..8,-,I]

Appendix 4: Water Balance Simulation Results Obtained from the Soil Water Accounting Model (SWAM) 181
Appendix 4: Water Balance Simulation Results Obtained from the Soil Water Accounting Model (SWAM) (Irrigation Schedule of 50 cm at 15 June, 15 July and 15 August)
Flood/ irrigation
period in days
Irrigation supply (I)
in cm
Actual bare soil
evaporation (Ea) in cm d-1
Deep percolation
(D) in cm d-1
*Saturation deficit (S) in the root zone in cm
Matric pressure (h) in the root zone in cm
Soil Moisture Storage (SMS)
in the root zone in cm
79.3 7840.91 22.5
1-Jun 0 0.049 0.00020 79.3 7852.36 22.5
2-Jun 0 0.049 0.00020 79.4 7908.55 22.4
3-Jun 0 0.049 0.00020 79.4 7964.20 22.4
4-Jun 0 0.048 0.00020 79.5 8019.28 22.3
5-Jun 0 0.048 0.00020 79.5 8073.82 22.3
6-Jun 0 0.047 0.00019 79.6 8127.82 22.2
7-Jun 0 0.047 0.00019 79.6 8181.30 22.2
8-Jun 0 0.046 0.00019 79.6 8234.26 22.2
9-Jun 0 0.046 0.00019 79.7 8286.70 22.1
10-Jun 0 0.046 0.00019 79.7 8338.65 22.1
11-Jun 0 0.045 0.00018 79.8 8390.11 22.0
12-Jun 0 0.045 0.00018 79.8 8441.08 22.0
13-Jun 0 0.044 0.00018 79.9 8491.57 21.9
14-Jun 0 0.044 0.00018 79.9 8541.59 21.9
15-Jun 50 0.043 0.00018 30.0 334.30 71.8
16-Jun 0 0.268 0.03183 30.3 337.39 71.5
17-Jun 0 0.267 0.03138 30.6 340.47 71.2
18-Jun 0 0.266 0.03094 30.9 343.54 70.9
19-Jun 0 0.266 0.03049 31.2 346.60 70.6
20-Jun 0 0.265 0.03005 31.4 349.65 70.4
21-Jun 0 0.264 0.02961 31.7 352.69 70.1
22-Jun 0 0.264 0.02917 32.0 355.72 69.8
23-Jun 0 0.263 0.02873 32.3 358.73 69.5
24-Jun 0 0.263 0.02830 32.6 361.74 69.2
25-Jun 0 0.262 0.02787 32.9 364.73 68.9
26-Jun 0 0.262 0.02743 33.2 367.72 68.6
27-Jun 0 0.261 0.02700 33.5 370.69 68.3
28-Jun 0 0.260 0.02657 33.8 373.66 68.0
29-Jun 0 0.260 0.02614 34.1 376.61 67.7
30-Jun 0 0.259 0.02572 34.3 379.56 67.5
1-Jul 0 0.290 0.02529 34.7 382.81 67.1
2-Jul 0 0.289 0.02482 35.0 386.05 66.8
3-Jul 0 0.288 0.02435 35.3 389.28 66.5
4-Jul 0 0.288 0.02389 35.6 392.50 66.2
5-Jul 0 0.287 0.02342 35.9 395.71 65.9

182 A Tradition in Transition: Water Management Reforms and Spate Irrigation Systems in Eritrea
6-Jul 0 0.286 0.02296 36.2 398.91 65.6
7-Jul 0 0.286 0.02250 36.5 402.09 65.3
8-Jul 0 0.285 0.02204 36.8 405.26 65.0
9-Jul 0 0.285 0.02158 37.1 408.43 64.7
10-Jul 0 0.284 0.02112 37.4 411.58 64.4
11-Jul 0 0.283 0.02067 37.7 414.72 64.1
12-Jul 0 0.283 0.02021 38.0 417.85 63.8
13-Jul 0 0.282 0.01976 38.3 420.97 63.5
14-Jul 0 0.282 0.01931 38.7 424.08 63.1
15-Jul 50 0.281 0.01886 -11.0 1.00 101.8
16-Jul 0 0.696 6.50000 -3.9 1.00 101.8
17-Jul 0 0.696 6.50000 3.3 14.72 98.5
18-Jul 0 0.537 4.86711 8.7 83.60 93.1
19-Jul 0 0.406 1.37528 10.5 111.42 91.3
20-Jul 0 0.384 0.81637 11.7 126.18 90.1
21-Jul 0 0.375 0.73410 12.8 139.81 89.0
22-Jul 0 0.367 0.65813 13.9 152.41 87.9
23-Jul 0 0.360 0.58790 14.8 164.06 87.0
24-Jul 0 0.354 0.52295 15.7 174.85 86.1
25-Jul 0 0.349 0.46283 16.5 184.84 85.3
26-Jul 0 0.345 0.40716 17.3 194.09 84.5
27-Jul 0 0.341 0.35561 17.9 202.66 83.9
28-Jul 0 0.338 0.30785 18.6 210.60 83.2
29-Jul 0 0.335 0.26358 19.2 217.96 82.6
30-Jul 0 0.332 0.22256 19.7 224.79 82.1
31-Jul 0 0.330 0.18452 20.3 231.11 81.5
1-Aug 0 0.363 0.14926 20.8 237.41 81.0
2-Aug 0 0.361 0.11416 21.3 243.25 80.5
3-Aug 0 0.359 0.08162 21.7 248.66 80.1
4-Aug 0 0.357 0.05146 22.1 253.09 79.7
5-Aug 0 0.355 0.04355 22.5 257.21 79.3
6-Aug 0 0.354 0.04296 22.9 261.31 78.9
7-Aug 0 0.352 0.04237 23.3 265.39 78.5
8-Aug 0 0.351 0.04178 23.7 269.45 78.1
9-Aug 0 0.350 0.04119 24.1 273.49 77.7
10-Aug 0 0.349 0.04061 24.5 277.51 77.3
11-Aug 0 0.347 0.04003 24.9 281.51 76.9
12-Aug 0 0.346 0.03945 25.2 285.49 76.6
13-Aug 0 0.345 0.03887 25.6 289.46 76.2
14-Aug 0 0.344 0.03830 26.0 293.40 75.8
15-Aug 50 0.343 0.03773 -23.6 1.00 101.8
16-Aug 0 0.771 6.50000 -16.3 1.00 101.8
17-Aug 0 0.771 6.50000 -9.1 1.00 101.8
18-Aug 0 0.771 6.50000 -1.8 1.00 101.8
19-Aug 0 0.771 6.50000 5.5 35.41 96.3
20-Aug 0 0.522 3.24241 9.2 92.85 92.6
21-Aug 0 0.441 1.09587 10.8 114.32 91.0

Appendix 4: Water Balance Simulation Results Obtained from the Soil Water Accounting Model (SWAM) 183
22-Aug 0 0.423 0.80018 12.0 129.36 89.8
23-Aug 0 0.412 0.71637 13.1 143.24 88.7
24-Aug 0 0.404 0.63902 14.2 156.06 87.6
25-Aug 0 0.396 0.56757 15.1 167.91 86.7
26-Aug 0 0.390 0.50151 16.0 178.87 85.8
27-Aug 0 0.385 0.44040 16.8 189.02 85.0
28-Aug 0 0.380 0.38386 17.6 198.41 84.2
29-Aug 0 0.376 0.33151 18.3 207.11 83.5
30-Aug 0 0.372 0.28303 19.0 215.17 82.8
31-Aug 0 0.369 0.23812 19.6 222.64 82.2
1-Sep 0 0.287 0.19651 20.1 228.58 81.7
2-Sep 0 0.285 0.16340 20.5 234.09 81.3
3-Sep 0 0.283 0.13267 20.9 239.20 80.9
4-Sep 0 0.282 0.10416 21.3 243.95 80.5
5-Sep 0 0.281 0.07771 21.7 248.36 80.1
6-Sep 0 0.279 0.05315 22.0 252.06 79.8
7-Sep 0 0.278 0.04370 22.3 255.38 79.5
8-Sep 0 0.278 0.04322 22.6 258.70 79.2
9-Sep 0 0.277 0.04274 23.0 262.00 78.8
10-Sep 0 0.276 0.04227 23.3 265.28 78.5
11-Sep 0 0.275 0.04179 23.6 268.56 78.2
12-Sep 0 0.274 0.04132 23.9 271.82 77.9
13-Sep 0 0.273 0.04085 24.2 275.06 77.6
14-Sep 0 0.273 0.04038 24.5 278.30 ***77.3 **15-Sep 0 0.272 0.03991 24.9 281.52 76.9
*The negative (-) sign indicates water is standing on the surface; **Planting data; **Final Soil Moisture Storage (SMSf)

184 A Tradition in Transition: Water Management Reforms and Spate Irrigation Systems in Eritrea
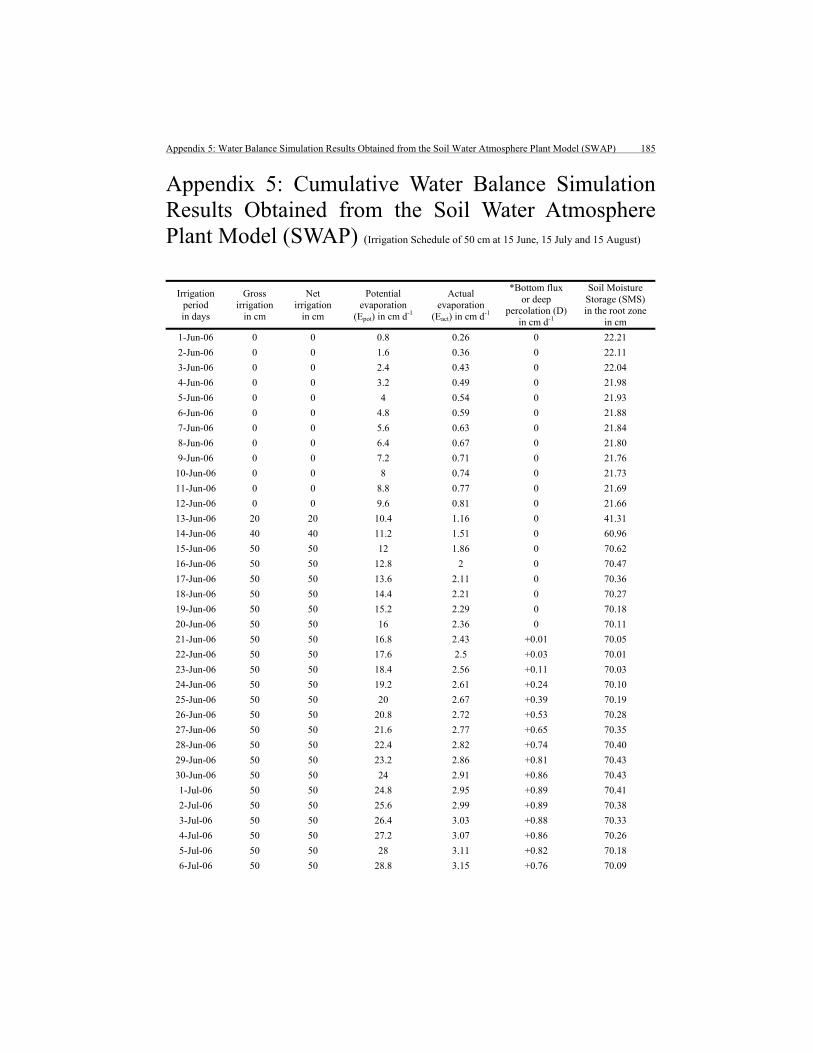
Appendix 5: Water Balance Simulation Results Obtained from the Soil Water Atmosphere Plant Model (SWAP) 185
Appendix 5: Cumulative Water Balance Simulation Results Obtained from the Soil Water Atmosphere Plant Model (SWAP) (Irrigation Schedule of 50 cm at 15 June, 15 July and 15 August)
Irrigation period in days
Gross irrigation
in cm
Net irrigation
in cm
Potential evaporation
(Epot) in cm d-1
Actual evaporation
(Eact) in cm d-1
*Bottom flux or deep
percolation (D) in cm d-1
Soil Moisture Storage (SMS) in the root zone
in cm
1-Jun-06 0 0 0.8 0.26 0 22.21
2-Jun-06 0 0 1.6 0.36 0 22.11
3-Jun-06 0 0 2.4 0.43 0 22.04
4-Jun-06 0 0 3.2 0.49 0 21.98
5-Jun-06 0 0 4 0.54 0 21.93
6-Jun-06 0 0 4.8 0.59 0 21.88
7-Jun-06 0 0 5.6 0.63 0 21.84
8-Jun-06 0 0 6.4 0.67 0 21.80
9-Jun-06 0 0 7.2 0.71 0 21.76
10-Jun-06 0 0 8 0.74 0 21.73
11-Jun-06 0 0 8.8 0.77 0 21.69
12-Jun-06 0 0 9.6 0.81 0 21.66
13-Jun-06 20 20 10.4 1.16 0 41.31
14-Jun-06 40 40 11.2 1.51 0 60.96
15-Jun-06 50 50 12 1.86 0 70.62
16-Jun-06 50 50 12.8 2 0 70.47
17-Jun-06 50 50 13.6 2.11 0 70.36
18-Jun-06 50 50 14.4 2.21 0 70.27
19-Jun-06 50 50 15.2 2.29 0 70.18
20-Jun-06 50 50 16 2.36 0 70.11
21-Jun-06 50 50 16.8 2.43 +0.01 70.05
22-Jun-06 50 50 17.6 2.5 +0.03 70.01
23-Jun-06 50 50 18.4 2.56 +0.11 70.03
24-Jun-06 50 50 19.2 2.61 +0.24 70.10
25-Jun-06 50 50 20 2.67 +0.39 70.19
26-Jun-06 50 50 20.8 2.72 +0.53 70.28
27-Jun-06 50 50 21.6 2.77 +0.65 70.35
28-Jun-06 50 50 22.4 2.82 +0.74 70.40
29-Jun-06 50 50 23.2 2.86 +0.81 70.43
30-Jun-06 50 50 24 2.91 +0.86 70.43
1-Jul-06 50 50 24.8 2.95 +0.89 70.41
2-Jul-06 50 50 25.6 2.99 +0.89 70.38
3-Jul-06 50 50 26.4 3.03 +0.88 70.33
4-Jul-06 50 50 27.2 3.07 +0.86 70.26
5-Jul-06 50 50 28 3.11 +0.82 70.18
6-Jul-06 50 50 28.8 3.15 +0.76 70.09

186 A Tradition in Transition: Water Management Reforms and Spate Irrigation Systems in Eritrea
7-Jul-06 50 50 29.6 3.18 +0.70 69.99
8-Jul-06 50 50 30.4 3.22 +0.63 69.88
9-Jul-06 50 50 31.2 3.26 +0.54 69.76
10-Jul-06 50 50 32 3.29 +0.46 69.64
11-Jul-06 50 50 32.8 3.32 +0.36 69.51
12-Jul-06 50 50 33.6 3.36 +0.26 69.38
13-Jul-06 70 70 34.4 3.71 +0.16 88.92
14-Jul-06 90 90 35.2 4.06 +0.08 108.49
15-Jul-06 100 100 36 4.41 -6.45 111.62
16-Jul-06 100 100 36.8 4.55 -12.67 105.25
17-Jul-06 100 100 37.6 4.66 -16.26 101.55
18-Jul-06 100 100 38.4 4.76 -18.89 98.82
19-Jul-06 100 100 39.2 4.84 -20.97 96.66
20-Jul-06 100 100 40 4.92 -22.71 94.85
21-Jul-06 100 100 40.8 4.98 -24.19 93.3
22-Jul-06 100 100 41.6 5.05 -25.5 91.93
23-Jul-06 100 100 42.4 5.11 -26.66 90.71
24-Jul-06 100 100 43.2 5.17 -27.7 89.61
25-Jul-06 100 100 44 5.22 -28.66 88.60
26-Jul-06 100 100 44.8 5.27 -29.53 87.67
27-Jul-06 100 100 45.6 5.32 -30.34 86.82
28-Jul-06 100 100 46.4 5.37 -31.09 86.02
29-Jul-06 100 100 47.2 5.41 -31.79 85.27
30-Jul-06 100 100 48 5.46 -32.45 84.57
31-Jul-06 100 100 48.8 5.5 -33.06 83.91
1-Aug-06 100 100 49.6 5.54 -33.65 83.28
2-Aug-06 100 100 50.4 5.58 -34.2 82.69
3-Aug-06 100 100 51.2 5.62 -34.73 82.12
4-Aug-06 100 100 52 5.66 -35.23 81.59
5-Aug-06 100 100 52.8 5.7 -35.7 81.07
6-Aug-06 100 100 53.6 5.74 -36.16 80.58
7-Aug-06 100 100 54.4 5.77 -36.6 80.11
8-Aug-06 100 100 55.2 5.81 -37.01 79.65
9-Aug-06 100 100 56 5.84 -37.42 79.21
10-Aug-06 100 100 56.8 5.88 -37.8 78.79
11-Aug-06 100 100 57.6 5.91 -38.18 78.39
12-Aug-06 100 100 58.4 5.94 -38.54 78.00
13-Aug-06 120 120 59.2 6.29 -38.88 97.30
14-Aug-06 140 140 60 6.64 -41.36 114.47
15-Aug-06 150 150 60.8 6.99 -53.86 111.62
16-Aug-06 150 150 61.6 7.14 -60.09 105.25
17-Aug-06 150 150 62.4 7.25 -63.69 101.54
18-Aug-06 150 150 63.2 7.34 -66.3 98.83
19-Aug-06 150 150 64 7.43 -68.39 96.66
20-Aug-06 150 150 64.8 7.5 -70.12 94.86
21-Aug-06 150 150 65.6 7.57 -71.6 93.3
22-Aug-06 150 150 66.4 7.63 -72.91 91.93
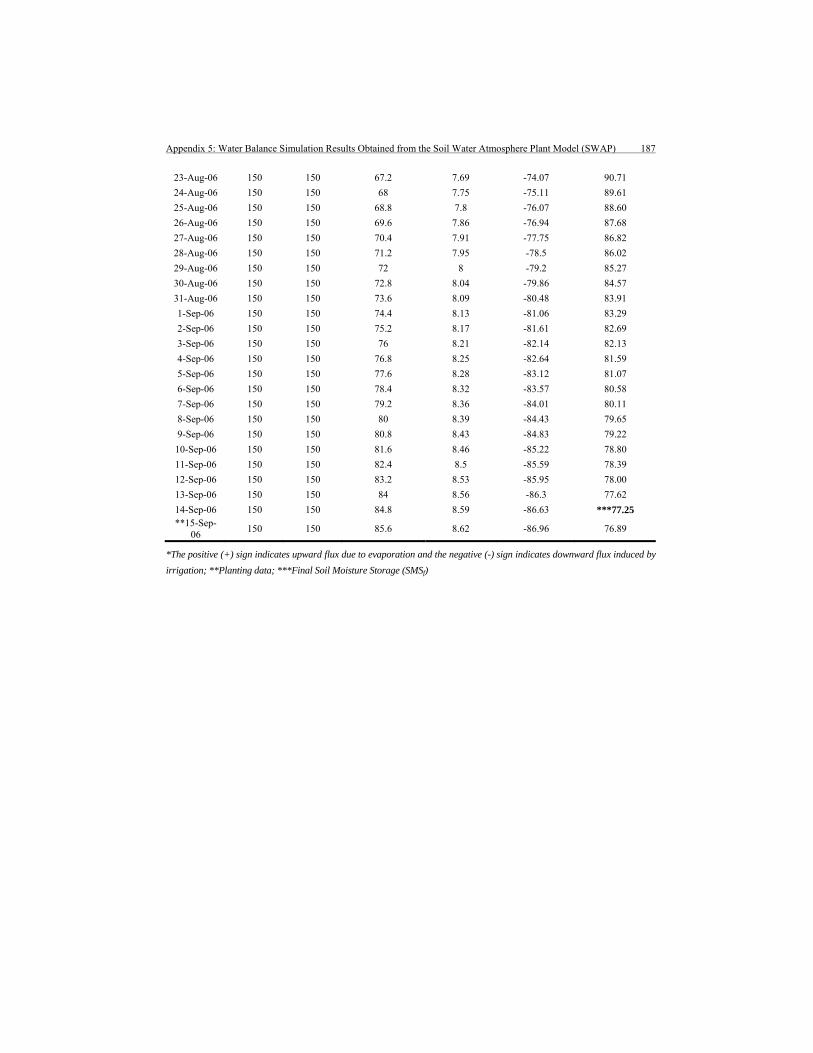
Appendix 5: Water Balance Simulation Results Obtained from the Soil Water Atmosphere Plant Model (SWAP) 187
23-Aug-06 150 150 67.2 7.69 -74.07 90.71
24-Aug-06 150 150 68 7.75 -75.11 89.61
25-Aug-06 150 150 68.8 7.8 -76.07 88.60
26-Aug-06 150 150 69.6 7.86 -76.94 87.68
27-Aug-06 150 150 70.4 7.91 -77.75 86.82
28-Aug-06 150 150 71.2 7.95 -78.5 86.02
29-Aug-06 150 150 72 8 -79.2 85.27
30-Aug-06 150 150 72.8 8.04 -79.86 84.57
31-Aug-06 150 150 73.6 8.09 -80.48 83.91
1-Sep-06 150 150 74.4 8.13 -81.06 83.29
2-Sep-06 150 150 75.2 8.17 -81.61 82.69
3-Sep-06 150 150 76 8.21 -82.14 82.13
4-Sep-06 150 150 76.8 8.25 -82.64 81.59
5-Sep-06 150 150 77.6 8.28 -83.12 81.07
6-Sep-06 150 150 78.4 8.32 -83.57 80.58
7-Sep-06 150 150 79.2 8.36 -84.01 80.11
8-Sep-06 150 150 80 8.39 -84.43 79.65
9-Sep-06 150 150 80.8 8.43 -84.83 79.22
10-Sep-06 150 150 81.6 8.46 -85.22 78.80
11-Sep-06 150 150 82.4 8.5 -85.59 78.39
12-Sep-06 150 150 83.2 8.53 -85.95 78.00
13-Sep-06 150 150 84 8.56 -86.3 77.62
14-Sep-06 150 150 84.8 8.59 -86.63 ***77.25 **15-Sep-
06 150 150 85.6 8.62 -86.96 76.89
*The positive (+) sign indicates upward flux due to evaporation and the negative (-) sign indicates downward flux induced by irrigation; **Planting data; ***Final Soil Moisture Storage (SMSf)

188 A Tradition in Transition: Water Management Reforms and Spate Irrigation Systems in Eritrea

Symbols, Acronyms and Glossary 189
Symbols, Acronyms and Glossary
Symbols
A area, either drainage area or flow cross sectional area in m2 D deep percolation or flux across the lower boundary of the rootzone in
cm d-1 DL deep percolation lag time in day Dr depth of rootzone in cm d soil particle diameter in m E evaporation rate in cm d-1 ECe average soil water salinity of the rootzone in dS m-1 ECsw electric conductivity of soil water in dS m-1 ETc crop evapotranspiration in mm d-1 ET0 reference crop evapotranspiration in mm d-1 Epen Penman open water evaporation in cm d-1 Wd water content expressed as depth in cm m-1 F cumulative depth of infiltrated water in mm f infiltration rate in mm h-1 g acceleration due to gravity in m s-2 (9.8) H hydraulic head in cm h pressure head or matric pressure in cm I irrigation gift in cm d-1 k hydraulic conductivity in cm d-1 kc crop coefficient ksat saturated hydraulic conductivity in cm d-1 ky yield response factor k(θ) hydraulic conductivity as a function of θ in cm d-1 n porosity of soil in cm3 cm-3 P precipitation rate in mm d-1 P precipitation depth in mm ρb soil bulk density in kg m-3 Ρp soil particle density in kg m-3 (2,650) ρw density of water in kg m-3 (1,000) Q flow rate, discharge in m3 s-1 qz flux in vertical direction in cm d-1 RNa adjusted sodium adsorption ratio in meq L-1 RNae average soil water sodicity of the rootzone in meq L-1 S soil moisture saturation deficit of the rootzone in cm3 cm-2 s yield loss in % per unit increase in salinity beyond the threshold, t t threshold salinity in dS m-1 above which yield reduction occurs v flow velocity in m s-1 Vs soil particle settling velocity in m s-1
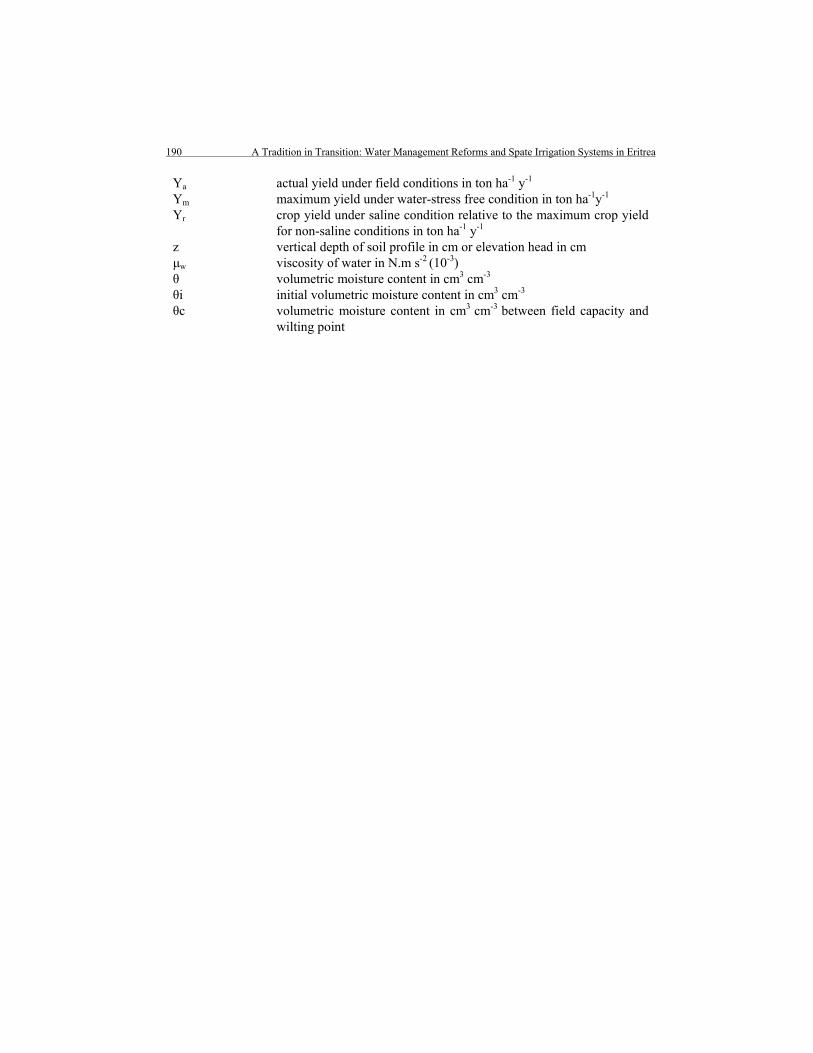
190 A Tradition in Transition: Water Management Reforms and Spate Irrigation Systems in Eritrea
Ya actual yield under field conditions in ton ha-1 y-1 Ym maximum yield under water-stress free condition in ton ha-1y-1 Yr crop yield under saline condition relative to the maximum crop yield
for non-saline conditions in ton ha-1 y-1 z vertical depth of soil profile in cm or elevation head in cm μw viscosity of water in N.m s-2 (10-3) θ volumetric moisture content in cm3 cm-3 θi initial volumetric moisture content in cm3 cm-3 θc volumetric moisture content in cm3 cm-3 between field capacity and
wilting point
Symbols, Acronyms and Glossary 191
Acronyms
CDE Centre for Development and Environment ELWDP Eastern Lowland Wadi Development Project ESP Exchangeable Sodium Percentage FAO Food and Agricultural Organization FC Field Capacity GDP Gross Domestic Product GNI Gross National Income per Capita ICID International Commission on Irrigation and Drainage IFAD International Fund for Agricultural Development IFPRI International Food Policy Research Institute IWMI International Water Management Institute LF Leaching Fraction MCHRGs Main Canal Head Regulator Gates MoA Ministry of Agriculture MSL Mean Seal Level NRCE Natural Resources Consulting Engineering PWP Permanent Wilting Point RAM/MAD Readily Available Moisture/Maximum Allowable Depletion RSM Residual Soil Moisture SAR Sodium Adsorption Ratio SCHRGs Secondary Canal Head Regulator Gates SWAM Soil Water Accounting Model SWAP Soil Water Atmosphere Plant Model TAW Total Available Water TDA Tihama Development Authority, Yemen UNCTAD United Nations Conference on Trade and Development UNDP United Nations Development Program USDA United States Department of Agriculture
192 A Tradition in Transition: Water Management Reforms and Spate Irrigation Systems in Eritrea
Glossary
Abay-Ad Board of village elders that provide advice on water sharing arrangements and conflict resolution approaches
Adsorption The adhesion of a substance to the surface of a solid or liquid. Adsorption is often used to extract pollutants by causing them to be attached to such adsorbents as activated carbon or silica gel. Hydrophobic, or water-repulsing adsorbents, are used to extract oil from waterways in oil spills.
Agim An earthen or brushwood diversion structure Bulk density The dry density of the soil; the mass of the solid mineral and
organic components of soil divided by the total volume Bajur Field inlet Cohesion A molecular attraction by which the particles of a body are
united throughout the mass whether like or unlike Composite sample A sample composed of two or more portions collected at
specific times and added together in volumes related to the flow at time of collection
Conjunctive management
Integrated management and use of two or more water resources, such as an aquifer and a surface water body
Darcy’s Law A relationship stating that the rate of fluid flow through a permeable medium is directly proportional to the hydraulic gradient and to the hydraulic conductivity. It is valid for flow velocities within the laminar range. Originally it was for saturated flow, but it was extended by Richards in 1931 for unsaturated flow.
Discharge The volume of water that passes a given point within a given period of time. It is an all-inclusive outflow term, describing a variety of flows such as from a pipe to a stream, or from a stream to a lake or ocean
Effective precipitation The part of precipitation which produces runoff; a weighted average of current and antecedent precipitation "effective" in correlating with runoff. It is also that part of the precipitation falling on an irrigated area which is effective in meeting the requirements of consumptive use
Elevation head The elevation above an arbitrary horizontal datum Erosion The process in which a material is worn away by a stream of
liquid (water) or air, often due to the presence of abrasive particles in the stream
Evapotranspiration Combination of evaporation and transpiration of water into the atmosphere from living plants and soil
Exchangeable Sodium Percentage
The proportion of the cation exchange capacity occupied by the sodium ions. It is expressed as a percentage
Field Capacity The moisture content remaining in soil after a few days of gravity drainage. Quantitatively, it is defined as the moisture

Symbols, Acronyms and Glossary 193
content corresponding to a pressure head between -100 and -500 cm
Flood An overflow of water onto lands that are used or usable by man and not normally covered by water. Floods have two essential characteristics: The inundation of land is temporary; and the land is adjacent to and inundated by overflow from a river, stream, lake, or ocean
Groundwater Water that flows or seeps downward and saturates soil or rock, supplying springs and wells. The upper surface of the saturate zone is called the water table. (2) Water stored underground in rock crevices and in the pores of geologic materials that make up the Earth's crust
Hydraulic conductivity A coefficient of proportionality describing the rate at which water can move through a porous medium under a hydraulic gradient. Hydraulic conductivity depends upon the pore geometry, fluid viscosity and density. The hydraulic conductivity is at its maximum when the soil is saturated and decreases with decreasing water content
Hydraulic head The equivalent height of a liquid column corresponding to a given pressure; usually called “head” of the fluid. The head is measured with respect to a horizontal datum and is the sum of pressure head and elevation head.
Hydraulic gradient The gradient of the hydraulic head that induces flow of water, expressed as head drop per unit distance in the direction of flow
Hydrograph A graph of stream (river) discharge versus time Infiltration rate The rate of water passing through the surface of the soil, via
pores or small opening, into the soil Infiltrometer A device used to directly measure the rate of infiltration of
water into the soil profile under field conditions Irrigation Water application confined in time and space, enabling to meet
the water requirements of a crop at a given time of its vegetative cycle or to bring the soil to the desired moisture level within the vegetative cycle. The irrigation of a field includes one or more watering per season
Khala A spillway that controls the distribution of water entering the fields. It is constructed on the side of the embankments of the field canals
Kifaf An earthen bund that borders a single field Mefjar A drop structure constructed from stones to dissipate flow
energy so that scouring is minimised Mietdera A land area unit equivalent to a quarter of a hectare Musgha An earthen or brushwood water distribution structure Musgha Kebir Main canal Musgha Sekir Secondary or tertiary canal

194 A Tradition in Transition: Water Management Reforms and Spate Irrigation Systems in Eritrea
Overland flow Part of stream flow which originates from rain which fails to infiltrate the soil surface at any point as it flows over the land surface
Permanent wilting point
The point at which the soil is almost dry and the little moisture left is so tightly held to the soil particles and is hence inaccessible by plants. Quantitatively, it is defined as the moisture content corresponding to a pressure head of -16,000 cm
pH A measure of the relative acidity or alkalinity of water. Water with a pH of 7 is neutral; lower pH levels indicate increasing acidity, while pH levels higher than 7 indicate increasingly basic solutions
Particle size the diameter, in millimeters, of suspended sediment or bed material. Particle-size classifications are: Clay: 0.00024 to 0.004 millimeters (mm); Silt: 0.004 to 0.062 mm; Sand: 0.062 to 2.0 mm; and Gravel: 2.0 to 64.0 mm
Porosity The volume of voids or pore spaces in a soil expressed as a fraction of the bulk volume
Potential energy The energy of an object resulting from its position in a gravitational field
Pressure head The equivalent height of a liquid column corresponding to a given pressure. Pressure head is pressure divided by the density of water
Readily available moisture/maximum allowable depletion
The portion of the total available water a plant can absorb easily or can deplete without reaching a water stress condition
Reka Generosity of water from God with regard to the supply of a very large flood that irrigates all the fields together
Residual soil moisture The amount of water retained by a soil profile at the start of a planting period following water supply during a flood/irrigation season
Runoff Overland and subsurface flow components that contribute to the quick flow in a stream, leaving a watershed within a time scale of about a day following surface water input. Runoff is all water leaving a watershed, the sum of quick flow, base flow and groundwater outflow
Salinity A measure of total soluble salts such as sodium chloride, magnesium and calcium sulfates and bicarbonates, in soil and water. A saline soil is one with an accumulation of free salts at the soil surface and/or within the profile affecting plant growth and/or land use. Salinity levels of soil or water can be tested using Electrical Conductivity (EC). EC of 0.7 to 3 dS m-1 indicates slight salinity, greater than 3, severe salinity
Saturation The condition of a liquid when it has taken into solution the

Symbols, Acronyms and Glossary 195
maximum possible quantity of a given substance at a given temperature and pressure
Sebekh-sagim Transhumance life style that involves seasonal movement of people and livestock from place to place in search of food and fodder
Sediment soil particles, sand, and minerals washed from the land into aquatic systems as a result of natural and human activities
Siham/kitea A roughly rectangular shaped irrigation field Sodicity A measure of exchangeable sodium in relation to other
exchangeable cations, namely calcium, magnesium and potassium. It is expressed as the Exchangeable Sodium Percentage (ESP). At ESP of 5 to 15%, a soil is considered sodic, at greater than 15%, strongly sodic
Sodium Adsorption Ratio
The proportion of sodium in the adsorbed layer, which is held in the pore fluid of the clay. This identity is calculated from the soluble cations present in the supernatant liquid
Soil particle density The weighted average density of the mineral grains making up the soil; mass of the soil divided by the volume of mineral grains
Soil texture The classification of a soil based on the distribution of particle sizes within the soil. The USDA soil texture triangle assigns names, such as sandy loam, silty clay loam, sandy clay based upon the relative fractions of particles
Soil Water Accounting model
A spreadsheet-based model with easily understandable user interface, concepts and computation procedure. It is developed as part of this research primarily to estimate how much of the water supplied during the flood season will be retained by the soil of the Wadi Laba spate irrigated fields (within a depth accessible by the plants) at the onset of the planting season
Soil Water Atmosphere Plant model
Physically based, complex agro-hydrological model that simulates the relationship between soil, weather and plant
Specific discharge The volume of flow per unit area through a porous medium Specific moisture capacity
A parameter representing the rate of change of soil moisture content with respect to pressure head that appears in Richard's equation
Suspended sediment Very fine soil particles that remain in suspension in water for a considerable period of time without contact with the bottom. Such material remains in suspension due to the upward components of turbulence and currents and/or by suspension
Suspended sediment concentration
The ratio of the mass of dry sediment in a water-sediment mixture to the mass of the water-sediment mixture. Typically expressed in milligrams of dry sediment per liter of water-sediment mixture
Suspended sediment The quantity of suspended sediment passing a point in a stream
196 A Tradition in Transition: Water Management Reforms and Spate Irrigation Systems in Eritrea
discharge over a specified period of time. When expressed in
tons per day, it is computed by multiplying water discharge (in
cubic feet per second) by the suspended-sediment concentration
(in milligrams per liter) and by the factor 0.0027
Ternafi A farmer leader of a secondary irrigation unit
Teshki A farmer leader of a tertiary irrigation unit
Tewali An earthen bund that encloses two or more fields
Total Available Water The amount of soil moisture retained between field capacity and
permanent wilting point
Transmissivity The integral over soil depth of hydraulic conductivity. If the soil
is relatively homogenous and flow paths are horizontal,
transmissivity may be defined as the depth times the hydraulic
conductivity
Viscosity Characterization of the degree of internal friction in a fluid;
internal friction or viscous force is associated with the resistance
of two adjacent layers of the fluid against moving relative to
each other
Wadi Laba One of the ephemeral streams in Eritrea
Water quality A term used to describe the chemical, physical, and biological
characteristics of water, usually in respect to its suitability for a
particular purpose
Water management The planned development, distribution, and use of irrigation
water in accordance with predetermined objectives and with
respect to both quantity and quality of the water resources. It is
the specific control of all human intervention on surface and
subterranean water. Every planning activity that has something
to do with water can be looked upon as water management in
the broadest sense of the term
Water table The top of the water surface in the saturated part of an aquifer

Samenvatting 197
Samenvatting
De Achtergrond van de Hervormingen in het Waterbeheer en dit Onderzoek
Eritrea is een klein land in de Hoorn van Afrika dat probeert te voorzien in de basisbehoefte van zijn bevolking wat betreft hun dagelijks voedsel. Met een jaarlijks groeipercentage van 3%, zal de huidige bevolking van 4,5 miljoen toenemen tot 8 miljoen in 2025. Om iedereen de vereiste hoeveelheid voedsel van 0.16 ton per jaar te verstrekken is in 2025 een totaal van 1,3 miljoen ton nodig. Ongeveer 600.000 ha land is geschikt voor regenafhankelijke landbouw en dat kan 450.000 ton per jaar opbrengen (de gemiddelde jaaropbrengst is 0,75 ton per ha). Deze hoeveelheid leidt op jaarbasis tot een tekort van 850.000 ton, dat zal moeten worden opgevangen door de import van voedsel en/of door geïrrigeerde landbouw indien Eritrea geheel voedselzelfvoorzienend en/of voedselonafhankelijk wil zijn.
Het huidige geïrrigeerde areaal is ongeveer 28.000 ha, terwijl het potentieel op 391.000 ha wordt geschat. Met de juiste methoden van waterbeheer zou de opbrengst onder geïrrigeerde landbouw het vijf- tot zesvoudige van die van de regenafhankelijke landbouw kunnen zijn. De geraadpleegde literatuur geeft aan dat de optimale jaaropbrengst van geïrrigeerde sorghum, het belangrijkste gewas in Eritrea, 3,5 tot 5 ton ha-1 kan bedragen. Aangezien de irrigatieontwikkeling in Eritrea in de beginfase verkeert, kan 5 ton ha-1 j-1 waarschijnlijk niet op korte termijn bereikt worden. Echter, met eenvoudige verbeteringen kan de opbrengst van de geïrrigeerde landbouw waarschijnlijk verdrievoudigd worden, dus per jaar tot 2,5 ton ha-1. Als alle inspanningen om het waterbeheer verder te verbeteren zijn uitgevoerd dan kan per jaar zeker een productie van 3,5 ton ha-1 worden bereikt. Op dit moment noemen de boeren die vloedirrigatie (spate irrigation; het onderwerp van dit onderzoek) toepassen per jaar een gemiddelde en een maximale sorghum opbrengst van respectievelijk 2,5 en 4,5 ton ha-1. Aannemend dat in 2025 391.000 ha onder irrigatie zal zijn gebracht en dat de opbrengst per jaar 2,5 ton ha-1 is, dan zou de totale productie meer dan de 850.000 ton van het voedseltekort dekken. Een jaaropbrengst van 3,5 ton ha-1 zou slechts 225.000 ha geïrrigeerde landbouwgronden vereisen om voldoende voedsel te produceren.
De essentiële rol die geïrrigeerde landbouw in de inspanning om elke nieuwe mond te voeden speelt, wordt geheel door de Overheid onderkend. Met prioriteit bij vloedirrigatie, zijn de nodige inspanningen gaande om het te irrigeren areaal uit te breiden en om specifieke verbeteringen in het waterbeheer te introduceren die tot een verhoging van de productie per hectare en per kubieke meter moeten leiden. Het begrip ‘waterbeheer' omvat “de organisatorische aspecten van de betrokken gebruikers; en de technieken die gebruikt worden in (her)ontwerp en lay-out, aanleg, herstel, onderhoud en beheer van de infrastructuur; de aard van de land- en waterrechten en de regels betreffende het waterbeheer, alsmede de mechanismen om deze te handhaven; de aard van de watergerelateerde conflicten en de strategieën om deze conflicten op te lossen”.
In Eritrea zijn 11 vloedirrigatie systemen in bedrijf, die het armste deel van de plattelandsbevolking helpen in de voorziening van hun dagelijkse levensonderhoud. Momenteel bevloeien deze systemen in totaal 16.000 ha of ongeveer 56% van het

198 A Tradition in Transition: Water Management Reforms and Spate Irrigation Systems in Eritrea
geïrrigeerde areaal. Na volledige ontwikkeling wordt de oppervlakte van deze irrigatiegebieden op 91.000 ha geschat, dat is bijna 25% van het potentieel te irrigeren landareaal. Indien de jaarlijkse oogsten 2,5 tot 3,5 ton ha-1 zouden zijn, dan kunnen deze systemen 20% tot 25% van de in 2025 voorspelde bevolking van 8 miljoen in voldoende mate van voedsel voorzien. Daarom heeft het Ministerie van Landbouw vloedirrigatie aangewezen als een zeer belangrijk element in het streven naar voedselzekerheid en/of voedselzelfvoorziening in Eritrea. Met het oog op deze ontwikkelingen had het Ministerie een plan voor de periode 1998 tot 2003 opgesteld om het waterbeheer in 4.000 ha bestaand vloedirrigatie gebied te verbeteren en om 5.000 ha nieuw areaal voor vloedirrigatie te ontwikkelen. Daarnaast zijn er plannen voor de lange termijn (2005 tot 2015) om het waterbeheer in 12.000 ha te verbeteren en om 60.000 tot 70.000 ha nieuw te ontwikkelen. Tot dusver is het waterbeheer in 3.500 ha met vloedirrigatie verbeterd en is er nog geen nieuw land onder vloedirrigatie gebracht wegens gebrek aan financiële middelen en goed opgeleid personeel.
Het irrigatiesysteem in de Wadi Laba (een wadi met sterk wisselende afvoeren in de regentijd; het studiegebied) werd gekozen om de beoogde verbeteringen in het waterbeheer op de korte termijn te testen. De Wadi Laba werd ongeveer 100 jaar geleden ontwikkeld en is daarmee een van de oudste vloedirrigatie systemen in Eritrea. Verwacht werd dat door het onderzoek meerdere relevante gegevens beschikbaar zouden komen en dat de boeren, die een rijkdom aan ervaring hebben opgebouwd, ook een waardevolle bijdrage aan de verbeteringen in het waterbeheer zouden kunnen geven. De vervanging van de lokale kunstwerken, die waren opgebouwd uit aarde en kreupelhout (Agims en Musghas) door een betonnen inlaatwerk en steenmatrassen (gabions) vormde de kern van de beoogde verbeteringen in het waterbeheer. De vervanging van het oorspronkelijk landeigendomsrecht door de Land Proclamatie van 1994 was een ander, belangrijk element van de beoogde hervormingen. Het specifieke doel van de hervormingen was om tot een duurzame verbetering van de levensomstandigheden van de boeren in het boven-, midden- en benedenstroomse irrigatiegebied te komen. De specifieke doelstellingen waren:
- een verdubbeling van de gewasproductie door een verhoging van respectievelijk de efficiency in de watertoevoer en een uitbreiding van het jaarlijks te irrigeren gebied met 50%, ofwel 1.200 ha (aanname voor het bestaande systeem) tot 80%, ofwel 2.600 ha na verbetering in een ‘gemiddeld’ seizoen met hoogstens 20 hoogwaters;
- betrouwbare en gereguleerde afvoeren van de grotere hoogwaters (van 100 tot 265 m3 s-
1) om op die manier de benedenstroomse gebieden te kunnen irrigeren, terwijl tegelijkertijd problemen betreffende erosie en sedimentatie in de kanalen en irrigatiegebieden tot een minimum beperkt zouden worden. De traditionele Agims en Musghas werden gewoonlijk al door de middelgrote en kleinere afvoeren (≤ 50 m3 s-1) weggespoeld;
- een duidelijke afname van de ontbossing in het stroomgebied doordat het gebruik van kreupelhout voor de (her)aanleg en het onderhoud van de Agims en Musghas minder zouden worden;
- het voorkomen van landfragmentatie, die veroorzaakt wordt door het traditionele systeem van landeigendom en landoverdracht.

Samenvatting 199
Dit onderzoek werd uitgevoerd om een bijdrage te leveren aan de hervormingen en verbeteringen in het waterbeheer in vloedirrigatie systemen in Eritrea. Het onderzoek heeft twee doelstellingen: - de belangrijkste pijlers van de lokale waterbeheersystemen te identificeren, te begrijpen
en te evalueren; - beoordelen of en in hoeverre de huidige hervormingen in het waterbeheer gebruik
maken van de sterke punten van de bestaande lokale waterbeheersing systemen en of zij de aanwezige zwakke punten zullen wegnemen, alsmede in welke mate de hervormingen de vooraf geformuleerde doelstellingen hebben bereikt of waarschijnlijk zullen bereiken.
Het studiegebied
Het onderzoek vond plaats in het irrigatiegebied van de Wadi Laba, dat in de kustvlakte van Eritrea op een hoogte van 300 m+NAP in het benedenstroomse deel van het stroomgebied van de Wadi Laba ligt. Dit benedenstroomse deel heeft een oppervlak van 60.000 ha wat ongeveer één kwart van het 240.000 ha grote stroomgebied is. Het klimaat is heet en droog met een maximum dagelijkse temperatuur die varieert van 21 oC in Januari tot 45 oC in Augustus. De gemiddelde jaarlijkse regenval is slechts 150 mm. Het bovenstroomse deel van het stroomgebied (180.000 ha), dat de bron van het irrigatiewater voor de laaggelegen gebieden vormt, is heuvelachtig en bergachtig met hoogten van 1.000 tot 3.000 m+NAP. Het klimaat in de hooglanden is warm tot mild met een gemiddelde jaarlijkse temperatuur van ongeveer 22 oC. De gemiddelde jaarlijkse regenval varieert van 400 tot 600 mm en valt zeer onregelmatig.
Het irrigatiesysteem van de Wadi Laba bevloeit momenteel 2.600 ha. Het potentieel wordt geschat op 5.000 ha. Het systeem is onderverdeeld in vijf zones of groepen. Ongeveer 3.000 huishoudens ofwel 21.000 mensen zijn voor hun dagelijkse bestaan afhankelijk van het systeem.
In het oorspronkelijke irrigatiesysteem zorgde het belangrijkste traditionele kunstwerk (Agim), de Jelwet, voor de verdeling van het water van de wadi naar de kanalen Sheeb-Kethin (rechteroever) en Sheeb-Abay (linkeroever). Dit laatste kanaal bedient vier deel gebieden. Op secundair en tertiair niveau werd het water verdeeld met behulp van talrijke Agims en Musghas. Tijdens de recente veranderingen van het waterbeheer kwam een betonnen inlaatwerk in de plaats voor de traditionele Jelwet. Andere, secundaire Agims en Mughas werden door steenmatrassen (gabions) vervangen. Op veldniveau is het lokale waterverdeling systeem - van bovenstrooms naar benedenstrooms en van veld naar veld - nog steeds in gebruik. Het hoofd-inlaatwerk heeft zes belangrijke componenten - de inlaat voorzien van schuiven voor het hoofdkanaal, een verdeelwerk voor het secundaire kanaal, een duiker onder de wadi, een spuisluis, een grindvang en een aarden dijk. De duiker verving de inlaat voor het open kanaal Sheeb-Kethin op de rechteroever. De spuisluis voorkomt dat grof sediment via de schuiven door het hoofdkanaal naar binnen komt. De grindvang is bedoeld om het grove sediment te onderscheppen dat niet door de spuisluis is verwijderd. De aarden dijk is zodanig ontworpen dat hij bij een afvoer van 265 m3 s-1 doorbreekt, waardoor in principe de schade aan de belangrijke betonnen delen van het inlaatwerk beperkt wordt.

200 A Tradition in Transition: Water Management Reforms and Spate Irrigation Systems in Eritrea
De belangrijkste gewassen, sorghum en maïs, kunnen hun groeiperiode (september tot april) voornamelijk voltooien op basis van het beschikbare bodemvocht, dat tijdens het hoogwaterseizoen van 15 juni tot 15 augustus in de wortelzone wordt opgeslagen. Daarom is de aanwezigheid van een diep grondprofiel met een goede bodemvochtigheidcapaciteit en uitstekende infiltratie van het oppervlaktewater een belangrijk element in het vloedirrigatie systeem. In de geïrrigeerde gebieden is sprake van zavel gronden (silt loams). Deze gronden hebben een vochthoudend vermogen van gemiddeld 36 cm m-1, wat als redelijk hoog kan worden beschouwd en hun initiële infiltratiewaarde (19 mm uur-1) is boven gemiddeld.
De boeren rangschikken de vloed afvoeren van de wadi in zes klassen: namelijk zeer klein, klein, middelgroot, matig groot, groot en zeer groot. Op basis van het aantal afvoeren verdelen de boeren een irrigatieseizoen in: uitstekend, goed, gemiddeld en te droog. Een bestand met 13-jaar afvoerwaarnemingen (1992 tot 2004) toonde aan dat 25% van de jaren of te droog of uitstekend zijn geweest en dat in de resterende jaren het seizoen of gemiddeld, of goed is geweest. De middel grote en kleine afvoeren vertegenwoordigen ongeveer 77% van de 229 afvoeren, die zijn voorgekomen. De matig grote afvoeren komen minstens tweemaal per jaar voor, terwijl de grote afvoeren één keer per jaar voorkwamen en de zeer grote afvoeren slechts eenmaal in de twee jaar.
Het lokale waterbeheer: het tijdvak voor de hervormingen van het waterbeheer De doelstellingen van het lokale waterbeheersingsysteem, dat in de afgelopen 100 jaar (1900 tot 2000) tot tevredenheid heeft gewerkt, waren:
- het veiligstellen van minstens drie en hoogstens vier irrigatiebeurten van 50 cm, elk zo vroeg mogelijk in het irrigatieseizoen. De boeren geloven dat drie irrigatiebeurten tenminste 4.5 ton ha-1 j-1 sorghum of sorghum en maïs produceren; een vierde irrigatiebeurt kan misschien de oogst met ongeveer 1 ton ha-1 j-1 verhogen; twee irrigatiegiften leidt tot een oogst die slechts de helft van de genoemde oogst is;
- het nastreven van een eerlijke waterverdeling tussen en over de boven-, midden- en benedenstroomse irrigatie gebieden.
Het gelijktijdig ten uitvoer brengen van de bovengenoemde doelstellingen was een geweldige uitdaging, vooral omdat de wadi afvoeren, de belangrijkste bron van het irrigatiewater, in tijd, volume en duur onvoorspelbaar en soms destructief van aard zijn. Om aan deze uitdaging het hoofd te kunnen bieden, introduceerden de boeren twee zeer belangrijke pijlers in hun waterbeheer - een serie waterrechten en regels en een organisatie die op een efficiënte manier het beheer konden bewerkstellingen. De twee belangrijkste waterrechten en watergebruiksregels waren:
- het recht op water volgens volgorde. Deze regel wijst de kleine en middel grote, en zo nu en dan de matig grote afvoeren toe aan de bovenstroomse gebieden; de matig grote en soms de grote afvoeren aan de middenstroomse gebieden; en de grote en zeer grote afvoeren aan de benedenstroomse gebieden;
- het recht op een irrigatiebeurt. Dit waterrecht legt vast dat in principe een bepaald gebied op een tweede, derde of vierde irrigatiebeurt recht heeft, alleen nadat alle andere gebieden één, twee of drie irrigatiebeurten hebben gehad. Dit recht geeft verder aan dat

Samenvatting 201
in een nieuw irrigatieseizoen, ongeacht hun plaats, de gebieden die in het vorige seizoen droog bleven nu één beurt krijgen vóór welk ander gebied dan ook.
Deze oorspronkelijke waterrechten en regels werden in hoge mate nageleefd. De middel grote en grotere afvoeren vernielden regelmatig de Agims en Musghas en daardoor droegen zij bij tot het handhaven van het recht op de grote afvoeren van de midden en de benedenstroomse gebieden. De lokale kunstwerken werden regelmatig zwaar beschadigd en dat betekende dat een tijdig onderhoud essentieel was met het oog op het afleiden en benutten van het eerstvolgende hoogwater. `De kritieke massa' - de minimum hoeveelheid arbeid, trekdieren en bouwmaterialen die nodig zijn voor het onderhoud - kon slechts door een zeer goede samenwerking tussen de boven-, midden en benedenstroomse boeren gemobiliseerd worden. Het feit dat de meest benedenstroomse boeren alleen dan geïnteresseerd waren om in de gemeenschappelijke onderhoudlast te delen als hen het recht op water niet werd ontzegd, was een belangrijke factor om al te grote onbillijkheden in de waterverdeling te voorkomen.
De oorspronkelijke boerenorganisatie was uiterst efficiënt in het mobiliseren van de noodzakelijke middelen, het organiseren en uitvoeren van het onderhoudswerk, het beschermen van de rechten van de benedenstroomse boeren en het voorkomen van conflicten. Dit was alleen mogelijk omdat de bevolking in de Wadi Laba sociaal en economisch homogeen is (van ieder huishouden is het grondbezit ongeveer 1 ha) en omdat ze sterk overtuigd is van het belang van gelijkheid in waterverdeling. De boerenorganisatie was organisatorisch volledig autonoom - in alle beheersaspecten van het water - aangezien het de volledige verantwoordelijkheid droeg voor besluiten ten aanzien van de wijze waarop het water zou moeten worden verdeeld. Slechts op verzoek van de organisatie konden overheidsinstellingen zich met de gang van zaken bemoeien; de boerenorganisatie was ook in grote lijnen autonoom in financiële zin - aangezien het grootste deel van de onderhoudswerkzaamheden aan de Agims en Musghas met arbeid en trekdieren van de boerengemeenschap zelf werd uitgevoerd. De overheidsinstellingen mobiliseerden alleen materieel zoals schoppen en spaden - zelfs dat slechts op uitdrukkelijk verzoek van de boerenorganisatie. De groepsleiders (Ternefti) en de subgroepleiders (Teshakil) werden democratisch gekozen en waren voornamelijk verantwoording verschuldigd aan de boeren.
De twee pijlers van het lokale waterbeheer slaagden erin om een visie van rechtvaardige waterverdeling te creëren. Dit resulteerde in een goed ontwikkeld saamhorigheidsgevoel onder de gehele boerengemeenschap, dat er toe geleid heeft dat tien decennia lang, een periode waarin vele en vaak verwoestende afvoeren voorkwamen, de gemeenschap erin slaagde om vooral erosie en bovenmatige sedimentatie in de kanalen en op de velden te voorkomen.
Het lokale waterbeheersingsysteem toonde echter enige tekortkomingen. Niet meer dan 60% en 80% van het totale oppervlak van 2.600 ha werd tijdens een gemiddelde en een goed tot uitstekende irrigatieseizoen bevloeid, vooral vanwege het feit dat het niet mogelijk was om in voldoende mate op de onvoorspelbaarheid van de grote afvoeren te anticiperen. Dientengevolge leefde de boerengemeenschap in armoede, hoewel iedereen op een identieke manier. Bovendien was het gebruik van kreupelhout voor het onderhoud van de Agims en Musghas nog steeds een belangrijke factor in de afname van de vegetatie in het stroomgebied met 60%. De oudere boeren verklaarden dat zij in de jaren '50 ongeveer 15
202 A Tradition in Transition: Water Management Reforms and Spate Irrigation Systems in Eritrea
minuten liepen om acacia kreupelhout te verzamelen, terwijl nu de afstand naar een plaats met acacia kreupelhout minstens 90 minuten in beslag neemt.
Hervormingen van het waterbeheer: kunnen de vastgestelde doelstellingen bereikt worden?
De beoogde verbeteringen in het waterbeheer hebben hun belangrijkste doelstellingen niet bereikt: slechts 1.550 ha of 60% van het vastgestelde gebied werden volledig geïrrigeerd (ontvingen drie watergiften) in het uitstekende irrigatieseizoen van 2004 toen er 28 middelgrote afvoeren waren; het gehele stroomafwaarts gelegen gebied van Emdenay/Ede-Eket (260 ha) kreeg geen water; er was geen merkbare afname in de mate van ontbossing.
Ontwerp en lay-out: tekortkomingen en mogelijke herstelmaatregelen
De noodzaak om het functioneren van het lokale waterbeheersingsysteem in details te kennen werd onderkend en zelfs als hoogst relevant gezien om een goed afgestemd technisch ontwerp en lay-out te kunnen maken. Hierbij werd echter opgemerkt dat zo’n gedetailleerde kennis nader onderzoek zou vergen en dat dit tot een verlengde studieduur zou leiden en de conclusie was dat het verzamelen van de studiegegevens een jarenlang uitstel van de ontwikkelingen zou betekenen. Daarom werden het ontwerp en de lay-out gemaakt zonder de belangrijkste aspecten en principes van het lokale waterbeheersingsysteem te kennen. Dit gebrek aan kennis bleek later een van de voornaamste oorzaken voor een aantal tekortkomingen in het ontwerp en lay-out, die hebben geleid tot een ondermaats presteren van het moderne irrigatiesysteem. Het verbeteren en aanpassen van de genoemde tekortkomingen vereisen onder meer:
- het vervangen van de duiker Sheeb-Kethin door een inlaatwerk naast het bestaande zodat het water van de wadi direct naar de boeren kan worden gestuurd en het herstellen van het waterrecht van de bovenstroomse boeren.
- de verst afgelegen midden- en benedenstroomse gebieden Emdenay en Ede-Eket voorzien van afzonderlijke steenmatrassen (gabions) zodat het hoogwater naar de kanalen kan worden geleid en indien nodig zelfs direct van de wadi kan worden afgeleid, wanneer bijvoorbeeld de nooddijk niet meer werkt.
Het uiteindelijke doel van de genoemde technische activiteiten is de verbetering van het gebruik, afleiding en distributie van de wadi afvoeren. In dit verband kan het volgende worden overwogen: - het verminderen van het maximum aantal irrigatie beurten van vier of drie tot twee.
Bijvoorbeeld, wanneer de 1.550 ha, die nu drie beurten ontvangen, slechts tweemaal worden geïrrigeerd, dan zou 7,75 miljoen m3 water gebruikt kunnen worden voor de irrigatie van een extra 775 ha;
- wijzigen van het recht op water volgens volgorde: ongeacht de grootte van de afvoer; wanneer de bovenstroomse gebieden tweemaal irrigatiewater ontvangen hebben tegen medio/eind juli dan zou in de periode daarna het water aan de middel/benedenstroomse gebieden moeten worden gegeven.
Dit voorstel is gebaseerd op resultaten van simulaties met het model SWAM (Hydrologisch Model van het Bodemwater), dat het resterende bodemvocht in de
Samenvatting 203
wortelzone aan het eind van het irrigatieseizoen bepaalt en dat in het kader van dit onderzoek werd ontwikkeld. Hier verwijst het resterende bodemvocht naar de hoeveelheid water die na het irrigatieseizoen, dus aan het begin van het groeiseizoen in de wortelzone aanwezig is.
De simulaties met het model hebben aangetoond dat wanneer een veld twee, drie of vier irrigatiebeurten krijgt het resterende bodemvocht in alle gevallen bijna hetzelfde is, namelijk 66 cm, 71 cm en 76 cm als het veld zijn laatste gift op 15 Juli, 30 Juli en 15 Augustus heeft gekregen. Zelfs een bodemvochtdiepte van 66 cm (met een geringe bijdrage van regenval) is voldoende voor een oogst van 4,5 ton ha-1. In tegenstelling tot het traditionele systeem, toen de velden meestal een derde gift tegen het einde van het irrigatieseizoen ontvingen, bieden de moderne kunstwerken van het nieuwe systeem de mogelijkheid aan sommige bovenstroomse boeren om drie of zelfs vier keer te irrigeren in juli.
Institutionele en wettelijke uitdagingen en mogelijke oplossingen
Gezien de potentieel vernietigende aard van de grote afvoeren, kunnen ook de moderne kunstwerken op elk willekeurig moment worden beschadigd. Deze kunstwerken vergen een heel ander type onderhoud. Het onderhoud hangt niet af van arbeid en de inzameling van acacia kreupelhout, maar vereist vooral grondverzetmachines, zoals vrachtwagens en bulldozers, die op hun beurt een hele andere organisatie vereisen, zowel op organisatorisch als op financieel en technisch gebied. Meer dan 30 jaar beheer in dit soort irrigatiesystemen in andere landen heeft aangetoond dat de grote publieke irrigatiediensten moeite hebben om de beheerstaak volledig zelfstandig te verzorgen. Vooral het chronisch tekort aan fondsen voor onderhoud en tekortkomingen in beheer- en onderhoudsdiensten waren de hoofdoorzaken. Door deze ontwikkelingen ontstond vaak een vacuüm waarin het niet duidelijk was wie voor de waterverdeling verantwoordelijk was waardoor niemand meer het fysieke werk van tijdig onderhoud aanpakte. Het beheer en onderhoud van de moderne systemen vergen niet alleen boerenorganisaties die als geloofwaardige partner optreden, maar die ook de hoofdrol spelen.
In Wadi Laba is grote vooruitgang geboekt met de totstandkoming van de boerenorganisatie waarvan bijna alle boeren lid zijn, gebaseerd op algemene goedgekeurde statuten en voorschriften. De leiding van de organisatie is gebaseerd op het traditionele systeem van Ternefti en Tesahkil. De belangrijkste taak is het scheppen van de voorwaarden voor financiële en organisatorische autonomie en volledige verantwoording van de organisatie naar de leden. Om dit te bereiken kan het volgende worden geadviseerd:
- introductie van een systeem waarbij voor het water betaald wordt; elke boer geeft een jaarlijkse of maandelijkse bijdrage voor beheer en onderhoud;
- officiëele wettelijke erkenning van de boerenorganisatie en haar activiteiten, zoals het leggen van direct contact met donors en het hebben van onafhankelijke bankrekeningen om zodoende voldoende financiële middelen te reserveren om grote onderhoudswerken uit te kunnen voeren.
Naast bovenstaande punten zijn er een aantal kwesties met betrekking tot de Land Proclamatie van 1994. Tot 2000 hadden de boerenorganisaties en de boerengemeenschap

204 A Tradition in Transition: Water Management Reforms and Spate Irrigation Systems in Eritrea
nooit de behoefte om de bepalingen van de Land Proclamatie van 1994 nader verklaard te hebben, alsmede welke invloed deze wet zou kunnen hebben op hun rechten en plichten ten aanzien van hun geïrrigeerde land en de watertoevoer. Sinds de start van de vooral infrastructureel georiënteerde veranderingen in het waterbeheer in 2000, vragen sommige boeren en hun leiders zich herhaaldelijk af: wat er gaat gebeuren na de omvangrijke financiële investeringen van de overheid: zal deze nog steeds toe staan dat zij (de boeren) "hun" land bezitten en gebruiken om met wadiwater te bevloeien? Het is belangrijk dat de boeren spoedig een duidelijk antwoord krijgen op deze vragen; want de nu waargenomen onzekerheid geeft aan dat de boeren niet weten of de Regering de Land Proclamatie van 1994 zou kunnen gebruiken als een wettelijk instrument om het land van de boeren te onteigenen dat zij decennia lang als hun eigen land hebben mogen beschouwen. In Eritrea is het recht om land te mogen bezitten of te gebruiken een voorwaarde om het waterrecht en daarmee de landbouwproductie veilig te stellen.
Generaties lang hebben de boeren geleefd met het traditionele landeigendomsrecht, de Risti (letterlijk vertaald: geërfd land van de stichters of grondleggers). Onder de Risti wordt het landeigendom in een dorp op grond van de Enda toegekend - de uitgebreide familie die rechtstreeks afstamt van de stichters van het dorp. Dit systeem discrimineert de vrouwen en kan ook tot versplintering van het land leiden, omdat het landverdeling na een erfenis toestaat, maar het systeem versterkt het eigendomsgevoel van en daarmee de zekerheid van water voor de landgebruikers. De hoofdbepaling stelt dat geen organisatie, instelling of individu het recht of de macht heeft om land dat aan een gerechtigd Enda lid toebehoort toe te eigenen. Daar staat tegenover de zeer belangrijke bepaling van de Land Proclamatie die stelt dat de Regering of een daartoe gerechtigde Regeringsinstantie het absolute recht en de macht heeft om voor algemene doelen voor ontwikkelingsprojecten en kapitaalinvesteringen land te onteigenen, dat mensen (ongeacht hun clan, Enda, ras, of sex) tot dan toe gebruikt hebben voor landbouw of andere activiteiten, om zodoende bij te dragen aan het nationale herstel. Al of niet gerechtvaardigd, maar deze bepaling heeft geleid tot grote onzekerheid bij de boeren ten aanzien van land en water. Dit gevoel van onzekerheid wordt nog extra versterkt door het streven van de Regering om de voedselgewassen sorghum en maïs te vervangen door katoen, dit ondanks bezwaren van de boeren. Daarom aarzelen de boeren steeds meer om mee te werken aan de beheer- en onderhoudsactiviteiten van het systeem. Om dit probleem op te lossen zijn aanvullende provinciale of sub-provinciale weten nodig, die vaststellen welke verplichtingen en rechten een gemeenschap heeft in het licht van de land- en water rechten na de veranderingen en investeringen in waterbeheer: welke beslissingsbevoegdheid dragen deze rechten naar de boerenorganisaties over ten aanzien van bijvoorbeeld het wijzigen en aanpassen van de gewaskalender, de waterrechten en gebruiksregels en andere belangrijke activiteiten betreffende land en watergebruik?
Verzilting en alkaliniteit en hun invloed op de oogst
Tot nu toe is alleen de waterhoeveelheid besproken, maar de 'waterkwaliteit' (verzilting en alkaliniteit) kan ook een grote invloed op de productie van het gewas hebben. De verzilting kan leiden tot lagere opbrengsten door een verhoging van de spanning om het bodemvocht op te nemen en alkaliniteit door optredende toxiciteit en lagere infiltratiewaarden.
Samenvatting 205
De hervormingen van het waterbeheer hebben vrijwel geen aandacht geschonken aan deze kwaliteitsaspecten - risico’s van verzilting van de bodem en accumulatie van natrium worden nauwelijks onderkend. Dit gebrek aan belangstelling hangt samen met een gebrek aan kennis van de meerderheid van de boeren en irrigatiespecialisten, die er van uit gaan dat de wadi in het irrigatieseizoen water van goede kwaliteit aanvoert, dat geen verzilting of alkaliniteit veroorzaakt. De veronderstelling is dat waterkwaliteit geen invloed heeft op de opbrengsten van sorghum en maïs, of op de infiltratie. Tijdens dit onderzoek zijn op een systematische wijze bodem en water monsters geanalyseerd om de mate en het effect van verzilting en alkaliniteit op lange termijn (10 tot 15 jaren) op de sorghum en maïsopbrengsten te kunnen vaststellen, alsmede hoe de infiltratie van de geïrrigeerde velden hierdoor zou kunnen veranderen. In de middelmatige afvoeren werd vrijwel geen zout aangetroffen, de matig grote afvoeren bevatten een kleine hoeveelheid zout, de grote afvoeren zijn gering tot matig zouthoudend en de heel grote afvoeren zijn matig zouthoudend. Aannemend dat de waterrechten en regels voor de waterverdeling volgens volgorde en irrigatie beurten worden gevolgd, dan kunnen de volgende conclusies met betrekking tot de opbrengstreducties voor de verschillende afvoercategorieën worden getrokken:
- sorghum en maïsopbrengsten in de bovenstroomse velden zullen niet verminderen, onafhankelijk van het feit of zij twee- of driemaal worden geïrrigeerd;
- de opbrengsten van sorghum op de middenstroomse velden die twee irrigatiegiften krijgen zullen niet verminderen, maar de opbrengst van maïs zal 30% tot 50% kunnen afnemen. Wanneer de velden drie irrigatie beurten krijgen – bijvoorbeeld twee gematigd grote en één grote afvoer, dan zal de maximale maïs opbrengst met ongeveer 10% kunnen afnemen;
- het effect op de benedenstroomse velden is het grootst. In het slechtste scenario, wanneer een veld twee irrigatiegiften van heel grote afvoeren krijgt dan zullen de sorghum en maïsopbrengsten met respectievelijk 75% en 100% kunnen afnemen. In het gunstigste scenario, wanneer een veld drie giften ontvangt van grote afvoeren dan kan de maïsopbrengst met 30% verminderen.
De hier gepresenteerde analyses zijn gebaseerd op de aanname dat drie irrigatiegiften ten minste een doorspoel factor (LF) van 0,3 heeft vergeleken met een LF van 0,1 voor twee irrigatiegiften. Volgens het SWAP model is het waterverlies ten gevolge van de evaporatie gemiddeld 700 en 900 m3 ha-1 j-1 in de respectievelijk twee- en driemaal geïrrigeerde velden.
Voorstellen om de verliezen in sorghum en maïsopbrengsten ten gevolge van de verzilting te minimaliseren betreffen: - verandering van het waterrecht volgens voorkomen en de aanleg van een afzonderlijk
inlaatwerk voor de beneden- en middenstrooms gelegen gebieden; - het beperken van de irrigatie tot maximaal twee giften van 6.000 m3 ha-1 elk. Dit
resulteert in een LF van 0,3, terwijl tegelijkertijd een aanzienlijke hoeveelheid water kan worden bespaard (4,7 miljoen m3 per jaar) van de grote afvoeren die 1.550 ha met 15.000 m3 ha-1 j-1 bevloeien; dit extra water zou een gebied van 390 ha kunnen bevloeien;
206 A Tradition in Transition: Water Management Reforms and Spate Irrigation Systems in Eritrea
- het verdiepen van de kennis van de boeren ten aanzien van verzilting en de invloed daarvan op de gewasopbrengsten, zodat zij in het vervolg alleen sorghum verbouwen in die velden die bevloeid worden met water van de grote afvoeren;
- het opstellen van een nieuwe regel voor het waterbeheer waardoor de hele grote afvoeren direct naar de wadi worden teruggevoerd en het overtuigen van de boeren van de noodzaak om dit water niet te gebruiken. Behalve dat de grote afvoeren de grootste negatieve invloed op de maïs en sorghumopbrengsten hebben, hebben deze afvoeren ook de grootste vernietigende kracht en zijn zij schaars in aantal;
- wanneer er behoefte zou bestaan om nieuwe gewassen in te voeren in het gebied, dan zou de voorkeur moeten worden gegeven aan die gewassen, die tenminste gematigd tolerant zijn met betrekking tot verzilting.
Betreffende de alkaliniteit kan worden opgemerkt dat de bepaling van de verbeterde natrium-adsorptie verhouding (RNa) en de gemiddelde alkali verhouding (RNae) in de wortelzone, zoals voorgesteld in dit onderzoek, heeft aangetoond dat de grote afvoeren noch infiltratieproblemen noch toxiciteit in de planten zullen veroorzaken. De toxiciteit index, het uitwisselbare Natrium Percentage (ESP) dat volgt uit de RNae was 9%, terwijl dezelfde index die volgt uit de RNa slechts 1,6% was. Bij maïs, dat een matig gevoelig gewas is, zal natrium toxiciteit pas optreden bij een ESP waarde van 10% of meer.
Verbruik van de bodemvoedingsstoffen en hun effect op de gewasopbrengsten.
Voor de meest optimale gewasopbrengst is meer nodig dan alleen de juiste hoeveelheid water van de juiste kwaliteit en op het juiste moment. Het vereist ook een voldoende aanbod van meer dan 16 voedingsstoffen, de macro voedingsstoffen Stikstof (N), Fosfor (P) en Kalium (K) (NPK) in het bijzonder. NPK is in grote hoeveelheden nodig, maar is gewoonlijk onvoldoende aanwezig in vele Afrikaanse gronden. Toen de plannen voor de hervormingen in het waterbeheer werden opgesteld, werd aangenomen dat de Wadi Laba voldoende voedingsstoffen aanvoert en dat het niet nodig is om kunstmest toe te voegen. Deze veronderstelling was vooral gebaseerd op het feit dat een tekort aan voedingsstoffen niet eenvoudig vastgesteld kon worden in de geïrrigeerde velden. Het is daarom belangrijk om op te merken dat de symptomen van een gering of matig tekort aan voedingsstoffen onopgemerkt kunnen blijven in het veld en soms verward worden met andere complexe verschijnselen, zoals zoutschade, ziekte en droogte. In het hoger gelegen stroomgebied van de wadi, de bron van de voedingsstoffen voor de lager gelegen irrigatievelden, is de opbrengst van regenafhankelijke sorghum afgenomen van 1 ton ha-1 in 1950 tot bijna niets in 2000 en de meeste velden produceren in het beste geval slechts veevoer. Dit is een gevolg van de erosie van de betrekkelijk vruchtbare bovenlaag. Niettemin kreeg de afname van de voedingsstoffen in het hoger gelegen stroomgebied pas de laatste vijf jaren enige aandacht. Dit omdat tot 2000, de landeigenaars in de regenafhankelijke gebieden en de meerderheid van de dorpsbewoners van het hoog gelegen stroomgebied dezelfde mensen waren, die ook het land in het lager gelegen stroomgebied irrigeerden. Deze boeren verbouwden voornamelijk hun voedingsgewassen op het geïrrigeerde land en de regenafhankelijke gebieden werden gebruikt voor supplementaire voedsel en veevoederbehoeften.

Samenvatting 207
De kolonisten, die nu permanent in het regenafhankelijk gebied wonen, zijn voor hun levensonderhoud volledig afhankelijk van het hoger gelegen stroomgebied. Hun aantal is nog klein. Sinds 2000 bevordert de overheid de vestiging van dorpen in dit gebied om administratieve, beter landgebruik en andere ontwikkelingsredenen. Hierdoor neemt het aantal permanente inwoners steeds verder toe. Het hoger gelegen stroomgebied wordt zodoende meer dan alleen maar leverancier van voedingsstoffen en sediment voor de lager gelegen irrigatiegebieden. Het wordt op de middenlange termijn ook een belangrijke bron van levensonderhoud voor de permanente kolonisten. In verband hiermee heeft de overheid plannen uitgewerkt om bodembescherming en andere conserveringsmaatregelen, zoals terrassen, te introduceren. Als deze interventies zich verder ontwikkelen dan zal dat op lange termijn een negatief effect op de levering van sediment en voedingsstoffen aan de lager gelegen irrigatiegebieden hebben.
Om de hierboven beschreven ontwikkelingen nader te analyseren werd het water van de Wadi Laba tijdens verschillende afvoeren onderzocht op sediment en voedingstoffen. Dit werd gedaan om zodoende de volgende hypothese te kunnen testen: alle categorieën van afvoeren leveren nu en in de toekomst voldoende hoeveelheden NPK voor een opbrengst van 4,5 ton ha-1 graan per jaar en van 2 ton ha-1sorghum voor veevoer per jaar en zodoende is een kunstmatige aanvulling van voedingsstoffen niet nodig. De hypothese werd getest voor de volgende watergiften (m3 ha-1 j-1): a) 15.000; b) 12.000; c) 10.000; d) 5.300, e) 3.800.
Op basis van de resultaten van de analyse van sediment en voedingsstoffen in het water kan de juistheid van de hypothese als volgt worden geïnterpreteerd:
- voor de huidige sedimentconcentraties in de verschillende vloedcategorieën, is de hypothese waar voor de watergiften a, b en c. Het is slechts gedeeltelijk waar voor de giften d en e omdat de middel grote afvoeren niet meer dan 70% en 50% van de benodigde stikstof voor de productie van respectievelijk 4,5 en 2 ton ha-1 sorghum en veevoeder per jaar leveren;
- indien in de toekomst de sedimentconcentraties tot de helft van de huidige concentraties afnemen dan zou de hypothese voor de gift a nog volledig waar zijn; maar voor de giften b, c, d en e slechts gedeeltelijk waar;
- wanneer in de toekomst de sedimentconcentraties afnemen tot driekwart van de huidige concentraties dan zou de hypothese voor alle giften (a t/m e) maar gedeeltelijk waar zijn.
De aanvoer van stikstof door de middelgrote en kleinere afvoeren zal in de toekomst een aandachtspunt moeten zijn. De mate waarmee de voedingstoffen in het hoger gelegen stroomgebied uitgeput raken wordt door de overheid erkend. Zij heeft daarom maatregelen genomen die tot conservering van de bodem en het water moeten leiden en die in een snel tempo en op grote schaal kunnen worden uitgevoerd. Deze maatregelen zouden op korte termijn tot een twee- of drievoudige vermindering van de sedimentconcentratie kunnen leiden. Om die reden mag verwacht worden dat de noodzakelijke aanvoer van stikstof zal teruglopen tot 65 kg ha-1 j-1, wat gelijk is aan 50% tekort voor sorghum productie. Om deze reden zal kunstmatige toevoeging van stikstof de bodemvruchtbaarheid in de irrigatiegebieden in de toekomst op peil moeten houden. De hier besproken analyse van het
208 A Tradition in Transition: Water Management Reforms and Spate Irrigation Systems in Eritrea
sediment en de voedingstoffen in het irrigatiewater zou als basis kunnen dienen om voorstellen en activiteiten met betrekking tot de conservering van de bodem en het water in het hoger gelegen stroomgebied te coördineren, om veldexperimenten en voorlichtingscampagnes op te zetten met als doel om methoden tot verbetering van de bodemvruchtbaarheid in de irrigatiegebieden te demonstreren. Hier kan nog eens vermeld worden dat de maatregelen om de bodemvruchtbaarheid in de Wadi Laba te verbeteren niet alleen een technische en economische uitdaging zijn, maar ook een sociale uitdaging.
Technisch bezien is een efficiënte toepassing van kunstmest moeilijk te realiseren, omdat bij elke irrigatiegift een grote, ongecontroleerde hoeveelheid water gegeven wordt waardoor de kunstmestverliezen groot kunnen zijn. Dit zou zich dan in een economische opgave vertalen – waarbij elke, extra US$ voor kunstmest de winst van de sorghumopbrengst, ook in US$, voldoende moet laten toenemen. In verband met de sociale uitdaging, zal de overheid training en voorlichting moeten geven en veldexperimenten ter plaatse moeten uitvoeren om tastbare, overtuigende resultaten aan de boeren te kunnen tonen en zodoende om de boeren te overtuigen dat een bepaalde aanpak gunstige effecten heeft op de bodemvruchtbaarheid en de oogst.
De belangrijkste bijdragen van dit onderzoek
Naast de technische, institutionele, wettelijke en milieu-technische maatregelen, die specifiek voor het irrigatiesysteem van de Wadi Laba zijn beschreven, heeft dit onderzoek ook een aantal algemene bijdragen voor het beheer en de ontwikkeling van (vloed) irrigatiesystemen in Eritrea en in andere landen opgeleverd:
- SWAM, een op spreadsheets gebaseerd model kan een nuttig hulpmiddel zijn voor waterbeheersing-problemen voor irrigatietechnici met beperkte kennis van modelleren en/of voor het werken in een omgeving met een gebrek aan gegevens. Het model is gekoppeld aan het complexere, reeds lang bestaande model SWAP.
- de verzilting en alkaliniteit betrekken bij de economische en technische overwegingen die leiden tot de vaststelling van de optimale ontwerpafvoer, wat tot nu toe nooit gebeurd is;
- de nieuw ontwikkelde methode om de alkaliniteit beter te beoordelen, namelijk met RNae, die preciezer is dan de bestaande methode RNa;
- een voorstel om twee hoofdregelkunstwerken te ontwerpen in plaats van één, dit laatste ontwerp wordt op dit moment nog steeds als de beste oplossing voor de sedimentatieproblemen gezien. Eén kunstwerk kan de sedimentproblemen niet goed oplossen en bovendien zal één kunstwerk de waterrechten van een aantal boeren ontnemen en zal de flexibiliteit in waterverdeling belemmerd worden;
- het verwerpen van een te simplistische benadering van waterrechten en regels – meestal worden waterrechten en regels beschouwd als vaste water hoeveelheden en rechten (dit is nog steeds de maatgevende grondslag voor de meeste hervormingen in waterbeheer in vloedirrigatie). Integendeel wordt onderbouwd dat waterrechten en watergebruikregels moeten worden bezien als operationele rechten en regels die onderdeel van een veranderend waterbeheer zijn;

Samenvatting 209
- de vaststelling dat - in tegenstelling tot het advies van sommige experts op het gebied van waterbeheer - nationale/provinciale wetten meer dan marginale betekenis hebben. Lokale waterrechten en regels zijn niet noodzakelijkerwijs voldoende om tot een goed waterbeheer van de (vloed) irrigatiesystemen te komen; oorspronkelijk waren zij vooral bedoeld om de behoeften van de lokale (arme) boerengemeenschap te verlichten. Daarom is het noodzakelijk dat na de infrastructurele hervormingen, de nationale en provinciale wetten de verandering in waterbeheer ondersteunen omdat zij een zeer belangrijke factor zijn om boeren en hun organisaties te motiveren en omdat zij wettelijke zekerheid bieden zodat de boeren volwaardige partners in het waterbeheer worden.
Een Wijder Toekomstperspectief: Heroverweging van de Huidige Hervormingen in het Waterbeheer
De hervormingen in de waterbeheersing in verscheidene lokale systemen met vloedirrigatie hebben tot nu toe maar in beperkte mate hun doelstelling om de gewasproductie en daarmee het levensonderhoud van de arme gemeenschappen te verbeteren, bereikt. Naast het feit dat een groot aantal plaatsspecifieke factoren aangepakt moeten worden, kan ook een heroverweging van sommige aspecten van de bestaande benaderingen nuttig zijn om daarmee toekomstige hervormingen in het waterbeheer een beter perspectief te bieden met betrekking tot het bereiken van bovengenoemde doelstellingen.
Het eerste aspect heeft betrekking op de onvolledigheid van het pakket van technische voorzieningen. Vele hervormingen in het waterbeheer beginnen en eindigen op het niveau van het hoofdsysteem waar niet meer dan twee betonnen inlaatwerken zijn geïntroduceerd. Deze oplossing is vooral voortgekomen uit de behoefte om economisch te produceren. In sommige landen, variëren de kosten van dergelijke betonnen inlaatwerken van US$ 1.500 tot 2.500 per hectare en dit is gezien de onvermijdelijke risico’s in de watervoorziening en gewasproductie in de vloedirrigatiesystemen een investeringsniveau dat nauwelijks economisch verantwoord kan worden.
Ervaringen tonen aan dat de betonnen inlaatwerken eigerlijk niet passen in een irrigatiesysteem waar de bevloeiing van veld naar veld plaats vindt, zoals dat in de lokale vloedirrigatiesystemen gebeurt en in systemen waar veel water bovenstrooms wordt afgeleid zonder dat, dat een productief doel dient en alleen uitdroging van de benedenstroomse velden tot gevolg heeft. Voorts heeft de nieuwe benadering om van twee naar een inlaatkunstwerk te gaan de sedimentproblemen niet opgelost. In verscheidene lokale irrigatiesystemen met twee hoofdkanalen heeft de benadering om maar een inlaatwerk te bouwen niet tot een aanvaardbare controle van het sediment in het hoofdsysteem geleid. Bovendien leidt deze oplossing ook tot sedimentproblemen in het secundair en tertiaire irrigatiesysteem.
Het tweede aspect betreft de misvatting betreffende de lokale waterrechten en regels. In de meeste hervormingen van het waterbeheer worden de waterrechten en regels als vaste afspraken beschouwd en om deze rechten en regels af te dwingen wordt de nadruk op de technische ontwerpen gelegd die een vaste en evenredige waterverdeling bevorderen. In vloedirrigatie, waar men geenszins met zekerheid kan zeggen wanneer de volgende vloed zal komen, hoelang en hoe groot de vloed zal zijn en zelfs niet welke velden door het water

210 A Tradition in Transition: Water Management Reforms and Spate Irrigation Systems in Eritrea
geïrrigeerd zullen worden, worden de waterrechten en regels vooral als operationele regels beschouwd die moeten worden aangepast om aan de nieuwe situatie van het waterbeheer te kunnen voldoen. Deze aanpassingen vereisen in de meeste gevallen dat het irrigatiesysteem tenminste twee betonnen inlaatwerken op het hoofdniveau heeft, die worden aangevuld met inlaten op het secundaire en tertiaire niveau zodat een goede waterverdeling van veld naar veld verkregen wordt. Deze benadering leidt op zijn beurt weer tot de eis dat het sociale aspect – verbetering van het levensonderhoud van de arme gemeenschappen - de grondslag zal zijn om de investeringen te rechtvaardigen. Sterke, betrouwbare betonnen inlaatwerken zijn belangrijk; maar het feit dat sommige grote afvoeren, die zelfs de betonnen kunstwerken kunnen vernietigen, voor irrigatie worden gebruikt, doet de weegschaal naar tijdige (her)bouw, beheer en onderhoud van de infrastructuur doorslaan. Zelfs wanneer economische haalbaarheid als leidend uitgangspunt wordt gebruikt dan is het nog steeds noodzakelijk om het uitgangspunt van meerdere inlaatwerken aan te houden door de introductie van kunstwerken van steenmatrassen.
Het derde aspect betreft de effecten van onvoldoende integratie van waterkwaliteit (zoutgehalte en alkaline) en beheer van de bodemvruchtbaarheid in het pakket van de waterbeheer hervormingen. Zoals het geval in de Wadi Laba was, kunnen de hoger gelegen delen van het stroomgebied zoutdragende mineralen bevatten en sommige hoogwaters die in deze gebieden ontstaan kunnen zout en/of alkaline zijn en kunnen daardoor tot een aanzienlijke vermindering van de gewasopbrengsten leiden. Om dezelfde reden zijn grootschalige conserveringsmaatregelen voor de bodem en het water nodig, die de natuurlijke bronnen van de hoger gelegen delen van het stroomgebieden moeten beschermen en het levensonderhoud van de bewoners ondersteunen, en bovendien het sediment en de aanvoer van voedingsstoffen naar de geïrrigeerde akkers veilig stellen.
Het vierde aspect heeft betrekking op de instelling van dubbele institutionele organisaties. De introductie van formele instellingen schijnt een bijna automatisch vereiste in waterbeheer hervormingen te zijn. In sommige irrigatiesystemen, heeft een dergelijke instelling geen toegevoegde waarde; eerder, kan het de informele en voldoende georganiseerde instellingen, die al op een brede steun van de gemeenschap kunnen rekenen, ondermijnen. Bovendien kan het nuttig zijn om de gewoonlijk aanvaarde benadering, die een 50% vertegenwoordiging van de gemeenschap als uitgangspunt voor een succesvolle onderneming van formele instellingen accepteert, opnieuw in overweging te nemen. Het is duidelijk dat 50% succes ook 50% mislukking betekent en dat de meerderheid van de helft van de gemeenschap die niet bij de veranderingen betrokken is, gevormd wordt door de armen.
Tot slot moet hier nogmaals benadrukt worden dat de genoemde technische, institutionele, wettelijke, en milieu (zoutgehalte en alkaline, en afname van de bodemvruchtbaarheid) aspecten als één pakket moeten worden gezien en dat alleen dan de invloed van hun onderlinge wisselwerking en afhankelijkheid op een wetenschappelijke wijze kan worden begrepen en geanalyseerd.
About the Author 211
About the Author
Abraham Mehari Haile was born in Asmara, Eritrea on May 14, 1971. He obtained his B.Sc. in Soil and Water Conservation in 1996 from the University of Asmara. In the same year, he joined the University as a graduate assistant where he handled soil and water analyses laboratory sessions. He acquired his M.Sc. in Irrigation and Water Management in January 2000 from Wageningen University, the Netherlands. His thesis assessed the successes and limitations of the farmers and government institutions in implementing the indigenous spate irrigation water rights and management systems in Eritrea.
Between March 2000 and 2002, he lectured water management, irrigation and hydrology courses and guided B.Sc. dissertations in the University of Asmara. In the same period, he was assigned to the post of irrigation water management expert in the Sustainable Land and Water Management collaborative project between the University of Bern, Switzerland and the University of Asmara. His main task was designing irrigation systems in accordance with community-based water sharing arrangements.
In April 2002, he joined the Land and Water Development Core of the UNESCO-IHE Institute, the Netherlands as a PhD research fellow. His thesis entitled: “A tradition in transition: Water management reforms in spate irrigation systems in Eritrea” has analyzed the effectiveness of the indigenous spate irrigation water management systems and water management reforms, from a technical, institutional and environmental perspective. The thesis also developed a Soil Water Accounting Model (SWAM), which can be a useful water management tool for those with limited modelling know-how and/or operating under data scarce conditions. The model gave comparable soil moisture simulation results to that of the more complex, widely used SWAP model.
During the course of his PhD research (2002 to 2006), he assessed practical application of the different water distribution rules and systems, and the strengths and weaknesses of the enforcing institutions in some spate irrigation systems in the Republic of Yemen in the period February to March 2004. This was done at the invitation of the Irrigation Improvement Project led by ARCADIS Euroconsult, the Netherlands. Moreover, from December 2005 to June 2006, he conducted a study in the Rufiji Basin at the request of the International Water Management Institute (IWMI), Srilanka. The study analysed the impacts of the formal water management package - modern water diversion infrastructure, water rights and fees system and legal Water Users Associations - on the socio-economic and cultural water needs of smallholder irrigators.
Mr. Mehari Haile presented papers in three conferences of the International Commission on Irrigation and Drainage (ICID) that were held in 2003, 2004 and 2005 in France, Russia and Beijing as well as in the water management related conferences in Switzerland in 2003, in South Africa, United States of America and Zimbabwe in 2005 and in Malawi in 2006. He has several publications in international peer reviewed journals.
