a treatise on the surveyor lunar landing dynamics … · a treatise on the surveyor lunar landing...
TRANSCRIPT
NATIONAL AERONAUTICS AND SPACE ADMINISTRATION
Technical Report 324035
A Treatise on the Surveyor Lunar Landing Dynamics
and an Evaluation of Pertinent Telemetry Data
Returned by Surveyor I
F, SpeWing
J. Garba
N67 -i (ACCESS_N
(NASA CR OR TMX C
34177_[UM BER)
rR AD NUI_BER)
(THOU)
(co2_/-I)
(CATE'GO RY)
JET PROPULSION LABORATORY
CALIFORNIA INSTITUTE OF TECHNOLOGY
PASADENA, CALIFORNIA
August 15, 1967
https://ntrs.nasa.gov/search.jsp?R=19670024848 2018-09-04T11:49:20+00:00Z

J
f
NATIONAL AERONAUTICS AND SPACE ADMINISTRATION
Technical Report 32-1035
A Treatise on the Surveyor Lunar Landing Dynamics
and an Evaluation of Pertinent Telemetry Data
Returned by Surveyor I
//
F. Sperling
J. Garba
Approved by:
M. E. Alper, Manager
Applied Mechanics Section
JET PROPULSION LABORATORY
CALIFORNIA INSTITUTE OF TECHNOLOGY
PASADENA, CALIFORNIA
August 15, 1967
"r
r
TECHNICAL REPORT 32-1035
Copyright © 1967
Jet Propulsion Laboratory
California Institute of Technology
Prepared Under Contract N_ NAS 7-100 ,_
National Aeronautics & Space Administration
L ¸

4D
pp_...F..DtNG _PAGE BLANK NO'[ F[_/_ED.
Acknowledgment
This report includes direct or indirect contributions by a large number of indi-
viduals, not only at the Jet Propulsion Laboratory but also at the Hughes Aircraft
Company, the prime Surveyor contractor, as well as many other industrial sub-
contractors. The authors express their thanks and appreciation, generally, to every-
one involved. However, specific acknowledgment should be extended to Ralph E.
Deitriek and Reginald H. Jones, of the Hughes Aircraft Company, who were
instrumental in conceiving and carrying through the Surveyor landing gear designand implementation, and to Robert G. Alderson and David A. Wells, of the
Bendix Products Aerospace Division, for providing the landing simulation pro-
gram, without which the subject data evaluation and lunar soil study would nothave been possible.
JPL TECHNICAL REPORT 32-1035 iii
_K_.c.EDING pAGE BLANK NO_ _U_BD_-
Contents
h Introduction ........................ 1
II. System Description ...................... 3
A. Spacecraft Landing System .................. 3
B. Lunar Descent and Landing Phase ................ 4
C. Instrumentation and Telemetry ................. 5
IIh Pre-Mission Landing Performance Assessment ........... 5
A. Specified Landing Performance Requirements ............ 5
B. Landing Stability Investigation ................. 6
C. Landing Loads Investigation .................. 8
IV. Environmental Conditions ................... 8
A. Lunar Topography ..................... 8
B. Mechanical Surface Properties ................. 10
C. Surveyor Potential for Gaining Knowledge in Regard to
Mechanical Surface Properties ................. 10
V. Computer Simulation ..................... 12
A. Objectives of the Computer Simulation .............. 12
B. Mathematical Model for Rigid Surface Landings ........... 12
C. Integration Routine .................... 12
D. Program Options ..................... 13
E. Modification for Non-Rigid Surface Landings ............ 13
Vl. Surveyor I Performance .................... 13
VII. Surveyor I Landing Data Evaluation and Interpretation ........ 16
A. Short-Term Data Evaluation .................. 16
B. Long-Term Data Evaluation .................. 17
Appendix. Landing-Gear Characteristics ................ 21
References ........................... 24
JPL TECHNICAL REPORT 32-1035 v
Contents (contd)
Tables
1. Summary of actual and predicted landing performance parameters . 16
A-1. Shock absorber characteristics ................ 23
A_2. Footpad characteristics .................. 23
A-3. Body block characteristics ................. 24
Figures
1. Surveyor I spacecraft configuration .............. 2
2. Surveyor I landing gear in extended position (schematic) ....... 3
3. Surveyor I landing gear articulation sequence during landing (schematic) . 3
4. RADVS beam orientation .................. 4
5. Terminal descent velocity profile ............... 5
6. Landing stability boundaries for planar downhill landings on
15-deg slope; spacecraft orientation: one leg trailing ........ 6
7. Degradation of spacecraft stability in nonplanar landings ....... 7
8. Average spacecraft tilts for six R9 frames (from Nathan-Rindfleisch data, JPL) 9
9. Frequency distribution of largest depressions and protuberances at points of
Surveyor ! crushable blocks for last R9 P-l, P-3 frames; counting interval, 5 cm
10. Surveyor I shock absorber strain-gage force histories ........
11. Surveyor I RADVS range data ...... ..........
9
13
14
12. Surveyor I RADVS velocity data, V_ ............... 14
13. Surveyor I pitch gyro data .................. 15
14. Surveyor I yaw gyro data .................. 15
15. Three-sigma ellipse showing predictions in descent velocities and
engine cutoff height I .................... 16
16. Bracketing of Surveyor I strain-gage data by pre-mission catalog
landing cases (Leg2) .................... 17
17. ComparisQn of Surveyor I strain-gage data with post-mission hard
surface landing simulation (Leg 2) ............... 18
18. Soft surface landing simulation (Leg 2) ............. 20
A-1. Surveyor I landing gear geometry (shown fully extended),
and footpad detail .................... 21
A-2. Typical shock absorber spring and damping profiles ......... 22
A-3. Typical footpad crush pressure profile .............. 23
A-4. Typical block crush pressure profile ............... 24
Vl JPL TECHNICAL REPORT 32-1035
_ . /,i ¸ :
Abstract
The lunar landing of a Surveyor spacecraft is investigated from the viewpoint
of landing dynamics, which includes the dynamic behaviour of the spacecraft as
well as that of the lunar surface material during the landing process. A descrip-
tion is given of the landing gear design, the final descent and landing sequence,
and the analytical and experimental qualification programs conducted. The eval-
uation of landing telemetry data concentrates on the Surveyor I mission, although
preliminary results of Surveyor III are briefly discussed. In a parametric landing
simulation study, the best agreement between analytical and flight data was
found to be associated with a dynamic soil model having a bearing strength
between 0 and 2 psi at the surface, and between 6 and 8 psi at a depth of 2 in.,
when penetrated by a Surveyor footpad.
• L ,
JPL TECHNICAL REPORT 32-1035 vii

i
A Treatise on the Surveyor Lunar Landing Dynamics
and an Evaluation of Pertinent Telemetry Data
Returned by Surveyor I
V'- "
I. Introduction
At 06:17:34 GMT, June 2, 1966, the spacecraft
Surveyor I performed a controlled soft landing on the
surface of the Moon in a location 43.35 deg west and
2.58 deg south. This report presents a description of the
Surveyor landing from a dynamic point of view. An
assessment of the dynamic performance of the spacecraft
during the final descent and landing phase is given, and
an attempt is made to estimate the dynamic behavior of
the surface material as indicated by the engineering
telemetry and TV data.
The Surveyor I mission was the first in a series of
Surveyor engineering missions; i.e., its main objective
was to demonstrate the feasibility of the radar-controlled
soft landing technique. There are two more general ob-
jectives of the Surveyor program as defined by NASA:
to obtain data of the lunar surface in support of the
Apollo Program, and to increase the scientific knowledge
of the Moon. The upcoming scientific Surveyor missions
will be specifically equipped to accomplish these goals.
However, some conclusions regarding these objectives
can be drawn from data obtained during the Surveyor I
landing.
The second Surveyor mission (Mission B) was con-
ducted in February 1967. Because of a failure in the
vernier propulsion system during midcourse correction
maneuver, the spacecraft went into a tumbling motionfrom which it could not be recovered.
Surveyor Mission C was performed in April 1967,
while this report was being reviewed for release. A soft
landing of Surveyor III on the lunar surface was accom-
plished at 00:04:18 GMT, April 20, 1967, in a location
23.34 deg west and 2.94 deg south. Except for the addi-
tion of the Surface Sampler Experiment to Surveyor III,
there was very little difference between Surveyor I and
HI in regard to the spacecraft, as well as the planned
mission profile. The nominal lunar descent and landing
profile was identical for both spacecraft; however, in
Mission C, it was not followed according to plan in all
JPL TECHNICAL REPORT 32-1035 1
E
L KJ
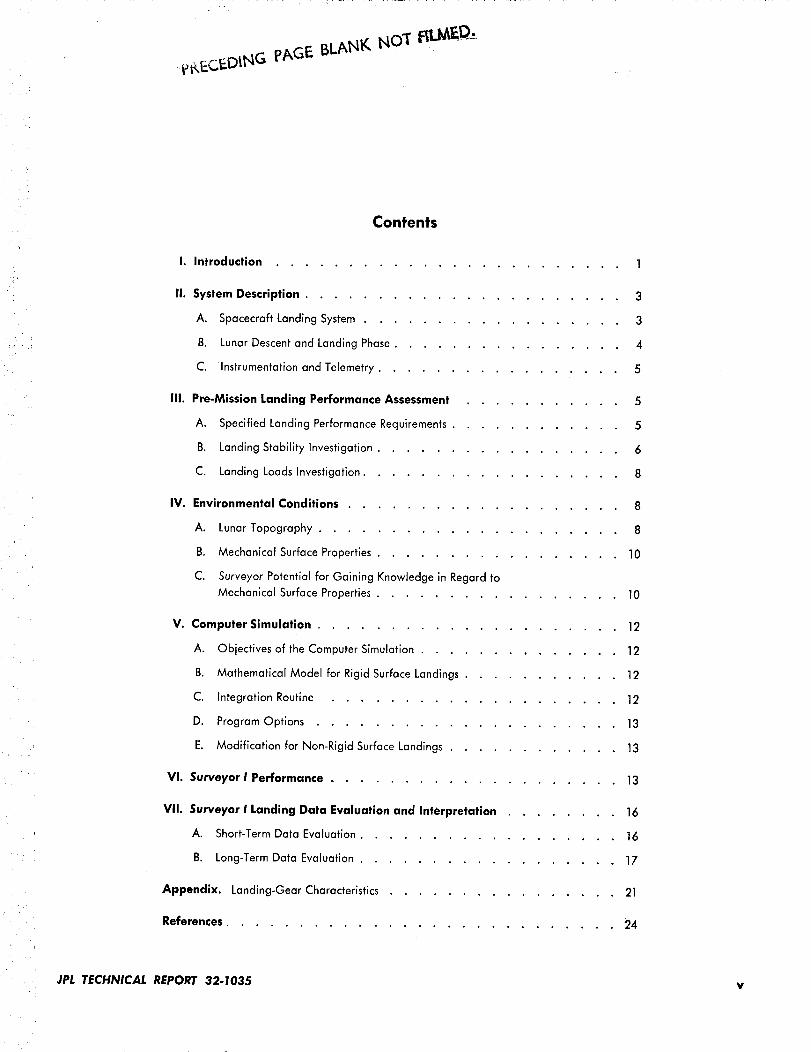
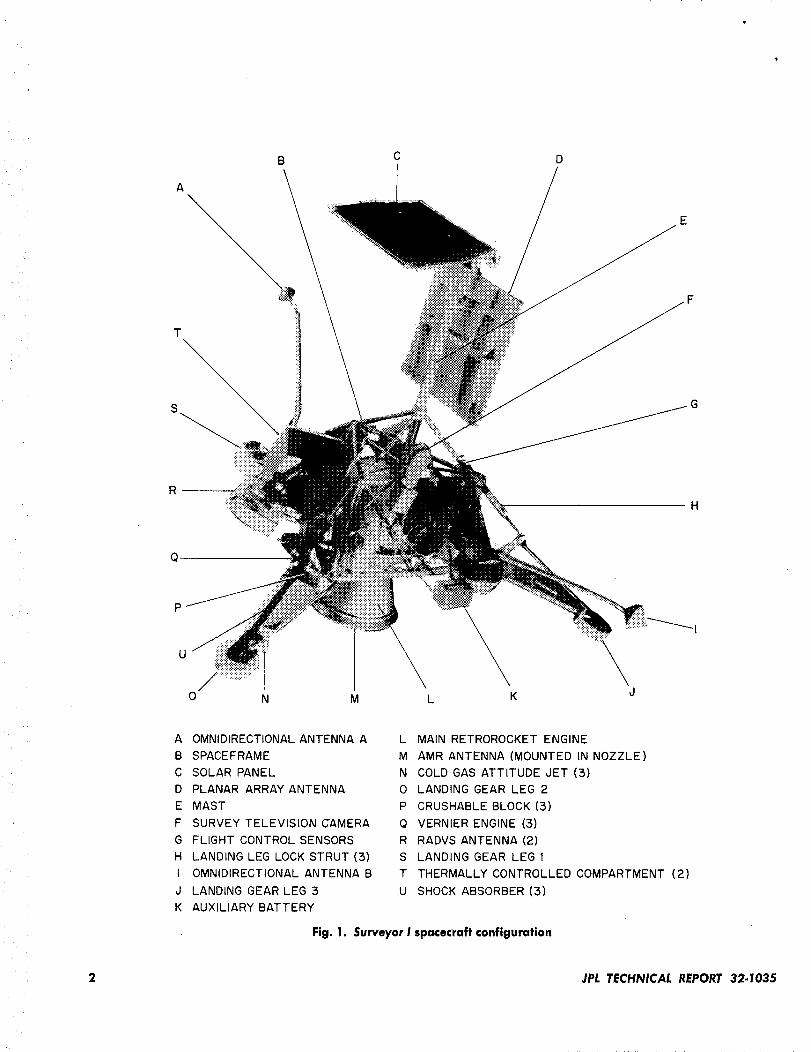
A OMNIDIRECTIONAL ANTENNA A
B SPACEFRAME
C SOLAR PANEL
D PLANAR ARRAY ANTENNA
E MAST
F SURVEY TELEVISION CAMERA
G FLIGHT CONTROL SENSORS
H LANDING LEG LOCK STRUT (3)
I OMNIDIRECTIONAL ANTENNA B
d LANDING GEAR LEG 3
K AUXILIARY BATTERY
L MAIN RETROROCKET ENGINE
M AMR ANTENNA (MOUNTED IN NOZZLE)
N COLD GAS ATTITUDE JET (3)
0 LANDING GEAR LEG 2
P CRUSHABLE BLOCK (3)
Q VERNIER ENGINE (3)
R RADVS ANTENNA (2)
S LANDING GEAR LEG t
T THERMALLY CONTROLLED COMPARTMENT (2)
U SHOCK ABSORBER (3)
Fig. 1. Surveyor I spacecraft configuration
2 JPL TECHNICAL REPORT 32-1035
aspects. Engine cutoff, nominally occurring automaticallyat an altitude of approximately 13 ft above the lunar sur-
face, was not executed at this time. With the engines
thrusting, the effective weight of the spacecraft was re-
duced by approximately 90%, which, in conjunction with
the landing gear elasticity, caused a high springbaekafter the first surface contact. A second touchdown oc-
curred approximately 24 seconds after the first, again
followed by a considerable rebound. A ground command
to terminate engine thrusting was sent and executed
35.8 see after first ground contact. One-half second later,
the third and final touchdown was registered, followed
by a very slight rebound and an elastic ringout, very
similar to what was observed in the Surveyor I landing.
As a consequence of the above-mentioned anomaly, thevertical touchdown velocity is estimated to have been
below 5 ft/s in all three ground encounters, resulting in
shock absorber peak forces of approximately half the
Surveyor I values. Because of this, the Surveyor III data
are not as suitable for an attempt to estimate lunar sur-
face mechanical properties, as described in Section VII of
this report, in conjunction with the data from Surveyor I.
However, a preliminary evaluation of the Surveyor III
data has resulted in bearing strength values which agree
well with the conclusions reached in the Surveyor Istudy, as presented below.
II. System Description
A. Spacecraft Landing System
The spacecraft structure, as illustrated by the model
shown in Fig. 1, consists basically of a frame in the shape
of a truncated three-sided pyramid surrounding the main
retro rocket, three inverted tripod landing legs and a
mast supporting the high-gain antenna and solar panel.
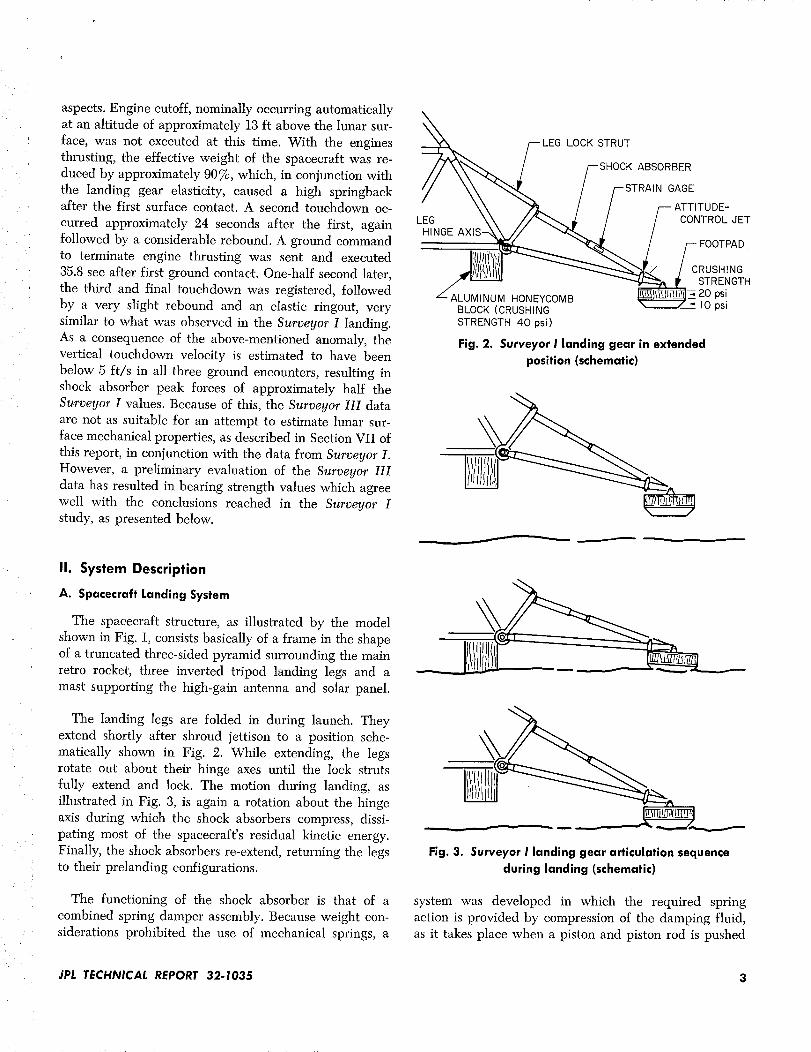
The landing legs are folded in during launch. They
extend shortly after shroud jettison to a position sche-
matically shown in Fig. 2. While extending, the legs
rotate out about their hinge axes until the lock struts
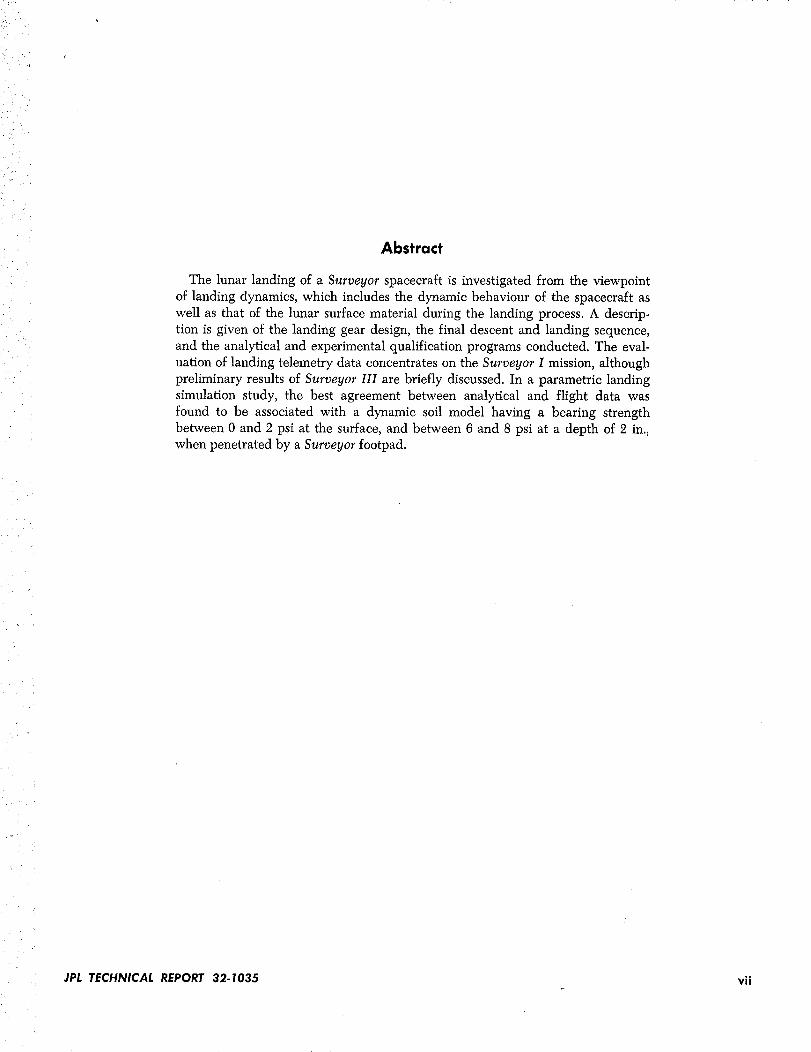
fully extend and lock. The motion during landing, as
illustrated in Fig. 3, is again a rotation about the hinge
axis during which the shock absorbers compress, dissi-
pating most of the spacecraft's residual kinetic energy.
Finally, the shock absorbers re-extend, returning the legs
to their prelanding configurations.
The functioning of the shock absorber is that of a
combined spring damper assembly. Because weight con-
siderations prohibited the use of mechanical springs, a
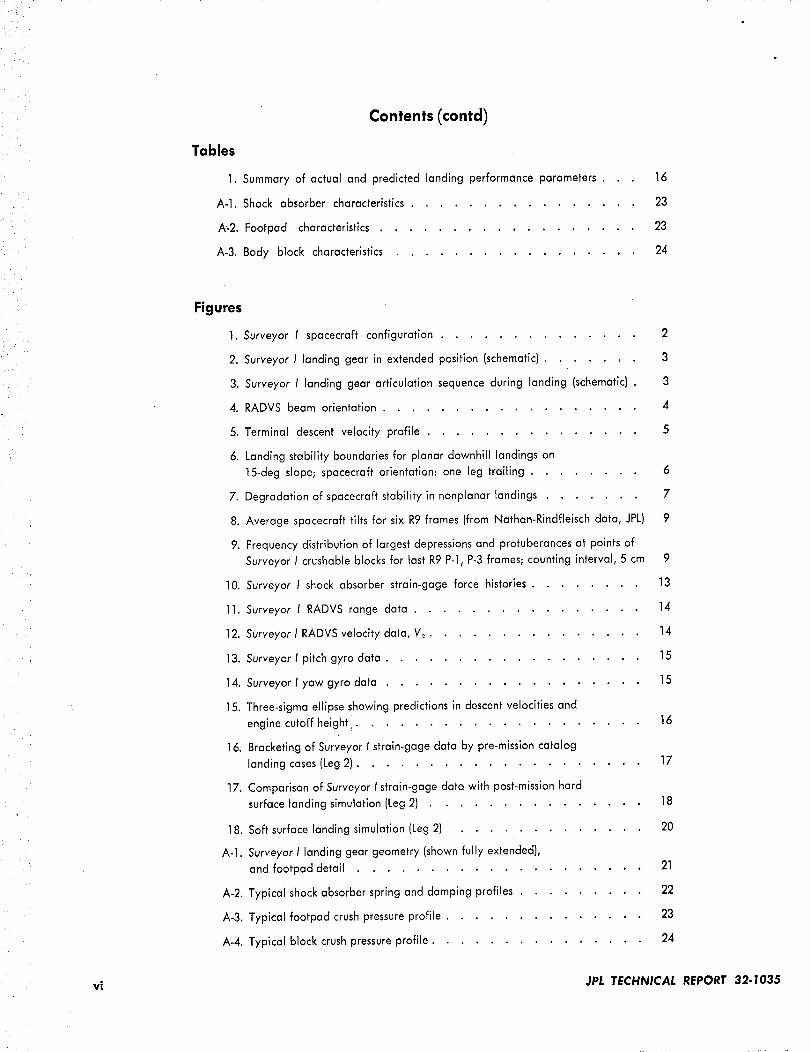
L_/LEG LOCK STRUT
SHOCK ABSORBER
STRAIN GAGE
/ /-- ATTITUDE-
/ / CONTROL JET
HI_ _ / FOOTPAD
ALUMINIIM FlCbKIFYf'.(hMR __ 20 psi" _-,,::_; ;7,::,';.',-T .... _ - I0 psiBLOCK (CRUSHING
STRENGTH 40 psi)
Fig. 2. Surveyor I landing gear in extended
position (schematic)
Fig. 3. Surveyor I landing gear articulation sequence
during landing (schematic)
system was developed in which the required spring
action is provided by compression of the damping fluid,
as it takes place when a piston and piston rod is pushed
JPL TECHNICAL REPORT 32-1035 3
into a rigid cylinder entirely filled with fluid. Simulta-
neously, the fluid is forced through an orifice in the
piston to provide a damping force which is approxi-
mately proportional to the square of the stroking veloc-
ity. During landing, this velocity is highest immediately
after impact, i.e., at low stroke, decreasing rapidly with
increasing stroke. To compensate for the resulting
damping force vs stroke characteristic, the orifice was
made to change its effeetive diameter during the strok-
ing process such that the damping coefficient increases
steeply with increasing stroke. The result is a damping
force which is approximately constant with stroke, i.e., a
maximum energy dissipation capability for a fixed peak
loading is obtained. A different orifice provides high
damping for the shock absorber back stroke.
A secondary energy dissipation device is provided in
the form of three cylindrical body blocks made of erush-
able aluminum honeycomb and mounted under the
frame near the leg attachment areas (Fig. 2). For a level
landing on a rigid level surface, these blocks engage with
the surface for vertical impact velocities exceeding 8 ft/s
and absorb energy by crushing at a constant load.
The footpads, which are mounted at the tips of the
landing legs and can each rotate about an axis parallel
to the leg hinge axis, are also made of aluminum honey-
comb material. They are designed to act as mechanical
overload filters for the shock absorber assemblies; they
also dissipate some landing energy. However, for a level
landing as described above, they do not crush if the
vertical landing velocity is below approximately 11.5 ft/s.
B. Lunar Descent and Landing Phase
The nominal lunar approach and terminal descent
sequence, which was followed very closely by Surveyor I,
may be described briefly as follows. Approximately 63 h
after launch, the spacecraft is commanded to roll and
pitch, or yaw, from its Sun/Canopus locked cruise atti-
tude into a position in which the main retro thrust axis
coincides with the velocity vector. Sixty miles above the
lunar surface, a radar sensor called the altitude marking
radar (AMR) (see Fig. 1) generates a signal which trig-
gers the following automated descent sequence. First, the
three engines of the vernier propulsion system are
ignited. These liquid propellant engines, each of which
is capable of being throttled within a thrust range from
approximately 30 to 104 lb, provide stabilization duringthe main retro motor burn. One second later, the 10,000-1b
thrust solid-propellant main retro motor is ignited and
burns for approximately 43 s. This reduces the spacecraft
velocity from 8,700 ft/s to 350 ft/s at approximately26,000 ft altitude. The main retro motor case is then
ejected, while the vernier propulsion system continues to
stabilize the spacecraft, developing a constant resultant
thrust of 90_o of the lunar spacecraft weight; in other
words the spacecraft is free falling in a one-tenth lunar
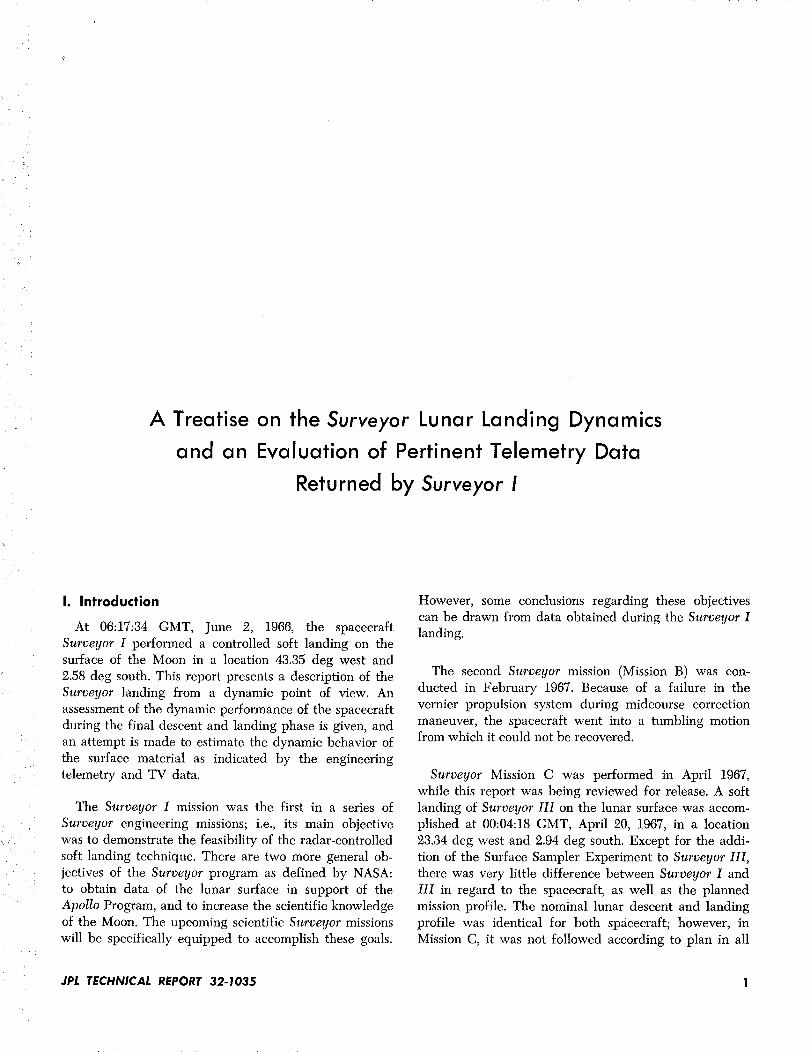
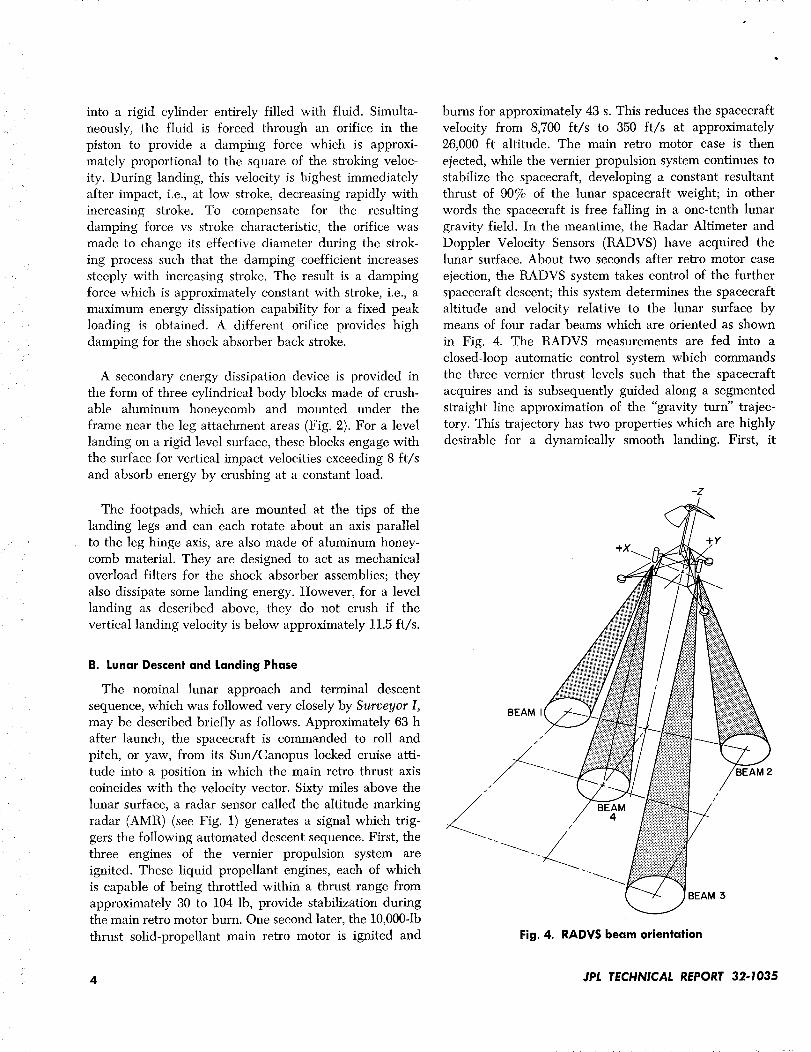
gravity field. In the meantime, the Radar Altimeter and
Doppler Velocity Sensors (RADVS) have acquired thelunar surface. About two seconds after retro motor case
ejection, the RADVS system takes control of the further
spacecraft descent; this system determines the spacecraft
altitude and velocity relative to the lunar surface bymeans of four radar beams which are oriented as shown
in Fig. 4. The RADVS measurements are fed into a
closed-loop automatic control system which commands
the three vernier thrust levels such that the spacecraft
acquires and is subsequently guided along a segmented
straight line approximation of the "gravity turn" trajec-
tory. This trajectory has two properties which are highly
desirable for a dynamically smooth landing. First, it
-z
:Y
BEAM I (
BEAM 5
Fig. 4. RADVS beam orientation
4 JPL TECHNICAL REPORT 32-1035
7
aligns the thrust and velocity directions; i.e., the space-
craft moves along its Z-direction only (see Fig. 4 for
spacecraft coordinates). Second, as the velocity ap-
proaches zero, the flight path direction (and, hence,
the spacecraft Z-axis) is turned toward the lunar vertical.
Because of control loop saturation, the spacecraft cannot
always follow the trajectory segments precisely. How-
ever, in each segment, the actual trajectory intersects the
pre-programmed line at a point called the acquisition
point, from which point very close tracking ensues.
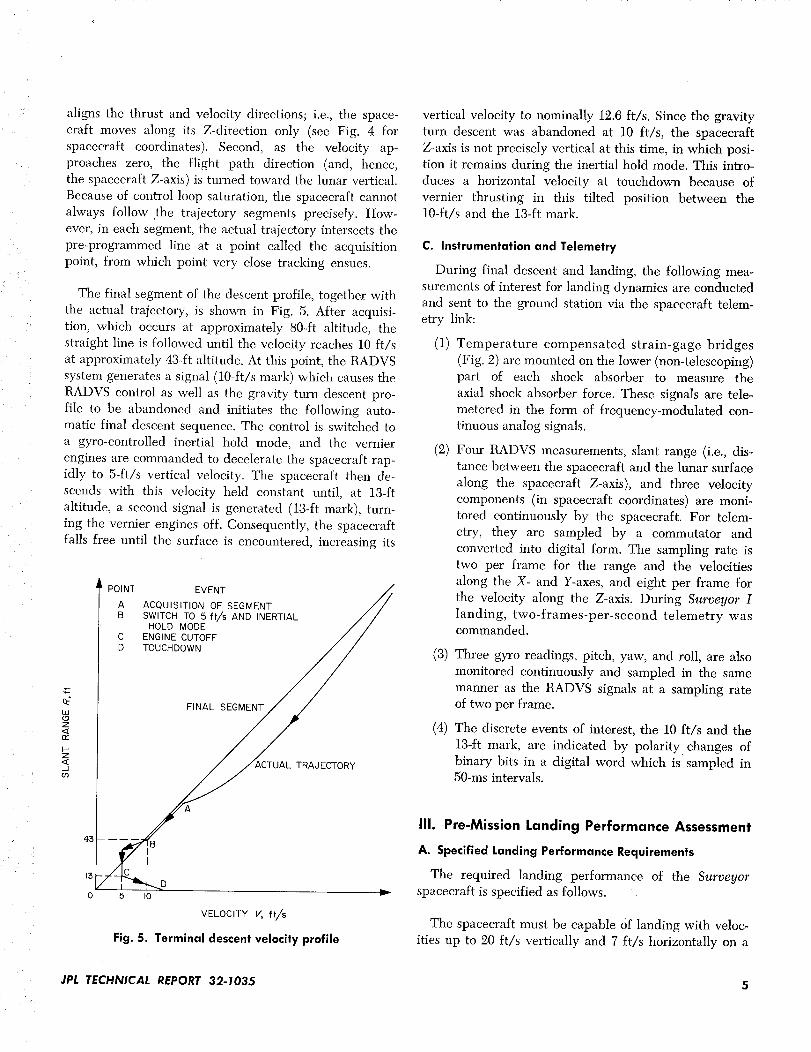
The final segment of the descent profile, together with
the actual trajectory, is shown in Fig. 5. After acquisi-
tion, which occurs at approximately 80-ft altitude, the
straight line is followed until the velocity reaches l0 ft/s
at approximately 43-ft altitude. At this point, the RADVS
system generates a signal (10-ft/s mark) which causes the
RADVS control as well as the gravity turn descent pro-
file to be abandoned and initiates the following auto-
matie final descent sequence. The control is switched to
a gyro-eontrolled inertial hold mode, and the vernier
engines are commanded to decelerate the spacecraft rap-
idly to 5-ft/s vertical velocity. The spacecraft then de-
scends with this velocity held constant until, at 13-ft
altitude, a second signal is generated (13-ft mark), turn-
ing the verifier engines off. Consequently, the spacecraft
falls free until the surface is encountered, increasing its
POINT EVENT
A ACQUISITION OF SEGMENT
B SWITCH TO 5 ft/s AND INERTIALHOLD MODE
C ENGINE CUTOFF
D TOUCHDOWN
mLIJ(.9z<rF
I-z<Ju)
FINAL SEGMENT
_CTUAL TRAJECTORY
vertical velocity to nominally 12.6 ft/s. Since the gravity
turn descent was abandoned at 10 ft/s, the spacecraft
Z-axis is not precisely vertical at this time, in which posi-
tion it remains during the inertial hold mode. This intro-
duces a horizontal veloeity at touchdown because of
vernier thrusting in this tilted position between the10-ft/s and the 13-ft mark.
C. Instrumentation and Telemetry
During final descent and landing, the following mea-
surements of interest for landing dynamics are conducted
and sent to the ground station via the spacecraft telem-etry link:
(1) Temperature compensated strain-gage bridges
(Fig. 2) are mounted on the lower (non-telescoping)
part of each shock absorber to measure the
axial shock absorber force. These signals are tele-
metered in the form of frequency-modulated con-
tinuous analog signals.
(2) Four RADVS measurements, slant range (i.e., dis-tanee between the spacecraft and the lunar surface
along the spacecraft Z-axis), and three velocity
components (in spacecraft coordinates) are moni-
tored continuously by the spacecraft. For telem-
etry, they are sampled by a commutator and
converted into digital form. The sampling rate is
two per frame for the range and the velocities
along the X- and Y-axes, and eight per frame for
the velocity along the Z-axis. During Surveyor I
landing, two-frames-per-second telemetry wascommanded.
(3) Three gyro readings, pitch, yaw, and roll, are also
monitored continuously and sampled in the same
manner as the RADVS signals at a sampling rateof two per frame.
(4) The discrete events of interest, the 10 ft/s and the
13-ft mark, are indicated by polarity changes of
binary bits in a digital word which is sampled in50-ms intervals.
II
D5 I0
VELOCITY V, ft/s
Fig. 5. Terminal descent velocity profile
JPL TECHNICAL REPORT 32-1035
III. Pre-Mission Landing Performance Assessment
A. Specified Landing Performance Requirements
The required landing performance of the Surveyor
spacecraft is specified as follows.
The spacecraft must be capable Of landing with veloc-
ities up to 20 ft/s vertically and 7 ft/s horizontally on a
rigid lunarsurface,whichhasa slopeof 15degor lessandprotuberances10cmor lessin height,withoutsus-tainingdamagethatwouldaffectits post-landingfunc-tions; however,upper three-sigmaestimatesfor thevelocitiesshouldnotexceed15ft/s verticallyand5 ft/shorizontally.This requirementobviouslyincludesthenecessityof a stablelanding,i.e., the spacecraftmustlandandsettlein anuprightposition.Furthermore,theshockexperiencedby the spacecraft'scenterof gravity(cg)duringlandingshouldnotexceed30g (Earth) ver-
tically and 12 g (Earth) horizontally, Le., the peak forcesare not to exceed 30 and 12 times, respectively, the earth
weight of the spacecraft in its landing configuration.
During the design, predictions of the above landing
parameters, and others, were generated. It was then to
be shown that the spacecraft was capable of performing
within the predicted and/or specified regions with re-
spect to landing stability and landing loads. In both
areas, analytical simulation methods and tests of full-size
test vehicles were employed.
B. Landing Stability Investigation
For an assessment of landing stability, a mathematical
model was conceived simulating the kinematic and dy-
namic characteristics of the landing gear mounted on a
rigid body with the mass and inertia properties of the
Surveyor spaceframe and components (Refs. i and 2).
This model was implemented into a computer-landing
analysis program allowing analytical landings to be per-
formed with any spacecraft initial conditions (attitude
and velocities), an arbitrary but constant landing surface
slope, and any constant surface friction coefficient. The
landing surface was originally assumed to be rigid, but
a later modification included the option of representing a
particular type of surface softness. This program, which
is also being used for data evaluation and lunar surface
dynamic properties estimates, is described in detail in
the computer simulation section. The landing program
was first used to investigate, systematically, all possible
combinations of landing parameters, i.e., spacecraft ori-entation and velocities at initial touchdown, lunar surface
slope, and friction coefficient for two-dimensional or
planar landings, i.e., landings in which the spacecraft
center of mass moves in a plane containing the lunar
vertical and the maximum slope direction of the assumed
landing plane. This confines the landing conditions to
velocities in this plane only, i.e., the spacecraft lands
either uphill or downhill, or with zero horizontal velocity.
Also, the spacecraft attitude is symmetrical about this
plane, i.e., one leg is either leading or trailing, and if
there is any initial spacecraft tilt, it is such that the
spacecraft Z-axis (parallel to the mast) remains in this
plane of symmetry.
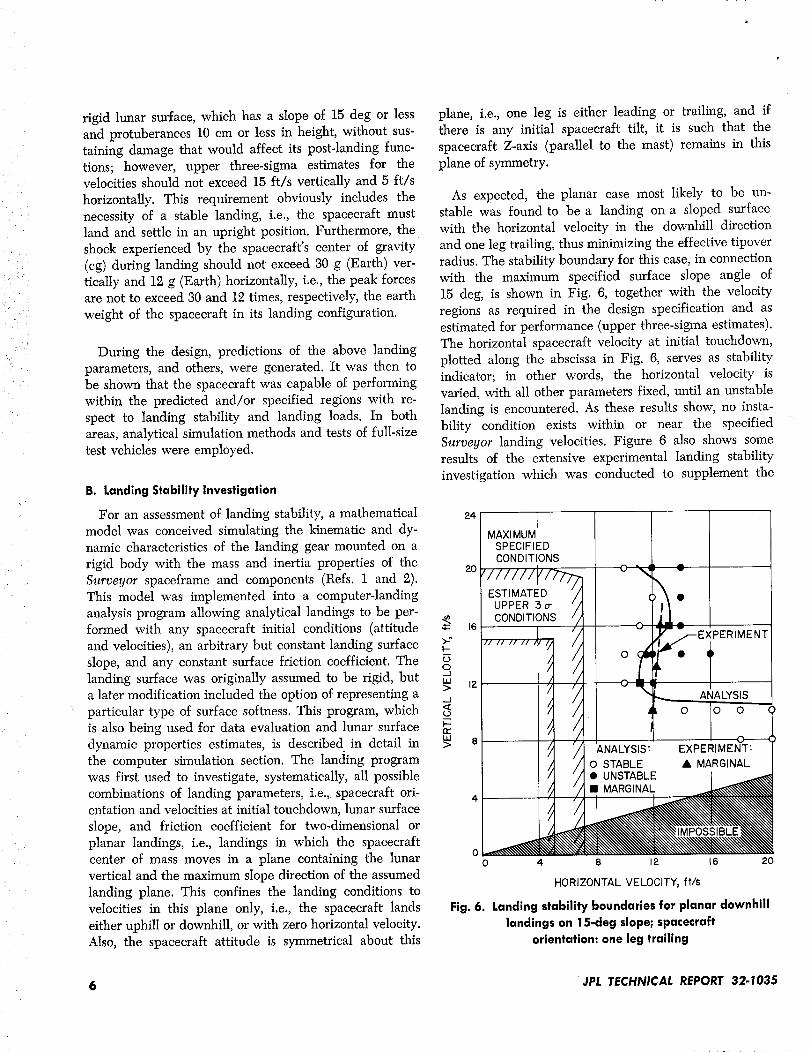
As expected, the planar case most likely to be un-stable was found to be a landing on a sloped suZface
with the horizontal velocity in the downhill direction
and one leg trailing, thus minimizing the effective tipover
radius. The stability boundary for this case, in connection
with the maximum specified surface slope angle of
15 deg, is shown in Fig. 6, together with the velocity
regions as required in the design specification and as
estimated for performance (upper three-sigma estimates).
The horizontal spacecraft velocity at initial touchdown,
plotted along the abscissa in Fig. 6, serves as stability
indicator; in other words, the horizontal velocity is
varied, with all other parameters fixed, until an unstable
landing is encountered. As these results show, no insta-
bility condition exists within or near the specified
Surveyor landing velocities. Figure 6 also shows some
results of the extensive experimental landing stability
investigation which was conducted to supplement the
24
20
>_-
O.dw 12>
_A
8V-
w 8>
lMAXI MUM
SPECIFIED
CONDITIONS
=ERIMENT
0 4 8 12 16 20
HORIZONTAL VELOCITY,ft/s
Fig. 6. Landing stability boundaries for planar downhill
landings on 15-deg slope; spacecraft
orientation: one leg trailing
6 JPL TECHNICAL REPORT 32.1035
analysis (Ref. 1). A full-size spacecraft model was em-
ployed in this program; lunar gravity simulation was
obtained by applying a force of approximately 5/6 of the
spacecraft's Earth weight at the cg in the upward direc-
tion through a trailing cable system connected to constant-
force pneumatic cylinders.
During the course of this test program, the vehicle was
first dropped onto a platform covered with rubber mat-
ting. No instability occurred at any of the touchdownvelocities of interest. In order to increase the effective
coefficient of sliding friction, two-inch cubic abutments
were attached to the landing platform. Total instability
still did not occur at any landing condition of interest.
Three drops were marginally stable. Figure 6 shows thetouchdown velocities for these cases.
Although the stability test program did substantiate
the conclusion that no danger of landing instability exists
unless the specified landing conditions are considerably
exceeded, close correlations, in detail, could not be ob-
tained between analytical and experimental stability
boundaries (Ref. 3). This is believed to be due primarily
to difficulties in the operation of the above mentioned
lunar gravity compensation mechanism; furthermore, notall test conditions could be controlled within close toler-
ances, which applies particularly to the friction between
the footpads and the test surface. Undoubtedly, assump-
tions in the analysis, such as rigidity of the spacecraftframe and a constant coefficient of friction between
footpads and ground, have also contributed to the devia-
tion between experimentally and analytically obtained
stability boundaries. Hence, the stability boundaries
shown in Fig. 6 are not directly comparable. While
for the analytical boundary the assumption of a constant
friction coefficient of unity was made, the effective
friction in the tests was (due to the above mentioned
2 X 2 X 2-in. blocks) not constant and, on the average,
considerably higher. However, since generally the land-
ing stability decreases with increasing footpad/ground
friction, the experimental results indicate a higher land-
ing capability than was found in the analytical investiga-
tion; in other words, the landing stability analysis is, in
general, conservative.
Although it was believed that the planar landings
include the most critical of all possible landing condi-
tions, an investigation was conducted to explore possible
stability degradations due to nonplanar conditions, i.e.,
non-symmetrical spacecraft attitudes, cross-slope hori-
zontal velocities, and spacecraft tilting in directions other
than uphill or downhill. Starting from planar base cases,
these effects were introduced in steps throughout their
ranges of interest. Investigating all combinations, it was
shown that generally any deviation from the base cases
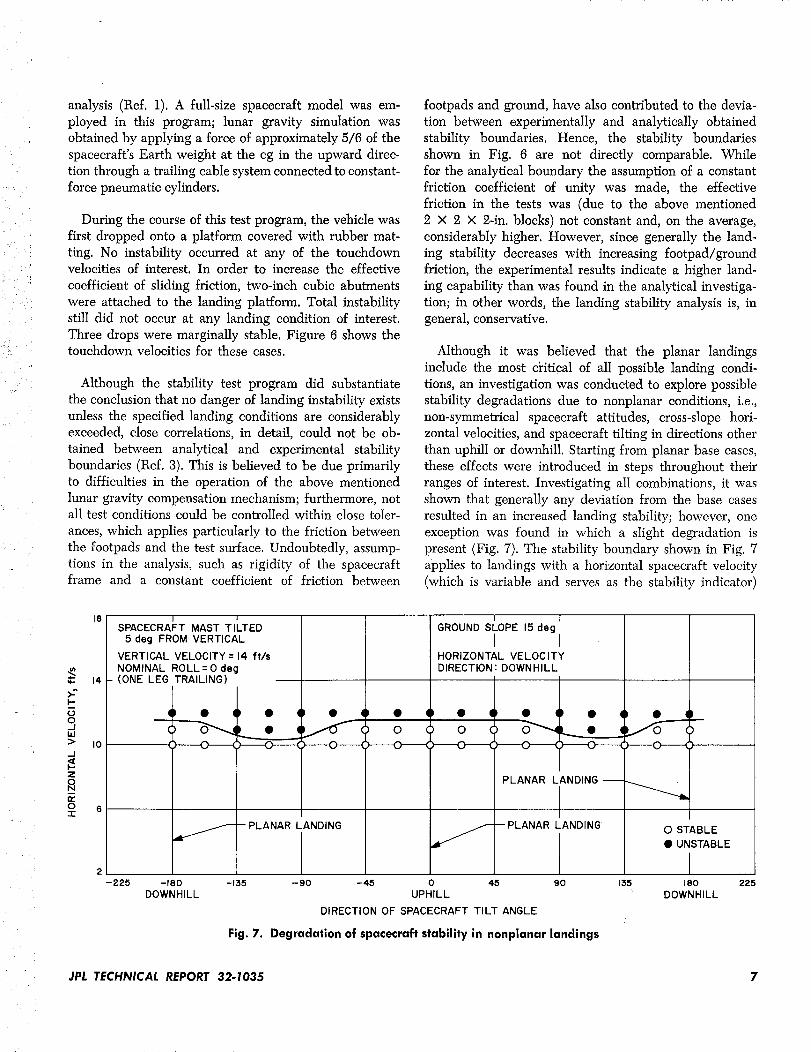
resulted in an increased landing stability; however, one
exception was found in which a slight degradation is
present (Fig. 7). The stability boundary shown in Fig. 7
applies to landings with a horizontal spacecraft velocity
(which is variable and serves as the stability indicator)
18
14
c.)O_1I/d> I0J
Z
o 6-i-
ISPACECRAFT MAST TILTED
5 deg FROM VERTICAL
VERTICAL VELOCITY = 14 ft/s
NOMINAL ROLL=Odeg- (ONE LEG TRAILING)
/
tt • ql • l
• ,c>-----o---_ _
• q
-- PLANAR LANDING
o
i 1GROUND SLOPE 15 deg
I IHORIZONTAL VELOCITY
DIRECTION : DOWNHILL
t • q • q
-- PLANAR LANDING'
PLANAR LANDING--
0 STABLE
• UNSTABLE
-225 -180DOWNHILL
-135 --90 -45 0 45 90UPHILL
DIRECTION OF SPACECRAFTTILT ANGLE
Fig. 7. Degradation of spacecraft stability in nonplanar landings
135 180
DOWNHILL
225
JPL TECHNICAL REPORT 32-1035 7
t
in the downhill direction, and a symmetrical spacecraft
roll attitude (one leg trails). However, a tilt angle of
5 deg between the spacecraft Z-axis and the vertical is
introduced, varying in projected direction from 0 deg
(uphill) to ___180 deg (downhill) in 22.5-deg steps. As
shown, the vehicle will overturn in a landing with 10- to
ll-ft/s horizontal velocity if it is tilted between ±90 deg
(directly sidewise) and ±135 deg (45 deg off the down-
hill direction), while it is capable of a stable landing with
approximately 1 ft/s more horizontal velocity if the tilt
is either uphill or downhill (planar cases). Further inves-
tigation showed that this phenomenon disappears as soon
as additional nonplanar conditions (cross-slope velocity
and nonsymmetric vehicle attitude) are introduced.
While this degradation, which is not intuitively obvious,
is interesting, it is slight and did not have an impact on
the Surveyor design because the horizontal velocities are
still approximately 50% above the maximum requiredvalue.
C. Landing Loads Investigation
Concurrently with the stability investigation, a struc-
ture and component landing loads analysis was per-
formed, which was also supplemented by a series of
landing tests employing a suitably instrumented full-size
structural test vehicle. The analytical approach was
based on a modal survey of the structural test vehicle,
i.e., an experimental determination of the ten lowest nat-
ural frequencies (frequency range from 6 to 70 Hz) and
the corresponding mode shapes. Using these as coordi-
nates, the elastic system was represented in 16 uncoupled
differential equations (6 rigid body modes plus 10 elastic
modes) combined in one matrix equation by use of the
so-called generalized mass and stiffness matrices, which
then enables a forced response solution for any excita-
tion. Again, landing simulations were performed using as
input the force time histories at the six ground contact
points obtained in the above described stability program
(Ref. 2). This procedure is not entirely consistent because
the stability simulation program does not account for
elastic responses of the spaceframe and superstructure,
i.e., regards the spacecraft main structure as a rigid body
with Surveyor mass and inertial properties. However, an
approximation with deviations generally in the conserva-
tive direction is to be expected. Comparisons with test
results showed that, in general, a fair agreement was ob-
tained although some deviations were excessive, which isbelieved to be due to nonlinearities in the structural re-
sponse, causing some of the off-diagonal terms in the
normalized generalized mass matrix to be as high as 0.2.
Ideally, all these terms should be zero or very small com-
pared with the unity values in the main diagonal. With
accelerations of all important spacecraft components de-
termined by this analysis, it was then possible to estimate
stresses in connecting structural members. A more de-
tailed description of the analytical approach is given inRef. 4.
In regard to the overall vehicle shock loads during
landing (i.e., the maximum forces acting on the cg of the
spacecraft, assuming a nonelastic main structure), it was
shown by this investigation that, even for the most severe
of the specified landing conditions, shock loads never
reached more than approximately 60% of the specifica-
tion values of 12 and 30 Earth g in the horizontal and
vertical direction, respectively. While this indicates a
very satisfactory overall design of the landing system,
individual component loads depend, of course, on their
location and support structure within the spacecraft, and
are generally higher than the cg loads. Peak loads of up
to 90 g (Earth) were determined in the antenna/solar
panel substructure, and several redesigns, especially in
the antenna solar panel positioner, were performed based
on results of the load investigation.
Finally, a prototype spacecraft with all components in
flight-like configuration and operating, including the
telemetry link, was type-approval tested for landing in
three drop tests, in order to establish confidence in struc-
tural and functional survival of the spacecraft when sub-
jeeted to the dynamic landing environment.
It was concluded from all these investigations that,
from a landing dynamics point of view, the spacecraft
was to be expected to survive a landing within the upper
three-sigma velocities, provided all systems performed
within their design limits and the environmental condi-
tions encountered were within the design specification,
i.e., a surface slope of less than 15 deg, no large protu-
berances or craters, and a fairly firm lunar soil.
IV. Environmental Conditions
A. Lunar Topography
At the time at which the Surveyor design specifications
had to be generated, including some expected worst-case
environmental conditions of the landing site, very little
was known about the topography of the Moon on a scale
meaningful to Surveyor, i.e., to a resolution of the order
JPL TECHNICAL REPORT 32-1035
/r
"%
L
S •
of one meter. Judging from large scale data, it was speci-
fied that no surface slope in excess of 15 deg was ex-
pected and no protuberances higher than 10 cm.
With the successful photographic missions of Rangers
VII, VIH, and IX in 1964 and 1965, a wealth of small-
scale topographic data became available through photo-
metric evaluations of the last frames of narrow-angle
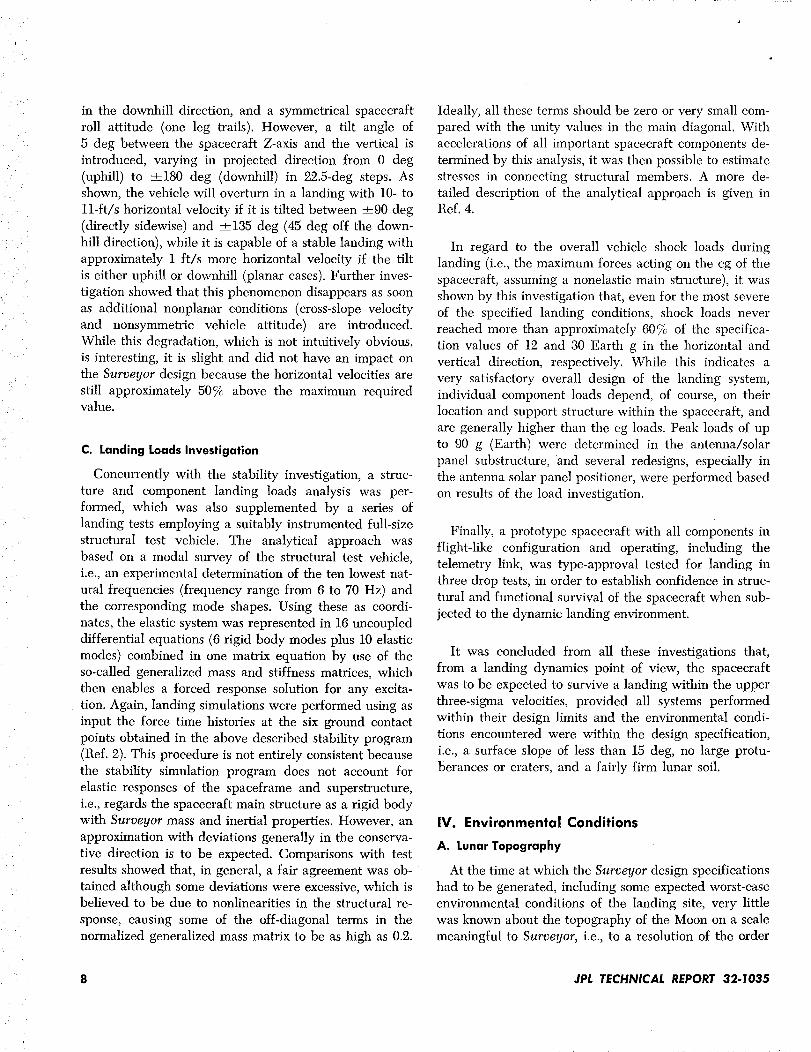
pictures obtained in these missions (Ref. 5). A statistical
analysis was performed simulating a large number of
Surveyor landings on six Ranger IX frames and recording
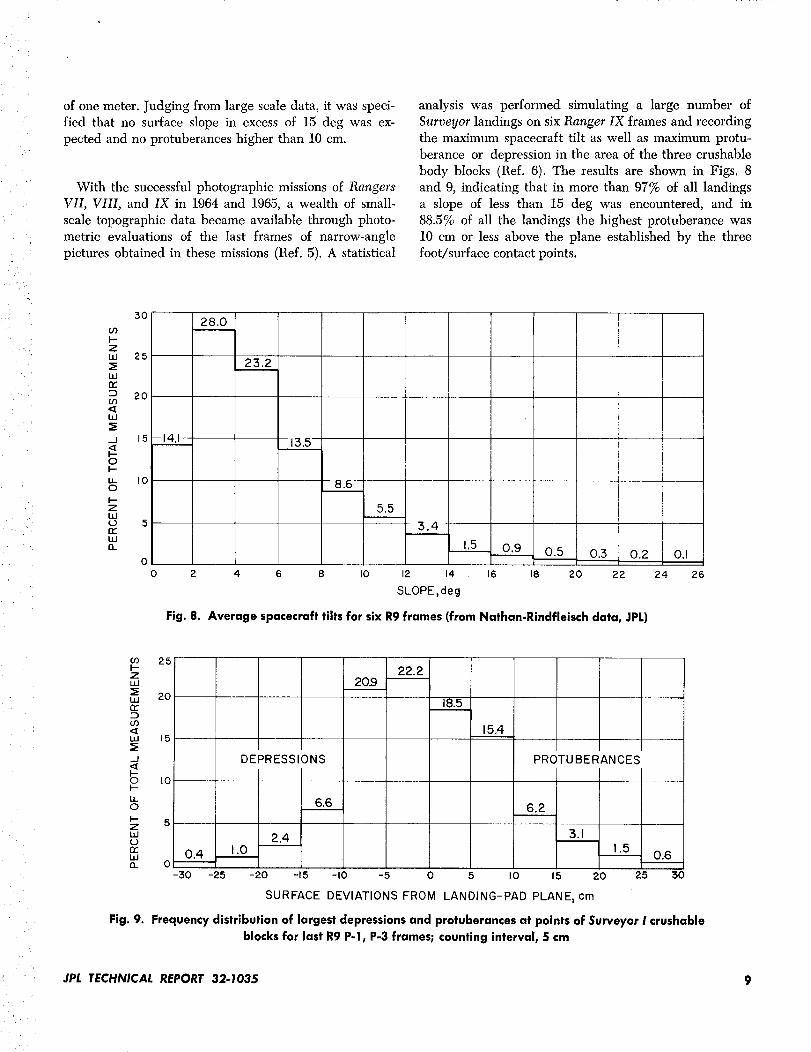
the maximum spacecraft tilt as well as maximum protu-
berance or depression in the area of the three crushable
body blocks (Ref. 6). The results are shown in Figs. 8
and 9, indicating that in more than 97% of all landings
a slope of less than 15 deg was encountered, and in
88.5% of all the landings the highest protuberance was
10 cm or less above the plane established by the three
foot/surface contact points.
30
co
zllJ 25
uJrr
2Oco
hl
.J 15
F-
U- I00
I--Zmo 5n.-wQ.
-14.1 -
28.0
23.2
13,5
8.6
5.5
5.4
1,5 0,9 0.5 0,3 0.2 0.I
2 4 6 e I0 12 14 16 18 20 22 24
SLOPE,deg
Fig. 8. Average spacecraft tilts for six R9 frames (from Nathan-Rindfleisch data, JPL)
26
?
u_ 25I-zLU
20tr:2)03
L,_I 15
J
o_ l0
1L0
_ 5ZW
n"W(3_
DEPRESSIONS
20.922.2
18.5
15.4
PROTUBERANCES
2.41.0
6,6 6.2
3.11.5
0.4 0.6O_
-30 -25 -20 -15 -I0 -5 0 5 I0 15 20 25 30
SURFACE DEVIATIONS FROM LANDING-PAD PLANE, crn
Fig. 9. Frequency distribution of largest depressions and protuberances at points of Surveyor ! crushableblocks for last R9 P-l, P-3 frames; counting interval, 5 cm
JPL TECHNICAL REPORT 32-1035 9
With respect to slopes, the original specification
appeared to be an excellent one; with respect to protuber-
ances, it was much less valid. Also, it had become ap-
parent in the meantime that depressions in the area of the
body blocks are very undesirable; hence, there was con-
cern about the large number of depressions (10.5% in
excess of 10 cm). But in weighing this concern against the
implications which would have resulted from a topo-
graphical re-specification at that time, it was decided toabstain from such action.
B. Mechanical Surface Properties
If there was little known in regard to small-scale lunar
topography at the time of the first Surveyor specification,
the knowledge about any mechanical properties of thelunar surface was still much smaller. However, at least
with respect to the expected hardness of the landing sur-
face, some numerical values had to be provided; this was
done by considering two cases, a 'qaard" and a "soft" sur-
face, specified in the following manner: (1) hard rock,
compressive strength 4000 to 25,000 psi, and (2) soft ma-
terial, compressive strength zero at surface, increasing
linearly with depth of vertical penetration at a rate of
10 psi/ft.
Reflected in this all-embracing specification is the fact
that, although no direct or indirect measurements wereavailable, there were several scientific models of the
lunar surface in existence, suggesting surface hardnesses
from hard rock down to 0.05 psi (Ref. 6). This, however,
was not much help because, from an engineering stand-
point, both extremes had to be considered, the hardest
for maximum shock environment and the softest for
landing stability and maximum sinkage. To design for the
latter to a value of 0.05 psi (no increase with penetration
was given in the scientific model) is next to impossible,
which led first to the above considerably harder soft sur-
face specification; later, a lower value of 50 psi for
surface bearing strength was adopted for design pur-
poses. However, some analytical and test work was per-
formed assuming the specified soft surface, and while it
was established that no sinkage to the point of endanger-
ing the functional survival of the spacecraft would result
in such material, possible stability degradations were
found in cases of downhill landings in which the trailing
leg encounters the surface first. Generally, in these cases
the two other legs impact with higher impact forces
than the first, compressing the material more and therefore
effectively increasing the landing slope. Although it was
not possible to obtain conclusive test results because of
difficulties in finding a soil material with the required
characteristics, i.e., the specified compressive strength
curve and no spring back, it was strongly indicated that
the degradation in landing capability was not substantial
enough to offset the comfortable margin which had been
established for hard surface landings (see Section III-B).
A hardness of 50 psi which was, as mentioned above,
finally adopted as low design value turned out to be
equivalent to a rigid surface for the Surveyor landing
system, because all landings within the specified velocity
limits result in a pressure between footpad and ground of
less than 50 psi; in fact, a ground force corresponding to
50 psi ground pressure would exceed the force transfer
capability of the shock absorber columns. Furthermore,
the aluminum honeycomb material of the lower (conical)
part of the footpads has a nominal crushing strength of
10 to 12 psi, so that, effectively, a material with more
than 10 psi surface bearing strength feels rigid to the
Surveyor footpads. Hence, design, testing, and analysis
of the Surveyor system was essentially performed with a
rigid landing surface in mind, rigid in this case meaning
a surface bearing strength of 10 psi or more.
The first direct indication that there appears to be a
reasonable bearing capability at least somewhere on the
Moon was provided by the successful landing of Russia's
Luna IX in February 1966, although no further infor-
mation facilitating numerical estimates of the bearing
strength was obtainable.
C. Surveyor Potential for Gaining Knowledge in Regard
to Mechanical Surface Properties
Although detailed scientific measurements concerning
lunar environmental conditions were to be performed by
later suitably equipped Surveyor models, it was ob-
viously of great interest to find out as much as possible
from the engineering missions, particularly in regard to
surface bearing strength. This would be of the highest
interest in case the spacecraft should perform success-
fully the descent and touchdown maneuver but should
then fail to survive. In this case, even if only a part of
the shock absorber strain-gage data during landing was
transmitted, these data would be invaluable for deduc-
tion of the encountered ground-reaction forces. A suc-
cessful landing and survival would render these data less
critical but not less interesting, especially because there
was a great curiosity within the scientific community as
well as the general public to find out, as soon as possible
after landing, at least whether the lunar surface was"soft" or 'qaard."
10 JPL TECHNICAL REPORT 32-1035
In order to prepare for this, a method had to be foundin which the measured shock absorber forces and the
sought footpad/ground forces could be related to each
other as reliably and speedily as possible. The relation
between these forces is generally quite complex and not
necessarily unique; it depends, aside from the soil char-
acteristics, on the spacecraft attitude and velocities at
landing. Hence, these variables had to be taken into
account, and it appeared that the most reliable way to
estimate the ground forces would be to simulate the
actual landing analytically, using the spacecraft landing
conditions as observed by the RADVS system. By vary-
ing the dynamic ground representation, an attempt would
then be made to match the analytical shock absorber
strain-gage data with the ones observed during the lunar
landing. The horizontal and vertical footpad ground
forces would then be readily available from the com-
puter simulation.
The main disadvantage of this approach appeared to
be the necessity to perform computer runs after data
reception before any conclusions could be reached,
which woUld delay the latter by at least several hours if
not days. To circumvent this problem, it was decided to
conduct a large number of analytical landings prior
to touchdown, systematically covering the ranges of ex-
pected surface slopes, landing velocities and attitudes,and to assemble the associated shock absorber force his-
tory plots in the form of an indexed catalog which would
facilitate at least rough data matching immediately after
data reception. This was done, resulting in a catalog en-
compassing 1128 landing cases on a rigid surface, i.e., a
surface resisting footpad penetration with at least 10 psi
bearing strength. In order to have at least some capa-
bility to investigate softer surfaces, a simple soft surface
representation in the form of horizontal and vertical
ground reaction forces in terms of static and dynamic
coefficients was devised, the formulas for which are
given and discussed in the following Section V. To re-peat all above hard surface cases for different soft sur-
faces, or combinations of static and dynamic coefficients,
proved to be impractical simply because of the excessive
number of required computer runs; hence, only selectedcases were run for several soft materials in order to be
able to judge, generally, the reflection of a low-bearing-
strength-material landing upon the shock absorber forcedata.
For the more detailed data matching program, as men-
tioned above, all pertinent landing parameters were first
to be determined from the spacecraft telemetry in
order to limit the program input variables to the soil
coefficients. For any landing simulation, nine spacecraft
state variables must be known, three linear and three
angular velocities, most conveniently in spacecraft coor-
dinates, and three angular positions in an inertial refer-
ence system. The first six can be determined from
RADVS and gyro data, the latter cannot since the gyro
reference is the position of the spacecraft at the 10-ft/smark, which is not known except for the fact that, by
virtue of the gravity turn descent, the spacecraft Z-axisshould be close to vertical.
However, these three angles can be determined with
respect to a surface based coordinate system. This is
achieved by a different application of the landing simu-
lation computer program in which the time differences
between the initial impacts of the three footpads, ob-
tained from the shock absorber strain-gage records, are
used as an input instead of a pre-specified surface slope
and orientation. As a result the relative pitch and yaw
angles are obtained as well as the roll angle, if there is
any sloping to the reference landing surface; if not, theroll orientation is irrelevant.
Although this gives neither absolute pitch and yaw (with
respect to the direction of gravity) nor absolute roll
(with respect to lunar north), it is useful for the landing
simulation, because, as long as neither the local surface
normal nor the spacecraft Z-axis at landing are far off
the gravity direction, the relative attitude of the space-
craft with respect to the landing surface is sufficient as
an input into the landing program.
The only unknowns still remaining are characteristics
of the landing surface. For a rigid surface, there is only
one such characteristic, namely the friction coefficient
between the footpads and blocks and the lunar soil. In
the simulation program, a constant friction coefficient is
assumed; hence a straight forward optimization of data
match, comparing mission and simulation shock absorber
strain-gage records, can be performed by varying this
one variable only.
If the ground cannot be regarded as rigid, assumptions
will have to be made about the ground reaction forces in
their dependence on penetration, penetration velocity,
sliding velocity, static and dynamic soil characteristics,
and possibly other variables, in order to enable an ana-
lytical simulation of the landing process. One such
assumption was implemented into the landing-analysis
program, as mentioned above and reported in detail in
JPL TECHNICAL REPORT 32-1035 11
f
the following Section V of this report; however, it con-
stitutes only a first rough approach, basically represent-
ing the soil by six static and dynamic coefficients. Work
is in progress to derive a more refined soil representation,
i.e., in terms of such soil characteristics as cohesion, in-
ternal friction, relative and absolute density, etc. In anyease, however, there will be more than one soil charac-
teristic to be varied in the above described data matching
procedure; consequently, there may be more than one
"soil" with good data correlation, even though one more
piece of information is available for the matching pro-
cess, namely, the final penetration of the footpads as indi-
cated by TV pictures.
The results of the described short and long term data
evaluation for mechanical properties of the lunar surface
performed after the first Surveyor mission are discussed
in Section VII of this report.
V. Computer Simulation
A. Objectives of the Computer Simulation
A digital computer program was developed to study
the landing performance of the Surveyor spacecraft dur-
ing the design phase (Ref. 2). The primary objective of
this program was to assess the landing stability margins
for the Surveyor configuration. However, as discussed in
Section VII below, a similar landing-simulation program
(Ref. 1) was also the primary tool in attempting to esti-
mate lunar surface mechanical properties based on
touchdown data obtained from the Surveyor I landing.
B. Mathematical Model for Rigid Surface Landings
In the digital computer programs, the Surveyor space-
craft is represented by the main body, which is rigid, and
the landing gear system. The latter is further broken
down into the three articulating inverted tripod legs,
three landing feet (footpads), and three crushable blocks
(Fig. 2).
Two of the members of the landing leg form the rigid
lower strut; the third member contains the hydraulic
shock absorber. Mathematically, the shock absorber is
described as exhibiting a force which opposes velocity
and displacement, and as depending on these two varia_bles in a nonlinear fashion.
The landing foot exhibits a force in the opposite direc-
tion of the displacement, this force being a function of
12
the angle of the applied load, the contact area, and the
crushing displacement. Due to the footpad geometry,
the crushing strength vs displacement is not constant.
The crushable blocks are mathematically similar to the
footpads; however, their crushing force is constant.
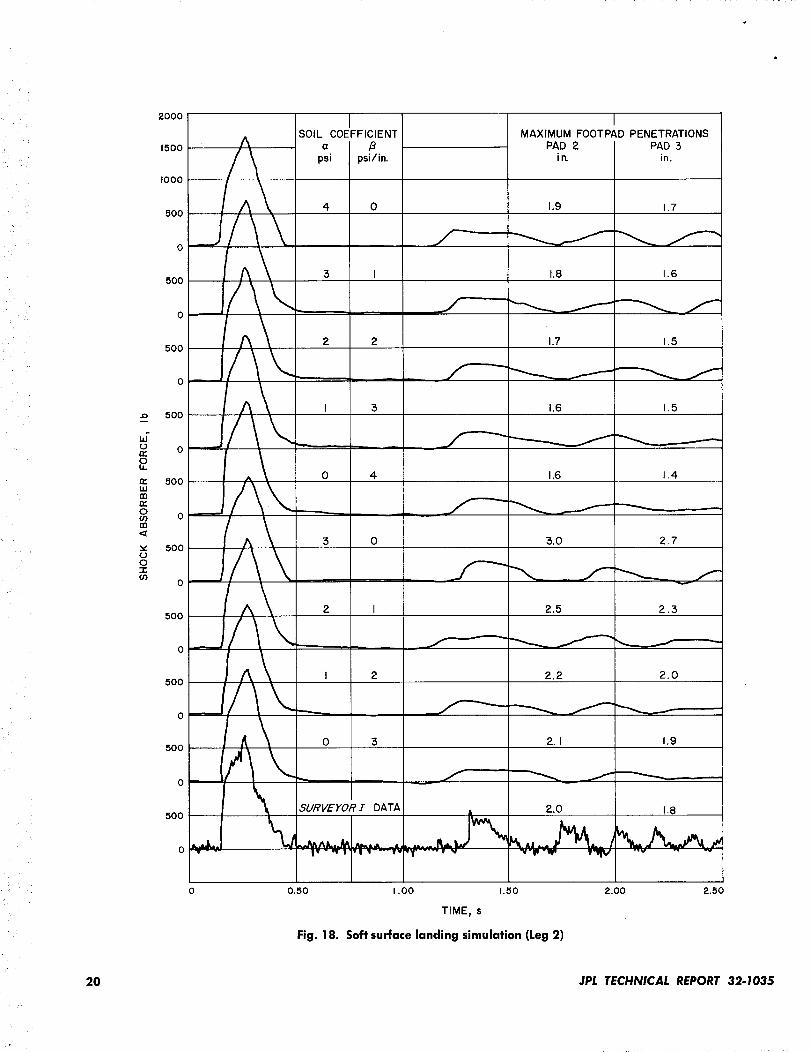
The landing system geometry and the characteristics
of the shock absorbers, the footpads, and the body blocks
are described in detail in the Appendix.
In formulating the equations of motion, the following
degrees of freedom are considered: 3 translations and
3 rotations of the main body, the 3 angular positions of
the individual legs with respect to the main body, and the
3 angular positions of the individual footpads with re-
spect to the legs. The external forces and moments acting
on the system are considered to arise from the ground
reaction and friction forces, and from gravity.
The above formulation leads to 12 second-order differ-
ential equations. The initial solution of these equations
establishes a new geometrical configuration of the ve-
hicle which, in turn, determines new forcing functions
for the next integration step.
C. Integration Routine
The integration routine used in solving the differential
equations of motion is a variable interval, error checking,
fourth-order Runge-Kutta integration procedure with abuilt-in correction for the estimated fifth-order trunca-
tion error.
Using this method, the program selects an initial inte-
gration interval and performs three integrations, onceover the entire interval and twice over two half intervals.
By comparing the difference of the two results with a
pre-selected allowable truncation error, the time interval
is either halved and the process repeated (in case the
allowable error was exceeded), or the consecutive inte-
gration time interval is increased in proportion to the
ratio of allowable error to incurred error (in case the
incurred error was below the allowable one).
Not only does this method control the incurred trunca-
tion error, but it also allows the integration time interval
to be opened up at times when the forcing functions are
varying smoothly, thus minimizing computation time.
JPL TECHNICAL REPORT 32-1035
L
D. Program Options
In addition to a standard output, the purpose of which
is to establish the stability or instability of the vehicle,
several other optional outputs are available. These
options provide complete time histories of spacecraft
motion, landing loads acting on the landing gear and the
main structure, "and a detailed breakdown of dissipated
energies.
A further option was implemented to aid in the inter-
pretation of lunar data. This option accepts in addition
to the standard input (spacecraft geometry, inertial prop-
erties, and initial conditions of the impact) the touch-
down times of the three footpads. The program will then,
utilizing these times, calculate the effective slope on
which the spacecraft landed and the vehicle orientation
with respect to this slope at the time of touchdown. This
information can then be used, in connection with telem-
etry data, to attempt a complete analytical simulation of
the actual lunar landing.
E. Modification for Non-Rigid Surface Landings
In order to provide some capability in handling non-
rigid surface landings, a modified version of the landing
program was devised. In this modified program, the foot-
pads have been removed, the body blocks are noncrush-
able, and the ground reaction forces (F_) and friction
forces (F_,) acting on the footpad pivot points and on the
body block face plates are functions of certain soil con-
stants (C1... Cs), vertical penetration into the soil (x),
vertical penetration velocity (i), horizontal displacement
(y), and sliding velocity (_) as expressed in the following
two equations:
Fv = C1 "1"Czx "1" Caic2
Fh = C4x(t _ + C+F_ + Ctx
In the vertical force equation, C_ represents the static
surface resistance of the top surface layer, while C2 indi-cates the linear increase of this resistance with vertical
penetration, and C3 is to account for any increases in the
vertical ground force due to dynamic effects during foot-
pad impacting. In the horizontal force equation, the term
associated with Ca can be recognized as representing a
conventional surface friction force, while the Cs and C+
terms are designed to account for static and dynamic
effects, respectively, resulting from horizontal motions of
the footpad while penetrating vertically into the surfacematerial.
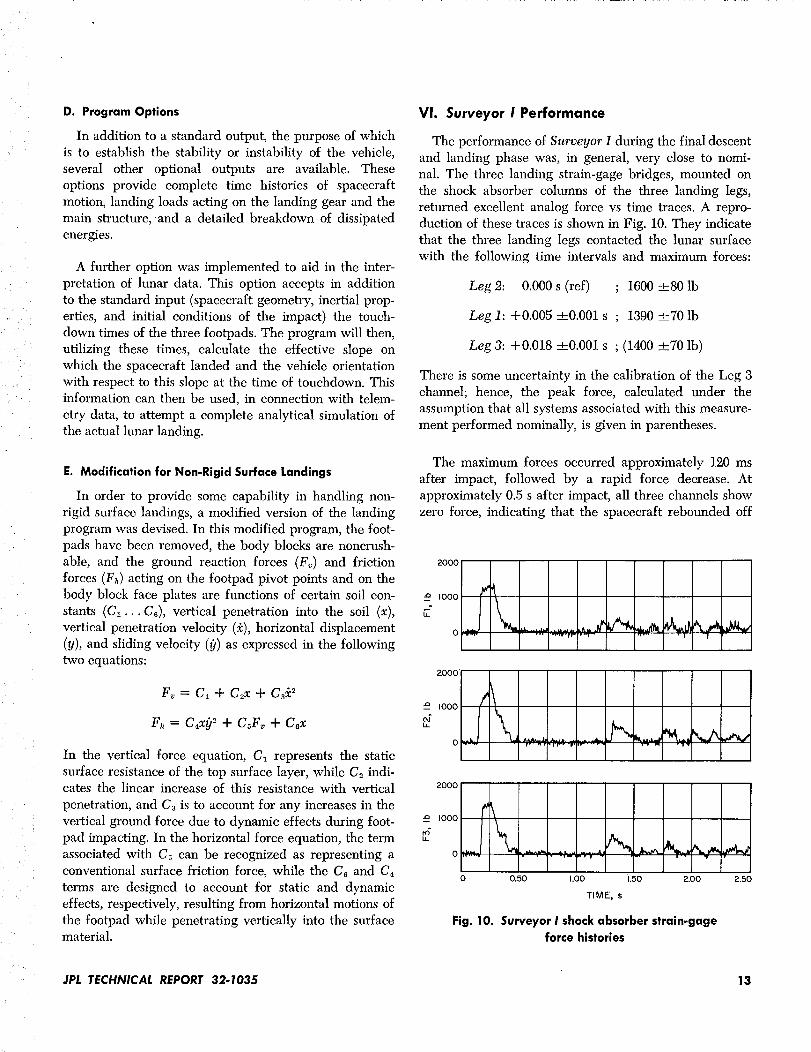
VI. Surveyor I Performance
The performance of Surveyor I during the final descent
and landing phase was, in general, very close to nomi-
nal. The three landing strain-gage bridges, mounted on
the shock absorber columns of the three landing legs,
returned excellent analog force vs time traces. A repro-
duction of these traces is shown in Fig. 10. They indicate
that the three landing legs contacted the lunar surface
with the following time intervals and maximum forces:
Leg 2: 0.000 s (ref) ; 1600 ±80 lb
Leg 1:-t-0.005 ___0.001 s ; 1390 ±70 lb
Leg 3:-t-0.018 ±0.001 s ; (1400 ±70 lb)
There is some uncertainty in the calibration of the Leg 3
channel; hence, the peak force, calculated under the
assumption that all systems associated with this measure-
ment performed nominally, is given in parentheses.
The maximum forces occurred approximately 120 ms
after impact, followed by a rapid force decrease. At
approximately 0.5 s after impact, all three channels show
zero force, indicating that the spacecraft rebounded off
2000
.o I000 _¢'
,'7
0q .... I "] "
2000
+_ ?- n .it +. I" • - ,-+ m "'I"
LLJ. I000
OF- I ]- I ' "1" r I0 0.50 1.00 1,50 2.00 2.50
TIME, s
Fig. 10. Surveyor I shock absorber strain-gageforce histories
JPL TECHNICAL REPORT 32-1035 13
60 _ qTOUCHDOWN
o I II50 _ _
I
,o !Iv _ /--NOMINAL I
30 I q _-'_,-,_.jl(" PERFORMANCE :
_ARE FIT I--// 0"_( _L
,o i
IO-ff/s MARK I I 13-It MARK
-,o _ I I _26 ;=8 30 32 34 36
GMT, 153:06:17:s
Fig. 11. Surveyor I RADVS range data
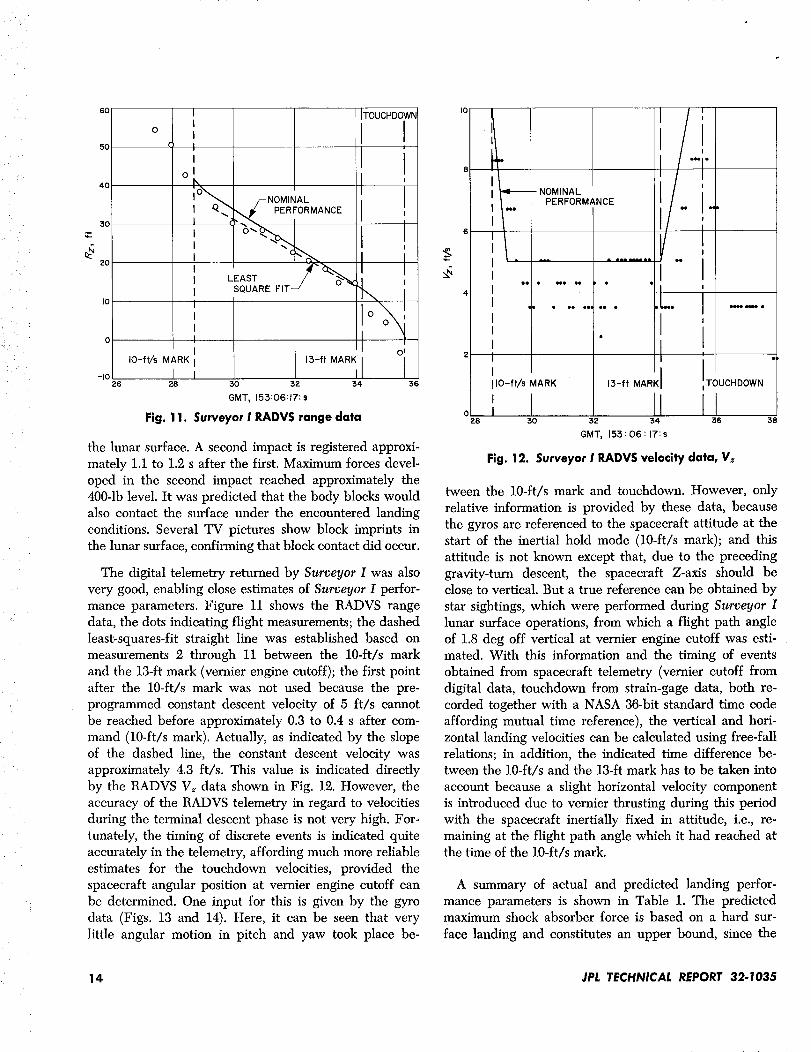
the lunar surface. A second impact is registered approxi-
mately 1.1 to 1.2 s after the first. Maximum forces devel-
oped in the second impact reached approximately the
400-1b level. It was predicted that the body blocks would
also contact the surface under the encountered landing
conditions. Several TV pictures show block imprints in
the lunar surface, confirming that block contact did occur.
The digital telemetry returned by Surveyor I was also
very good, enabling close estimates of Surveyor I perfor-
mance parameters. Figure 11 shows the RADVS range
data, the dots indicating flight measurements; the dashed
least-squares-fit straight line was established based on
measurements 2 through 11 between the 10-ft/s mark
and the 13-ft mark (vernier engine cutoff); the first point
after the 10-ft/s mark was not used because the pre-
programmed constant descent velocity of 5 ft/s cannot
be reached before approximately 0.3 to 0.4 s after com-
mand (10-ft/s mark). Actually, as indicated by the slope
of the dashed line, the constant descent velocity was
approximately 4.3 ft/s. This value is indicated directly
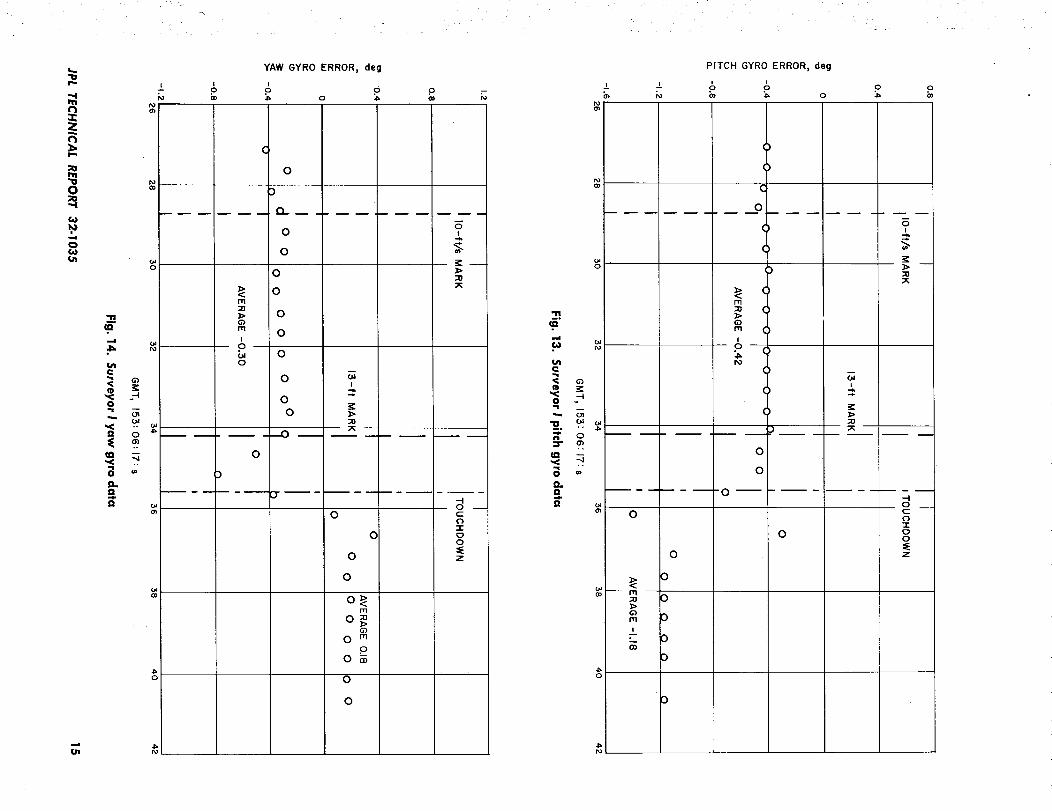
by the RADVS V_ data shown in Fig. 12. However, the
accuracy of the RADVS telemetry in regard to velocities
during the terminal descent phase is not very high. For-
tunately, the timing of discrete events is indicated quite
accurately in the telemetry, affording much more reliable
estimates for the touchdown velocities, provided the
spacecraft angular position at vernier engine cutoff can
be determined. One input for this is given by the gyro
data (Figs. 13 and 14). Here, it can be seen that very
little angular motion in pitch and yaw took place be-
IO
6
4 i ""IIII
Ii IO-ft/s MARK
o28 30
- NOMINALPERFORMANCE
• •• lel_ ee •
13-ft MAR
I
32 34
GMT, 155:06: 17:s
TOUCHDOWN
__J36 38
Fig. 12. Surveyor I RADVS velocity data, Vz
tween the 10-ft/s mark and touchdown. However, only
relative information is provided by these data, because
the gyros are referenced to the spacecraft attitude at the
start of the inertial hold mode (10-ft/s mark); and this
attitude is not known except that, due to the preceding
gravity-turn descent, the spacecraft Z-axis should be
close to vertical. But a true reference can be obtained by
star sightings, which were performed during Surveyor I
lunar surface operations, from which a flight path angle
of 1.8 deg off vertical at vernier engine cutoff was esti-
mated. With this information and the timing of events
obtained from spacecraft telemetry (vernier cutoff from
digital data, touchdown from strain-gage data, both re-
corded together with a NASA 36-bit standard time code
affording mutual time reference), the vertical and hori-
zontal landing velocities can be calculated using free-fall
relations; in addition, the indicated time difference be-tween the 10-ft/s and the 13-ft mark has to be taken into
account because a slight horizontal velocity component
is introduced due to vernier thrusting during this period
with the spacecraft inertially fixed in attitude, i.e., re-
maining at the flight path angle which it had reached atthe time of the 10-ft/s mark.
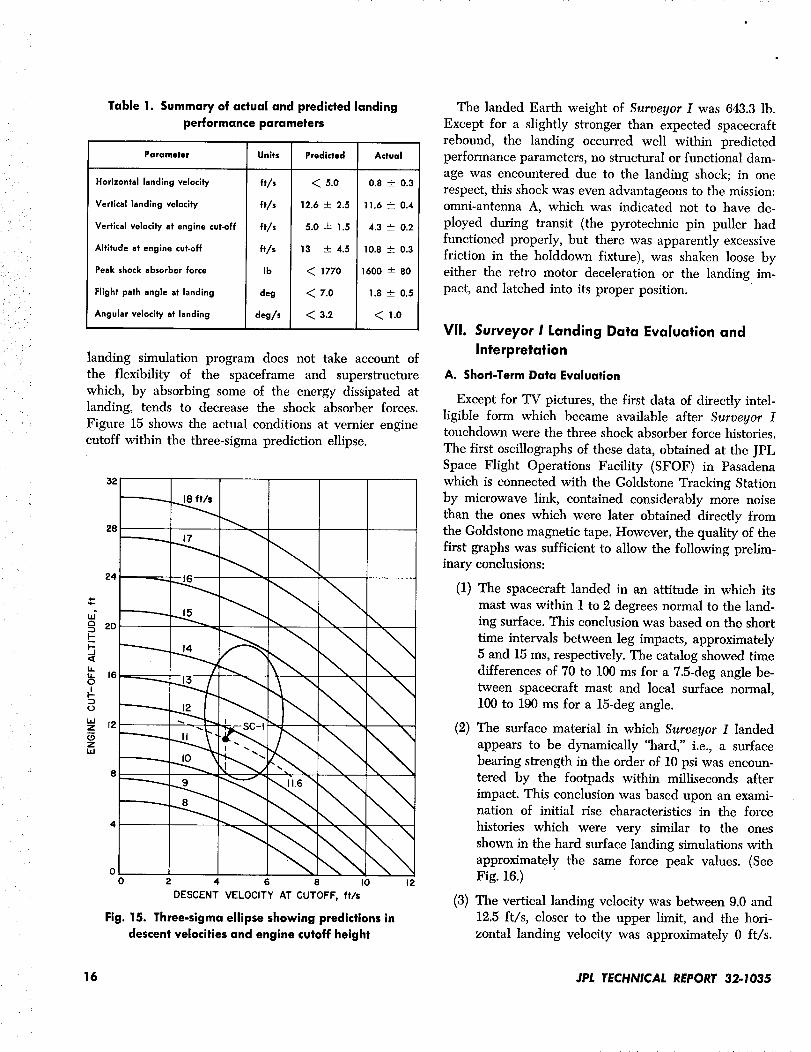
A summary of actual and predicted landing perfor-
mance parameters is shown in Table 1. The predictedmaximum shock absorber force is based on a hard sur-
face landing and constitutes an upper bound, since the
14 JPL TECHNICAL REPORT 32.1035
m
:Z:Z
"U
O
"1
O
¢D
o
D
=E(D
BD,.
o
t.e
- &
YAW GYRO ERROR, deg
P
O
)
0
0
0
_ om
_ 0
m 0
_ 00
0
00
0
--t
0
0
0
0
o_m
o_0 m
P0
0
0
0CZ0
-rO0
=EZ
o
=I"
BD.
9,,m,
G')
0.I
0
O_
PITCH GYRO ERROR, deg
;_ _o :_ o
C
O
O
O
b m m
G)m OI
0
0
<_m
rll
¢,,
C
C
)
_g
m m L')
0
0
-0
0
0
--I0C
"T
0
Z
_i ¸2
Table 1. Summary of actual and predicted landing
performance parameters
Parameter Units
Horizontal landing velocity ft/s
Vertical landing velocity ft/s
Vertical velocity at engine cut-off ft/s
Altitude at engine cut-off ft/s
Peak shock absorber force Ib
Flight path angle at landing deg
Angular velocity at landing deg/s
Predicted Actual
5.0 O.8 ± 0.3
12.6 ± 2.5 11.6 ± 0.4
5.0 -- 1.5 4.3 ± 0.2
13 _ 4.5 10.8 ± 0.3
1770 1600 ± 80
7.0 1.8 ± 0.5
3.2 _ 1.0
landing simulation program does not take account of
the flexibility of the spaceframe and superstructure
which, by absorbing some of the energy dissipated atlanding, tends to decrease the shock absorber forces.
Figure 15 shows the actual conditions at vernier engine
cutoff within the three-sigma prediction ellipse.
32
2e
20 \
4
00 2 4 6 8 I0 12
DESCENT VELOCITY AT CUTOFF, ft/s
Fig. 15. Three-sigma ellipse showing predictions in
descent velocities and engine cutoff height
The landed Earth weight of Surveyor I was 643.3 lb.
Except for a slightly stronger than expected spacecraft
rebound, the landing occurred well within predicted
performance parameters, no structural or functional dam-
age was encountered due to the landing shock; in one
respect, this shock was even advantageous to the mission:
omni-antenna A, which was indicated not to have de-
ployed during transit (the pyrotechnic pin puller had
functioned properly, but there was apparently excessive
friction in the holddown fixture), was shaken loose by
either the retro motor deceleration or the landing im-
pact, and latched into its proper position.
VII. Surveyor I Landing Data Evaluation and
Interpretation
A. Short-Term Data Evaluation
Except for TV pictures, the first data of directly intel-
ligible form which became available after Surveyor Itouchdown were the three shock absorber force histories.
The first oscillographs of these data, obtained at the JPL
Space Flight Operations Facility (SFOF) in Pasadena
which is connected with the Goldstone Tracking Station
by microwave link, contained considerably more noise
than the ones which were later obtained directly from
the Goldstone magnetic tape. However, the quality of the
first graphs was sufficient to allow the following prelim-inary conclusions:
(1) The spacecraft landed in an attitude in which its
mast was within 1 to 2 degrees normal to the land-
ing surface. This conclusion was based on the short
time intervals between leg impacts, approximately
5 and 15 ms, respectively. The catalog showed time
differences of 70 to 100 ms for a 7.5-deg angle be-
tween spacecraft mast and local surface normal,
100 to 190 ms for a 15-deg angle.
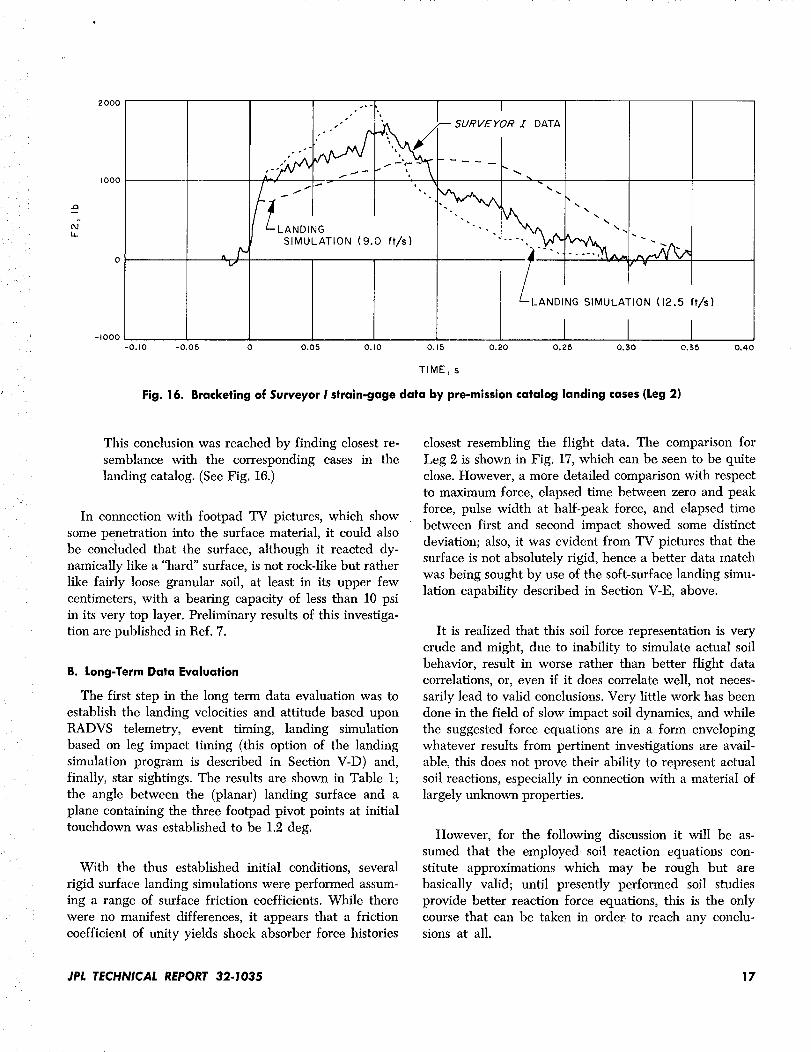
(2) The surface material in which Surveyor I landed
appears to be dynamically 'qaard," i.e., a surface
bearing strength in the order of 10 psi was encoun-
tered by the footpads within milliseconds after
impact. This conclusion was based upon an exami-nation of initial rise characteristics in the force
histories which were very similar to the ones
shown in the hard surface landing simulations with
approximately the same force peak values. (SeeFig. 16.)
(3) The vertical landing velocity was between 9.0 and
12.5 ft/s, closer to the upper limit, and the hori-
zontal landing velocity was approximately 0 ft/s.
16 JPL TECHNICAL REPORT 32-1035
r
r_
ta.
2000
I000
-I000
-0.I0 -0,05
/i: -NDING
SIMULATION
I
_ SURVEYOR I DATA
-...
LANDI!GS,MULAT,ON(I2.5
(9.0 ft/s)
0.05 0. I0 0.15 0.20 0.25 0.30 0,35 0.40
TIME, s
Fig. 16. Bracketing of Surveyor I strain-gage data by pre-mission catalog landing cases (Leg 2)
This conclusion was reached by finding closest re-
semblance with the corresponding cases in the
landing catalog. (See Fig. 16.)
In connection with footpad TV pictures, which show
some penetration into the surface material, it could also
be concluded that the surface, although it reacted dy-
namically like a 'qmrd" surface, is not rock-like but rather
like fairly loose granular soil, at least in its upper few
centimeters, with a bearing capacity o£ less than 10 psi
in its very top layer. Preliminary results of this investiga-
tion are published in Ref. 7.
B. Long-Term Data Evaluation
The first step in the long term data evaluation was to
establish the landing velocities and attitude based upon
RADVS telemetry, event timing, landing simulation
based on leg impact timing (this option of the landing
simulation program is described in Section V-D) and,
finally, star sightings. The results are shown in Table 1;
the angle between the (planar) landing surface and a
plane containing the three footpad pivot points at initial
touchdown was established to be 1.2 deg.
With the thus established initial conditions, several
rigid surface landing simulations were performed assum-
ing a range of surface friction coefficients. While there
were no manifest differences, it appears that a friction
coefficient o£ unity yields shock absorber force histories
closest resembling the flight data. The comparison for
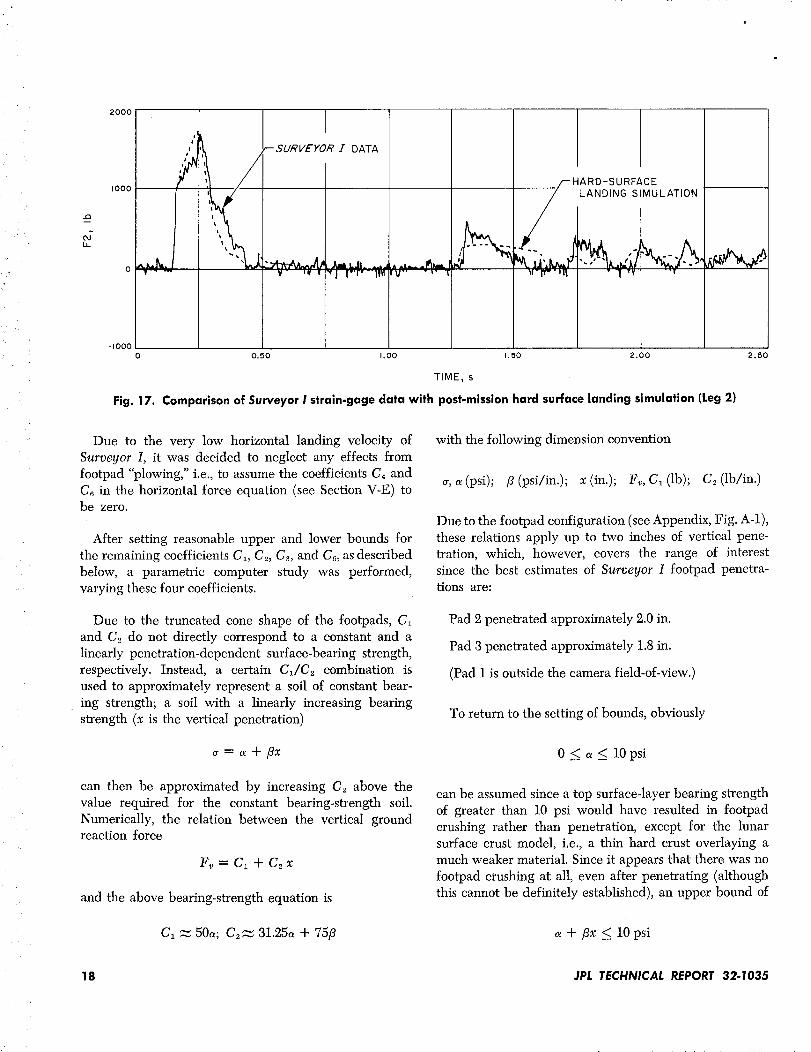
Leg 2 is shown in Fig. 17, which can be seen to be quite
close. However, a more detailed comparison with respect
to maximum force, elapsed time between zero and peak
force, pulse width at half-peak force, and elapsed time
between first and second impact showed some distinct
deviation; also, it was evident from TV pictures that the
surface is not absolutely rigid, hence a better data match
was being sought by use o£ the soft-surface landing simu-
lation capability described in Section V-E, above.
It is realized that this soil force representation is very
crude and might, due to inability to simulate actual soil
behavior, result in worse rather than better flight data
correlations, or, even ff it does correlate well, not neces-
sarily lead to valid conclusions. Very little work has been
done in the field of slow impact soil dynamics, and while
the suggested force equations are in a form enveloping
whatever results from pertinent investigations are avail-
able, this does not prove their ability to represent actual
soil reactions, especially in connection with a material of
largely unknown properties.
However, for the following discussion it will be as-
sumed that the employed soil reaction equations con-
stitute approximations which may be rough but are
basically valid; until presently performed soil studies
provide better reaction force equations, this is the only
course that can be taken in order to reach any conclu-sions at all.
JPL TECHNICAL REPORT 32-1035 17
la.
2000
1000
0 ¸
-I000
i
--SURVEYOR I DATA
JLI LJI=.... .J"_J wr'-qlg IV'" "'_' ]
HLARD; ,SNUR_f_EULATION
u--_'- ql • -|"r ,v
0 0.50 1.00 1.50 2.00 2.50
TIME, s
Fig. 17. Comparison of Surveyor I strain-gage data with post-mission hard surface landing simulation (Leg 2)
Due to the very low horizontal landing velocity of
Surveyor I, it was decided to neglect any effects from
footpad "plowing," i.e., to assume the coefficients C4 and
C6 in the horizontal force equation (see Section V-E) tobe zero.
After setting reasonable upper and lower bounds for
the remaining coefficients C1, C2, C3, and C5, as described
below, a parametric computer study was performed,
varying these four coefficients.
Due to the truncated cone shape of the footpads, C1
and C2 do not directly correspond to a constant and a
linearly penetration-dependent surface-bearing strength,
respectively. Instead, a certain CJC_ combination is
used to approximately represent a soil of constant bear-
ing strength; a soil with a linearly increasing bearing
strength (x is the vertical penetration)
_=,+/3x
can then be approximated by increasing C2 above the
value required for the constant bearing-strength soil.
Numerically, the relation between the vertical groundreaction force
Fv = C1 + C_ x
and the above bearing-strength equation is
C1 _ 50a; C_ 31.25a + 75fl
with the following dimension convention
a,, (psi); /3 (psi/in.); x (in.); Fv, Cl (lb); C2 (lb/in.)
Due to the footpad configuration (see Appendix, Fig. A-l),these relations apply up to two inches of vertical pene-
tration, which, however, covers the range of interest
since the best estimates of Surveyor I footpad penetra-tions are:
Pad 2 penetrated approximately 2.0 in.
Pad 3 penetrated approximately 1.8 in.
(Pad i is outside the camera field-of-view.)
To return to the setting of bounds, obviously
0 < . < 10 psi
can be assumed since a top surface-layer bearing strength
of greater than 10 psi would have resulted in footpad
crushing rather than penetration, except for the lunar
surface crust model, i.e., a thin hard crust overlaying a
much weaker material. Since it appears that there was no
footpad crushing at all, even after penetrating (although
this cannot be definitely established), an upper bound of
+/3x < 10 psi
18 JPL TECHNICAL REPORT 32-1035
i
/
seems reasonable, especially since some increase in force
is to be expected from the dynamic term Cjc 2. This,
again, excludes the crust model or any other material
with a negative fl, i.e., a decrease in bearing strength with
progressing penetration. While such model cannot be
ruled out definitely, there is nothing in the Surveyor I
data which would support it, and it was not considered
in this investigation.
To bracket the dynamic factor Ca, a rough estimate
based on the apparent volume of displaced material,
the throw-out pattern, and estimated timing (using a
conservative density value of 3 g/cm a) resulted in an
upper value of approximately 2.5 lb-s2/ft _. Finally, the
friction coefficient Ca was estimated to lie between ap-
proximately 0.5 and 1.5.
Several trends became apparent in the initial stage of
the computer study which consisted of approximately
80 runs. First, while the output in form of shock-absorber
force time plots was somewhat sensitive to changes in
and p values, footpad penetration values appear to be
a more critical indicator. Neither one, however, is very
sensitive to changes in friction as well as the above-
mentioned dynamic factor C3 within their established
bounds. While the latter resulted in high initial normal
forces on the footpads, as is to be expected, these forces
are of very short duration and seem not to influence the
shock absorber force histories or the penetration values
in a significant way.
As a result, it was decided to neglect this ground in-
ertia effect, i.e., assume Ca = 0, and to continue the
investigation with a friction coefficient of 0.7, which ap-
peared to be most reasonable, although, as mentioned,
changes in this value also resulted in almost unnotice-
able changes in the program output.
Hence, it appears that the only variables of importance
are a, the top layer static bearing strength, and /3, the
linear increase in static bearing strength with vertical
penetration.
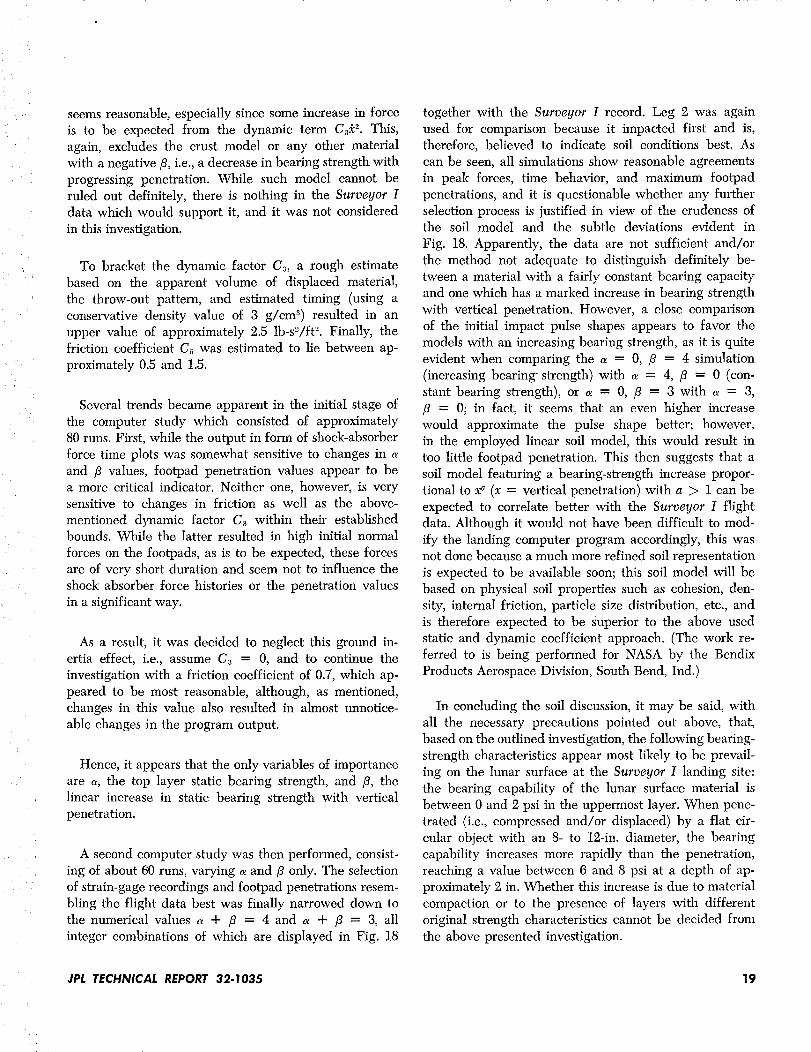
A second computer study was then performed, consist-
ing of about 60 runs, varying, and/3 only. The selection
of strain-gage recordings and footpad penetrations resem-
bling the flight data best was finally narrowed down to
the numerical values , + /3 = 4 and o_ + /3 = 3, all
integer combinations of which are displayed in Fig. 18
together with the Surveyor I record. Leg 2 was again
used for comparison because it impacted first and is,
therefore, believed to indicate soil conditions best. As
can be seen, all simulations show reasonable agreements
in peak forces, time behavior, and maximum footpad
penetrations, and it is questionable whether any further
selection process is justified in view of the crudeness ofthe soil model and the subtle deviations evident in
Fig. 18. Apparently, the data are not sufficient and/or
the method not adequate to distinguish definitely be-
tween a material with a fairly constant bearing capacity
and one which has a marked increase in bearing strength
with vertical penetration. However, a close comparison
of the initial impact pulse shapes appears to favor the
models with an increasing bearing strength, as it is quite
evident when comparing the _ = 0, /3 = 4 simulation
(increasing bearing" strength) with _ = 4, /3 = 0 (con-
stant bearing strength), or _ = 0, /3 = 3 with _ = 3,
/3 = 0; in fact, it seems that an even higher increase
would approximate the pulse shape better; however,
in the employed linear soil model, this would result in
too little footpad penetration. This then suggests that a
soil model featuring a bearing-strength increase propor-
tional to x_ (x = vertical penetration) with a > 1 can be
expected to correlate better with the Surveyor I flight
data. Although it would not have been difficult to mod-
ify the landing computer program accordingly, this was
not done because a much more refined soil representation
is expected to be available soon; this soil model will be
based on physical soil properties such as cohesion, den-
sity, internal friction, particle size distribution, etc., and
is therefore expected to be superior to the above used
static and dynamic coefficient approach. (The work re-
ferred to is being performed for NASA by the Bendix
Products Aerospace Division, South Bend, Ind.)
In concluding the soil discussion, it may be said, with
all the necessary precautions pointed out above, that,
based on the outlined investigation, the following bearing-
strength characteristics appear most likely to be prevail-
ing on the lunar surface at the Surveyor I landing site:
the bearing capability of the lunar surface material is
between 0 and 2 psi in the uppermost layer. When pene-
trated (i.e., compressed and/or displaced) by a flat cir-
cular object with an 8- to 12-in. diameter, the bearing
capability increases more rapidly than the penctTation,
reaching a value between 6 and 8 psi at a depth of ap-
proximately 2 in. Whether this increase is due to material
compaction or to the presence of layers with different
original strength characteristics cannot be decided from
the above presented investigation.
JPL TECHNICAL REPORT 32-1035 19
uo
t)n-OIt
_EI.I1:13n-O(/)_D
00-r(/)
2ooo ISOIL COEFFICIENT
15oo (_ i
/ psi psi/in.
fIooo
500 _ 4 0
o\\ 3 I
500
O- / _ _
t\ 2 2
5o0
o / \\ I 3
500 / \0 -- / _
IMAXIMUM FOOTPAD PENETRATIONS
PAD 2 PAD 3in. in.
1.9 1.7
1.8 1.6
1.7
1.6
1.6 1.4
2.7
500
0
500
0
500
0
500
0
500
0
500
A.._L.0 -'11" -
0 4
o/:5.0
..f'-"" __ f__ fv
2 I 2.5 2.3
._1 2 2,2 2.0
0 3 2.1 1.9
SLIRVEYORI DATA .__ _ 2.0 1.8
iw-,_rv wl 1-_vv, T .... v 'v -v-lv-wv iP-illV -,v -
0 0.50 1.00 1.50 2.00 2.50
TIME, S
Fig. 18. Soft surface landing simulation (Leg 2)
20 JPL TECHNICAL REPORT32-1035
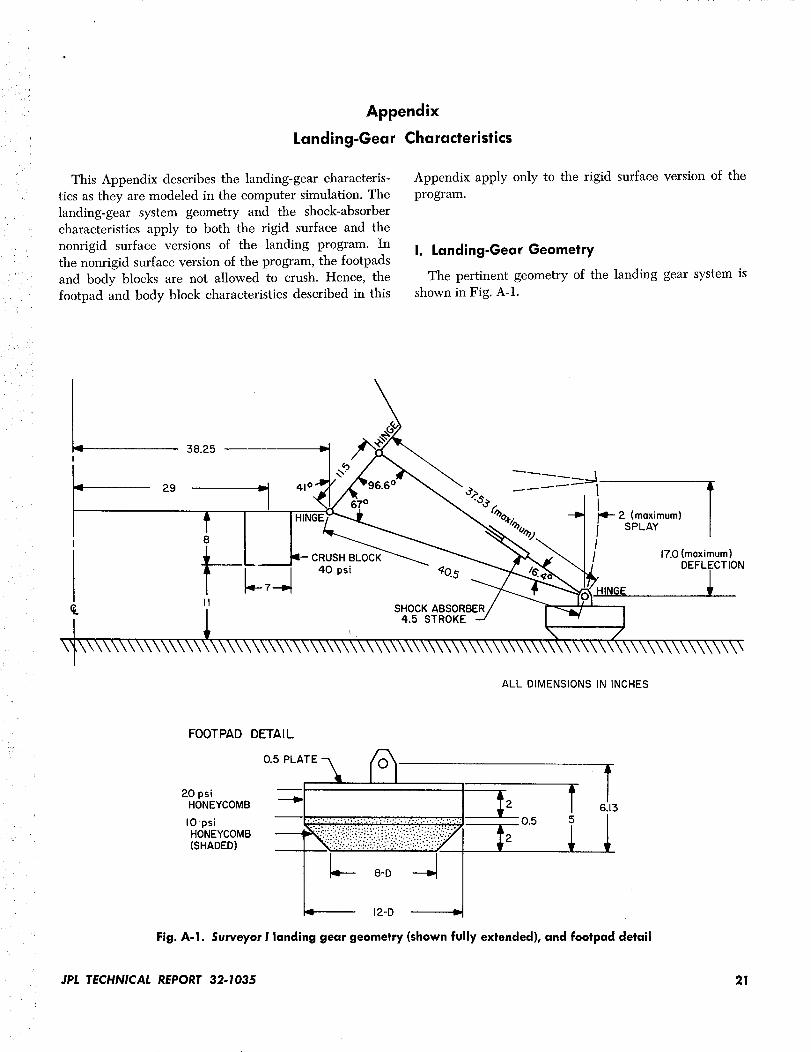
i Appendix
Landing-Gear Characteristics
This Appendix describes the landing-gear characteris-
tics as they are modeled in the computer simulation. The
landing-gear system geometry and the shock-absorber
characteristics apply to both the rigid surface and the
nonrigid surface versions of the landing program. In
the nonrigid surface version of the program, the footpads
and body blocks are not allowed to crush. Hence, the
footpad and body block characteristics described in this
Appendix apply only to the rigid surface version of the
program.
I. Landing-Gear Geometry
The pertinent geometry of the landing gear system is
shown in Fig. A-1.
38.25 I_
/ _ I HINGE/_'_I_ _ o4.;_ -_ _ 2 (maximum) // _ I I _ _ _'_."% /I SPLAY /
' I___J, __'_ / I7.0 (maximum)-- 40 psi _" _0.,_ __-_o "_b.. DEFLECTION
_. 111 SHOCK ABSORBER/ _'_ _'Id/T' I
ALL DIMENSIONS IN INCHES
FOOTPAD DETAIL
20 psiHONEYCOMB
IOpsiHONEYCOMB --(SHADED)
2
t2
;- 8o-.I!12-D
0.5
6.13
Fig. A-I. Surveyor I landing gear geometry (shown fully extended), and footpad detail
JPL TECHNICAL REPORT 32-1035 21
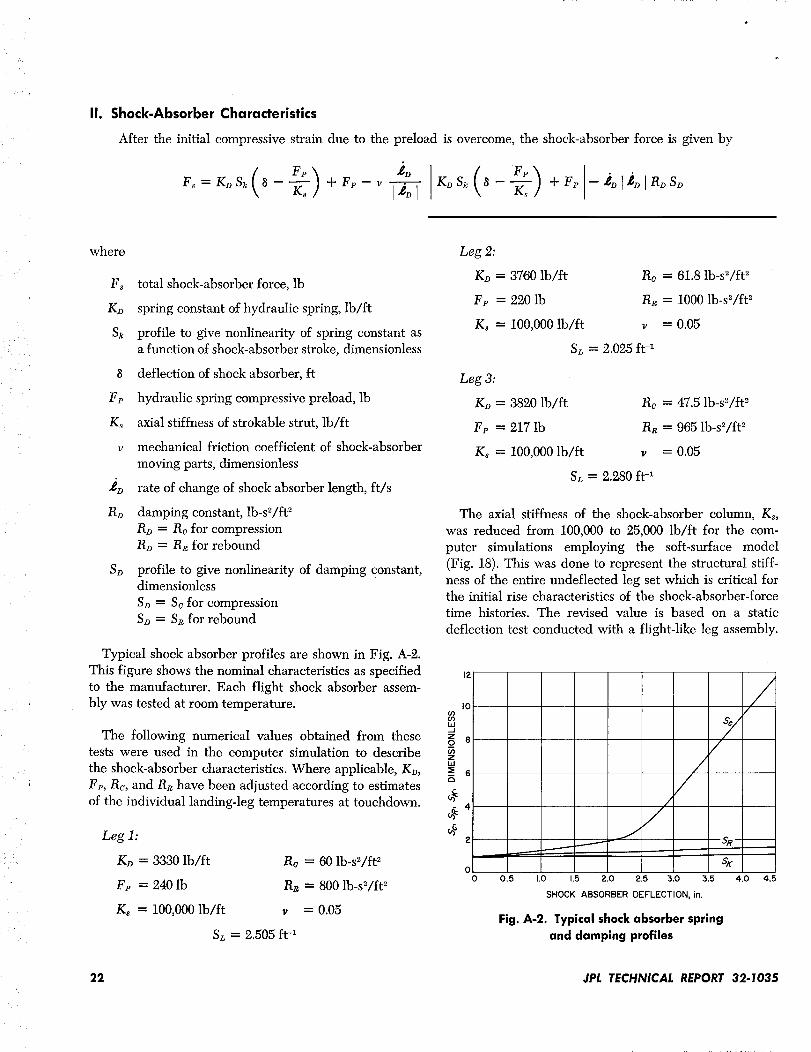
II. Shock-Absorber Characteristics
After the initial compressive strain due to the preload is overcome, the shock-absorber force is given by
Fs= os +e,-v I Kos +F - or olRoso
where
Fs total shock-absorber force, lb
KD spring constant of hydraulic spring, lb/ft
Sk profile to give nonlinearity of spring constant as
a function of shock-absorber stroke, dimensionless
8 deflection of shock absorber, ft
Fe hydraulic spring compressive preload, lb
Ks axial stiffness of strokable strut, lb/ft
v mechanical friction coefficient of shock-absorber
moving parts, dimensionless
_ rate of change of shock absorber length, ft/s
R_ damping constant, lb-s2/ft 2
R_ = Rc for compression
RD = NR for rebound
SD profile to give nonlinearity of damping constant,dimensionless
SD = Sc for compressionS_ = S_ for rebound
Typical shock absorber profiles are shown in Fig. A-2.
This figure shows the nominal characteristics as specified
to the manufacturer. Each flight shock absorber assem-
bly was tested at room temperature.
The following numerical values obtained from these
tests were used in the computer simulation to describe
the shock-absorber characteristics. Where applicable, Kg,
Fe, Re, and RR have been adjusted according to estimates
of the individual landing-leg temperatures at touchdown.
Leg 1:
K9 = 3330 lb/ft Ra = 60 lb-s2/ft 2
Fe = 240 lb Re = 800 lb-s_/ft 2
K8 = 100,000 lb/ft v = 0.05
SL = 2.505 ft -1
Leg 2:
K9 = 3760 lb/ft Ro = 61.8 Ib-s_/ft 2
Fe = 220 lb RR = 1000 lb-s2/ft 2
Ks = 100,000 lb/ft v = 0.05
SL = 2.025 ft -I
Leg 3:
K9 = 3820 lb/ft Ro = 47.5 lb-sZ/ft 2
Fe = 217 lb Re = 965 lb-s2/ft 2
Ks = 100,000 lb/ft v = 0.05
SL = 2.280 ft -1
The axial stiffness of the shock-absorber column, Ks,
was reduced from 100,000 to 25,000 lb/ft for the com-
puter simulations employing the soft-surface model
(Fig. 18). This was done to represent the structural stiff-
ness of the entire undeflected leg set which is critical forthe initial rise characteristics of the shock-absorber-force
time histories. The revised value is based on a static
deflection test conducted with a flight-like leg assembly.
{DO_Ld/
_go_ZI.d
12
I0
8
6
4
2
00
//
/
J
0.5 1.0 1.5 2.0 2.5 5.0 3.5
SHOCK ABSORBER DEFLECTION, in.
Fig. A-2. Typical shock absorber spring
and damping profiles
sn
&4.0
/
4.5
22 JPL TECHNICAL REPORT 32-1035
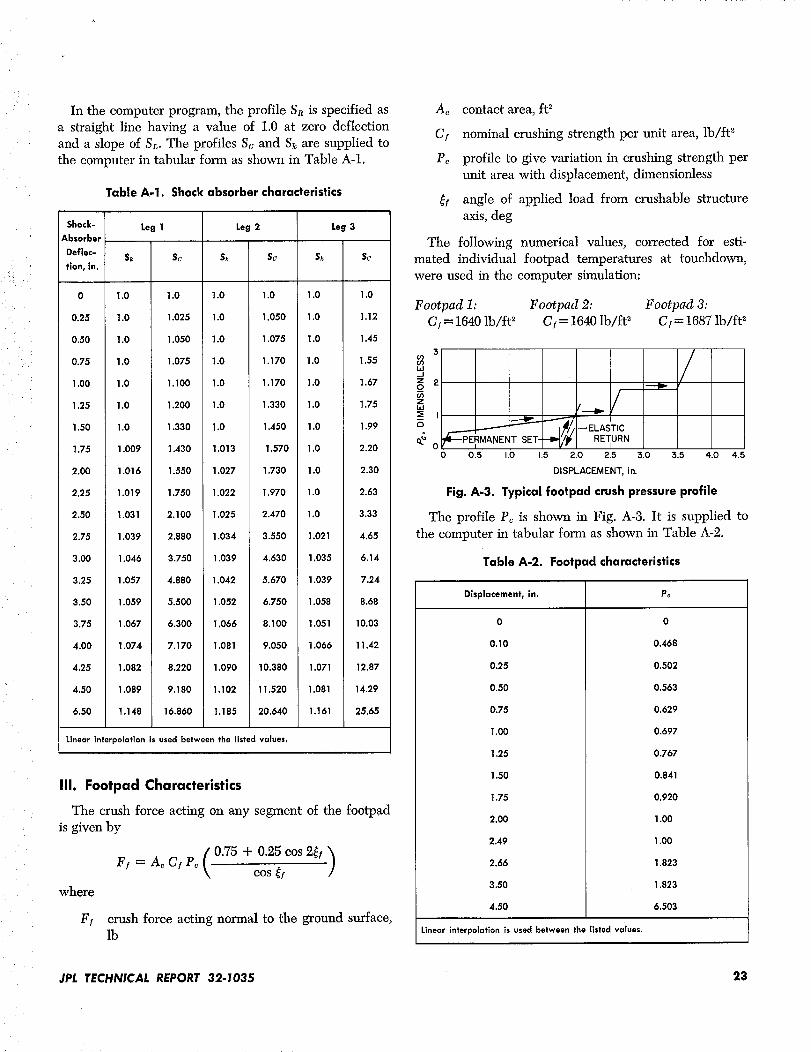
In the computer program, the profile Sg is specified as
a straight line having a value of 1.0 at zero deflection
and a slope of SL. The profiles So and S_ are supplied to
the computer in tabular form as shown in Table A-1.
Table A-1. Shock absorber characteristics
Shock- Leg 1 Leg 2 Leg 3Absorber
Deflec-Sk So 5_ So S_ Sc
tlon, in.
0 1.0 1.0 1.0 1.0 1.0 1.0
0.25 1.0 1.025 1.0 1.050 1.0 1.12
0.50 1.0 1.050 1.0 1.075 1.0 1.45
0.75 1.0 1.075 1.0 1.170 1.0 1.55
1.00 1.0 1.100 1.0 1.170 1.0 1.67
1.25 1.0 1.200 1.0 1.330 1.0 1.75
1.50 1.0 1.330 1.0 1.450 1.0 1.99
1.75 1.009 1.430 1.013 1.570 1.0 2.20
2.00 1.016 1.550 1.027 1.730 1.0 2.30
2.25 1.019 1.750 1.022 1.970 1.0 2.63
2.50 1.031 2.100 1.025 2.470 1.0 3.33
2.75 1.039 2.880 1.034 3.550 1.021 4.65
3.00 1.046 3.750 1.039 4.630 1.035 6.14
3.25 1.057 4.880 1.042 5.670 1.039 7.24
3.50 1.059 5.500 1.052 6.750 1.058 8.68
3.75 1.067 6.300 1.066 8.100 1.051 10.03
4.00 1.074 7.170 1.081 9.050 1.066 11.42
4.25 1.082 8.220 1.090 10.380 1.071 12.87
4.50 1.089 9.180 1.102 11.520 1.081 14.29
6.50 1.148 16.860 1.185 20.640 1.161 25.65
Linear interpolation is used between the listed values,
III. Footpad Characteristics
The crush force acting on any segment of the footpad
is given by
(0.75 + 0.25 cos 2_t )F r = A_ C r Pc ,cos if
where
Fr crush force acting normal to the ground surface,lb
Ac contact area, ft 2
Ct nominal crushing strength per unit area, lb/ft _
Pc profile to give variation in crushing strength per
unit area with displacement, dimensionless
_t angle of applied load from crushable structure
axis, deg
The following numerical values, corrected for esti-
mated individual footpad temperatures at touchdown,
were used in the computer simulation:
Footpad 1: Footpad 2: Footpad 3:
CI = 1640 lb/ft _ CI = 1640 lb/ft _ Cr = 1687 lb/ft _
//
--ELASTIC_EPERMANENT, , SET- RETURN
0 0.5 1.0 1.5 2.0 2.5 5.0 3.5 4.0 4.5
DISPLACEMENT, in.
Fig. A-3. Typical footpad crush pressure profile
The profile Pc is shown in Fig. A-3. It is supplied to
the computer in tabular form as shown in Table A-2.
Table A-2. Footpad characteristics
Displacement, in. Po
0
0.10
0.25
0.50
0.75
1.00
1.25
1.50
1.75
2.00
2.49
2.66
3.50
4.50
0
0.468
0.502
0.563
0.629
0.697
0.767
0.841
0.920
1.00
1.00
1.823
1.823
6.503
Linear interpolation is used between the listed values.
JPL TECHNICAL REPORT 32-1035 23
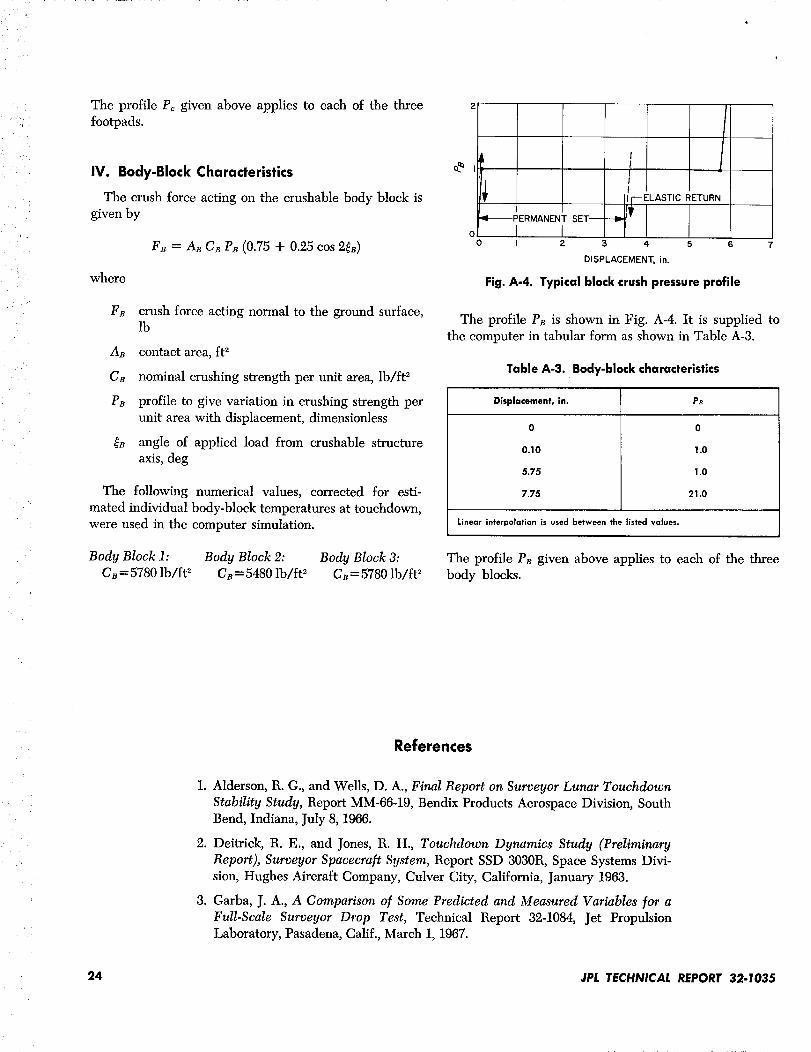
r,.
LI¸
The profile Pc given above applies to each of the three
footpads.
IV. Body-Block Characteristics
The crush force acting on the crushable body block is
given by
FB = A8 C_ PB (0.75 + 0.25 cos 2_8)
where
FB crush force acting normal to the ground surface,lb
AB contact area, ft 2
CB nominal crushing strength per unit area, lb/ft 2
Pn profile to give variation in crushing strength per
unit area with displacement, dimensionless
_ angle of applied load from crushable structure
axis, deg
The following numerical values, corrected for esti-
mated individual body-block temperatures at touchdown,
were used in the computer simulation.
Body Block 1: Body Block 2: Body Block 3:
CB = 5780 lb/ft 2 CB = 5480 lb/ft 2 CB = 5780 lb/ft 2
2
/IIIII
IF-ELASTIC RETURN
,,qu---PERMANENT SET-- ---m,,ii_,
I I/
0 I 2 4 5 6
DISPLACEMENT, in.
Fig. A-4. Typical block crush pressure profile
The profile P_ is shown in Fig. A-4. It is supplied to
the computer in tabular form as shown in Table A-3.
Table A-3. Body-block characteristics
Displacement, in. PB
0
0.10
5.75
7.75
0
1.0
1.0
21.0
Linear interpolation is used between the listed values.
The profile Pn given above applies to each of the three
body blocks.
References
1. Alderson, R. G., and Wells, D. A., Final Report on Surveyor Lunar Touchdown
Stability Study, Report MM-66-19, Bendix Products Aerospace Division, South
Bend, Indiana, July 8, 1966.
2. Deitrick, R. E., and Jones, R. H., Touchdown Dynamics Study (Preliminary
Report), Surveyor Spacecraft System, Report SSD 3030R, Space Systems Divi-
sion, Hughes Aircraft Company, Culver City, California, January 1963.
3. Garba, J. A., A Comparison of Some Predicted and Measured Variables for a
Full-Scale Surveyor Drop Test, Technical Report 32-1084, Jet PropulsionLaboratory, Pasadena, Calif., March 1, 1967.
24 JPL TECHNICAL REPORT 32-1035
• • h
. i[
:i ¸ " :;
References (contd)
4. Harter, R. J., and Switz, R. J., "Analytical and Experimental Techniques Used
to Establish Structural Design Loads for the Surveyor Spacecraft During
Lunar Landing," Shock and Vibration Bulletin No. 35, Naval Research Labora-
tory, Washington, D. C., January 1966.
5. Rindfleiseh, T., "Photometric Method for Lunar Topography," Photogram-
metric Engineering, March 1966.
6. Jaffe, L. D., Surveyor Project Lunar Scientific Model, Project Document 54,
Jet Propulsion Laboratory, Pasadena, Calif., April 1, 1966.
7. Christensen, E. M., et al., "Lunar Surface Mechanical Properties-Surveyor I,"
Journal of Geophysical Research, Vol. 72, No. 2, January 15, 1967.
JPL TECHNICAL REPORT 32-1035 25

r• p
I