a trend analysis of inland waterways freight, workboat and
TRANSCRIPT

1
SMS Report—Inland Waterways Freight, workboat and service craft October 2017
A trend analysis of Inland Waterways freight, workboat and service craft occurrences in the Port of London October 2017
Overview
There have been at total of 1979 reports submitted to the harbourmaster between 2010 and 2016. 336 (17%) of these reports involved freight, workboat or service craft.
2017 so far is showing a 72% increase in the total number of occurrences on last year. A closer look at 2017 is on the following pages.
Freight vessel occurrences did show a declining trend between 2010 and
2016, with 2016 being ↓ 41% compared to 2015.
A closer look at the top 6 categories 2010-2016
‘Breakdown’ is the biggest cause (30%) which seems to correspond to times that workboats are moving.
‘Contact’ is the biggest incident type (approx. 25%)
(‘Other’ consists of on-board medical incidents, external events)
Causes
Poor Communication & Planning accounts for around 30% of the incidents in 2017.
Passenger vessel movements at commuter times influences the number of wash complaints attributed to non-passenger vessels.
Near Miss Trend
Near Miss reports show an increasing trend since 2010. In 2016, there was a 2:1 ratio of near miss contacts to actual contact incidents. So far in 2017, there is a further 50% increase, which may indicate an improving reporting culture.
Definitions
Incident: All incidents, including
breakdowns which result in an
incident or near miss occurring.
Deficiency: Breakdowns which
did not lead to an incident or near
miss. For Commercial Shipping,
these are reported to the Maritime
& Coastguard Agency (MCA) if
they fail to comply with the
requirements of international
conventions (i.e. SOLAS,
MARPOL, STCW, etc.)
Near Miss: An instance of a
vessel or vessels narrowly
avoiding an Incident.
25%
up 72%
2
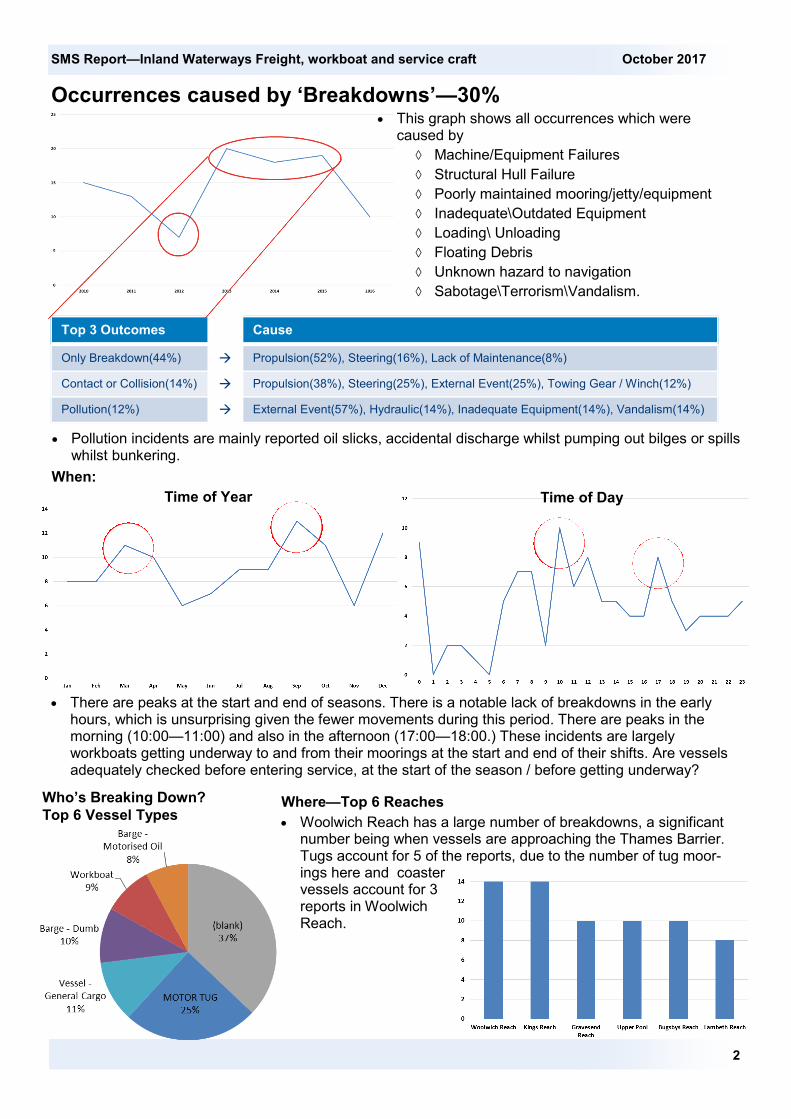
Occurrences caused by ‘Breakdowns’—30%
Pollution incidents are mainly reported oil slicks, accidental discharge whilst pumping out bilges or spills whilst bunkering.
Top 3 Outcomes Cause
Only Breakdown(44%) Propulsion(52%), Steering(16%), Lack of Maintenance(8%)
Contact or Collision(14%) Propulsion(38%), Steering(25%), External Event(25%), Towing Gear / Winch(12%)
Pollution(12%) External Event(57%), Hydraulic(14%), Inadequate Equipment(14%), Vandalism(14%)
This graph shows all occurrences which were caused by
Machine/Equipment Failures
Structural Hull Failure
Poorly maintained mooring/jetty/equipment
Inadequate\Outdated Equipment
Loading\ Unloading
Floating Debris
Unknown hazard to navigation
Sabotage\Terrorism\Vandalism.
When:
Time of Year Time of Day
There are peaks at the start and end of seasons. There is a notable lack of breakdowns in the early hours, which is unsurprising given the fewer movements during this period. There are peaks in the morning (10:00—11:00) and also in the afternoon (17:00—18:00.) These incidents are largely workboats getting underway to and from their moorings at the start and end of their shifts. Are vessels adequately checked before entering service, at the start of the season / before getting underway?
SMS Report—Inland Waterways Freight, workboat and service craft October 2017
Who’s Breaking Down?
Top 6 Vessel Types Where—Top 6 Reaches
Woolwich Reach has a large number of breakdowns, a significant number being when vessels are approaching the Thames Barrier. Tugs account for 5 of the reports, due to the number of tug moor-ings here and coaster vessels account for 3 reports in Woolwich Reach.

3
Contacts—25%
Incident and Near Misses labelled as ‘Contact’ make up 25% of the Inland occurrences between 2010 and 2016 Increase in Near Miss reports in 2016
could be indicative of an improving reporting culture—2017 follows in this trend.
Nearly 1/4 of all reports labelled as Contacts are in fact Near Misses, with the majority being caused by breakdowns.
This may be an indication that more contacts are now avoided than there has been previously.
Interestingly, most Contacts happen between 12:00 and 16:00, which has been identified as a peak in traffic density in central London by the Capacity Study.
Incidents Near Miss/Breakdown/Deficiency
at a pier or mooring(49%) engine failure near berth/mooring(60%)
with a buoy(26%) lost tow(10%)
with a bridge(17%) near bridge or Thames Barrier(20%)
with wall, causeway / Thames Barrier(9%)
Why:
Where:
Human Error is a predominant cause of contact incidents. These are misjudgements, as well as failure to lookout or follow a passage plan.
Breakdowns are the predominant cause of Near Misses (70%). Breakdowns are covered in more detail on page 5.
There is a high proportion of contact incidents and near misses in Kings Reach, which is unsurprising considering the traffic density.
75% of the incidents are contacts/near misses with bridges and 25% with a moored vessel.
One near miss was loss of propulsion near a bridge and the other was lifting operations over an open river.
The majority (60%) of incidents in Bugsbys Reach are breakdowns. There have been a number of construction projects loading in this reach
In Sea Reach, 40% of the incidents were contacts with buoys, 40% with piers/jetties and 20% with a moored/anchored vessel. Only 20% were down to breakdowns.
In Gravesend Reach, 60% of the incidents were contacts with beacons (1 at the groynes and 1 at the Port beacon at Newbridge Causeway), and 40% with a moored barge.
SMS Report—Inland Waterways Freight, workboat and service craft October 2017
4
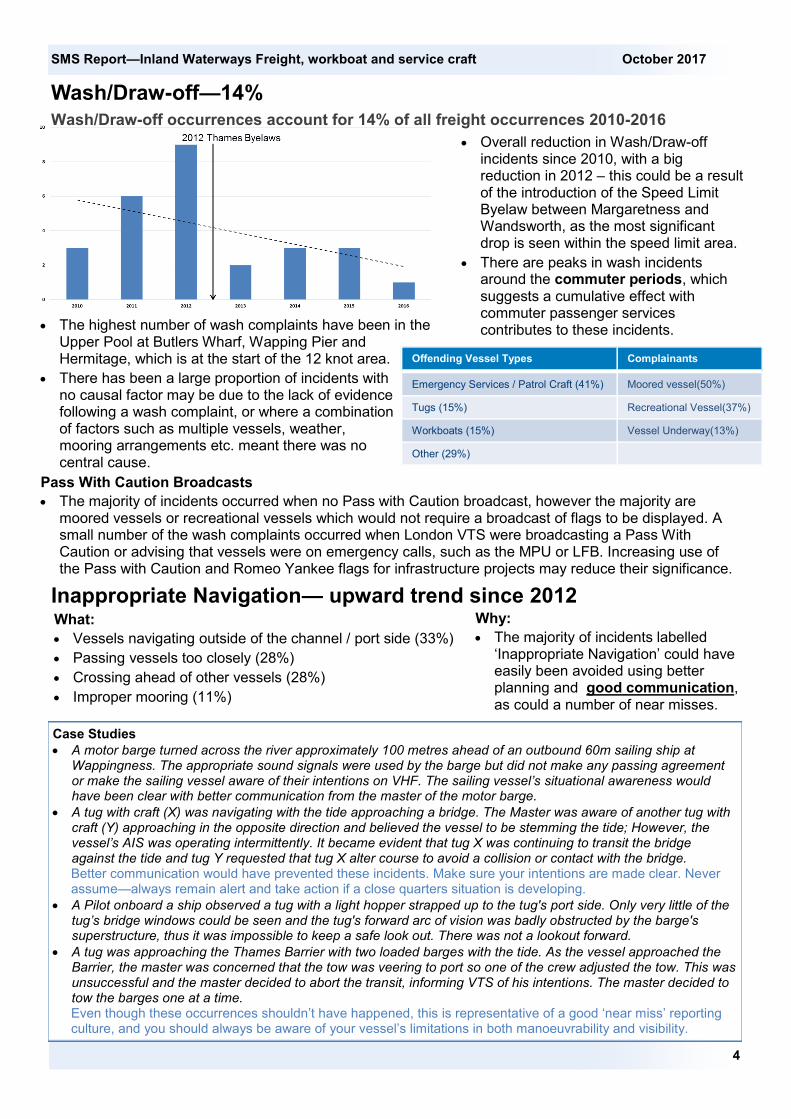
Wash/Draw-off—14%
Wash/Draw-off occurrences account for 14% of all freight occurrences 2010-2016
The highest number of wash complaints have been in the Upper Pool at Butlers Wharf, Wapping Pier and Hermitage, which is at the start of the 12 knot area.
There has been a large proportion of incidents with no causal factor may be due to the lack of evidence following a wash complaint, or where a combination of factors such as multiple vessels, weather, mooring arrangements etc. meant there was no central cause.
Pass With Caution Broadcasts
The majority of incidents occurred when no Pass with Caution broadcast, however the majority are moored vessels or recreational vessels which would not require a broadcast of flags to be displayed. A small number of the wash complaints occurred when London VTS were broadcasting a Pass With Caution or advising that vessels were on emergency calls, such as the MPU or LFB. Increasing use of the Pass with Caution and Romeo Yankee flags for infrastructure projects may reduce their significance.
Overall reduction in Wash/Draw-off incidents since 2010, with a big reduction in 2012 – this could be a result of the introduction of the Speed Limit Byelaw between Margaretness and Wandsworth, as the most significant drop is seen within the speed limit area.
There are peaks in wash incidents around the commuter periods, which suggests a cumulative effect with commuter passenger services contributes to these incidents.
Offending Vessel Types Complainants
Emergency Services / Patrol Craft (41%) Moored vessel(50%)
Tugs (15%) Recreational Vessel(37%)
Workboats (15%) Vessel Underway(13%)
Other (29%)
SMS Report—Inland Waterways Freight, workboat and service craft October 2017
Inappropriate Navigation— upward trend since 2012 Why:
The majority of incidents labelled ‘Inappropriate Navigation’ could have easily been avoided using better planning and good communication, as could a number of near misses.
What:
Vessels navigating outside of the channel / port side (33%)
Passing vessels too closely (28%)
Crossing ahead of other vessels (28%)
Improper mooring (11%)
Case Studies
A motor barge turned across the river approximately 100 metres ahead of an outbound 60m sailing ship at Wappingness. The appropriate sound signals were used by the barge but did not make any passing agreement or make the sailing vessel aware of their intentions on VHF. The sailing vessel’s situational awareness would have been clear with better communication from the master of the motor barge.
A tug with craft (X) was navigating with the tide approaching a bridge. The Master was aware of another tug with craft (Y) approaching in the opposite direction and believed the vessel to be stemming the tide; However, the vessel’s AIS was operating intermittently. It became evident that tug X was continuing to transit the bridge against the tide and tug Y requested that tug X alter course to avoid a collision or contact with the bridge. Better communication would have prevented these incidents. Make sure your intentions are made clear. Never assume—always remain alert and take action if a close quarters situation is developing.
A Pilot onboard a ship observed a tug with a light hopper strapped up to the tug's port side. Only very little of the tug’s bridge windows could be seen and the tug's forward arc of vision was badly obstructed by the barge's superstructure, thus it was impossible to keep a safe look out. There was not a lookout forward.
A tug was approaching the Thames Barrier with two loaded barges with the tide. As the vessel approached the Barrier, the master was concerned that the tow was veering to port so one of the crew adjusted the tow. This was unsuccessful and the master decided to abort the transit, informing VTS of his intentions. The master decided to tow the barges one at a time. Even though these occurrences shouldn’t have happened, this is representative of a good ‘near miss’ reporting culture, and you should always be aware of your vessel’s limitations in both manoeuvrability and visibility.

5
How’s 2017 looking so far...
A closer look at Inland Waterway freight, workboats and service craft occurrences in 2017.
Overview
Although there has been an overall downward trend between 2010 and 2016, this is not reflected in the current 2017 figures, with increases in almost all categories.
So far in 2017, there is an over all increase of 72% in the number of occurrences.
Proportions
Year Deficiency Near Miss Incident
2014 11.1% 4.4% 71.1%
2015 7.4% 9.3% 83.3%
2016 3.1% 18.8% 78.1%
2017 18.2% 16.4% 65.5%
Total 10.8% 11.8% 74.2%
Top 6 categories 900%
250%
0%
75%
200%
0%
300%
100%
% = increase on 2016 total
SMS Report—Inland Waterways freight, workboat and service craft October 2017
Top 6 Vessel Types
What’s Breaking Down?
Top 6 Vessel Types
The largest increase is in the number of deficiencies, which are up 9x since 2016. This large increase may be due to an increased reporting of minor breakdowns, breakdowns now not resulting in incidents occurring, or in fact more breakdowns are actually occurring.
As with the 2010-2016 trend, it may be that breakdowns are resulting in fewer contacts or collisions due to better procedures to deal with breakdowns.
Whist an accurate assessment of the AIS traffic is not yet possible, traffic due to projects, including the Tideway Tunnel, has begun to increase, which may account for the increase in occurrences. Vessels being worked over longer and more hours to keep up with projects demands may also account for the increase in breakdowns.
Workboats and PLA vessels are responsible for the majority of breakdowns.
The number of near misses this year is up 50% compared to 2016. This could be evidence of an improving reporting culture, which is supported by the increasing trend over a number of years.
Tug Incidents
Communication and Planning
Around 30% of occurrences are caused by vessels navigating inappropriately, communicating poorly or inadequate planning, which could have been avoided given more awareness.
The high proportion of ‘Breach of Regulations’ by tugs may have been avoided through better awareness of the regulations and planning the number and sizes of tows to be within General and Pilotage Directions.

6
Conclusion Non-passenger, Inland Waterway incident statistics showed an improving trend between 2010 and
2016, however this did not continue into 2017. Machinery Deficiencies also make up a large proportion—particularly in 2017 (18%), with occurrences
caused by “Breakdowns” accounting for nearly 30%, which are largely workboats. ‘Contact’ is the biggest incident type, however 21% of these are Near Misses.
1. Maintenance and Checks The Trend Analysis shows that improved maintenance, accompanied by thorough pre-season and pre-departure checks will reduce the likelihood of incidents, near misses and deficiency reports. Particularly for workboats. This is supported by the fact that these occurrences happen when vessels are likely entering service. Many breakdowns occur in Woolwich Reach near the Thames Barrier, and so could have a severe outcome. However it is evident that breakdowns are less likely to result in contacts or collisions than before. This could be indicative of better corrective action or earlier intervention to reduce the consequence.
This is particularly important when vessels are worked harder and longer to keep up with the demands of current infrastructure projects. The availability of dry docks and maintenance facilities may also play a part in the breakdown figures—vessels being out of service for extended periods would apply unwanted commercial pressure and potentially more strain on other vessels which are operating on a particular project.
3 serious incidents in 2017 have been barges or vessels sinking and 1 was due to a vessel breaking down. Improvements in maintenance and checks may have avoided these incidents. 1 was due to the loading of the barge which may have been averted by closer monitoring of the loading and better communication and planning...
2. Communication and Planning Non-passenger Inland Waterway occurrences due to Inappropriate Navigation, bad communication or poor planning is accounting for a increasing proportion, around 30% in 2017.
Human Error accounts for around 1/3 of all occurrences in the Port of London, however a poor safety culture and lack of procedures does have a bearing on a much wider range of incidents.
The Human Factors campaign focusses on 3 key areas—Communication, Distractions and Best Practice, which are centred around Safety Culture. By keeping alert, not being complacent and speaking out, the number of incidents and near misses can be reduced.
3. Traffic The recent central London ‘Capacity Study’ identified hot spots and peak traffic periods and the PLA is overseeing improvements to timetabling, waterspace management and reviewing the location of moorings in busy areas. More thorough Trend Analyses and appreciation of the effect traffic has on these incident statistics will be possible in the future with better access to AIS data.
What is the PLA doing? Undertaking a Red Tape Challenge, to simplify the rules and regulations and to ensure they are fit for
purpose for the river today. Examining the Vessel Licensing regime to identify where improvements can be made to reduce the
likelihood of workboat breakdowns. ‘Capacity Study’ recommendations being implemented to ease congestion in central London. Increased traffic monitoring and intervention by Harbour Launches during peak periods Increased enforcement for serious breaches of regulation Working to lessen the impact of major infrastructure projects, such as Tideway.
SMS Report—Inland Waterways Freight, workboat and service craft October 2017