a tungsten-in-glass iontophoresis assembly for studying ... · pdf filemicropipettes with...
TRANSCRIPT

Journal of Neuroscience Methods, 49 (1993) 211-223 2 l 1 © 1993 Elsevier Science Publishers B.V. All rights reserved 0165-0270/93/$06.00
NSM 01544
A tungsten-in-glass iontophoresis assembly for studying input-output relationships in central neurons
Dw ay n e W. G o d w in
Behacioral Neuroscience Program, Department of Psychology, Uniz,ersity of Alabama at Birmingham, Birmingham, AL 35294 (USA)
(Received 25 September 1992) (Revised version received 6 May 1993)
(Accepted 11 May 1993)
Key words: Microiontophoresis; Microelectrode; Thalamus; Lateral geniculate nucleus; Vision; Retina; GABA; S-potential
A method is described for the production of an electrode capable of monitoring and modulating the input-output relationship of thalamic neurons. Tungsten-in-glass electrodes were manufactured with the ability to simultaneously record lateral geniculate nucleus action potentials and associated, retinally evoked S-potentials. The recording electrodes were mounted onto multibarreled micropipettes with iontophoretic capability. The completed electrode assembly permitted micropharmacological modulation of the fraction of lateral geniculate nucleus output spikes to retinal input spikes (the transfer ratio), lontophoretically applied 3,-aminobutyric acid (GABA) decreased the transfer ratio, an effect countered by the GABA A antagonist, bicuculline. Elevated transfer ratios produced by stimulation of an afferent pathway originating in the parabrachial region of the brainstem were decreased by concurrently applied GABA. The fabrication of this electrode assembly employs simple modifications of existing techniques and separate construction of recording and iontophoretic elements to provide high-quality single-unit recordings coupled with micropharmacological function.
Introduction
The transformations in neuronal signals that occur between peripheral and central brain struc- tures are of fundamental interest in the investiga- tion of sensory systems. In the mammalian visual system, the dorsal lateral geniculate nucleus (LGN) represents the first station where central mechanisms can act to alter the visual signal en route from retina to primary visual cortex. Al- though there appear to be few modifications of the cen te r / su r round structure of the receptive fields generated in the retina and transmitted to the non-lagged relay cells of the LGN, LGN
Correspondence: D.W. Godwin, Department of Neurobiology and Behavior, State University of New York, Stony Brook, NY 11794-5230, USA. Email: [email protected].
neurons are the recipients of massive synaptic inputs from non-retinal sources that may regulate the strength of the visual signal (for reviews see Steriade et al., 1990; Sherman and Koch, 1986, 1991; Norton and Godwin, 1992; Wilson, 1992). Examinations of the input-output relationship of LGN relay neurons have demonstrated a de- crease in the firing rate from retina to LGN (Bullier and Norton, 1979; Kaplan et al., 1987) and the switching of LGN relay neurons between a faithful tonic relay mode and an oscillatory burst mode that does not reflect the retinal input in a 1:1 fashion (McCormick and Feeser, 1990; Steriade et al., 1990).
The S-potential is a useful index of the retinal afferent input to LGN neurons. As illustrated in Fig. 1, S-potentials are small, monophasically pos- itive voltage events recorded extracellularly in association with LGN neurons. Studies have sug-

212
A~, B
I
i
c i~ ~ - ~ r ~
1 mV
5 ms
Fig. 1. L G N S-potentials and action potentials recorded,-trom a cat O N - center X relay cell. A: single S-potential that does not produce an action potential. 13: action potential in which the associated S-potential, if present, is not apparent . C: action potential that arises from an S-potential. The transfer ratio calculated from this example is 0.67 (2 LGN action potentials produced by 3 S-potentials), because it is usually assumed in the case of (B). that an underlying S-potential is masked by the rising phase of the action potential. However, another plausible interpretation is that the action potential was generated by a source other than a retinally evoked S-potential. This is of particular concern during relay cell burst firing, when single retinal afferent discharges may lead to a burst of 2-8 action potentials from the relay neuron. This paper will describe a method of revealing these hidden S- potentials, which provides for more accurate estimates of the
retinal input to an individual LGN neuron.
gested that S-potentials are post-synaptic poten- tials representative of retinally evoked excitatory postsynaptic potentials (Bishop et al., 1962; McI1- wain and Creutzfeldt, 1967; Cleland et al., 1971; Kaplan and Shapley, 1984; Wang et al., 1985; Kaplan et al., 1987; Mastronarde, 1987). By quan- tifying the relative occurrence of S-potentials and action potentials, one may obtain the transfer ratio, a description of the fraction of retinally evoked input impulses which are t ransformed into LGN neural output impulses (Coenen and Ven- drik, 1972; see Fig. 1). Variations in the transfer ratio have been observed to be highly correlated with the arousal state of the animal (Coenen and Vendrik, 1972), with low transfer ratios occurring during slow wave sleep and high transfer ratios occurring during waking (Coenen and Vendrik, 1972; Fourment et al., 1984).
Despite the well-established link between
arousal and the transfer ratio, few studies have examined the underlying pharmacology. This has been due in part to the difficulty of in vivo assessment of retinogeniculate transfer in a situa- tion which allowed direct manipulation of the neurochemical environment of the neuron being studied. In this paper I will describe the fabrica- tion of a combined recording/ iontophoresis elec- trode based on established electrophysiological and microiontophoretic techniques which allows both the assessment and the selective modulation of the transfer ratio during natural stimulation of the LGN neurons with visual stimuli, and during electrical stimulation of LGN afferent pathways.
Methods
The fabrication of the combined record ing/ iontophoresis electrode consists of 3 procedures: (1) the construction of a tungsten-in-glass record- ing electrode; (2) the construction of a multibar- reled, drug delivery pipette; and (3) the attach- ment of the recording electrode to the ion- tophoretic pipette to form the assembled unit. On average, a completed electrode assembly can be obtained within 30 rain, but it should be recog- nized that steps in the recording electrode manu- facturing process involve the generation of batches of intermediate elements.
'Procedure 1: tungsten-in-glass recording electrode Much of this methodology is a modification
and synthesis of standard techniques of tungsten- in-glass, recording electrode manufacture (Free- man, 1969; Merrill and Ainsworth, 1972; WOrt- gotter and Eysel, 1988; Hellier et al., 1990). Four basic steps are involved in the procedure: (1) etching the tungsten wire to the required tip geometry; (2) coating the etched wire with borosilicate glass; (3) breaking the glass from the coated, etched tip to expose the metal recording tip; and (4) adjusting the electrode impedance to the final target value.
Step 1: etching. Tungsten wires (AM systems no. 7190, 101 lzm diameter, 7.62 cm long) were loaded onto a stainless steel, 2.54-cm-diameter hollow cylinder (Fig. 2A). The wires were placed
213
A STAINLESS STEEL ~ ~ ~ C Y L I N D E R ~p , ~.
s . A n o F J " . - < ; ~ ~ ~ - ~ l g ~ MoToR
TUNGSTEN ~ j . ~ - 18 GAUGE WIRE ~ - NEEDLE TUBING
TIME
;.TAL O1L
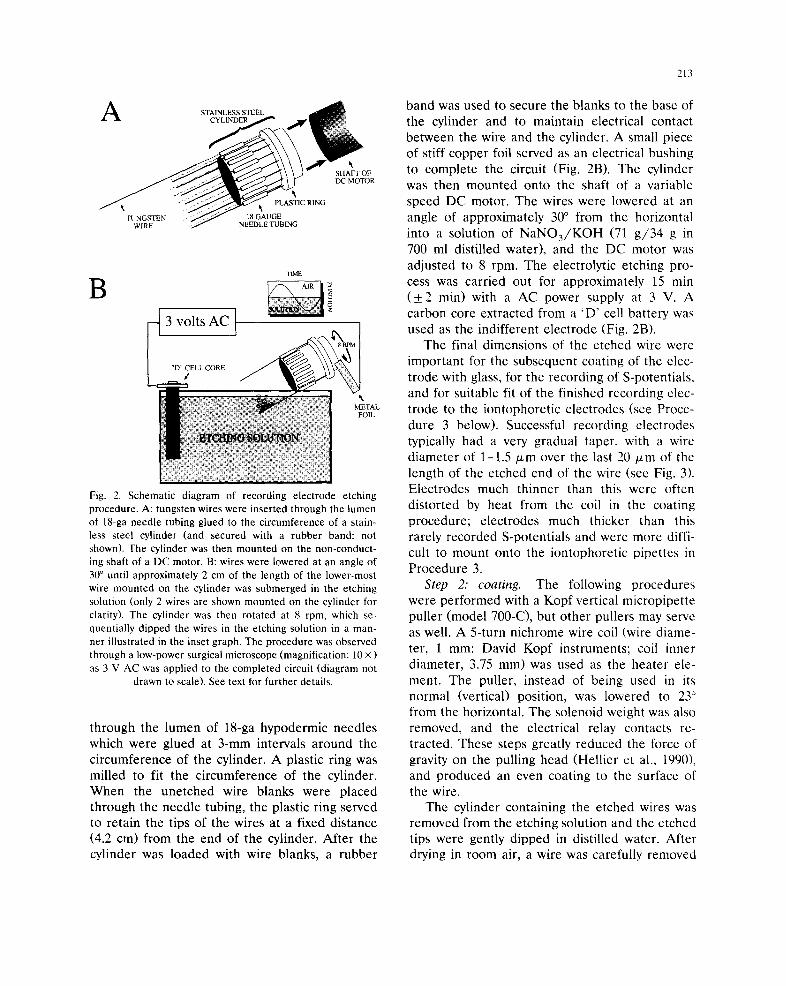
Fig. 2. Schematic diagram of recording electrode etching procedure. A: tungsten wires were inserted through the lumen of 18-ga needle tubing glued to the circumference of a stain- less steel cylinder (and secured with a rubber band: not shown). The cylinder was then mounted on the non-conduct- ing shaft of a DC motor. B: wires were lowered at an angle of 30 ° until approximately 2 cm of the length of the lower-most wire mounted on the cylinder was submerged in the etching solution (only 2 wires are shown mounted on the cylinder for clarity). The cylinder was then rotated at 8 rpm, which se- quentially dipped the wires in the etching solution in a man- ner illustrated in the inset graph. The procedure was observed through a low-power surgical microscope (magnification: 10 × ) as 3 V AC was applied to the completed circuit (diagram not
drawn to scale). See text for further details.
t h rough the l umen of 18-ga hypode rmic need le s which were g lued at 3 -mm intervals a r o u n d the c i r cumfe rence of the cyl inder . A plas t ic r ing was mi l led to fit the c i r cumfe rence of the cyl inder . W h e n the u n e t c h e d wire b lanks were p l aced th rough the n e e d l e tubing, the p las t ic r ing served to re ta in the t ips of the wires at a f ixed d i s tance (4.2 cm) f rom the end of the cyl inder . A f t e r the cyl inder was l o a d e d with wire b lanks , a r u b b e r
band was used to secure the b lanks to the base of the cyl inder and to ma in ta in e lec t r ica l contac t be tw e e n the wire and the cylinder. A small p iece of stiff coppe r foil served as an e lec t r ica l bush ing to comple t e the circuit (Fig. 2B). The cyl inder was then m o u n t e d on to the shaft of a var iab le speed D C motor . T h e wires were lowered at an angle of approx ima te ly 30 ° f rom the hor izon ta l into a so lu t ion of N a N O 3 / K O H (71 g / 3 4 g in 700 ml dis t i l led water) , and the DC m o t o r was ad jus ted to 8 rpm. T h e e lect rolyt ic e tching pro- cess was ca r r i ed out for app rox ima te ly 15 min (_+2 min) with a A C power supply at 3 V. A ca rbon core ex t rac ted f rom a ' D ' cell ba t t e ry was used as the ind i f fe ren t e l ec t rode (Fig. 2B).
The final d imens ions of the e tched wire were impor t an t for the subsequen t coa t ing of the elec- t rode with glass, for the record ing of S-potent ia l s , and for sui table fit of the f in ished record ing elec- t rode to the ion tophore t i c e l ec t rodes (see Proce- dure 3 below). Successful r ecord ing e l ec t rodes typical ly had a very g radua l t aper , with a wire d i a m e t e r of 1 - 1 . 5 / x m over the last 2 0 / x m of the length of the e t ched end of the wire (see Fig. 3). E l ec t rodes much th inne r than this were of ten d i s to r t ed by hea t f rom the coil in the coat ing p rocedure ; e l ec t rodes much th icker than this ra re ly r e c o r d e d S-po ten t ia l s and were more diffi- cult to mount onto the i on tophore t i c p ipe t t e s in P r o c e d u r e 3.
Step 2: coating. The fol lowing p r o c e d u r e s were p e r f o r m e d with a K o p f ver t ical m ic rop ipe t t e pu l l e r (mode l 700-C), but o the r pu l le rs may serve as well. A 5- turn n ichrome wire coil (wire d iame- ter , 1 mm: David K o p f ins t ruments ; coil inner d i ame te r , 3.75 mm) was used as the h e a t e r ele- ment . The pul ler , ins tead of be ing used in its no rma l (vert ical) posi t ion, was lowered to 23 ° from the hor izonta l . The so lenoid weight was also removed , and the e lec t r ica l re lay contac t s re- t rac ted . These s teps great ly r e d u c e d the force of gravity on the pul l ing head (He l l i e r et al., 1990), and p r o d u c e d an even coat ing to the surface of the wire.
The cyl inder con ta in ing the e t ched wires was r e move d f rom the e tching so lu t ion and the e t ched t ips were gent ly d i p p e d in dis t i l led water . Af t e r drying in room air, a wire was careful ly r emoved
214
from the cy l inder and slid, u n e t c h e d end first, down the cen t e r of a glass capi l la ry (0.75 m m o u t e r d i ame te r , 0.4 m m inner d i ame te r ; A M Sys- tems no. 6255) until abou t 1 cm of the u n e t c h e d end p r o t r u d e d f rom the end of the capi l la ry to serve as an e lec t r ica l p ickup lead to the head- s tage ampl i f i e r dur ing exper iments . This was
g lued in p lace with a d rop of cyanoacry la te adhe- sive (i.e., ' S u p e r g l u e ' ) app l i ed at the junc t ion be tween the wire and the capi l lary. The glue could be quickly cured by careful ly passing it t h rough the f lame of a bu tane l ighter or a lcohol
STEP 1
STEP2
¢ GLASS WHISKER
STEP3 END OF GLASS
COATING
3 ~ HL[t..21~!IIII~[2/12ILIII ?i~ ¢
EXPOSED .... I 10 ILtm
i i
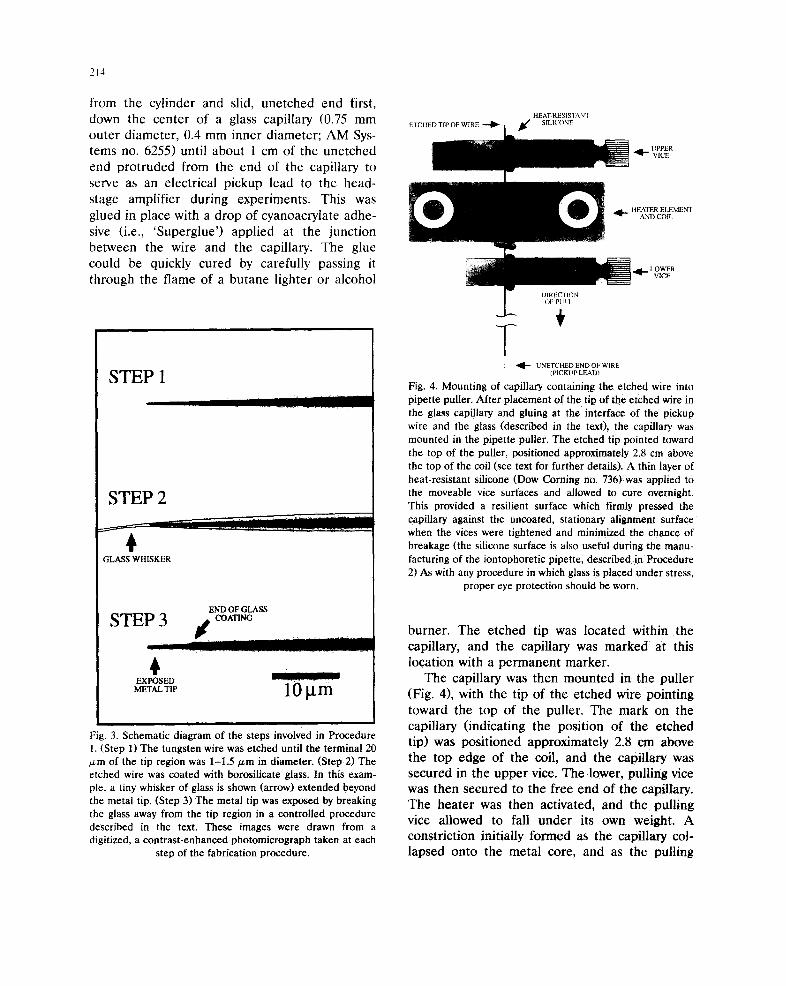
Fig. 3. Schematic diagram of the steps involved in Procedure 1. (Step 1) The tungsten wire was etched until the terminal 20 ~zm of the tip region was 1-1.5/zm in diameter. (Step 2) The etched wire was coated with borosilicate glass. In this exam- ple, a tiny whisker of glass is shown (arrow) extended beyond the metal tip. (Step 3) The metal tip was exposed by breaking the glass away from the tip region in a controlled procedure described in the text. These images were drawn from a digitized, a contrast-enhanced photomicrograph taken at each
step of the fabrication procedure.
ETCH]
UPPER 4-- VICE
HEATER ELEMENT AND COIL
~[.._ LOWER VICE
~ = - UNETCHED END OF WIRE (PICKUP LEAD)
Fig. 4. Mounting of capillary containing the etched wire into pipette puller. After placement of the tip of the etched wire in the glass capillary and gluing at the interface of the pickup wire and the glass (described in the text), the capillary was mounted in the pipette puller. The etched tip pointed toward the top of the puller, positioned approximately 2.8 cm above the top of the coil (see text for further details). A thin layer of heat-resistant silicone (Dow Corning no. 736) was applied to the moveable vice surfaces and allowed to cure overnight. This provided a resilient surface which firmly pressed the capillary against the uncoated, stationary alignment surface when the vices were tightened and minimized the chance of breakage (the silicone surface is also useful during the manu- facturing of the iontophoretic pipette, described in Procedure 2) As with any procedure in which glass is placed under stress,
proper eye protection should be worn.
burner . The e t ched tip was loca ted within the capi l lary, and the capi l la ry was m a r k e d at this loca t ion with a p e r m a n e n t marker .
The capi l la ry was then m o u n t e d in the pu l le r (Fig. 4), with the t ip of the e t ched wire po in t ing toward the top of the pul ler . The m a r k on the capi l la ry ( indica t ing the pos i t ion of the e t ched t ip) was pos i t i oned app rox ima te ly 2.8 cm above the top edge of the coil, and the capi l la ry was secured in the u p p e r vice. The l ower , pul l ing vice was then secu red to the f ree end o f the capil lary. The h e a t e r was then act ivated, and the pu l l ing vice a l lowed to fall u n d e r its own weight . A cons t r ic t ion ini t ial ly f o r m e d as the capi l la ry col- l apsed on to the me ta l core, and as the pul l ing

215
vice fell the etched tip was drawn through the heat-softened capillary.
In this configuration, 15 A was generally suffi- cient to coat the electrode with glass. If the temperature of the coil was too low, the glass tended not to adhere to the metal, and the glass tended to break far away from the etched tip. Temperatures that were too high caused very uneven coating, bubbling of the coating, or de- struction of the very finely etched metal tip (see also Merrill and Ainsworth, 1972). Any electrodes bearing these characteristics were generally unus- able.
Step 3: breaking. A properly coated tip some- times bore a small whisker of glass which ex- tended a few micrometers beyond the metal tip (see Fig. 3), or the glass sometimes ended flush with the metal tip. Infrequently, the glass would break with the metal tip exposed in such a way that the electrode was ready to be directly ad- vanced to Step 4 without passing through Step 3.
In Step 3, the final exposed tip length was obtained with a procedure essentially identical to that of Merrill and Ainsworth (1972), and Hellier et al. (1990). Using a hydraulic microdrive (David Kopf Instrument no. 607), the whiskered tip was advanced into a bead of heated glass (Coming no. 7570; bead diameter, approximately 2 mm) that was suspended on a platinum wire loop (wire diameter, 0.5 mm) mounted on a microscope stage. The mounting posts were in electrical con- tact with a small laboratory variable auto-trans- former (Powerstat 3PN116B). By applying voltage until the platinum loop glowed red, the glass bead would form as powdered glass was applied to the wire loop (Hellier et al., 1990).
Liquification of the glass bead resulted when 20-30 V AC was applied to the circuit (exact voltage is dependent on the size of the bead). After advancing the recording electrode into the liquified bead to a distance equal to the desired exposed tip length, the transformer was turned off and the glass bead allowed to cool, fracturing the glass at the interface of the capillary and the bead and exposing the desired length of metal tip. This procedure allowed very fine control over the final tip configuration. In our laboratory, ex- posed metal tips of 4-10 txm yielded the best
S-potential recordings, with greater selectivity and higher signal-to-noise recordings derived from the shorter tips.
Step 4: impedance adjustment. Merrill and Ainsworth (1972) plated their electrodes with platinum black in order to lower electrode impedance. In our laboratory, this procedure was found to be difficult to control when applied to the tiny exposed metal tips necessary for our S-potential recordings. A reliable and much sim- pler method was adapted from W6rgotter and Eysel (1990), who lowered the impedance of their tungsten electrodes by dipping the tips in a solu- tion of 40% hydrofluoric acid in saline. Whereas W6rg6tter and Eysel suggest that approximately 5 mm of the tip region should be dipped in the acid solution, the recording electrodes described in the current procedure were dipped only until contact with the surface of the solution was cer- tain, typically no more than about 2 mm. Impedances were adjusted using this method to a stable value in the range of 14-25 M,Q (about 65% of the starting impedance: measured with a Winston no. BL1000B impedance meter at 135 Hz) for the recording of S-potentials, and the action of the acid terminated by dipping the tips in distilled water. While this impedance range was somewhat high in comparison to electrodes manufactured by the methods of Merrill and Ainsworth (1972) and Hellier et al. (1990), it is consistent with values obtained by W6rg6tter and Eysel (1990) and likely reflects the smaller tip size of these electrodes. Lower impedance electrodes capable of recording single or multiunit activity. (but not S-potentials) could be obtained by either breaking off more glass from the tip or increasing the duration of the dip in acid solution. After thc impedance adjustment procedure, the finished recording electrodes were stored, or used in the final procedure for the construction of the com- bined recording/ iontophoret ic electrode.
While electrodes capable of recording single units could be fashioned without passing them through Step 3 (relying instead on Step 4 for exposing the metal tip), in our laboratory such electrodes did not provide adequate control over the final tip geometry nor did they routinely record S-potentials. The reason for this may be

216
that the fine metal tips exposed in the controlled procedure in Step 3 are cleaned in Step 4 as the impedance drops to the target value, whereas electrodes treated only with acid in Step 4 are exposed along a greater tip area because of the action of the acid on the glass.
The magnitude of the inherent noise of the tungsten electrode described here is comparable to that obtained by W6rtg6tter and Eysel (1988) for their tungsten-in-glass electrodes. To measure the noise, a test system was constructed which included a saline test bath connected to the ground of a P15 AC preamplifier (Grass Instru- ment Co.) via a A g / A g C I wire, with the tungsten electrode immersed in the bath to approximately 10 mm and connected to the active lead of the P15. The output of the preamplifier (bandwidth: 0.3 Hz-10 kHz) was monitored on an oscilloscope at a slow sweep speed. The mean peak-to-peak
test system noise (without the tungsten electrode in the test circuit) was 10.5 gV, while the mean (+ SD) peak-to-peak noise of a sample of individ- ually measured tungsten electrodes manufactured by the methods of this paper was 19.4 ~ 4.3 /zV.
Procedure 2: drug defivery pipette The fashioning of the drug delivery pipette
consists of 2 steps: (1) pulling the pipette blank to the desired taper; and (2) breaking the tip to a desired diameter.
Step 1: pulling to desired taper. The LGN in adult cats is located approximately 11-14 mm below the cortical surface in vertical penetrations (Sanderson, 1971). This depth placed a constraint upon the physical characteristics of the record- ing/iontophoret ic pipette. Multibarreled pipettes (World Precision Instruments no. 5B120F-6) pulled with a shoulder-to-tip length of 20 mm
STATIONARY PIPETTE
J
~RECORDING ELECTRODE
I O N T O P H O R E T I C ~ ELECTRODE
lOOjJm
B
1
J
Fig. 5. Bonding of the recording electrode to the iontophoretic pipette (top view). The recording electrode and iontophoretic electrode were attached in a procedure observed under the microscope. After the initial gross placement of the recording electrode upon the multibarreled pipette (described in the text), the final tip placement was viewed under low power (10 × ). Ai using the microscope mechanical stage manipulator (Edmund Scientific no. A31,954 or equivalent), the recording electrode was touched at about 100/xm above the tip to a stationary pipette dipped in either optical adhesive or freshly mixed 5-min epoxy (the stationary pipette rests on a ball of plasticine affixed to the microscope stage). B: the recording electrode with the attached glue droplet (1) was then guided to rest in the groove (front view shown in schematic cross-section in 2: black bar indicates downward direction) made by the top two and the center barrels of the 5-barrel pipette, and capillary action would draw the uncured adhesive toward
the tip (3).
217
yielded minimal damage of the overlying brain tissue and provided maximal structural stability of the assembled unit.
The 5-barreled pipettes were pulled with a Kopf 700-C pipette puller (Heater, 16 A;
Solenoid, 41) equipped with a 5-turn Nichrome wire coil (inner diameter, 6 mm) in the normal (vertical) position and configuration. The pipette barrels that were diagonally opposite one another when viewed in cross-section (see Fig. 5B 2, at-
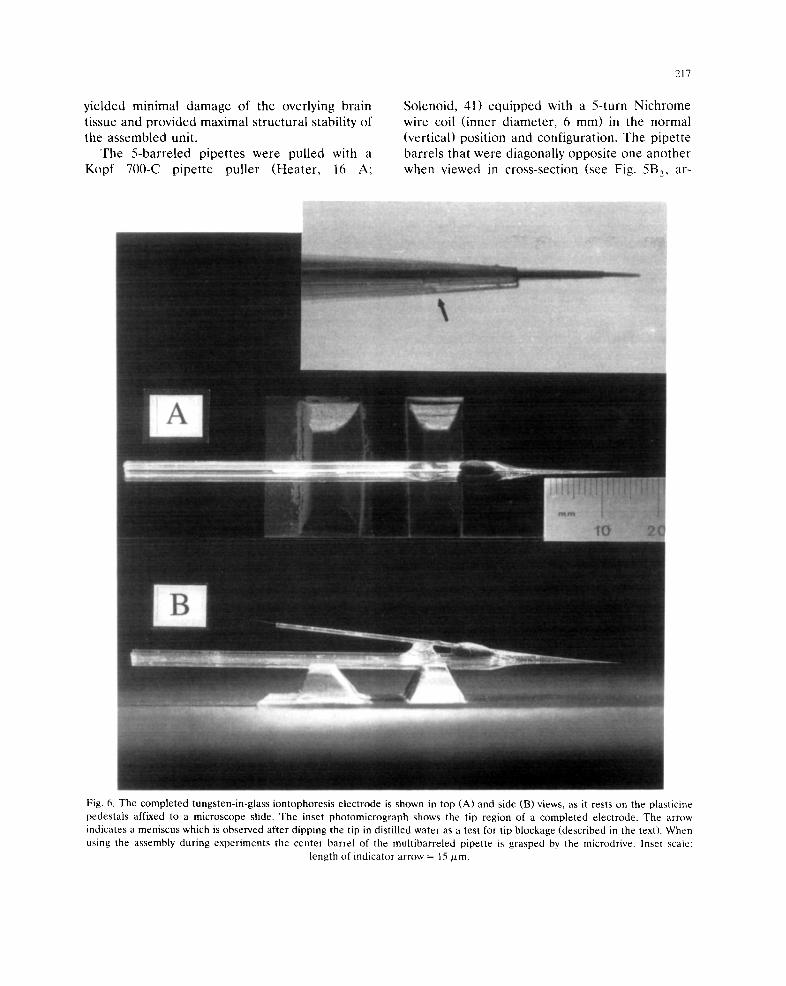
Fig. 6. The completed tungsten-in-glass iontophoresis electrode is shown in top (A) and side (B) views, as it rests on the plasticine pedestals affixed to a microscope slide. The inset photomicrograph shows the tip region of a completed electrode. The arrow indicates a meniscus which is observed after dipping the tip in distilled water as a test for tip blockage (described in the text). When using the assembly during experiments the center barrel of the multibarreled pipette is grasped by the microdrive. Inset scale:
length of indicator arrow = 15 ~.m.

218
rows) were clamped by the clamping vices. The layer of heat resistant silicone applied to the movable vice surfaces in Procedure 1 helped to avoid shattering of the multibarreled pipette due to the clamp and pulling forces (see legend Fig. 4).
Step 2: breaking to desired diameter. To in- crease the diameter of the tapered, multibarreled pipette some investigators have broken the tip against a glass slide or a piece of optical lens paper while viewing the procedure under the microscope. However, the same glass-bead proce- dure as described in Procedure 1, Step 3 for breaking the glass tips from the recording elec- trodes also worked well for the micropipettes. This procedure provided significantly greater control over the breaking process than was ob- tained with other techniques. To allow proper fit of the recording electrode onto the iontophoretic pipette, and to produce tip orifices large enough to permit adequate drug flow, an overall tip di- ameter of 15-20 t~m was used, which corre- sponded to an individual barrel orifice diameter of 2-3 ~m.
Procedure 3: The assembly process The final assembly of the electrode consists of
2 steps: (1) aligning the recording electrode with the iontophoretic electrode, and (2) affixing them with a strong glue. Either optical adhesive (Ed- mund Scientific no. 68) or 5-min epoxy have been used in a procedure illustrated in Fig. 5.
Step 1: alignment. The iontophoretic elec- trode was placed upon supporting pedestals of plasticine (i.e., 'modelling clay') that were affixed to a glass microscope slide, with the widest cross- sectional dimension of the iontophoretic pipette contacting the pedestals (Fig. 5B 2, black bar). The tip was then arranged so as to provide a optimal view when placed under a microscope objective (see Fig. 6A and B for arrangement). The gross placement of the recording electrode was made upon a small (5 mm diameter) ball of plasticine affixed just above the shoulder (ap- proximately 25-30 mm from the tip), pressed into the top of the iontophoretic electrode as it rested upon the pedestals (Fig. 6B). The recording elec- trode was gently pressed into the ball of plas-
ticine, with the tips of the recording and ion- tophoretic electrodes brought into roughly the same plane (orthogonal to the axis of the ion- tophoretic electrode), with the aim of minimizing the space between the shoulders of the two elec- trodes. Because the process of breaking the tip with the glass bead preserved the relative macrostructural arrangement of the barrels in the microstructure of the tip, the top 3 barrels of the 5-barrel pipette configuration provided a centcr groove upon which the recording electrode could be rested and affixed (Fig. 5B2). By grasping the recording electrode near the pickup lead. in Step 2 one could use the ball of plasticine as a fulcrum to adjust the tip of the recording electrode until it came to rest within the center groove of the iontophoretic pipette.
Step 2." gluing. As illustrated in Fig. 5A. a stationary pipette dipped in uncured adhesive was used as an applicator to the recording elec- trode. The recording electrode was manually po- sitioned slightly canted from its final resting posi- tion on the iontophoretic pipette. The micro- scope stage manipulator was used to bring the recording electrode into contact with the drop of adhesive on the stationary pipette, and a small bead of adhesive was allowed to form on the recording electrode. Again using the stage manip- ulator, the recording electrode was withdrawn from the field of view to avoid damaging it as the stationary pipette was removed. The stationary, adhesive-bearing pipette was then removed from the field, and the tips of the recording and ion- tophoretic pipette were returned to the field of view. The recording electrode was then manually guided to rest within the center groove of the iontophoretic electrode (Fig. 5B 2 ).
If optical adhesive was used to attach the tips, a high intensity ultraviolet light gun (Edmund Scientific no. D36,430) was used to solidify the bond. The remainder of the shoulder was coated in a second stage of optical adhesive application with a hand-held pipette dipped in the uncured adhesive. The assembled recording/ iontopho- retie pipette was then placed on a sheet of alu- minum foil under an ultraviolet lamp (Burton no. 9312) to cure overnight. If 5-min epoxy was used, initial application at the tip was allowed to solid-

ify for 5 min before the final application of fleshly mixed epoxy over the remainder of the shoulder. A supportive bead of epoxy or dental acrylic was applied to attach the recording/iontophoretic electrode 1-2 cm above the shoulder (Fig. 6).
Because gluing the tips of the pipettes to- gether introduced the danger of blocking the iontophoretic pipette with adhesive, the cured unit should be screened for blockage by dipping the tip in distilled water, and observing it under high power microscopy. At a relative humidity of 45-55%, a meniscus could be observed in each unblocked barrel that would move toward the tip as the distilled water evaporated from the tip (Fig. 6, inset).
Another advantage of the gluing procedure was that the adhesives were soluble in methylene chloride or acetone, which permitted recovery from tip blockage and reuse of the recording electrode. Successful recording electrodes could be recovered and reused by affixing them onto pristine iontophoretic pipettes.
Fig. 7. The effects of G A B A and the G A B A A antagonist bicuculline on retinogeniculate transfer in a cat LGN on- center X relay cell are shown in representative recordings of S-potentials and action potentials responding to a flashed 0.3 ° spot of light centered within the cell's receptive field. The inset figure shows an expanded view along the time axis of 4 S-potentials and 1 action potential. A: in the predrug control record, action potentials and S-potentials were evoked by the stimulus, however, the action potential response was more transient than that of the S-potential (transfer ratio mean + SD = 0.13 _+ 0.10). B: iontophoretically applied G A B A (0.5 M, pH 3.0) diminished the number of relay cell output spikes, revealing the underlying sustained S-potential response pat- tern (transfer ratio = 0.02+0.02). C: bicuculline (methochlo- ride form; 5 mM in 165 mM NaCI, pH 3.0) antagonized the effect of G A B A on the transfer ratio, and produced a sus- tained output which more faithfully reflected the S-potential activity (transfer ra t io=0.85-+0.21) . These records were recorded with a PI5 AC preamplifier at a bandwidth of 0.3 Hz to 10 kHz. Voltage scale: vertical deflection of st imulus indicator trace = 0.7 inV. Iontophoretic methodology: The drug-filled barrels of the iontophoretic electrode were con- nected via Ag /AgC 1 wires to iontophoresis pumps (Medical Systems Corporation no. IP-2), which permit ted the applica- tion of 9 nA retention currents. Ejection currents and dura-
tion were as indicated in the figure labels.
219
Results and discussion
The described recording/iontophoresis elec- trode has been used in studies of input-output relationships in the LGN of anesthetized cats in response to visual stimulation, during ionto- phoretic application of neuroactive substances (Godwin and Norton, 1990; Norton and Godwin, 1992). The assembly provided the capability to directly modulate the transfer ratio under experi- mental control.
tA CONTROL (.77 CONTRAST)
Lr l i t IL I [
~B GABA (70 nA, 7 min)
[C BIC o 2 nA, 1 min)
I STIMULUS ON (500 ms) [
220
Examples from the results of these drug stud- ies are summarized in Fig. 7. Fig. 7A shows the response of an ON-center X cell recorded from layer A1 of the cat's LGN before drug applica- tion. In this condition, the mean (+ SD) transfer ratio over 20 stimulus trials was 0.13 + 0.10. Ion- tophoretic application of 3,-aminobutyric acid (GABA) produced a decrease in the transfer ratio, reducing the number of relay cell action potentials (transfer ratio: 0.02 _+ 0.02)' and reveal- ing the underlying S-potentials (Fig. 7B). Applica- tion of the GABA A receptor antagonist bicu- culline reversed this effect and yielded a signifi- cantly increased transfer ratio (0.85 _+ 0.21) over the predrug condition (t test, P < 0.001) (Fig. 7C). Application of GABA and bicuculline to X, Y and W cells produced similar results, and in most cases GABA completely abolished the LGN neuronal output.
These drug studies are consistent with previ- ous studies indicating an important role for the GABAergic circuitry of the LGN in the control of visual information flow (Sillito and Kemp, 1983; Berardi and Morrone, 1984; Holdefer et al., 1989; Norton et al., 1989). They further suggest that an important component of the function of the in- hibitory circuitry may be modulation of the trans- fer ratio (Norton and Godwin, 1992).
Electrical stimulation of the parabrachial re-
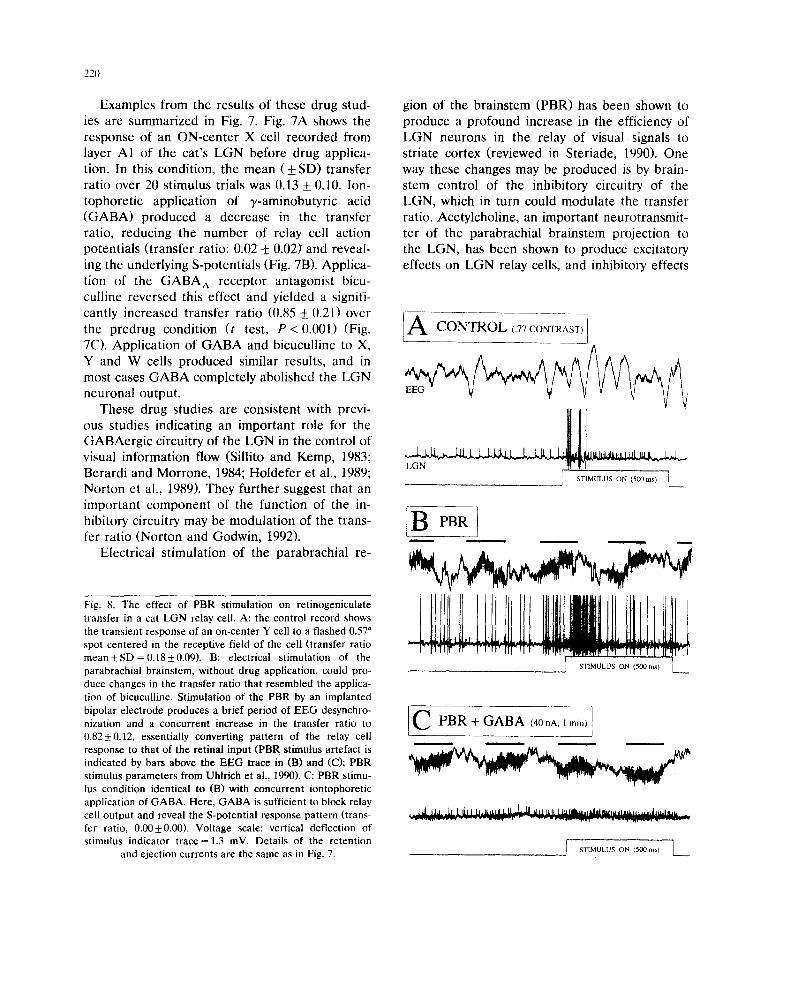
Fig. 8. The effect of PBR stimulation on retinogeniculate transfer in a cat LGN relay cell. A: the control record shows the transient response of an on-center Y cell to a flashed 0.57 ° spot centered in the receptive field of the cell (transfer ratio mean -+ SD = 0.18 + 0.09). B: electrical stimulation of the parabrachial brainstem, without drug application, could pro- duce changes in the transfer ratio that resembled the applica- tion of bicuculline. Stimulation of the PBR by an implanted bipolar electrode produces a brief period of EEG desynchro- nization and a concurrent increase in the transfer ratio to 0.82+0.12, essentially converting pattern of the relay cell response to that of the retinal input (PBR stimulus artefact is indicated by bars above the EEG trace in (B) and (C); PBR stimulus parameters from Uhlrich et al., 1990). C: PBR stimu- lus condition identical to (B) with concurrent iontophoretic application of GABA. Here, GABA is sufficient to block relay cell output and reveal the S-potential response pattern (trans- fer ratio, 0.00_+0.00). Voltage scale: vertical deflection of stimulus indicator trace = 1.3 inV. Details of the retention
and ejection currents are the same as in Fig. 7.
gion of the brainstem (PBR) has been shown to produce a profound increase in the efficiency of LGN neurons in the relay of visual signals to striate cortex (reviewed in Steriade, 1990), One way these changes may be produced is by brain- stem control of the inhibitory circuitry of the LGN, which in turn could modulate the transfer ratio. Acetylcholine, an important neurotransmit- ter of the parabrachial brainstem projection to the LGN, has been shown to produce excitatory effects on LGN relay cells, and inhibitory effects
A CONTROL (.77 CONTRASTI'!
! STIMULUS ON (500ms)
IB PBR1
I f PBR + GABA (40nA, lmin)]
~r J ~ l l J . . ] , J . ~ let I.[JLIk,LId L LI.~.-JJ] d tl LLIL | ]u ld lka, !~ l lde, qd l l l~.kmuJ~l~l l t tLL ,,
J STIMULUS ON (500ms) ] ~
on GABAergic inhibitory neurons (McCormick and Pape, 1988).
The effects of PBR activation on the process- ing of visual stimuli were apparent when using the described iontophoresis assembly, with the added capability of simultaneous micropharmaco- logical manipulation. Fig. 8A shows the response of an ON-center Y cell before PBR stimulation. In Fig. 8B, electrical stimulation of the PBR produced an increase in the transfer ratio from 0.18 to 0.82, a change similar to that seen during the application of bicuculline to the cell in Fig. 7C. Despite the very strong responses evoked by PBR stimulation and the production of a brief period of EEG desynchronization, iontophoretic application of GABA was sufficient to block all relay cell action potentials and to reveal the S- potential response pattern.
The results of the drug studies reported here are comparable to previous reports of GABA- mediated modifications of prepotential-to-action potential ratios in the cat somatosensory thala- mus (Gottschaldt et al., 1983, 1988). The pro- longed (several hours) recordings obtained with the stainless steel microelectrode used in those studies are also frequently obtained with the elec- trode assembly described in this paper. Because many investigators commonly employ tungsten- in-glass recording electrodes in single-unit re- cording experiments, the modifications to the ba- sic technique of fabrication described in this pa- per may present an easier alternative to the man- ufacture of stainless steel microelectrodes, which employs a different methodology (Gottschaldt et al., 1988).
Previous studies using S-potentials as an index of retinal input to relay cells have been limited by the assumption that every action potential gener- ated by the LGN is triggered by a retinally evoked S-potential. This assumption, described in the legend of Fig. 1, is unlikely to hold true during relay cell burst activity, during which single reti- nal afferent discharges may trigger a burst of 2-8 action potentials from the LGN relay cell. By eliminating the relay cell output with GABA the S-potential response pattern can be more clearly observed, and neural network transfer functions reflecting more accurate estimates of the retinal
221
input may be calculated. This approach could be of value in the study of the orientation selectivity of retinal versus LGN cells (Smith et al., 1990) and in other experimental comparisons of retinal and geniculate properties (Mastronarde, 1987, 1992).
The electrode assembly described in this paper offered several advantages in the fabrication of the recording and iontophoretic elements over other commonly used methods (Hicks, 1984). Recording electrodes manufactured by the meth- ods of this paper were very sturdy, did not re- quire multi-stage plating procedures to lower electrode impedance, and possessed a low inher- ent noise. They were also small enough to be easily incorporated into iontophoretic assemblies without resorting to concentric, or co-axial ion- tophoretic electrode configurations consisting of glass, or tungsten-in-glass core recording ele- ments (Hellier et al., 1990). The composite nature of the electrode assembly process permitted the relative adjustment of the recording electrode in advance of the iontophoretic barrels, which di- minished or eliminated the pickup of any electri- cal noise that may have originated in the ion- tophoresis pump modules and thereby permitted the use of high impedance recording electrodes. In addition, this design provided separation be- tween the group of wires from the iontophoresis current generator and the recording lead (Fig. 6), which also minimized operational noise. Al- though the recording of S-potential/action po- tential pairs has been emphasized in this paper, the ability to easily adjust the relevant opera- tional parameters of the composite electrode should provide significant flexibility in the refine- ment of the delivery system for use in other preparations or brain regions.
Acknowledgments
This work was supported by grants from the National Institutes of Health (F32 MH09693, T32 EY07033, R01 EY02909, BRSG RR 05932 and CORE P30 EY03039). I would like to express appreciation to Thomas T. Norton, Ph.D., for helpful comments on the manuscript and for pro-

222
viding a laboratory in which to develop these techniques, to Robert N. Holdefer, Ph.D., who introduced me to the use of piggyback ion- tophoretic electrodes, to John T. Siegwart for technical assistance and to Marcia Sullivan for programming related to the analysis of S-poten- tial data and for critically reviewing the manu- script.
References
Berardi, N. and Morrone, M.C. (1984) The role of y- aminobutyric acid mediated inhibition in the response properties of cat lateral geniculate nucleus neurons. J. Physiol., 357: 505-523.
Bishop, P.O., Burke, W. and Davis, R. (1962) The interpreta- tion of the extracellular response of single lateral genicu- late cells. J. Physiol. (Lond.), 162: 451-472.
Cleland, B.G., Dubin, M.W. and Levick, W.R. (1971) Sus- tained and transient neurones in the cat's retina and lateral geniculate nucleus. J. Physiol. (Lond.), 217: 473- 496.
Coenen, A.M.L and Vendrik, A.J.H. (1972) Determination of the transfer ratio of cat's geniculate neurons through quasi-intracellular recordings and the relation with the level of alertness. Exp. Brain Res., 14: 227-242.
Fourment, A.. Hirsch, J.C., Marc, M.E. and Guidct, C. (1984) Modulation of postsynaptic activities of thalamic lateral geniculate neurons by spontaneous changes in the number of retinal inputs in chronic cats. I. Input-output relations. Neuroscience, 12: 453-464.
Freeman, J.A. (1969) A simple method of producing in quan- tity, metal microelectrodes with a desired taper and impedance. Electroenceph. Clin. Neurophysiol., 26: 623- 626.
Godwin, D.W. and Norton, T.T. (1990) GABAergic modula- tion of the transfer ratio in cat lateral geniculate nucleus (LGN). Soc. Neurosci. Abst., 16: 160.
Gottschaldt, K.-M., Vahle-Hinz, C. and Hicks, T.P. (1983) Electrophysiological and micropharmacological studies on mechanisms of input-output transformation in single neu- rons of the somatosensory thalamus. In: G. Macchi, A. Rustioni and R. Spreafico (Eds.), Somatosensory Integra- tion in the Thalamus, Elsevier, Amsterdam, pp. 199-216.
Gottschaldt, K.-M., Hicks, T.P. and Vahle-Hinz, C. (1988) A combined recording and microiontophoresis technique for input-output analysis of single neurons in the mammalian CNS. J. Neurosci. Methods, 23: 233-239.
Havey, D.C. and Caspary, D.M. (1980) A simple technique for constructing 'piggy-back' multibarrel microelectrodes. Electroencephalogr. Clin. Neurol., 48: 249-251.
Hellier, M., Boers, P. and Lambert, G.A. (1990) Fabrication
of a metal-cored multi-barreled microiontophoresis assem- bly. J. Neurosci. Methods, 32: 55-61.
Hicks, T.P. (1984) The history and development of microion- tophoresis in experimental neurobiology. Prog. Neurobiol., 22: 185-240.
Holdefer, R.N., Norton, T.T. and Godwin, D,W. H989) Ef- fects of bicuculline on signal detectability in lateral genicu- late taucleus relay cells, Brain Res., 488: 341-347.
Kaplan, E. and Shapley, R.M. (1984) The origin of the S (slow) potential in the mammalian lateral geniculate nu- cleus. Exp. Brain Res., 55: 111-116.
Kaplan, E., Purpura, K. and Shapley, R.M. (1987) Contrast affects the transmission of visual information through the mammalian lateral geniculate nucleus. J. Physiol. (Lond.), 391: 267-288.
Mastronarde, D.N. (1987) Two classes of single-input X-cells in cat lateral geniculate nucleus. II. Retinal inputs and the generation of receptive-field properties. J. Neurophysiol., 57: 381-413.
Mastronarde, D.N. (1992) Non-lagged relay cells and in- terneurons in the cat lateral geniculate nucleus: receptive field properties and retinal inputs. Visual Neurosci., 8: 407-441.
McCormick, D.A. and Feeser, H.R. (1990) Functional impli- cations of burst firing and single spike activity in lateral geniculate relay neurons. Neuroscience, 39: 103-113.
McCormick, D.A. and Pape, H.C. (1988) Acetylcholine in- hibits identified interneurons in the cat lateral geniculate nucleus. Nature, 334: 246-248.
McCormick, D.A. and Prince, D.A. (1986) Acetylcholine in- duces burst firing in thalamic reticular neurons by activat- ing a potassium conductance. Nature, 319: 402-405:
Mcllwain, J.T. and Creutzfeldt, O.T. (1967) Microetectrode study of synaptic excitation and inhibition in the lateral geniculate nucleus of the cat. J. Neurophysiot., 30: 1-21.
Merrill, E.G. and Ainsworth, A. (1972) Glass-coated plat- inum-plated metal microelectrodes. Med. BioL Eng., 10: 662-672.
Norton, T.T. and Godwin, D.W. (1992) Inhibitory GABAergic control of visual signals at the lateral geniculate nucleus. In: R.R. Mize, R. Marc and A. Sillito (Eds.), GABA in the Retina and Central Visual System, Prog. Brain Res., Vol. 90, Elsevier, Amsterdam, pp. 193-217.
Norton, T.T., Holdefer, R.N. and Godwin, D.W. (1989) Ef- fects of bicuculline on receptive field center sensitivity of relay cells in the lateral geniculate nucleus. Brain Res., 488: 348-352.
Sanderson, K.J. (1971) The projection of the visual field to the lateral geniculate and medial interlaminar nuclei in the cat. J. Comp. Neurol., 143: 101-118.
Sherman, S.M. and Koch, C. (1986) The control of retino- geniculate transmission in the mammalian lateral genicu- late nucleus. Exp. Brain Res., 63: 1-20.
Sherman, S.M. and Koch, C. (199t) Thalamus. In: G.M. Shepherd (Ed.), The Synaptic Organization of.the Brain, Oxford University Press, New York, pp. 246-27&
Sillito, A.M. and Kemp, J.A. (1983) The influence of

GABAergic inhibitory processes on the receptive field structure of X and Y cells in cat dorsolateral geniculate nucleus (dLGN). Brain Res., 280: 299-307.
Steriade, M., Jones, E.G. and Llinas, R.R. (1990) Thalamic Oscillations and Signalling. Wiley, New York.
Smith, E.L., 1II, Chino, Y.M., Ridder, W.H., III, Kitagawa, K. and Langston, A. (1990) Orientation bias of neurons in the lateral geniculate nucleus of macaque monkeys. Visual Neurosci., 5: 525-545.
Uhlrich, D.J., Tamamaki, N. and Sherman, S.M. (1990) Brain- stem control of response modes in neurons of the cat's
223
lateral geniculate nucleus. Proc. Natl. Acad. Sci. USA, 87: 2560-2563.
Wang, C., Cleland, B.G. and Burke, W. (1985) Synaptic delay in the lateral geniculate nucleus of the cat. Brain Res., 343: 236-245.
Wilson, J.R. (1993) Circuitry in the dorsal lateral geniculate nucleus in the cat and monkey. Acta Anat. (Basel), 147: 1-13.
W6rg6tter, F. and Eysel, U.Th. (1988) A simple glass-coated, fire-polished electrode with conductance adjustment using hydrofluoridic acid. J. Neurosci. Methods, 25: 135-138.