a tutorial on quality function deployment
TRANSCRIPT
24 Engineering Management Journal Vol. 5 No, 3 September 1993
A TUTORIAL ON QUALITY FUNCTION DEPLOYMENTA. Terry Bahill, University of Arizona, and William L, Chapman, Hughes Aircraft Co.
ABSTRACTQuality function deployment (QFD) helps to introduce theidea of quality in early phases of the design cycle and toreevaluate quality considerations throughout the system'sentire life cycle. This article presents a tutorial example ofusing QFD to design a product. It shows which qualitycontrols in the manufacturing process are most importantto ensure customer satisfaction,
IntroductionOver the past 40 years, the Japanese have developed manytechniques for improving quality in manufacturing process-es. One of these, quality function deployment (QFD), isbecoming very popular in both Japan and the United States.QFD started in Japan in the late 1960s and is now used byover half of Japan's major companies. It was introducedin American automobile manufacturing companies in theearly 1980s; now many of our major corporations are usingit, including John Deere, Ford, Chrysler, General Motors,Hughes Aircraft, Boeing, McDonnell Douglas, MartinMarietta, Texas Instruments, Hewlett Packard, Westing-house, and 3M, QFD is the jewel of the collection of toolsnow being called total quality management (TQM).
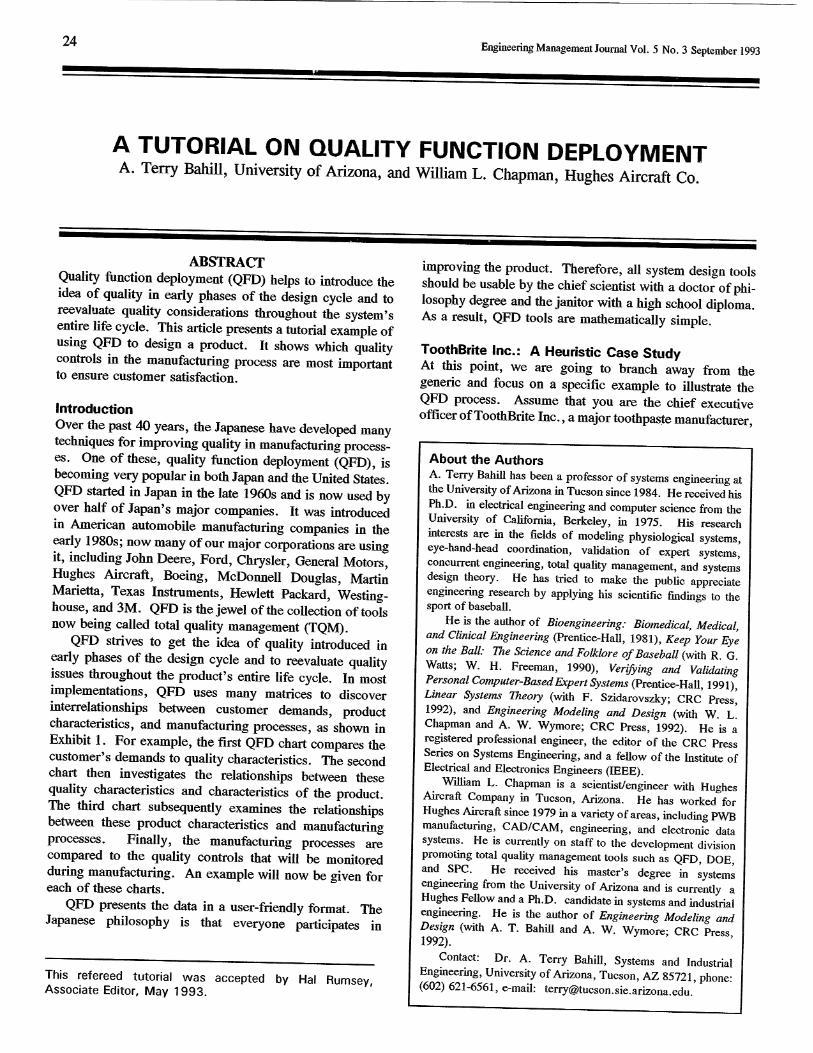
QFD strives to get the idea of quality introduced inearly phases of the design cycle and to reevaluate qualityissues throughout the product's entire life cycle. In mostimplementations, QFD uses many matrices to discoverinterrelationships between customer demands, productcharacteristics, and manufacturing processes, as shown inExhibit 1. For example, the first QFD chart compares thecustomer's demands to quality characteristics. The secondchart then investigates the relationships between thesequality characteristics and characteristics of the product.The third chart subsequently examines the relationshipsbetween these product characteristics and manufacturingprocesses. Finally, the manufacturing processes arecompared to the quality controls that will be monitoredduring manufacturing. An example will now be given foreach of these charts.
QFD presents the data in a user-friendly format. TheJapanese philosophy is that everyone participates in
This refereed tutorial was accepted by Ha! Rumsey,Associate Editor, May 1993.
improving the product. Therefore, all system design toolsshould be usable by the chief scientist with a doctor of phi-losophy degree and the janitor with a high school diploma.As a result, QFD tools are mathematically simple.
ToothBrite Inc.: A Heuristic Case StudyAt this point, we are going to branch away from thegeneric and focus on a specific example to illustrate theQFD process. Assume that you are the chief executiveofficer of ToothBrite Inc,, a major toothpaste manufacturer,
About the AuthorsA. Terry Bahill has been a professor of systems engineering atthe University of Arizona in Tucson since 1984. He received hisPh.D. in electrical engineering and computer science from theUniversity of California, Berkeley, in 1975. His researchinterests are in the fields of modeling physiological systems,eye-hand-head coordination, validation of expert systems,concurrent engineering, total quality management, and systemsdesign theory. He has tried to make the public appreciateengineering research by applying his scientific findings to thesport of baseball.
He is the author of Bioengineering: Biomedical, Medical,and Clinical Engineering (Prentice-Hall, 1981), Keep Your Eyeon the Ball: The Science and Folklore of Baseball (with R. G.Watts; W. H. Freeman, 1990), Verifying and ValidatingPersonal Computer-Based Expert Systems (Prentice-Hall, 1991),Linear Systems Theory (with F. Szidarovszky; CRC Press,1992), and Engineering Modeling and Design (with W. L.Chapman and A. W, Wymore; CRC Press, 1992). He is aregistered professional engineer, the editor of the CRC PressSeries on Systems Engineering, and a fellow of the Institute ofElectrical and Electronics Engineers (IEEE).
William L. Chapman is a scientist/engineer with HughesAircraft Company in Tucson, Arizona. He has worked forHughes Aircraft since 1979 in a variety of areas, including PWBmanufacturing, CAD/CAM, engineering, and electronic datasystems. He is currently on staff to the development divisionpromoting total quality management tools such as QFD, DOE,and SPC. He received his master's degree in systemsengineering from the University of Arizona and is currently aHughes Fellow and a Ph.D. candidate in systems and industrialengineering, He is the author of Engineering Modeling andDesign (with A. T. Bahill and A. W, Wymore; CRC Press,1992).
Contact: Dr. A. Terry Bahill, Systems and IndustrialEngineering, University of Arizona, Tucson, AZ 85721, phone:(602) 621-6561, e-mail: [email protected].
Engineering Management Journal VoL 5 No. 3 September 1993 25
Qualitycharacteristics
g-8§§•
Productcharacteristics
o o=3 O
11a. o
Manufacturingprocesses
=f 0>
«S
Qualitycontrols
Exhibit 1. The QFD waterfall chart.
and your market share has suddenly dropped. You suspectthis is the result of your competitor's new innovation.Crest® has developed a new toothpaste container called theNeat Squeeze dispenser and has endowed it with a substan-tial advertising budget. (To understand this example better,you might want to cut open a Crest Neat Squeeze dispenserand see what is inside.) The function of Colgate®'s newStand-Up Tube is similar. To recapture your market share,you decide to redesign your product. Therefore, you plana QFD analysis of your product. To begin with, you mustfind out what your customers want. Our MarketingDepartment asked all people who should provide input forthe system design what they thought was important. In theQFD literature, the aspects deemed important by thecustomer are variously called demands, wants, expecta-tions, requirements, and needs. We will use only the termcustomer demands. Based on customer surveys, wederived the following customer demands:
Customer Demands:
NeatnessTidy Tip—The tip stays clean and neat.Retains Shape—The container retains its original shape.Stays Put—The container does not roll off the counter.
Hygienic—Toothpaste that touched the brush cannot bedrawn back into container.
Squeezable—People want to squeeze the container, they donot want a pump.
Easy Open—The cap opens and closes easily.
No Waste—Almost all the toothpastecomes out but not all over the bath-room.
Small Footprint—Container takes uplittle counter space.
Reasonable Cost—It should cost aboutthe same as present containers.
Attractive Container—The Sales Depart-ment says it must look good.
By attractive container we mean that ismust look good on the shelf in the storeand also on the counter in the bathroom.Perhaps we should have divided this upinto two customer demands, but we didnot. It is easy to continually secondguess the categories. We advise thatyou review them once and move on.You can always go back and changethings later.
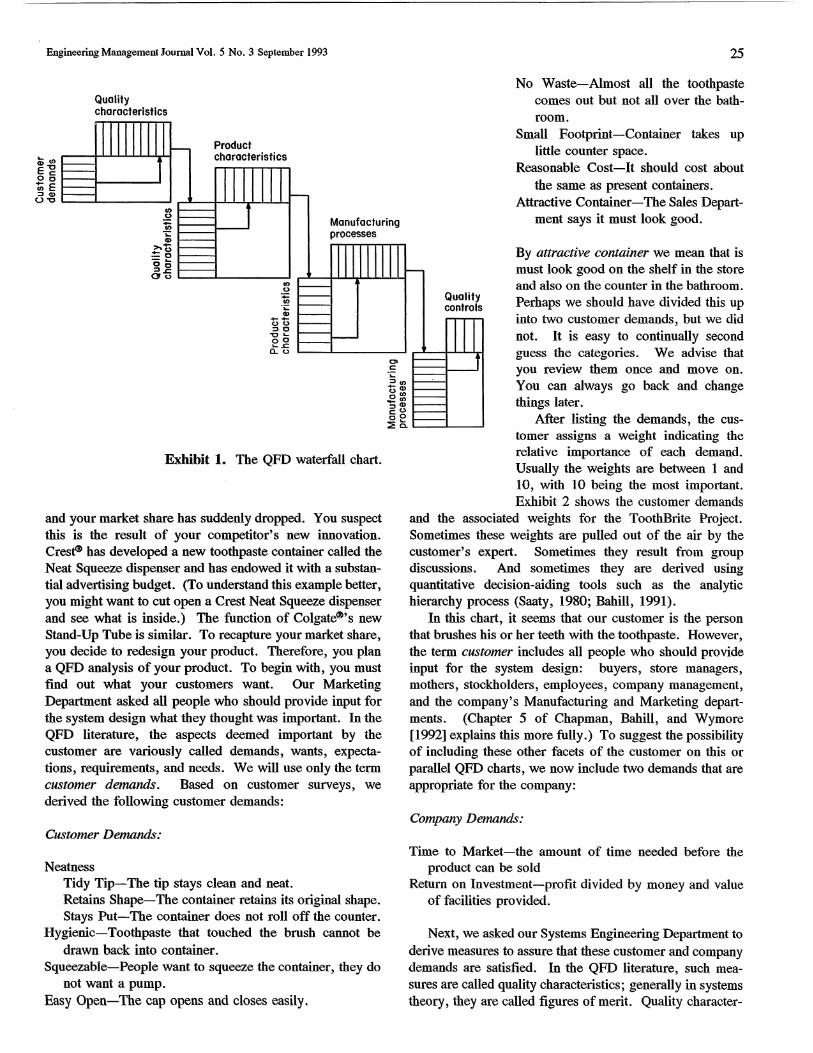
After listing the demands, the cus-tomer assigns a weight indicating therelative importance of each demand.Usually the weights are between 1 and10, with 10 being the most important.Exhibit 2 shows the customer demands
and the associated weights for the ToothBrite Project.Sometimes these weights are pulled out of the air by thecustomer's expert. Sometimes they result from groupdiscussions. And sometimes they are derived usingquantitative decision-aiding tools such as the analytichierarchy process (Saaty, 1980; Bahill, 1991).
In this chart, it seems that our customer is the personthat brushes his or her teeth with the toothpaste. However,the term customer includes all people who should provideinput for the system design: buyers, store managers,mothers, stockholders, employees, company management,and the company's Manufacturing and Marketing depart-ments. (Chapter 5 of Chapman, Bahill, and Wymore[1992] explains this more fully.) To suggest the possibilityof including these other facets of the customer on this orparallel QFD charts, we now include two demands that areappropriate for the company:
Company Demands:
Time to Market—the amount of time needed before theproduct can be sold
Return on Investment—profit divided by money and valueof facilities provided.
Next, we asked our Systems Engineering Department toderive measures to assure that these customer and companydemands are satisfied. In the QFD literature, such mea-sures are called quality characteristics; generally in systemstheory, they are called figures of merit. Quality character-
26 Engineering Management Journal Vol. 5 No. 3 September 1993
CustomerNeatnessTidy TipRetains ShapeStays Put
HygienicSqueezableEasy OpenNo WasteSmall FootprintReasonable CostAttractive Container
CompanyTime to MarketReturn on Investment
0
0
CDoc
0Q_E
1044746
659
8
59
Exhibit 2, Customer demands with their associatedweights,
isties should be quantitative and measurable. These are thequality characteristics for the ToothBrite Project:
Quality Characteristics:
Mess—amount of toothpaste scraped off tip when halfempty
Pull-Back—amount of toothpaste pulled back when donedispensing
Pressure—pressure needed to get the toothpaste outEffort—number of turns or time or effort needed to remove
capWaste—amount of toothpaste left in container at end of life
cycleCounter Space—amount of counter space occupied by
containerDeformation—amount of change in shape of container
when half emptyPleasing Appearance—based on customer survey resultsCost to Produce—cost to manufacture the productSelling Price—sales price for one itemTime to Develop—time needed to develop the product.
In general, QFD charts have something listed on the leftand something listed along the top, as shown in Exhibit 3.The things listed on the left are called the Whats and thethings listed along the top are called the Hows. To helpdetermine the Hows we ask, "This is what the customerwants, now how can we measure it?"
The next step in a QFD analysis is determining thestrength of the relationships (or the degree of correlation)between the Whats and the Hows. This is done by fillingin the central matrix as shown in Exhibit 3. Each elementof the Whats is compared to each element of the Hows.Four classifications are given. If they are strongly related,a value of 9, or a black disk with a white dot inside, isrecorded in the appropriate cell. Moderate relationshipsare given a 3, or a circle. Weak relationships are given a1, or a triangle. No relationship is given a 0, or the cell isleft blank. The logarithmic 9-3-1 weighting was created bythe Japanese and has been adopted by most QFD users.These correlations are sometimes represented with symbolsand sometimes with numbers. In fact, sometimes we useboth in the same chart, as in Exhibit 3. You should usewhatever will make your customers most comfortable.Different symbols may even be used, because the foremostprinciple of QFD is "copy the spirit, not the form" (Akao,1990), Each relationship can be either positive or negative.We want to know whether each customer demand can bemeasured by a quality characteristic, not whether it showsa positive or a negative relationship. If any row of thismatrix is blank, then we cannot assure satisfaction of thatcustomer demand; that demand, therefore, should either beeliminated or another quality characteristic should beadded. Usually numerous customer demands are generatedinitially. And then, to save work, the least important onesare deleted. However, the deleted items should be record-ed to assure future designers that these customer demandswere indeed considered.
The next step is multiplying each cell's value by theweight of the customer demand and totaling the column foreach quality characteristic. This is shown in the rowlabeled "Score" in Exhibit 4. The total score for eachcolumn indicates the importance of that characteristic inmeasuring the customer's satisfaction. Typically measureswith low scores receive little consideration. However, thisdoes not necessarily mean that they will not be used in theproduct design: They may still be necessary for contractu-al or other reasons. To satisfy the customer, we must paystrict attention to the measures with the highest scores.This attention to the customer is the main purpose of theQFD chart. The chart and its results are not as importantas the process of concentrating on the "voice of thecustomer" rather than the "voice of the manufacturer." Forthe ToothBrite Project, the cost to produce (with a score of256) and the selling price (with a score of 249) were themost important measures.

Engineering Management Journal Vol. 5 No. 3 September 1993 27
WHATs vs. HOWs
Strong Relationship: • 9Medium Relationship: O 3Weak Relationship: & 1
CustomerNeatnessTidy TipRetains ShapeStays Put
HygienicSqueezableEasy OpenNo WasteSmall FootprintReasonable CostAttractive Container
CompanyTime to MarketReturn on Investment
&&0)
0
i Am
ount
*
A
AO
0
_*:003-Q
t
"5CL
0
Am
ount
0
0
&
f Pre
ssur
e |
0
Am
ount
A
0
0
tr£LU
0
Am
ount
*
5t/503
0
cZ50
<
A
A
A
«
CD003CL
CO
Cou
nte
00
«
A
of D
efor
mat
ion
|
c130
<
0
0
0
AA
0
Ple
asin
g A
ppea
ranc
e |
5A
A0
A
Cos
t to
Pro
duce
]
*A
*A0
OA
O0
CD.2CL05
~QCO
«
«
O0
Tim
e to
Dev
elop
0
0
0
Q
CDO
i0CL
1044
7
466
59
8
59
Exhibit 3. The first QFD chart—customer demands versus quality characteristics.
The Roof and Porch of the House of Quality. Inaddition to the relationships between the Whats and theHows, Exhibit 5 also shows interrelationships between theHows in the top triangle. When this top triangle is added,the QFD chart begins to resemble a house, hence the nameHouse of Quality, The top triangle is called the "roof,"There are five possible relationships between the Hows:strong positive (indicated with a black disk with a white dotinside or -h9); weak positive (indicated with a circle orH-3); none (a blank square or 0); weak negative (indicatedwith an X or -3); and strong negative (indicated with # or-9), Relationships between the Hows help to identifycorrelations between the quality measures. For example,the amount of mess is strongly related to pleasing appear-ance. As one measure increases, the other decreases,
The "porch" (the leftmost triangle) of our House ofQuality shows correlations between customer demands.We use the same symbols as for the correlations in theroof: a black disk with a white dot, a circle, a blanksquare, an X, and a #. Because the porch is original wewill now discuss it in detail.
Principles of psychology suggest that humans under-stand properties best if they are stated in a positive mannerand if properties are chosen so that "more is better" or thatan "optimum is desired." One customer demand, no waste,
in Exhibit 5's House of Quality is defined in a negativemanner. As a result, the porch (the leftmost triangle)shows a positive correlation between tidy tip and no waste,because if we leave less toothpaste on the tip then we willwaste less toothpaste, which means that no waste becomesbigger. Such use of a negative term might make it hard tofollow logic like this. We used no waste instead of amountof waste, because in this case we thought that the "more isbetter" dictum was more important.
Negative correlations in the porch are important,because they point out conflicting customer demands thatwill make optimization difficult or perhaps make modelvalidation impossible. For example, stays put and smallfootprint have a strong negative correlation. (A pencilbalanced on its tip takes up very little counter space, but itis not likely to stay put for long.) Therefore we shouldworry about trade-offs between these two demands. Thereare no other strong negative correlations, so we do nothave to trade off any other customer demands.
A valuable principle in studying correlations is "Do notanalyze your customer's problems based on preconceivednotions about the solution." For example, the first time wefilled out the chart of Exhibit 4, we were thinking about theCrest Neat Squeeze dispenser, so we put a blank in the cellcorrelating retains shape with small footprint. However,

28 Engineering Management Journal Vol. 5 No. 3 September 1993
WHATs vs. HOWs
Strong Relationship: • 9Medium Relationship: O 3Weak Relationship: A 1
CustomerNeatnessTidy TipRetains ShapeStays Put
HygienicSqueezableEasy OpenNo WasteSmall FootprintReasonable CostAttractive Container
CompanyTime to MarketReturn on Investment
Score
Rank
C/)tOCD
^B
| A
mou
nt
*
A
A
0
O
LO^t
co
_*:003
_Q
"5Du15
Am
ou
nt
0
0
A
CDCD
LO
of P
ress
ure
|A
mou
nt
A
0
0
COLO
O
troS•5
Am
ount
e
m
-
-2to03
15a_30E<
A
A
A
«
egr-
CO
CD003CL
CD
CD•t— *c13OO
OO
«
A
h-h-
r^
of D
efor
mat
ion
|
c13OE<
«
0
O
AA
0
LOCD
CD
Ple
asin
g A
ppea
ranc
e |
5A
A
•
A
0^r
ni-
cest
to
Pro
duce
|
»A
«
A
O
0A
O0
CDLOCM
-
CD0
"v_Q_0)c
CD0)
«
0
O
*CD•^fCM
CM
Q.OCD
c5Q
5CDEi-
0O
CMr-
COIm
port
ance
(1 t
o 1
0)
I
104
47466
598
59
Exhibit 4. The first QFD chart with the addition of calculated scores.
one of our students pointed out that we were confoundingour preconceived notion of the solution with the statementof the problem. If we thought about alternative solutions,we would realize that retains shape should be negativelycorrelated with small footprint with regard to counterspace.
In assessing correlations, avoid tertiary links. Forexample, attractive container is correlated with retainsshape, and retains shape is correlated with small footprint,However, the link between attractive container and smallfootprint is only a tertiary link, so for this square in theporch of Exhibit 5 we were careful to indicate no correla-tion.
Analyzing correlations in the porch of the house canhelp organize the Whats into appropriate subcategories.
Whats that have similar correlations with the other Whatsshould be grouped together. For example, because wethought they were related, we initially grouped the threecustomer demands tidy tip, retains shape, and stays put intoone customer demand category, called neatness. However,after looking at the porch of the QFD chart we see thatthey are independent. Therefore they should not besubcategories, but should be moved up to the main level.However the customer demands hygienic and tidy tip arestrongly correlated and their rows are similar. Thereforethey seem to be dependent and could be made subcatego-ries. No other rows are similar, so all the other customerdemands seem to be independent. To further illustrate theneed to use the porch to help group similar entries, let usconsider a new example.

Engineering Management Journal Vol. 5 No. 3 September 1993 29
WHATS vs. WHATS and HOWs vs. HOWs
Strong Positive: O 9Weak Positive: O 3Weak Negative: x -3Strong Negative: & -9
WHATs vs. HOWs
Strong Relationship: • 9Medium Relationship: O 3Weak Relationship: A 1
CustomerNeatnessTidy TipRetains ShapeStays Put
HygienicSqueezableEasy OpenNo WasteSmall FootprintReasonable CostAttractive Container
CompanyTime to MarketReturn on Investment
Score
Rank
A.
COCOCD
O
coE
•
A
A
O
O
LO
CO
0y\
CCS.0
"5Q_
0
cIDOE
0
0
A
CD
LO
f Pre
ssur
e X
)*
oc13OE
A
9
O
COLO
o
n
tro£0
Am
ount
O
LO
^1
a
CD
cd
o
Am
ount
A
A
A
•
CM
00
1
CD0COQ_
CD
"E130O
00
p
A
fc
^
of D
efor
mat
ion
^^
c13OE
«
0
0
A
A
0
LOCD
CD
n
CDO
103CDQ_Q_
O).EcocdCDLX
5
A
A
0
A
0
*
| C
ost to
Pro
duce
X
>
0A
0
A
O
0
A
0
O
CDmCJ
-
n
1ol0)
"CDCD
0
*
00
CD
CM
CM
X
Q.OCD
Q
O•*-*
CD
F
00
CM
CO
Impo
rtan
ce (
1 to
10)
1
10447466598
59
Customer Demands versus Quality Characteristics
Exhibit 5. The foil House of Quality,
Our ToothBrite example shows how QFD can be usedto help design a product or process. QFD can also be usedto help select the best alternative concept, as suggestedwith the following example. Suppose a young couplewants to buy a new car. The man says his most importantdemand is horse power, and the woman says her mostimportant demand is gas mileage. Although these areconflicting demands with a negative correlation, there is noproblem. Their decision of what car to buy will probably
be based on a trade-off between these two criteria. Now,however, assume there is another couple where the womansays her most important demand is safety (as measured bysafety claims in advertisements), but the man says his mostimportant demands are lots of horse power, lots of torque,low time to accelerate 0 to 60 mph, low time to accelerate0 to 100 mph, low time for the standing quarter mile, largeengine size (in liters), and many cylinders. Assume theman agrees that the woman's demands are more important
30 Engineering Management Journal Vol. 5 No, 3 September 1993
than his, so they decide to weight safety the heaviest: Theygive it the maximum importance value of 10. The manconcedes that his demands are not as important as hers, sothey only give his demands importance values of 3 and 4.What kind of a car do you think they will buy? In summa-ry, dependent entries should be combined. However,similar, but independent, entries ought to be made intosubcategories and grouped together.
Every QFD chart could have two triangular correlationmatrices attached; we have called these the porch and theroof. They alert the system designer to interactions thathave different consequences depending on the particularQFD chart. Consider a correlation matrix where thesystem components are listed. If a system is to be assem-bled from components made by different people, divisions,or companies, it is important to know which componentsaffect which other components. Thus if one divisionchanges the component they are building, they can notifythe other divisions that will be affected by the change. In
addition, these correlations can be used to determineinteractions when doing sensitivity analyses.
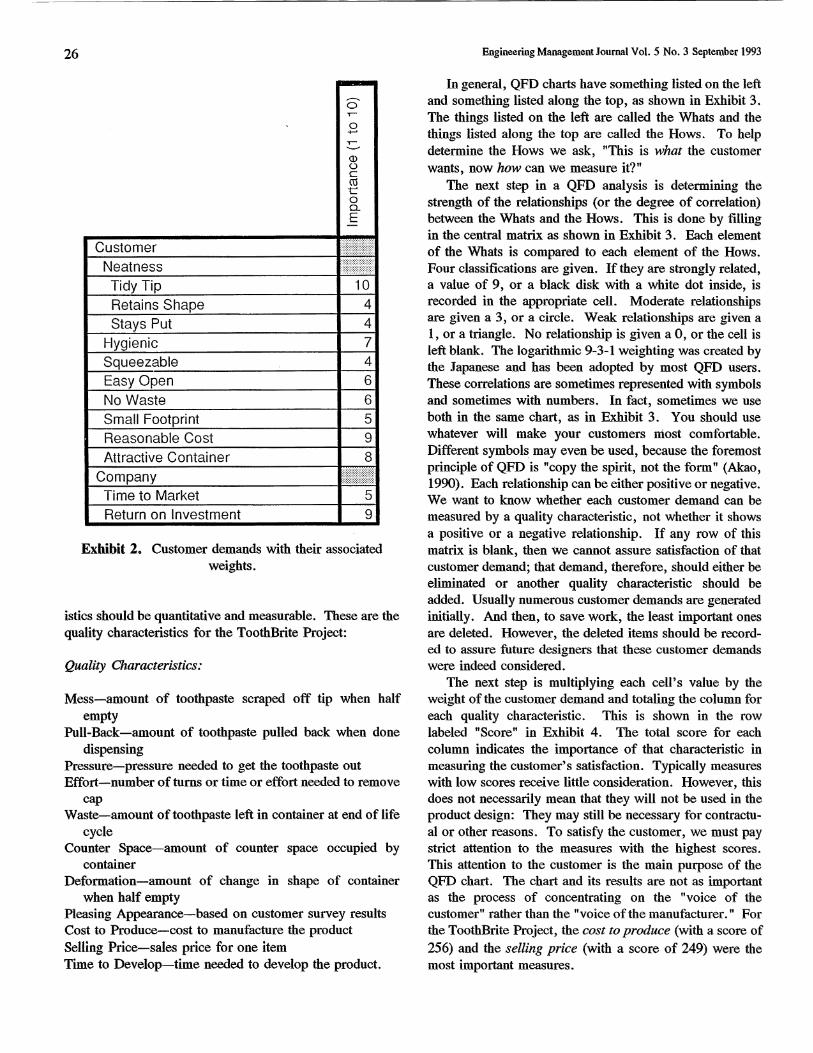
Subsequent QFD Charts. To continue our QFD analysis,we will relate the quality characteristics of Exhibit 5 tocharacteristics of the product. One purpose of a QFDanalysis is to investigate alternative designs. However, asthe analysis progresses, we must limit the number ofalternatives under consideration. The characteristics of theproduct will be different for each alternative design. If wewish to continue investigating alternative designs, we mighthave to create a second QFD chart for each. The follow-ing product characteristics, provided by the Design Engi-neering Department, seem to imply a suction type of tube:
Product Characteristics:
Double Lead Threads on Cap and Tip—this allows capremoval with one-half turn
WHATs vs. HOWs
Strong Relationship: • 9Medium Relationship: O 3Weak Relationship: A 1
Amount of MessAmount of Pull-backAmount of PressureAmount of EffortAmount of WasteCounter SpaceAmount of DeformationPleasing AppearanceCost to ProduceSelling PriceTime to Develop
Score
RankQuality Characteristics versus Product
Exhibit 6* The second QFD chart— quality
T305Pf—Ho03CD_J
_CD_Q
^30Q
0
COCO
^
0
Charact
Q.
j—
C
oX
"oCDN
CO
A
O
0
A
O
A
COO)
CO
COCO0)c.*:
JCh-1$'%_CD03:>A
O
O
A
A
A
A
COCOC\
-
CDo
H*
CD03
^
O0
•AO
•A
•O
O
o00COCO
-
oCL
CO03Q
15CDN
CO
O
O
A
A
A
CD0CO
CD
OCLr~CO03Q
15>>
"coo0CO
>
0
•o
A
O
A
O
COLO
co
CO
i_CDcfT5
-i— »C
O
'o
£
CD
<:
0
A
CO""sT
CD
\O*C"m•*->c:o0
*oQ)N
CO
O0A
0
0A
i-^r-C\
LO
CD_Q03
1
OD)C
•-j—
Q_
A
•00A
xfrCMCDC\
^
\__CDCiU
-«— •cn015CDQ_
O3r*
CO
A
0
AO0
0
O
r^LO
CM
CO
CD
^
145.099.058.054.072.077.095.0
140.0256.0249,0
72.0
eristics
characteristics versus product characteristics.
II•D0CLQ!
CZ31£0
SICD '
•wl~"ito
CD
C
CD
5,
§2.
CQ
S
(D
£in
"n£>
21
657843
rn0O8
116240151515
338813701816638
68669075293702
enzrDCD
2»oo
£?.ZJ
•"J
0000
00
01•xlo
m
5"enoZJ
JU
sr
0ro(D
4^k0
rn
N*CD
2,o0
S"ZJ(D
0
D>
O
0
0ro&£*
0
*~CD.
zroO0
5"3CD
0
o
4^CO
o
c/5"80)
x;
2,oto"DO
•00
o
GO
GO
0
f/V
N*<D !O,
O030)zrT>0
0
O
o
GOOCD0
03(D
~~~H*<0
O
0!O
o
00
O0)GO(JOO0
J5>»
03
?S"Hzro*7TZJCD
W
•
O
ro(X)000
m
B'a~fo®
H
000
0
to00
0
ocrCDr-CD
a— izrfljWn
•e0
C^
D*
00CD0
JDQ.O
CQ
Sol°"BO*wopZTZJ to
-=-c/>zr^5ra'
o
OO0-^GOCD
S>
to
z:0
t?
Molding Process (Cap,Body,Bottom)Create MoldBlow MaterialRemove Container
Insert and Bond LinerInserting ToothpasteScrewing on TopUltrasonic Weld BottomPasting or Printing Label
Weights
^ ^ s» ^ csrt-f
S *s*§1O » CP
:' &
tit§.=•&!•;Cl>
8 f
IsB B5 |
<B. Ert <6 §•a S
& 5
en
I
S S
32 Engineering Management Journal Vol. S No. 3 September 1993
l\
1c
IF
c
F
WHATs vs. HOWs
Strong Relationship: • 9Medium Relationship: O 3Weak Relationship: A 1
folding Process (Cap,Body, Bottom)Create MoldBlow MaterialRemove Container
nsert and Bond Linernserting ToothpasteScrewing on TopJltrasonic Weld BottomCasting or Printing Label
Score
3ank
co£2.g
"cocCD
Ebu0
*OA
A
0
|S
COCD
rr>
T
C\
CO
0
"r00
"S
CD
"cdCDQ.
CD
O
0
inCOCDCO
COT —
-
CD
:5COCO
ol
O
oLO
inin^
CD
CD
EI-
O
0
LO
LO
LO
CD
C0
ts0)CLCOC
"rCD
E
1
CD
"Jj
0
0
C\CO
COCOCO
co
CD
1oLL
hPas
te
0o
•
0
CM
fs^CD
T—
-
CD— CT0
L.CD
O
Q.OSO
0
0"•sf
O)Is-T —cu
CM
&u"EoOC3)
CD
5
"coC
A
O
0
T^fj-s^
CMCD0CO
CD
Co
Q
0
0
COLOCMCM
CM
0
CD
1CL
A
0
0
COCO
COLOco
CO
CD33COCO
CL
0)
.Qcd
0
0
00
COCO
GO
*
CO
0
00CDCCD01
X
c05
nlin
ess
O3CD
O
A
A
•OAA
0LO., —CD
0LO
LO
fiCD
1 1 6240.0151515.0
33881.037018.016638.0
6866.090752.093702.0
Manufacturing Processes versus Quality Controls
Exhibit 8. The fourth QFD chart—manufacturing processes versus quality controls.
our ToothBrite Project, these scores indicate that thetype of material used for the sides of the container isthe most important product characteristic. This is animportant finding that was not obvious at the outset.
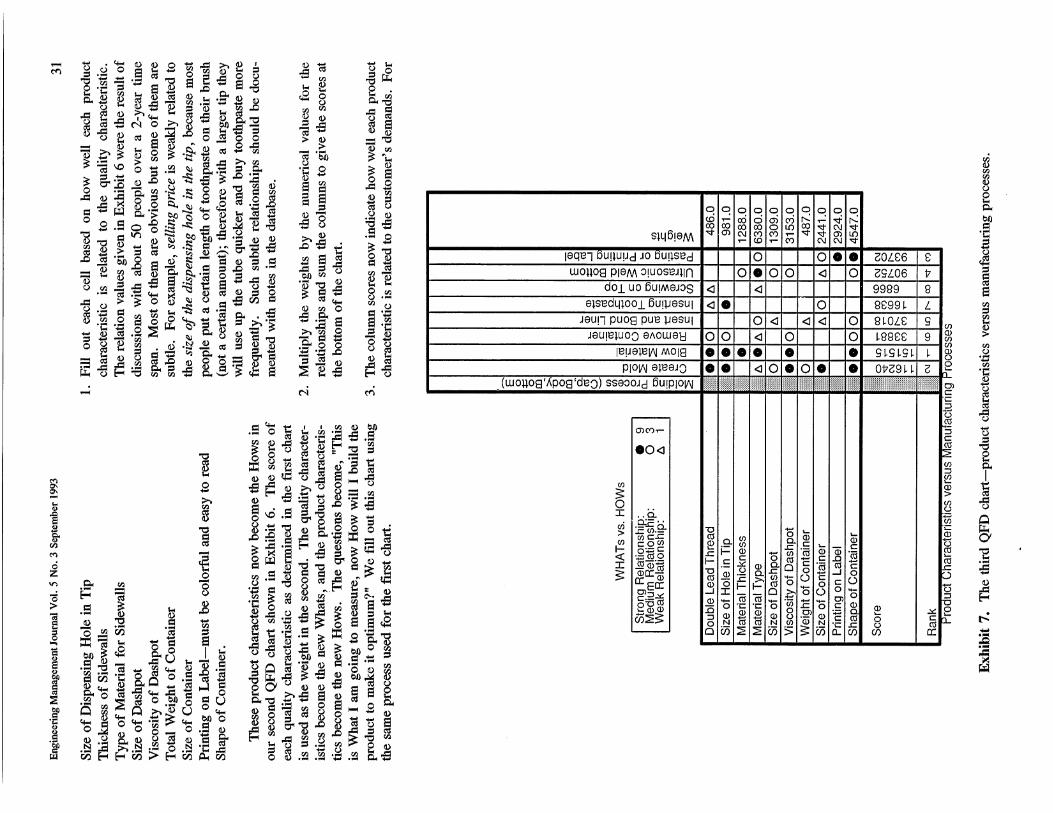
The third QFD chart, shown in Exhibit 7, compares theproduct characteristics to manufacturing processes providedby the Manufacturing Department.
Manufacturing Processes:
Molding Process (Cap, Body, and Bottom)—Assume ablow molding process.Create MoldBlow Material—Assume use of polycarbonate material.Remove Container
Insert and Bond Liner—The liner is the bag that holds thetoothpaste.
Insert ToothpasteScrew on CapUltrasonic Weld—Assume bottom is attached to sides by
ultrasonic welding.Paste or Print Label—Minimizing extraneous packaging is
an important consideration.
These manufacturing processes are listed in the approxi-mate order in which they are done. From the scores andranks at the bottom of this chart, we can see that blowingthe material into the mold is the most important manufac-turing process. Creating the mold is the second mostimportant process.
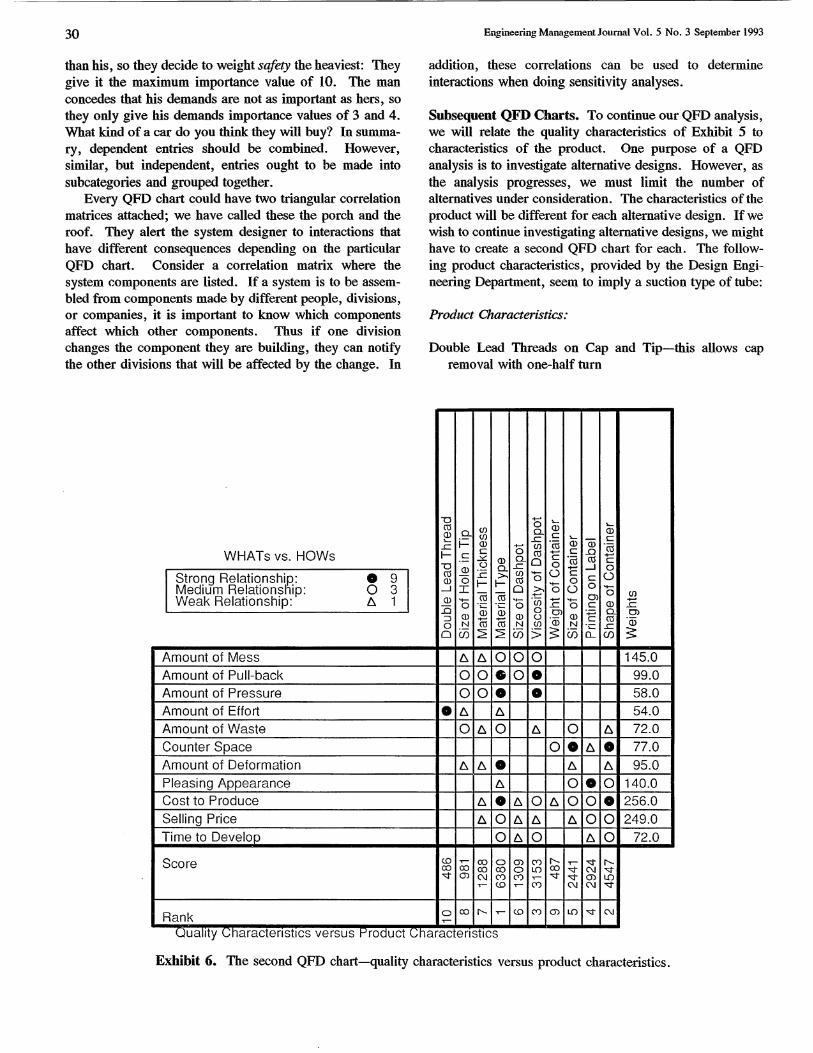
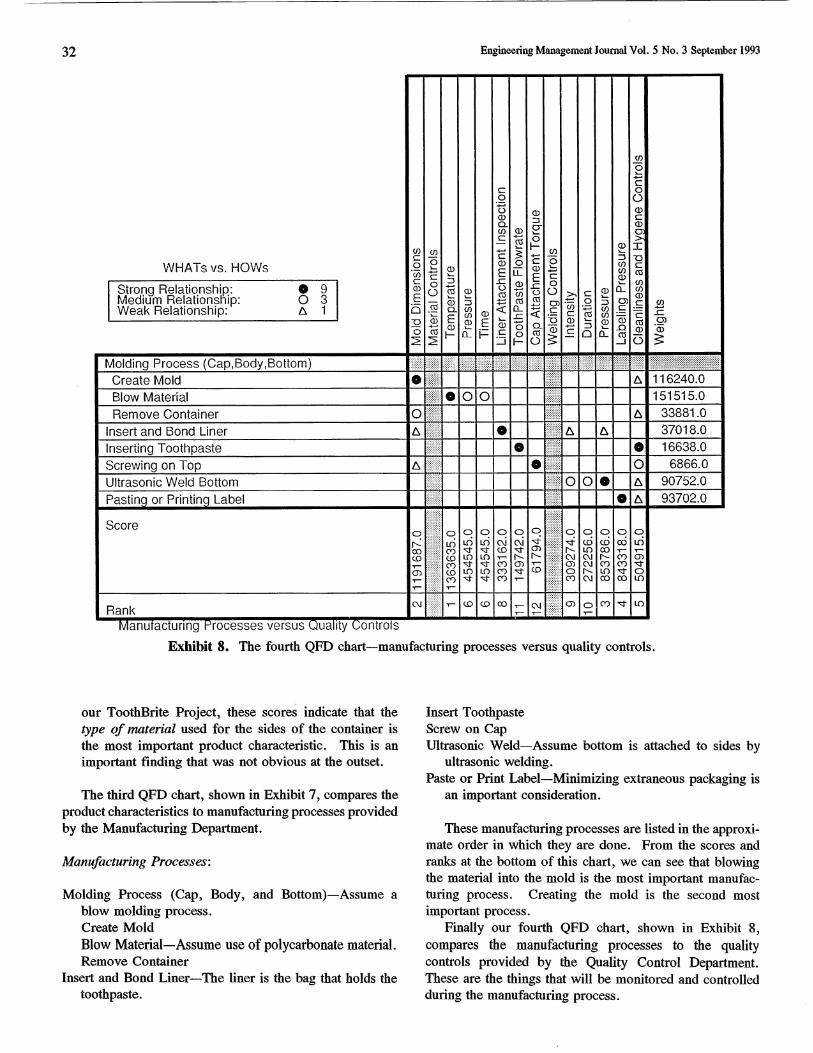
Finally our fourth QFD chart, shown in Exhibit 8,compares the manufacturing processes to the qualitycontrols provided by the Quality Control Department.These are the things that will be monitored and controlledduring the manufacturing process.
Engineering Management Journal Vol. 5 No, 3 September 1993
Quality Controls:
Mold DimensionsMaterial Controls—properties to be controlled during the
molding processTemperaturePressureTime
Liner Attachment InspectionTooth Paste Flow Rate—how fast the toothpaste is inserted
into the tubeCap Attachment TorqueWelding Controls—parameters to be controlled during
ultrasonic weldingIntensityDurationPressure
Labeling PressureCleanliness and Hygiene Controls,
For the liner attachment inspection, we assume thatsome quality control technique will be used to removesome units from the assembly line for destructive testing tomonitor assembly strength. The other tests can be madeon-line.
As we progressed through this ToothBrite Project, theQFD charts became more and more specific. This fourthQFD chart is specific to the particular alternative, materi-als, and manufacturing process chosen. This last chart tellsus that in order to satisfy the customer, we should pay veryspecial attention to the material temperature and the molddimensions during manufacturing. This may not have beenobvious to the manufacturing engineers before this QFDanalysis.
Our QFD analysis is now complete. Throughout theentire design and production cycle, the QFD charts havebeen used to ensure that the customer's concerns wereaddressed, The chief responsibility of engineering manage-ment is to allocate scarce human and financial resources toensure that these customer needs are met. The first chartshows that the cost to produce, the selling price, and theamount of mess should be the chief concerns for thedesigners. The second chart shows that the type of materi-al, the shape of the container, and the viscosity of thedashpot are the most important product characteristics; themanager should allocate talent and money to trade-offstudies on these product characteristics. On the third chart,the manufacturing processes of importance are blowing thematerial into the mold, creating the mold, and pasting orprinting the label. The manufacturing manager now knowswhich processes to develop and spend capital on. The finalmatrix shows that the material temperature, the molddimensions, and the ultrasonic welding pressure are thecritical quality controls and deserve special experimentationand investment to ensure a quality product.
33
GeneralizationsThe phrase quality Junction deployment might imply thatthe tool is a technique for deploying good functions, butthis is misleading. That phrase is just a loose translation ofthe Japanese phrase HinShitsu KiNo TenKai. The wordHinShitsu can be translated as qualities, features, character-istics, or attributes; KiNo can be translated as function,method, or procedure; and TenKai can be translated asdeployment, allocation, flowdown, or distribution. Hencea literal translation might be quality function deployment;but we think more meaningful translations would be methodfor allocating features, or method for translating character-istics. However, throughout this article we use the stan-dard name, QFD.
The process of linking QFD charts together can contin-ue until dozens of charts have been filled out, as suggestedby the "waterfall" chart of Exhibit 1. For examples ofusing many QFD charts on one heuristic example, werecommend King (1989) and Chapman, Bahill, and Wy-more (1992). For many examples derived from realmanufacturing systems, see Akao (1990), which is arguablythe most definitive work on QFD in the English language,and the Transactions of the Symposia on Quality FunctionDeployment.
QFD can also be applied to the overall system, then toits subsystems, and then to their components. The criticalparameters should flow down from one QFD analysis to thenext. Using QFD to design real systems will involvemany, many QFD charts. Managing such a large databasewill certainly require computer assistance. Such programsare available: We used QFD/Capture (1990) and QFDplus(1991) to generate the exhibits of this article.
Creating QFD charts is a lot of work. The real produc-tivity gain comes when parts of QFD charts are reused. Ifseveral versions of the same product are being built, thenparts of earlier QFD charts can be reused in the design oflater products in the line. Similarly, if QFD charts arereused in redesigning a product, then productivity isenhanced.
The important thing to remember about QFD is that thegoal is to translate what the customer considers importantinto the product so that the customer is satisfied. Creatingmany charts or trying to optimize any chart is of littlevalue, Discovering what is important to the customer is ofgreat value. "The process of making QFD charts is moremeaningful than the final results" (Akao, 1990).
Other QFD ChartsExhibit 1 shows a temporal ordering of QFD matrices. Itwould be nice if we really could design a product in sucha straightforward manner. However, more often every-thing has to be done simultaneously. We will now try togive a flavor for many other QFD charts that have beenused. Most of them do not follow a temporal ordering.Some of the entities that have been used for the Whats andHows include customer demands, quality characteristics,
34 Engineering Management Journal Vol, 5 No. 3 September 1993
product characteristics, manufacturing processes, qualitycontrols, alternatives, functions, parts, components,mechanisms, product failure modes, part failure modes,and new concepts. With just these 13 entities, more than100 matrices could be formed. However, not all of thesematrices are useful; King (1989) explains 30 of them thatare in common use. We will now discuss eight of the mostuseful ones.
L Customer Demands Versus Quality Characteristics.This is the House of Quality of Exhibit 5. Purposes: tolearn customer priorities, to point out which customerdemands are most important, to ensure that no customerdemand is ignored, to identify key items to measure andcontrol, and to develop an initial plan of how customerdemands will be satisfied. This is the most widely usedQFD chart, Often these charts are embellished withcomparisons of the company's present product to that ofthe competition.
2. Customer Demands Versus Customer Demands, Thisis the porch of the house in Exhibit 5, although it could beconstructed as a separate chart. Purpose: to alert thesystem designers to interactions. Dependent demandsmight be eliminated, and similar but independent demandsmight be grouped into subcategories, This chart is origi-nal; it is not mentioned in the QFD literature.
3. Functions Versus Quality Characteristics. Functionsare usually written by engineers, so this chart is oftencalled "Voice of the Engineer Versus Quality Characteris-tics." Purposes: to identify functions of the product thatthe customer may not be aware of and to identify missingquality characteristics. The functions of our toothpastedispenser are store toothpaste, dispense toothpaste, cleartip, and attract attention. We made a QFD chart relatingthese functions to the quality characteristics. The storetoothpaste function pointed out a possible new qualitycharacteristic of net weight.
4. Quality Characteristics Versus Quality Characteristics.This is the roof of the house in Exhibit 5, although it isoften constructed as a separate chart. Purposes: to alertthe system designers to interactions, to tell the engineerswho else must be notified if they make a design change,and to suggest groupings of quality characteristics.
5. Quality Characteristics Versus Pans. Purpose: toidentify the parts associated with the most important qualitycharacteristics. These critical parts might be highlightedfor technological breakthroughs.
6. Customer Demands Versus Functions. This chart couldalso be called "Voice of the Customer Versus Voice of theEngineer." Purposes: to validate customer demands, to
identify functions that should be the target of cost reduc-tions, to identify conflicts between the Voice of theCustomer and the Voice of the Engineer, and to search forlatent demands that were not verbalized. For example, thefact that no customer demand related to the function storetoothpaste suggested a new customer demand of holds areasonable amount of toothpaste.
7. Customer Demands Versus Product Failure Modes.Purposes: to prioritize product failure modes for reliabilityengineering and to ensure that some important customerdemands have not been discarded. For the ToothBriteProject, the product failure modes were 1) stripping thethreads, 2) rupturing the mylar sack containing the tooth-paste, and 3) losing the hermetic seal of the dashpot bysplitting the case, puncturing the case, or having the orificefall off. This QFD chart (not presented in this article)showed that losing the hermetic seal of the dashpot was themost important failure mode.
8. Product Failure Modes Versus Functions. Purpose: tohelp engineers focus on the key functions. For the Tooth-Brite Project, we found that the functions dispense tooth-paste and clear tip were affected most by possible failures.
Other Modern Manufacturing ToolsWe have used several of the other recently popularizedquality engineering tools. We found that Pareto diagramsare useful if the product is already being manufactured andstatistical data about the process are available. We foundthree tools that are good for brainstorming to help solveproblems in the manufacturing process, namely, Ishikawafishbone diagrams (also called cause-and-effect diagrams),affinity diagrams, and force field analysis.
We found three tools that could be used to select thebest alternative concept: Pugh charts (Pugh, 1990), QFD,and matrix analysis (Chapman, Bahill and Wymore, 1992).However, Pugh charts do not provide a quantitativerecommendation for the best alternative; they merely givea bunch of +'s and -'s. Therefore, this tool seems moreappropriate for brainstorming than for selecting the bestalternative concept, Perhaps this tool is best used as abridge between brainstorming and selecting the bestalternative concept. It could be used late in the brainstorm-ing process after many ideas have already been formalizedbut early in the concept selection process when designs arestill being extensively modified. Pugh (1990) has deprecat-ed QFD, saying it is only good for redesign of old, staticproducts. He said, for example, that for the last 90 years,all automobiles have been designed with an engine and asteering system mounted on a box with one wheel at eachcorner; for such systems, the customer demands and theirweights are well known.
Indeed, the most spectacular successes of QFD in theliterature have been by automobile companies. We foundthat QFD was very useful for analyzing an old design, but
Engineering Management Journal Vol. 5 No. 3 September 1993 35
it was less useful for a brand new design. Most QFD toolshave provisions for comparing competitive designs.However, only the customer demands are used, not theperformance or cost figures of merit. (The performanceand cost figures of merit are also called design require-ments or quality characteristics; they are the Hows of thefirst QFD chart.) Furthermore, none of these QFD toolsgives a quantitative summary of the data. Therefore, wethink the best way to use QFD to evaluate alternativedesigns is to fill in a House of Quality QFD chart for eachdesign and study the scores at the bottom of each chart.This way the system judged best is the one that bestsatisfies the customer demands as well as the performanceand cost figures of merit. However, in selecting the bestalternative design, we have had the best results usingmatrix analysis.
In general, QFD charts have the Whats listed on the leftand the Hows listed along the top, as shown in Exhibit 3.With a systems engineering approach, we determine theHows by asking, "This is What the customer wants, nowHow can we measure it?" However, there is an alternativeuse for the Hows. We could ask, "This is What thecustomer wants, now How can we provide that?" If weused this approach for the ToothBrite Project, we wouldhave created Hows such as incorporate a suction chamber9
make the tube walls resilient, use double lead threads, etc.This approach is not consistent with the systems engineer-ing process. We suggest that it not be used with QFDunless its consequences are first demonstrated.
Advantages of Using QFDJapanese and American manufacturers (King, 1989; Akao,1990; and our companies) have found the followingadvantages of using QFD:
Customer needs were understood and prioritized better.Documentation of system requirements was improved.There was increased commitment from the customer
toward finalizing the design.Design time was reduced (usually by one-fourth to
one-half).Planning became more specific, thus making
consensus-building within the company easier.An informed balance between quality and cost was made.Control points were clarified.Duplication of effort was eliminated.Each task was guaranteed to have someone assigned to it.The number of engineering bottlenecks was reduced.The design aim was communicated to manufacturing.There were fewer manufacturing problems at start up.There were fewer design changes late in development and
during production.Rework was greatly reduced.
Sales were increased.Market share was increased.Customer feedback was increased.Human relations between divisions were improved.Employee job satisfaction was improved.Company organization was improved.Company reputation for being serious about quality was
enhanced.
There are three versions of every conversation: whatyou meant to say, what you actually said, and what theother person thought you said. QFD helps document whatwas actually said.
In summary, QFD charts are rapidly becoming popular,powerful, system-design tools. They help ensure thatimportant items are not overlooked. They provide aconvenient mechanism for communication between thecustomer and the engineer. And finally they help tostreamline the design and manufacturing process.
ReferencesAkao, Y. (ed.), Quality Function Deployment: Integrating
Customer Requirements into Product Design, Cam-bridge, MA: Productivity Press (1990).
Bahill, A. T., Verifying and Validating PersonalComputer-Based Expert Systems, Englewood Cliffs, NJ:Prentice Hall (1991).
Bossert, J. L., Quality Function Deployment: A Fraction-er's Approach, Milwaukee, WI: ASQC Quality Press(1991).
Chapman, W. L., A. T. Bahill, and A. W. Wymore,Engineering Modeling and Design, Boca Raton, FL:CRC Press (1992).
Harrington, H, J., The Improvement Process, New York:Quality Press, McGraw-Hill Book Co. (1987).
King, B., Better Designs in Half the Time, ImplementingQFD Quality Function Deployment in America, Meth-uen, MA: GOAL/QPC (1989).
Pugh, S., Total Design, New York: Addison-Wesley(1990),
QFD/Capture User's Manual, Milford, OH: InternationalTechneGroup Inc. (1990).
QFDplus User Guide, QFDplus Software Program, Plym-outh, MI: Ford Motor Co. (1991).
Re Velle, J, B,, The New Quality Technology, An Introduc-tion to Quality Function Deployment (QFD) and Tagu-chi Methods, Los Angeles: Hughes Aircraft Co. (1990).
Saaty, T, L,, The Analytic Hierarchy Process!, New York:McGraw-Hill (1980).
Transactions of the Symposia on Quality Function Deploy-ment, Novi, MI, Goal/QPC, Metheun, MA, and theAmerican Supplier Institute, Dearborn, MI (June 1989,1990, 1991, and 1992).