a typology for understanding the career and … › fulltext › ed574521.pdf · (now known as cte)...
TRANSCRIPT

Oscar A. Aliaga
October 2012
A TYPOLOGYFORUNDERSTANDINGTHE CAREERAND TECHNICALEDUCATIONCREDIT-TAKING
Pradeep Kotamraju James R. Stone III
NRCCTE
EXPERIENCEOF HIGHSCHOOLSTUDENTS

A Typology for Understanding the Career and Technical Education Credit-Taking Experience of High School Students
Oscar A. Aliaga Pradeep Kotamraju James R. Stone, III
October 2012
National Research Center for Career and Technical Education University of Louisville

Funding Information
Project Title: National Research Center for Career and Technical Education Grant Number: VO51A070003
Act Under Which Funds Administered:
Carl D. Perkins Career and Technical Education Act of 2006
Source of Grant: Office of Vocational and Adult Education U.S. Department of Education Washington, D.C. 20202
Grantees: University of Louisville National Research Center for Career and Technical Education 354 Education Building Louisville, KY 40292
Project Director: James R. Stone, III
Percent of Total Grant Financed by Federal Money:
100%
Dollar Amount of Federal Funds for Grant:
$4,500,000
Disclaimer: The work reported herein was supported under the National Research Center for Career and Technical Education, PR/Award (No. VO51A070003) as administered by the Office of Vocational and Adult Education, U.S. Department of Education.
However, the contents do not necessarily represent the positions or policies of the Office of Vocational and Adult Education or the U.S. Department of Education and you should not assume endorsement by the Federal Government.
Discrimination: Title VI of the Civil Rights Act of 1964 states: “No person in the United States shall, on the ground of race, color, or national origin, be excluded from participation in, be denied the benefits of, or be subjected to discrimination under any program or activity receiving federal financial assistance.” Title IX of the Education Amendment of 1972 states: “No person in the United States shall, on the basis of sex, be excluded from participation in, be denied the benefits of, or be subjected to discrimination under any education program or activity receiving federal financial assistance.” Therefore, the National Research Center for Career and Technical Education project, like every program or activity receiving financial assistance from the U.S. Department of Education, must be operated in compliance with these laws.

Abstract
This study describes a typology that allows us to explore and analyze the career and technical education (CTE) credit-taking experience of all high school students, not just those traditionally considered CTE (or vocational) students. We argue that this new typology provides a better framework for understanding CTE than the more traditional approach that classifies students as either academic or vocational concentrators. A typology like the one introduced in this paper is necessary because academic requirements have increased for all high school students in the United States, including those considered vocational students, and because most students, not just vocational students, participate in CTE at some level. Acknowledging these facts better reflects the varied nature of students’ high school CTE credit-taking experiences. We propose this typology using data from the Education Longitudinal Study of 2002 (ELS:2002), collected by the National Center for Education Statistics (NCES) of the U.S. Department of Education. Our analyses of ELS:2002 data using this typology show that the typology provides a more effective means of understanding the credit-taking experience of high school students than analyses based on dichotomous, vocational versus academic frameworks. Our analyses show that about 17% of all high school students complete high-intensity CTE in addition to their academic requirements. Although CTE has historically targeted low-income and special populations, our study reveals high levels of participation among higher income students and those with parents with higher levels of educational achievement. Positive results were also found for academic outcomes, such as a high rate of high-intensity CTE participation among students who were also enrolled in advanced mathematics and, to a lesser extent, in advanced science classes.

1
A Typology for Understanding the Career and Technical Education Credit-Taking
Experience of High School Students
In recent years, concerns have been expressed about the effectiveness of our educational system, and in particular of career and technical education (CTE), in preparing high school students academically for their postsecondary endeavors (Beach, 2009; Duncan, 2011) and for an apparent lack of success in improving the job readiness of those students, as indicated in the recent Pathways to Prosperity report (Symonds, Schwartz, & Ferguson, 2011). Specifically related to CTE, most of these concerns are raised using a framework for understanding CTE that is historical in nature but that has not adapted to the current condition of CTE in high schools. That framework, described below, dichotomizes high school coursework as either academic or vocational; yet as we will discuss, this view does not take into account curriculum changes that have taken place in the past decades that define a different high school experience. As a consequence, two fundamental, connected questions emerge. First, what policy framework is being used when we discuss CTE? Second, derived from the first question, how should we categorize CTE students—and who should be categorized as a CTE student? Research literature of the past 30 years suggests that these questions are not easy to answer. But as we move into the second decade of the 21st century, it is certain that old policy frameworks and paradigms cannot be used to consider a topic of such critical importance to the nation’s educational and economic well-being. How to define who a CTE student is remains a critical issue in part because states use different criteria to define them, and researchers too have been inconsistent in the way they classify those students. The current and most traditional way of classifying a high school CTE concentrator follows the curriculum adopted with the Smith-Hughes Act of 1917. Students in this curriculum were termed vocational, whereas students in “regular” or “classical” education—often geared toward preparation for postsecondary education—were termed academic. This old paradigm for distinguishing students based on their curriculum or concentration has been the prevailing means of classifying and understanding high school students’ trajectories from both policy and research perspectives for most of the past century. This distinction has also come to include other, later classifications such as general (not accumulating enough credits in academic or CTE courses) and dual curriculum (accumulating enough credits in both academic and CTE courses) students.
A new approach to understanding students’ participation in CTE is warranted because federal and state policies of the last decade have increasingly emphasized academic credit-taking for all students, including those typically characterized as CTE students, thus changing the overall curriculum requirements for CTE in high school. This new policy environment must be taken into account as we seek to understand high school students’ course-taking experiences, including CTE, and CTE therefore must be understood as part of the whole high school experience, not as an isolated, distinguished, or separate curriculum or track. Consequently, any effort to understand CTE based on the traditional approach of classifying students as academic, vocational, general, or dual has only limited value; CTE cannot be examined purely from the perspective of this curriculum divide. Instead, we propose a new CTE credit-taking typology that examines the entire student experience, isolating patterns of CTE credit-taking, including the CTE credit-taking patterns of students who are not traditionally associated with CTE. In this

2
paper, we use this typology to examine changes in CTE participation based on credit requirements and explore students’ high school experiences and participation in CTE. The typology allows us to examine the value of CTE for the approximately 92% of public high school students who take CTE at a variety of levels. The typology also helps to explain the complexity of the CTE credit-taking experience. Using this typology, we also seek to spark a deeper discussion of students’ high school experiences that will finally disassociate CTE from its historical links to special populations and underperformance.
Purpose
This study analyzes the CTE credit-taking experience of U.S. public high school students. We intend to show that the traditional classification of students as academic or vocational is no longer useful or responsive to the reality of students’ high school experiences in the 21st century. Our primary research question asks: What does the CTE credit-taking experience look like among public high school students? More specifically, we ask: What are CTE participation patterns among public high school students, demographically and in terms of math and science course-taking? In responding to these questions, we explore different patterns in students’ overall CTE experience and propose a new typology of CTE credit-taking that offers a more useful way to categorize CTE students for research and policy-making purposes. Our study uses data from the Education Longitudinal Study of 2002 (ELS:2002; National Center for Education Statistics [NCES], 2010b).
Perspectives on CTE Participation
Defining who a high school CTE participant is has been an unsettled topic and a recurring subject of debate among researchers and policymakers (Plank, 2001; Roey, Perkins, Caldwell, Rust, & Brown, 2007; Stone & Aliaga, 2007b). The prevailing discussion is based on a historical view that divides students dichotomously as academic or CTE (vocational). However, in recent years, in response to federal and state policy, academic requirements have increased for all students, making participation figures based on an academic versus vocational division less useful, especially given that more students are taking CTE in high school. This policy shift affects other student categories based on the distinction between academics and CTE that have emerged throughout the years, including students termed general (students taking less than the required number of credits to be considered an academic or a vocational concentrator) or dual (students taking both academic and vocational credit requirements). The Old Paradigm and the Current Categorization The current method of categorizing students as participating in academic or vocational education (now known as CTE) has its origins in the adoption and implementation of the Smith-Hughes Act of 1917 that established vocational education as part of the U.S. public school system. The Act was passed as part of a policy to better position the United States in the global economy in the newly industrialized world of the early 20th century (Kantor, 1986). But the implementation of vocational education was made in response to a complex set of conditions unique to that time. It was directed primarily at poor, unemployed youth in cities that were rapidly growing due to internal migration from rural areas and immigration from Europe (Lynch, 2000); it was supposed

3
to bring a sense of stability to businesses “and the corporate industrial society that was emerging in the early twentieth century” (Kantor, 1986, p. 402). From an educational perspective, vocational education was a curriculum that would provide technical skills and train blue collar workers in agriculture, manufacturing, and home economics. The establishment of this curriculum contrasted with the “regular,” or academic curriculum, because it was:
specially designed to prepare workers for the most common occupations in which a great mass of our people find useful employment… to give training of a secondary grade to persons more than 14 years of age for… employment in the trades and industries, in agriculture, in commerce and commercial pursuits, and in callings based upon… home economics. (Plawing, as cited by Gordon, 2008, p. 87)
In addition, by providing youth with technical skills, the law could help them become better citizens and learn the values of a democratic society, as envisioned by Dewey (1916).
After the inception of the Act, it was decided that students in vocational education would follow the “50-25-25 rule,” which required students to spend 50% of their time in the shop, 25% of their time in a closely related subject, and 25% of their time in academic subjects (Lynch, 2000). This has been the dominant paradigm under which vocational education has operated for much of the past century, with emphasis placed on a curriculum of education for work, separate but co-existing with an academic curriculum that served a different type of students—those assumed to become professionals. Thus, education was differentiated “according to the ‘evident and probable destinies’ of students” (Grubb, 1995, p. 12).
The distinction between academics and CTE would later be modified, although not conceptually altered, through successive reforms and policies. The most noteworthy of these advanced increased academic course-taking based on the understanding that CTE did not prepare students with the academic skills needed for postsecondary education. Different efforts were thus undertaken to increase the academic preparation of CTE students, including the curriculum integration movement (Grubb, 1995; Hoachlander, 1999; Stasz, Kaganoff, & Eden, 1994), followed by the “new vocationalism” movement (Benson, 1997; Grubb, 1996a) which promoted articulating secondary and postsecondary education and teaching the kinds of technical and work-related skills needed by employers (Grubb, 1996a). Increased academics were not clearly set as an explicit educational policy goal until the release of A Nation At Risk (National Commission on Excellence in Education, 1983). This seminal report pointed to several problems in the U.S. educational system and suggested that states adopt the “New Basics” as solution:
We recommend that State and local high school graduation requirements be strengthened and that, at a minimum, all students seeking a diploma be required to lay the foundations in the Five New Basics by taking the following curriculum during their 4 years of high school: (a) 4 years of English; (b) 3 years of mathematics; (c) 3 years of science; (d) 3 years of social studies and (e) one-half year of computer science. For the college-bound,

4
2 years of foreign language in high school are strongly recommended in addition to those taken earlier. (p. 70)
The report, despite failing to mention vocational education, triggered school reform efforts that resulted in the release of what became known as the SCANS report (Secretary’s Commission on Achieving Necessary Skills, 1991). However, these reforms did not seek to change the content of schooling; instead, states responded by instituting “higher academic standards,… new testing requirements, and new content standards for teachers” (Grubb, 1996b, p. 3). The idea of increasing the academic course-taking of high school students transfixed the formal policymaking arena. When the Carl D. Perkins Vocational Education Act passed in 1984, the law called for assessing the impact of vocational education programs on students’ academic achievement. Successive changes in legislation at the federal and state level would push for even more increases in academic work, including changes in the 1990 version of the Perkins legislation that emphasized the integration of core academic content into CTE, but without modifying the basic paradigm of the existence of two types of curricula—vocational and academic. The Office of Vocational and Adult Education (OVAE) within the U.S. Department of Education has guided state eligible agencies (SEAs) on matters related to definitions, measurement approaches, and reporting requirements for at least two decades about how SEAs should define CTE participants, concentrators, and completers. OVAE has provided particular leadership and guidance related to how SEAs should define concentrators. Based on that curricular paradigm, high school students are currently and continued to be classified following the academic-vocational divide. The most noteworthy classification is the one used by the National Center for Education Statistics (NCES), which considers a student to be academic if she or he has completed at least 12 Carnegie units in academic courses, but less than three Carnegie units in any occupational education field; and vocational (CTE) if the student has completed at least three Carnegie units in an occupational education field, but less than 12 Carnegie units in academic courses (NCES, 2011a). For all practical purposes, a student who takes less than 12 credits in academic courses cannot exist anymore due to the adoption of the “New Basics,” as we will discuss in the section of this paper to follow. All states’ classification practices basically follow this approach, but many states have made this system of classification even more confusing by implementing their own criteria for further increasing academic requirements. In 1972, the total number of required credits in core academic subjects (English, Social Studies, Mathematics, and Science) was 8.0, out of 16.0 for all subjects. In 1980, the required number of core academic credits was 8.1, a number that then jumped to 10.3 out of 20.3 in 1985, and to 11.1 out of 21.0 by 1988 (Adelman, 1989). The numbers are even higher today. States have also used separate measures to classify CTE students, which has resulted in an unclear picture of who a CTE student is even when the states continue to follow the old vocational-academic paradigm. A review of states’ criteria for classifying a high school student as a CTE student renders up to seven different types. A student could be a CTE student if she or he (a) completes at least two credits in a single CTE area, (b) completes at least three credits in a single CTE area, (c) completes at least two or three credits depending on the requirements of the recognized sequence, (d) completes at least 50% of the requirements of a recognized sequence, (e) completes at least four or more credits in a single CTE area, (f) completes two years or

5
enrolls in the second year of a two-year program, or (f) completes any other type of arrangement, such as 350 hours of instruction or the completion of a skills assessment (based on data from the U.S. Department of Education, 2011, and numerous personal communications with state CTE administrators). This level of incoherence in the ways in which students may be classified as CTE students undergirds our interest in portraying these students from a new perspective that takes into account the modern educational policy context and examines the entire CTE credit-taking experience of all students. Current Research on Measures of Participation in CTE and Data Sources Research on high school students’ participation in CTE has not been uniform. There are three major types of research on this topic. The first relies on self-reported data based on interviews, the second uses transcript data, and the third has been conducted by states using their own data. Although we will focus mainly on the first two types, we note that states have different ways of collecting and reporting data, and thus of classifying CTE students, which has profound implications for a national system of CTE accountability and evaluation:
At present, the United States has no national, comprehensive database that meets the accountability requirements prescribed in the Perkins IV legislation. Individual state-level databases that collect CTE accountability information do exist, but these generally have been built to serve state-specific purposes and requirements. Most have little or no connection either to other databases within the state (most states keep their secondary and postsecondary CTE data separate) or to those of other states, let alone to a national system (Kotamraju & Mettille, 2012, p. 3).
With regard to the first two types, studies show that self-reported participation numbers almost never match numbers derived from transcript data, and studies using transcript data also differ in their results. Studies using either self-reported or transcript data also vary in the types of samples employed (e.g., national, longitudinal, local, regional, or selected samples). Students generally provide self-reported data during interviews. Although such data bring with them great potential for inaccuracy (Rosenbaum, 1980), they may also more accurately capture students’ real perceptions and desires. Rosenbaum found discrepancies between students’ self-reported curriculum participation and school-provided concentration information. These discrepancies led Delci and Stern (1999) to warn of the differences between self-reported and transcript-based studies. Stone and Aliaga (2003), using a relatively small subsample of the National Longitudinal Survey of Youth 1997 (NLSY97) that included transcript data, and acknowledging the shortcomings of transcript-based templates for analyses, emphasized the positive aspects of self-reported data: “Because students see themselves and identify themselves with one of those [curriculum] concentrations, we might reasonably conclude that self-classification of curriculum concentration provides a more reliable indicator of future college completion than transcript analyses” (p. 12). Furthermore, they noted that self-reported data for those students in academic concentrations were closely aligned with actual college enrollment data (Stone & Aliaga, 2007a), as suggested by Rosenbaum (2002).

6
Self-reported data have been useful in calculating CTE participation (Fletcher & Zirkle, 2009). Using a non-weighted subsample of the NLSY97, Delci and Stern (1999), for example, classified students using self-reported data and showed that 5% of the 9th- to 11th-grade students included in the study were CTE concentrators. Stone and Aliaga (2007a) also used data from the NLSY97 but reported a CTE participation rate of 6.6% for those high school students surveyed in 1999. The differences between the participation rates in the two studies is small and explicable when we note that Stone and Aliaga (a) used a larger subsample that included 12th graders and (b) used weighted data to calculate national estimates. Like self-reported data, transcript analyses have not been exempt from criticism. The main argument against transcript studies is that they classify students by imposing a template based on the researcher’s own perspective. Delci and Stern (1999) indicated that although transcripts accurately reflect students’ course-taking patterns, they are not sufficient to classify students in any of the four curriculum concentrations (academic, vocational, dual, or general). They argued that “any definition of curricular programs that is intended to apply to the country as a whole must be artificial and somewhat arbitrary because there is no standard nationwide definition of what a vocational, general, or academic student is” (p. 11). Studies using transcript data also report different participation rates. Although some discrepancies may arise from using different databases (i.e., both longitudinal and cross-sectional), other discrepancies reflect the different ways in which researchers classify students as CTE participants. Hoachlander, Kaufman, Levesque, and Houser (1992), for example, reported a very high participation rate in CTE for high school graduates: They estimated that 31.6% of 1987 graduates took four or more Carnegie units in specific labor market preparation areas (SLMP). Hoachlander et al. used several databases, including the 1987 High School Transcript Study and the High School and Beyond study. Their figure is one of the highest reported for CTE participation. A much more modest CTE participation rate was reported by Levesque et al. (1995). Drawing on the 1987 High School Transcript Study, the 1990 National Assessment of Educational Progress (NAEP) High School Transcript Study, and the High School and Beyond Sophomore Cohort 1982 High School Transcript Study, Levesque et al. found that 8% of 1992 public high school graduates concentrated in vocational education. These students earned at least four credits in a single occupationally specific program area, of which at least two credits needed to be beyond the introductory level. Tuma (1996) studied participation in CTE using four national databases that included transcript information: High School and Beyond (for 1982 graduates), the NAEP 1987 High School Transcript Study (for 1987 graduates), the NAEP 1990 High School Transcript Study, and the National Educational Longitudinal Study of 1988 (NELS:88; 1992 graduates). He reported that 24.4% of 1992 public high school graduates were CTE concentrators (defined as earning three or more credits in a specific field).
More recently, Roey et al. (2001) reported high school student participation in CTE using data from the 1998 High School Transcript Study, a database containing information from a

7
nationally representative sample of 25,422 students who graduated in 1998. Restricting their analysis to a subsample of 24,218 students, Roey et al. found that 4.4% were vocational concentrators. That figure has more recently been reported as 3.0% of all graduates from public high schools (Roey et al., 2007).
Using transcript data from the NELS:88, Plank (2001) estimated that 18.94% of 1992 high school graduates were CTE concentrators. By contrast, Levesque (2003) calculated CTE participation as 25% of all 1998 high school graduates, a number based on an analysis of several data sources including the High School and Beyond Longitudinal Study of 1980 Sophomores, the NELS:88, and the High School Transcript Studies of 1990, 1994, and 1998 for 1990, 1994, and 1998 graduates.
These studies reveal both wide variation in rates of CTE participation and a lack of consensus about how to define a CTE student. Because the differences in participation rates described above are important, caution must be exercised in interpreting them. For example, the most recent reports about smaller numbers of students participating in CTE in general may correspond with a reduction in high school students participating in CTE as concentrators. We need a clearer picture of CTE participation in order to respond to long-standing criticisms of CTE’s ability to help students achieve their academic and professional goals (Bae, Gray, & Yeager, 2007). In recent years, CTE’s effectiveness has been scrutinized as to whether it reduces the high school dropout rate, provides adequate academic preparation for postsecondary education at two- or four-year colleges (e.g., Arum, 1998; Clark, Dayton, Stern, Tidyman, & Weisberg, 2007), and helps students develop the necessary skills for work (e.g., Symonds et al., 2011). These concerns have prompted researchers and educators to try to improve the delivery of CTE (Stone, Alfeld, Pearson, Lewis, & Jensen, 2007) as well as the way in which it is studied. Newer research has shown the important benefits derived from CTE participation (Aliaga, 2011). Most research on CTE has distinguished between academic and vocational education (e.g., Delci & Stern, 1999; Levesque et al., 1995; Stone & Aliaga, 2003) and hence has regarded CTE participation as homogenous, failing to distinguish between different levels of CTE credit-taking. As a consequence, this approach has overlooked other aspects of CTE participation, such as the status of students who are classified as neither academic nor CTE, as well as the trajectories of students who do not complete the requirements to be considered CTE concentrators. The classification system proposed in this paper is more comprehensive and aims to correct this deficiency.
Addressing the Inadequacies of the Academic Versus Vocational Divide Classifying students merely as academic or CTE is limiting, particularly in an era of changing graduation requirements that emphasize more academic credit-taking in response to increasing pressure to produce a workforce with high academic and technical skills. Researchers and policymakers must be sensitive to different issues, measurement approaches and policy frameworks for CTE participation. The number of academic courses that all high school students, including those typically considered CTE students, need to complete in order to graduate is increasing (Nord et al., 2011). At the same time, most students, including those students who were traditionally considered college-bound are also taking more CTE (Roey et al.,

8
2007, see Table 5), and not necessarily with the goal of following a trajectory in any of the occupational areas. Such increases in course-taking have expanded both the demand for CTE and the number of occupational areas in which CTE courses are available. Similarly, CTE research has largely overlooked participation in the general concentration group as well as the participation of students who, although they have taken three or more CTE credits, are still considered non-concentrators.
Overlooking the general concentrator group. Researchers and policymakers frequently overlook the existence of general concentrators, a group of students who have been classified as such because they do not fulfill the required number of either academic or vocational credits to graduate but who have been “left to wander haphazardly through their high school years” (Stone & Aliaga, 2003, p. 3). General concentrators matter because they represented, by most accounts, a large proportion of all public high school students: 38.29% of all 1992 graduates (Plank, 2001), 42% of all graduates in 1994 (Levesque et al., 2000), and 52.2% of all students in the graduating cohort of 2000 (Stone & Aliaga, 2007a). More recently, Roey et al. (2007) stated that general concentrators represented only 5.8% of all graduates in 2000, a much smaller percentage than those reported above.
The variation in these estimates may conceal a different problem, particularly in studies using self-reported data. Students may harbor misperceptions about their high school trajectories or be reluctant to admit to participating in CTE, an area that has long been socially stigmatized. Stone and Aliaga (2007b) examined this problem using self-reported data and available transcript information in a smaller subsample of the NLSY97 dataset. They found that out of a weighted sample of about 9,000 students, after transcript information was used to verify CTE participation, the 48.22% of students who self-reported as general concentrators shrank to 31.37%. This shift in the general concentration group increased membership in the CTE concentrator group from 6.25% to 24.89%—a new figure that also included some students previously classified as academic concentrators. Neglecting the CTE non-concentrators. Research and policy have also tended to neglect the meaning of the CTE experience. A CTE concentrator is usually defined by examining whether CTE credits were taken in a predefined collection of courses in a specific labor market preparation (SLMP) or occupational area such as business, agriculture, marketing, or health care. Sometimes, courses classified as general labor market preparation (GLMP), such as family and consumer sciences, have also counted toward the definition of a CTE concentrator, but ordinarily they have not. The typology introduced in this paper excludes GLMP courses and instead uses the U.S. Department of Education Classification of Secondary School Course (CSSC) numbering system to identify SLMP courses. For this typology, we “cleaned out” the courses included in each occupational area, reconstructing those occupations and redefining them more strictly, primarily by eliminating courses that are not CTE or were not part of the SLMPs. Prior research using transcript data has relied on less accurate interpretations of what constitutes a CTE course, and thus participation analyses relied on different templates. The major question in defining a CTE concentrator in high school, however, is not which courses count but how many credits are required. The number varies in different state policy contexts and research foci, as described in the previous sections of this paper. Although state graduation

9
requirements depend on state policy, which varies from state to state, researchers largely use a three-credit threshold, often combined with the criteria of whether those credits were taken in a single SLMP or occupational area. When researchers use only one area or SLMP and treat the variable dichotomously (i.e., those students that reach the threshold vs. those who do not), they miss two groups of students who are likely to enroll in and complete CTE courses in significant numbers. First, they miss students who take CTE courses in different SLMPs or occupational areas without reaching the three-credit CTE threshold. Second, they miss those students who take three or more CTE credits in different SLMP areas, thus precluding them from reaching the threshold of the three-credit requirement in any single SLMP. Though not considered “concentrators,” these two groups of students are typically labeled “CTE participants” in research and policy. Our typology includes them as separate groups, because the way in which such students tailor their CTE experience has important policy, research, and personal consequences.
Stone and Aliaga (2007b) conceptualized how CTE course-taking in different programs would look using various definitions of a CTE student (see Table 1). Of the four students shown in Table 1 who took a variety of CTE classes, only one, Student 4, is a true CTE concentrator, having taken three courses in one SLMP. However, the other students “could very well be packaging a CTE experience for their future labor market interests” (Stone & Aliaga, 2007b, p. 2). What is reflected in the examples of Students 1, 2, and 3, but is not captured by current classifications, are students’ intents, interests, and plans—the potential to build a career out of a tailored program that works for the individual student yet does not meet the definition of a focused CTE trajectory. Table 1 Four Students Who Take Three Credits of CTE: Who Gets Counted as a CTE Concentrator? Grade Student 1 Student 2 Student 3 Student 4 10 Food Tech I Horticulture Introduction to Computers Word Processing 11 Marketing I Business Management CAD I Accounting I 12 Marketing II Marketing I CAD II Accounting II Note. Adapted from Stone and Aliaga (2007b). Aware of the rigidity of this type of classification, Hudson and Laird (2009) conducted an analysis of CTE in which they reduced the threshold to require only two CTE credits in a single SLMP “rather than the more restrictive and narrow definition” of at least three credits (p. 2). Similarly, Levesque, Wun and Green (2010) used two CTE credits as a threshold to classify CTE concentrators. Although this approach treats a larger number of students as CTE concentrators, it still excludes other students. Such might be the case for students who take CTE credits in several different SLMPs, or students who go beyond the three CTE credit threshold but whose total number of CTE credits taken in a single SLMP is still less than three (or less than two credits if using the Hudson and Laird definition). The credit-taking patterns of CTE concentrators need to be analyzed separately from CTE non-concentrators, who typically take a CTE course (or more) to round out their high school course-taking experience. The typology we propose provides a framework for conducting such analyses.

10
A New Typology for the High School CTE Credit-Taking Experience
Because the traditional distinction between academic and CTE students limits research and a deeper understanding of the complexity of high school CTE participation, we propose a new typology that analyzes CTE credit-taking in terms of the entire high-school credit-taking experience, examining the entire spectrum of CTE credits taken while in high school. Initially proposed by Kotamraju, Aliaga, and Dickinson (2011b), this typology is based on two significant changes in CTE and the educational system more generally. First, the old distinction between academic and CTE students has been obliterated by increases in the number of academic credits required of all high school students. Second, CTE course-taking has expanded across students. In other words, due to the emergence of a new federal and state policy framework emphasizing academic preparation for all students, CTE needs to be re-examined in the context of this new paradigm. Increased Minimum Academic Graduation Requirements for All High School Students: Breaking the “50-25-25” Rule Our typology is based on two key principles derived from educational policy—academic preparation and CTE availability. In this section, we discuss academic preparation. First, academic and CTE students no longer follow completely different curricula because minimum academic requirements for graduation now demand that all high school students take an increased number of academic courses, regardless of those students’ classifications as academic, CTE, general, or dual. Federal and state graduation requirement reforms have effectively eliminated the distinction between academic and vocational curricula, and by extension the original “50-25-25 rule” that was established after the adoption of the Smith-Hughes Act of 1917. As indicated, changes in academic requirements for graduation have been evolving for many years. The ultimate expression of this trend is the College for All movement, with its emphasis on preparing students to be both college and career ready. College for All largely stresses rigorous academics and preparation for postsecondary education (Kotamraju, Aliaga, & Dickinson, 2011a; Stone & Lewis, 2012). With the scale tipped toward the college-preparatory side of the college and career ready equation, high school students’ ability to choose between different curricula and experiences of CTE has been fundamentally altered. As noted, states have increased over the years—and to some extent have leveled off—the number of academic credits high school students need to complete in order to graduate. The last significant push came from the No Child Left Behind Act of 2001. The average number of credits required in academic subjects in order to graduate from high school is 12.2, although the minimum number varies from state to state (see Table 2) and ranges from 9 to 16 credits. The number of required credits for graduation, for all courses, is typically 24. Thirty-three states require a minimum of 12 academic credits to graduate. As noted in Table 2, in most states, at least half of all required credits must be in academic subjects. The Nation’s Report Card (Nord et al., 2011), published by the NAEP, indicates that the standard academic course credit requirement for high school graduation is 13 credits: 4 credits in English, 3 in math, 3 in social studies, and 3 in science. From another perspective, in the 33 states requiring 12 or more academic credits, these credits represent 50% or more of the total credits required for graduation.

11
In 11 other states in which the requirements are less than 12 academic credits, students are still required to take 50% or more of their total credits in academic courses. In six other states, graduation credit requirements are locally determined. Table 2 State Minimum Academic Credit Requirements
Minimum Academic Creditsa, b
Number of
Statesc
Academic Cr. to Total Cr.
(50% or more) State 0d 6 -- CO, IA, MA, NE, ND, PA
9 1 1 IL 9.5 1 1 WA 10 4 4 CA, IN, ME, MT
10.5 2 2 AZ, NH 11 4 3 AK, ID, NV, WI 12 2 2 CT, OR
12.5 1 1 UT 13 16 16 GA, KS, KY, LA, MD, MO, NJ, NC,
OH, OK, SD, TN, TX, VT, VA, WY 13.5 3 3 DC, MN, NM
14 9 9 AR, DE, FL, HI, MI, MS, NY, RI, SC 15 1 1 WV 16 1 1 AL
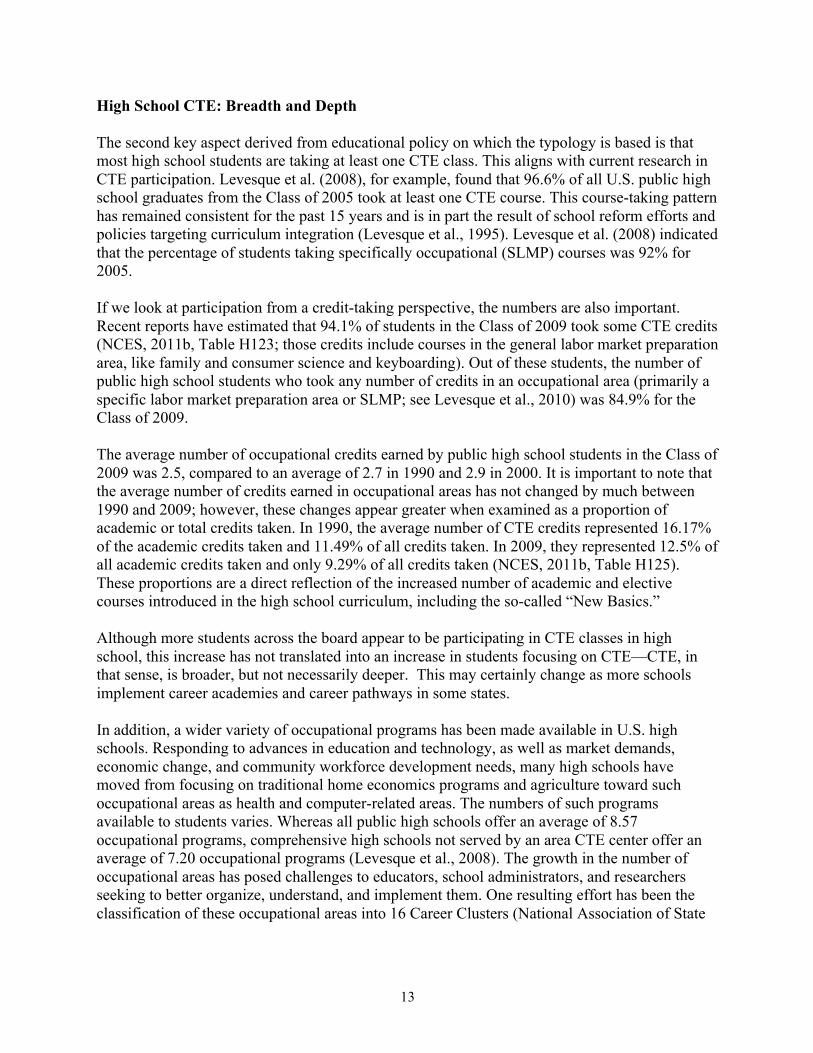
Total 51 44 Note. a Subjects include English, Mathematics, Social Studies, and Science. b In four states, minimum requirements include 1 unit of CTE. c Includes the District of Columbia. d In these states, all credits are locally determined. Colorado requires 0.5 credits, and Iowa 2.5 credits, but the remaining credits are locally determined. Sources: Education Commission of the States, 2007; NCES, 2011a, Table 177. In theory, the minimum academic requirements established by state policy form the basis of the curriculum that every high school graduate must complete. Having completed their academic graduation requirements, students can then build their own course trajectories. They may build either a purely academic trajectory, a CTE trajectory, or a combination of the two, as depicted in Figure 1. For example, students interested in a purely academic trajectory may choose to take advanced math and science. But they may also combine advanced academic courses with other courses, such as electives and CTE courses; for example, students wishing to pursue a baccalaureate degree in engineering need advanced math and some high school engineering courses.

12
FIGURE 1. CTE and high school trajectories.
On the other hand, a student interested in CTE may pursue CTE credits yielding (a) an individualized experience with a combination of credits from different occupational areas, not necessarily focused on one area, but rather tailored according to the student’s intentions, interests, and plans for life; or (b) a high-intensity CTE experience with at least three CTE credits focused on a specific occupational area or areas and fulfilling the requirements set forth in that area or areas.
We further argue that the field should not limit its view of high school CTE to the experience of CTE (or occupational) concentrators. Rather, CTE should be seen as a vital component of all students’ experiences in high school, in which all students take a wide variety of courses in different amounts that suit their personal interests—whether the courses are mainly academic, mainly CTE, or a combination of the two.
The increase of minimum academic credits required for all high school students have an unintended and immediate effect: The “50-25-25 rule” established after the adoption of the Smith-Hughes of 1917 ceases to apply, breaking in practice one of the landmark educational policies of the 20th century. Because the source of the distinction between two types of curricula has been eliminated, the divide between CTE and academic students also no longer exists.
State Minimum Academic Requirements (9 to 16 credits in English, Mathematics, Social Studies, and Science)
Advanced Math and Science
Electives and/or Foreign Language
CTE or High-‐
Intensity CTE
Completion of High School Graduation Requirements
13
High School CTE: Breadth and Depth The second key aspect derived from educational policy on which the typology is based is that most high school students are taking at least one CTE class. This aligns with current research in CTE participation. Levesque et al. (2008), for example, found that 96.6% of all U.S. public high school graduates from the Class of 2005 took at least one CTE course. This course-taking pattern has remained consistent for the past 15 years and is in part the result of school reform efforts and policies targeting curriculum integration (Levesque et al., 1995). Levesque et al. (2008) indicated that the percentage of students taking specifically occupational (SLMP) courses was 92% for 2005. If we look at participation from a credit-taking perspective, the numbers are also important. Recent reports have estimated that 94.1% of students in the Class of 2009 took some CTE credits (NCES, 2011b, Table H123; those credits include courses in the general labor market preparation area, like family and consumer science and keyboarding). Out of these students, the number of public high school students who took any number of credits in an occupational area (primarily a specific labor market preparation area or SLMP; see Levesque et al., 2010) was 84.9% for the Class of 2009. The average number of occupational credits earned by public high school students in the Class of 2009 was 2.5, compared to an average of 2.7 in 1990 and 2.9 in 2000. It is important to note that the average number of credits earned in occupational areas has not changed by much between 1990 and 2009; however, these changes appear greater when examined as a proportion of academic or total credits taken. In 1990, the average number of CTE credits represented 16.17% of the academic credits taken and 11.49% of all credits taken. In 2009, they represented 12.5% of all academic credits taken and only 9.29% of all credits taken (NCES, 2011b, Table H125). These proportions are a direct reflection of the increased number of academic and elective courses introduced in the high school curriculum, including the so-called “New Basics.” Although more students across the board appear to be participating in CTE classes in high school, this increase has not translated into an increase in students focusing on CTE—CTE, in that sense, is broader, but not necessarily deeper. This may certainly change as more schools implement career academies and career pathways in some states.
In addition, a wider variety of occupational programs has been made available in U.S. high schools. Responding to advances in education and technology, as well as market demands, economic change, and community workforce development needs, many high schools have moved from focusing on traditional home economics programs and agriculture toward such occupational areas as health and computer-related areas. The numbers of such programs available to students varies. Whereas all public high schools offer an average of 8.57 occupational programs, comprehensive high schools not served by an area CTE center offer an average of 7.20 occupational programs (Levesque et al., 2008). The growth in the number of occupational areas has posed challenges to educators, school administrators, and researchers seeking to better organize, understand, and implement them. One resulting effort has been the classification of these occupational areas into 16 Career Clusters (National Association of State

14
Directors of Career Technical Education Consortium [NASDCTEc], 2011) and related Programs of Study (POS) or Career Pathways (Lewis, 2008).
With virtually all U.S. high school students having some degree of experience with CTE, simply classifying high school students dichotomously as CTE concentrators or academic concentrators masks the vast complexity of students’ course-taking experiences and post-high school goals and plans. Our new typology provides a method for addressing and analyzing this complexity, and more particularly, provides a basis for understanding the engagement, achievement, and transition of all students, but particularly for those students who participate in varying numbers of CTE courses.
Sample, Data, and Method
Sample In this descriptive study, we used data from the ELS:2002, which “follows a nationally representative cohort of students from the time they were high school sophomores through the rest of their high school careers” and “continues to follow these students into postsecondary education and/or the labor market” (NCES, 2010b, Overview section, ¶ 3).
The ELS:2002 is composed of two cohorts. The first cohort was interviewed for the baseline survey of high school sophomores in the spring term of 2002. The second was formed with seniors in the spring of 2004, during which “the base year cohort [2002] was ‘freshened.’ What freshening means is that spring term 2004 seniors who were not sophomores in the … spring term of 2002 (for example, students who were out of country, or in another grade sequence because of skipping or failing a grade) were given a chance of selection into the survey” (NCES, 2010b, Survey Design section, ¶ 2).
For this study, we used data collected for the senior cohort of 2004, including the sophomore cohort of 2002 and a freshened sample of 2004 seniors (Ingels et al., 2007). For the analyses performed in this study, the reporting sample is restricted to graduates of U.S. public high schools, thus excluding students from private institutions. The overall reporting weighted sample N = 2,698,609.
Data We used the restricted ELS:2002 datasets from the Base-Year (2002), the First Follow-Up (2004), and the Second Follow-Up (2006). Like all NCES sample survey data, the ELS:2002 datasets have four components: student information, including personal, demographic, and socioeconomic data; school characteristics, including information on teachers and administrators (i.e., their perceptions of their students and the schools in which they work); student perceptions of their school environments and the condition and status of their homes (particularly as their perceptions of home relate to their ability to succeed in school); and transcript data describing students’ high-school courses, behavior, enrollment, and completion rates.

15
We built this typology from analyses of the transcript data, using other components of the ELS:2002 database as moderating and mediating variables, particularly those variables that have been traditionally used for measuring participation in CTE. Such variables include background characteristics, prior academic achievement, and academic performance in high school. We used weighted data in order to calculate population estimates. In doing so, we used the strata, primary sampling unit, and weights information provided in ELS:2002. We provide the specific size of the reporting sample in each table presented below.
Method
We follow the Kotamraju et al. (2011b) approach for the analyses in this study. In the detailed transcript information provided in the ELS:2002 data, each course taken by a student is assigned a CSSC number. In preparing these data for analysis, the CSSC data were categorized by classifying each course as academic, CTE, Performing Arts, Physical Education, and Other. CTE courses were grouped into the 13 occupational/SLMP areas reported by Levesque et al. (2010). The ELS:2002 data also identify courses that are part of a sequence, and this information is used to determine if a graduate has enrolled in and completed a partial or full sequence of courses in academic or CTE areas. Math and science courses are categorized into three levels: less than basic, basic, and advanced. Finally, the database also identifies the last grade year in which a math or science course was taken. We reorganized the transcript data into aggregated information to determine the level, mix, intensity, and sequencing of CTE credit-taking for all high school students. We did this following a two-pronged approach. First, we examined the number of CTE credits using the Classification of Secondary School Course (NCES, 2010a); second, we examined the alignment of those credits in the occupational areas, for which we followed the classification of occupational areas used by Levesque et al. (2010). For each student, the total number of Carnegie credits was calculated for each of the 13 occupational areas (Levesque et al., 2010). We then organized the spectrum of those credits around three anchors to reflect the most common patterns of CTE credit-taking: taking no CTE credits at all, taking one credit, and taking three or more credits. After the number of CTE credits was calculated, we proceeded to assign students to categories based on the criteria of whether they fulfilled the requirements of an occupational area. That is, we determined whether those students reached the threshold of taking a minimum of three-credits in any of the occupational areas.
In its broadest form, the resulting typology consists of eight different categories:
1. no CTE credits; 2. more than zero (e.g., 0.5 credits) but less than one CTE credit; 3. one CTE credit; 4. more than one but less than three CTE credits; 5. three CTE credits without fulfilling the requirements of an occupational or SLMP
area; 6. more than three CTE credits without fulfilling the requirements of an occupational or
SLMP area; 7. three credits and fulfilling the requirements of one occupational or SLMP area; and,

16
8. more than three CTE credits and fulfilling the requirements of one or more occupational or SLMP areas.
In the first four categories, the requirement of fulfilling an occupational or SLMP area is not expected. Students who did not fulfill the requirements of an occupational area (three credits) can be further distinguished as follows: (a) students who took courses in a single occupational or SLMP area but did not reach the three-credit threshold; (b) students who took courses in many occupational or SLMP areas but also did not reach the three-credit threshold; and (c) students who took courses in multiple occupational or SLMP areas but went beyond the three-credit threshold. Similarly, students who fulfill the three-credit requirement in a single occupational area can also be divided into two groups: (a) students who focused on only one occupational or SLMP area and whose total number of Carnegie credits in that occupational area totaled three credits or more, and (b) students who focused on more than one occupational or SLMP area and took three or more credits in at least one occupational area. Students in Categories 7 and 8 are those who are typically described as occupational concentrators. The idea behind using these eight categories is that they provide more flexibility for any analysis on CTE credit taking—certainly more than the traditional, restricting dichotomy of academic versus CTE. Depending on the research questions and needs—and for practical purposes—these eight categories may be collapsed into different groups. One way of collapsing the categories is into four groups: (a) students taking zero CTE credits, (b) students taking more than zero but less than three CTE credits, (c) students taking three or more CTE credits without fulfilling the requirements of an occupational or SLMP area, and (d) students taking three or more CTE credits and fulfilling the requirements of one or more occupational or SLMP areas. This approach has already been taken in analyses conducted by Aliaga (2011), Aliaga, Kotamraju, and Dickinson (2011), and Aliaga and Dickinson (2011), among others. However, for the purpose of this study, we used the eight categories.
We explored the relationship between high school CTE and demographics, as well as the relationship between CTE credit-taking and course-taking patterns in both mathematics and science. For this purpose, mathematics and science courses were categorized as below basic, basic, and advanced. For this categorization, we used CSSC codes (NCES, 2010a). We began with the idea that students usually take advanced courses if they plan to pursue postsecondary education, particularly in preparation for STEM (Science, Technology, Engineering, and Mathematics) careers. CSSC codes cover a very large number of courses in all areas and contain a reference group—the basic group—for both math and science courses. Below basic mathematics includes generalized courses like General Math. Basic mathematics includes a wide variety of courses, including Algebra I, Algebra II, and Geometry. Advanced mathematics includes courses like Calculus, Statistics, and Advanced Placement (AP) mathematics courses. In the case of science, below basic includes courses such as Space Science; basic includes typical courses such as Biology, Physics, and Chemistry; and advanced includes courses such as Biochemistry, Genetics, Microbiology, and AP science courses.

17
Results
In Table 3, we summarize the high school CTE credit-taking experience of all U.S. public high school students included in the reporting sample, categorized using the proposed typology. Table 3 shows wide variety in participation patterns, with significant proportions in each category. The most noticeable categories, the ones of primary interest in this analysis, are Categories 5 through 8. Almost 17% of all students took three or more CTE credits in one or more occupational or SLMP areas (a figure close to the 19.1% CTE participation rate for the Class of 2009 that was recently reported using a different dataset, the High School Transcript Study; see NCES, 2011b, Table H127). This group of students—occupational concentrators—focus intensely on courses that will build the work skills they need after high school. Our analyses suggest that students appear to prefer building skills in more than one occupational area (participation in Category 8). Those taking only three CTE credits and in just one occupational area represent barely 1% of all high school students (Category 7). A key finding is that 27% of all students took three or more CTE credits without focusing on a single occupational or SLMP area (Categories 5 and 6). This significant number of CTE non-concentrators suggests that many students are seeking to build a diverse set of skills in a variety of occupational areas, regardless of their ultimate post high school experiences. Research has generally overlooked this group. The way these students articulate their high school experiences of CTE may say more about their intents, interests, and plans than what we know from current research. Initial analyses of this group reveal that they choose the following combinations of occupational areas with particular frequency: business management, computer science, and consumer services; business management, communication, and consumer services; business management, communication, computer science, and consumer services; and communication, computer science, and consumer services (Aliaga, Kotamraju, & Dickinson, 2011). Another revealing result from the analysis using the typology is the unsurprising fact that 8% of all high school students in the sample took no CTE credits at all. This is somewhat consistent with other reports. Hudson and Laird (2009), for example, estimated such students at 3.4% of the Class of 2005. Table 3 also shows that 48.1% of all students took more than zero but less than three CTE credits. Of these, 40.6% took between one and less than three CTE credits. Almost 30% of all high school students took more than one and less than three credits (Categories 2 through 4). Those taking more than zero CTE credits and less than or equal to one CTE credit (Categories 2 and 3, or 18.2% of all students in the sample) may be more likely to be following an academic trajectory, along with those students with zero CTE credits. In these cases, students may be combining those courses with advanced academic courses and electives in the arts or foreign languages. We emphasize the fact that more than 40% of all students take CTE credits in a significant amount (almost 50% of all students if we include those taking more than zero CTE credits—usually half a credit). This represents a significant impact of CTE on the high school experience of students.

18
Table 3 CTE Credit-Taking Experience of Public High School Students. ELS:2002 (Percentages) Category CTE Credit-Taking Category % 1 No CTE credits 8.0 2 More than 0 and less than 1 CTE credits, no occupational area fulfilled 7.5 3 1 CTE credit, no occupational area fulfilled 10.7 4 More than 1 and less than 3 CTE credits, no occupational area fulfilled 29.9 5 3 CTE credits, no occupational area fulfilled 7.6 6 More than 3 CTE credits, no occupational area fulfilled 19.6 7 3 CTE credits, 1 occupational area fulfilled 0.8 8 More than 3 credits, at least 1 occupational area fulfilled 16.0 Note. Weighted N = 2,698,609. Demographic patterns across the eight categories show a significant distribution between females and males (see Table 4A). The data show that females participated more than males in all categories up to three CTE credits taken, with differences of up to 2.1% between females and males across credit-taking categories. However, males predominated among students taking more than three CTE credits, regardless of whether or not they fulfilled the requirements of an occupational or SLMP area (with differences between males and females between 2.3% and 4.5%). The distribution of students by race across the eight categories had no uniform pattern. Asian students appeared to be the most interested in enrolling in just some CTE—up to three CTE credits—followed closely by Latino students. White students were more likely to take three or more CTE credits, regardless of whether they focused on an occupational area. White students formed the largest proportion and Asian students the smallest proportion of students in Categories 6, 7, and 8. Latino students were more likely to take three CTE credits without focusing on an occupational area, followed by Black students. Black students formed the largest proportion of Category 7, students taking three credits with an occupational area of focus, followed by White and Latino students. Asian students predominated among those students taking no CTE credits at all.

19
Table 4A Frequencies of Background Characteristics by CTE Credit-Taking for Public High School Students: ELS:2002 (Percentages) CTE Credit-Taking Category 1 2 3 4 5 6 7 8
0 0.01 –
0.99 1 1.01 –
2.99 3.00; No
OAF
3.00+; No OAF
3.00; OAF
3.00+; OAF
Gender* Female 9.0 8.1 11.4 30.8 7.6 18.4 0.9 13.8 Male 6.9 6.8 9.9 28.9 7.6 20.8 0.7 18.3 Race* White 8.3 7.4 10.1 27.8 7.1 21.2 0.8 17.4 Black 8.0 5.7 8.9 33.5 7.8 17.9 1.3 16.9 Latino 7.7 9.2 12.2 31.6 8.8 17.7 0.8 12.1 Asian 10.4 9.7 17.0 34.9 7.3 11.9 0.2 8.4 Socioeconomic Status* SES-Q1 (Low) 5.9 6.0 9.7 29.5 7.8 20.6 0.9 19.6 SES-Q2 5.7 6.6 8.6 28.9 7.2 23.6 0.5 19.0 SES-Q3 8.7 6.4 10.3 30.7 8.2 19.5 0.8 15.3 SES-Q4 (High) 11.7 11.0 14.1 30.4 7.1 14.5 1.0 10.2
Note. Weighted N = 2,698,610. OAF = Requirements for occupational area fulfilled.

20
Table 4B Frequencies of Background Characteristics by CTE Credit-Taking for Public High School Students: ELS:2002 (Percentages) CTE Credit-Taking Category 1 2 3 4 5 6 7 8
0 0.01 –
0.99 1 1.01 –
2.99 3.00; No
OAF
3.00+; No OAF
3.00; OAF
3.00+; OAF
Parents’ Education* No HS graduate 6.2 7.9 11.8 30.0 9.1 20.7 0.4 14.0 HS grad/GED 5.6 5.2 8.3 27.2 7.4 23.2 1.4 21.6 Attended 2-yr 7.0 6.0 9.8 29.2 9.5 19.3 0.4 18.8 Graduated 2-yr 6.1 4.9 9.9 29.6 6.6 23.2 0.8 18.9 Attended 4-yr 8.2 7.8 9.7 32.2 7.2 20.1 0.4 14.4 Graduated 4-yr 9.5 8.2 11.2 31.0 7.9 18.3 0.6 13.1 MA or equiv. 11.4 10.6 14.5 30.9 6.6 13.8 1.1 11.2 PhD/MD 12.5 14.9 14.7 30.7 6.0 12.0 1.0 8.3 Urbanicity* Urban 8.5 9.4 11.6 31.9 7.6 16.7 0.9 13.5 Suburban 7.7 7.4 10.5 30.4 7.7 20.1 0.7 15.5 Rural 8.3 5.3 9.7 25.5 7.2 21.9 1.1 20.9 Note. Weighted N = 2,933,730. *Chi-square statistically significant for all categories, p < .001. OAF = Requirements for occupational area fulfilled. Historically, CTE has targeted mainly low-income and disadvantaged students (Lynch, 2000). That trend is still observable in our analyses of student participation and socioeconomic status (SES). Table 4A reveals an overall inverse relationship between income and the amount of CTE credits taken: Students in the highest SES quartile predominated in the categories corresponding with the least number of CTE credits taken (36.8% of students in the highest quartile took zero to one CTE credits), whereas students in the lowest two SES quartiles took the most CTE credits (48.91% of students in the lowest quartile, and 50.34% in the second-lowest quartile, took three or more credits, with or without an occupational area of focus).
But what data from Table 4A also reveal are two fundamental facts about participation in CTE that have been largely overlooked. First, across all SES quartiles, 44% or more students in each quartile took some CTE, defined as more than zero and up to less than three CTE credits. Interestingly, students in the highest SES quartile taking more than zero but less than three CTE credits (Categories 2 through 4) had the largest participation—a total of 55.5% of students in that quartile. These results may indicate that higher income students are “rounding out” their educational experiences with CTE participation—which, if they are college-bound, may benefit them in their postsecondary trajectories. The second point is that 32.8% of students in the highest SES quartile took three or more CTE credits with or without a focus in an occupational area (Categories 5 through 8). Thus, practically one in every three students in the highest SES group participates in high-intensity CTE while in high school. The percentage is even higher for the

21
second highest SES group—43.8%. These are facts that have not previously been made evident and mark a crucial shift of our understanding of participation in CTE.
Low-income students (the two lowest SES quartiles) who participate in high-intensity CTE—that is, who take three or more CTE credits with or without an occupational area of focus—in many ways may benefit from CTE’s power to engage students in their high school studies and prevent them from dropping out. Recent analyses appear to confirm this possibility (Aliaga, 2011). Participation patterns similar to those based on SES can be seen in our analyses of credits taken and parents’ level of education. Students with parents who either attended four-year colleges or attained a higher university degree predominated in the first four CTE credit-taking categories (from zero to less than three CTE credits). Conversely, students whose parents graduated from two-year colleges or had lower levels of educational attainment predominated among those categories encompassing three or more CTE credits taken. But as in the case of SES, it is important to note the surprising, comparatively high proportion of students (27.3% and higher) whose parents held a bachelor’s degree or higher and who took three or more CTE credits. This, too, is an important rate of participation that has not received much attention from research.
Table 4B also reports on CTE credit-taking by urbanicity. Surprisingly large numbers of students in rural (and to some extent suburban) schools took three or more CTE credits, whereas students in urban and suburban schools appear more often in the categories from zero to less than three CTE credits.
Collectively, the data in Tables 4A and 4B indicate that students from a variety of racial, socioeconomic, educational, and geographic backgrounds actively participate in CTE. CTE can no longer be said to serve exclusively low-income students, underperforming students, or students from special populations. Table 5 presents data related to our analyses of the relationship between CTE credit-taking and math and science course-taking. We examined high school GPA for all CTE credit-taking categories compared to the three different levels of math and science. With regards to math credit-taking, three points are worth noting. First, at the advanced math level, high school GPA decreased with increased CTE credit-taking. However, at the advanced math level, the mean difference in GPA between high-intensity CTE (Category 8) and the zero CTE credit group (Category 1) was small (0.27). Second, at the below basic level, as the number of CTE credits increased, so did high school GPA. Third, the variation in GPA at the basic level was very small across the eight categories. The existence of students with an average GPA of 3.02 (a GPA higher than the overall high school GPA) who participate in high-intensity CTE and take advanced math cuts against the claim that CTE concentrators do not take higher math. We make a similar argument regarding students in Categories 5 through 7 related to advanced math credit-taking. Notably, those students taking below basic math with higher GPAs were also those enrolled in high-intensity CTE, whereas those with the lowest GPAs in that category tended to take less than one or no CTE credits.
No clear patterns emerged in the interaction of high school GPA and the three levels of science study. Advanced science showed a pattern similar to advanced math. As CTE credit-taking increased, GPA decreased along the categories—with one isolated, yet important exception:

22
those students taking three CTE credits and fulfilling the requirements of an occupational area. However, the mean difference in GPA between CTE categories in the advanced science group, although higher than the case of advanced math, was still not large—0.38 (or less than half of a GPA point). As with math, those students with a higher GPA were also taking more CTE and taking advanced science at the same time. At the basic level of science, GPA was more uniform across the eight CTE categories, similar to math. At the below basic level, students who took more CTE had a higher GPA, with the exception of those students taking one CTE credit only (Category 3) and those taking three credits and focusing in one occupational area only (Category 7). Table 5 CTE Credit-Taking and Level of Mathematics and Science Course Achieved: ELS:2002 (Average GPAs) CTE Credit-Taking Category
1 2 3 4 5 6 7 8
0 0.01 –
0.99 1 1.01 –
2.99 3.00;
No OAF 3.00+;
No OAF 3.00; OAF
3.00+; OAF
Math Level* Below Basic 2.0 2.0 2.2 2.2 2.2 2.4 2.3 2.4 Basic 2.4 2.4 2.4 2.4 2.5 2.5 2.5 2.5 Advanced 3.3 3.3 3.1 3.1 3.1 3.0 3.0 3.0 Science Level** Below Basic 2.3 2.1 2.8 2.9 2.4 2.6 1.8 2.4 Basic 2.6 2.6 2.6 2.6 2.7 2.7 2.5 2.6 Advanced 3.2 3.2 3.1 2.9 3.0 2.8 3.1 2.9
Note. Weighted N: 2,668,108. *F test statistically significant for all categories, p < .001. **F test statistically significant for all categories, p < .001. OAF = Requirements for occupational area fulfilled.

23
Table 6 Student Distribution, CTE Credit-Taking and Level of Mathematics and Science Course Achieved: ELS:2002 (Percentages) CTE Credit-Taking Category
1 2 3 4 5 6 7 8
0 0.01 –
0.99 1 1.01 –
2.99 3.00;
No OAF 3.00+;
No OAF 3.00; OAF
3.00+; OAF
Math Level* Below Basic 9.7 6.5 6.5 29.0 3.2 16.1 0.0 29.0 Basic 5.9 6.3 8.4 28.7 7.3 22.6 0.6 20.1 Advanced 9.7 8.7 12.78 31.0 8.3 17.2 0.8 11.4 Science Level** Below Basic 10.5 10.5 5.3 26.3 5.3 10.5 0.0 31.6 Basic 6.4 6.7 8.9 29.6 8.0 21.8 0.7 17.8 Advanced 9.7 8.1 12.7 30.6 7.2 17.6 0.9 13.2
Note. Weighted N = 2,666,132. * Chi-square statistically significant for all categories, p < .001. ** Chi-square statistically significant for all categories, p < .001. OAF = Requirements for occupational area fulfilled. When student distribution is examined for math and science course-taking, the data show no clear patterns of participation (see Table 6). Overall, however, proportionately more students in the below basic and advanced math levels take up to less than three CTE credits (Categories 1 through 4), whereas those students in the basic level represent a larger group among those that take three or more CTE credits, whether or not they focus on an occupation area at the same time (Categories 5 through 8). In all three math credit-taking levels, the largest proportions of students were those who took more than one and less than three CTE credits (Category 4). In the case of advanced math course-taking, as well as basic math, for those students taking three or more CTE credits, regardless of whether they fulfilled an occupational area (Categories 6 and 8), the proportions were larger than that of students taking no CTE credits. The difference between the students taking three or more credits and those taking no CTE credits was even larger (about four times as large) for basic math. Again, this counters the widespread assumption that the preponderance of students taking advanced math are those who also take zero CTE and, conversely, that those taking more CTE credits also take lower levels of math.
A different pattern is seen with science credit-taking. In this case, larger groups of students in the three science credit-taking levels take up to less than three CTE credits (Categories 1 through 4). As in the case of math credit-taking, the proportion of students in the advanced science credit-taking level in categories 1 through 4 almost doubles the proportion of students taking three or more CTE credits (Categories 5 through 8). The proportion of students at the below basic level is largest among those taking three or more CTE credits and focusing in one or more occupational areas (Category 8). These students also represent the single largest group in any of the categories at the three levels. As in the case of math course-taking, larger proportions of students in advanced science took three or more CTE credits (38.9%), indicating that more than one in three students take advanced science and high-intensity CTE at the same time.

24
Although these participation patterns in both math and science follow, prima facie, findings from prior research, both patterns contradict claims regarding the incompatibility of CTE and advanced math and science course-taking, suggesting the benefits of a high-intensity CTE credit-taking experience for all students. Other analyses using this typology point in that direction (e.g., Aliaga, Stone, Kotamraju, & Dickinson, 2011; Aliaga & Dickinson, 2011).
Discussion and Conclusions
The objective of this study was to present a new typology that captures the entirety of the CTE experience for all high school students. The idea behind the typology is that high school students have different interests and exhibit different scholastic behaviors depending on their interests, goals, and plans for their postsecondary trajectories. The fundamental premise for this analysis is that there has been a shift in the educational framework regarding CTE. From a policy and paradigm that separated and differentiated CTE from “regular” (i.e., academically focused) education, the country has moved toward a different framework—one that stresses academic graduation requirements for all high school students and focuses on preparation for postsecondary education. In this study, we have argued that the traditional and widely used classification of high school students into dichotomous categories does not reflect the reality of our contemporary educational environment. Because students must now comply with standardized, more intensive academic graduation requirements, the CTE experience must be addressed and interpreted differently. Any attempt to understand the high school CTE experience must take this into account. The old paradigm fails to acknowledge these requirements and leaves us with more questions than answers. For example, when reporting increased academic requirements for all states for 2008, the Digest of Education Statistics (NCES, 2011a; Table 158) classified as vocational those students who had completed “at least 3 Carnegie units in an occupational education field, but less than 12 Carnegie units in academic courses,” and as academic those students who had completed “at least 12 Carnegie units in academic courses, but less than 3 Carnegie units in any occupational education field.” As we have argued, this system of classification makes no sense for most students, who in at least 33 states are required to take 12 or more academic credits to graduate. Similarly, the strategy of lowering the CTE credit requirements in defining a CTE concentrator to two credits fails to address the increased emphasis on academic requirements (Hudson & Laird, 2009). The CTE experience is far too complex and rich for these limited categorizations of CTE credit-taking. We have presented a new typology comprised of eight categories that correspond with different levels of CTE credit-taking for all high school students. This typology completely changes the paradigm under which high school students’ progress through the educational pipeline is examined. Our goal is to improve our analysis of the impact of CTE, rather than compare the relative advantages of CTE or academic curricula. An obvious question that arises is how the typology relates to the current Perkins accountability framework (which is based upon the participant-concentrator dichotomy) used by states, under guidance from OVAE, for definitions, measurement approaches, and reporting requirements. There are decided advantages to adopting the typology to develop definitions, measurement approaches, and reporting requirements for accountability purposes. In the case of mid-level CTE participants (Category 4), high-end CTE

25
participants (Categories 5 and 6), and concentrators (Categories 7 and 8), the typology offers additional, important knowledge about which specific occupational areas high school students are likely to enroll and possibly complete. Such information would be highly useful for states, for example, as they continue to develop their programs of study. In the case of low-end CTE participants (particularly Categories 2 and 3), the typology may show a more tenuous connection to CTE; including these students for accountability purposes might be misleading. In general, the typology will better enable states to determine who is a CTE student, and as a result better align their budgets, programs, planning, and accountability functions—a goal that is being emphasized more and more by the U.S. Department of Education (2012).
Our analyses using this typology have generated four important conclusions. First, virtually all high school students participate in CTE to varying degrees, and CTE credit-taking is a far more complex phenomenon than the simplistic classification of students as CTE or academic suggests. Students may combine any number of CTE credits along with other courses if they choose to follow a non-CTE trajectory. But they may also choose to follow a CTE trajectory, whether this be an exploration of different occupational areas or a high-intensity CTE trajectory focusing on one or more occupational areas.
Second, data showed that 16.8% of all students take three or more CTE credits and fulfill the requirements of one or more occupational areas. This finding alone is sufficient to challenge our understanding of and approach to CTE and CTE students, especially given that in many cases, such students are engaging in high-intensity CTE while also completing advanced academic requirements.
The typology also provides a starting point from which to understand why some students may choose to take three or more CTE credits without a clear occupational area of focus. Such students represent 27.2% of all high school students. What does the field of CTE tell us about such students? Are there benefits to this kind of high school trajectory? Answering these questions is critical not only to researchers, but also to educational policymakers whose curricular and programmatic decisions will affect the kinds of workplace skills and postsecondary preparation students receive in high school. Until now, this group of students has not received sufficient attention from either researchers or policymakers, and further research on their experiences is certainly warranted.
Similarly, another 30% of students take from more than one to less than three CTE credits. This group has also received little attention. In fact, according to the requirements of some states and school districts, such students may be considered CTE concentrators, although many of them choose a non-CTE trajectory.
Third, this typology also challenges perceptions and historical practices regarding the target population for CTE that have existed since the turn of the 20th century and that have been used to track students in high school. Since its origins and through much of the past century, CTE has traditionally targeted youth from lower income families, immigrants, and other underprivileged groups for the world of work; the assumption has been that such students are unsuited for more rigorous academic programs. Our new typology reveals more complex and nuanced patterns of CTE participation in high school. For example, students from higher SES groups participate at

26
higher rates in categories reflecting three or more CTE credits taken. In other words, higher intensity in CTE credit-taking appears to be not the sole province of poor, minority, and underachieving students. Our typology thus portrays CTE as a complex social experience. It reveals that although CTE provides opportunities for students in lower SES groups in a CTE trajectory at various levels of credit-taking intensity, it also offers opportunities to higher SES students who are not following a CTE trajectory but still see the benefit of taking CTE. Similarly, it has been widely argued that CTE has been used to track underperforming students and students from special populations while in high school (Lewis & Cheng, 2006), and that students in CTE did not participate in higher level English, math, and science courses (Oakes, Selvin, Karoly, & Guiton, 1992; Silverberg, Warner, Fong, & Goodwin, 2004). Using our typology, we have shown that such a situation does not necessarily hold, and that students taking high-intensity CTE courses also take higher levels of math. A similar situation is found with science course-taking, although the levels of association between high-intensity CTE and science are not the same as with math. Nevertheless, this typology allows us to break away from long-held assumptions and understand the CTE-academic relationship differently.
Further research is needed on the benefits of CTE participation, research that may be aided by this typology. One important aspect of the typology is that it allows us to group students differently according to research needs. For example, we may decide to collapse Categories 7 and 8 and analyze this integrated category in relation to another collapsed category (e.g., Categories 1 through 4 combined). We have conducted some such analyses, with intriguing initial results. For example, in a study of CTE’s impact on the dropout rate, we found that those students taking three or more CTE credits without an occupational area of focus or taking three or more credits in one or more occupational areas of focus were less likely to drop out of high school than students taking less than three CTE credits (Aliaga, Stone, Kotamraju, & Dickinson, 2011). Similarly, 12% of all students who take three or more CTE courses enroll in two-year colleges immediately after high school; about 17% of the same group enroll in four-year colleges (Aliaga & Dickinson, 2011). These important positive effects present a different picture of CTE.
This study makes clear that high school students’ diverse CTE experiences need to be approached from a new conceptual and analytic perspective. Using a new typology, we will be able to better channel our research in ways that reflect the lived experiences of those students and thus better inform policymakers. This typology’s approach should be used in research and incorporated in the policy-making process. We believe that it will help further our understanding of the intricacies of the high school experience for all students.

27
References Adelman, N. E. (1989). The case for integrating academic and vocational education.
Washington, DC: U.S. Department of Education, National Assessment of Vocational Education.
Aliaga, O. A. (2011, November). Engaging students in high school: Research on the role of career and technical education. Presentation made at the Educational Strategies and Student Engagement Institute, St. Petersburg, FL.
Aliaga, O. A, & Dickinson, E. R. (2011). Career and technical education graduates and enrollment in two-year colleges. Louisville, KY: National Research Center for Career and Technical Education, University of Louisville. Manuscript in preparation.
Aliaga, O. A., Kotamraju, P., & Dickinson, E. R. (2011, November). Career and technical education course-taking patterns of high school graduates: Exploring the participation in the most frequent sets of occupational areas. Presentation made at the annual conference of the Association for Career and Technical Education Research, St. Louis, MO.
Aliaga, O. A., Stone, J. R., III, Kotamraju, P., & Dickinson, E. R. (2011). Engaging students in high school: An examination of the positive role of career and technical education. Louisville, KY: National Research Center for Career and Technical Education, University of Louisville. Manuscript in preparation.
Arum, R. (1998). Invested dollars or diverted dreams: The effect of resources on vocational students’ educational outcomes. Sociology of Education, 71, 130-151.
Bae, S. H., Gray, K., & Yeager, G. (2007). A retrospective cohort comparison of career and technical education participants and non-participants on a state-mandated proficiency test. Career and Technical Education Research, 32, 9-22.
Beach, J. M. (2009). A critique of human capital formation in the U.S. and the economic returns to sub-baccalaureate credentials. Educational Studies, 45, 24–38.
Benson, C. S. (1997). New vocationalism in the United States: Potential problems and outlook. Economics of Education Review, 16, 201-212.
Clark, P., Dayton, C., Stern, D., Tidyman, S., & Weisberg, A. (2007). Can combining academic and Career-Technical Education improve high school outcomes in California? Santa Barbara, CA: California Dropout Research Project.
Delci, M., & Stern, D. (1999). Who participates in new vocational programs? A preliminary analysis of student data from NLSY97. Berkeley, CA: National Center for Research in Vocational Education.
Dewey, J. (1916). Democracy and education. New York, NY: Macmillan. Duncan, A. (2011, April 19.). Remarks made at the National Association of State Directors of
Career-Technical Education Consortium annual spring meeting. Washington, DC: NASDCTEc. Retrieved from http://www.youtube.com/watch?v=qYn1an3v5Yc.
Education Commission of the States. (2007). Standard high school graduation requirements (50 state). Denver, CO: Author. Retrieved from http://mb2.ecs.org/reports/Report.aspx?id=735.
Fletcher, E. C., Jr., & Zirkle, C. (2009). The relationship of high school curriculum tracks to degree attainment and occupational earnings. Career and Technical Education Research, 34, 81-102.
Gordon, H. R. D. (2008). The history and growth of career and technical education in America (3rd ed.). Long Grove, IL: Waveland Press.

28
Grubb, W. N. (1995). “The cunning hand, the cultured mind”: Sources of support for curriculum integration. In W. N. Grubb (Ed.). Education through occupations in American high schools (Vol. I, pp. 11-25). New York, NY: Teachers College.
Grubb, W. N. (1996a). The new vocationalism. Phi Delta Kappan, 77(8), 535. Grubb, W. N. (1996b). The “new vocationalism” in the United States: Returning to John Dewey.
Educational Philosophy and Theory, 28, 1-23. Hoachlander, G. (1999). Integrating academic and vocational curriculum: Why is theory so hard
to practice? Berkeley, CA: National Center for Research in Vocational Education. Retrieved from http://vocserve.berkeley.edu/CenterPoint/CP7/CP7.html.
Hoachlander, G., Kaufman, P., Levesque, K., & Houser, J. (1992). Vocational education in the United States: 1969-1990. Washington, DC: National Center for Education Statistics.
Hudson, L., & Laird, J. (2009, April). New indicators of high school career/technical education coursetaking: Class of 2005 – Statistics in brief. Washington, DC: National Center for Education Statistics.
Ingels, S. J., Pratt, D. J., Wilson, D., Burns, L. J., Currivan, D., Rogers, J. E., Hubbard-Bednasz, S., & Wirt, J. (2007). Education Longitudinal Study of 2002 (ELS:2002): Base-year to second follow-up data file documentation. Washington, DC: National Center for Education Statistics.
Kantor, H. (1986). Work, education, and vocational reform: The ideological origins of vocational education, 1890-1920. American Journal of Education, 94, 401-426.
Kotamraju, P., Aliaga, O. A., & Dickinson, E. R. (2011a, April). The college and career readiness of U.S. high school graduates: Moving from concept to measurement. Paper presented at the annual convention of the American Educational Research Association, New Orleans, LA.
Kotamraju, P., Aliaga, O. A., & Dickinson, E. R. (2011b, April). CTE accountability and evaluation: A comprehensive strategy for technical assistance. Presentation made at the National Research Center for Career and Technical Education Spring Colloquium, Washington, DC.
Kotamraju, P., & Mettille, J. (2012). Using return on investment and other related tools: Guidelines for measuring career and technical education internal efficiency and external effectiveness. Louisville, KY: National Research Center for Career and Technical Education, University of Louisville.
Levesque, K. (2003). Public high school graduates who participated in vocational/technical education: 1982-1998. Washington, DC: National Center for Education Statistics.
Levesque, K., Laird, J., Hensley, E., Choy, S. P., Cataldi, E. F., & Hudson, L. (2008). Career and technical education in the United States: 1990 to 2005. Washington, DC: National Center for Education Statistics.
Levesque, K., Lauren, D., Teitelbaum, P., Alt, M., Librera, S., & Nelson, D. (2000). Vocational education in the United States: Toward the year 2000. Washington, DC: National Center for Education Statistics.
Levesque, K., Premo, M., Vergun, R., Emanuel, D., Klein, S., Henke, R., Kagehiro, S., & Houser, J. (1995). Vocational education in the United States: The early 1990s. Washington, DC: National Center for Education Statistics.
Levesque, K., Wun, J., & Green, C. (2010, May). Science achievement and occupational career/technical education coursetaking in high school: The class of 2005 – Statistics in brief. Washington, DC: National Center for Education Statistics.

29
Lewis, M. V. (2008). Effectiveness of previous initiatives similar to programs of study: Tech prep, career pathways, and youth apprenticeships. Career and Technical Education Research, 33, 165-188.
Lewis, T., & Cheng, S.-Y. (2006). Tracking, expectations, and the transformation of vocational education. American Journal of Education, 113, 67-99.
Lynch, R. L. (2000). New directions for high school career and technical education in the 21st century. Columbus, OH: ERIC.
National Association of State Directors of Career Technical Education Consortium. (2011). Career clusters at a glance. Washington, DC: Author. Retrieved from http://www.careertech.org/career-clusters/glance/at-a-glance.html.
National Center for Education Statistics. (2010a). CSSC courses/Course codes. Washington, DC: Author. Retrieved from http://nces.ed.gov/surveys/hst/courses.asp.
National Center for Education Statistics. (2010b). Education Longitudinal Study of 2002 (ELS:2002). Washington, DC: Author. Retrieved from http://nces.ed.gov/surveys/els2002/.
National Center for Education Statistics. (2011a). Digest of education statistics: 2010. Washington, DC: Author. Retrieved from http://nces.ed.gov/programs/digest/d10/.
National Center for Education Statistics. (2011b). Most recent secondary/high school level tables. Washington, DC: Author. Retrieved from http://nces.ed.gov/surveys/ctes/tables/index.asp?LEVEL=SECONDARY.
National Commission on Excellence in Education. (1983). A nation at risk: The imperative for education reform. Washington, DC: U.S. Government Printing Office.
Nord, C., Roey, S., Perkins, R., Lyons, M., Lemanski, N., Brown, J., & Schuknecht, J. (2011). The nation’s report card: America’s high school graduates. Washington, DC: National Center for Education Statistics.
Oakes, J., Selvin, M., Karoly, L., & Guiton, G. (1992). Educational matchmaking: Academic and vocational tracking in comprehensive high schools. Berkeley, CA: National Center for Research in Vocational Education.
Plank, S. (2001). Career and technical education in the balance: An analysis of high school persistence, academic achievement, and postsecondary destinations. St. Paul, MN: National Research Center for Career and Technical Education, University of Minnesota.
Roey, S., Caldwell, N., Rust, K., Blumstein, E., Krenzke, T., Legum, S., Kuhn, J., Waksberg, M., Haynes, J., & Brown, J. (2001). The 1998 high school transcript study tabulations: Comparative data on credits earned and demographics for 1998, 1994, 1990, 1987, and 1982 high school graduates. Washington, DC: National Center for Education Statistics.
Roey, S., Perkins, R., Caldwell, N., Rust, K., & Brown, J. (2007). The 2000 High School Transcript Study tabulations: Comparative data on credits earned and demographics for 2000, 1998, 1994, 1990, 1987, and 1982 high school graduates. Washington, DC: National Center for Education Statistics. Retrieved from http://nces.ed.gov/pubsearch/pubsinfo.asp?pubid=2007463.
Rosenbaum, J. E. (1980). Track misperceptions and frustrated college plans: An analysis of the effects of tracks and track perceptions in the National Longitudinal Survey. Sociology of Education, 53, 74-88.
Rosenbaum, J. E. (2002). Beyond empty promises: Policies to improve transitions into college and jobs. Washington, DC: U.S. Department of Education, Office of Vocational and Adult Education. Retrieved from:

30
http://www2.ed.gov/about/offices/list/ovae/pi/hs/rosenbaum.doc. Secretary’s Commission on Achieving Necessary Skills. (1991). What work requires of schools.
A SCANS report for America 2000. Washington, DC: U.S. Department of Labor. Silverberg, M., Warner, E., Fong, M., & Goodwin, D. (2004). National Assessment of Vocational
Education. Final report to Congress. Washington, DC: U.S. Department of Education. Stasz, C., Kaganoff, T., & Eden, R. A. (1994). Integrating academic and vocational education: A
review of the literature, 1987-1992. Journal of Vocational Education Research, 19, 25-72.
Stone, J. R., III, Alfeld, C., Pearson, D., Lewis, M., & Jensen, S. (2007). Rigor and relevance: A model of enhanced math learning in career and technical education. St. Paul, MN: National Research Center for Career and Technical Education, University of Minnesota.
Stone, J. R., III, & Aliaga, O. A. (2003). Career and technical education, career pathways, and work-based learning: Changes in participation 1997-1999. Saint Paul, MN: National Research Center for Career and Technical Education, University of Minnesota.
Stone, J. R., III, & Aliaga, O. A. (2007a). Participation in career and technical education and school-to-work in American high schools. In D. Neumark (Ed.), Improving school-to-work transitions (pp. 59-86). New York, NY: Russell Sage Foundation.
Stone, J. R., III, & Aliaga, O. A. (2007b, April). Redefining career and technical education participation. Paper presented at the annual meeting of the American Educational Research Association, Chicago, IL. Stone, J. R., III, & Lewis, M. V. (2012). College and career ready in the 21st century. New York, NY: Teachers College Press.
Symonds, W. C., Schwartz, R. B., & Ferguson, R. (2011). Pathways to prosperity: Meeting the challenge of preparing young Americans for the 21st century. Cambridge, MA: Pathways to Prosperity Project. Harvard Graduate School of Education.
Tuma, J. (1996). Trends in participation in secondary vocational education: 1982-1992. Washington, DC: National Center for Education Statistics.
U.S. Department of Education. (2012). Investing in America’s future: A blueprint for transforming career and technical education. Washington, DC: Office of Vocational and Adult Education, U.S. Department of Education.

National Research Center for Career and Technical Education University of Louisville, College of Education and Human Development, Louisville, KY 40292
Phone: 502-852-4727 • Toll-Free: 877-372-2283 • Fax: 502-852-3308 Email: [email protected] • www.nrccte.org