a value-focused thinking model for the selection of the
TRANSCRIPT

Air Force Institute of Technology Air Force Institute of Technology
AFIT Scholar AFIT Scholar
Theses and Dissertations Student Graduate Works
3-2007
A Value-Focused Thinking Model for the Selection of the Best A Value-Focused Thinking Model for the Selection of the Best
Rigid Pavement, Partial-Depth Spall Repair Material Rigid Pavement, Partial-Depth Spall Repair Material
Benjamin G. Speer
Follow this and additional works at: https://scholar.afit.edu/etd
Part of the Construction Engineering and Management Commons
Recommended Citation Recommended Citation Speer, Benjamin G., "A Value-Focused Thinking Model for the Selection of the Best Rigid Pavement, Partial-Depth Spall Repair Material" (2007). Theses and Dissertations. 3064. https://scholar.afit.edu/etd/3064
This Thesis is brought to you for free and open access by the Student Graduate Works at AFIT Scholar. It has been accepted for inclusion in Theses and Dissertations by an authorized administrator of AFIT Scholar. For more information, please contact [email protected].
A VALUE-FOCUSED THINKING MODEL
FOR THE SELECTION OF THE BEST RIGID
PAVEMENT PARTIAL-DEPTH SPALL
REPAIR MATERIAL
THESIS
Benjamin G. Speer, Captain, USAF
AFIT/GEM/ENS/07-04
DEPARTMENT OF THE AIR FORCE AIR UNIVERSITY
AIR FORCE INSTITUTE OF TECHNOLOGY
Wright-Patterson Air Force Base, Ohio
APPROVED FOR PUBLIC RELEASE; DISTRIBUTION UNLIMITED.

The views expressed in this thesis are those of the author and do not reflect the official policy or position of the United States Air Force, Department of Defense, or the United States Government.
AFIT/GEM/ENS/07-04
A VALUE-FOCUSED THINKING MODEL FOR THE SELECTION OF THE BEST
RIGID PAVEMENT PARTIAL-DEPTH SPALL REPAIR MATERIAL
THESIS
Presented to the Faculty
Department of Systems and Engineering Management
Graduate School of Engineering and Management
Air Force Institute of Technology
Air University
Air Education and Training Command
In Partial Fulfillment of the Requirements for the
Degree of Master of Science in Engineering Management
Benjamin G. Speer, BS
Captain, USAF
March 2007
APPROVED FOR PUBLIC RELEASE; DISTRIBUTION UNLIMITED.
AFIT/GEM/ENS/07-04
A VALUE-FOCUSED THINKING MODEL FOR THE SELECTION OF THE BEST
RIGID PAVEMENT PARTIAL-DEPTH SPALL REPAIR MATERIAL
Benjamin G. Speer, BS Captain, USAF
Approved: ____________________________________ SHANE A. KNIGHTON, Maj, USAF (Chairman) date ____________________________________ BARRY S. MINES, Col, USAF (Member) date ____________________________________ CHARLES D. BLECKMAN, PhD (Member) date
AFIT/GEM/ENS/07-04
Abstract
Concrete spalls on airfield pavements generate foreign object debris (FOD) that is
damaging to aircraft engines, and may damage landing gear by roughening the pavement
surface. Repairing spalled concrete on aging and deteriorating airfields is essential for its
safe operational use. Picking the best repair material from many products on the
commercial market is difficult. There is wide variation on material properties, and good
performance on certain criteria is critical to constructing long lasting repairs.
Since there is currently no procedure for Air Force decision-makers to select the
best rigid-pavement repair material, a model was created using Value-Focused Thinking
(VFT) to evaluate repair material alternatives. Fourteen products were compared against
each other. Each was scored using fourteen evaluation measures that were identified as
important to the repair material selection process. Pavemend EX-H was found to be the
best choice for repairs conducted during conventional, steady-state operations.
Pavemend VR was found to be the best option for repairs that must be ready for traffic
within hours after placement, such as during contingency operations. VFT was shown to
be an effective methodology for objectively ranking repair products, while providing a
systematic process that can be tailored for future circumstances.
iv

Acknowledgments I would like to thank my thesis advisor and committee chair, Maj Shane
Knighton, for his patience and flexibility in seeing me through this endeavor. I would
like to thank the following pavement engineers for helping me understand the
complexities of pavement repair, and their assistance in structuring this decision model:
Dr. Ray Rollings and Mr. George Vansteenburg of the Air Force Civil Engineer Support
Agency (AFCESA), and Dr. Craig Rutland of the Air Force Research Lab (AFRL).
Special thanks to Col Barry Mines for serving on my committee and improving my thesis
by offering his expertise and knowledge of airfield pavements. I would also like to thank
Dr. Charles Bleckman for serving on my committee and taking the time to edit and give
feedback on my thesis submissions. Finally, thank you to all my friends who have made
my time at the Air Force Institute of Technology enjoyable, and an experience I will not
forget.
v

Table of Contents
Page
Abstract .................................................................................................................. iv
Acknowledgments.............................................................................................................v List of Figures ............................................................................................................... viii List of Tables .................................................................................................................. xi I. Introduction .............................................................................................................1 1.1 Overview.........................................................................................................1 1.2 Background.....................................................................................................3 1.3 Problem Identification ....................................................................................3 1.4 Research Questions.........................................................................................4 1.5 Research Approach .........................................................................................5 1.6 Scope...............................................................................................................6 1.7 Significance.....................................................................................................6 1.8 Summary .........................................................................................................7 II. Literature Review.....................................................................................................8 2.1 Overview.........................................................................................................8 2.2 Decision Analysis Approaches .......................................................................8 2.2.1 Analytical Hierarchy Process (AHP) ......................................................8 2.2.2 Life Cycle Cost Analysis (LCCA)..........................................................9 2.2.3 Expert Systems......................................................................................10 2.3 Property Testing and Field Performance of repair materials .........................13 2.3.1 Material Properties................................................................................15 2.3.1.1 Compatibility ..................................................................................15 2.3.2 Other Properties of Concern .................................................................18 2.4 Decision Analysis ..........................................................................................20 2.4.1 Value-Focused Thinking.......................................................................22 III. Methodology..........................................................................................................26 3.1 Overview........................................................................................................26 3.2 Problem Identification ...................................................................................26 3.3 Constructing the Value Hierarchy .................................................................27 3.3.1 Cost .......................................................................................................30 3.3.2 Desirable Material Properties ...............................................................31 3.3.3 Shelf Life ..............................................................................................33 3.3.4 Site Preparation Required .....................................................................34
vi
Page 3.3.5 Workability ...........................................................................................34 3.3.6 Complete Hierarchy ..............................................................................35 3.4 Develop Evaluation Measures .......................................................................37 3.4.1 Cost .......................................................................................................38 3.4.2 Desired Material Properties ..................................................................38 3.4.3 Shelf Life ..............................................................................................39 3.4.4 Site Preparation Required .....................................................................39 3.4.5 Workability ...........................................................................................40 3.5 Weighting the Hierarchy................................................................................40 3.6 Creating Value Functions ..............................................................................42 3.6.1 Cost Value Functions............................................................................44 3.6.2 Desirable Material Properties Value Functions ....................................45 3.6.3 Shelf Life Value Function.....................................................................51 3.6.4 Site Preparation Required Value Function ...........................................52 3.6.5 Workability Value Functions................................................................53 3.7 Alternative Generation...................................................................................54 IV. Results and Analysis ..............................................................................................56 4.1 Overview........................................................................................................56 4.2 Alternative Scoring ........................................................................................56 4.3 Deterministic Analysis (Conventional Weighting)........................................58 4.3.1 Deterministic Analysis on a Conventionally Weighted Scenario.........58 4.3.2 Contingency Weighting Deterministic Analysis ..................................61 4.4 Sensitivity Analysis .......................................................................................63 4.4.1 Sensitivity on Fundamental Objectives ................................................64 4.5 Summary of Results and Analysis .................................................................68 V. Summary and Conclusions ....................................................................................72 5.1 Overview........................................................................................................72 5.2 Research Summary ........................................................................................72 5.3 Model Strengths .............................................................................................74 5.4 Model Limitations..........................................................................................75 5.5 Future Research .............................................................................................75 5.6 Conclusions....................................................................................................76 Appendix A: Sensitivity Graphs on Measures (Conventional Weighting)....................77 Appendix B: Sensitivity Graphs on Measures (Contingency Weighting) .....................84 Bibliography ...................................................................................................................91 Vita ................................................................................................................................93
vii

List of Figures
Page Figure 1. Concrete Pavement Spalls...............................................................................2
Figure 2. Example of a Failed Concrete Pavement Repair ............................................7
Figure 3. Variable Inputs on SCEPTRE 1.1 Program..................................................11
Figure 4. SCEPTRE 1.1 Expected Pavement Service Life Output ..............................12
Figure 5. Factors Affecting Durability of a Concrete Repair System..........................14
Figure 6. Properties that Affect Compatibility between Repair Material and Substrate..
.......................................................................................................................15
Figure 7. VFT Ten-Step Process ..................................................................................22
Figure 8. Hierarchy Tiers .............................................................................................23
Figure 9. Example Piecewise Linear Function.............................................................24
Figure 10. Example Exponential ....................................................................................24
Figure 11. Advantages to using VFT .............................................................................27
Figure 12. First Tier Hierarchy Values ..........................................................................29
Figure 13. Cost Branch...................................................................................................31
Figure 14. Desirable Material Properties Branch...........................................................32
Figure 15. Shelf Life Branch..........................................................................................34
Figure 16. Site Preparation Required Branch.................................................................34
Figure 17. Workability Branch.......................................................................................35
Figure 18. Complete Hierarchy ......................................................................................37
Figure 19. Cost per Yield SDVF....................................................................................44
viii
Page
Figure 20. Requires Specialized Aggregates..................................................................45
Figure 21. ASTM C 882 SDVF......................................................................................46
Figure 22. ASTM C 39 SDVF........................................................................................46
Figure 23. ASTM C 666 SDVF......................................................................................47
Figure 24. SDVF for Early Strength (ASTM C 39 after 3 hours of curing) ..................48
Figure 25. Modulus of Elasticity Differential from Substrate SDVF ............................49
Figure 26. Restrained Shrinkage SDVF.........................................................................50
Figure 27. Thermal Coefficient SDVF (deviation from 5 microstrains/°F)...................51
Figure 28. Shelf Life SDVF ...........................................................................................51
Figure 29. SDVF for Bonding Agent Requirement .......................................................52
Figure 30. SDVF for Material Hydrophobicity..............................................................53
Figure 31. SDVF for Aggregate/Lift Requirement ........................................................53
Figure 32. SDVF for Initial Set Time (deviation from 45 minutes)...............................54
Figure 33. Alternative Rankings under Conventional Weighting..................................58
Figure 34. Alternative Rankings with Respect to Fundamental Objectives (Conventional
Weighting) ....................................................................................................59
Figure 35. Alternative Rankings with Respect to Evaluation Measures (Conventional
Weighting) ....................................................................................................60
Figure 36. Ranking of Alternatives using Contingency Weighting ...............................61
Figure 37. Alternative Ranking with Respect to Fundamental Objectives (Contingency
Weighting) ....................................................................................................62
ix

Figure 38. Alternative Ranking with Respect to Evaluation Measures (Contingency
Weighting) ....................................................................................................63
Figure 39. Sensitivity Analysis on Cost Value...............................................................65
Figure 40. Sensitivity Analysis on Desirable Material Properties Value.......................65
Figure 41. Sensitivity Analysis on Shelf Life Value......................................................66
Figure 42. Sensitivity Analysis on Site-Preparation Required Value ............................67
Figure 43. Senstivity Analysis on Workability Value....................................................67
x

List of Tables
Page Table 1. Definitions of First Tier Values .......................................................................30 Table 2. Desired Material Properties Values .................................................................33 Table 3. Desired Material Properties Measures .............................................................39 Table 4. Weight Assignments for Conventional Spall Repair .......................................41 Table 5. Weight Assignments for Contingency Spall Repair ........................................42 Table 6. Repair Materials Scored in Model ...................................................................55 Table 7. Summary Matrix of Alternative Scores ...........................................................57 Table 8. Summary of Weight Sensitivity on Values................................................ 69-71 Table 9. Summary of Research Questions .....................................................................72
xi
A VALUE-FOCUSED THINKING MODEL FOR THE SELECTION OF THE BEST RIGID PAVEMENT, PARTIAL-DEPTH SPALL REPAIR MATERIAL
I. Introduction
1.1 Overview
Portland Cement Concrete (PCC) is the most common pavement surface used in airfield
runways, taxiways and parking aprons. When properly designed, constructed, and maintained, it
provides a smooth surface capable of supporting the loads and tire pressures of all types of
aircraft. However, PCC pavements that have outlived their useful lives or that have not been
maintained may develop cracks and spalls that are damaging to the pavement surface. A spall is
a pavement distress in the form of a crack, often along pavement joints and edges. Figure 1
shows typical spalls in concrete pavement. Spalls are commonly partial depth, but may be full
depth, in which case the structural capacity of the slab is weakened. Repairing spalls as they
occur is important for maintaining the health of airfield pavements, and is essential to the safety
of aircraft as they take off, land, and taxi. Engineers from all branches of service perform these
repairs, to include Air Force Civil Engineers, Navy Seabees, and Army Combat Engineers.
1
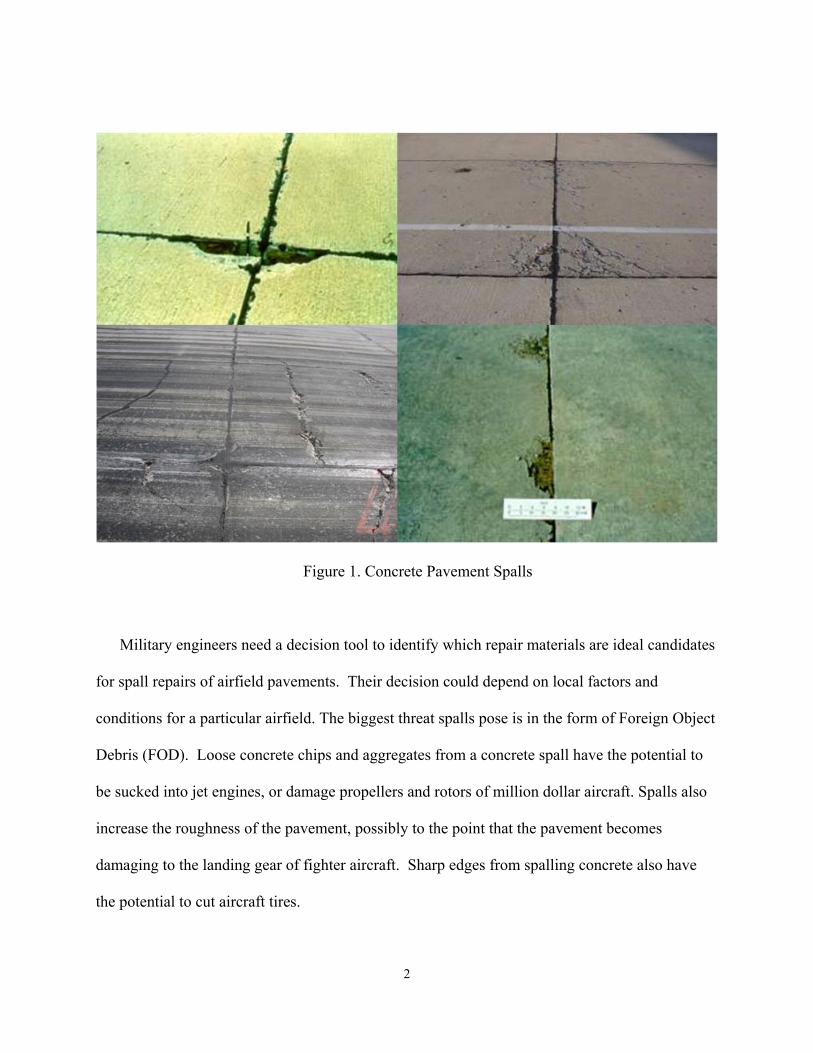
Figure 1. Concrete Pavement Spalls
Military engineers need a decision tool to identify which repair materials are ideal candidates
for spall repairs of airfield pavements. Their decision could depend on local factors and
conditions for a particular airfield. The biggest threat spalls pose is in the form of Foreign Object
Debris (FOD). Loose concrete chips and aggregates from a concrete spall have the potential to
be sucked into jet engines, or damage propellers and rotors of million dollar aircraft. Spalls also
increase the roughness of the pavement, possibly to the point that the pavement becomes
damaging to the landing gear of fighter aircraft. Sharp edges from spalling concrete also have
the potential to cut aircraft tires.
2
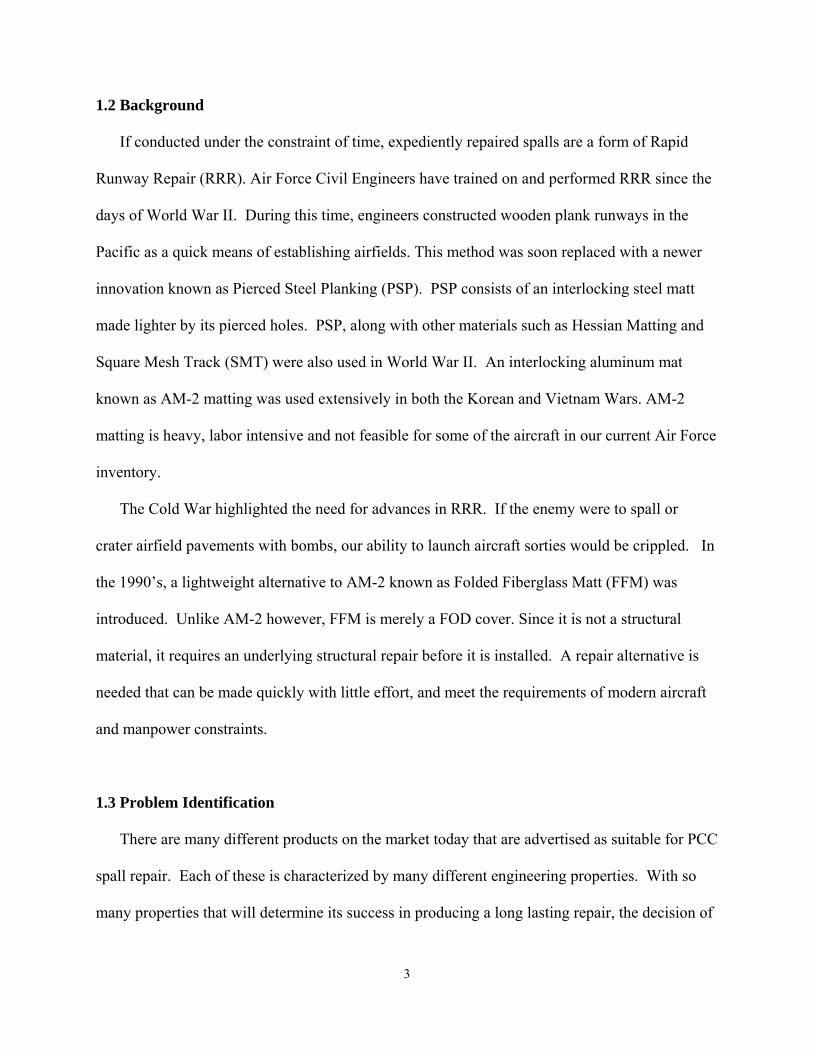
1.2 Background
If conducted under the constraint of time, expediently repaired spalls are a form of Rapid
Runway Repair (RRR). Air Force Civil Engineers have trained on and performed RRR since the
days of World War II. During this time, engineers constructed wooden plank runways in the
Pacific as a quick means of establishing airfields. This method was soon replaced with a newer
innovation known as Pierced Steel Planking (PSP). PSP consists of an interlocking steel matt
made lighter by its pierced holes. PSP, along with other materials such as Hessian Matting and
Square Mesh Track (SMT) were also used in World War II. An interlocking aluminum mat
known as AM-2 matting was used extensively in both the Korean and Vietnam Wars. AM-2
matting is heavy, labor intensive and not feasible for some of the aircraft in our current Air Force
inventory.
The Cold War highlighted the need for advances in RRR. If the enemy were to spall or
crater airfield pavements with bombs, our ability to launch aircraft sorties would be crippled. In
the 1990’s, a lightweight alternative to AM-2 known as Folded Fiberglass Matt (FFM) was
introduced. Unlike AM-2 however, FFM is merely a FOD cover. Since it is not a structural
material, it requires an underlying structural repair before it is installed. A repair alternative is
needed that can be made quickly with little effort, and meet the requirements of modern aircraft
and manpower constraints.
1.3 Problem Identification
There are many different products on the market today that are advertised as suitable for PCC
spall repair. Each of these is characterized by many different engineering properties. With so
many properties that will determine its success in producing a long lasting repair, the decision of
3
which one to use becomes difficult. Although one material may excel in certain respects, it may
be lacking in others. Finding the clear winner is difficult, and will ultimately depend on the
performance characteristics that produce the best results for the decision maker. For example, in
cases where the repair does not need to be ready for traffic immediately after placement, the
decision maker would place little importance on the material’s early strength. Therefore, a
decision tool is needed that can be tailored to each decision maker’s unique situation. This tool
would rank order repair-material alternatives based on the importance that the decision maker
places on the objectives of runway repair and pavement repair materials. The military decision
maker would then have a tool to allow him or her to choose the best repair material for the
airfield at his or her installation.
Another advantage to this tool will be the identification of new materials that are suitable for
testing. Prior to fielding spall repair materials for wartime use, materials often undergo testing
by research agencies within the DOD. These agencies include the Air Force Civil Engineer
Support Agency (AFCESA), the Air Force Research Lab (AFRL), and the US Army Corps of
Engineers Waterways Experiment Station Engineering Research and Development Center
(USACE WES ERDC). However, field testing can be expensive, time consuming, and requires
special equipment. Because there is an abundance of concrete repair products on the commercial
market, a decision tool is needed to determine which products are worthy of testing and which
are not.
1.4 Research Questions
4

In order to create an effective decision-making tool, the following research questions will be
addressed by this study:
1. What are the characteristics that engineers look for in an ideal repair material?
2. What characteristics and properties are uniquely important to military engineers in the
repair of airfield pavements?
3. What is the appropriate methodology for choosing the best pavement repair material?
4. What are the available materials suitable for concrete spall repair?
5. Which material(s) should military engineers select for concrete pavement spall repair?
1.5 Research Approach
Evaluating different repair materials may be difficult because each has different strengths and
weaknesses. In order to compare these materials on the same scale, this research will create a
decision tool that allows the decision maker to assign his or her own values, risk preferences, and
objectives to determine which repair alternative is best in his or her situation. The methodology
that does this best is Value Focused Thinking (VFT). VFT is a strategic, quantitative approach
to decision making that uses specified objectives, evaluation measures, and value hierarchies
(Kirkwood, 1997). VFT follows a process of five steps when faced with decision problems:
recognize a decision problem, specify values, create alternatives, evaluate alternatives, and select
an alternative. VFT is different from traditional approaches because traditional methods look for
alternatives before considering values. Once values are specified, evaluation measures are
determined to effectively score the alternatives. A single-dimensional value function is then
created to compare the scores of each alternative on the same scale. The alternative with the
highest score will be selected as the best alternative.
5
1.6 Scope
Alternatives will be chosen for this model that best fulfill the decision maker’s objectives in
the value hierarchy. However, because testing is limited on some repair material properties, the
alternatives chosen may be limited to those with complete data on the value hierarchy measures.
In addition, repair materials for asphalt pavements are not considered; this research is restricted
to the selection of repair materials intended for PCC pavements only. Furthermore, only partial-
depth (occurring in the top one third of pavement thickness) spall repairs will be considered.
Another limitation to this model is that the weights are assigned subjectively, and may differ
from the weights of the end user.
1.7 Significance
By employing this tool to select the best repair material for airfield pavements, military
decision makers will be able to make quality repairs that best suit their situation. This model will
predict the best material to use when faced with many repair products available on the market.
The model will also serve as a tool to assist engineers in choosing which of these materials
should undergo the cost of additional field testing.
In today’s Global War on Terrorism, US forces are encountering airfield pavements on
foreign airbases in less-than-ideal shape. Civil Engineer crews are conducting spall repairs on a
daily basis, during times when runways are shut down specifically for this purpose. Currently,
Pavemend© is the predominant spall repair material in use by Civil Engineer crews on foreign
airfields. The question of whether this material is best is still not clear-- crews have experienced
early failures with this material. Figure 2 shows a pavement repair that has failed. The reason for
6
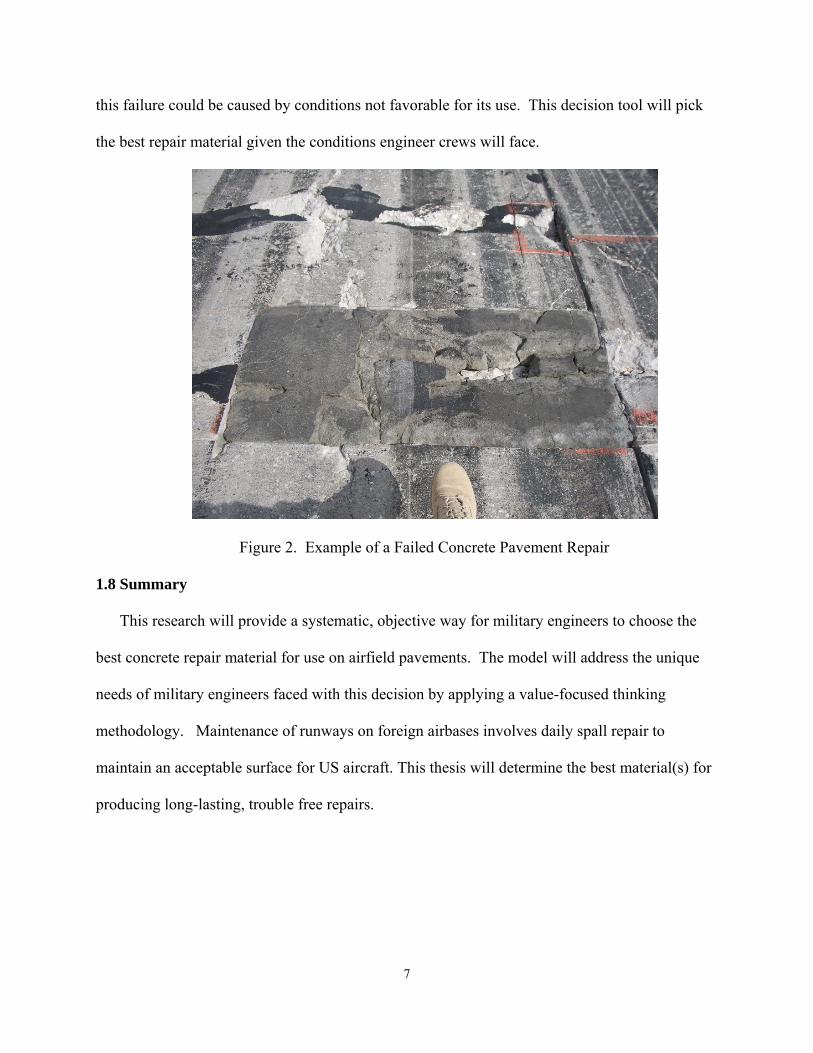
this failure could be caused by conditions not favorable for its use. This decision tool will pick
the best repair material given the conditions engineer crews will face.
Figure 2. Example of a Failed Concrete Pavement Repair
1.8 Summary
This research will provide a systematic, objective way for military engineers to choose the
best concrete repair material for use on airfield pavements. The model will address the unique
needs of military engineers faced with this decision by applying a value-focused thinking
methodology. Maintenance of runways on foreign airbases involves daily spall repair to
maintain an acceptable surface for US aircraft. This thesis will determine the best material(s) for
producing long-lasting, trouble free repairs.
7

II: Literature Review
2.1 Overview
Many techniques have been used in the past to solve construction maintenance and repair
decisions. This chapter will first examine past methodologies that have been used to solve
pavement maintenance and other construction related decisions. Next, traditional methods for
testing and comparing concrete repair materials will be investigated, along with a look at the
qualities and properties that are needed for repair materials to produce a long lasting repair.
Finally, this chapter will introduce the multiple objective decision making method known as
Value-Focused Thinking.
2.2 Decision Analysis Approaches
2.2.1 Analytical Hierarchy Process (AHP)
The Analytical Hierarchy Process was developed by Thomas Saaty (1990:1-39) as a way
to decompose a complex problem into a series of one on one comparisons. This method is first
approached by decomposing the problem into a hierarchy of criteria and alternatives. Next,
pairwise comparisons are made to determine the importance of one criterion over another. These
comparisons are then arranged into a matrix. By calculating an eigenvector from this matrix, one
can determine the rankings of priorities. This gives the weights of the values in the hierarchy.
Next, pairwise comparisons are made against the alternatives for each respective value. This
8

information is then placed into a matrix, and the eigenvector calculated. The eigenvector gives
the rankings for the alternatives for a particular value. The summation of the alternative’s value
ranking times the respective weights for each value gives the final score for each alternative.
The alternative with the greatest score is the best alternative (Saaty 1990).
Miroslaw Skibniewski and Li-Chung Chao (1992) demonstrated the Analytical Hierarchy
Process’s usefulness to the construction industry by showing how it can quantify the intangible
benefits of new or advanced construction technologies along with the risks of implementation.
With this process, the attributes of a new and existing construction technology are compared
pairwise according to the decision maker’s knowledge and experience. Likewise, the relative
importance of each criterion is determined by the decision maker’s judgment and perception
(Skibniewski, 1992:580). In Skinbiewski’s example, a semiautomated tower-crane is compared
against a traditional tower-crane. In their example, the semiautomated crane achieved a slightly
higher score against the traditional crane. However, if a different decision maker were to go
through this process, the outcome may change.
2.2.2 Life Cycle Cost Analysis (LCCA)
The American Institute of Architects (AIA) defines a life cycle cost analysis (LCCA) as
“The calculation of expected future operating, maintenance, and replacement costs of designs
and features to assist owners in developing a realistic design and budget estimate” (AIA, 2006).
Al-Mansour and Sinha (1994) used the LCCA technique to make pavement maintenance
decisions on deteriorating asphalt pavements. They considered four options for rehabilitating a
pavement: do nothing, perform Basic Routine Maintenance (BRM), perform BRM and chip
sealing, or perform BRM and sand sealing.
9
By performing a present worth analysis for all alternatives, the most economical
maintenance alternative was determined. Additionally, the authors used available data to
develop a set of pavement condition prediction models to determine the effectiveness of
maintenance activities. Data was also used to determine the relationship between a pavement
serviceability index (PSI) and age. Using statistical regression, the authors found that:
PSI = a + b*Age (1) Where PSI = pavement serviceability index Age= pavement age (in years) since construction or last resurfacing a,b = estimated regression parameters
Using the same method, the authors found that the gain in PSI due to seal coating follows the
below relationship:
ΔPSI = a*(PSI – b) (2) Where ΔPSI = gain in pavement serviceability due to seal coating PSI = PSI at time of seal coating a, b = estimated regression parameters
By using a computer program to perform the LCCA, the authors were able to experiment
with the cost variations caused by varying the PSI at which resurfacing was performed. They
concluded that the optimal timing to perform sealing from a cost standpoint occurs when the PSI
reaches a value of 3.25. They recommend that BRM should be performed along with seal
coating, but seal coating should not be postponed beyond a PSI value of 3.0. They did not find
any major cost difference in comparing chip sealing vs. sand sealing. (Al-Mansour, 1994)
2.2.3 Expert Systems
10
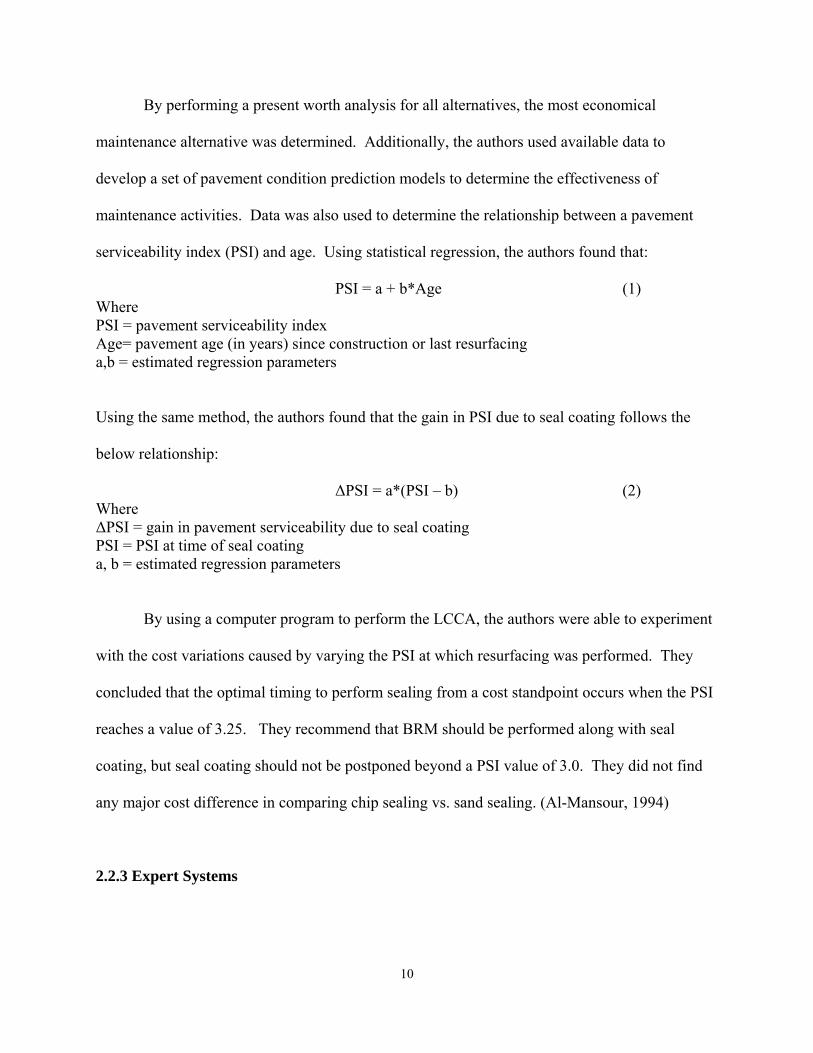
An expert system is an interactive, problem-solving software program that emulates the
knowledge of a human expert in a specific area. Ritchie et al., (1986) developed an expert
system named SCEPTRE 1.1 to make flexible pavement rehabilitation strategies for state-
maintained highways. To begin the program, the user selects one of six forms of pavement
distresses: 1. Corrugation, waves, sags, and humps, 2. alligator cracking, 3. raveling or flushing,
4. longitudinal cracking, 5. transverse cracking, 6. patching. Once the particular type of
pavement distress is chosen, the program asks the user to answer a set of categorical questions
about the condition of the pavement. For example, if alligator cracking is selected as the type of
pavement distress, the program requests the following inputs, summarized in Figure 3:
Figure 3. Variable Inputs on SCEPTRE 1.1 Program (Ritchie, 1986:100)
11
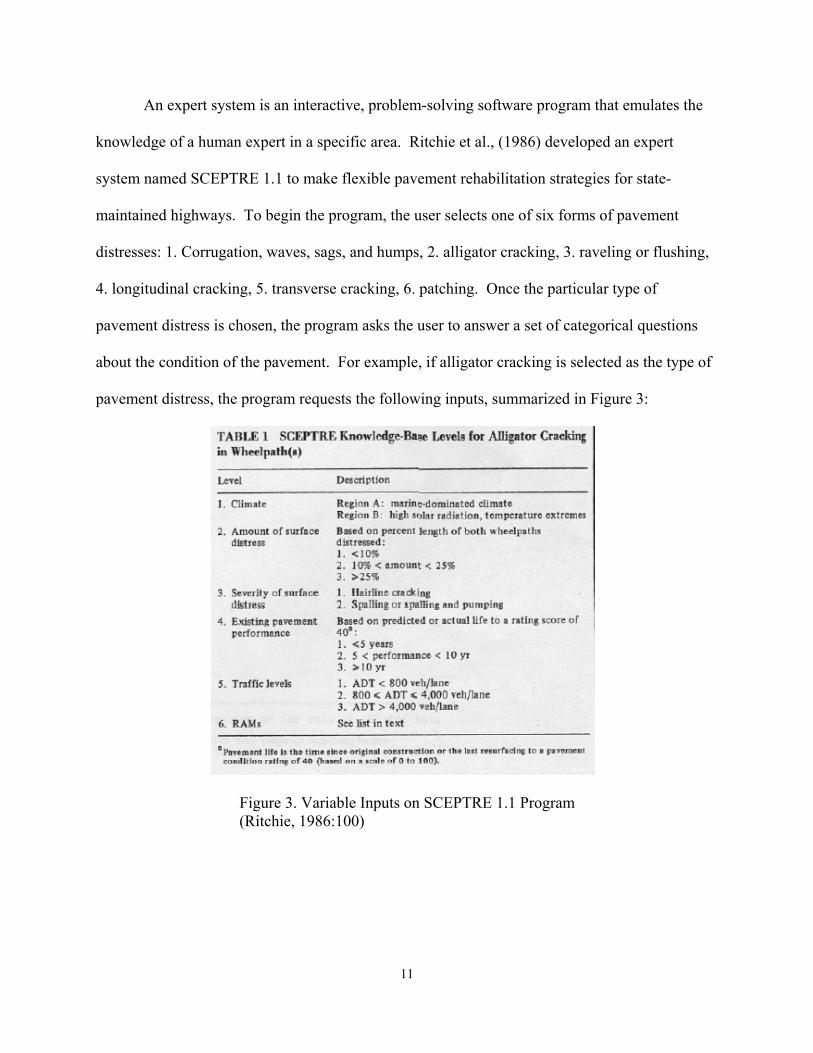
Once these questions are answered, the program generates a set of Rehabilitation and
Maintenance Strategies (RAMs). Expected service life and the associated probability the
pavement will exceed this life are shown in the output (see Figure 4)
Figure 4. SCEPTRE 1.1 Expected Pavement Service Life Output (Ritchie, 1986:102)
Expert systems are ideal to use for problems that meet the following criteria:
-Algorithmic solutions are impractical because of complex physical, social, political, or judgmental components -Experts exist in the field -An expert is not physically available -Tasks are largely cognitive (Ritchie, 1986:97) Expert systems differ from conventional computer programs in that an explicit problem-solving
algorithm is not needed since every knowledge element is already stored and outputted
depending on the user responses to the initial questions. To state this another way, human
experts have programmed the software to output a particular RAM depending on the
combination of pavement condition inputs by the user. This makes the software useful as a
learning tool, and to pass on acquired wisdom of senior transportation engineers to others in the
Department of Transportation (DOT).
12

An Expert System was later developed in 1994 by Khan et al. (1994:1-16) to gather data
from California Department of Transportation engineers, and determine design features and
project scope for resurfacing, restoration, and rehabilitation (RRR) pavement projects. The
Expert System was designed to prevent underestimation of project-costs, which was frequently
occurring on projects expanded to include RRR safety enhancements. The program allowed
Caltrans (California DOT) engineers to input data from both office records and field assessments
into the software. The software can then recommend design features and an appropriate project
scope by accessing data from past projects. Use of this tool helps Caltrans engineers develop
more accurate project cost estimates.
2.3 Property testing and field performance of repair materials
Research on concrete repair materials has not revealed any exact methodologies to follow
for choosing the best repair material for a particular application. Instead, it has focused on the
performance properties of the material, and attempts have been made to correlate these properties
with durability and crack resistance of repairs. According to P.H. Emmons et al., leading
researchers in the concrete repair field, there are two difficulties with selecting repair materials;
the lack of industry-wide reliable testing standards, and the lack of generally accepted
performance criteria (2000:38). This section will review the current state of research on the
performance and selection criteria of concrete repair materials.
Although this section describes the properties that are considered important for the
selection of a good repair material, it should be emphasized that these properties should be
looked at as a whole—any one single property will not determine the success and durability of a
13

repair. It should also be noted that the selection of a repair material is only one of many
interrelated steps needed to produce a quality repair. Equally important are the method of
application, surface preparation, construction practices, and follow on inspection (Emmons
1994:43). The influence diagram in Figure 5 shows the interrelationship of factors that affect the
durability of a concrete repair system.
Figure 5. Factors Affecting Durability of a Concrete Repair System (Emmons, 1994:43)
Spalling, cracking, scaling and loss of strength are all symptoms of durability problems
within a concrete repair system. Depending on the structure to be repaired and the type of
damage, the reason for the repair may vary. However, Edward Rizzo and Martin Sobelman
(1989:46) identified three basic requirements that a repair material should fulfill: 1. The repair
must arrest the deterioration of the structure. 2. The repair must restore the structural integrity,
14
and have strength properties similar to those of the substrate. 3. The repair must provide an
esthetically acceptable finish. In the case of pavement repair, esthetics, mentioned in the third
requirement, should be of little importance. The first and second requirements however, agree
with the nature of pavement repairs. One could also argue there is an additional requirement of
restoring smoothness to the pavement.
2.3.1 Material Properties
2.3.1.1 Compatibility
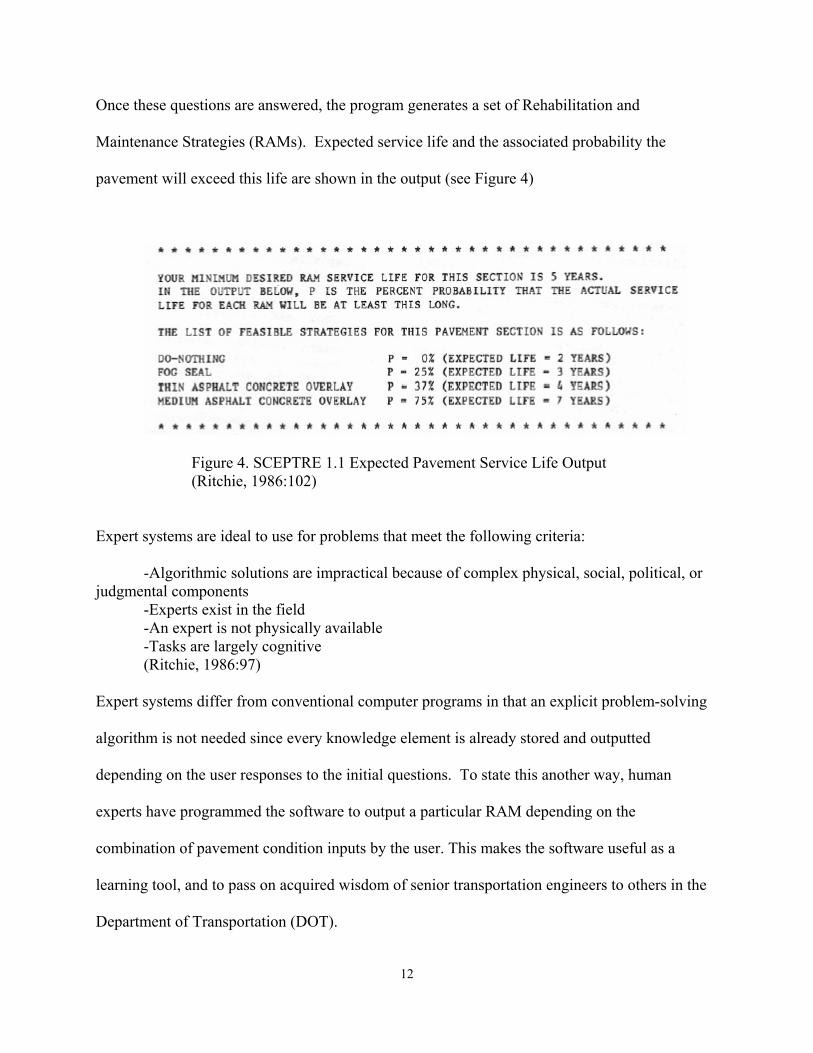
Compatibility is regarded as one of the most important factors in producing durable
repairs. As shown in Figure 6, compatibility is the balance of physical, chemical, permeability
and electrochemical properties and dimensions between the repair material and existing
substrate.
Figure 6. Properties that Affect Compatibility between Repair Material and Substrate (Emmons, 1994:44)
15
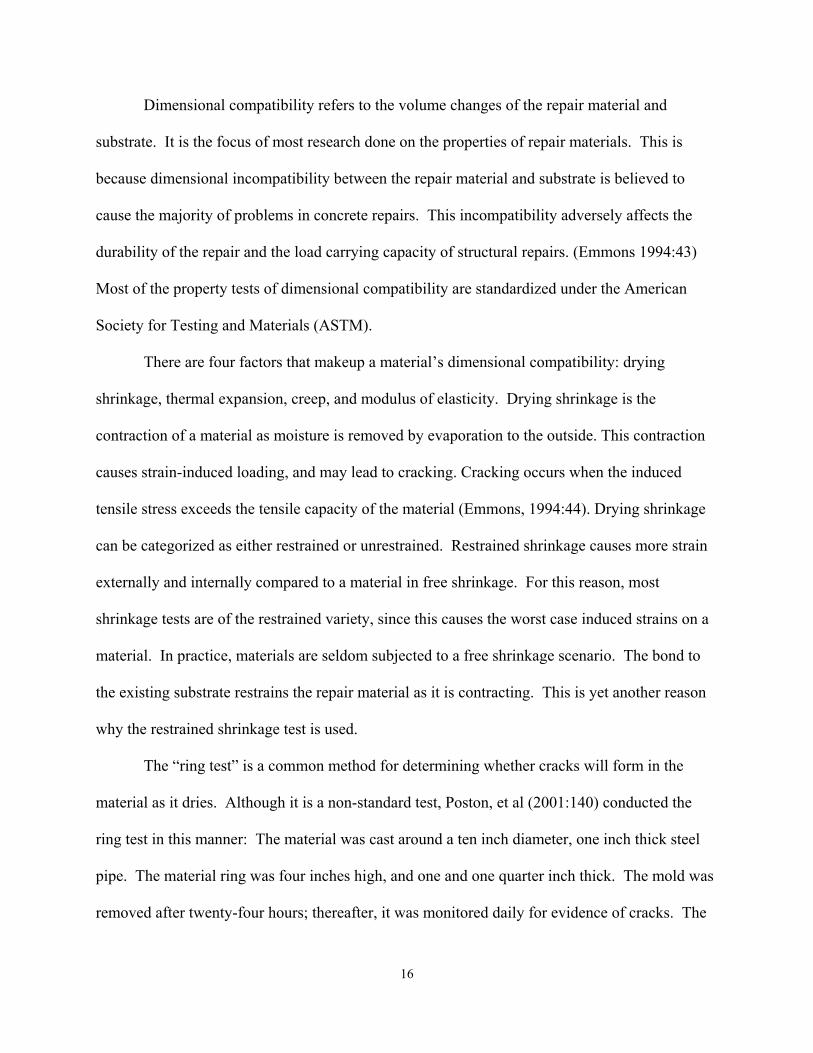
Dimensional compatibility refers to the volume changes of the repair material and
substrate. It is the focus of most research done on the properties of repair materials. This is
because dimensional incompatibility between the repair material and substrate is believed to
cause the majority of problems in concrete repairs. This incompatibility adversely affects the
durability of the repair and the load carrying capacity of structural repairs. (Emmons 1994:43)
Most of the property tests of dimensional compatibility are standardized under the American
Society for Testing and Materials (ASTM).
There are four factors that makeup a material’s dimensional compatibility: drying
shrinkage, thermal expansion, creep, and modulus of elasticity. Drying shrinkage is the
contraction of a material as moisture is removed by evaporation to the outside. This contraction
causes strain-induced loading, and may lead to cracking. Cracking occurs when the induced
tensile stress exceeds the tensile capacity of the material (Emmons, 1994:44). Drying shrinkage
can be categorized as either restrained or unrestrained. Restrained shrinkage causes more strain
externally and internally compared to a material in free shrinkage. For this reason, most
shrinkage tests are of the restrained variety, since this causes the worst case induced strains on a
material. In practice, materials are seldom subjected to a free shrinkage scenario. The bond to
the existing substrate restrains the repair material as it is contracting. This is yet another reason
why the restrained shrinkage test is used.
The “ring test” is a common method for determining whether cracks will form in the
material as it dries. Although it is a non-standard test, Poston, et al (2001:140) conducted the
ring test in this manner: The material was cast around a ten inch diameter, one inch thick steel
pipe. The material ring was four inches high, and one and one quarter inch thick. The mold was
removed after twenty-four hours; thereafter, it was monitored daily for evidence of cracks. The
16

day that cracking was first observed was recorded. This test has now been standardized as
ASTM C1581-04.
Repair materials, like most any material, will expand and contract with changes in
temperature. If the coefficients of thermal expansion of a repair patch and substrate are too
dissimilar, high stress will develop at the bond interface. This may ultimately result in bond
failure and the ejection of the repair patch from the spall. Ideally, the coefficient of thermal
expansion should match that of the existing substrate. (ACI Committee 546, 2006:6)
Coefficient of thermal expansion testing is done in accordance with the ASTM C 531 procedure.
Creep is defined as the time-dependent inelastic deformation occurring with prolonged
application of stress (Emmons, 2000:38). A repair material may experience tensile creep caused
by drying shrinkage, or it may experience compressive strength from structural loads. Although
it is generally accepted that higher creep aids in the relaxation of stresses and strains caused by
restrained shrinkage, a study by McDonald et al (2002:42) found the opposite to be true. In their
study, there was improved field performance in materials with decreased creep. They attributed
this in part to the higher drying shrinkage of materials with high creep characteristics
(McDonald, 2002:42). Regardless, in an airfield pavement-repair scenario, one would not expect
to have a prolonged application of stress, except in the case where an aircraft tire might park on
top of a repair. A pavement repair would be more likely to see cyclic stresses from moving
aircraft. However, as Emmons points out, “very few tests, if any, to date, have incorporated
stress or cyclic stress on the specimen concurrent with exposure to the environment” (Emmons,
2000:42).
Modulus of elasticity, also known as Young’s modulus, is defined as the slope of the
curve that represents stress divided by strain. In non-structural applications, it is generally
17

agreed that decreases in modulus of elasticity reduces the potential for cracking of cement-based
repair materials. This is attributed to creep and stress relaxation of lower modulus materials
reducing the magnitude of stresses induced by drying shrinkage (McDonald, 2002:40).
However, in structural applications where the repair material will see a point load, as in
pavements, differences in Young’s modulus between the substrate and repair patch may lead to
stress concentrations (Emmons, 1994:44). In this case, the bond region is the weak link and
cracks will tend to form there. It is best to select a repair material that will best match the
modulus of the existing substrate. This will help ensure a uniform load transfer across the
section (Rizzo, 1989:48).
Chemical compatibility generally refers to the alkali content, content (tricalcium
aluminate), and chloride content of the repair material. As an example, if a concrete being
repaired included potentially reactive aggregates, a repair material with low alkalinity must be
specified. The reactivity of the material to reinforcing steel must also be considered; a material
with a low pH may damage reinforcement by corrosion. Electrochemical compatibility may be
a problem in the case where a potentially anodic metal area is overlaid. Increasing the
cathode/anode area ratio could accelerate the corrosion process. In this case, methods for
restricting excess water and oxygen in the cathodic area should be considered. (Emmons,
1993:41)
AC3
2.3.2 Other Properties of Concern
When choosing a repair material, there are other important properties beyond
compatibility with the substrate. These other properties include freeze/thaw resistance,
compressive strength, early compressive strength, and bond strength.
18
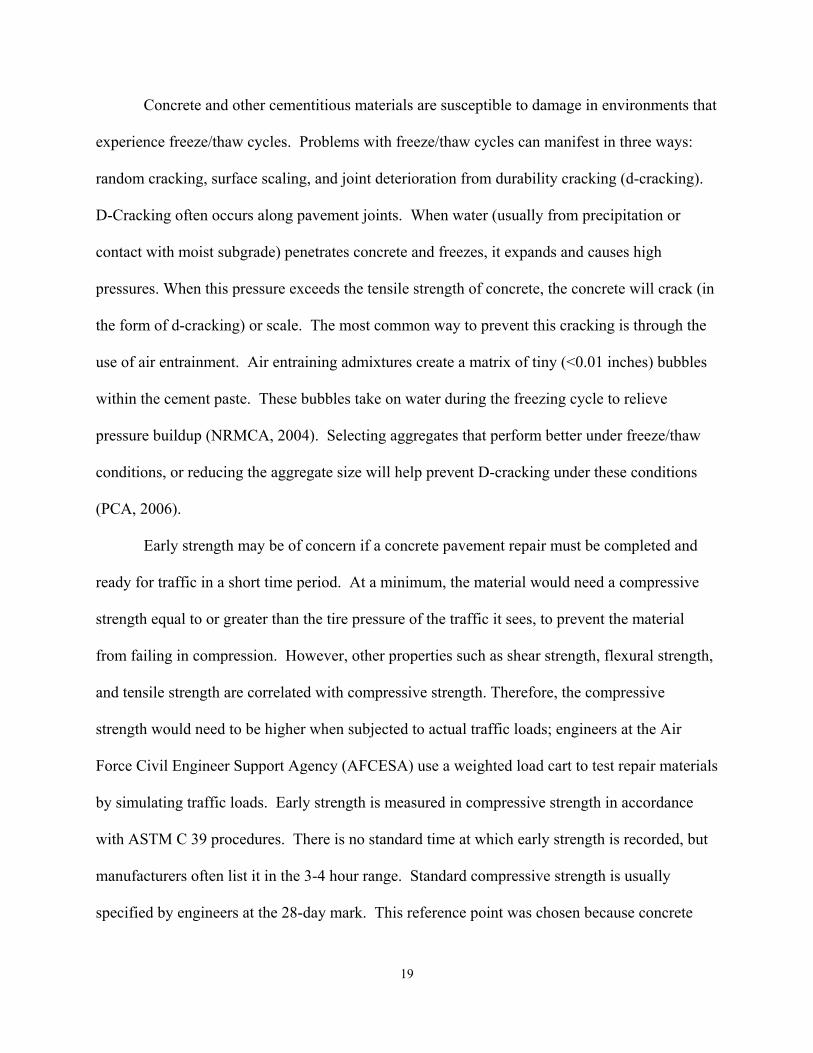
Concrete and other cementitious materials are susceptible to damage in environments that
experience freeze/thaw cycles. Problems with freeze/thaw cycles can manifest in three ways:
random cracking, surface scaling, and joint deterioration from durability cracking (d-cracking).
D-Cracking often occurs along pavement joints. When water (usually from precipitation or
contact with moist subgrade) penetrates concrete and freezes, it expands and causes high
pressures. When this pressure exceeds the tensile strength of concrete, the concrete will crack (in
the form of d-cracking) or scale. The most common way to prevent this cracking is through the
use of air entrainment. Air entraining admixtures create a matrix of tiny (<0.01 inches) bubbles
within the cement paste. These bubbles take on water during the freezing cycle to relieve
pressure buildup (NRMCA, 2004). Selecting aggregates that perform better under freeze/thaw
conditions, or reducing the aggregate size will help prevent D-cracking under these conditions
(PCA, 2006).
Early strength may be of concern if a concrete pavement repair must be completed and
ready for traffic in a short time period. At a minimum, the material would need a compressive
strength equal to or greater than the tire pressure of the traffic it sees, to prevent the material
from failing in compression. However, other properties such as shear strength, flexural strength,
and tensile strength are correlated with compressive strength. Therefore, the compressive
strength would need to be higher when subjected to actual traffic loads; engineers at the Air
Force Civil Engineer Support Agency (AFCESA) use a weighted load cart to test repair materials
by simulating traffic loads. Early strength is measured in compressive strength in accordance
with ASTM C 39 procedures. There is no standard time at which early strength is recorded, but
manufacturers often list it in the 3-4 hour range. Standard compressive strength is usually
specified by engineers at the 28-day mark. This reference point was chosen because concrete
19
will have gained roughly 90% of its strength by this time. 28-day strength is also tested using
ASTM C 39. The units for both are in pounds per square inch (psi) or megapascals (MPa).
Bond strength is important for ensuring a repair patch does not debond or delaminate
from the substrate. Bond strength is tested in accordance with ASTM C 882, also known as the
slant shear test. The test is conducted by forming a three inch diameter, by six inch high
cylindrical mold. Within the mold is the repair material, bonded to ordinary portland cement.
The bond line is thirty degrees from vertical, forming an elliptical area where the two meet. This
specimen is then tested in compression. The stress is calculated as the maximum force applied,
divided by the bond area where the two materials meet (ETL, 2006).
2.4 Decision Analysis
According to Clemen and Reilly (2001:2-3), there are four sources of difficulty that make
solving problems hard. The first is complexity. A decision may have many alternatives, many
courses of outcome, different economic impacts, and different values held by key players in the
decision. Keeping all of these issues in mind may be nearly impossible. By using decision
analysis, a complex problem can be arranged into a structure that can be analyzed. (Clemen &
Reilly, 2001:2)
The second cause of difficulty in decision making is due to the inherent uncertainty of
certain situations. Imagine a decision that involves choosing between two concrete repair
materials—one that has good resistance to freeze/thaw conditions, and another that does not.
Depending on the climate, there may be uncertainty as to how many freeze/thaw cycles the repair
will experience. Decision Analysis can aid in identifying sources of uncertainty, and representing
it in a systematic and meaningful way (Clemen & Reilly, 2001:3).
20

Another difficulty in decision making arises when there are multiple objectives in a
decision. In this case, progress in one objective, may impede progress in another. This would
force the decision maker to tradeoff benefits in one area to benefit another. Decision analysis
provides a framework and tools for dealing with problems that have multiple objectives (Clemen
& Reilly, 2001:3).
The last source of difficulty according to Clemen & Reilly (2001:3) is when different
perspectives lead to different conclusions. This source of difficulty is pertinent when more than
one person is involved in the decision making process. Different individuals may look at the
problem from different viewpoints and disagree on the uncertainty of values of the outcomes.
Decision analysis can help resolve these differences whether the decision maker is an individual
or group (Clemen & Reilly, 2001:3).
Keeney (1993:5-6) describes decision analysis as a five step process: preanalysis,
structural analysis, uncertainty analysis, utility or value analysis, and optimization analysis.
Preanalysis occurs when the decision maker identifies a problem, the alternatives are given, and
the course of action is unknown. The decision maker structures the qualitative anatomy in the
structural analysis step. In the uncertainty analysis step, the decision maker assigns probabilities
to the components of a problem with uncertainty. In the utility or value analysis step, the
decision maker’s unique risk attitude and mindset towards costs and benefits are quantified. In
the final step, optimization analysis, the decision maker calculates the optimal decision strategy
(Keeney, 1993:5-7).
2.4.1 Value-Focused Thinking (VFT)
21
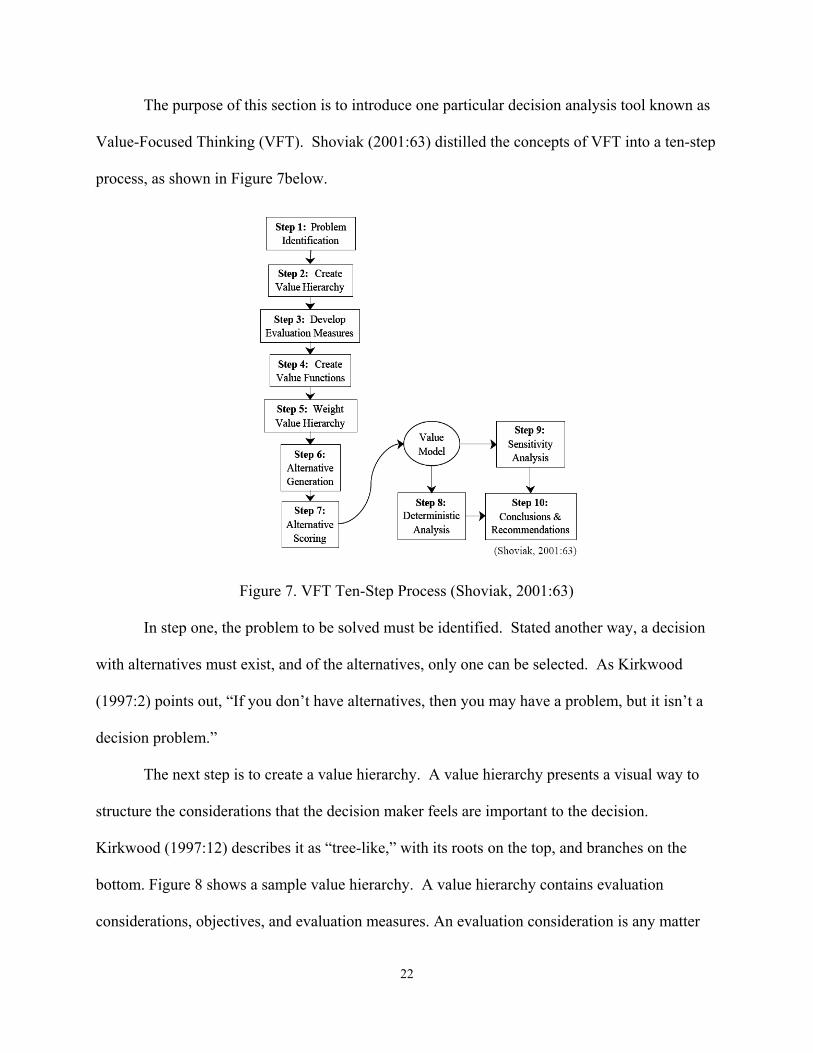
The purpose of this section is to introduce one particular decision analysis tool known as
Value-Focused Thinking (VFT). Shoviak (2001:63) distilled the concepts of VFT into a ten-step
process, as shown in Figure 7below.
Figure 7. VFT Ten-Step Process (Shoviak, 2001:63)
In step one, the problem to be solved must be identified. Stated another way, a decision
with alternatives must exist, and of the alternatives, only one can be selected. As Kirkwood
(1997:2) points out, “If you don’t have alternatives, then you may have a problem, but it isn’t a
decision problem.”
The next step is to create a value hierarchy. A value hierarchy presents a visual way to
structure the considerations that the decision maker feels are important to the decision.
Kirkwood (1997:12) describes it as “tree-like,” with its roots on the top, and branches on the
bottom. Figure 8 shows a sample value hierarchy. A value hierarchy contains evaluation
considerations, objectives, and evaluation measures. An evaluation consideration is any matter
22
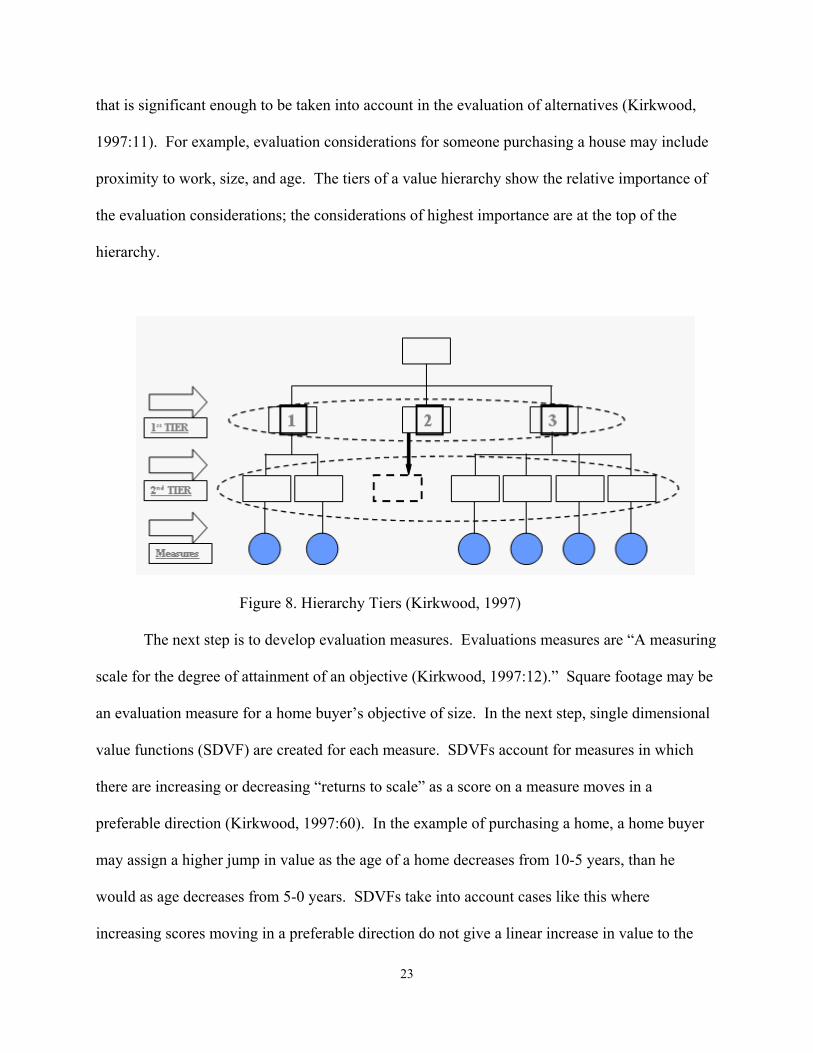
that is significant enough to be taken into account in the evaluation of alternatives (Kirkwood,
1997:11). For example, evaluation considerations for someone purchasing a house may include
proximity to work, size, and age. The tiers of a value hierarchy show the relative importance of
the evaluation considerations; the considerations of highest importance are at the top of the
hierarchy.
Figure 8. Hierarchy Tiers (Kirkwood, 1997)
The next step is to develop evaluation measures. Evaluations measures are “A measuring
scale for the degree of attainment of an objective (Kirkwood, 1997:12).” Square footage may be
an evaluation measure for a home buyer’s objective of size. In the next step, single dimensional
value functions (SDVF) are created for each measure. SDVFs account for measures in which
there are increasing or decreasing “returns to scale” as a score on a measure moves in a
preferable direction (Kirkwood, 1997:60). In the example of purchasing a home, a home buyer
may assign a higher jump in value as the age of a home decreases from 10-5 years, than he
would as age decreases from 5-0 years. SDVFs take into account cases like this where
increasing scores moving in a preferable direction do not give a linear increase in value to the
23
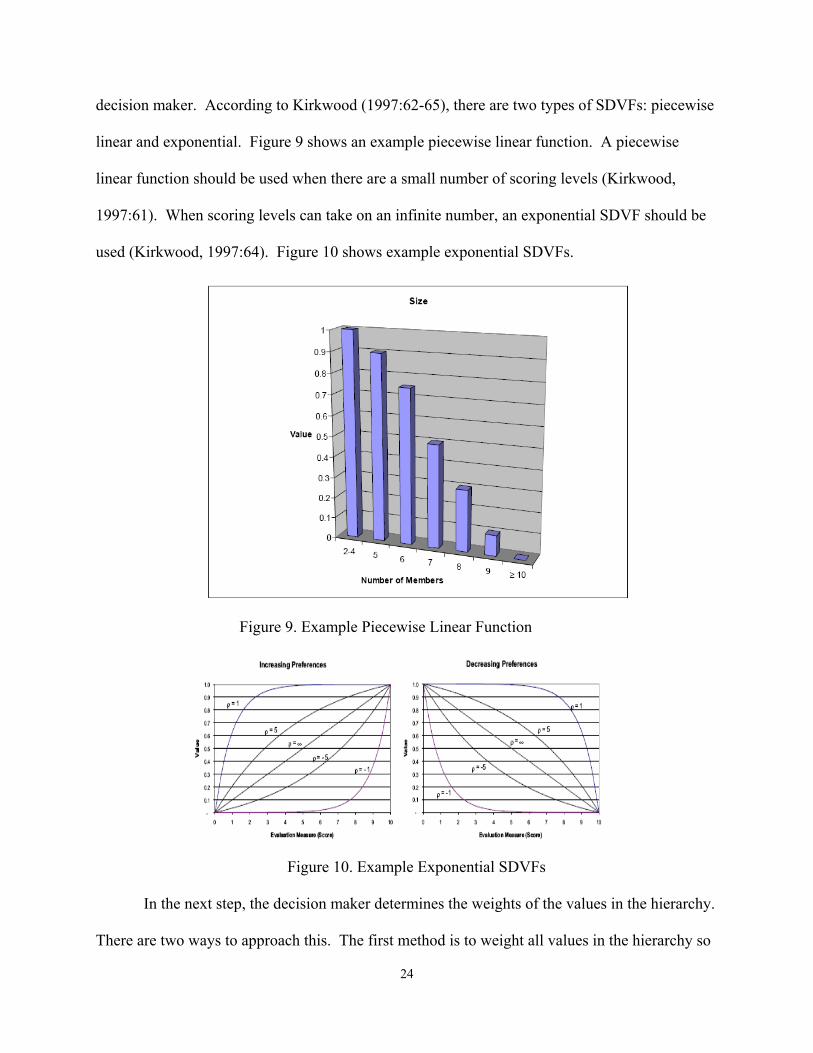
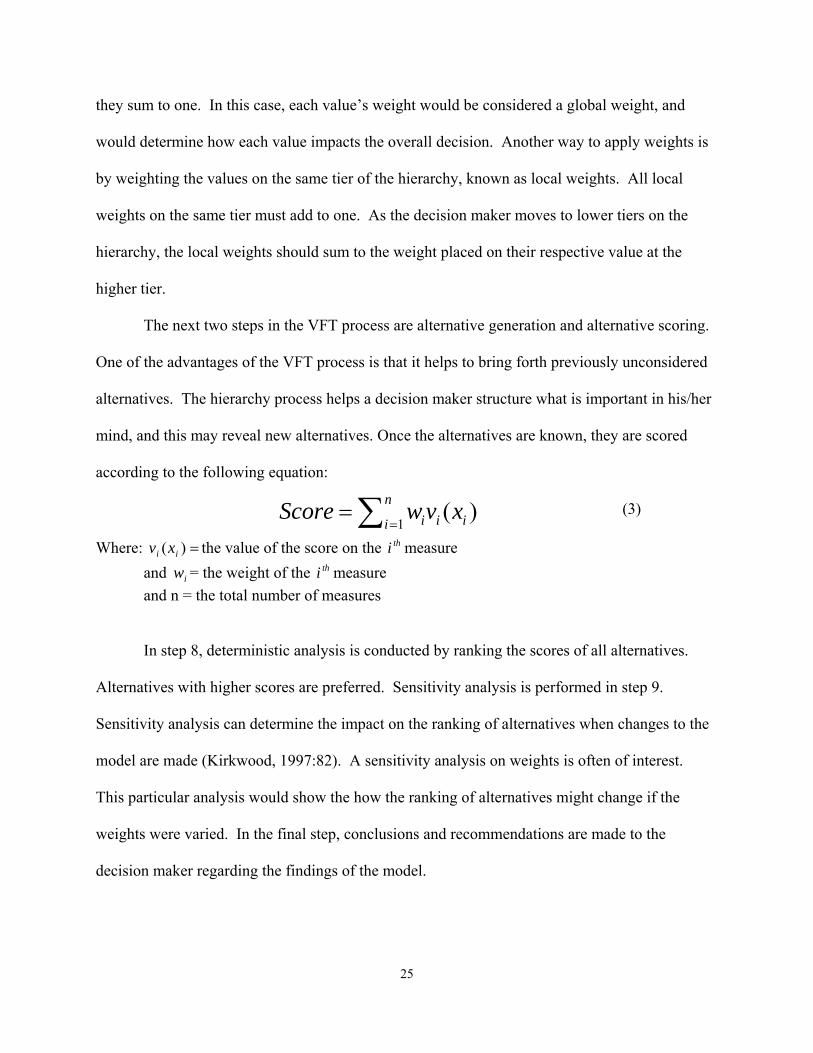
decision maker. According to Kirkwood (1997:62-65), there are two types of SDVFs: piecewise
linear and exponential. Figure 9 shows an example piecewise linear function. A piecewise
linear function should be used when there are a small number of scoring levels (Kirkwood,
1997:61). When scoring levels can take on an infinite number, an exponential SDVF should be
used (Kirkwood, 1997:64). Figure 10 shows example exponential SDVFs.
Figure 9. Example Piecewise Linear Function
Figure 10. Example Exponential SDVFs
In the next step, the decision maker determines the weights of the values in the hierarchy.
There are two ways to approach this. The first method is to weight all values in the hierarchy so
24
they sum to one. In this case, each value’s weight would be considered a global weight, and
would determine how each value impacts the overall decision. Another way to apply weights is
by weighting the values on the same tier of the hierarchy, known as local weights. All local
weights on the same tier must add to one. As the decision maker moves to lower tiers on the
hierarchy, the local weights should sum to the weight placed on their respective value at the
higher tier.
The next two steps in the VFT process are alternative generation and alternative scoring.
One of the advantages of the VFT process is that it helps to bring forth previously unconsidered
alternatives. The hierarchy process helps a decision maker structure what is important in his/her
mind, and this may reveal new alternatives. Once the alternatives are known, they are scored
according to the following equation:
(3) ∑ =
n
i iii xvw1
)(=ScoreWhere: the value of the score on the measure =)( ii xv thi and = the weight of the measure iw thi and n = the total number of measures
In step 8, deterministic analysis is conducted by ranking the scores of all alternatives.
Alternatives with higher scores are preferred. Sensitivity analysis is performed in step 9.
Sensitivity analysis can determine the impact on the ranking of alternatives when changes to the
model are made (Kirkwood, 1997:82). A sensitivity analysis on weights is often of interest.
This particular analysis would show the how the ranking of alternatives might change if the
weights were varied. In the final step, conclusions and recommendations are made to the
decision maker regarding the findings of the model.
25

III. Methodology
3.1 Overview
Finding the best spall repair material for the job is often difficult, given the many choices
in available products, and wide variability in performance on criteria that engineers consider
important to the decision. This chapter will present the process of creating a VFT model to aid
decision makers in ranking available spall repair products for use in airfield pavements. The
decision makers in this process were pavement engineers from various organizations in the
Department of Defense. These organizations include the Air Force Civil Engineer Support
Agency (AFCESA), the Air Force Research Laboratory (AFRL), and the US Army Corps of
Engineers (USACE) Engineer Research and Development Center (ERDC). Because this thesis
used more than one decision maker, creation of the hierarchy, weight assignment, and
construction of value functions required that a consensus was reached on each. In the case where
requirements may change in the future for spall repair scenarios, this process can be adapted and
repeated to meet changing missions.
3.2 Problem Identification
The first step in the VFT process is to identify the problem to be solved. Military
engineers conducting spall repairs at overseas airbases are seeing varied success in the longevity
of repairs. In many cases, early failures are seen in these repairs. These failures may be due to
the use of inferior spall repair products, not suitable for the unique requirements of military
26

engineers maintaining airfield pavements. A decision tool is needed to identify spall repair
products suitable for this application. Although this tool is not meant to replace actual field
testing of products, it will be helpful in narrowing down from a wide list of products, those that
are suitable to be tested in the field. Because field testing is costly and time consuming, this tool
is needed to aid in identifying products that are good candidates to be tested in this manner, and
eliminate those that are not.
3.3 Constructing the Value Hierarchy
A value hierarchy serves as a graphical representation for what is important to decision
makers in a particular decision. Keeney (1992:24) identifies many benefits for using value-
focused thinking, as shown in Figure 11.
Thinking About Values
creating alternatives
guiding strategic thinking
inter- connecting decisions
guiding information collection
facilitating involvement
identifying decision opportunities
evaluating alternatives
improving communication
uncovering hidden objectives
Figure 11. Advantages to using VFT (Keeney, 1992:24)
According to Kirkwood (1997:16-18), a hierarchy should be complete. A complete
hierarchy is one that takes into account all concerns necessary to evaluate the overall objective of
27

the decision. A hierarchy should also be non-redundant, meaning it should not have any two
evaluation considerations in the same tier that overlap. A good hierarchy is one that is
decomposable and independent. In any situation where the value attached to variations in the
level of one evaluation measure depends on the level of another measure, the measures are not
decomposable and independent. This can cause problems when attempting to develop a
procedure to combine evaluation measures to determine the overall preference of alternatives
(1997:18). A hierarchy that is operable is one that is easily understood by the persons who use it.
This is important for repeatability of the process—the hierarchy must be easily understood by
future stakeholders in order to repeat the process. Finally, all other things being equal, a
hierarchy should be small in size. This makes it easier to communicate, and requires fewer
resources to estimate the performance of alternatives with respect to the evaluation measures
(1997:18).
To begin the hierarchy, each of the decision maker’s viewpoints on what was important
to this decision had to be gathered. The decision makers were asked to provide values (issues of
importance) from an engineer’s perspective on necessary criteria to produce quality repairs.
Additionally, decision makers were asked to consider what would be important from an end-
user’s perspective—in this case, that of the workers in the field performing the repair. By
contacting the decision makers by telephone, each gave his thoughts on the matter. Construction
of the hierarchy was an iterative process; as decision makers provided input on values and
measures that belonged in the hierarchy, it was sent for review to the other decision makers until
all were in agreement.
All agreed that the five most important values are low cost, desirable engineering
properties, long shelf life, minimal site preparation required, and good workability. These values
28

are arranged on the first tier of the hierarchy, as shown in Figure 12. Table 1 defines each of the
values on the first tier. The term “goal” as used in the hierarchy is synonymous with value.
Desirable Material Properties
Goal
Workability
Goal
Shelf Life
Goal
Cost Goal
Site Prep. Required
Goal
Best Spall Repair Material Goal
Figure 12. First Tier Hierarchy Values
29
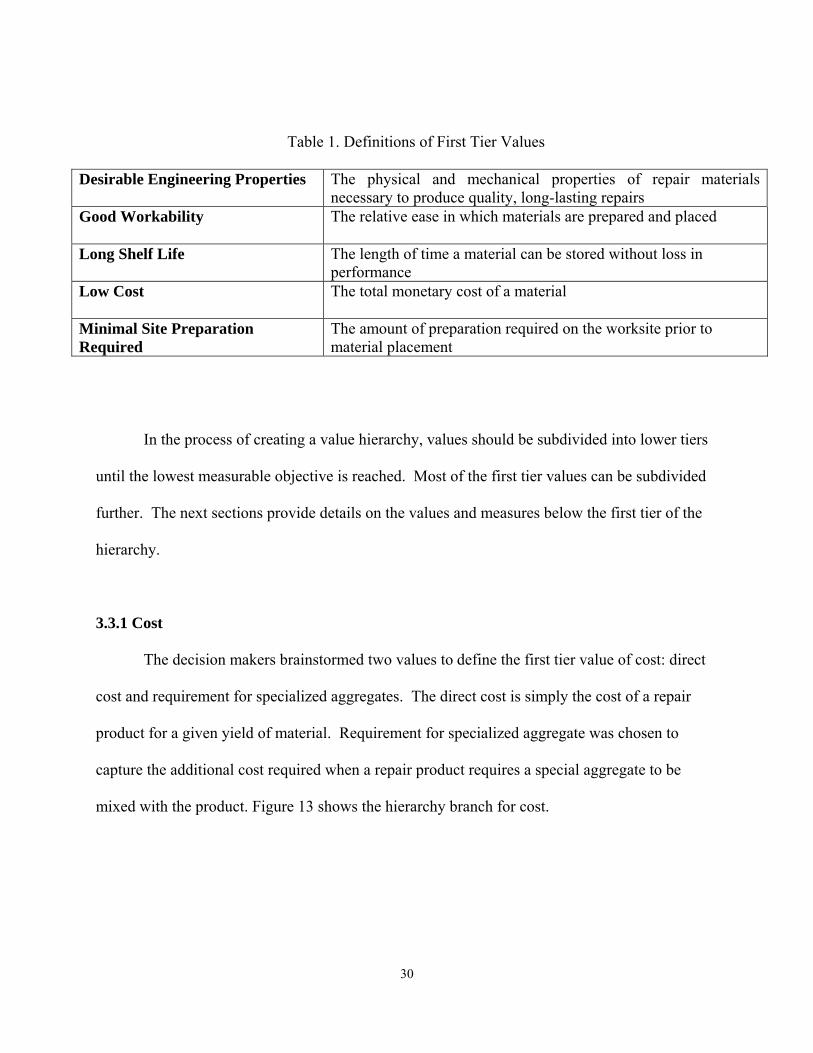
Table 1. Definitions of First Tier Values
Desirable Engineering Properties The physical and mechanical properties of repair materials necessary to produce quality, long-lasting repairs
Good Workability The relative ease in which materials are prepared and placed
Long Shelf Life The length of time a material can be stored without loss in performance
Low Cost The total monetary cost of a material
Minimal Site Preparation Required
The amount of preparation required on the worksite prior to material placement
In the process of creating a value hierarchy, values should be subdivided into lower tiers
until the lowest measurable objective is reached. Most of the first tier values can be subdivided
further. The next sections provide details on the values and measures below the first tier of the
hierarchy.
3.3.1 Cost
The decision makers brainstormed two values to define the first tier value of cost: direct
cost and requirement for specialized aggregates. The direct cost is simply the cost of a repair
product for a given yield of material. Requirement for specialized aggregate was chosen to
capture the additional cost required when a repair product requires a special aggregate to be
mixed with the product. Figure 13 shows the hierarchy branch for cost.
30
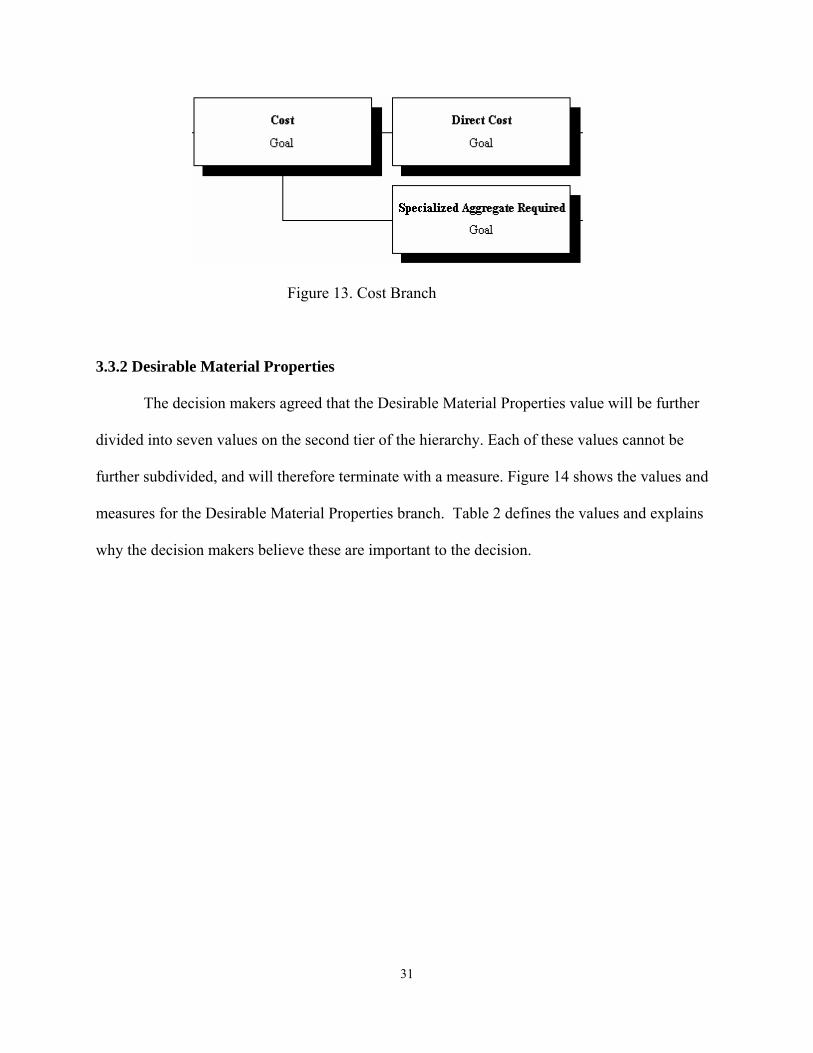
Figure 13. Cost Branch
3.3.2 Desirable Material Properties
The decision makers agreed that the Desirable Material Properties value will be further
divided into seven values on the second tier of the hierarchy. Each of these values cannot be
further subdivided, and will therefore terminate with a measure. Figure 14 shows the values and
measures for the Desirable Material Properties branch. Table 2 defines the values and explains
why the decision makers believe these are important to the decision.
31
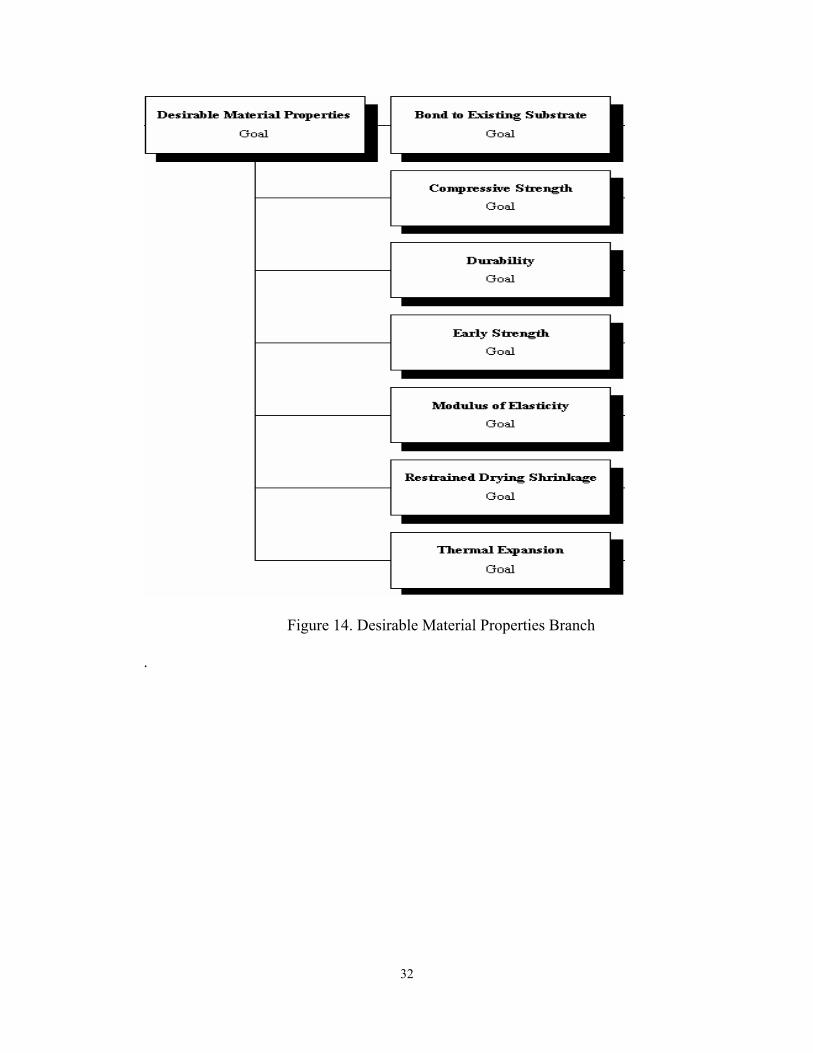
Figure 14. Desirable Material Properties Branch .
32
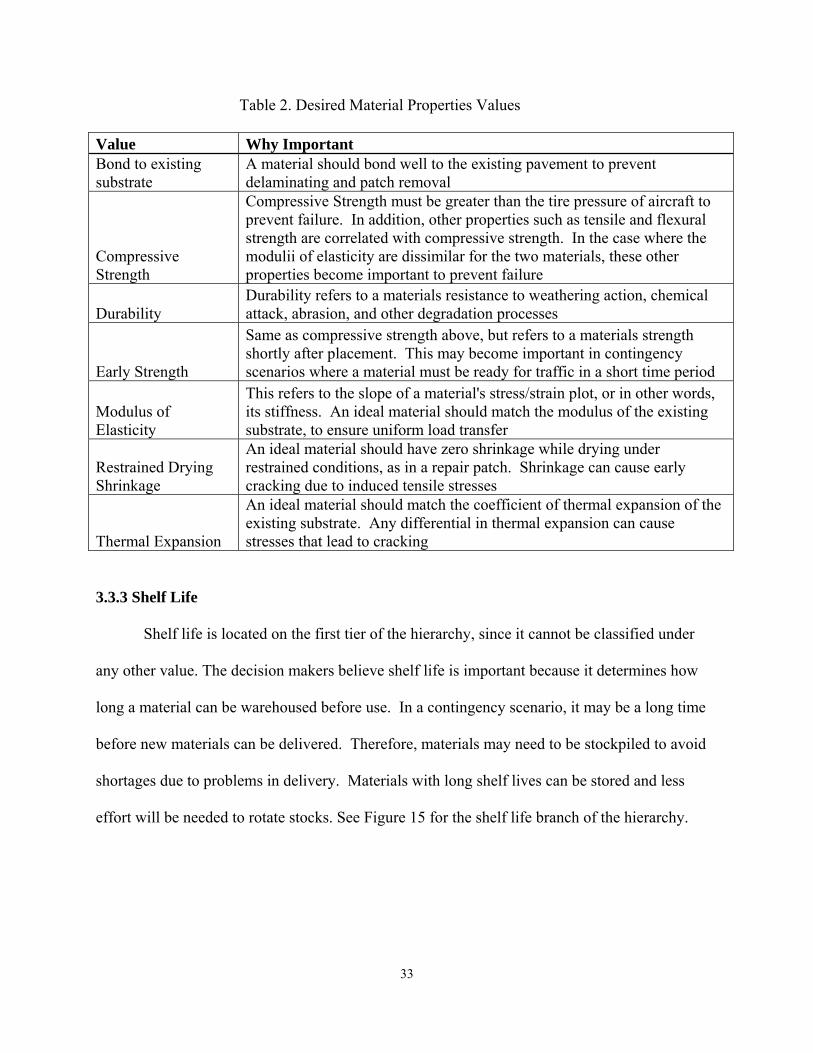
Table 2. Desired Material Properties Values
Value Why Important Bond to existing substrate
A material should bond well to the existing pavement to prevent delaminating and patch removal
Compressive Strength
Compressive Strength must be greater than the tire pressure of aircraft to prevent failure. In addition, other properties such as tensile and flexural strength are correlated with compressive strength. In the case where the modulii of elasticity are dissimilar for the two materials, these other properties become important to prevent failure
Durability Durability refers to a materials resistance to weathering action, chemical attack, abrasion, and other degradation processes
Early Strength
Same as compressive strength above, but refers to a materials strength shortly after placement. This may become important in contingency scenarios where a material must be ready for traffic in a short time period
Modulus of Elasticity
This refers to the slope of a material's stress/strain plot, or in other words, its stiffness. An ideal material should match the modulus of the existing substrate, to ensure uniform load transfer
Restrained Drying Shrinkage
An ideal material should have zero shrinkage while drying under restrained conditions, as in a repair patch. Shrinkage can cause early cracking due to induced tensile stresses
Thermal Expansion
An ideal material should match the coefficient of thermal expansion of the existing substrate. Any differential in thermal expansion can cause stresses that lead to cracking
3.3.3 Shelf Life
Shelf life is located on the first tier of the hierarchy, since it cannot be classified under
any other value. The decision makers believe shelf life is important because it determines how
long a material can be warehoused before use. In a contingency scenario, it may be a long time
before new materials can be delivered. Therefore, materials may need to be stockpiled to avoid
shortages due to problems in delivery. Materials with long shelf lives can be stored and less
effort will be needed to rotate stocks. See Figure 15 for the shelf life branch of the hierarchy.
33

Figure 15. Shelf Life Branch
3.3.4 Site Preparation Required
The decision makers felt that an ideal material would require as little worksite
preparation as possible. Increased site preparation adds more work and time to complete the job.
The decision makers identified two variables in site preparation seen when placing spall repairs.
The first is whether or not a repair material requires a bonding agent. Preparing and placing a
bonding agent coat to the existing substrate adds a step to the repair process, and is not preferred
if avoidable. The second variable found when using spall repair products is whether or not the
product is hydrophobic. A hydrophobic material must be placed on a dry substrate. Drying the
substrate can potentially add a considerable amount of work and time to the repair. The substrate
could be damp at times from weather conditions or wet saw cutting. Figure 16 shows the branch
for Site Preparation Required.
Figure 16. Site Preparation Required Branch
3.3.5 Workability 34
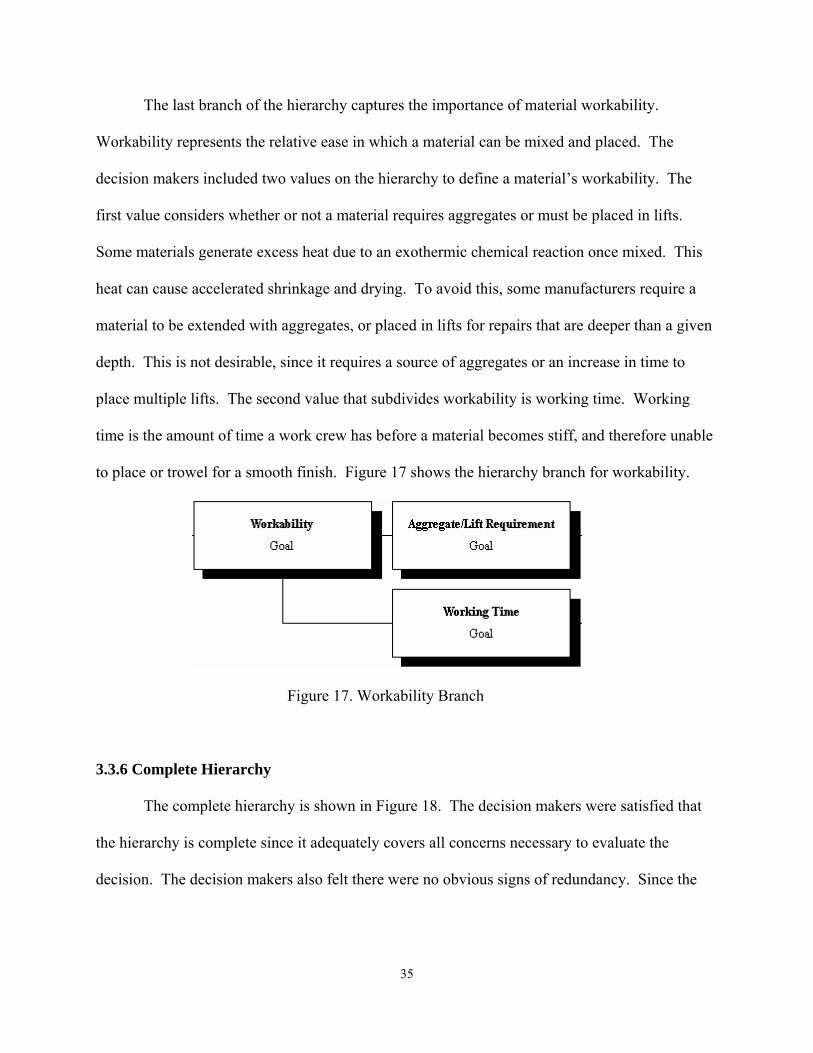
The last branch of the hierarchy captures the importance of material workability.
Workability represents the relative ease in which a material can be mixed and placed. The
decision makers included two values on the hierarchy to define a material’s workability. The
first value considers whether or not a material requires aggregates or must be placed in lifts.
Some materials generate excess heat due to an exothermic chemical reaction once mixed. This
heat can cause accelerated shrinkage and drying. To avoid this, some manufacturers require a
material to be extended with aggregates, or placed in lifts for repairs that are deeper than a given
depth. This is not desirable, since it requires a source of aggregates or an increase in time to
place multiple lifts. The second value that subdivides workability is working time. Working
time is the amount of time a work crew has before a material becomes stiff, and therefore unable
to place or trowel for a smooth finish. Figure 17 shows the hierarchy branch for workability.
Figure 17. Workability Branch
3.3.6 Complete Hierarchy
The complete hierarchy is shown in Figure 18. The decision makers were satisfied that
the hierarchy is complete since it adequately covers all concerns necessary to evaluate the
decision. The decision makers also felt there were no obvious signs of redundancy. Since the
35
hierarchy is complete and non-redundant, it can be said that the values in the hierarchy for this
decision are “collectively exhaustive and mutually exclusive (Kirkwood 1997:17).”
The hierarchy does show limitations in decomposability. Looking at the cost values, a
decision maker may be willing to pay more for a material that does not require specialized
aggregates. Since the value attached to “direct cost” may vary with the level of “specialized
aggregates required,” an independence problem arises. This same situation occurs with “early
strength” and “working time.” Materials with high early strengths are likely to have shorter
working time. Therefore, a decision maker may vary the value attached to working time
depending on the level of early strength.
36

Figure 18. Complete Hierarchy
3.4 Develop Evaluation Measures
Each of the values has an associated measure, shown in the ovals to the right of the
rectangular value boxes. The measures are used to quantify and score the alternatives
performance on each of their respective values. According to Kirkwood (1997:24), measures are
classified as natural or constructed, and as direct or proxy. Natural scales are those in general
37

use and commonly understood by everyone. The slump test, measured in inches concrete has
“slumped” after having been removed from a cone, is a natural scale for evaluating the
workability of concrete. Constructed scales are those that are uniquely developed for a particular
decision problem, such as classifying concrete shrinkage as low, medium, or high. If a measure
is a direct scale, it directly measures the level of attainment of an objective, as in measuring the
shelf life of a repair product in months. A proxy measure on the other hand, reflects the degree
of attainment of an associated objective. Cement type is a proxy measure for the shrinkage of a
cementitious repair material. It should be noted that the determinations of natural versus
constructed and direct versus proxy are not absolute. In reality, they represent the extremes on a
wide range of possibilities (Kirkwood, 1997:24).
3.4.1 Cost
Direct cost will simply be measured by the cost per weight of material. Since the yield in
volume of repair material will vary with water/cement ratio, aggregate extension etc, a simpler
measure of cost per weight of material will be used instead. For example, if a fifty pound sack of
material costs $100, the direct cost is $2/lb. Cost per weight of material is a natural, proxy
measure. Requirement for specialized aggregates is a categorical, binary measure of yes or no.
This measure is natural and direct.
3.4.2 Desired Material Properties
Table 3 lists the values and their associated measures. The units of the evaluation
measures and type of scale are also shown in the table.
38

Table 3. Desired Material Properties Measures
Value Measure Units Scale Bond to existing substrate
ASTM C 882, Standard Test Method for Bond Strength of Epoxy-Resin Systems Used With Concrete By Slant Shear PSI Natural/Direct
Compressive Strength
ASTM C 39, Compressive Strength of Cylindrical Concrete Specimens PSI Natural/Direct
Durability
ASTM C 666, Standard Test Method for Resistance of Concrete to Rapid Freezing and Thawing
% of modulus of elasticity retained after freeze/ thaw cycles Constructed/Proxy
Early Strength ASTM C 39, recorded at 3 hours PSI Natural/Direct
Modulus of Elasticity
ASTM C 469, Standard Test Method for Static Modulus of Elasticity and Poisson's Ratio of Concrete in Compression PSI Natural/Direct
Restrained Drying Shrinkage
The predominant mineral of the material's cement composition will be used as a proxy measure for restrained shrinkage
Categorical (Low, Medium, High) Constructed/Proxy
Thermal Expansion
ASTM C 531, Standard Test Method for Linear Shrinkage and Coefficient of Thermal Expansion of Chemical-Resistant Mortars, Grouts, Monolithic Surfacings, and Polymer Concretes in/in°C Natural/Direct
3.4.3 Shelf Life
Shelf life is simply measured by the manufacturer’s specified shelf life in months. It is a
natural and direct measure.
3.4.4 Site Prep Required
The measures for “bonding agent required” and “hydrophobic” are both binary,
categorical measures with responses of yes and no. They are both natural and direct measures.
39

3.4.5 Workability
The measure for “aggregate/lift requirement” is a natural, binary measure with responses
of yes or no. “Working time” is measured by a material’s initial set time. The initial set time is
determined by the Vicat needle method. The test procedure for this method is as follows: A
weighted, 1mm needle is lowered into cement paste. The time it takes until the needle penetrates
25mm into cement paste is recorded as the initial set time. This measure is direct and proxy for
working time.
3.5 Weighting the Hierarchy
Weights can be applied to the value hierarchy in a global or local manner. If local
weighting is chosen, the decision maker assigns weights to a particular tier in a branch so that the
weights sum to one. These are also known as relative weights, since the weights only hold true
relative to the other values in the same tier and branch. Another approach is to assign weights
globally. With this method, the decision maker directly assigns weights to all values in the
hierarchy, so that all weights on the lowest level values add to one. The decision makers for this
thesis decided to assign global weights directly to the values in the hierarchy.
Because the decision for this thesis is choosing the best spall repair material for military
applications, the decision makers felt the weights in the hierarchy were dependent on the repair
scenario. They asserted that the weights would change depending on whether the repair was
performed in a conventional, steady state operational environment, or if the repair was conducted
in a contingency environment. The decision makers defined a conventional repair scenario as
one made without the constraint of time. Specifically, they assumed that the repair will not be
40

subjected to traffic within six hours after placement. A contingency repair scenario was assumed
to be one that was required to be ready for traffic in under six hours after placement. Given a
contingency environment, some values were more important, and some less. Therefore, the
hierarchy was weighted two ways to be pertinent to both scenarios. Table 4 shows the
weighting for a conventional work environment, and Table 5 shows the weighting for a
contingency scenario.
Table 4. Weight Assignments for Conventional Spall Repair
Conventional Tier 1 Tier 2 Value Weight Weight Cost 0.15 Direct Cost 0.100
Specialized Aggregates Required 0.050
Material Properties 0.45 Bond to Existing Substrate 0.050 Compressive Strength 0.050 Durability 0.050 Early Strength 0.000 Modulus of Elasticity 0.050 Restrained Drying Shrinkage 0.200 Thermal Expansion 0.050 Shelf Life 0.05 Site Prep Required 0.10 Bonding Agent Required 0.050 Hydrophobic 0.050 Workability 0.25 Aggregate/Lift Requirement 0.050 Working Time 0.200 Total 1.00
41
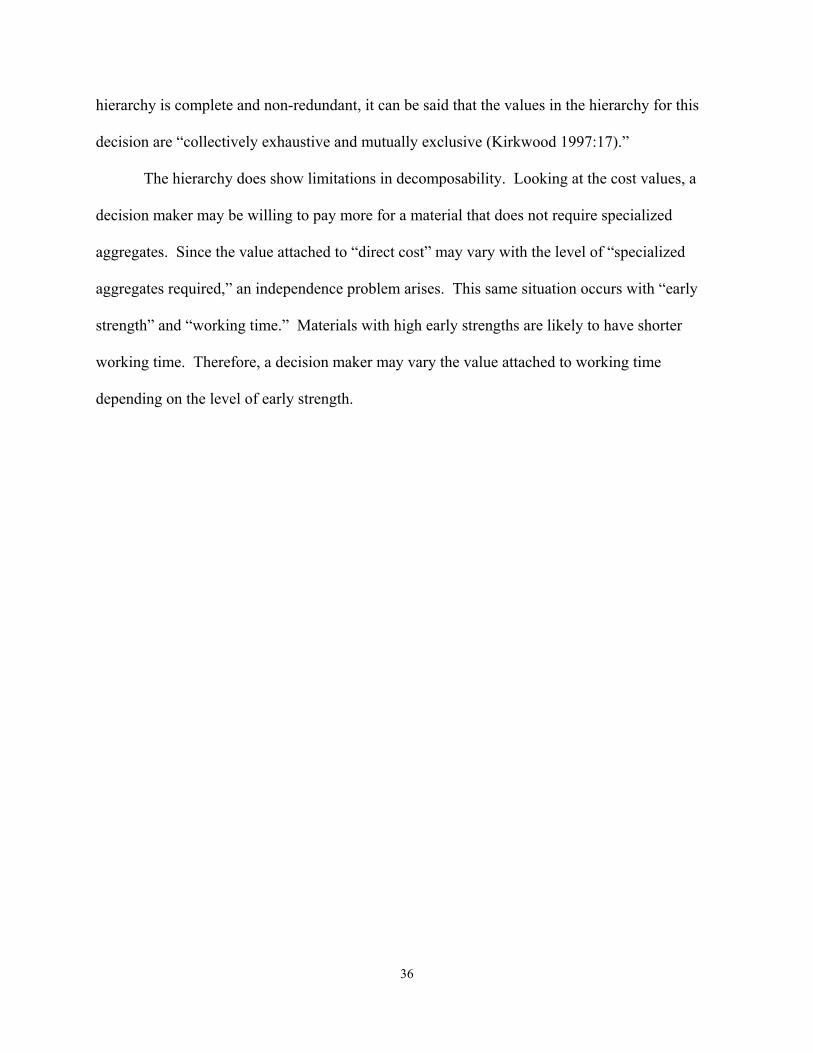
Table 5. Weight Assignments for Contingency Spall Repair
Contingency Tier 1 Tier 2 Value Weight Weight Cost 0.05 Direct Cost 0.000
Specialized Aggregates Required 0.050
Material Properties 0.50 Bond to Existing Substrate 0.050 Compressive Strength 0.050 Durability 0.050 Early Strength 0.050 Modulus of Elasticity 0.050 Restrained Drying Shrinkage 0.200 Thermal Expansion 0.050 Shelf Life 0.05 0.050 Site Prep Required 0.15 Bonding Agent Required 0.075 Hydrophobic 0.075 Workability 0.25 Aggregate/Lift Requirement 0.050 Working Time 0.200 Total 1.00
3.6 Creating Value Functions
In order to rank repair material alternatives using the VFT process, a Single Dimension
Value Function (SDVF) must be created for each evaluation measure. An SDVF determines the
value or “goodness” that a decision maker assigns for a particular level of an evaluation measure
(Kirkwood, 1997:55). The SDVF assigns the worst possible level of an evaluation measure a
42

score of zero, and the best possible level for an evaluation measure a score of one. By
“normalizing” the levels of evaluation measures to a unitless scale from zero to one, the overall
score of an alternative can be found using Equation 1, the additive value function (described in
Chapter 2):
(3) ∑ == xwScore )(n
i iiiv1
The additive value function sums the product of each measure’s SDVF score and its respective
weight. The overall score for an alternative will fall between zero and one; an alternative with a
maximum score on each evaluation measure would receive an overall score of one, and an
alternative with a minimum score on each evaluation measure would receive an overall score of
zero. The alternative with the highest overall score is chosen as the best alternative.
The SDVFs for each measure must be monotonically increasing or decreasing. A
monotonically increasing value function is one in which higher values on a measure are preferred
by the decision maker. Similarly, monotonically decreasing functions are those for which lower
values on evaluation measures are preferred. In the case of continuous functions, increasing
functions have positive slopes, and decreasing functions have negative slopes.
The SDVFs used in this model are discrete or continuous. The discrete SDVFs are
categorical, meaning they have a finite number of levels (categories), while the continuous
SDVFs have an infinite number of possible levels. The decision makers chose a discrete or
continuous scale for each evaluation measure. For those measures that were evaluated on a
discrete scale, categories were determined and given an associated value. If a measure was
determined to be continuous, the decision makers were asked to provide an upper and lower
bound representing the best and worst possible scores. The decision makers chose to use linear,
43
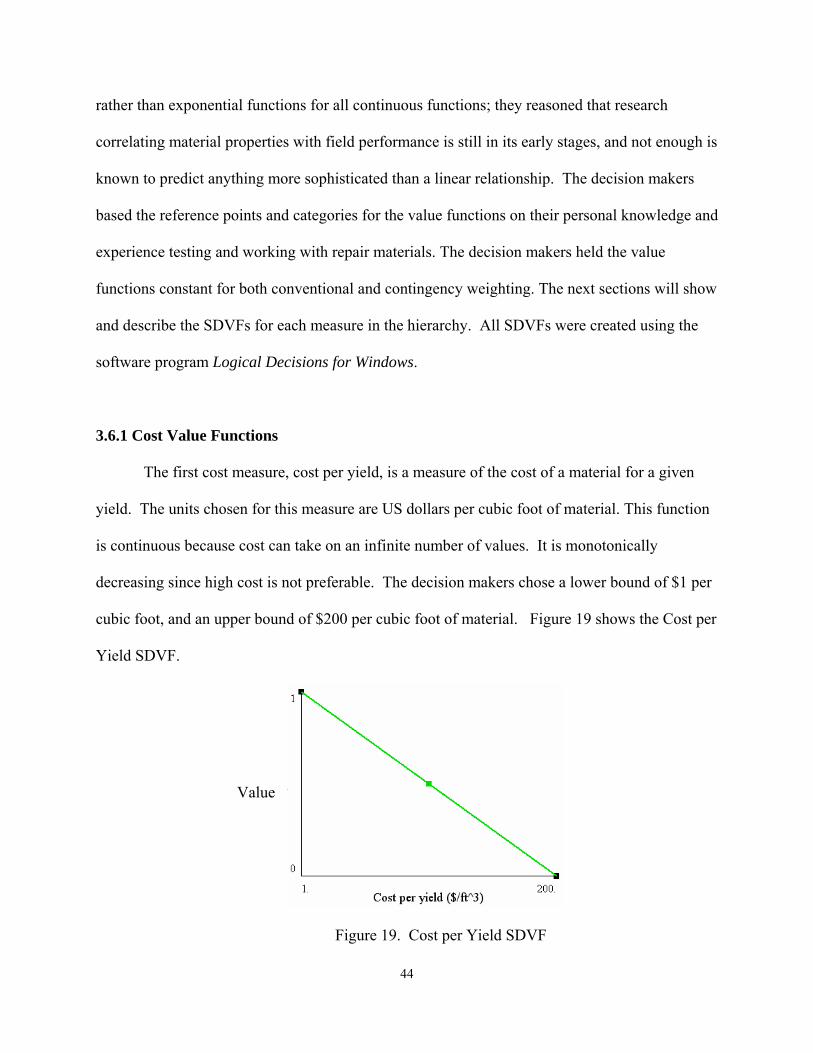
rather than exponential functions for all continuous functions; they reasoned that research
correlating material properties with field performance is still in its early stages, and not enough is
known to predict anything more sophisticated than a linear relationship. The decision makers
based the reference points and categories for the value functions on their personal knowledge and
experience testing and working with repair materials. The decision makers held the value
functions constant for both conventional and contingency weighting. The next sections will show
and describe the SDVFs for each measure in the hierarchy. All SDVFs were created using the
software program Logical Decisions for Windows.
3.6.1 Cost Value Functions
The first cost measure, cost per yield, is a measure of the cost of a material for a given
yield. The units chosen for this measure are US dollars per cubic foot of material. This function
is continuous because cost can take on an infinite number of values. It is monotonically
decreasing since high cost is not preferable. The decision makers chose a lower bound of $1 per
cubic foot, and an upper bound of $200 per cubic foot of material. Figure 19 shows the Cost per
Yield SDVF.
Value
Figure 19. Cost per Yield SDVF
44
The second measure specifies whether a repair material requires a specialized aggregate.
This SDVF is categorical since the range of possibilities is binary. A repair material that does
not require specialized aggregates receives the full score of one on this measure. Figure 20
shows the categorical SDVF.
Figure 20. Requires Specialized Aggregates SDVF
3.6.2 Desirable Material Properties Value Functions
The ASTM C 882 slant shear bond test measures a repair materials ability to resist sliding
between a material and the concrete substrate. The units for this measure are pounds per square
inch (PSI). The decision makers chose a continuous, linear function with an upper bound of
3000 PSI and lower bound of 1500 PSI. The function is increasing since higher bond strengths
are preferred. Figure 21 shows the ASTM C 882 SDVF.
45
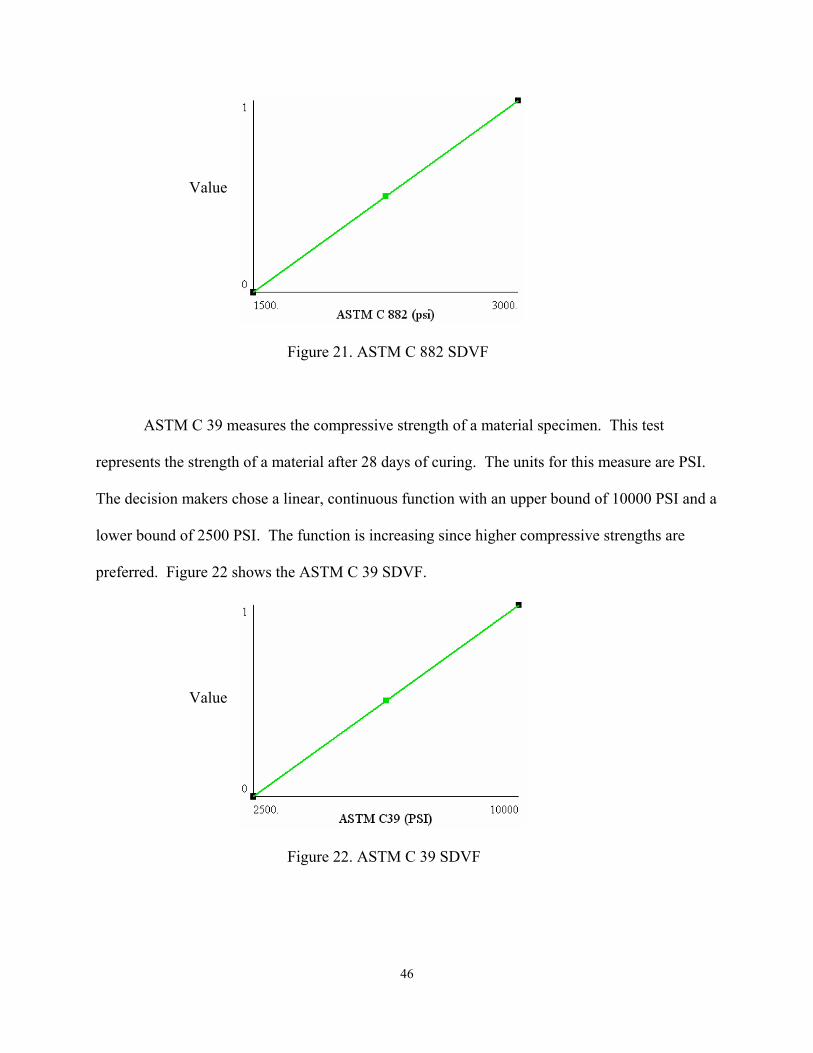
Value
Figure 21. ASTM C 882 SDVF
ASTM C 39 measures the compressive strength of a material specimen. This test
represents the strength of a material after 28 days of curing. The units for this measure are PSI.
The decision makers chose a linear, continuous function with an upper bound of 10000 PSI and a
lower bound of 2500 PSI. The function is increasing since higher compressive strengths are
preferred. Figure 22 shows the ASTM C 39 SDVF.
Figure 22. ASTM C 39 SDVF
Value
46
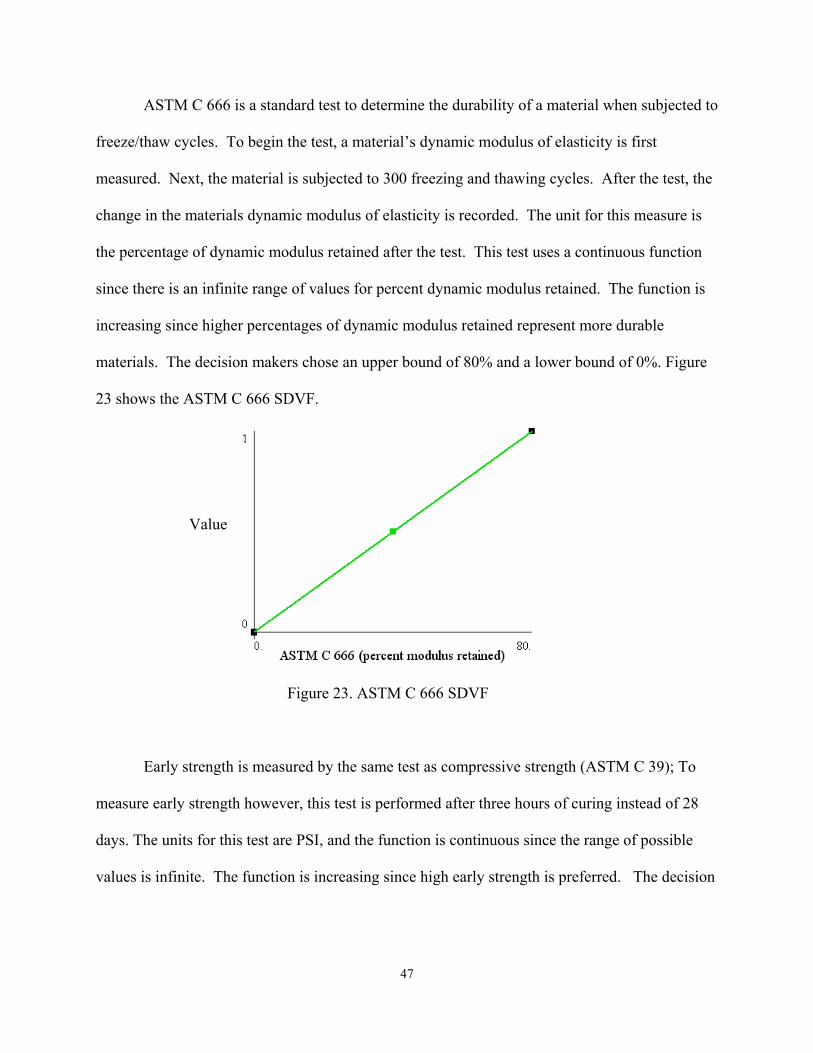
ASTM C 666 is a standard test to determine the durability of a material when subjected to
freeze/thaw cycles. To begin the test, a material’s dynamic modulus of elasticity is first
measured. Next, the material is subjected to 300 freezing and thawing cycles. After the test, the
change in the materials dynamic modulus of elasticity is recorded. The unit for this measure is
the percentage of dynamic modulus retained after the test. This test uses a continuous function
since there is an infinite range of values for percent dynamic modulus retained. The function is
increasing since higher percentages of dynamic modulus retained represent more durable
materials. The decision makers chose an upper bound of 80% and a lower bound of 0%. Figure
23 shows the ASTM C 666 SDVF.
Value
Figure 23. ASTM C 666 SDVF
Early strength is measured by the same test as compressive strength (ASTM C 39); To
measure early strength however, this test is performed after three hours of curing instead of 28
days. The units for this test are PSI, and the function is continuous since the range of possible
values is infinite. The function is increasing since high early strength is preferred. The decision
47

makers chose an upper bound of 4000 PSI, and a lower bound of 1500 PSI. Figure 24 shows the
SDVF for early strength.
Value
SDVF for Early Strength (ASTM C 39 after 3 hours of curing)
Modulus of elasticity is measured by ASTM C 469. This test measures the slope of a
material’s stress/strain curve when deformed, or in simpler terms, the stiffness of a material. The
units for this test are PSI. The decision makers felt that an ideal material would have a modulus
of elasticity equal to that of the concrete substrate. The levels of modulus of elasticity for
alternatives will therefore be inputted in this model as the deviation, or delta from an assumed
value of concrete pavement. The decision makers chose 4.5 million PSI as a typical value for
concrete pavement. The value function for this measure will scale the modulus differential that
deviates from 4.5 million PSI. The function is continuous since there is an infinite range of
possible deviation values. The decision makers chose an upper bound of 4.5 million PSI, and a
lower bound of 0 PSI (no differential from substrate). The function is decreasing because a high
modulus differential from the existing substrate is not preferred. Figure 25 shows the SDVF for
modulus of elasticity differential.
48
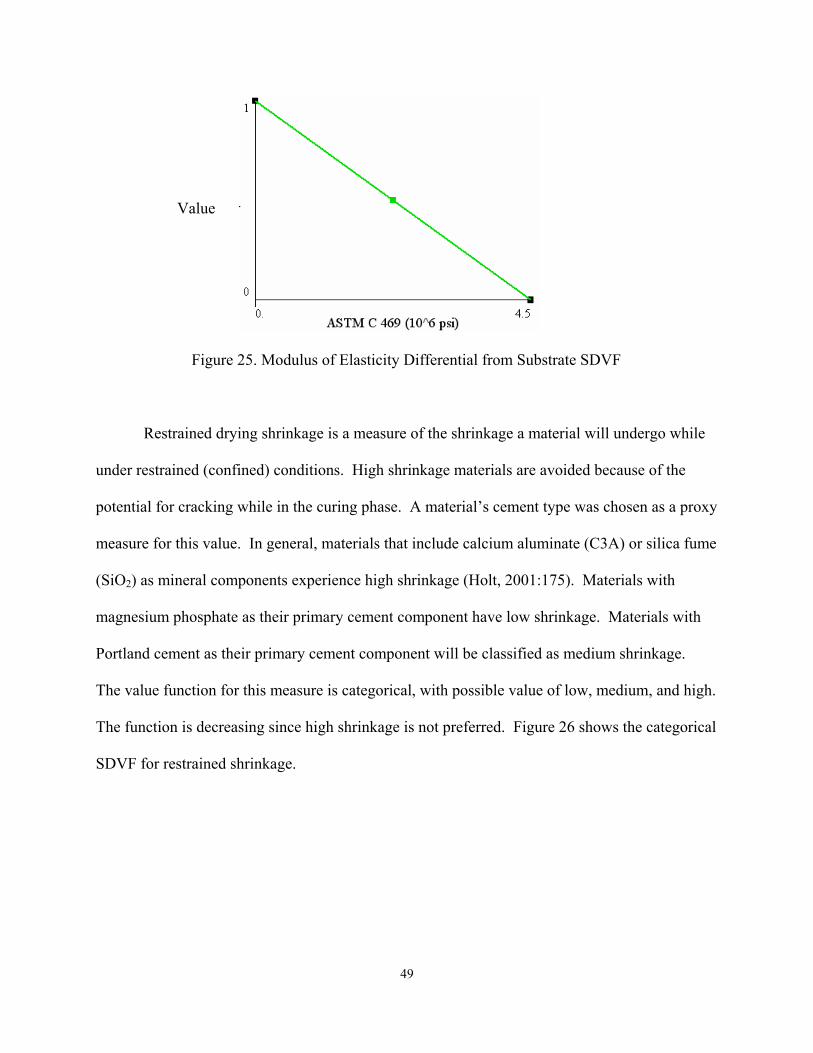
Value
Figure 25. Modulus of Elasticity Differential from Substrate SDVF
Restrained drying shrinkage is a measure of the shrinkage a material will undergo while
under restrained (confined) conditions. High shrinkage materials are avoided because of the
potential for cracking while in the curing phase. A material’s cement type was chosen as a proxy
measure for this value. In general, materials that include calcium aluminate (C3A) or silica fume
(SiO2) as mineral components experience high shrinkage (Holt, 2001:175). Materials with
magnesium phosphate as their primary cement component have low shrinkage. Materials with
Portland cement as their primary cement component will be classified as medium shrinkage.
The value function for this measure is categorical, with possible value of low, medium, and high.
The function is decreasing since high shrinkage is not preferred. Figure 26 shows the categorical
SDVF for restrained shrinkage.
49
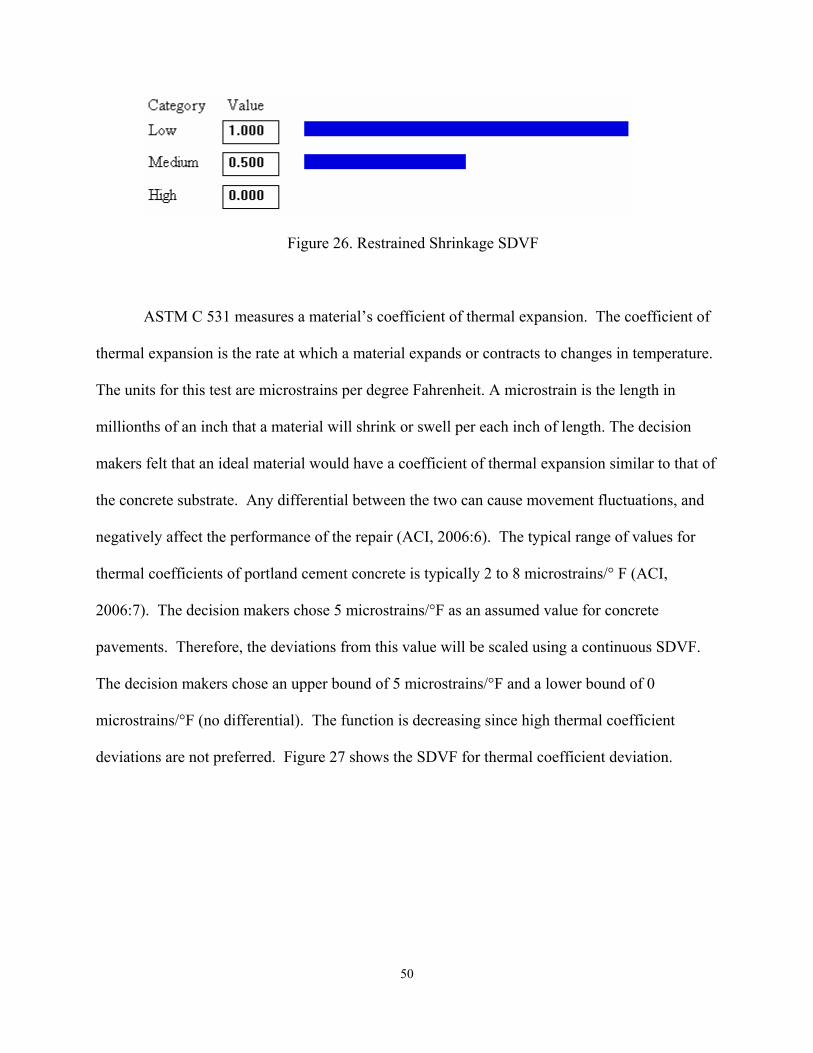
Figure 26. Restrained Shrinkage SDVF
ASTM C 531 measures a material’s coefficient of thermal expansion. The coefficient of
thermal expansion is the rate at which a material expands or contracts to changes in temperature.
The units for this test are microstrains per degree Fahrenheit. A microstrain is the length in
millionths of an inch that a material will shrink or swell per each inch of length. The decision
makers felt that an ideal material would have a coefficient of thermal expansion similar to that of
the concrete substrate. Any differential between the two can cause movement fluctuations, and
negatively affect the performance of the repair (ACI, 2006:6). The typical range of values for
thermal coefficients of portland cement concrete is typically 2 to 8 microstrains/° F (ACI,
2006:7). The decision makers chose 5 microstrains/°F as an assumed value for concrete
pavements. Therefore, the deviations from this value will be scaled using a continuous SDVF.
The decision makers chose an upper bound of 5 microstrains/°F and a lower bound of 0
microstrains/°F (no differential). The function is decreasing since high thermal coefficient
deviations are not preferred. Figure 27 shows the SDVF for thermal coefficient deviation.
50

Value
Figure 27. Thermal Coefficient SDVF (deviation from 5 microstrains/°F)
3.6.3 Shelf Life
The shelf life of a material is the length of time a manufacturer recommends a product
can be stored unopened before the performance of a material is degraded. The unit for this
measure is months. This function is continuous since the range of possible values is infinite. The
function is increasing because materials with high shelf lives are preferred. The decision makers
chose an upper bound of 60 months and a lower bound of 12 months. Figure 28 shows the
SDVF for shelf life.
Figure 28. Shelf Life SDVF
Value
51

3.6.4 Site Preparation Required
The first measure in the Site Preparation Required branch is the determination of whether
a material requires a bonding agent or not. A bonding agent is not preferred because it adds a
step to the repair process. The value function for this measure is binary and categorical. There
are only two possible values for this function: yes or no. If the material requires a bonding agent,
it receives a score of zero—otherwise, it receives a score of one. Figure 29 shows the SDVF for
Bonding Agent Requirement.
Figure 29. SDVF for Bonding Agent Requirement
The second measure in this branch is the determination of whether a material is
hydrophobic or not. Hydrophobic materials cannot be applied to damp or wet surfaces.
Hydrophobic materials are not preferred because they cannot be placed in wet weather
conditions, and require extra time and effort to dry a wet surface. The value function for this
measure is binary and categorical. There are only two possible values for this function: yes or no.
If a material is hydrophobic, it receives a score of zero—otherwise, it receives a score of one.
Figure 30 shows the categorical SDVF for Hydrophobic.
52
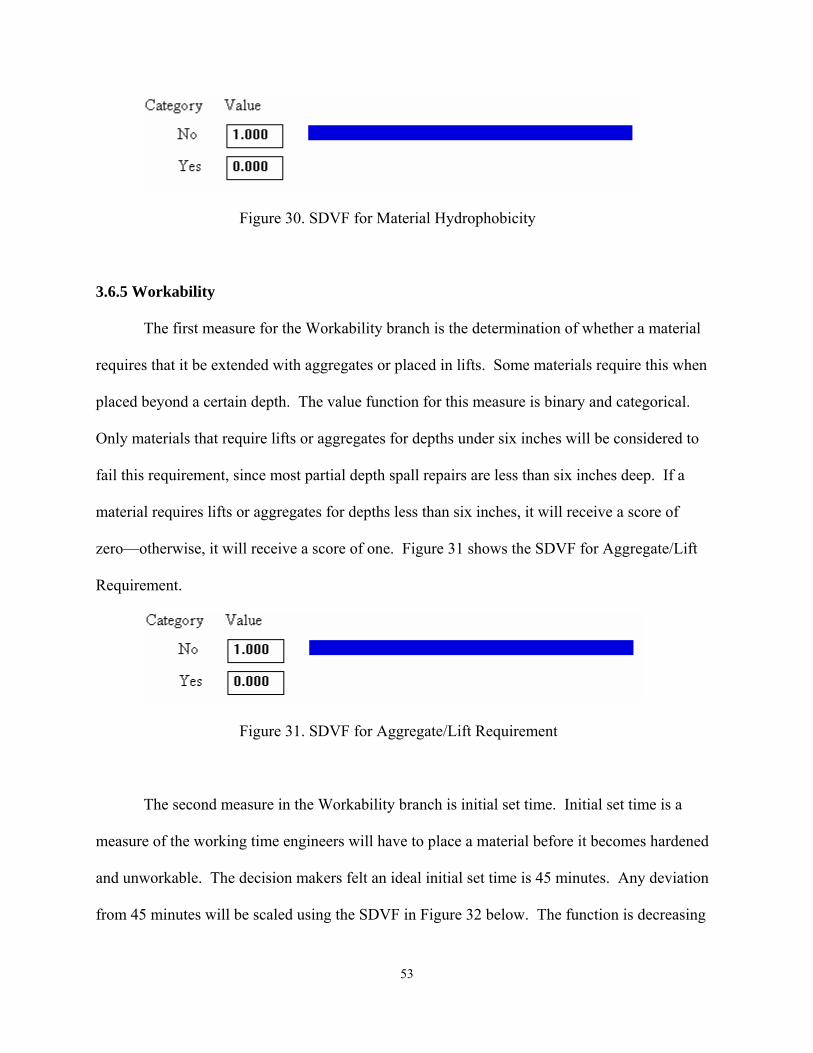
Figure 30. SDVF for Material Hydrophobicity
3.6.5 Workability
The first measure for the Workability branch is the determination of whether a material
requires that it be extended with aggregates or placed in lifts. Some materials require this when
placed beyond a certain depth. The value function for this measure is binary and categorical.
Only materials that require lifts or aggregates for depths under six inches will be considered to
fail this requirement, since most partial depth spall repairs are less than six inches deep. If a
material requires lifts or aggregates for depths less than six inches, it will receive a score of
zero—otherwise, it will receive a score of one. Figure 31 shows the SDVF for Aggregate/Lift
Requirement.
Figure 31. SDVF for Aggregate/Lift Requirement
The second measure in the Workability branch is initial set time. Initial set time is a
measure of the working time engineers will have to place a material before it becomes hardened
and unworkable. The decision makers felt an ideal initial set time is 45 minutes. Any deviation
from 45 minutes will be scaled using the SDVF in Figure 32 below. The function is decreasing
53

since high deviation from the ideal set time is not preferred. The function is continuous because
there is an infinite range of possible set times for a given material. The decision makers chose an
upper bound of 45 minutes and a lower bound of 0 minutes (no differential).
Figure 32. SDVF for Initial Set Time (deviation from 45 minutes)
Value
3.7 Alternative Generation
Repair material alternatives were chosen by the decision makers from the many available
repair products on the commercial market. The decision makers chose materials that were
thought to best meet the important values that the decision makers conceptualized in the value
hierarchy. Table 6 shows the repair materials that were chosen for this model. The repair
material alternatives and their associated scores are presented in Chapter 4.
54
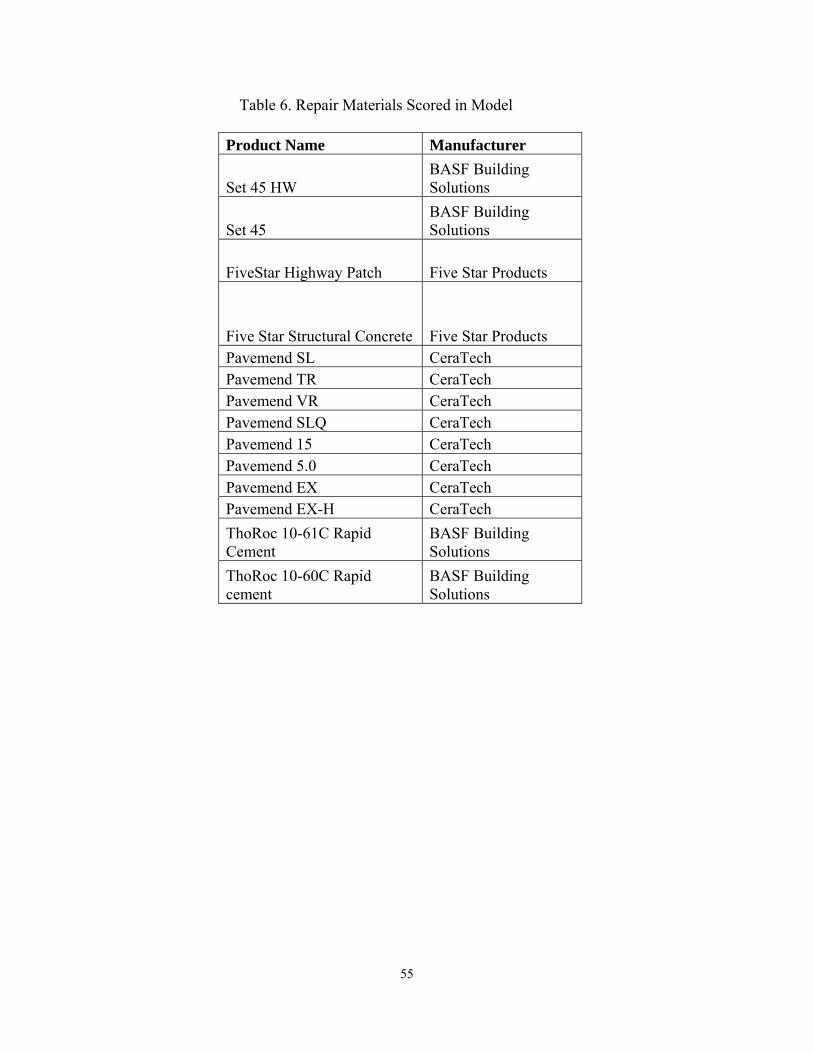
Table 6. Repair Materials Scored in Model
Product Name Manufacturer BASF Building Solutions Set 45 HW BASF Building Solutions Set 45
FiveStar Highway Patch Five Star Products
Five Star Structural Concrete Five Star Products Pavemend SL CeraTech Pavemend TR CeraTech Pavemend VR CeraTech Pavemend SLQ CeraTech Pavemend 15 CeraTech Pavemend 5.0 CeraTech Pavemend EX CeraTech Pavemend EX-H CeraTech ThoRoc 10-61C Rapid Cement
BASF Building Solutions
ThoRoc 10-60C Rapid cement
BASF Building Solutions
55
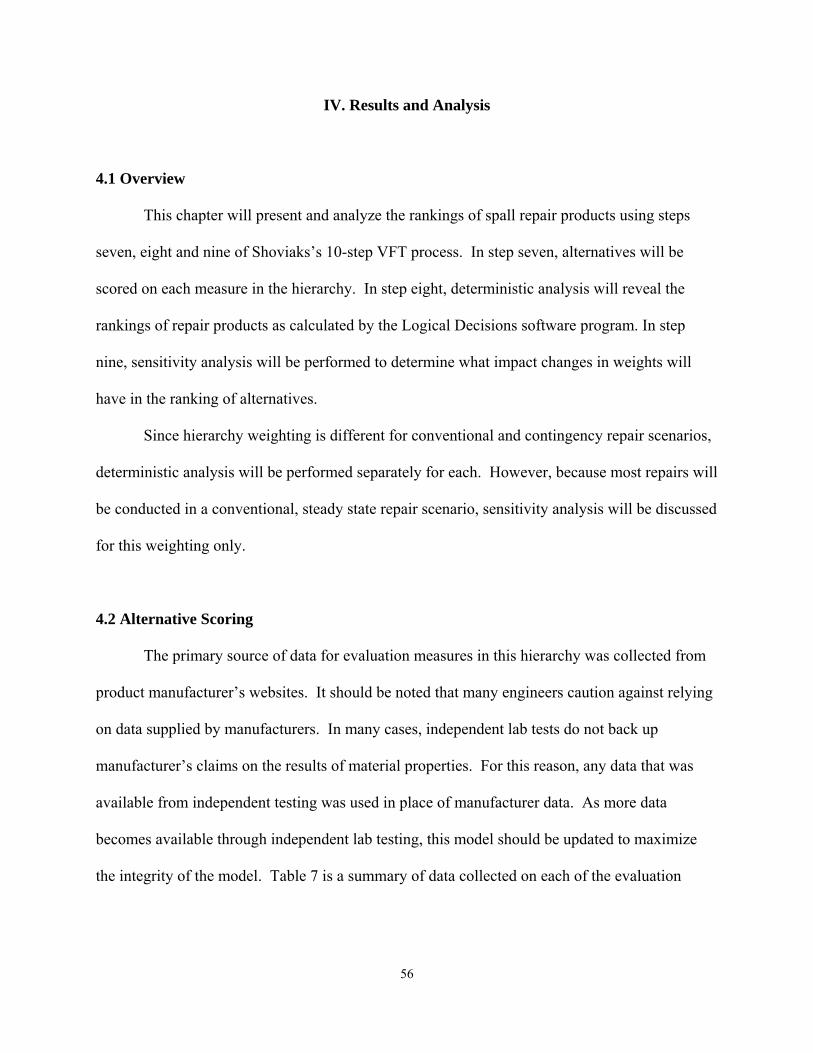
IV. Results and Analysis
4.1 Overview
This chapter will present and analyze the rankings of spall repair products using steps
seven, eight and nine of Shoviaks’s 10-step VFT process. In step seven, alternatives will be
scored on each measure in the hierarchy. In step eight, deterministic analysis will reveal the
rankings of repair products as calculated by the Logical Decisions software program. In step
nine, sensitivity analysis will be performed to determine what impact changes in weights will
have in the ranking of alternatives.
Since hierarchy weighting is different for conventional and contingency repair scenarios,
deterministic analysis will be performed separately for each. However, because most repairs will
be conducted in a conventional, steady state repair scenario, sensitivity analysis will be discussed
for this weighting only.
4.2 Alternative Scoring
The primary source of data for evaluation measures in this hierarchy was collected from
product manufacturer’s websites. It should be noted that many engineers caution against relying
on data supplied by manufacturers. In many cases, independent lab tests do not back up
manufacturer’s claims on the results of material properties. For this reason, any data that was
available from independent testing was used in place of manufacturer data. As more data
becomes available through independent lab testing, this model should be updated to maximize
the integrity of the model. Table 7 is a summary of data collected on each of the evaluation
56

measures for the fourteen repair alternatives. All data except those in the shaded cells were
collected from manufacturer specifications.
Table 7. Summary Matrix of Alternative Scores
251487.54132.54127.532.53415203231
Initial Set time Differential from 45 min (minutes)
20 min193 min37.5min70 min4 min12.5 min4 min17.5 min12.5 min11 min30 min25 min13 min76 min
Initial Set Time
NoNoYesYesNoNoYesNoNoYesYesNoYesYes
Lifts or Aggregate required?
NoNoNoNoNoNoNoNoNoNoNoNoNoNoHydrophobic?
NoNoNoNoNoNoNoNoNoNoNoNoNoNo
Requires Bonding Agent?
12 months
12 months
12 months
12 months
36 months
36 months
36 months
36 months
36 months
36 months
24 months
12 months
12 months
12 monthsShelf Life
21.81.130.92.052.182.052.482.482.4503.32.152.15
Thermal Coefficient Differential from 5 Microstrains (*10^-6)
7.0 *10^-6
6.8*10^-6
6.13 X 10^-6
5.9* 10^-6
2.95*10^-6
2.82 X 10^-6
2.95X10^-6
2.52X10^-6
2.52X10^-6
2.55 *10^-6
5*10^-6
8.3* 10 -̂6
7.15 *10^-6
7.15 *10^-6
Coefficient ofThermal Expansion (ASTM C 531)
6893 psi8293 psi6535 psi5870 psi6100 psi6300 psi7483 psi6580 psi7114 psi4257 psi
8000 psi7280 psi8500 psi6317 psi
Compressive Strength (28 Day)
0.10.10.061.781.11.22.82.231.732.290.710.320.4
Modulus differential from 4.5 * 10^6 (10^6 psi)
4.4*10^6 pjsi
4.6*10^6 psi
4.56* 10^6 psi
2.72* 10^6 psi
3.4* 10^6 psi
3.3* 10^6 psi
1.70* 10^6 psi
2.27* 10^6 psi
2.77* 10^6 psi
2.21* 10^6 psi
3.8 * 10^6 * psi
3.5*10^6 psi
4.18*10^6 psi
4.90*10^6 psi
Modulus of Elasticity (ASTM C 469)
100%100%>80%>80%>80%>80%>80%>80%>80%>80%>90%96%80%80%
Freeze/Thaw Resistance (ASTM C 666)
3100 psi3887 psi3395 psi2875 psi3830 psi3870 psi3966 psi4300 psi3000 psi3643 psi
2500 psi3500 psi5000 psi3227 psi
Early Strength (ASTM C 39 @ 3 hours)
2160 psi1480 psi2500 psi2450 psi2780 psi2000 psi2866 psi2400 psi1930 psi1665 psi
2500 psi2000 psi2250 psi2190 psi
Bond Strength (ASTM C 882 Slant Shear) @ 7 days
NNYesYesNNoYesNoNoYesNoNoYesYes
Special Aggregates required?
$13.49$13.49$116.30$122.00$116.30$116.30$116.30$116.30$116.30$116.30$70.00$50.00$50.00$50.00$/cf
HighHighLowLowLowLowLowLowLowLowLowHighLowLowShrinkage
alumina cement, portland cement, anhydrite, fly ash
alumina cement, portland cement, anhydrite, fly ash
Silica (crystalline quartz), fly ash, magnesium oxide, calcium carbonate
Silica (crystalline quartz), fly ash, magnesium oxide, calcium carbonate
Magnesium oxide, Phosphate (calcium/potassium/sodium), silica (crystalline quartz)
Magnesium oxide, Phosphate (calcium/potassium/sodium), silica (crystalline quartz)
Silica (crystalline quartz), fly ash, magnesium oxide, calcium carbonate
Silica (crystalline quartz), fly ash, magnesium oxide, calcium carbonate
Silica (crystalline quartz), fly ash, magnesium oxide, calcium carbonate
Silica (crystalline quartz), fly ash, magnesium oxide, calcium carbonate
Silicon Dioxide, Crystalline Silica, Silica Sand SiO
Silicon Dioxide, Crystalline Silica, Silica Sand SiO2,
Silica (crystalline quartz), fly ash, magnesium oxide
Silica (crystalline quartz), fly ash, magnesium oxide
Cement Composition (in order of prominence)
BASF Building Solutions
BASF Building SolutionsCeraTech
CeraTech
CeraTechCeraTech
CeraTech
CeraTech
CeraTech
CeraTech
Five Star Products
Five Star Products
BASF Building Solutions
BASF Building Solutions
Manufacturer
ThoRoc 10-60C rapid cement
ThoRoc 10-61C Rapid Cement
Pavemend EX-H
Pavemend EX
Pavemend 5.0
Pavemend 15
Pavemend SLQ
Pavemend VR
Pavemend TR
Pavemend SL
Five Star Structural Concrete
FiveStar Highway PatchSet 45
Set 45 HW
Material Name
Key: Data collected from WES Repair, Evaluation, Maintenance, and Rehabilitation (REMR) reports Data obtained from the Wisconsin Department of Transportation Data obtained from WES ERDC lab testing Data obtained from engineers at AFCESA
57

4.3 Deterministic Analysis (Conventional Weighting) In Chapter 3, SDVFs were created for each evaluation measure to convert the scores in
Table 7 into unitless, normalized values from zero (least preferred) to one (most preferred).
Next, the scores from Table 7 were inputted into Logical Decisions and the software calculated
the corresponding unitless value for each measure determined from the SDVFs created earlier.
Logical Decisions then used the additive value function to sum the products of these values and
their predetermined weights (see Tables 4 and 5) for each evaluation measure to compute a total
score for each alternative. The software then ranked each alternative based on its score, from
high to low.
4.3.1 Deterministic Analysis on a Conventionally Weighted Scenario
Figure 33 shows the rank ordered list of alternatives using the decision maker’s
weighting (Table 4) for a conventional repair scenario. Pavemend EX-H ranks the highest and
earns the highest additive value function sum of 0.707.
AlternativePavemend EX-HPavemend VRPavemend 15Pavemend TRPavemend 5Set 45Set 45 HWPavemend EXFive Star Structural ConcreteThoroc 10-60C Rapid CementPavemend SLQFive Star Highway PatchPavemend SLThoroc 10-61C Rapid Cement
Value0.7070.7020.6790.6740.6690.6230.6100.6030.5730.5630.5620.5410.5330.463
AlternativePavemend EX-HPavemend VRPavemend 15Pavemend TRPavemend 5Set 45Set 45 HWPavemend EXFive Star Structural ConcreteThoroc 10-60C Rapid CementPavemend SLQFive Star Highway PatchPavemend SLThoroc 10-61C Rapid Cement
Value0.7070.7020.6790.6740.6690.6230.6100.6030.5730.5630.5620.5410.5330.463
Figure 33. Alternative Rankings under Conventional Weighting
58

The value score next to each alternative specifies the distance (in a value sense) that each
alternative is from the hypothetical best or worst score (Kirkwood, 1997:74). However,
Kirkwood (1997:74) explains that no specific meaning can be given to value numbers without
knowing the ranges of the evaluation measures being used. Therefore, the values next to each
alternative should only be used to rank alternatives and not to infer a degree improvement from
one alternative to another.
Figure 34 shows how well each alternative fulfilled the decision maker’s fundamental
objectives by color-coding the bands to indicate how well each alternative scored on the Tier 1
values. The lengths of the color coded bands are in proportion to the scoring for each respective
value. This makes it easy to see how each fundamental objective contributed to the overall score
of each alternative.
AlternativePavemend EX-HPavemend VRPavemend 15Pavemend TRPavemend 5Set 45Set 45 HWPavemend EXFive Star Structural ConcreteThoroc 10-60C Rapid CementPavemend SLQFive Star Highway PatchPavemend SLThoroc 10-61C Rapid Cement
Value0.7070.7020.6790.6740.6690.6230.6100.6030.5730.5630.5620.5410.5330.463
Desirable Material PropertiesSite-Prep Required
WorkabilityShelf Life
Cost
Figure 34. Alternative Rankings with Respect to Fundamental Objectives (Conventional
Weighting)
59

The top choice, Pavemend EX-H, outscored all other materials on the Desirable Material
Properties value. It also scored highly on the Workability and Cost values. Although it has a
score of zero on Shelf Life, it scores well enough on all other values to earn the top spot on the
list. Pavemend VR scored well on all fundamental objectives, but was edged out by Pavemend
EX-H on Desirable Material Properties and Workability. The worst alternative, Thoroc 10-61C
Rapid Cement, ranked at the bottom due to poor scores on Desired Material Properties and
Workability, and because it received a score of zero on Shelf Life.
Logical Decisions can also perform a stacked bar ranking by color-coding each individual
measure. Figure 35 shows the stakeholders how each measure hurt or helped the value score of
each alternative.
AlternativePavemend EX-HPavemend VRPavemend 15Pavemend TRPavemend 5Set 45Set 45 HWPavemend EXFive Star Structural ConcreteThoroc 10-60C Rapid CementPavemend SLQFive Star Highway PatchPavemend SLThoroc 10-61C Rapid Cement
Value0.7070.7020.6790.6740.6690.6230.6100.6030.5730.5630.5620.5410.5330.463
Cement TypeASTM C39ASTM C 882Requires Bonding Agent- Yes/NoManufacturer Claimed Shelf Life
Initial Set TimeASTM C 469ASTM C 531Requires Special Aggregates- Yes/NoASTM C 39 @ 3 hours
Cost per yieldASTM C 666Material is Hydrophobic- Yes/NoLifts or Aggregates Required- Yes/No
AlternativePavemend EX-HPavemend VRPavemend 15Pavemend TRPavemend 5Set 45Set 45 HWPavemend EXFive Star Structural ConcreteThoroc 10-60C Rapid CementPavemend SLQFive Star Highway PatchPavemend SLThoroc 10-61C Rapid Cement
Value0.7070.7020.6790.6740.6690.6230.6100.6030.5730.5630.5620.5410.5330.463
Cement TypeASTM C39ASTM C 882Requires Bonding Agent- Yes/NoManufacturer Claimed Shelf Life
Initial Set Time
AlternativePavemend EX-HPavemend VRPavemend 15Pavemend TRPavemend 5Set 45Set 45 HWPavemend EXFive Star Structural ConcreteThoroc 10-60C Rapid CementPavemend SLQFive Star Highway PatchPavemend SLThoroc 10-61C Rapid Cement
Value0.7070.7020.6790.6740.6690.6230.6100.6030.5730.5630.5620.5410.5330.463
Cement TypeASTM C39ASTM C 882Requires Bonding Agent- Yes/NoManufacturer Claimed Shelf Life
Initial Set TimeASTM C 469ASTM C 531Requires Special Aggregates- Yes/NoASTM C 39 @ 3 hours
Cost per yieldASTM C 666Material is Hydrophobic- Yes/NoLifts or Aggregates Required- Yes/No
Figure 35. Alternative Rankings with Respect to Evaluation Measures (Conventional Weighting) At the top of the list, Pavemend EX-H scores well on all measures within the Desirable Material
Properties value. The next best alternative, Pavemend VR, is one of the few alternatives to score
consistently well across all fourteen measures. In fact, only Pavemend VR, Pavemend 15,
60

Pavmend 5, and Pavemend TR received non-zero scores across all measures. Pavemend EX-H
scores higher than the latter four due to its high score on Initial Set Time. The stacked bar
ranking in Figure 35 does not show a score for early strength (ASTM C 39 @ 3 hours) for any
alternatives since this value has a weight of zero under a conventional repair scenario weighting.
4.3.2 Contingency Weighting Deterministic Analysis
Figure 36 shows the rank ordered list of alternatives using the decision maker’s
weighting (Table 5) for a contingency repair scenario. Using this weighting, Pavemend VR
becomes the dominant alternative. Although the order has changed, the same materials remain
the top five alternatives.
AlternativePavemend VRPavemend EX-HPavemend 15Pavemend 5Pavemend TRSet 45Pavemend EXPavemend SLQSet 45 HWPavemend SLFive Star Structural ConcreteFive Star Highway PatchThoroc 10-60C Rapid CementThoroc 10-61C Rapid Cement
Value0.7600.7410.7320.7200.6920.6480.6190.6190.6040.5770.5480.5460.5330.465
AlternativePavemend VRPavemend EX-HPavemend 15Pavemend 5Pavemend TRSet 45Pavemend EXPavemend SLQSet 45 HWPavemend SLFive Star Structural ConcreteFive Star Highway PatchThoroc 10-60C Rapid CementThoroc 10-61C Rapid Cement
Value0.7600.7410.7320.7200.6920.6480.6190.6190.6040.5770.5480.5460.5330.465
Figure 36. Ranking of Alternatives using Contingency Weighting
Further insight can be achieved by looking at a color-coded stacked bar ranking, detailing
the scores on the decision maker’s fundamental objectives, as seen in Figure 37. Thoroc 10-60C
moves down to the second from last position. Whereas it scored #10 out of 14 under
61

conventional weighting, it moves down three spots since it no longer receives as much value for
cost, since direct cost under contingency weighting is zero.
AlternativePavemend VRPavemend EX-HPavemend 15Pavemend 5Pavemend TRSet 45Pavemend EXPavemend SLQSet 45 HWPavemend SLFive Star Structural ConcreteFive Star Highway PatchThoroc 10-60C Rapid CementThoroc 10-61C Rapid Cement
Value0.7600.7410.7320.7200.6920.6480.6190.6190.6040.5770.5480.5460.5330.465
Desirable Material PropertiesShelf Life
WorkabilityCost
Site-Prep Required
Figure 37. Alternative Ranking with Respect to Fundamental Objectives (Contingency
Weighting)
Figure 38 shows the rankings with respect to individual evaluation measures using
weights for a contingency repair scenario. Assuming a contingency repair scenario, the decision
makers placed greater importance and thus higher weights on Early Strength. Pavemend VR
surpasses Pavemend EX-H with a better score on compressive strength at three hours (ASTM C
39).
62

AlternativePavemend VRPavemend EX-HPavemend 15Pavemend 5Pavemend TRSet 45Pavemend EXPavemend SLQSet 45 HWPavemend SLFive Star Structural ConcreteFive Star Highway PatchThoroc 10-60C Rapid CementThoroc 10-61C Rapid Cement
Value0.7600.7410.7320.7200.6920.6480.6190.6190.6040.5770.5480.5460.5330.465
Cement TypeASTM C39ASTM C 882Requires Bonding Agent- Yes/NoManufacturer Claimed Shelf Life
Initial Set TimeASTM C 469ASTM C 531Requires Special Aggregates- Yes/NoCost per yield
ASTM C 39 @ 3 hoursASTM C 666Material is Hydrophobic- Yes/NoLifts or Aggregates Required- Yes/No
AlternativePavemend VRPavemend EX-HPavemend 15Pavemend 5Pavemend TRSet 45Pavemend EXPavemend SLQSet 45 HWPavemend SLFive Star Structural ConcreteFive Star Highway PatchThoroc 10-60C Rapid CementThoroc 10-61C Rapid Cement
Value0.7600.7410.7320.7200.6920.6480.6190.6190.6040.5770.5480.5460.5330.465
Cement TypeASTM C39ASTM C 882Requires Bonding Agent- Yes/NoManufacturer Claimed Shelf Life
Initial Set Time
AlternativePavemend VRPavemend EX-HPavemend 15Pavemend 5Pavemend TRSet 45Pavemend EXPavemend SLQSet 45 HWPavemend SLFive Star Structural ConcreteFive Star Highway PatchThoroc 10-60C Rapid CementThoroc 10-61C Rapid Cement
Value0.7600.7410.7320.7200.6920.6480.6190.6190.6040.5770.5480.5460.5330.465
Cement TypeASTM C39ASTM C 882Requires Bonding Agent- Yes/NoManufacturer Claimed Shelf Life
Initial Set TimeASTM C 469ASTM C 531Requires Special Aggregates- Yes/NoCost per yield
ASTM C 39 @ 3 hoursASTM C 666Material is Hydrophobic- Yes/NoLifts or Aggregates Required- Yes/No
Figure 38. Alternative Ranking with Respect to Evaluation Measures (Contingency Weighting)
4.4 Sensitivity Analysis The purpose of sensitivity analysis is to determine how changes in the model assumptions
impact the alternative rankings. Since weights reflect the relative importance that is attached to
changes in the evaluation measures, this can be a source of disagreement among various
stakeholders for a particular decision (Kirkwood, 1997:82). Sensitivity analysis was performed
with the weights previously assigned by the decision makers to determine how the rankings may
change if another decision maker assigns weights differently. Sensitivity analysis also ensures
that the hierarchy has been properly weighted and accurately depicts the decision maker’s
preferences. For the purpose of this model, sensitivity analysis was performed using the decision
maker’s weights for a conventional repair scenario.
The Logical Decisions® software program was used to graph sensitivity plots for
measures and values in the hierarchy. Logical Decisions® shows sensitivity plots with the
63
assumption that as the weight for a goal or measure moves in the positive or negative direction,
all other values lose or gain a percentage of their original weight. For example, if the weight on
the cost goal increased by x percent, Logical Decisions® assumed that the remaining goals each
lost the same percentage y that keeps the sum of the weights equal to one.
4.4.1 Sensitivity on Fundamental Objectives
Figure 39 shows the sensitivity analysis for variations in the weight on the Tier 1 value of
cost. The vertical line in the graph shows the user how alternatives ranked with the current
weight assignment of 0.15. Alternative rank changes are found by looking at the intersections of
the lines on the plot. The user can determine where rank changes occur by visualizing right or
left movement of the vertical line; the alternative that intersects the vertical line at the highest
point is the best alternative for a given weight. The points at which lines cross are the weights at
which two alternatives scored exactly the same.
Looking at the plot in this manner, Pavemend EX-H remains the dominant alternative for
all cost weights below 0.16. Beyond this point, Pavemend VR becomes dominant until a weight
of 0.39. Thoroc 10-60C Rapid Cement becomes the dominant alternative for all weights above
0.39. This shows that the weight assigned to Cost is highly sensitive, as there are many
intersections (rank changes) around the current weight of 0.15.
64
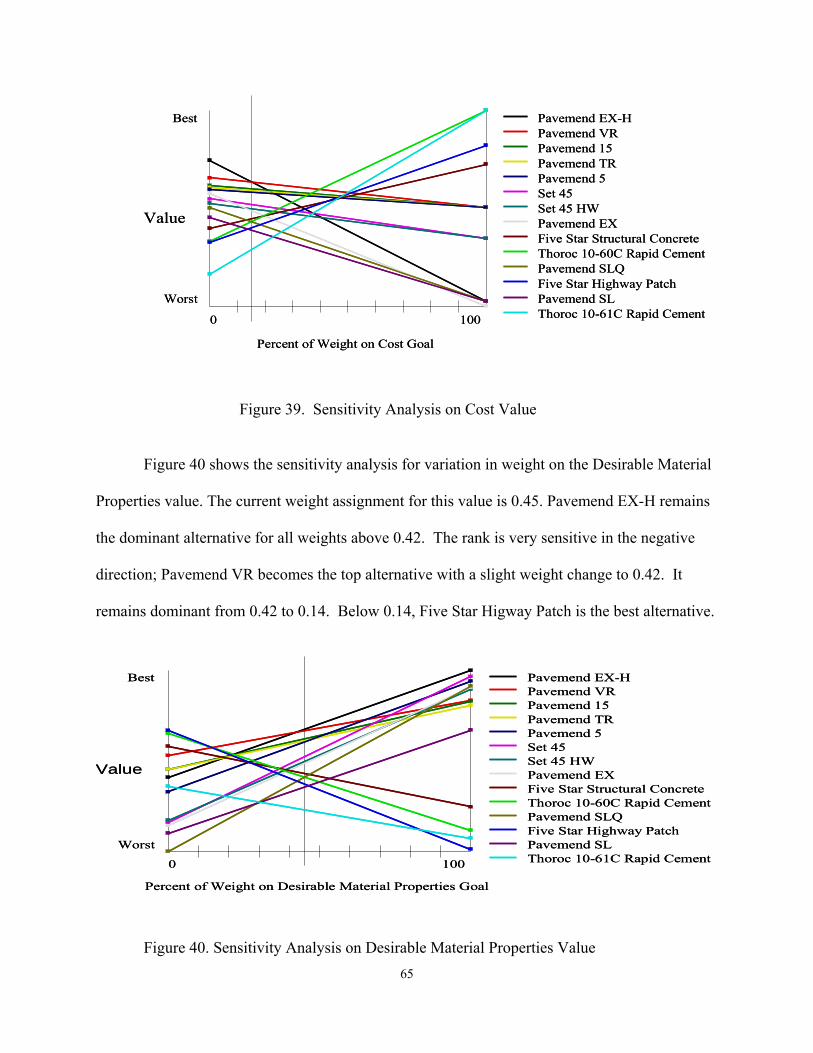
Value
Percent of Weight on Cost Goal
Best
Worst
0 100
Pavemend EX-HPavemend VRPavemend 15Pavemend TRPavemend 5Set 45Set 45 HWPavemend EXFive Star Structural ConcreteThoroc 10-60C Rapid CementPavemend SLQFive Star Highway PatchPavemend SLThoroc 10-61C Rapid Cement
Value
Percent of Weight on Cost Goal
Best
Worst
0 100
Pavemend EX-HPavemend VRPavemend 15Pavemend TRPavemend 5Set 45Set 45 HWPavemend EXFive Star Structural ConcreteThoroc 10-60C Rapid CementPavemend SLQFive Star Highway PatchPavemend SLThoroc 10-61C Rapid Cement
Figure 39. Sensitivity Analysis on Cost Value
Figure 40 shows the sensitivity analysis for variation in weight on the Desirable Material
Properties value. The current weight assignment for this value is 0.45. Pavemend EX-H remains
the dominant alternative for all weights above 0.42. The rank is very sensitive in the negative
direction; Pavemend VR becomes the top alternative with a slight weight change to 0.42. It
remains dominant from 0.42 to 0.14. Below 0.14, Five Star Higway Patch is the best alternative.
Value
Percent of Weight on Desirable Material Properties Goal
Best
Worst
0 100
Pavemend EX-HPavemend VRPavemend 15Pavemend TRPavemend 5Set 45Set 45 HWPavemend EXFive Star Structural ConcreteThoroc 10-60C Rapid CementPavemend SLQFive Star Highway PatchPavemend SLThoroc 10-61C Rapid Cement
Value
Percent of Weight on Desirable Material Properties Goal
Best
Worst
0 100
Pavemend EX-HPavemend VRPavemend 15Pavemend TRPavemend 5Set 45Set 45 HWPavemend EXFive Star Structural ConcreteThoroc 10-60C Rapid CementPavemend SLQFive Star Highway PatchPavemend SLThoroc 10-61C Rapid Cement
Figure 40. Sensitivity Analysis on Desirable Material Properties Value
65
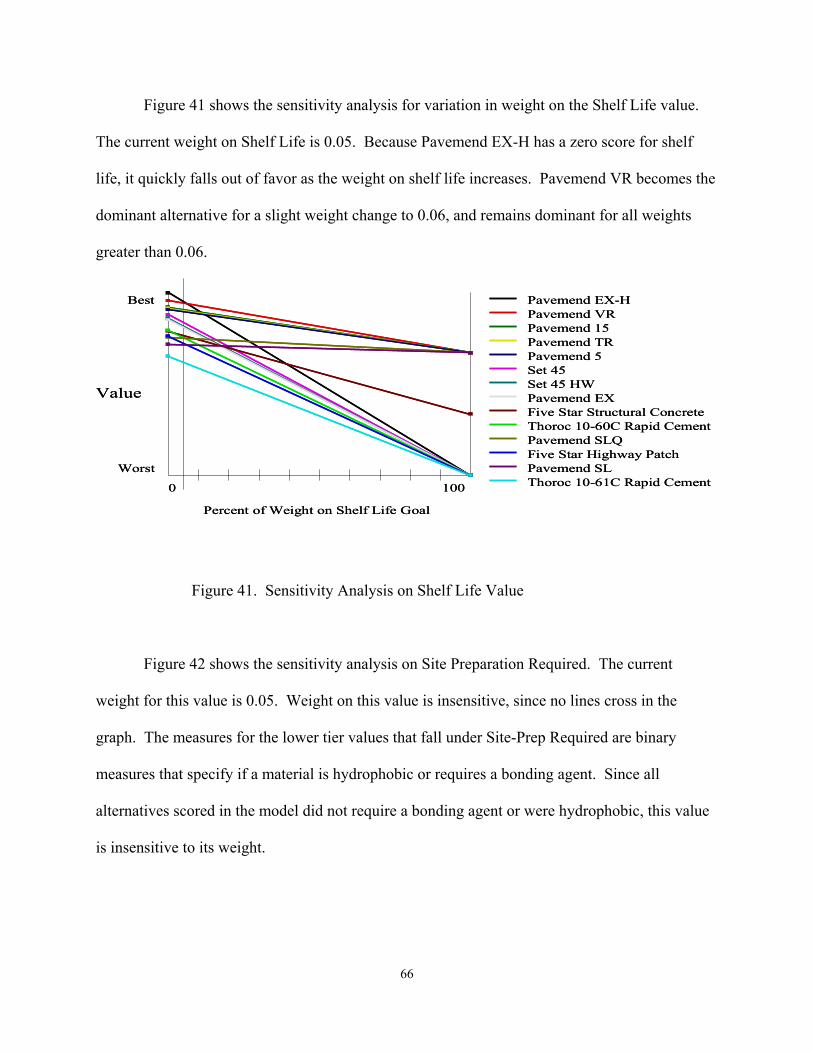
Figure 41 shows the sensitivity analysis for variation in weight on the Shelf Life value.
The current weight on Shelf Life is 0.05. Because Pavemend EX-H has a zero score for shelf
life, it quickly falls out of favor as the weight on shelf life increases. Pavemend VR becomes the
dominant alternative for a slight weight change to 0.06, and remains dominant for all weights
greater than 0.06.
Value
Percent of Weight on Shelf Life Goal
Best
Worst
0 100
Pavemend EX-HPavemend VRPavemend 15Pavemend TRPavemend 5Set 45Set 45 HWPavemend EXFive Star Structural ConcreteThoroc 10-60C Rapid CementPavemend SLQFive Star Highway PatchPavemend SLThoroc 10-61C Rapid Cement
Value
Percent of Weight on Shelf Life Goal
Best
Worst
0 100
Pavemend EX-HPavemend VRPavemend 15Pavemend TRPavemend 5Set 45Set 45 HWPavemend EXFive Star Structural ConcreteThoroc 10-60C Rapid CementPavemend SLQFive Star Highway PatchPavemend SLThoroc 10-61C Rapid Cement
Figure 41. Sensitivity Analysis on Shelf Life Value
Figure 42 shows the sensitivity analysis on Site Preparation Required. The current
weight for this value is 0.05. Weight on this value is insensitive, since no lines cross in the
graph. The measures for the lower tier values that fall under Site-Prep Required are binary
measures that specify if a material is hydrophobic or requires a bonding agent. Since all
alternatives scored in the model did not require a bonding agent or were hydrophobic, this value
is insensitive to its weight.
66

Value
Percent of Weight on Site-Prep Required Goal
Best
Worst
0 100
Pavemend EX-HPavemend VRPavemend 15Pavemend TRPavemend 5Set 45Set 45 HWPavemend EXFive Star Structural ConcreteThoroc 10-60C Rapid CementPavemend SLQFive Star Highway PatchPavemend SLThoroc 10-61C Rapid Cement
Value
Percent of Weight on Site-Prep Required Goal
Best
Worst
0 100
Pavemend EX-HPavemend VRPavemend 15Pavemend TRPavemend 5Set 45Set 45 HWPavemend EXFive Star Structural ConcreteThoroc 10-60C Rapid CementPavemend SLQFive Star Highway PatchPavemend SLThoroc 10-61C Rapid Cement
Figure 42. Sensitivity Analysis on Site-Preparation Required Value
Figure 43 shows the sensitivity analysis on Workability. The current global weight is
0.25. A small weight change in the negative direction to 0.23 causes Pavemend VR to be the top
choice. Pavemend VR is the dominant alternative for weights ranging from 0.14 to 0.23. For
weights below 0.14, Pavemend 5 is the best alternative. This value is highly sensitive to weight,
causing three alternatives to rank at the top for only a 0.09 swing in weight.
Value
Percent of Weight on Workability Goal
Best
Worst
0 100
Pavemend EX-HPavemend VRPavemend 15Pavemend TRPavemend 5Set 45Set 45 HWPavemend EXFive Star Structural ConcreteThoroc 10-60C Rapid CementPavemend SLQFive Star Highway PatchPavemend SLThoroc 10-61C Rapid Cement
Value
Percent of Weight on Workability Goal
Best
Worst
0 100
Pavemend EX-HPavemend VRPavemend 15Pavemend TRPavemend 5Set 45Set 45 HWPavemend EXFive Star Structural ConcreteThoroc 10-60C Rapid CementPavemend SLQFive Star Highway PatchPavemend SLThoroc 10-61C Rapid Cement
Figure 43. Senstivity Analysis on Workability Value
67
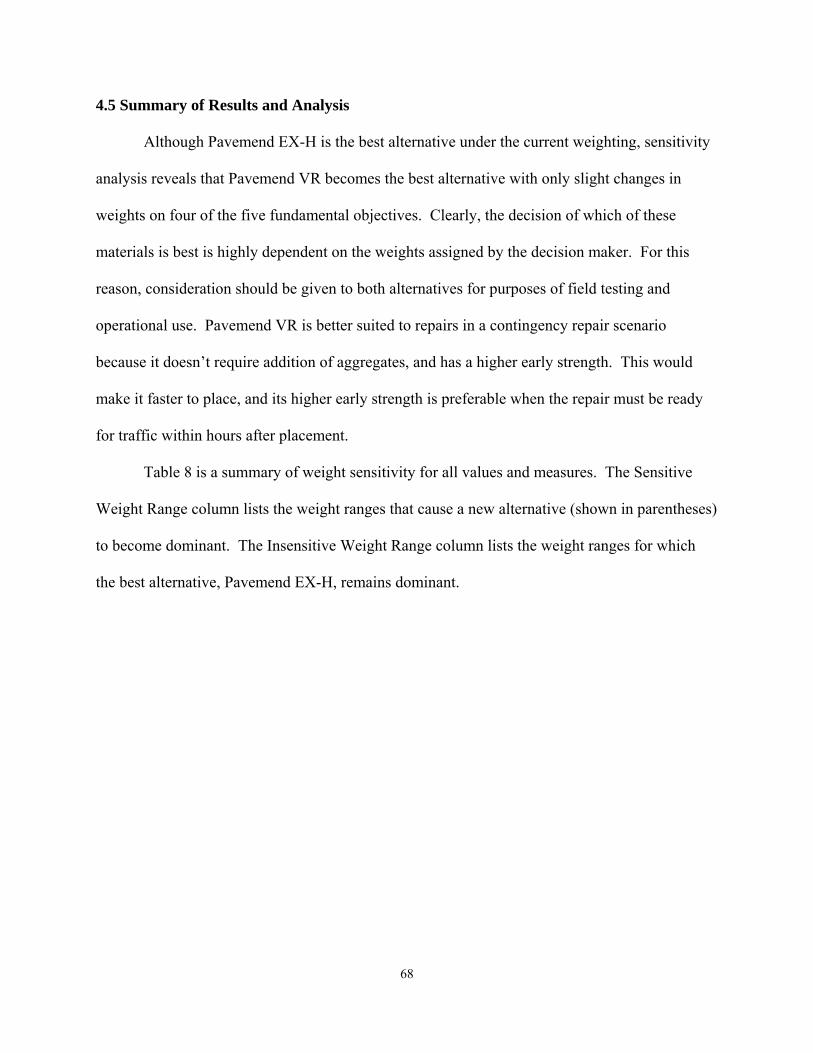
4.5 Summary of Results and Analysis
Although Pavemend EX-H is the best alternative under the current weighting, sensitivity
analysis reveals that Pavemend VR becomes the best alternative with only slight changes in
weights on four of the five fundamental objectives. Clearly, the decision of which of these
materials is best is highly dependent on the weights assigned by the decision maker. For this
reason, consideration should be given to both alternatives for purposes of field testing and
operational use. Pavemend VR is better suited to repairs in a contingency repair scenario
because it doesn’t require addition of aggregates, and has a higher early strength. This would
make it faster to place, and its higher early strength is preferable when the repair must be ready
for traffic within hours after placement.
Table 8 is a summary of weight sensitivity for all values and measures. The Sensitive
Weight Range column lists the weight ranges that cause a new alternative (shown in parentheses)
to become dominant. The Insensitive Weight Range column lists the weight ranges for which
the best alternative, Pavemend EX-H, remains dominant.
68

Table 8. Summary of Weight Sensitivity on Values
Value Sensitivity Graph Current Global Weight Sensitive Weight Range Insensitive Weight Range
Cost
0.15 0.16-0.39 (Pavemend VR), 0.39-1.0 (Thoroc 10-60c) 0-0.16
Desirable Material Properties
0.45
0.15-0.42 (Pavemend VR), 0-0.15 (Five Star Highway
Patch) 0.42-1.00
Shelf Life
0.05 .06-1.00 (Pavemend VR) 0-.06
Site-Prep Required
0.1 N/A 0.00-1.00
Workability 0.25 0.12-0.22 (Pavemend VR), 0-
0.12 (Pavemend 5) .22-1.00
Direct Cost
0.1 0.26-0.32 (Set 45), 0.32-1.0
(Thoroc 10-60c) 0-0.26
Specialized Aggregate Required
0.05 .06-1.0 (Pavemend VR) 0-.06
Bond to Existing Substrate
0.05 0.23-0.65 (Pavemend 5),
0.23-1.0 (Pavemend SLQ) 0-0.23
69

Table 8 (Continued)
Value Sensitivity Graph Current Global Weight Sensitive Weight Range Insensitive Weight Range
Compressive Strength
0.05 0.27-1.0 (Set 45) 0-0.27
Durability
0.05 N/A 0-1.0
Early Strength
0 N/A 0-1.0
Modulus of Elasticity
0.05 0-0.04 (Pavemend VR) 0.04-1.0
0.2 0-.07 (Five Star Structural
Concrete) 0.07-1.0
Restrained Drying Shrinkage
0.05
0-0.03 (Pavemend VR), 0.40-1.0 (Five Star Structural
Concrete) 0.03-0.40 Thermal Expansion
0.05 N/A 0-1.0
Bonding Agent Required?
Hydrophobic? 0.05 N/A 0.1.0
70

Table 8 (Continued)
Insensitive Weight Range Value Sensitivity Graph Current Global Weight Sensitive Weight Range
Aggregate/Lift Requirement 0.05 0.06-1.0 (Pavemend VR) 0-0.06
Working Time 0.2 0-0.09 (Pavemend 5), 0.09-
0.19 (Pavemend VR) 0.19-1.0
71
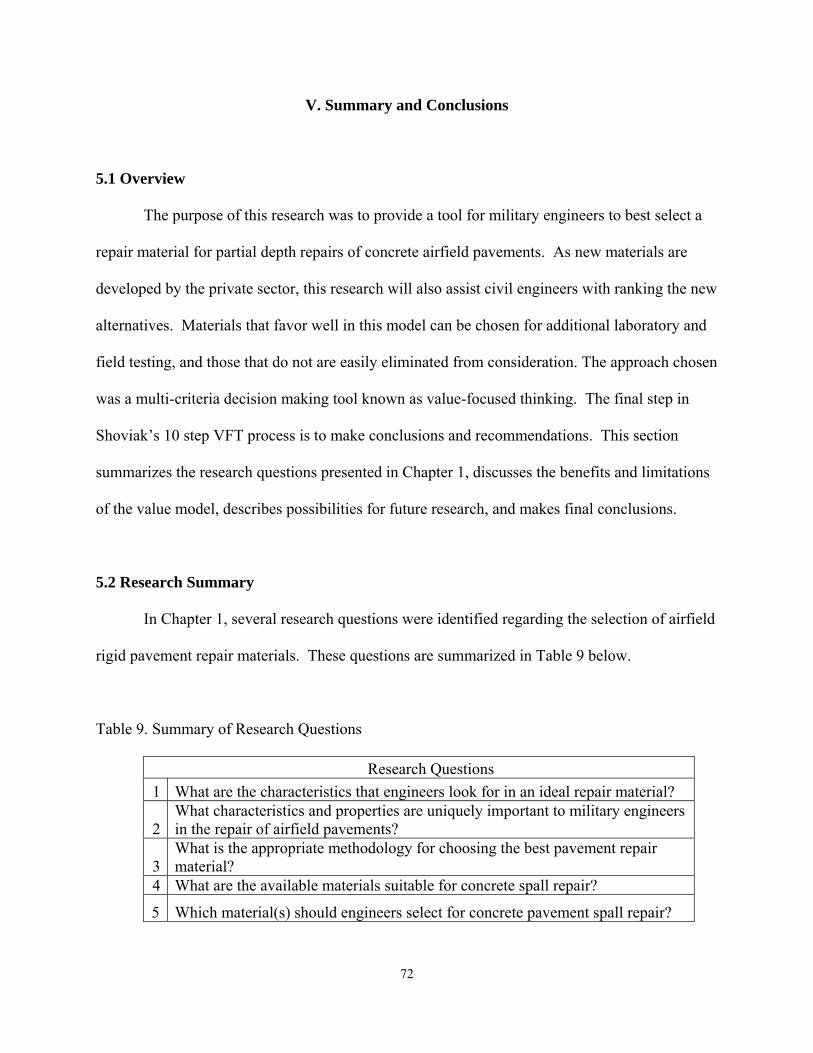
V. Summary and Conclusions
5.1 Overview
The purpose of this research was to provide a tool for military engineers to best select a
repair material for partial depth repairs of concrete airfield pavements. As new materials are
developed by the private sector, this research will also assist civil engineers with ranking the new
alternatives. Materials that favor well in this model can be chosen for additional laboratory and
field testing, and those that do not are easily eliminated from consideration. The approach chosen
was a multi-criteria decision making tool known as value-focused thinking. The final step in
Shoviak’s 10 step VFT process is to make conclusions and recommendations. This section
summarizes the research questions presented in Chapter 1, discusses the benefits and limitations
of the value model, describes possibilities for future research, and makes final conclusions.
5.2 Research Summary
In Chapter 1, several research questions were identified regarding the selection of airfield
rigid pavement repair materials. These questions are summarized in Table 9 below.
Table 9. Summary of Research Questions
Research Questions 1 What are the characteristics that engineers look for in an ideal repair material?
What characteristics and properties are uniquely important to military engineers in the repair of airfield pavements? 2 What is the appropriate methodology for choosing the best pavement repair material? 3
4 What are the available materials suitable for concrete spall repair?
5 Which material(s) should engineers select for concrete pavement spall repair?
72

What are the characteristics that engineers look for in an ideal repair material?
Engineers look for a material with favorable physical properties needed to produce a long
lasting repair. The material should have low drying shrinkage, high bond strength, and high
compressive strength. It should be durable and able to withstand weather conditions such as
freeze/thaw cycles. It should also be dimensionally compatible with the underlying substrate.
This means that it should have a similar modulus of elasticity and coefficient of thermal
expansion to the existing pavement. If a material meets the above criteria, it has a high chance of
providing a long service life without early failure.
What characteristics and properties are uniquely important to military engineers in the
repair of airfield pavements?
Military engineers look for a material that is low in cost, has favorable physical
properties, with a long shelf life and that is easy to prepare and place. The material should be
low in cost so that it does not strain financial resources, and unnecessarily waste taxpayer
dollars, when a cheaper alternative may perform equally well. Military engineers need a material
that will withstand heavy aircraft traffic; the material should have adequate physical properties to
withstand these loads and avoid additional maintenance due to early failure. In order to avoid
improperly placed repairs, a material is needed that is easy to prepare and place. The material
should have high workability and require minimal repair site preparation.
What is the appropriate methodology for choosing the best pavement repair material?
Value-Focused Thinking was determined to be the best methodology to select pavement
repair materials. VFT is an appropriate methodology to use when there are competing objectives
73

in a decision. It is an objective tool that can balance all values a decision maker faces when
selecting and ideal pavement repair material. The VFT process has the added benefit in that it
sometimes leads the decision maker to think of possible alternatives that were previously
unconsidered.
What are the available materials suitable for concrete spall repair?
The materials that were found to be suitable for concrete spall repair include products on
the commercial market advertised for structural concrete repair applications. There are too many
products on the market to list, however, so the decision makers chose materials for this model
with good industry reputation, and properties that were favorable for good results.
Which material(s) should engineers select for concrete pavement spall repair?
This model found Pavemend VR, made by Ceratech Inc., to be the best candidate for
partial depth spall repair. The material scored well on all measures in the hierarchy, and
warrants field testing and possible use on operational airfields. In addition, four other Ceratech
products scored high in this model and should also be considered: Pavemend EX-H, Pavemend
15, Pavemend 5, and Pavemend TR.
5.3 Model Strengths
The value model provides a systematic, objective, and defendable method to rank repair
product alternatives. The model is developed in a systematic series of steps that can be easily
repeated or tailored to the needs of other stakeholders. By developing and weighting a value
hierarchy before considering alternatives, the model is objective and free of bias that could
74
unduly influence the selection of alternatives. By numerically scoring repair material
alternatives with this model, the decision of which material to select can be defended with
quantifiable confidence.
5.4 Model Limitations
This model requires extensive data and lab testing of repair materials in order for
materials to be scored in the model. This testing is expensive and few manufacturers perform all
the tests. For this reason, many alternatives with the potential to perform well in this decision
had to be omitted for lack of data. In addition, many engineers find manufacturer-reported data
to be suspect and often inflated. Due to the preponderance of manufacturer data used in this
model, the results assume that manufacturers are properly performing and reporting results of
material property tests. As materials undergo further lab testing, manufacturer data in this model
should be replaced with data from independent lab testing to ensure the integrity of data in this
model.
5.5 Future Research
As stated earlier, much effort is needed to perform independent testing of concrete repair
materials. Although this may be expensive, it is well worth the cost to ensure that expensive
materials are not fielded in operational use, and found to fail early and require successive repairs.
Additionally, more research is needed to correlate material properties with field performance.
Although generalizations can be made regarding properties that are favorable to produce long
lasting repairs, minimum acceptable standards have not been established and agreed on by
researchers.
75

5.6 Conclusions
This research shows that value-focused thinking is an appropriate methodology for
selecting the best material to use for partial-depth rigid pavement spall repair. This research is
unique since it is the first decision tool developed that will select the best repair material in this
specific context. Many engineers still regard concrete repair material selection as “more of an art
than a science.” This research provides the much needed science and objectivity to the material
selection process.
The model indicates that Pavemend EX-H is the best alternative to use for conventional
repair scenarios, and Pavemend VR is the best alternative for military engineers to use in
contingency repair scenarios. This model shows that poor product candidates for pavement
repair can be eliminated from consideration, avoiding the expense of testing and fielding inferior
products. By implementing the decision strategy presented in this thesis, airfield pavement
repairs will last longer and require less maintenance.
76
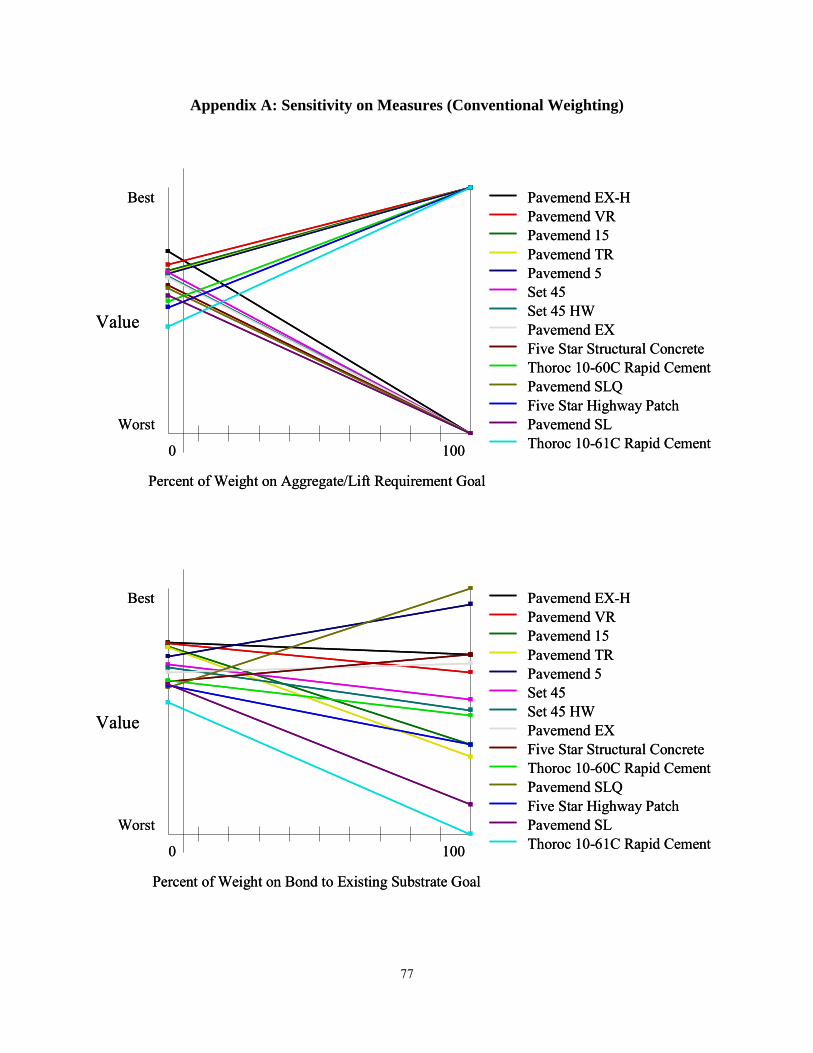
Appendix A: Sensitivity on Measures (Conventional Weighting)
Value
Percent of Weight on Aggregate/Lift Requirement Goal
Best
Worst
0 100
Pavemend EX-HPavemend VRPavemend 15Pavemend TRPavemend 5Set 45Set 45 HWPavemend EXFive Star Structural ConcreteThoroc 10-60C Rapid CementPavemend SLQFive Star Highway PatchPavemend SLThoroc 10-61C Rapid Cement
Value
Percent of Weight on Aggregate/Lift Requirement Goal
Best
Worst
0 100
Pavemend EX-HPavemend VRPavemend 15Pavemend TRPavemend 5Set 45Set 45 HWPavemend EXFive Star Structural ConcreteThoroc 10-60C Rapid CementPavemend SLQFive Star Highway PatchPavemend SLThoroc 10-61C Rapid Cement
Value
Percent of Weight on Bond to Existing Substrate Goal
Best
Worst
0 100
Pavemend EX-HPavemend VRPavemend 15Pavemend TRPavemend 5Set 45Set 45 HWPavemend EXFive Star Structural ConcreteThoroc 10-60C Rapid CementPavemend SLQFive Star Highway PatchPavemend SLThoroc 10-61C Rapid Cement
Value
Percent of Weight on Bond to Existing Substrate Goal
Best
Worst
0 100
Pavemend EX-HPavemend VRPavemend 15Pavemend TRPavemend 5Set 45Set 45 HWPavemend EXFive Star Structural ConcreteThoroc 10-60C Rapid CementPavemend SLQFive Star Highway PatchPavemend SLThoroc 10-61C Rapid Cement
77
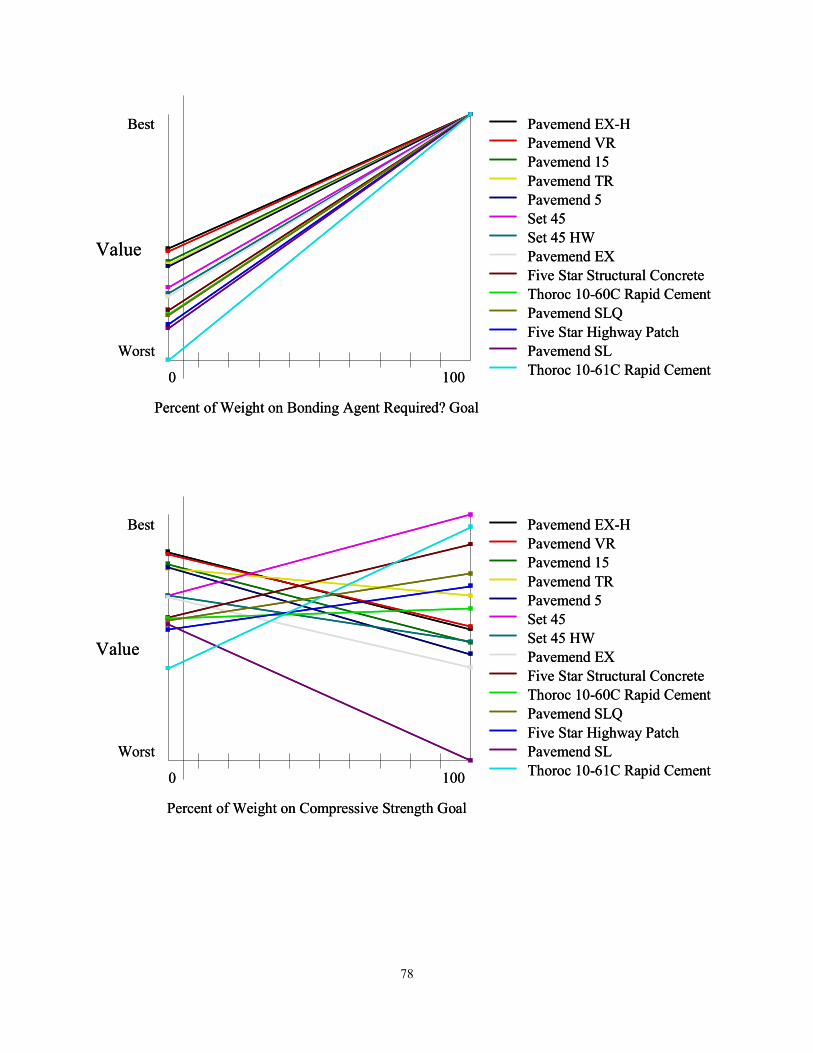
Value
Percent of Weight on Bonding Agent Required? Goal
Best
Worst
0 100
Pavemend EX-HPavemend VRPavemend 15Pavemend TRPavemend 5Set 45Set 45 HWPavemend EXFive Star Structural ConcreteThoroc 10-60C Rapid CementPavemend SLQFive Star Highway PatchPavemend SLThoroc 10-61C Rapid Cement
Value
Percent of Weight on Bonding Agent Required? Goal
Best
Worst
0 100
Pavemend EX-HPavemend VRPavemend 15Pavemend TRPavemend 5Set 45Set 45 HWPavemend EXFive Star Structural ConcreteThoroc 10-60C Rapid CementPavemend SLQFive Star Highway PatchPavemend SLThoroc 10-61C Rapid Cement
Value
Percent of Weight on Compressive Strength Goal
Best
Worst
0 100
Pavemend EX-HPavemend VRPavemend 15Pavemend TRPavemend 5Set 45Set 45 HWPavemend EXFive Star Structural ConcreteThoroc 10-60C Rapid CementPavemend SLQFive Star Highway PatchPavemend SLThoroc 10-61C Rapid Cement
Value
Percent of Weight on Compressive Strength Goal
Best
Worst
0 100
Pavemend EX-HPavemend VRPavemend 15Pavemend TRPavemend 5Set 45Set 45 HWPavemend EXFive Star Structural ConcreteThoroc 10-60C Rapid CementPavemend SLQFive Star Highway PatchPavemend SLThoroc 10-61C Rapid Cement
78

Value
Percent of Weight on Direct Cost Goal
Best
Worst
0 100
Pavemend EX-HPavemend VRPavemend 15Pavemend TRPavemend 5Set 45Set 45 HWPavemend EXFive Star Structural ConcreteThoroc 10-60C Rapid CementPavemend SLQFive Star Highway PatchPavemend SLThoroc 10-61C Rapid Cement
Value
Percent of Weight on Direct Cost Goal
Best
Worst
0 100
Pavemend EX-HPavemend VRPavemend 15Pavemend TRPavemend 5Set 45Set 45 HWPavemend EXFive Star Structural ConcreteThoroc 10-60C Rapid CementPavemend SLQFive Star Highway PatchPavemend SLThoroc 10-61C Rapid Cement
Value
Percent of Weight on Durability Goal
Best
Worst
0 100
Pavemend EX-HPavemend VRPavemend 15Pavemend TRPavemend 5Set 45Set 45 HWPavemend EXFive Star Structural ConcreteThoroc 10-60C Rapid CementPavemend SLQFive Star Highway PatchPavemend SLThoroc 10-61C Rapid Cement
Value
Percent of Weight on Durability Goal
Best
Worst
0 100
Pavemend EX-HPavemend VRPavemend 15Pavemend TRPavemend 5Set 45Set 45 HWPavemend EXFive Star Structural ConcreteThoroc 10-60C Rapid CementPavemend SLQFive Star Highway PatchPavemend SLThoroc 10-61C Rapid Cement
79

Value
Percent of Weight on Early Strength Goal
Best
Worst
0 100
Pavemend EX-HPavemend VRPavemend 15Pavemend TRPavemend 5Set 45Set 45 HWPavemend EXFive Star Structural ConcreteThoroc 10-60C Rapid CementPavemend SLQFive Star Highway PatchPavemend SLThoroc 10-61C Rapid Cement
Value
Percent of Weight on Early Strength Goal
Best
Worst
0 100
Pavemend EX-HPavemend VRPavemend 15Pavemend TRPavemend 5Set 45Set 45 HWPavemend EXFive Star Structural ConcreteThoroc 10-60C Rapid CementPavemend SLQFive Star Highway PatchPavemend SLThoroc 10-61C Rapid Cement
Value
Percent of Weight on Hydrophobic? Goal
Best
Worst
0 100
Pavemend EX-HPavemend VRPavemend 15Pavemend TRPavemend 5Set 45Set 45 HWPavemend EXFive Star Structural ConcreteThoroc 10-60C Rapid CementPavemend SLQFive Star Highway PatchPavemend SLThoroc 10-61C Rapid Cement
Value
Percent of Weight on Hydrophobic? Goal
Best
Worst
0 100
Pavemend EX-HPavemend VRPavemend 15Pavemend TRPavemend 5Set 45Set 45 HWPavemend EXFive Star Structural ConcreteThoroc 10-60C Rapid CementPavemend SLQFive Star Highway PatchPavemend SLThoroc 10-61C Rapid Cement
80

Value
Percent of Weight on Modulus of Elasticity Goal
Best
Worst
0 100
Pavemend EX-HPavemend VRPavemend 15Pavemend TRPavemend 5Set 45Set 45 HWPavemend EXFive Star Structural ConcreteThoroc 10-60C Rapid CementPavemend SLQFive Star Highway PatchPavemend SLThoroc 10-61C Rapid Cement
Value
Percent of Weight on Modulus of Elasticity Goal
Best
Worst
0 100
Pavemend EX-HPavemend VRPavemend 15Pavemend TRPavemend 5Set 45Set 45 HWPavemend EXFive Star Structural ConcreteThoroc 10-60C Rapid CementPavemend SLQFive Star Highway PatchPavemend SLThoroc 10-61C Rapid Cement
Value
Percent of Weight on Restrained Drying Shrinkage Goal
Best
Worst
0 100
Pavemend EX-HPavemend VRPavemend 15Pavemend TRPavemend 5Set 45Set 45 HWPavemend EXFive Star Structural ConcreteThoroc 10-60C Rapid CementPavemend SLQFive Star Highway PatchPavemend SLThoroc 10-61C Rapid Cement
Value
Percent of Weight on Restrained Drying Shrinkage Goal
Best
Worst
0 100
Pavemend EX-HPavemend VRPavemend 15Pavemend TRPavemend 5Set 45Set 45 HWPavemend EXFive Star Structural ConcreteThoroc 10-60C Rapid CementPavemend SLQFive Star Highway PatchPavemend SLThoroc 10-61C Rapid Cement
81

Value
Percent of Weight on Specialized Aggregate Required Goal
Best
Worst
0 100
Pavemend EX-HPavemend VRPavemend 15Pavemend TRPavemend 5Set 45Set 45 HWPavemend EXFive Star Structural ConcreteThoroc 10-60C Rapid CementPavemend SLQFive Star Highway PatchPavemend SLThoroc 10-61C Rapid Cement
Preference Set = NEW PREF. SET
Value
Percent of Weight on Thermal Expansion Goal
Best
Worst
0 100
Pavemend EX-HPavemend VRPavemend 15Pavemend TRPavemend 5Set 45Set 45 HWPavemend EXFive Star Structural ConcreteThoroc 10-60C Rapid CementPavemend SLQFive Star Highway PatchPavemend SLThoroc 10-61C Rapid Cement
Value
Percent of Weight on Thermal Expansion Goal
Best
Worst
0 100
Pavemend EX-HPavemend VRPavemend 15Pavemend TRPavemend 5Set 45Set 45 HWPavemend EXFive Star Structural ConcreteThoroc 10-60C Rapid CementPavemend SLQFive Star Highway PatchPavemend SLThoroc 10-61C Rapid Cement
82

Value
Percent of Weight on Working Time Goal
Best
Worst
0 100
Pavemend EX-HPavemend VRPavemend 15Pavemend TRPavemend 5Set 45Set 45 HWPavemend EXFive Star Structural ConcreteThoroc 10-60C Rapid CementPavemend SLQFive Star Highway PatchPavemend SLThoroc 10-61C Rapid Cement
Value
Percent of Weight on Working Time Goal
Best
Worst
0 100
Pavemend EX-HPavemend VRPavemend 15Pavemend TRPavemend 5Set 45Set 45 HWPavemend EXFive Star Structural ConcreteThoroc 10-60C Rapid CementPavemend SLQFive Star Highway PatchPavemend SLThoroc 10-61C Rapid Cement
83

Appendix B: Sensitivity on Measures (Contingency Weighted)
Value
Percent of Weight on Direct Cost Goal
Best
Worst
0 100
Pavemend VR Pavemend EX-H Pavemend 15Pavemend 5Pavemend TR Set 45Pavemend EX Set 45 HW Pavemend SLQ Pavemend SLFive Star Structural ConcreteFive Star Highway PatchThoroc 10-60C Rapid CementThoroc 10-61C Rapid Cement
Value
Percent of Weight on Specialized Aggregate Required Goal
Best
Worst
0 100
Pavemend VR Pavemend EX-H Pavemend 15Pavemend 5Pavemend TR Set 45Pavemend EX Set 45 HW Pavemend SLQ Pavemend SLFive Star Structural ConcreteFive Star Highway PatchThoroc 10-60C Rapid CementThoroc 10-61C Rapid Cement
84

Value
Percent of Weight on Bond to Existing Substrate Goal
Best
Worst
0 100
Pavemend VR Pavemend EX-H Pavemend 15Pavemend 5Pavemend TR Set 45Pavemend EX Set 45 HW Pavemend SLQ Pavemend SLFive Star Structural ConcreteFive Star Highway PatchThoroc 10-60C Rapid CementThoroc 10-61C Rapid Cement
Value
Percent of Weight on Bonding Agent Required? Goal
Best
Worst
0 100
Pavemend VR Pavemend EX-H Pavemend 15Pavemend 5Pavemend TR Set 45Pavemend EX Set 45 HW Pavemend SLQ Pavemend SLFive Star Structural ConcreteFive Star Highway PatchThoroc 10-60C Rapid CementThoroc 10-61C Rapid Cement
85
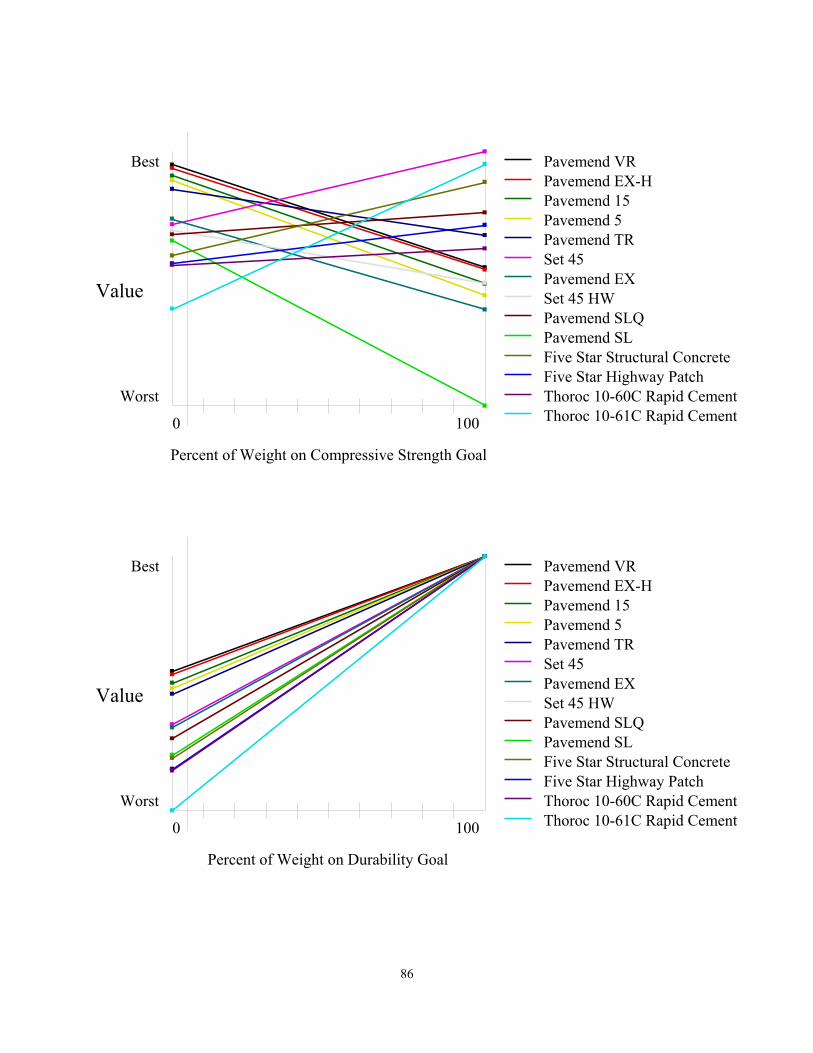
Value
Percent of Weight on Compressive Strength Goal
Best
Worst
0 100
Pavemend VR Pavemend EX-H Pavemend 15Pavemend 5Pavemend TR Set 45Pavemend EX Set 45 HW Pavemend SLQ Pavemend SLFive Star Structural ConcreteFive Star Highway PatchThoroc 10-60C Rapid CementThoroc 10-61C Rapid Cement
Value
Percent of Weight on Durability Goal
Best
Worst
0 100
Pavemend VR Pavemend EX-H Pavemend 15Pavemend 5Pavemend TR Set 45Pavemend EX Set 45 HW Pavemend SLQ Pavemend SLFive Star Structural ConcreteFive Star Highway PatchThoroc 10-60C Rapid CementThoroc 10-61C Rapid Cement
86

Value
Percent of Weight on Early Strength Goal
Best
Worst
0 100
Pavemend VR Pavemend EX-H Pavemend 15Pavemend 5Pavemend TR Set 45Pavemend EX Set 45 HW Pavemend SLQ Pavemend SLFive Star Structural ConcreteFive Star Highway PatchThoroc 10-60C Rapid CementThoroc 10-61C Rapid Cement
Value
Percent of Weight on Modulus of Elasticity Goal
Best
Worst
0 100
Pavemend VR Pavemend EX-H Pavemend 15Pavemend 5Pavemend TR Set 45Pavemend EX Set 45 HW Pavemend SLQ Pavemend SL Five Star Highway PatchThoroc 10-60C Rapid CementThoroc 10-61C Rapid Cement
87
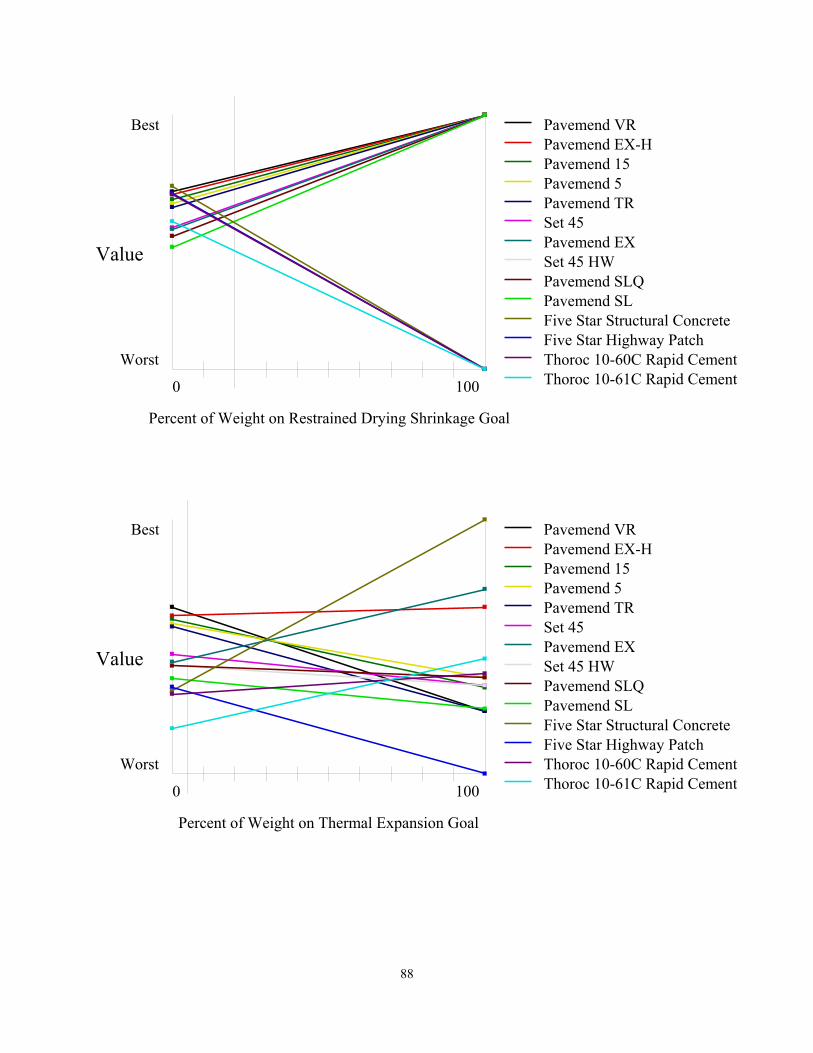
Value
Percent of Weight on Restrained Drying Shrinkage Goal
Best
Worst
0 100
Pavemend VR Pavemend EX-H Pavemend 15Pavemend 5Pavemend TR Set 45Pavemend EX Set 45 HW Pavemend SLQ Pavemend SLFive Star Structural ConcreteFive Star Highway PatchThoroc 10-60C Rapid CementThoroc 10-61C Rapid Cement
Value
Percent of Weight on Thermal Expansion Goal
Best
Worst
0 100
Pavemend VR Pavemend EX-H Pavemend 15Pavemend 5Pavemend TR Set 45Pavemend EX Set 45 HW Pavemend SLQ Pavemend SLFive Star Structural ConcreteFive Star Highway PatchThoroc 10-60C Rapid CementThoroc 10-61C Rapid Cement
88

Value
Percent of Weight on Hydrophobic? Goal
Best
Worst
0 100
Pavemend VR Pavemend EX-H Pavemend 15Pavemend 5Pavemend TR Set 45Pavemend EX Set 45 HW Pavemend SLQ Pavemend SLFive Star Structural ConcreteFive Star Highway PatchThoroc 10-60C Rapid CementThoroc 10-61C Rapid Cement
Value
Percent of Weight on Aggregate/Lift Requirement Goal
Best
Worst
0 100
Pavemend VR Pavemend EX-H Pavemend 15Pavemend 5Pavemend TR Set 45Pavemend EX Set 45 HW Pavemend SLQ Pavemend SLFive Star Structural ConcreteFive Star Highway PatchThoroc 10-60C Rapid CementThoroc 10-61C Rapid Cement
89

Value
Percent of Weight on Working Time Goal
Best
Worst
0 100
Pavemend VR Pavemend EX-H Pavemend 15Pavemend 5Pavemend TR Set 45Pavemend EX Set 45 HW Pavemend SLQ Pavemend SLFive Star Structural ConcreteFive Star Highway PatchThoroc 10-60C Rapid CementThoroc 10-61C Rapid Cement
90
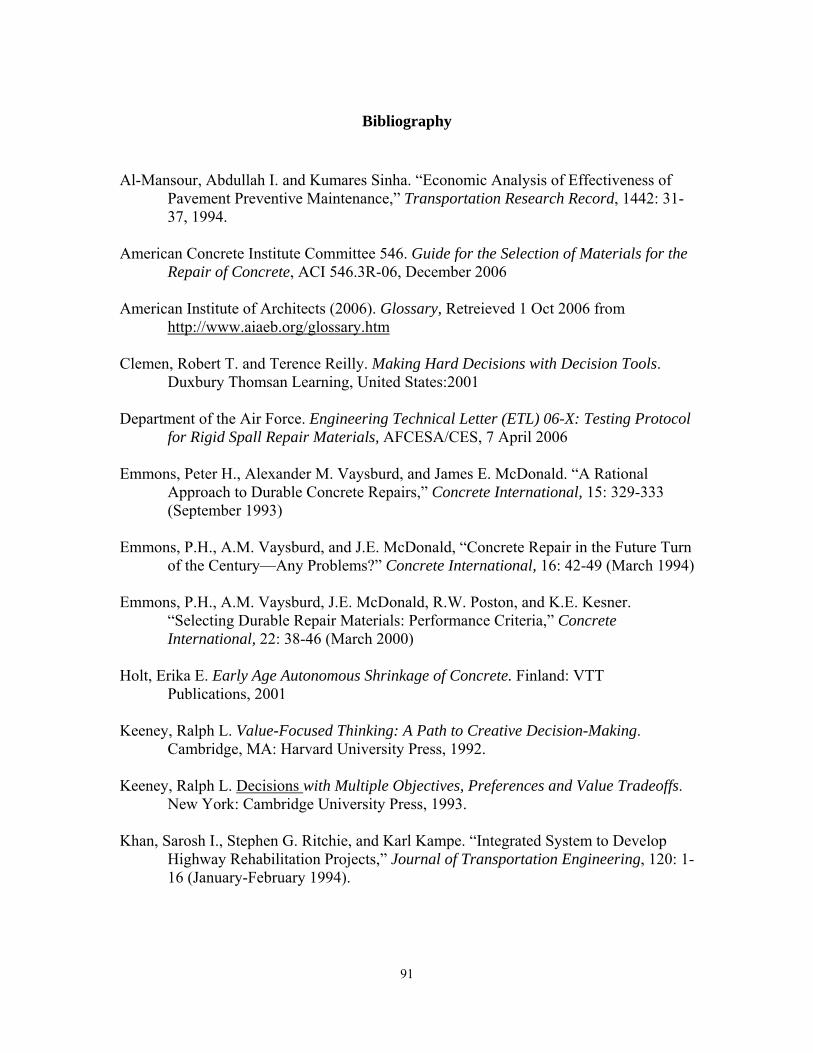
Bibliography Al-Mansour, Abdullah I. and Kumares Sinha. “Economic Analysis of Effectiveness of Pavement Preventive Maintenance,” Transportation Research Record, 1442: 31- 37, 1994. American Concrete Institute Committee 546. Guide for the Selection of Materials for the Repair of Concrete, ACI 546.3R-06, December 2006 American Institute of Architects (2006). Glossary, Retreieved 1 Oct 2006 from http://www.aiaeb.org/glossary.htm Clemen, Robert T. and Terence Reilly. Making Hard Decisions with Decision Tools. Duxbury Thomsan Learning, United States:2001 Department of the Air Force. Engineering Technical Letter (ETL) 06-X: Testing Protocol for Rigid Spall Repair Materials, AFCESA/CES, 7 April 2006 Emmons, Peter H., Alexander M. Vaysburd, and James E. McDonald. “A Rational Approach to Durable Concrete Repairs,” Concrete International, 15: 329-333 (September 1993) Emmons, P.H., A.M. Vaysburd, and J.E. McDonald, “Concrete Repair in the Future Turn of the Century—Any Problems?” Concrete International, 16: 42-49 (March 1994) Emmons, P.H., A.M. Vaysburd, J.E. McDonald, R.W. Poston, and K.E. Kesner. “Selecting Durable Repair Materials: Performance Criteria,” Concrete International, 22: 38-46 (March 2000) Holt, Erika E. Early Age Autonomous Shrinkage of Concrete. Finland: VTT Publications, 2001 Keeney, Ralph L. Value-Focused Thinking: A Path to Creative Decision-Making. Cambridge, MA: Harvard University Press, 1992. Keeney, Ralph L. Decisions with Multiple Objectives, Preferences and Value Tradeoffs. New York: Cambridge University Press, 1993. Khan, Sarosh I., Stephen G. Ritchie, and Karl Kampe. “Integrated System to Develop Highway Rehabilitation Projects,” Journal of Transportation Engineering, 120: 1- 16 (January-February 1994).
91

Kirkwood, Craig W. Strategic Decision Making Multiobjective Decision Analysis with Spreadsheets. Wadsworth Publishing Company, California, 1997. McDonald, J.E., A.M. Vaysburd, P.H. Emmons, R.W. Poston, and K. Kesner. “Selecting
Durable Repair Materials: Performance Criteria-Summary,” Concrete International, 37-44 (January 2002).
National Ready Mixed Concrete Association (NRMCA). Freeze Thaw Resistance of
Pervious Concrete, Silver Spring, Maryland, May 2004 Portland Cement Association (2006). Concrete Technology, Retrieved 1 October, 2006
from http://www.cement.org/tech/cct_dur_freeze-thaw.asp Poston, Randall W., Keith Kesner, James E. McDonald, Alexander M. Vaysburd, and
Peter H. Emmons. “Concrete Repair Material Performance—Laboratory Study,” ACI Materials Journal, 98: 137-147 (March-April 2001)
Ritchie, Stephen G., Che-I Yeh, Joe P. Mahoney, and Newton C. Jackson. “Development
of an Expert System for Pavement Rehabilitation Decision Making,” Transportation Research Record, 1070: 96-103 (1986)
Rizzo, Edward M. and Martin B. Sobelman. “Selection Criteria for Concrete Repair
Materials,” Concrete International, 11: 46-49 (September 1989) Saaty, Thomas L. “How to Make a Decision: The Analytic Hierarchy Process,” European
Journal of Operational Research, 48: 9-26 (1990) Shoviak, Mark J. Decision Analysis Methodology to Evaluate Integrated Solid Waste
Management Alternatives for a Remote Alaskan Air Station. MS Thesis, AFIT/GEE/ENV/01M-20. Graduate School of Engineering and Management, Air Force Institute of Technology (AU), Wright-Patterson AFB OH, March 2001
Skibniewski, Miroslaw J. and Li-Chung Chao. “Evaluation of Advanced Construction Technology with AHP Method,” Journal of Construction Engineering and Management, 118: 577-593 (September 1992) US Army Corps of Engineers, Waterways Experiement Station. Performance Criteria for Concrete RepairMaterials, Phase II Summary Report, Technical Report REMR- CS-62, March 1999
92

Vita Captain Benjamin G. Speer graduated in May 1997 from Buchholz High School
in Gainesville, Florida. He attended Embry-Riddle Aeronautical University in Daytona
Beach, Florida, and graduated in May 2002 with a Bachelor of Science degree in Civil
Engineering. He was commissioned through the Air Force Reserve Officer Training
Corps, Detachment 157.
Captain Speer’s first assignment was with the 30th Civil Engineer Squadron,
Vandenberg Air Force Base, California. During this assignment, he served as an
Environmental Flight Project Manager, as the squadron Unit Deployment Manager, and
as an Operations Flight Maintenance Engineer. While at Vandenberg, he also deployed
to Balad AB, Iraq, for 181 days as a RED HORSE Project OIC. Upon graduation,
Captain Speer will separate from active duty, join the Air Force Reserves, and pursue a
career in corporate management.
93

REPORT DOCUMENTATION PAGE Form Approved OMB No. 074-0188
The public reporting burden for this collection of information is estimated to average 1 hour per response, including the time for reviewing instructions, searching existing data sources, gathering and maintaining the data needed, and completing and reviewing the collection of information. Send comments regarding this burden estimate or any other aspect of the collection of information, including suggestions for reducing this burden to Department of Defense, Washington Headquarters Services, Directorate for Information Operations and Reports (0704-0188), 1215 Jefferson Davis Highway, Suite 1204, Arlington, VA 22202-4302. Respondents should be aware that notwithstanding any other provision of law, no person shall be subject to an penalty for failing to comply with a collection of information if it does not display a currently valid OMB control number. PLEASE DO NOT RETURN YOUR FORM TO THE ABOVE ADDRESS. 1. REPORT DATE (DD-MM-YYYY)
03-22-2007 2. REPORT TYPE
Master’s Thesis 3. DATES COVERED (From – To)
Sep 2006 – Mar 2007 5a. CONTRACT NUMBER
5b. GRANT NUMBER
4. TITLE AND SUBTITLE A Value-Focused Thinking Model for the Selection of the Best Rigid Pavement, Partial-Depth Spall Repair Material
5c. PROGRAM ELEMENT NUMBER
5d. PROJECT NUMBER 5e. TASK NUMBER
6. AUTHOR(S) Speer, Benjamin, G., Captain, USAF
5f. WORK UNIT NUMBER
8. PERFORMING ORGANIZATION REPORT NUMBER
7. PERFORMING ORGANIZATION NAMES(S) AND ADDRESS(S) Air Force Institute of Technology
Graduate School of Engineering and Management (AFIT/EN) 2950 Hobson Street, Building 642 WPAFB OH 45433-7765
AFIT/GEM/ENS/07-04
10. SPONSOR/MONITOR’S ACRONYM(S)
9. SPONSORING/MONITORING AGENCY NAME(S) AND ADDRESS(ES) HQ/AFCESA Attn: James L. Greene 139 Barnes Drive Suite 1 DSN: 523-6334 Tyndall AFB, FL 32403-5319 e-mail: [email protected]
11. SPONSOR/MONITOR’S REPORT NUMBER(S)
12. DISTRIBUTION/AVAILABILITY STATEMENT APPROVED FOR PUBLIC RELEASE; DISTRIBUTION UNLIMITED. 13. SUPPLEMENTARY NOTES 14. ABSTRACT Concrete spalls on airfield pavements generate foreign object debris (FOD) that is damaging to aircraft engines, and may damage landing gear by roughening of the pavement surface. Repairing spalled concrete on aging and deteriorating airfields is essential for its safe operational use. Picking the best repair material from many products on the commercial market is difficult. There is wide variation on material properties, and good performance on certain criteria is critical to constructing long lasting repairs. Since there is currently no procedure for Air Force decision–makers to select the best rigid-pavement repair material, a model was created using Value–Focused Thinking (VFT) to evaluate repair material alternatives. Fourteen products were compared against each other. Each was scored using fourteen evaluation measures that were identified as important to the repair material selection process. Pavemend EX-H was found to be the best choice for repairs conducted during conventional, steady-state operations. VFT was shown to be an effective methodology for objectively ranking repair products, while providing a systematic process that can be tailored for future circumstances. 15. SUBJECT TERMS Decision Analysis, Value-Focused Thinking, VFT, Airfield, Concrete, Pavement, Spall, Repair 16. SECURITY CLASSIFICATION OF: 19a. NAME OF RESPONSIBLE PERSON
Shane A. Knighton, Maj, USAF (ENS) 17. LIMITATION OF ABSTRACT
UU
18. NUMBER OF PAGES 19b. TELEPHONE NUMBER (Include area code) a. REPORT b. ABSTRACT c. THIS PAGE (937) 785-3636, ext 4575; e-mail: [email protected] 106 U U U
Standard Form 298 (Rev. 8-98) Prescribed by ANSI Std. Z39-18