a wall interference assessment/correction system semi ... · a wall interference...
TRANSCRIPT

A WALL INTERFERENCE
ASSESSMENT/CORRECTION
SYSTEM
SEMI-ANNUAL
REPORT #2
JANUARY - JUNE 1992
Dr. C.F. Lo, Principal Investigator
University of Tennessee Space Institute
NASA Ames Research Center NAG 2-733
Ames Research Center
Moffett Field, CA 94035-1000
INSTITUTION:
CSTAR - Center for Space
Transportation and Applied ResearchUTSI Research Park
Tullahoma, TN 37388-8897
Phone 615-455-9294 or 5884
https://ntrs.nasa.gov/search.jsp?R=19930002722 2018-06-20T05:36:21+00:00Z

Title: A Wall Interference Assessment/Correction System
Semi-Annual Report
January - June, 1992
Principal Investigator:
Dr. C. F. Lo, UTSI
Other Investigators:
Mr. N. Ulbrich, GRA/UTSI
Mr. W. L. Sickles, CSTAR/Calspan
Ms. Cathy X. Qian, GRA/UTSI
Technical Officer:
Dr. Frank W. Steinle, NASA/Ames Research Center
Technical Objectives
A Wall Signature method, the Hackett method, has been selected to
be adapted for the 12-ft Wind Tunnel WIAC system in the present
phase. This method uses limited measurements of the static
pressure at the wall, in conjunction with the solid wall boundary
condition, to determine the strength and distribution of
singularities representing the test article. The singularities are
used in turn for estimating wall interference at the model
location. The Wall Signature method will have to be formulated for
application to the unique geometry of the 12-ft Tunnel. The
development and implementation of a working prototype will becompleted, delivered and documented with a software manual.
The WIAC code will be validated by conducting numerically simulated
experiments rather actual wind tunnel experiments. It is an
effective, but efficient way to validate the implemented code.
The simulations will be used to generate both free-air and confined
wind-tunnel flow fields for each of the test articles over a range
of test configurations. Specifically, the pressure signature at
the test section wall will be computed for the tunnel case to
provide the simulated "measured" data. These data will serve as
the input for the WIAC method--Wall Signature method. The
performance of the WIAC method then may be evaluated by comparingthe corrected parameters with those for the free-air simulation.
Each set of wind tunnel/test article numerical simulations providesdata to validate the WIAC method.

Status of Progress
A. Numerical Simulation of Tunnel Flow
A numerical wind tunnel test simulation is initiated to validate
the WIAC methods developed in the project, specifically to the Wall
Signature Method--Modified Hackett's method in the current phase.
A low-order potential-flow panel method PMARC(Ref. I) with a
aerodynamic plotting program PMAPP(Ref.2) has been selected to
simulate the wind tunnel and test article geometries. This
simulation should provide two sets of data: (i) a reference
solution of the interference problem; and (ii) the surface pressure
distribution on selected wall locations.
The flow field of a test article installed in the 12-ft Pressure
Wind Tunnel has been simulated using the panel method code PMARC.
Pressure coefficients on a given test article and wind tunnel wall
panels were computed by this panel code. The geometry of the
selected test article and the location of corresponding surface
panel elements are depicted in Fig. A-I. The test article is
installed in the NASA ARC 12ft Pressure Wind Tunnel as shown in
Fig. A-2 which depicts the location of the wind tunnel wall panels
relative to the location of the test article.
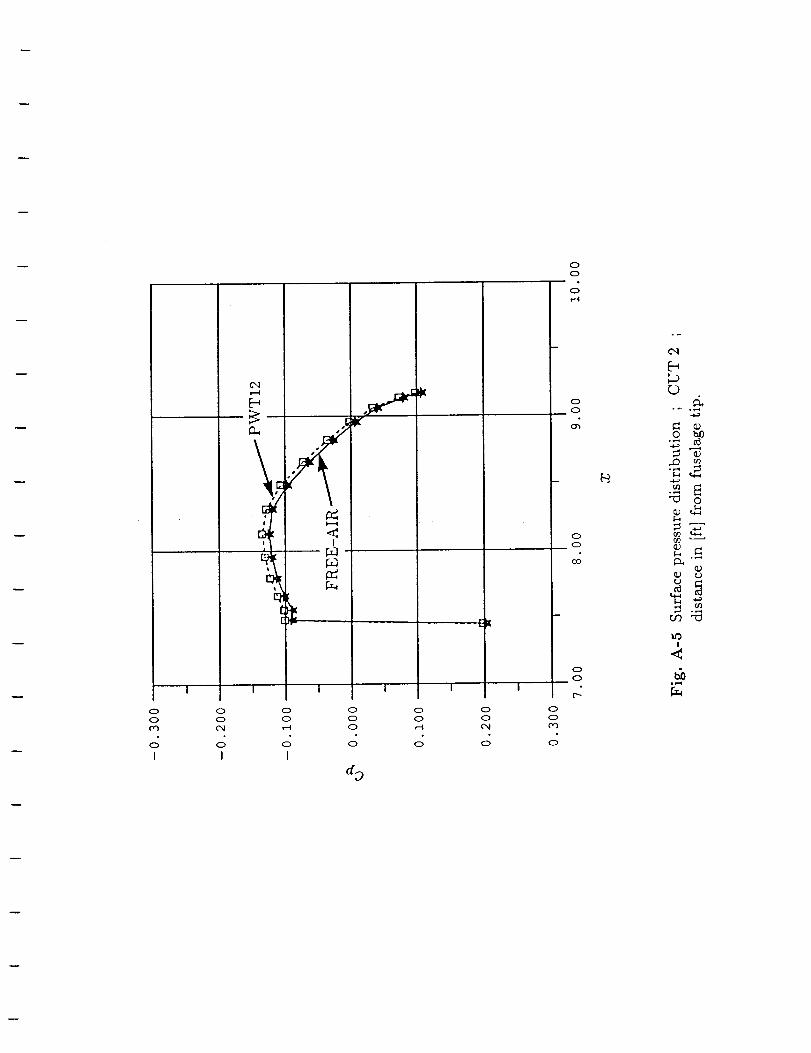
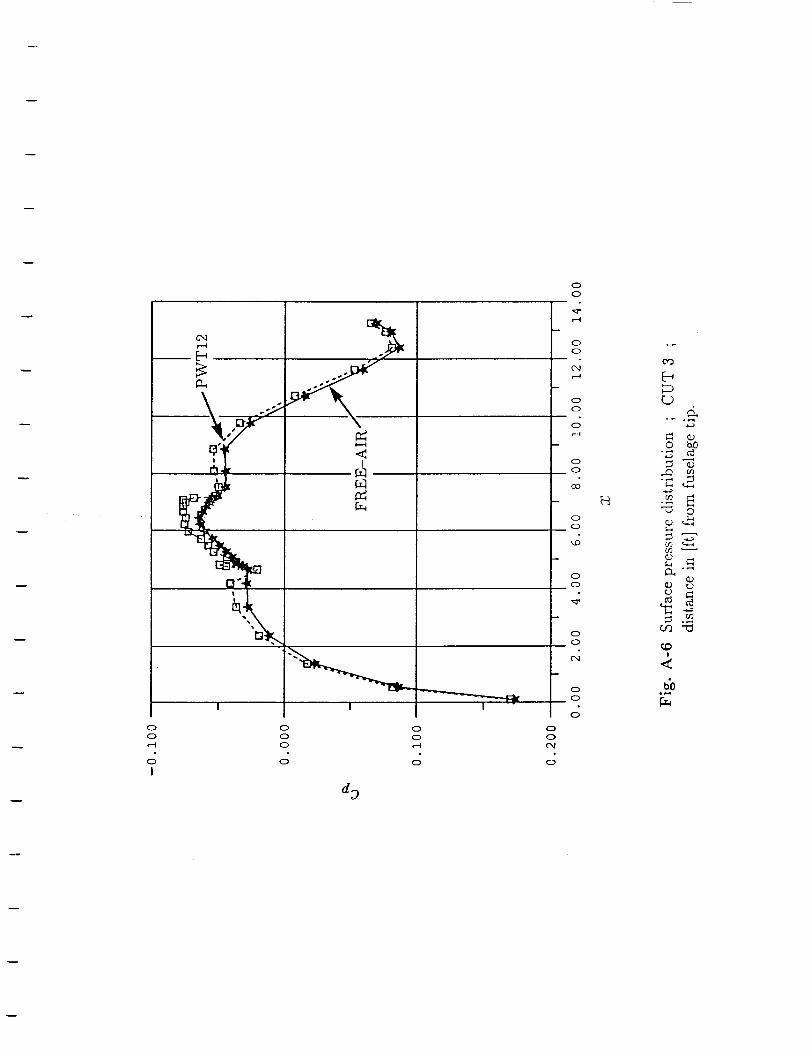
For the free air case, the pressure coefficient distribution is
calculated on three selected cuts of the test article geometry.
The location of the cuts is given in Fig. A-3. The pressure
distribution for the wind tunnel case on the same three cuts is
calculated as well. Corresponding free-air and wind tunnel
solutions can be compared in Figs. A-4, A-5 and A-6. Surface
velocities are slightly higher in the case of the wind tunnel
solution as expected. The difference between free-air and wind
tunnel solution of the pressure distribution on corresponding
surface panel locations can be used as the reference solution of
the interference problem.
The pressure coefficient distributions on five selected rows on thewind tunnel wall are also calculated. The location of the rows on
the wind tunnel wall and corresponding pressure coefficient
distributions are depicted in Figs. A-7a, b, c, d, e.
These calculated wall pressure coefficient distributions can be
used as inputs into the Wall Signature method to obtaininterference corrections.
All numerical computation were carried out on a research VAX
computer at NASA/ARC Aerodynamics division.

B. Wall Signature Method Implementation
The Wall Signature method (Ref. 3) is considered to calculate ablockage and lifting(angle of attack) correction in the NASA/ARC12-ft Pressure Wind Tunnel. In the present reported period, theblockage correction has been developed and implemented for arectangular tunnel (Ref. 4) as well as 12-ft Pressure Tunnel (Ref.5). Figure B-I shows basic elements of a Wall Signature method.In the first part of the development, blockage corrections wereinvestigated in detail. A modified form of the Wall Signaturemethod was developed which describes an equivalent body geometry interms of surface panel elements. It was shown that existingthree-dimensional panel codes like PMARC can be combinedeffectively with the modified form of the Wall Signature method.The results of this study are reported in an AIAA paper No.92-3925(Ref. 4) which was presented at the AIAA ground Testing Conference,July 1992. The preprint of this paper is enclosed in the appendixfor reference.
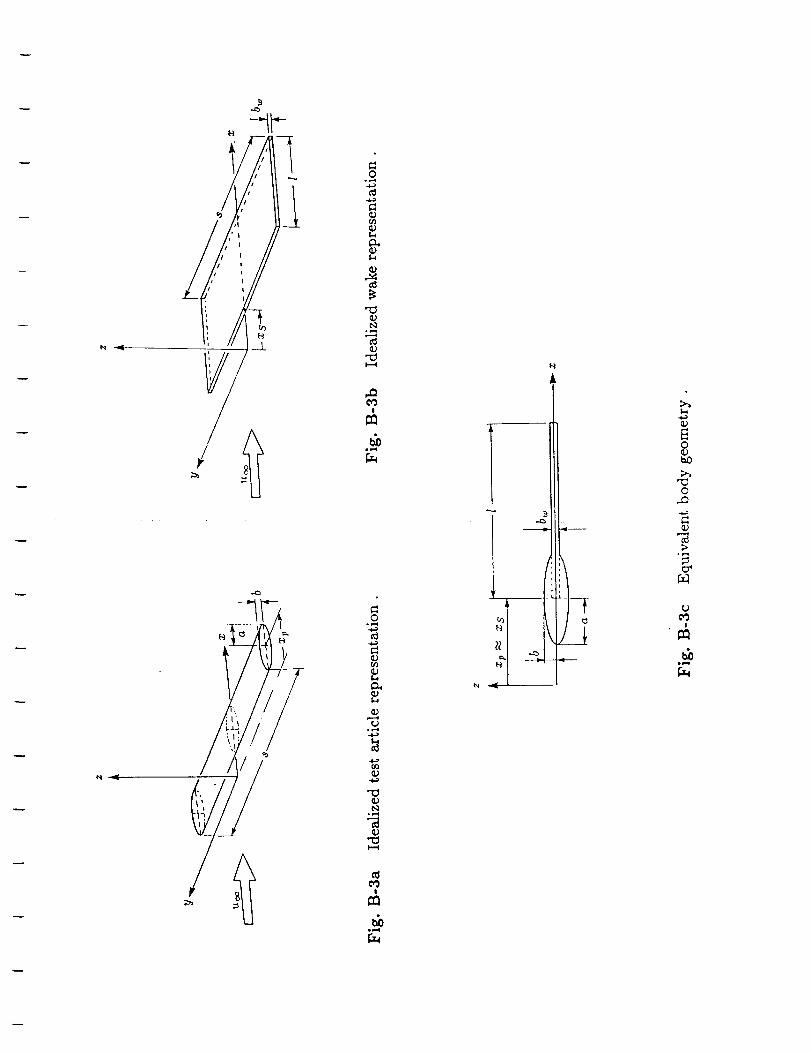
In general, the modified Wall Signature method relates wallpressure measurements similar to the typical measurements depictedin Fig. B-2 to an equivalent body shown in Fig. B-3a,b,c. Theequivalent body is then used instead of the actual test article todetermine blockage corrections.
It was demonstrated that the modified Wall Signature method can
successfully be applied to a three-dimensional wind tunnel with
rectangular cross-section (Ref.4) and to the NASA/ARC 12ft Pressure
Wind Tunnel (Ref.5). Figures B-4a, b and c show the geometry of aselected test article in the NASA/ARC 12-ft Pressure Wind Tunnel
and the corresponding description in terms of surface panel
elements.
The numerical example described in Fig. B-4a is used to demonstrate
the practical application of the modified Wall Signature method.
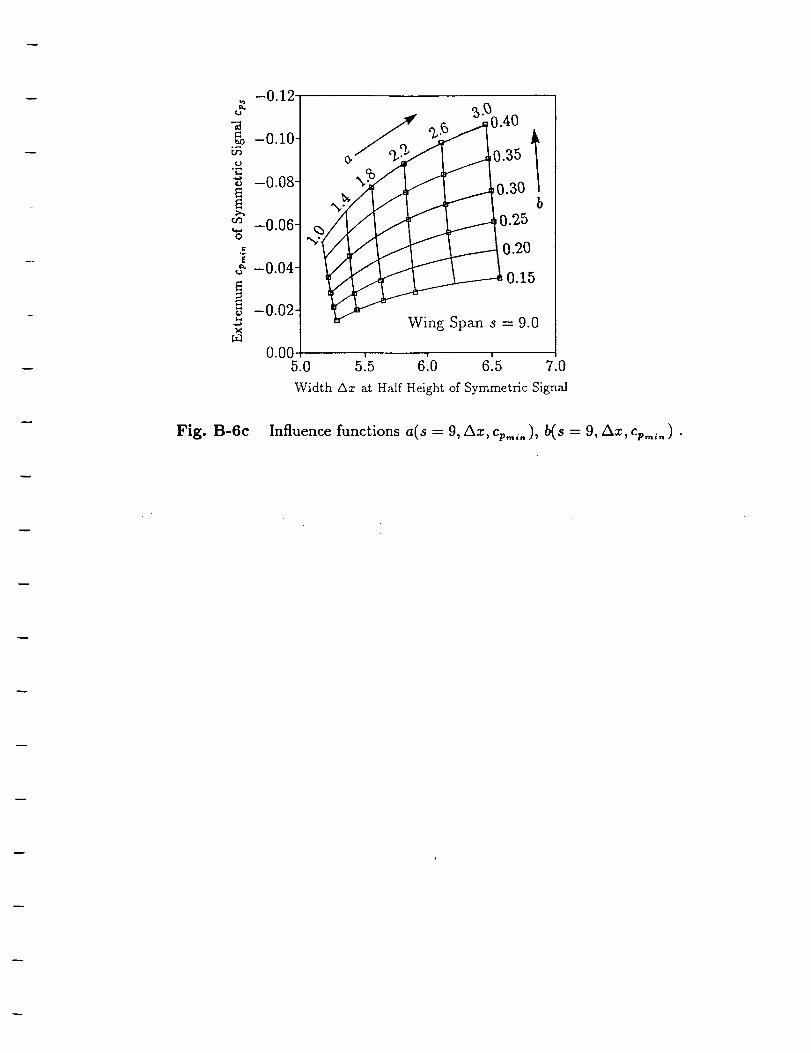
The signature analysis procedure was applied to a simulated wall
pressure signature and the representation of the wall pressure
measurement in terms of symmetric and antisymmetric part is given
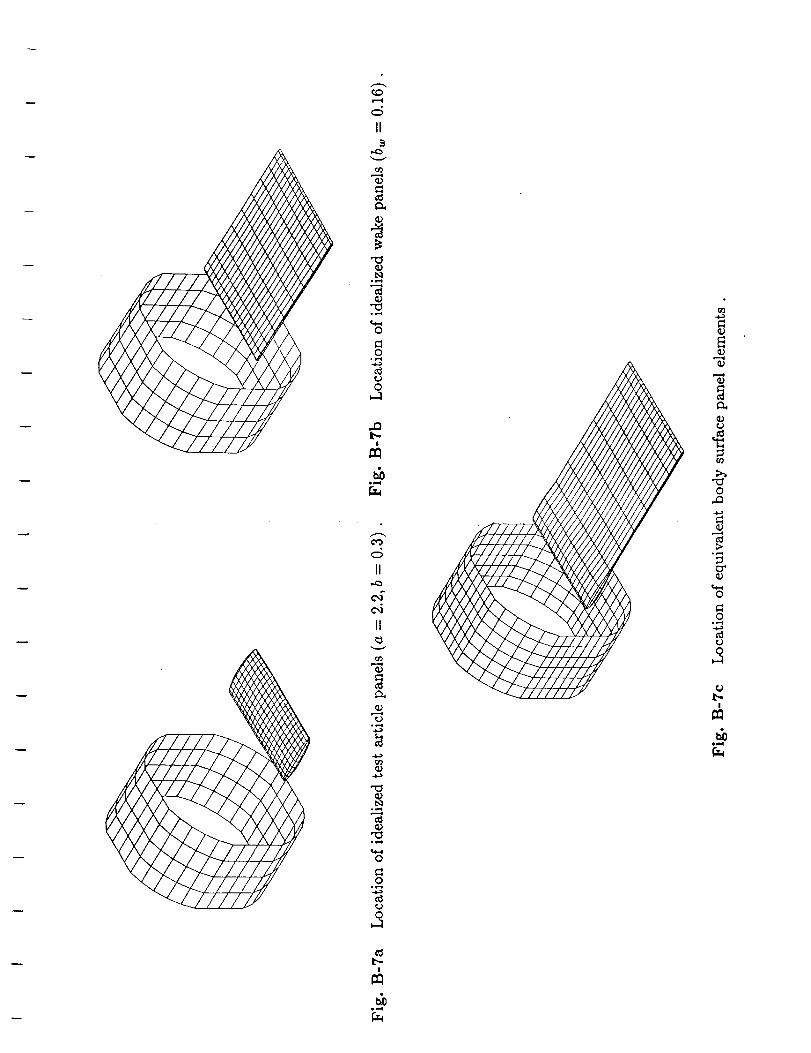
in Fig. B-5. The wall pressure measurement is related to the
equivalent body description using precalculated influence functions
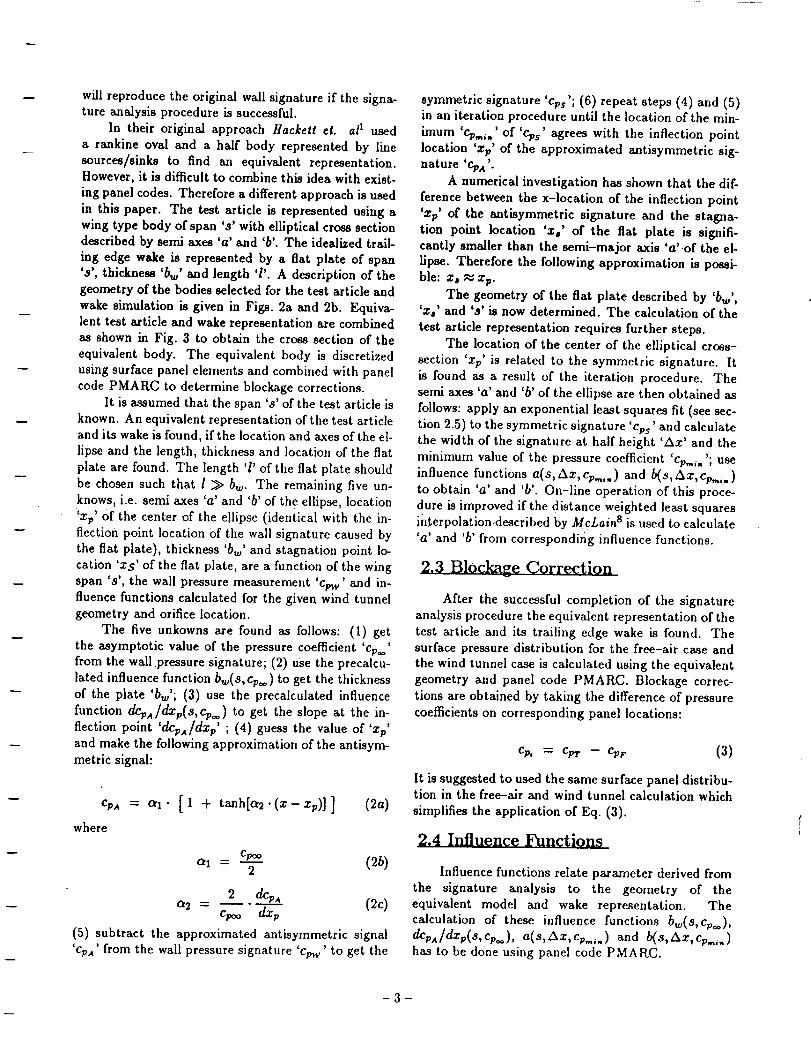
depicted in Figs. B-6a, b, and c. Equivalent representations of
test article and wake are shown in Figs. B-7a, b. These equivalent
representations are superimposed to obtain the equivalent body
geometry depicted in Fig. B-7c. The equivalent body is used to
calculate the wall pressure signature. This wall pressure
signature compares reasonably with the original signal as can be
seen in Fig. B-8a. Figure B-8b shows excellent agreement between
cross-section of test article and equivalent body
Surface pressure coefficient corrections calculated on a selected
test article surface location are compared favorably with the
reference solution in Fig. B-9a. Finally, corrected surface

pressures are compared with the free-air solution in Fig. B-9b.Corrected and free-air pressure distribution show reasonableagreement to verify the modified Wall Signature method.
An improvement of the signature analysis procedure has beendeveloped as well. It is shown that the signature analysis of thesymmetric signature can be based on a Gaussian. More details onthe application of the wall signature method to the NASA/ARC 12-ft Pressure Wind Tunnel and on the improved signature analysisprocedure can be found in Ref.5.
Future Plan:
A. The development of the lifting correction of Wall signaturemethod will continue. The verification will be based on an
solution obtained from the PMARC code.
B. The Wall Signature method with singularity representation of the
equivalent body will be improved to include pre-computed "influence
coefficients" of wall interferences for the implementation of on-
line interference calculation.
C. The investigation of effects of the model support system in the
12-ft Pressure Tunnel on tunnel wall pressure signaturemeasurements will be initiated.
References:
i. Ashby, D. L., Dudley, M. R., Iguchi, S. K., Browne, L.,
Katz, J., _Potential Flow Theory and Operation Guide for the Panel
Code PMARC,'' NASA TM 102851, NASA Ames Research Center, Moffett
Field, California, January 1991.
2. Lovely, P.K., Wigren, L., PMAPP User's Guide Release 1.0, TN89-
2000-205-100, Sterling Federal Systems, Inc., Palo Alto,
California, December 1989.
3. Hackett, J. E. et al,"A Review of the Wall Pressure Signature
and other Tunnel Constraint Correction Methods for High Angle-of-
Attacks Tests", AGARD Report No. 692, May 1980
4. Ulbrich, N., Lo, C. F. and Steinle, F. W., _Blockage Correction
in Three-Dimensional Wind Tunnel Testing Based on the Wall
Signature Method,'' AIAA 92-3925, presented at the 17th Aerospace
Ground Testing Conference, Nashville, TN, July 6-8, 1992.
5. Ulbrich, N., _Wall Interference Correction Based on Interface
Measurements in Subsonic Wind Tunnel Testing,'' Ph. D.
dissertation, The University of Tennessee, Knoxville, TN, August1992.

FIGURES

Y
Fig. A-1 Description of test article in terms of surface panel elements;
origin of coordinate system is located in fuselage tip.

Fig. A-2 Description of test article and NASA ARC 12ft PressureWind Tunnelin terms of surfacepanelelements.

.fc_
0
b_
c_
O
o_
0
0o_
c_
0
Ql--I

I
0
0
0
I
0
0
0
I
f
L
o
o
,-I
o
I
o
o
o
o
o
o
,-I
o
I
o
o
('N
o
o
o
01D
0
0
0
0
0
0
0
0
0
°_
C)d.
°_ °,-i
0 I:_
"0 0
o,I
,i _
!
<I
I !
0 0 0 0 0
0 0 0 0 0
C'3 C_I ,--I 0 i-'-I
0 0 0 0 0
I I I
d_
0
0
0
0
0
0
0
0
0
0
0
0
0
CO
0
0
h.• _ °r..i
0 I_
° _.,.I
"_ 0
_ "'"_
I1)
r_ '-_
J w,,,l
I
I
0
0
0
I
0
0
0
0
d_
0
0
0
0
0
C_
0
0
0
0
0
0
0
o
0
0
CO
0
0
',.D
0
0
0
0
0
0
0
°_
o_
C.)
0
°_
"-_ 0
¢)
I_ *_

-- Z
POSITION 1
111
8.0[ft]ll.3[ft]
t_L)
--0.100
0.000
0.i00
-i0.0
TEST
!
i =-'_t
ARTICLE
I I
I0.00.0 20.0 30.0
X
Fig. A-Ta Wall pressure coefficient distribution ; POSITION 1 ;
distance in [ft] from fuselage tip.
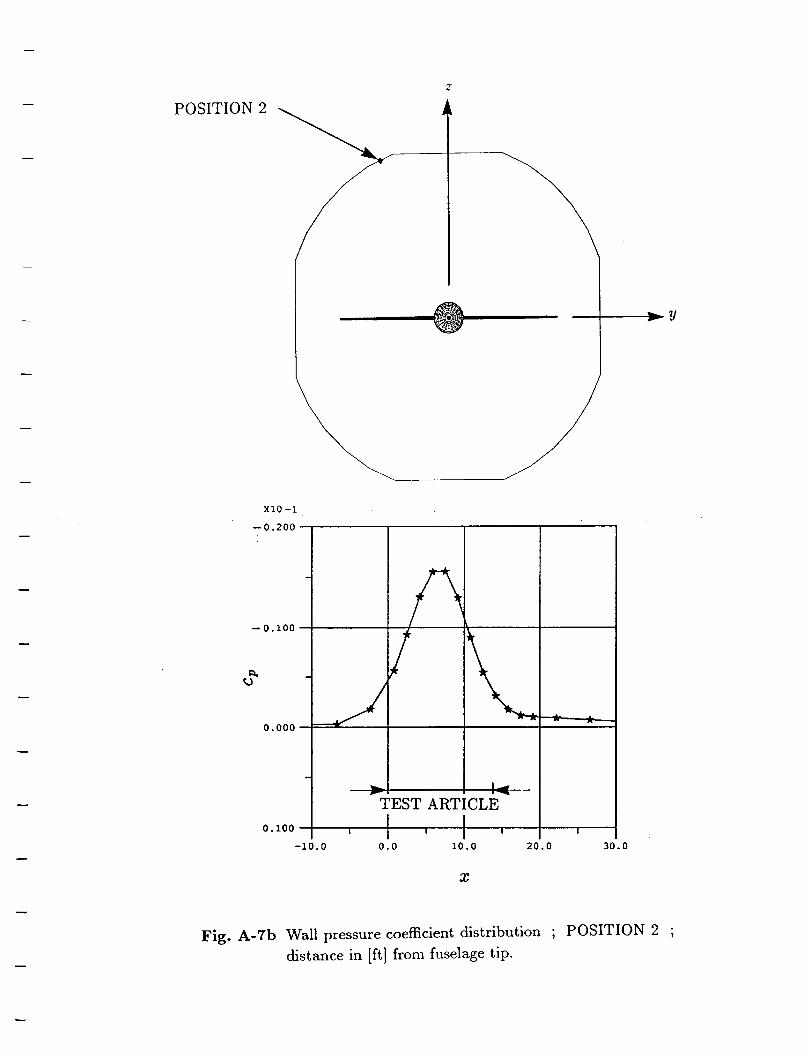
POSITION 2
XlO -I
--0.200 --
-- 0.i00
0.000
TEST ARTICLE
I I I
0.0 I0.0 20.0 30
X
v
Fig. A-Tb Wall pressure coefficient distribution
distance in [ft} from fuselage tip.
; POSITION 2 ;

POSITION 3
® yv
XIO -I
-- 0.200 -
-- 0.I00
o,
0.000
TEST
k..,
ARTICLE
! I I
--.,-.._.,__
b.O 0.0 10.0 20.0 30.0
x
Fig. A-Tc Wall pressure coefficient distribution
distance in [ft] from fuselage tip.
; POSITION 3 ;

POSITION 4
r
--0.I00 -
0.000 --
0.i00
-I{
ARTICLE
I I I
.0 0.0 I0.0
i
20 0
x
30.0
Fig. A-Td Wall pressure coefficient distribution ; POSITION 4 ;
distance in [ft] from fuselage tip.

z
POSITION 5
® _.--y
XIO -i
--0.200
--0.I00 -
0.000
0.I00
-I0,0
TEST ARTICLE
I I I
0.0 I0.0 20 0 30.0
X
Fig. A-Te Wall pressure coefficient distribution ; POSITION 5 ;
distance in [ft] from fuselage tip.

J WALL PRESSURE IMEASUREMENT
WALL
SIGNATURE
ANALYSIS
EQUIVALENT
BODY
J CORRECTED WiND TUNNEL IMEASUREMENT5
Fig. B-1 Basic elements of a Wall Signature method .
-- Cp w
i
- ,__x,,q,-_--j_t- •
xp _ m's _gNN_
Cps
v
cp
Fig. B-2 Wall pressure signature cpv¢ represented as sum of symmetric part Cps
and a:ntisymmetric part cpa .
/
.o
(p
(l,>l_
o,-4
o'3!
.o
C_
"-Go v...i
oO
o
h-.
o.c)
o_._
r_

TUNNEL BLOCKAGE _ 3.9%
Fig. B-4a Geometry of numerical example .
Fig. B-4b Location of wind tunnel wall panels .
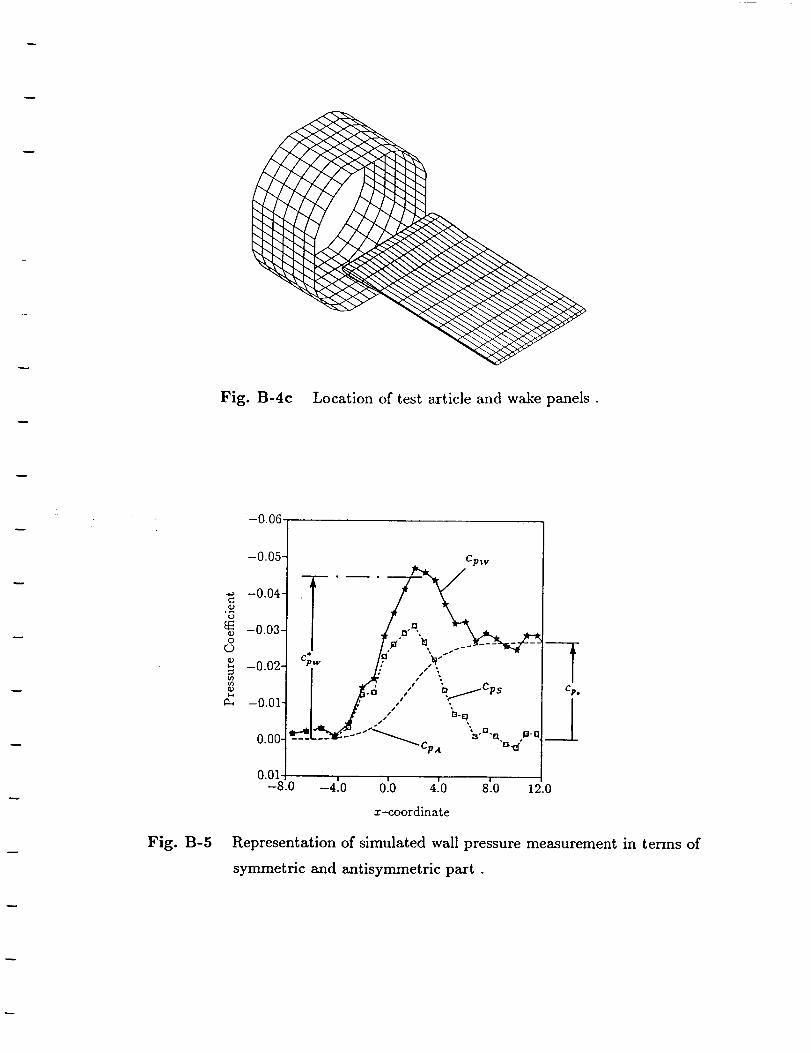
Fig. B-4c Location of test article and wake panels .
Fig. B-5
O
(D
-0.06,
-0.05 t
-0.04-
-0.03-
-0.02-
-0.01-
0.00-
0.01-8.0
Cpw
--4:0 0:0 4:0 8t0 12.0
x-coordinate
Representation of simulated wall pressure measurement in terms of
symmetric and antisymmetric part .

"O_A
la.
0.30-
0.25.
0.20-
0.15
II
& 0.10.
0.05t9
0.00-0.05
Fig. B-6a
Wing Span s = 9.0
-0[04 -0'.03 -0[02 -0.01
Asymptotic Pressure Coefficient cp.
Influence function bw(s = 9, %o) •
-0.002
Ii -0.003-
-0.004-g_
_3
-o.oo5-O
O
•:, -0.006-',9
V_
-0.007-
O
-0.008-0.05
Asymptotic Pressure Coefficient cp.
Fig. B-6b Influence function dcp,,,/dxp(s = 9, cp. ) .
_ -0.12_ __o.4o
_o.oo1 I_ ' _o._oj-°.°41
Wing Span s = 9.0
0.00/
._ -0.10-
rj_
5.o 515 6'.o 6'.5 7.oWidth Az at Half Height of Symmetric Signal
Fig. B-6c Influence functions a(s = 9, Ax, cp,,,,. ), b(s = 9, Az, %,_,. )
_o
II
c_
Q)
c_
o_-_g,--4
c_
°f--4
O
c_
O
,.Q
o
II
c_
II
Q)
¢.)o,-g
L_o,.-iI,-.-o
c_
O
.o
O
c_
!
o_,-i
_f3
g,-..,i
Q_
C_
r_
O
o,,-i
O
c_
O
uL"-
I
op,_
(.T.4

Fig. B-8a
cO
¢J
Q)
oL)
qJ
-0.06
-0.05-
-0.04-
-0.03-
-0.02-
-0.01-
0.00-
0.01
TEST ARTICLE AND WAKE
.<._ EQUIVALENT BODY
-8.0 -410 0'.0 410 8_0 12.0
x-coordinate
Comparison of simulated wall pressure measurement and wall signature
derived from corrected equivalent body geometry .
TEST ARTICLE AND WAKE
........... EQUIVALENT BODY
Fig. B-8b Comparison of test article and equivalent body geometry.

Fig. B-9a
O
¢q
c5
d
¢-O
O
¢2
¢3
O'2
0.00.
-0.01-
-0.02-
-0.03-
y = 0.225
WALL SIGNATURE METHOD
"'_UTION
-0.04o.oo o'.25 o_5o o175 _oo
z/c-coordinate
Pressure coefficient correction &,(x, 0.225, 0) on test article surface .
Fig. B-9b
-0.5
-0.4-(D
0
_9 -0.3 -
-0.2q)
_2
= -0.1.¢D
0.00.00
Uncorrected Surface Pressure Coefficient
............ Corrected Surface Pressure Coefficient
.... Free-Air Solution
y = 0.225
N
0125 0:50 055x/c-coordinate
1.00
Comparison of uncorrected and corrected surface pressure coefficient
with free-air solution ; y = 0.225.

w
APPENDIX ,

AIAA 92-3925BLOCKAGE CORRECTION IN THREE-DIMENSIONALWIND TUNNEL TESTING BASED ON THE WALL
SIGNATURE METHOD
N. Ulbrich and C.F. Lo
The University of TennesseeTullahoma, TN
Space Institute
F.W. Steinle Jr.
....NASA Ames Research
Moffett Field, CA
Center
AIAA 17th
Aerospace Ground Testing ConferenceJuly 6-8, 1992 / Nashville, TN
For permission to copy or republish, contact the American Institute of Aeronautics and Astronautics370 L'Enfant Promenade, S.W., Washington, D.C. 20024

- AIAA-92-3925
BLOCKAGE COR.RECqTON IN THR.EF__DIMENSIONAL WIND TUNNEL
TESTING BASED ON THE WALL SIGNATURE MLqT-/OD
N. Ulbrich", C. F. Ix)'" and F. W. Steinle Jr. "'"
The University of Tennessee Space Institute
Tollahoma, T(amessee 37388
AbstractCp$
An improved wall interference assessment and c_ rcorrection method for three-dimensional wind tunnel
testing is presented. Blockage corrections on the sur- cm ¢face of a test article are calculated based on a lim-
ited number of wall pressure measurements. These cpoo
measurements are combined with a signature analy- IAcp I
sis procedure and influence functions to determine an dcpA/dxpequivalent test article and wake representation. Pres-
sure coefficient corrections are calculated based on this 1
equivalent body. The signature analysis procedure is 3
modified to improve the on-line operation of the wall x
signature method. A new geometry of the equivalent xpbody is introduced which can be combined with ex- xsisting panel codes more effectively. The calculation Ax
of influence functions and the determination of pres-
sure coefficient corrections are based on a panel code. yTherefore it is possible to apply the present method to zany closed tunnel cross section. A numerical simula-
tion of the idealized flow field of a wing and its wake
in a rectangular wind tunnel is used to verify the im-
proved wall signature method. The present method
is considered to calculate blockage corrections in the
NASA/ARC 12ft Pressure Wind Tunnel.
Nomenclature
a
al _ a2 _ a3
oi°),.i°),4°)b
cpA
CpF
cp,CPmi_
=semi major axis of ellipse
=coefficients of exponential function
=initial guess of ai,a2,a3
=semi minor axis of ellipse=thickness of the wake
=antisymmetric part of the wall
pressure measurement
=pressure coefficient in free--air flow
=pressure coefficient correction=pressure coefficient minimum of
symmetric signature
* Graduate Reseaxch Assistant.
** Professor of Aerospace Engineering, Member AIAA.
*** Chief, Aerodynamic Facilities Branch NASA/ARC,Associate Fellow AIAA.
Copyright (_)1992 by the American Institute of Aeronauticsand Astronautics, Inc. All rights reserved.
=symmetric part of the wall
pressure measurement
=pressure coefficient in wind tunnelflow field
=pressure coefficient measurement onthe wind tunnel wall
=asymptotic value of Cpw=pressure coefficient error
=slope of antisymmetric signal atinflection point location
=length of flat plate
=wing span
=x-coordinate (streamwise direction)=inflection point location; peak location
=stagnation point location (fiat plate)
=width at half height of the symmetricwall signature
=y-coordinate (spanwise direction)=z-coordinate
1. Introduction
Wall interference prediction in three-dimensional
wind tunnel testing based on the wall signature
method was investigated in the past. Basic assump-
tions and elements of this method are described byHackett et al. 1 and Allmaras 2. Lo and Ulbrich 3 calcu-
lated blockage corrections in a two-dimensional sub-
sonic flow field using the wall signature method andavailable experimental data 4. Results of this calcula-
tion compared favorably to results obtained by apply-ing an analytic two-interface method s .
An improved version of the wall signature method
is presented in this paper. This version is considered to
calculate blockage corrections due to wall interference
in the NASA/ARC 12ft Pressure Wind Tunnel which
has a quasi--octagonal cross-section. Only a limitednumber of wall pressure measurements is used to de-
termine blockage corrections.
At first, basic elements of the wall signature
method are presented. Wall pressure measurements
are combined with a signature analysis procedureand precalculated influence functions to determine an
equivalent representation of the test article and its ide-
alized wake. The equivalent representation is used to

calculate pressure coefficient corrections due to model
blockage.The calculation of influence functions and block-
age corrections is based on a three-dimensional panelcode. It is demonstrated how the improved wall sig-
nature method can be combined more effectively with
existing panel codes like PMARC 6.
A numerical verification of the improved wall sig-
nature method is given. The flow field of a wing and its
idealized wake inside a closed rectangular wind tunnel
is simulated using panel code PMARC. Wall pressurecoefficients on a limited number of wall locations are
calculated and combined with a set of randomly gener-
ated disturbances. The perturbed wall pressure coeffi-
cients are considered as simulated wall pressure mea-
surements era,. These simulated wall pressure mea-surements are used in combination with the wall sig-
nature method to calculate blockage corrections. A
reference solution of the blockage problem is calcu-
lated as well. The reference solution is compared to
blockage corrections obtained from the wall signature
method to verify results.
Finally, necessary changes are described if the im-
proved wall signature method is to be applied to the
NASA/ARC 12ft Pressure Wind Tunnel.
2. Wall Signature Method
2.1GeneralRemarks
The wall signature method described by Hackeltet al. 1 consists of two major parts: the signature anal-
ysis procedure which calculates an equivalent repre-
sentation of the test article and its wake; the determi-
nation of blockage corrections based on this equivalent
body. Hackett et al. 1 used line sources and sinks to de-
scribe an equivalent body. llowever, it is difficult touse the idea of line sources and sinks in combination
with panel codes. A different approach is selected in
this paper: an equivalent body is described in terms
of surface panel elements instead of line sources/sinks.
The signature analysis procedure uses wall pres-
sure measurements in combination with precalculated
influence functions to determine an equivalent body.
Influence functions relate geometric parameter of
the equivalent model representation to parameter de-
rived from the wall signature analysis. They depend
on the type of tunnel cross-section, the location of the
wall pressure measurements and on the class of equiv-
alent body representing the test article and its wake.
The present method uses panel code PMARC to ob-tain these influence functions.
Blockage corrections are calculated using the
equivalent test article and wake geometry derived from
the signature analysis procedure. Panel code PMARCcalculates surface pressures on the equivalent body inthe free--air flow field and in the wind tunnel flow field.
A blockage correction is found by taking the difference
of pressure coefficients on corresponding surface loca-tions.
It was demonstrated by Hacket_ e_ alfl that block-
age corrections can be calculated with sufficient accu-
racy if the equivalent body is used instead of the actual
test article and wake geometry.
The pressure coefficients on the selected wall lo-
cations can be calculated as well. A comparison of
calculated and measured pressure coefficients on the
tunnel wall can be used to check the quality of the
equivalent body.
Figure 1 gives details on the improved wall signa-ture method.
2.2 Simaature Analysis
The signature analysis procedure presented in this
paper is developed to correct for test article and wake
blockage of'a rectangular wing in three-dimensional
incompressible wind tunnel testing. Basic elements of
the signature analysis remain the same if a different
class of test article (e.g. body of revolution, swept
wing, etc.) or a different wind tunnel cross--section isconsidered.
The signature analysis procedure works as fol-
lows: During a wind tunnel experiment of a rectan-
gular wing of wing span 's' wall pressure coefficients
'Cpw' on a single row of pressure orifices are recorded.
The asymptotic value 'cpo o ' of the wall pressure mea-surements is determined numerically.
The signature analysis procedure uses the mea-
sured wall pressure signature 'Cpw' and its asymptoticvalue 'cp_' to determine an equivalent representationof the test article and its idealized wake. The total
wall signature 'crm,' is split into a symmetric and an-tisymmetric part:
cpw "- cpA + Cps (1)
The signature splitting requires an iteration procedure
which is terminated as soon as the x-location 'xp' of
the minimum of the symmetric signature '%s' agrees
with the location of the inflection point 'xp' of the
antisymmetric signature '%A"
The equivalent geometric representation of the
test article is derived from the symmetric signature;the representation of the wake is derived from the an-
tisymmetric signature. The wall pressure signaturecaused by this representation of test article and wake
will reproduce the original wall signature if the signa-ture analysis procedure is successful.
In their original approach Hackett et. al x used
a rankine oval and a half body represented by line
sources/sinks to find an equivalent representation.
However, it is diffficuit to combine this idea with exist-
ing panel codes. Therefore a different approach is used
in this paper. The test article is represented using a
wing type body of span 's' with elliptical cross section
described by semi axes 'a' and 'b'. The idealized trail-
ing edge wake is represented by a flat plate of span
'8', thickness 'bu,' and length 'I'. A description of the
geometry of the bodies selected for the test article and
wake simulation is given in Figs. 2a and 2b. Equiva-lent test article and wake representation are combined
as shown in Fig. 3 to obtain the cross section of the
equivalent body. The equivalent body is discretized
using surface panel elements and combined with panel
code PMAB.C to determine blockage corrections.
It is assumed that the span 's' of the test article is
known. An equivalent representation of the test article
and its wake is found, if the location and axes of the el-
lipse and the length, thickness and location of the flat
plate are found. The length 'l' of the flat plate should
be chosen such that 1 >> bw. The remaining five un-
knows, i.e. semi axes 'a' and 'b' of th e ellipse, location
'xp' of the center of the ellipse (identical with the in-
flection point location Of the wall signature caused by
the flat plate), thickness 'bw' and stagnation point lo-
cation 'xs' of the flat plate, are a function of the wing
span 's', the wall pressure measurement 'cr,W' and in-
fluence functions calculated for the given wind tunnel
geometry and orifice location.
The five unkowns are found as follows: (1) get
the asymptotic value of the pressure coefficient 'cp..'
from the wall.pressure signature; (2) use the precalcu-
lated influence function b,_(s,%..) to get the thickness
of the plate 'bw'; (3) use the precalculated influence
function dcpA/dxp(S, cpoo) to get the slope at the in-
flection point 'dcpA/dx p' ; (4) guess the value of 'xp'
and make the following approximation of the antisym-
metric signal:
cpA = al" [1 + tanh[a2.(x-xp)]]
where
(2a)
Cpooor1 = _ (2b)
2
2 d.cpAas = _" (2c)
(5) subtract the approximated antisymmetric signal
'CpA' from the wall pressure signature 'Cpw' to get the
symmetric signature 'Cps'; (6) repeat steps (4) and (5)in an iteration procedure until the location of the min-
imum '%.., ' of '%s' agrees with the inflection point
location 'x_,' of the approximated antisymmetric sig-
nature 'e_a'.
A numerical investigation has shown that the dif-
ference between the x-location of the inflection point
'zp' of the antisymmetric signature and the stagna-
tion point location 'z,' of the flat plate is signifi-cantly smaller than the semi-major axis 'a',of the el-
lipse. Therefore the following approximation is possi-
ble: x, _, xp.
The geometry of the flat plate described by 'bu,',
'x,' and '_' is now determined. The calculation of the
test article representation requires further steps.
The location of the center of the elliptical cross-
section 'xp' is related to the symmetric signature. Itis found as a result of the iteration procedure. The
semi axes 'a' and 'b' of the ellipse are then obtained as
follows: apply an exponential least squares fit (see sec-
tion 2.5) to the symmetric signature 'cps' and calculate
the width of the signature at half height 'Ax' and the
minimum value of the pressure coefficient 'cp,,,,'; use
influence functions a(s, Ax, cp,_,.) and b(s, Ax, cp,_,.)to obtain 'a' and 'b'. On-line operation of this proce-
dure is improved if the distance weighted least squares
interpolation.described by McLain 8 is used to calculate
'a' and 'b' from corresponding influence functions.
2.3 Blockage Correction
After the successful completion of the signature
analysis procedure the equivalent representation of the
test article and its trailing edge wake is found. The
surface pressure distribution for the free-air case and
the wind tunnel case is calculated using the equivalent
geometry and panel code PMARC. Blockage correc-
tions are obtained by taking the difference of pressure
coefficients on corresponding panel locations:
cp, = c_ - cp_ (3)
It is suggested to used the same surface panel distribu-tion in the free-air and wind tunnel calculation which
simplifies the application of Eq. (3).
2.4 Influence Functions
Influence functions relate parameter derived from
the signature analysis to the geometry of the
equivalent model and wake representation. The
calculation of these influence functions bw(s, cpo.) ,
d%Jdxp(s, cpoo), a(s, Ax, cpm,.) and b(.s, Ax, cp..,.)
has to be done using panel code PMARC.

The functions b_(s,%oo ) and dcva/dxp(cvoo) areobtained as follows: (1) select a set of reasonable val-
ues of 'b_,' for the selected wing span 's'; (2) use
PMARC to calculate the discrete wall signature on the
selected wall location where pressure measurements
will be taken; (3) use the formula for the difference up-proximation of the second derivative to determine the
inflection point location (it is suggested to use the for-
mula derived for unequal grid spacing given by Smith 7
as the distance between chosen wall panels is not nec-
essarily constant); (4) find the x-location of the inflec-
tion point by linear interpolation (second derivative
has to be equal to zero); (5) find the inflection point
slope 'd%A/dzp' using linear interpolation of the two
closest points; (6) find the minimum of the calculated
pressure coefficient and consider it as the asymptotic
pressure coefficient 'cpo o'.
The calculation of the functions a(s, Ax,%_,.)and b(s, Ax,%,_,.) is done in a similar fusion: (1) se-
lect a set of reasonable semi major and semi minor
axes 'a' and 'b'; (2) calculate the wall pressure disti-
bution on the selected wall panel locations using panelcode PMARC; (3) derive the values of width at half
height 'Ax' and minimum value of these precalculated
wall signatures 'cp..,.' numerically.
2.5 Exponential LeastSquares Fit
The values of width at half height 'Ax' and the
minimum value of the symmetric signature 'cp.,.' haveto be calculated using a least squares approach. In
their original publication Hackelt et al. 1 suggested to
fit a parabola in the vicinity of the minimum of the
symmetric signature. This, however, requires some
additional qualitative check of the user to make sure
that the least squares fit is reasonable. The calculated
parabolic_least squares fit is not unique.
A different least squares fit is suggested in this
paper to avoid the problem of non-uniqueness and to
improve the on-line operation of the signature anal-ysis procedure. The symmetric signature is fitted asfollows:
Cps = al'exp [--a2-(x--a3) 2] (4)
The function will fit the symmetric signature in the
neighborhood of the minimum 'cl,.,_. '.The least squares problem leads to a set of three
nonlinear equations which can be solved numerically if
Newton's Method is applied. A concise description ofthis method can be found in Burden and Faires 9. Sev-
eral different checks have shown that Newton's Method
can only successfully be applied to this set of nonlinear
equations if a reasonable initial guess is made. There-
fore the following initial guess of values ,_0),, ,_0),
and '4 °)' is suggested: consider the smallest value of
the symmetric signature 'Cps' as initial guess of 'a_°)';consider the x-location of the smallest value of the
symmetric signature 'Cps' as initial guess of ,_0),; find
an initial guess of 'a_ °)' based on the related logarith-
mic least squares problem 9.
After the successful completion of the iteration
the peak location 'zp', the minimum value of the the
symmetric signature 'c._in' and the width of the sym-metric signature at half height 'Az' are calculated asfollows:
zp = a3 (Sa)
cp.,. = al (5b)
= 2. v 2/a2 (5c)Different checks were applied to show that the ex-
ponential least squares fit can be used as a part ofthe signatdre analysis procedure. It could be shown
that the calculation of'zp', 'cp_,' and 'Az' hardly de-pends on the selected interval where discrete measure-
ments are considered. Therefore the exponential least
squares fit is .better than the parabolic least squaresfit.
3. Numerical Verification
The verification of the improved version of the
wall signature method requires a numerical simulationof a three-dimensional wind tunnel flow field as no
experimental data were available for the present study.
The flow field of a wing with NACA 0012 airfoil section
and a trailing edge wake in a rectangular wind tunnel
is simulated. The selected geometry is given in Fig. 4.Tunnel blockage is 4.5% for the selected test article
and wind tunnel geometry.
In a first step panel code PMARG was used to
determine surface pressures in the free-air and wind
tunnel flow field using the original test article and
trailing edge wake geometry. The reference solution
of the blockage problem was obtained by taking thedifference of the surface pressure coefficients on corre-
sponding panels (see Eq. (3)). This reference solution
will be used to check the result of the improved wall
signature method. The reference solution of the pres-sure coefficient correction on the surface of the test
article at a distance of y = 0.075 from the tunnel cen-
terline is given as the solid line in Fig. 7a.
In a second step wall pressure coefficients on cho-
sen wall locations are calculated using panel code
-4-

PMARC. The wall locations are shown in Fig. 4. The
ideal wall pressure signature is perturbed by adding
random disturbances of amplitude IAc_l - 0.005. This
assumption is based on an experimental investigation 4.
Figure 6a shows the perturbed simulated wall pres-
sure measurement 'crw'. This perturbed wall pressure
signature will be used in combination with the wall
pressure signature method to determine blockage cor-rections.
In the next step the wall pressure signature
method is applied to the simulated wall pressure mea-
surement given in Fig. 6a. The signal is split into a
symmetric and antisymmetric part and the equivalentmodel representation is calculated based on procedures
described in the previous sections. Figure 6a gives theresult of the signature analysis procedure after the suc-
cessful completion of the iteration. Figure 6b compares
the exponential least squares fit of the symmetric sig-
nature to the measured signature.
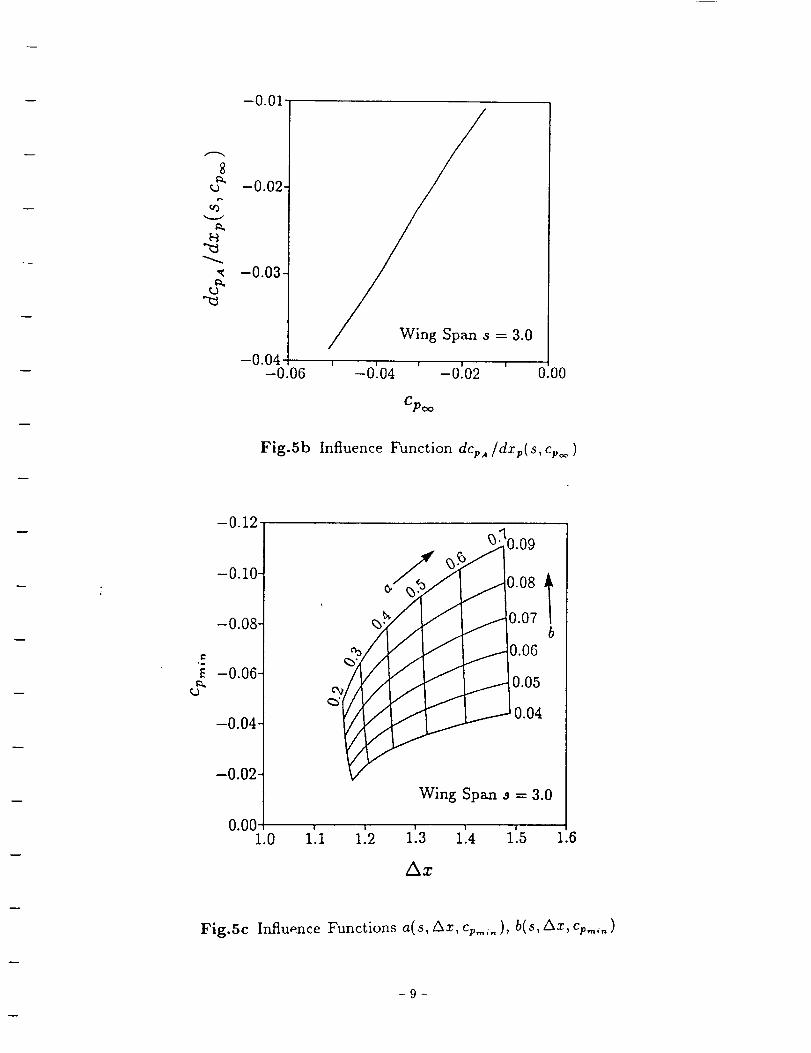
Required influence functions were calculated for
the specific wall pressure orifice location and wind tun-
nel cross-section. These charts are given in Figs. 5a,
5b and 5c . Figure 6c compares the test article with
its equivalent geometric representation after comple-
tion of the signature analysis procedure. Test article
and calculated equivalent representation show reason-
able agreement.:
In the last step blockage corrections 'c w' are cal-
culated as desribed in section 2.3. Figure 7a shows
results of this calculation and compares them to the
reference solution of the blockage problem. The agree-
ment between reference solution (solid line) and the so-
lution derived from the wall signature method (dashed
line) is excellent which verifies the improvements.
The wall pressure signature based on the equiva-
lent body are calculated as well. A comparison of this
signature (dashed line) with the original simulated wall
pressure measurement (solid line) is given in Fig. 7b.
Both signals are in excellent agreement.
Panel code PMARC calculates velocities on pan-
els using a numerical iteration technique. Therefore it
is necessary to select the panel location on the test ar-
ticle, wake model and tunnel wall such that the panel
code will converge for a variety of geometries. All cal-culations of the numerical example were done with a
total number of panels in the order of 1000.
4. Col_clusion and Remarks
An improved version of a wall signature method
to determine surface pressure corrections on the sur-
face of a test article is presented. The method can beused in three-dimensional wind tunnel testing. It re-
quires the measurement of wall pressure coefficients on
a limited number of wall locations. These wall pressure
measurements are combined with a signature analysis
procedure to determine an equivalent representation
of the test article and its wake. Blockage corrections
are calculated based on the equivalent body.
Significant improvements of the signature analysis
procedure are introduced to make the present method
more efficient in on-line operation. It is also demon-
strated that the present method can he combined
with existing three-dimensional panel codes more ef-
fectively if an equivalent body is described in terms of
surface panel elements.
The improved wall signature method is verified by
using a. numerical simulation of a wing and its trail-
ing edge wake in a rectangular wind tunnel. Calcu-
lated blockage corrections show excellent agreementwith the reference solution.
A few modifications will be required to apply
the present method to the NASA/ARC 12ft PressureWind Tunnel. Influence functions will have to be cal-
culated based on the quasi-octagonal cross-section of
the tunnel and selected pressure orifice locations. This
will require only a change in the panel code input file
which describes the internal flow geometry.
In the future it will be necessary to apply the
present method to existing experimental data to gainconfidence in the method.
Acknowledgementv
This work was supported by NASA Ames Re-
search Center under grant NAG 2-733 with technicalmonitor Dr. F. W. Steinle.
lllackett, J. E., Wilsden, D. J. and Lilley, D. E. , "Es-
timation of Tunnel Blockage from Wall Pressure Sig-
natures: a Review and Data Correlation", NASA CR-
152241, Lockheed-Georgia Company, Marietta, Geor-
gia, March 1979.
2Allmaras, S. R. , "On Blockage Corrections for
Two-Dimensional Wind Tunnel Tests using the Wall-
Pressure Signature Method", NASA TM 86759, March1986.
3Lo, C. F. and Ulbrich, N., "Experimental Results ona Wall Interference Correction Method with Interface
Measurements", AIAA 92-0570, presented at the 30th
Aerospace Sciences Meeting, January 6-9, 1992/Reno,Nevada.
4Green, L., Zhang, Q., Garriz, J., Wang, S., Vatsa, V.,

Haigler, K., Newman, P., "NASA/CAE Wind Tunnel
Interference Cooperative Program - Status and Sample
Results", ICAW 1991 Paper-W1, NASA Langley Re-
search Center, Nanjing Aeronautical Institute, Harbin
Aerodynamic Research Institute, Vigyan, Inc., June1991.
SLo, C. F., "Tunnel Interference Assessment from
Measurements on Two Interfaces', AIAA Jowrnal,
Vol.28, No.8, August 1990, pp. 1481-1484.
SAshby, D. L., Dudley, M. R., lguchi, S. K.,
Browne, L., Katz, J., "Potential Flow Theory and Op-
eration Guide for the Panel Code PMARC", NASA
TM 102851, NASA Ames Research Center, Moffett
Field, California, January 1991.
7Smith, G. D., "Numerical Solutions of Partial Differ-
ential Equations _, Oxford University Press, London,
New York, Toronto, 1965, p.139 .
SMcLain, D. H., "Drawing Contours from Arbitrary
Data Points _, Tbe Compwter Jowrnal, Vo1.17, No.4,
November 1974, pp.318-320.
SBurden, P_ L. and Faires, J. D., "Numerical AnAly-
sis _, 3rd ed., PWS-Kent Publishing Company, Boston,
1985, p.368 and pp.496-499.
WIND TUNNEL TEST
SIGNATURE ANALYSIS
z
CALCULATED WALL
PRESSURE SIGNATURE
_'l "'
/:i
z
EQUI VALENT BODY
BLOCKAGE
CORRECTION
INFLUENCE i
FUNCTIONS I
Fig.1 Basic Elements of a Wall Signature Method
-6-
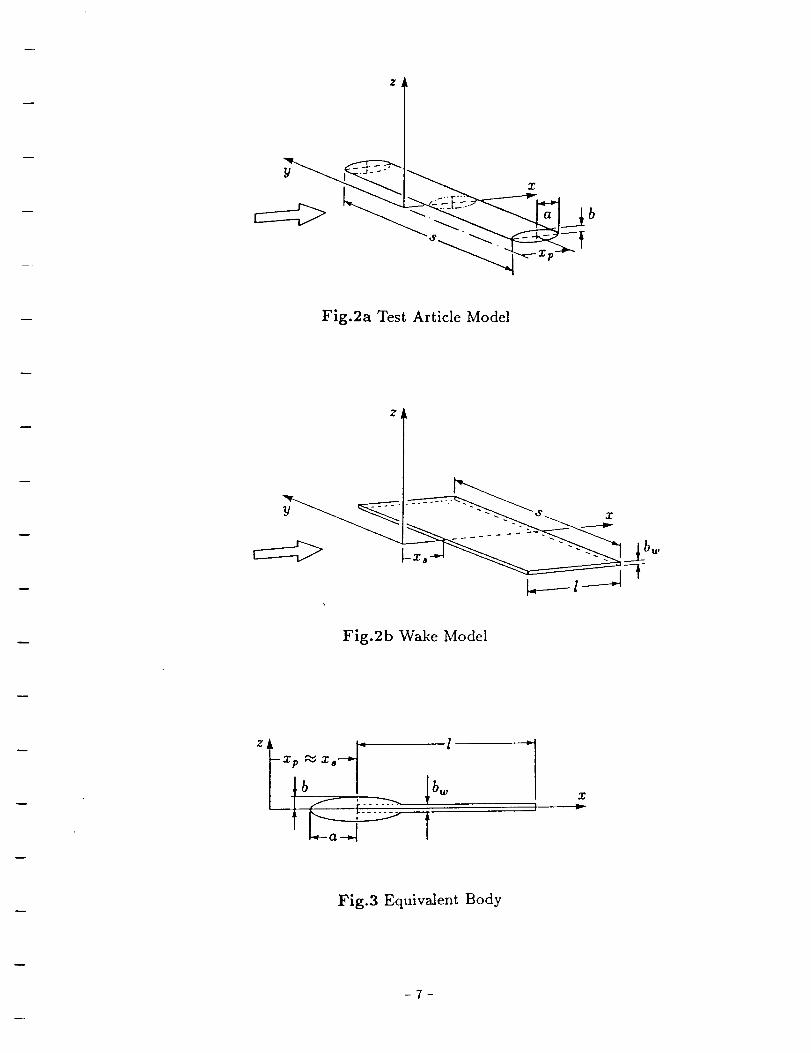
Fig.2a Test Article Model
Fig.2b Wake Model
Xp ,._ X s
Lo_ tX
Fig.3 Equivalent Body

l2
Y
,Wall Pressure Measurement
X
0.04
Fig.4 Geometry of Numerical Example
0.08
0.06-
g
Z.)
0.04-
0.02-
Wing Span s = 3.0
0.00
Fig.5a Influence Function b,,,( s, ci, _ )
8
_O
tJ
-0.01
-0.02-
-0.03
Fig.Sb
=3.0
-o:o4 ' -o:o2 ' o.oo
Cp_o
Influence Function d%A /dxp( s, %0o )
e.o.
L)
-0.12
-0.10-
-0.08-
-0.06-
-0.04-
1%
/ //%
/ / ../f
/ /
/
/
/
/
/ D.07 Ib
/0.06/
0.05/ /
/ _i/'0.04
J
Wing Span s = 3.0
0.0(]'51.0 i'.i112 i'.3i'.4I. 1.6
Az
Fig.5c Influence Functions a( s, Az, %,,,,. ), b(s, Ax, %=,, )

Q9
_9
if)O
(.9_D$--4
o9o9Q)
-0.06
-0.05-
-0.04-
-0.03-
-0.02-
-0.01-
0.00-
0.01-2.0 -1'.o o:o 1'.o 2'.0
X
Fig.6a Signature Analysis
3.0
"U
CDO
Q)
o9o9cD
-0.06
-O.O5
-O.O4
-0.03
-0.02-
-0.01-
0.00-
0.01--2.0
Exponential
Least Squares Fit
l ',\
/ ,
--I.0 0.0 1.0 2.0 3.0
X
Fig.6b Exponential Least Squares Fit
.......... P--
Fig.6c Comparison Test Article / Equivalent Body
-10-

°_
0.00
¢0
-0.01-
-0.02-
-0.03-
_ Reference Solution
...... Wall Signature Method
y = 0.075
-0.04 o.o 0:2 0:4 o'.6 o'.s 1.oX
Fig.7a Pressure Coefficient Correction cp_
-0.06
t3
-0.05-
-0.04- "
--0.03- Equivalent
-0.02- __-0.01-
0,00- _ % XTest Article and Wake
0.01-zo -1'.o o'.o £o 2:o _.oX
Fig.7b Wall Pressure Coefficient Comparison
-11-