a water resources system planning model for state water...
TRANSCRIPT

Prepared byDepartment of Water ResourcesThe California Natural Resources AgencyState of Califonia
In Association withU.S.Department of the InteriorBureau of ReclamationMid-Pacific Region
CalSim 3.0 Draft ReportDecember 2017
A Water Resources System Planning Model For State Water Project (SWP) & Central Valley Project (CVP)


State of California Edmund G. Brown Jr., Governor
Natural Resources Agency John Laird, Secretary for Resources
Department of Water Resources Grant Davis, Director
Cindy Messer Chief Deputy Director
Kasey Schimke Asst. Director
Legislative Affairs
Erin Mellon Asst. Director
Public Affairs Office
Spencer Kenner Chief Counsel
Eric Koch Acting Deputy Director
Integrated Water Management
Christy Jones Deputy Director Statewide
Emergency Preparedness and Security
Kathie Kishaba Deputy Director
Business Operations
Jesse Cason Acting Deputy Director
California Energy Resources Scheduling
Joel Ledesma Deputy Director
State Water Project
Taryn Ravazzini Deputy Director Special
Initiatives
Bay-Delta Office Francis Chung, Chief
Modeling Support Branch Tara Smith, Chief
Central Valley Modeling Section Erik Reyes, Chief
This report was prepared under the supervision of Hongbing Yin, Program Manager
Core Project Team Members:
DWR: Zhiqiang (Richard) Chen, Emin (Can) Dogrul, Todd Hillaire, Mei (Idy) Lui,
Erik Reyes, Jianzhong (Jay) Wang, Hongbing Yin, Liheng Zhong
USBR: Jim Cornwell and Nancy Parker Stantec: Andy Draper


Acknowledgements We appreciate and thank many individuals that have contributed to the development of CalSim 3.0 since its conception in 2005. This development is primarily the result of collaboration between the California Department of Water Resources (DWR) and the U.S. Department of the Interior, Bureau of Reclamation, Mid-Pacific Region (Reclamation), and collaboration within DWR between the Bay-Delta Office and the Division of Statewide Integrated Water Management. In addition to the staff from both agencies, we also acknowledge and thank the various water agencies and consultants that provided data and assisted in the development of the model. A special thank you goes out to our Bay-Delta Office Chief, Francis Chung and Sushil Arora, former Chief of the Water Resources System Modeling Section of the Bay-Delta Office; without their guidance and energy, this model would never have been completed.


This page left blank intentionally.

i DRAFT – December 2017
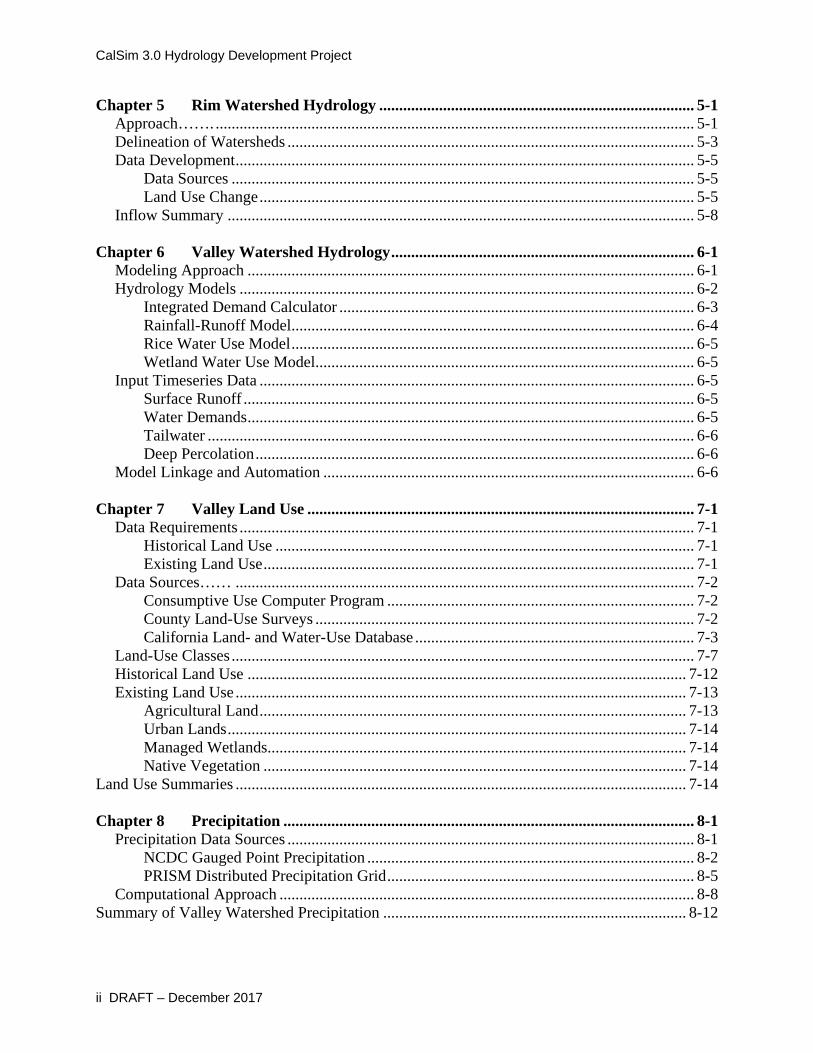
Contents Chapter 1 Introduction ........................................................................................................ 1-1
Background…. ........................................................................................................................ 1-1 CalSim Development .............................................................................................................. 1-2
Benchmark Studies .......................................................................................................... 1-2 Operations Criteria and Plan ............................................................................................ 1-2 San Joaquin Valley Hydrology Enhancement ................................................................. 1-2 CALFED Common Assumptions .................................................................................... 1-3 California Central Valley Simulation Model ................................................................... 1-3 CALFED Science Peer Review ....................................................................................... 1-3
Project Objectives ................................................................................................................... 1-4 Organization of Report ............................................................................................................ 1-5
Chapter 2 Water Budget Areas .......................................................................................... 2-1 Background….. ....................................................................................................................... 2-1 Model Spatial Refinement ...................................................................................................... 2-4 Delineation of Water Budget Areas ........................................................................................ 2-5 Water Budget Area Numbering and Description .................................................................... 2-7
Chapter 3 Demand Units ..................................................................................................... 3-1 Definition………………… .................................................................................................... 3-1 Naming Convention ................................................................................................................ 3-2
Demand Units Located in Water Budget Areas ............................................................... 3-2 Demand Units Located in Rim Watersheds and Export Areas ........................................ 3-3
Agricultural Demand Units ..................................................................................................... 3-3 Definition ......................................................................................................................... 3-3 Data Sources .................................................................................................................... 3-3 Agricultural Demand Units in Sacramento River Hydrologic Region ............................ 3-4
Urban Demand Units ............................................................................................................ 3-13 Definition ....................................................................................................................... 3-13 Data Sources .................................................................................................................. 3-15 Urban Demand Units in Sacramento River Hydrologic Region .................................... 3-16
Wetland Demand Units ......................................................................................................... 3-26 Background .................................................................................................................... 3-26 Data Sources .................................................................................................................. 3-28 Wetland Demand Units in the Sacramento River Hydrologic Region .......................... 3-28
Water Purveyor and Demand Unit Boundaries ..................................................................... 3-31 Chapter 4 Network Schematic ............................................................................................ 4-1
Nomenclature and Symbology Conventions ........................................................................... 4-1 Naming and Style Conventions ....................................................................................... 4-4
CalSim User Interface ............................................................................................................. 4-9 CalSim Georeferenced Schematic ............................................................................................... 4-9
CalSim 3.0 Hydrology Development Project
ii DRAFT – December 2017
Chapter 5 Rim Watershed Hydrology ............................................................................... 5-1 Approach……. ........................................................................................................................ 5-1 Delineation of Watersheds ...................................................................................................... 5-3 Data Development ................................................................................................................... 5-5
Data Sources .................................................................................................................... 5-5 Land Use Change ............................................................................................................. 5-5
Inflow Summary ..................................................................................................................... 5-8 Chapter 6 Valley Watershed Hydrology ............................................................................ 6-1
Modeling Approach ................................................................................................................ 6-1 Hydrology Models .................................................................................................................. 6-2
Integrated Demand Calculator ......................................................................................... 6-3 Rainfall-Runoff Model ..................................................................................................... 6-4 Rice Water Use Model ..................................................................................................... 6-5 Wetland Water Use Model ............................................................................................... 6-5
Input Timeseries Data ............................................................................................................. 6-5 Surface Runoff ................................................................................................................. 6-5 Water Demands ................................................................................................................ 6-5 Tailwater .......................................................................................................................... 6-6 Deep Percolation .............................................................................................................. 6-6
Model Linkage and Automation ............................................................................................. 6-6 Chapter 7 Valley Land Use ................................................................................................. 7-1
Data Requirements .................................................................................................................. 7-1 Historical Land Use ......................................................................................................... 7-1 Existing Land Use ............................................................................................................ 7-1
Data Sources…… ................................................................................................................... 7-2 Consumptive Use Computer Program ............................................................................. 7-2 County Land-Use Surveys ............................................................................................... 7-2 California Land- and Water-Use Database ...................................................................... 7-3
Land-Use Classes .................................................................................................................... 7-7 Historical Land Use .............................................................................................................. 7-12 Existing Land Use ................................................................................................................. 7-13
Agricultural Land ........................................................................................................... 7-13 Urban Lands ................................................................................................................... 7-14 Managed Wetlands ......................................................................................................... 7-14 Native Vegetation .......................................................................................................... 7-14
Land Use Summaries ................................................................................................................. 7-14 Chapter 8 Precipitation ....................................................................................................... 8-1
Precipitation Data Sources ...................................................................................................... 8-1 NCDC Gauged Point Precipitation .................................................................................. 8-2 PRISM Distributed Precipitation Grid ............................................................................. 8-5
Computational Approach ........................................................................................................ 8-8 Summary of Valley Watershed Precipitation ............................................................................ 8-12

Contents
iii DRAFT – December 2017
Chapter 9 Evaporation ........................................................................................................ 9-1 Theoretical Background .......................................................................................................... 9-1
Standardized Evaporation Rates ...................................................................................... 9-1 Crop Evapotranspiration Under Standard Conditions ..................................................... 9-2 Crop Evapotranspiration under Nonstandard Conditions ................................................ 9-3 Bare Soil Evaporation ...................................................................................................... 9-5
Open Water Evaporation ......................................................................................................... 9-7 Available Data ................................................................................................................. 9-8 CalSim 3.0 Approach ....................................................................................................... 9-8
Crop Evapotranspiration ....................................................................................................... 9-12 Reference Crop Evapotranspiration ............................................................................... 9-13 Crop Coefficients and Growth Stages............................................................................ 9-19 Growing Season ............................................................................................................. 9-22 Other Factors Affecting Evapotranspiration .................................................................. 9-25 Simulation of Daily Crop Evapotranspiration ............................................................... 9-25
Chapter 10 Valley Surface Runoff...................................................................................... 10-1
Modeling Approach for CalSim 3.0 ...................................................................................... 10-1 Soil Conservation Service Curve Number Method ............................................................... 10-2
Factors Affecting Curve Number ................................................................................... 10-3 Model Validation .................................................................................................................. 10-6
Cottonwood Creek ......................................................................................................... 10-6 Other Watersheds ......................................................................................................... 10-10
Runoff Adjustments ............................................................................................................ 10-10 Effects of Land-Use Change ........................................................................................ 10-10 Lower American River ................................................................................................ 10-13
Summary of Valley Watershed Surface Runoff .................................................................. 10-15 Surface Runoff Inflow Arcs ................................................................................................ 10-15
Chapter 11 Agricultural Water Use ....................................................................................... 11-1
Background…… ................................................................................................................... 11-1 Integrated Demand Calculator v. C3.0 .................................................................................. 11-2
Soil Moisture Routing in the Root Zone ........................................................................ 11-2 Crop Evapotranspiration ................................................................................................ 11-3 Applied Water Demand ................................................................................................. 11-3 Varying Land Use .......................................................................................................... 11-5 Model Input Data ........................................................................................................... 11-5
Rice Cultivation in the Central Valley ................................................................................ 11-20 Agricultural Practices ................................................................................................... 11-20 Rice Straw Decomposition .......................................................................................... 11-21 Duck Habitat ................................................................................................................ 11-23 Rice Water Use Model ................................................................................................. 11-23
Model Outputs ..................................................................................................................... 11-30 Simulation of Agricultural Water Use ................................................................................ 11-32
Agricultural Template .................................................................................................. 11-32 Agricultural Water Use Parameters ............................................................................. 11-33

CalSim 3.0 Hydrology Development Project
iv DRAFT – December 2017
Groundwater Use ......................................................................................................... 11-41 Historical and Simulated Agricultural Deliveries ............................................................... 11-44
SWP Feather River Service Area ................................................................................. 11-45 CVP Sacramento River Settlement Contractors .......................................................... 11-50 CVP Sacramento Valley Water Service Contractors ................................................... 11-54 Reclamation Orland and Solano Projects .................................................................... 11-59
Chapter 12 Urban Water Use ............................................................................................. 12-1
Representation in CalSim 3.0 ................................................................................................ 12-1 Urban Template ............................................................................................................. 12-1 Urban Water Use Parameters ......................................................................................... 12-3 Demand Units ................................................................................................................ 12-3
Data Sources…. .................................................................................................................... 12-3 Division of Statewide Integrated Water Management ................................................... 12-3 Urban Water Management Plans ................................................................................... 12-4 Water Forum Agreement ............................................................................................... 12-5 National Census Data ..................................................................................................... 12-6 National Pollutant Discharge Elimination System ........................................................ 12-6
Population Data ..................................................................................................................... 12-6 Water Demands ..................................................................................................................... 12-7
Monthly Demand Pattern ............................................................................................... 12-8 Surface Water Diversions ................................................................................................... 12-22 Groundwater Pumping ........................................................................................................ 12-22 Return Flows…. .................................................................................................................. 12-30
Indoor and Outdoor Water Use .................................................................................... 12-30 Wastewater ................................................................................................................... 12-31
Model Validation ..................................................................................................................... 12-31 Chapter 13 Wetlands Water Use ........................................................................................ 13-1
Wetland Habitat Types .......................................................................................................... 13-1 Seasonal Wetlands ......................................................................................................... 13-1 Semi-permanent Wetlands ............................................................................................. 13-2 Permanent Wetlands ...................................................................................................... 13-3 Croplands ....................................................................................................................... 13-3 Riparian Habitat and Natural Grasslands ....................................................................... 13-3
Water Management Schedule ............................................................................................... 13-3 Wetland Demand Units ......................................................................................................... 13-5 Historical Water Deliveries and Contract Amounts.............................................................. 13-5 Wetlands Water Use Model .................................................................................................. 13-8
Computations ................................................................................................................. 13-8 Model Output ................................................................................................................. 13-9
Simulation of Wetland Water Use ...................................................................................... 13-12 Template for Managed Wetlands ................................................................................. 13-12 Conveyance and Conveyance Losses .......................................................................... 13-13 Reuse…………………. ............................................................................................... 13-15 Miscellaneous Evaporative Losses .............................................................................. 13-15

Contents
v DRAFT – December 2017
Contract and Water Right Limitations ......................................................................... 13-15 Groundwater Use ......................................................................................................... 13-15 Simulated Deliveries .................................................................................................... 13-16
Chapter 14 Contracts and Water Rights ........................................................................... 14-1
Central Valley Project ........................................................................................................... 14-1 CVP Sacramento River Settlement Contracts ................................................................ 14-1 CVP Municipal and Industrial and Agricultural Water Service Contracts .................... 14-8 CVP Wildlife Refuge Contractors ............................................................................... 14-14
State Water Project .............................................................................................................. 14-16 SWP Long-term Contracts and Water Rights Agreements .......................................... 14-16
Other Reclamation Projects ................................................................................................ 14-24 Orland Project .............................................................................................................. 14-24 Solano Project .............................................................................................................. 14-25
Non-Project Water .............................................................................................................. 14-26 Sacramento River ......................................................................................................... 14-26 Other Diverters ............................................................................................................. 14-32 Lower Feather River .................................................................................................... 14-33 Bear River .................................................................................................................... 14-34
Lower American River ............................................................................................................ 14-35 Chapter 15 Groundwater Representation ......................................................................... 15-1
Background…. ...................................................................................................................... 15-1 Groundwater Dynamic Link Library .................................................................................... 15-2
Reconciliation of Differences between CalSim 3.0 and Groundwater DLL ................. 15-3 Implementation of Groundwater DLL .................................................................................. 15-9
Groundwater DLL Functions ......................................................................................... 15-9 Aquifer Parameters, Initial and Boundary Conditions ................................................. 15-11 Flowchart for Implementation of Groundwater DLL .................................................. 15-11 File Structure ................................................................................................................ 15-16 Input Files .................................................................................................................... 15-21
Output Files…. .................................................................................................................... 15-25 Data in Groundwater-Specific Output Files ................................................................ 15-25 Data in Decision Variable Output File......................................................................... 15-31
Summary of Results ................................................................................................................. 15-33 Chapter 16 Closure Terms .................................................................................................. 16-1
Background…. ...................................................................................................................... 16-1 Historical Flow Balance ........................................................................................................ 16-2 Bias and Error Correction ..................................................................................................... 16-6
Rim Inflow Corrections ................................................................................................. 16-6 Rainfall-Runoff Corrections .......................................................................................... 16-7 Combined Rim Inflow and Rainfall-Runoff Corrections .............................................. 16-7
Sources of Historical Data .................................................................................................... 16-8 Stream-Aquifer Interaction ............................................................................................ 16-8 Surface Runoff ............................................................................................................... 16-8

CalSim 3.0 Hydrology Development Project
vi DRAFT – December 2017
Stream Gauge Data ........................................................................................................ 16-8 Diversion Data ............................................................................................................. 16-10 Historical Return Flows ............................................................................................... 16-11
Historical Flows at Control Points ...................................................................................... 16-12 Sacramento River at Shasta Dam ................................................................................. 16-12 Sacramento River above Bend Bridge ......................................................................... 16-13 Sacramento River at Butte City ................................................................................... 16-13 Sacramento River below Wilkins Slough .................................................................... 16-14 Colusa Basin Drain at Knights Landing Outfall Gates ................................................ 16-15 Sacramento River at Verona ........................................................................................ 16-16 Sacramento River at Freeport ...................................................................................... 16-16 Feather River at Oroville ............................................................................................. 16-17 Feather River at Nicolaus............................................................................................. 16-18 Sacramento Slough near Karnak .................................................................................. 16-19 Yuba River at Smartville ............................................................................................. 16-20 Bear River near Wheatland .......................................................................................... 16-21 American River at Fair Oaks ....................................................................................... 16-22 Stony Creek below Black Butte ................................................................................... 16-22 Cache Creek at Yolo .................................................................................................... 16-23 Yolo Bypass near Woodland ....................................................................................... 16-23 Putah Creek near Davis ................................................................................................ 16-24 Fremont Weir ............................................................................................................... 16-25 Knights Landing Ridge Cut ......................................................................................... 16-25
Bank Overflow .................................................................................................................... 16-26 Closure Term Summaries .................................................................................................... 16-27
Sacramento Valley Closure Terms .............................................................................. 16-27 Gauge Errors… ................................................................................................................... 16-48
Chapter 17 Sacramento-San Joaquin Delta ...................................................................... 17-1
Legal Delta and Delta Service Area ...................................................................................... 17-1 Net Channel Depletions ........................................................................................................ 17-3 Computer Models .................................................................................................................. 17-6
Consumptive Use Model................................................................................................ 17-6 Delta Island Consumptive Use Model ........................................................................... 17-6 Delta Evapotranspiration of Applied Water .................................................................. 17-6
Data Inputs….. ...................................................................................................................... 17-7 Land Use ........................................................................................................................ 17-7 Comparison of CalSim II and CalSim 3.0 Land Use ..................................................... 17-9 Precipitation ................................................................................................................. 17-11 Evapotranspiration ....................................................................................................... 17-15 Net Channel Depletions ............................................................................................... 17-22
Representation in CalSim 3.0 .............................................................................................. 17-24 Adjustment for Delta Imports ...................................................................................... 17-26
CalSim 3.0 Inputs…………………………………………………………………………… 17-29 Chapter 18 Implementation ................................................................................................ 18-1

Contents
vii DRAFT – December 2017
System File Input .................................................................................................................. 18-2 Timeseries Data ............................................................................................................. 18-2 Paired Data ..................................................................................................................... 18-3
System File WRESL Code .................................................................................................... 18-5 System Definition Files.................................................................................................. 18-5 System Constraint Files ............................................................................................... 18-17
Chapter 19 Model Validation .............................................................................................. 19-1
Delta Inflow…. ..................................................................................................................... 19-1 Sacramento River ........................................................................................................... 19-1 Sacramento Regional Wastewater Treatment Plant ....................................................... 19-4 Yolo Bypass ................................................................................................................... 19-4 Putah Creek .................................................................................................................... 19-5
Validation Metrics ................................................................................................................. 19-6 Adjusted Sacramento River Outflow ............................................................................. 19-6 Yolo Bypass Outflow ..................................................................................................... 19-7 Validation Period ........................................................................................................... 19-7 Limitations ..................................................................................................................... 19-7
Comparison of CalSim 3.0 to Historical Flows .................................................................... 19-9 Comparison of CalSim 3.0 to CalSim II ............................................................................. 19-19
Model Performance .................................................................................................................. 19-28 Chapter 20 Model Application to Climate Change Impact Assessment ............................. 20-1
Introduction…. ...................................................................................................................... 20-1 Technical Approach .............................................................................................................. 20-1
Selection of Climate Model Projections ........................................................................ 20-2 Downscaled Precipitation and Surface Air Temperature ............................................... 20-3 Rim Inflows ................................................................................................................... 20-4 Valley Floor Hydrology, Water Demands, and Water Use ........................................... 20-8 Sea Level Rise and Delta Salinity .................................................................................. 20-9
Model Results.. ................................................................................................................... 20-11 Delta Export ........................................................................................................... 20-11 North of Delta Carryover Storage .......................................................................... 20-13 System Reliability: Dead Storage .......................................................................... 20-14 X2 Location And Net Delta Outflow .................................................................... 20-15
Summary……. .................................................................................................................... 20-18 Chapter 21 References ......................................................................................................... 21-1
Chapter 1: Introduction ......................................................................................................... 21-1 Chapter 2: Water Budget Areas ............................................................................................ 21-2 Chapter 3: Demand Units ...................................................................................................... 21-2 Chapter 4: Network Schematic ............................................................................................. 21-5 Chapter 5: Rim Watershed Hydrology .................................................................................. 21-5 Chapter 6: Valley Watershed Hydrology .............................................................................. 21-5 Chapter 7: Valley Land Use .................................................................................................. 21-6 Chapter 8: Precipitation ........................................................................................................ 21-6

CalSim 3.0 Hydrology Development Project
viii DRAFT – December 2017
Chapter 9: Evaporation ......................................................................................................... 21-7 Chapter 10: Valley Surface Runoff ..................................................................................... 21-10 Chapter 11: Agricultural Water Use ................................................................................... 21-11 Chapter 12: Urban Water Use ............................................................................................. 21-13 Chapter 13: Wetlands Water Use ........................................................................................ 21-16 Chapter 14: Contracts and Water Rights ............................................................................. 21-16 Chapter 15: Groundwater .................................................................................................... 21-19 Chapter 16: Closure Terms ................................................................................................. 21-20 Chapter 17: Sacramento-San Joaquin Delta ........................................................................ 21-21 Chapter 18: Implementation ................................................................................................ 21-22 Chapter 19: Model Validation ............................................................................................. 21-22 Chapter 20: Climate Change Impact Assessment ............................................................... 21-22

Contents
ix DRAFT – December 2017
Appendices
Appendix A Map Appendix for Sacramento River Hydrologic Region Appendix B Map Appendix for San Joaquin River and Tulare Lake Hydrologic Regions Appendix C Network Schematic for Sacramento River Hydrologic Region
CalSim 3.0 Hydrology Development Project
x DRAFT – December 2017
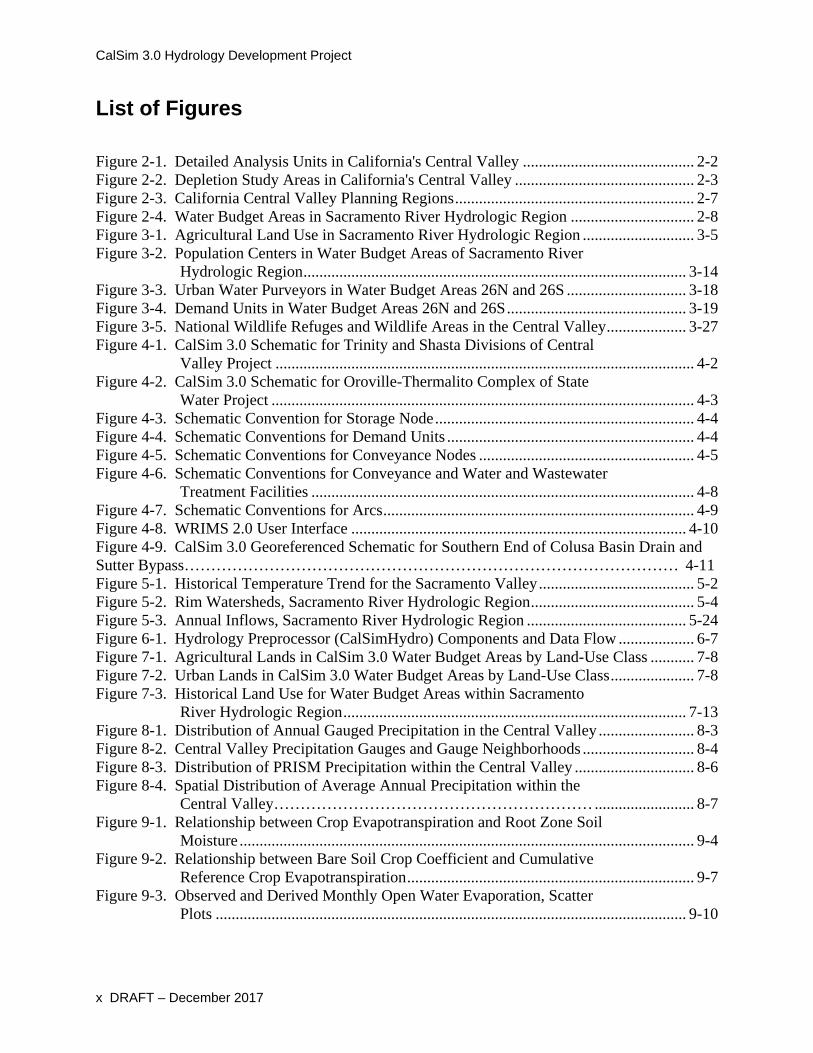
List of Figures
Figure 2-1. Detailed Analysis Units in California's Central Valley ........................................... 2-2 Figure 2-2. Depletion Study Areas in California's Central Valley ............................................. 2-3 Figure 2-3. California Central Valley Planning Regions ............................................................ 2-7 Figure 2-4. Water Budget Areas in Sacramento River Hydrologic Region ............................... 2-8 Figure 3-1. Agricultural Land Use in Sacramento River Hydrologic Region ............................ 3-5 Figure 3-2. Population Centers in Water Budget Areas of Sacramento River
Hydrologic Region ................................................................................................ 3-14 Figure 3-3. Urban Water Purveyors in Water Budget Areas 26N and 26S .............................. 3-18 Figure 3-4. Demand Units in Water Budget Areas 26N and 26S ............................................. 3-19 Figure 3-5. National Wildlife Refuges and Wildlife Areas in the Central Valley .................... 3-27 Figure 4-1. CalSim 3.0 Schematic for Trinity and Shasta Divisions of Central
Valley Project ......................................................................................................... 4-2 Figure 4-2. CalSim 3.0 Schematic for Oroville-Thermalito Complex of State
Water Project .......................................................................................................... 4-3 Figure 4-3. Schematic Convention for Storage Node ................................................................. 4-4 Figure 4-4. Schematic Conventions for Demand Units .............................................................. 4-4 Figure 4-5. Schematic Conventions for Conveyance Nodes ...................................................... 4-5 Figure 4-6. Schematic Conventions for Conveyance and Water and Wastewater
Treatment Facilities ................................................................................................ 4-8 Figure 4-7. Schematic Conventions for Arcs .............................................................................. 4-9 Figure 4-8. WRIMS 2.0 User Interface .................................................................................... 4-10 Figure 4-9. CalSim 3.0 Georeferenced Schematic for Southern End of Colusa Basin Drain and Sutter Bypass………………………………………………………………………………… 4-11 Figure 5-1. Historical Temperature Trend for the Sacramento Valley ....................................... 5-2 Figure 5-2. Rim Watersheds, Sacramento River Hydrologic Region ......................................... 5-4 Figure 5-3. Annual Inflows, Sacramento River Hydrologic Region ........................................ 5-24 Figure 6-1. Hydrology Preprocessor (CalSimHydro) Components and Data Flow ................... 6-7 Figure 7-1. Agricultural Lands in CalSim 3.0 Water Budget Areas by Land-Use Class ........... 7-8 Figure 7-2. Urban Lands in CalSim 3.0 Water Budget Areas by Land-Use Class ..................... 7-8 Figure 7-3. Historical Land Use for Water Budget Areas within Sacramento
River Hydrologic Region ...................................................................................... 7-13 Figure 8-1. Distribution of Annual Gauged Precipitation in the Central Valley ........................ 8-3 Figure 8-2. Central Valley Precipitation Gauges and Gauge Neighborhoods ............................ 8-4 Figure 8-3. Distribution of PRISM Precipitation within the Central Valley .............................. 8-6 Figure 8-4. Spatial Distribution of Average Annual Precipitation within the
Central Valley…………………………………………………… ......................... 8-7 Figure 9-1. Relationship between Crop Evapotranspiration and Root Zone Soil
Moisture .................................................................................................................. 9-4 Figure 9-2. Relationship between Bare Soil Crop Coefficient and Cumulative
Reference Crop Evapotranspiration ........................................................................ 9-7 Figure 9-3. Observed and Derived Monthly Open Water Evaporation, Scatter
Plots ...................................................................................................................... 9-10
Contents
xi DRAFT – December 2017
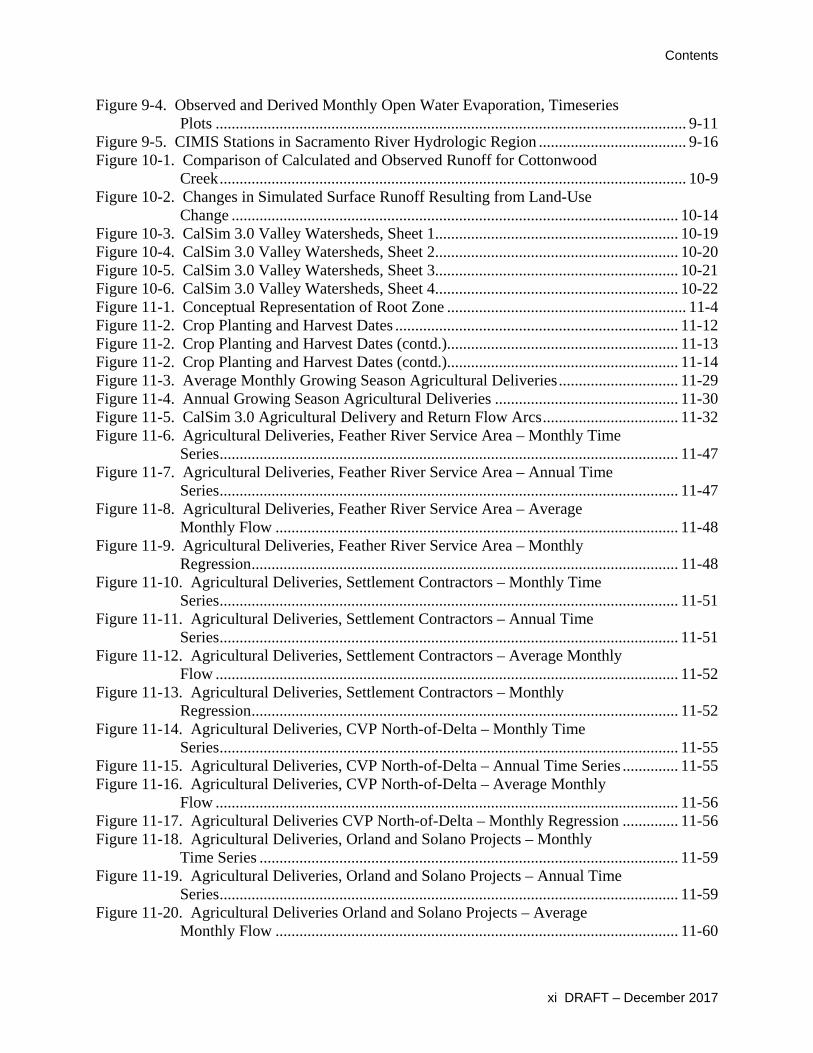
Figure 9-4. Observed and Derived Monthly Open Water Evaporation, Timeseries Plots ...................................................................................................................... 9-11
Figure 9-5. CIMIS Stations in Sacramento River Hydrologic Region ..................................... 9-16 Figure 10-1. Comparison of Calculated and Observed Runoff for Cottonwood
Creek ..................................................................................................................... 10-9 Figure 10-2. Changes in Simulated Surface Runoff Resulting from Land-Use
Change ................................................................................................................ 10-14 Figure 10-3. CalSim 3.0 Valley Watersheds, Sheet 1 ............................................................. 10-19 Figure 10-4. CalSim 3.0 Valley Watersheds, Sheet 2 ............................................................. 10-20 Figure 10-5. CalSim 3.0 Valley Watersheds, Sheet 3 ............................................................. 10-21 Figure 10-6. CalSim 3.0 Valley Watersheds, Sheet 4 ............................................................. 10-22 Figure 11-1. Conceptual Representation of Root Zone ............................................................ 11-4 Figure 11-2. Crop Planting and Harvest Dates ....................................................................... 11-12 Figure 11-2. Crop Planting and Harvest Dates (contd.).......................................................... 11-13 Figure 11-2. Crop Planting and Harvest Dates (contd.).......................................................... 11-14 Figure 11-3. Average Monthly Growing Season Agricultural Deliveries .............................. 11-29 Figure 11-4. Annual Growing Season Agricultural Deliveries .............................................. 11-30 Figure 11-5. CalSim 3.0 Agricultural Delivery and Return Flow Arcs .................................. 11-32 Figure 11-6. Agricultural Deliveries, Feather River Service Area – Monthly Time
Series ................................................................................................................... 11-47 Figure 11-7. Agricultural Deliveries, Feather River Service Area – Annual Time
Series ................................................................................................................... 11-47 Figure 11-8. Agricultural Deliveries, Feather River Service Area – Average
Monthly Flow ..................................................................................................... 11-48 Figure 11-9. Agricultural Deliveries, Feather River Service Area – Monthly
Regression ........................................................................................................... 11-48 Figure 11-10. Agricultural Deliveries, Settlement Contractors – Monthly Time
Series ................................................................................................................... 11-51 Figure 11-11. Agricultural Deliveries, Settlement Contractors – Annual Time
Series ................................................................................................................... 11-51 Figure 11-12. Agricultural Deliveries, Settlement Contractors – Average Monthly
Flow .................................................................................................................... 11-52 Figure 11-13. Agricultural Deliveries, Settlement Contractors – Monthly
Regression ........................................................................................................... 11-52 Figure 11-14. Agricultural Deliveries, CVP North-of-Delta – Monthly Time
Series ................................................................................................................... 11-55 Figure 11-15. Agricultural Deliveries, CVP North-of-Delta – Annual Time Series .............. 11-55 Figure 11-16. Agricultural Deliveries, CVP North-of-Delta – Average Monthly
Flow .................................................................................................................... 11-56 Figure 11-17. Agricultural Deliveries CVP North-of-Delta – Monthly Regression .............. 11-56 Figure 11-18. Agricultural Deliveries, Orland and Solano Projects – Monthly
Time Series ......................................................................................................... 11-59 Figure 11-19. Agricultural Deliveries, Orland and Solano Projects – Annual Time
Series ................................................................................................................... 11-59 Figure 11-20. Agricultural Deliveries Orland and Solano Projects – Average
Monthly Flow ..................................................................................................... 11-60

CalSim 3.0 Hydrology Development Project
xii DRAFT – December 2017
Figure 11-21. Agricultural Deliveries, Orland and Solano Projects – Monthly Regression ........................................................................................................... 11-60
Figure 12-1. CalSim 3.0 Urban Diversion and Return Flow Arcs……………………………12-2 Figure 13-1. CalSim 3.0 Managed Wetland Delivery and Return Flow Arcs ........................ 13-13 Figure 13-2. Level 2 Refuge Deliveries North-of-Delta – Monthly Timeseries .................... 13-19 Figure 13-3. Level 2 Refuge Deliveries North-of-Delta – Annual Timeseries ...................... 13-19 Figure 13-4. Level 2 Refuge Deliveries North-of-Delta – Average Monthly Flow ............... 13-20 Figure 13-5. Level 2 Refuge Deliveries North-of-Delta – Monthly Regression……………..13-20 Figure 15-1. Absolute Differences between Groundwater Heads Computed by
Groundwater DLL and C2VSim for Same Input Data ......................................... 15-4 Figure 15-2. Definition of Stream Node ................................................................................... 15-5 Figure 15-3. CalSim 3.0 Water Budget Areas and C2VSim Finite Element Grid ................... 15-8 Figure 15-4. Distribution of Horizontal Hydraulic Conductivity ........................................... 15-13 Figure 15-5. Distribution of Vertical Hydraulic Conductivity ............................................... 15-14 Figure 15-6. Distribution of Specific Yield ............................................................................ 15-15 Figure 15-7.a. Flowchart for Implementing Groundwater DLL in CalSim 3.0 ...................... 15-17 Figure 15-7.b. Flowchart for Implementing Groundwater DLL in CalSim 3.0 ..................... 15-18 Figure 15-7.c. Flowchart for Implementing Groundwater DLL in CalSim 3.0 ...................... 15-19 Figure 15-7.d. Flowchart for Implementing Groundwater DLL in CalSim 3.0 ..................... 15-20 Figure 15-8. Annual Net Inflows and Storage for the Sacramento Valley Aquifer ............... 15-36 Figure 15-9. Average Monthly Groundwater Pumping and Stream Gain for
Sacramento Valley .............................................................................................. 15-37 Figure 16-1. Historical Water Balance ..................................................................................... 16-3 Figure 16-2. Location of Control Points in the Sacramento Valley ......................................... 16-4 Figure 16-3. Control Gauges and Contributing Drainage Areas in Sacramento
River Hydrologic Region ...................................................................................... 16-5 Figure 16-4. Closure Term Flow Components, Sacramento River above Bend
Bridge.................................................................................................................. 16-33 Figure 16-5. Closure Term Flow Components, Sacramento River at Butte City ................... 16-34 Figure 16-6. Closure Term Flow Components, Sacramento River below Wilkins
Slough ................................................................................................................. 16-35 Figure 16-7. Closure Term Flow Components, Colusa Basin Drain at Outfall
Gates ................................................................................................................... 16-36 Figure 16-8. Closure Term Flow Components, Sacramento River at Verona ........................ 16-37 Figure 16-9. Closure Term Flow Components, Sacramento River at Freeport ...................... 16-38 Figure 16-10. Closure Term Flow Components, Feather River at Oroville ........................... 16-39 Figure 16-11. Closure Term Flow Components, Feather River near Nicolaus ...................... 16-40 Figure 16-12. Closure Term Flow Components, Sacramento Slough near Karnak ............... 16-41 Figure 16-13. Closure Term Flow Components, Yuba River at Smartville ........................... 16-42 Figure 16-14. Closure Term Flow Components, Bear River near Wheatland ........................ 16-43 Figure 16-15. Closure Term Flow Components, American River at Fair Oaks ..................... 16-44 Figure 16-16. Closure Term Flow Components, Cache Creek at Yolo .................................. 16-45 Figure 16-17. Closure Term Flow Components, Yolo Bypass near Woodland ..................... 16-46 Figure 16-18. Closure Term Flow Components, Putah Creek near Davis ............................. 16-47 Figure 17-1. Delta Lowlands, Delta Uplands, and Detailed Analysis Units ........................... 17-4 Figure 17-2. Cities and Districts within the Delta Receiving Imported Water ......................... 17-5

Contents
xiii DRAFT – December 2017
Figure 17-3. CalSim II and CalSim 3.0 Land Uses for the Delta ............................................. 17-9 Figure 17-4. Thiessen Polygons for Delta Precipitation ......................................................... 17-14 Figure 17-5. Comparison of Precipitation Data Used in Delta Consumptive Use
Models for CalSim II and CalSim 3.0 ................................................................ 17-15 Figure 17-6. Comparison of PRISM to Observed Temperature Data .................................... 17-19 Figure 17-7. Average Monthly Distribution of Delta Reference Crop
Evapotranspiration .............................................................................................. 17-21 Figure 17-8. Annual Delta Reference Crop Evapotranspiration ............................................. 17-22 Figure 17-9. CalSim 3.0 Delta Subregions ............................................................................. 17-25 Figure 17-10. Annual Net Channel Depletions, Existing Conditions ..................................... 17-29 Figure 17-11. Average Monthly Net Channel Depletions, Existing Conditions .................... 17-30 Figure 17-12. Average Annual Net Channel Depletions by Subregion, Existing
Conditions ........................................................................................................... 17-30 Figure 19-1. Sacramento Valley Inflows to the Delta ………………………………………...19-2 Figure 19-2. Historical Average Annual Inflows to the Delta………………………………..19-3 Figure 19-3. Historical and CalSim 3.0 Adjusted Sacramento River Outflow – Monthly Time
series Water Years 1996-2015……………………………………………………19-10 Figure 19-4. Historical and CalSim 3.0 Adjusted Sacramento River Outflow – Annual Time
series Water Years 1996-2015……………………………………………………19-10 Figure 19-5. Historical and CalSim 3.0 Adjusted Sacramento River Outflow – Monthly Flow
Exceedance Water Years 1996-2015……………………………………………..19-11 Figure 19-6. Historical and CalSim 3.0 Adjusted Sacramento River Outflow –
Average Monthly Flow Water Years 1996-2015 ............................................... 19-11 Figure 19-7. Historical and CalSim 3.0 Adjusted Sacramento River Outflow –
Monthly Flow Regression Water Years 1996-2015 ........................................... 19-12 Figure 19-8. Historical and CalSim 3.0 Yolo Bypass Outflow – Monthly Time
series Water Years 1996-2015 ............................................................................ 19-13 Figure 19-9. Historical and CalSim 3.0 Yolo Bypass Outflow – Annual Time
series Water Years 1996-2015 ............................................................................ 19-13 Figure 19-10. Historical and CalSim 3.0 Yolo Bypass Outflow – Monthly Flow
Exceedance Water Years 1996-2015 .................................................................. 19-14 Figure 19-11. Historical and CalSim 3.0 Yolo Bypass Outflow – Average
Monthly Flow Water Years 1996-2015 .............................................................. 19-13 Figure 19-12. Historical and CalSim 3.0 Yolo Bypass Outflow – Monthly Flow
Regression Water Years 1996-2015 ................................................................... 19-15 Figure 19-13. Historical and CalSim 3.0 Adjusted Sacramento Valley Outflow –
Monthly Time series Water Years 1996-2015 .................................................... 19-16 Figure 19-14. Historical and CalSim 3.0 Adjusted Sacramento Valley Outflow –
Annual Time series Water Years 1996-2015 ...................................................... 19-16 Figure 19-15. Historical and CalSim 3.0 Adjusted Sacramento Valley Outflow –
Monthly Flow Exceedance Water Years 1996-2015 .......................................... 19-17 Figure 19-16. Historical and CalSim 3.0 Adjusted Sacramento Valley Outflow –
Average Monthly Flow Water Years 1996-2015 ............................................... 19-17 Figure 19-17. Historical and CalSim 3.0 Adjusted Sacramento Valley Outflow –
Monthly Flow Regression Water Years 1996-2015 ........................................... 19-18

CalSim 3.0 Hydrology Development Project
xiv DRAFT – December 2017
Figure 19-18. CalSim II and CalSim 3.0 Adjusted Sacramento River Outflow – Monthly Time series Water Years 1994-2003 .................................................... 19-20
Figure 19-19. CalSim II and CalSim 3.0 Adjusted Sacramento River Outflow – Annual Time series Water Years 1994-2003 ...................................................... 19-20
Figure 19-20. CalSim II and CalSim 3.0 Adjusted Sacramento River Outflow – Monthly Flow Exceedance Water Years 1994-2003 .......................................... 19-21
Figure 19-21. CalSim II and CalSim 3.0 Adjusted Sacramento River Outflow – Average Monthly Flow Water Years 1994-2003 ............................................... 19-21
Figure 19-22. CalSim II and CalSim 3.0 Adjusted Sacramento River Outflow – Monthly Flow Regression Water Years 1994-2003 ........................................... 19-22
Figure 19-23. CalSim II and CalSim 3.0 Yolo Bypass Outflow –Monthly Time series Water Years 1994-2003 ............................................................................ 19-23
Figure 19-24. CalSim II and CalSim 3.0 Yolo Bypass Outflow – Annual Time series Water Years 1994-2003 ............................................................................ 19-23
Figure 19-25. CalSim II and CalSim 3.0 Yolo Bypass Outflow – Monthly Flow Exceedance Water Years 1994-2003 .................................................................. 19-24
Figure 19-26. CalSim II and CalSim 3.0 Yolo Bypass Outflow – Average Monthly Flow Water Years 1994-2003 .............................................................. 19-24
Figure 19-27. CalSim II and CalSim 3.0 Yolo Bypass Outflow – Monthly Flow Regression Water Years 1994-2003 ................................................................... 19-25
Figure 19-28. CalSim II and CalSim 3.0 Adjusted Sacramento Valley Outflow – Monthly Time series Water Years 1994-2003 .................................................... 19-26
Figure 19-29. CalSim II and CalSim 3.0 Adjusted Sacramento Valley Outflow – Annual Time series Water Years 1994-2003 ...................................................... 19-26
Figure 19-30. CalSim II and CalSim 3.0 Adjusted Sacramento Valley Outflow – Monthly Flow Exceedance Water Years 1994-2003 .......................................... 19-27
Figure 19-31. CalSim II and CalSim 3.0 Adjusted Sacramento Valley Outflow – Average Monthly Flow Water Years 1994-2003 ............................................... 19-27
Figure 19-32. CalSim II and CalSim 3.0 Adjusted Sacramento Valley Outflow – Monthly Flow Regression Water Years 1994-2003 ........................................... 19-28
Figure 19-33. Adjusted Sacramento Valley Outflow – Monthly Percent Deviation Water Years 1994-2003 ...................................................................................... 19-29
Figure 19-34. Adjusted Sacramento Valley Outflow – Monthly Percent Deviation Water Years 2004-2015 ...................................................................................... 19-29
Figure 19-35. Adjusted Sacramento Valley Outflow – Annual Percent Deviation Water Years 1994-2015 ...................................................................................... 19-30
Figure 19-36. Adjusted Sacramento Valley Outflow – Average Monthly Percent Deviation Water Years 1994-2003 ..................................................................... 19-30
Figure 19-37. Adjusted Sacramento Valley Outflow – Average Monthly Percent Deviation Water Years 1996-2015 .......................................................................................... 19-31 Figure 20-1. Projected Precipitation and Surface Air Temperature Trend, 2045-
2074, by 20 CCTAG Climate Model Projections, based on 1°×1° re-gridded GCM Projections ..................................................................................... 20-3
Figure 20-2. Runoff Types for 63 Sacramento River Rim Watersheds in CalSim 3.0 ......................................................................................................................... 20-5

Contents
xv DRAFT – December 2017
Figure 20-3. Variable Perturbation Ratio for Inflows to Trinity Reservoir under the BDCP Climate Change Scenario Q2 .............................................................. 20-5
Figure 20-4. Exceedance Probability of Rim Inflows for Base and Mid-Century Scenarios ............................................................................................................... 20-7
Figure 20-5. Average Monthly Rim Inflows for Base and Mid-Century Scenarios ................. 20-7 Figure 20-6. Sacramento and San Joaquin Valley Annual Applied Water Demand
for Base and Mid-Century Scenarios .................................................................... 20-9 Figure 20-7. Exceedance Probability of Annual Delta Exports for Base and Mid-
Century Scenarios ............................................................................................... 20-12 Figure 20-8. Exceedance Probability of North of Delta Carryover Storage for
Base and Mid-Century Scenarios ....................................................................... 20-14 Figure 20-9. Dead Storage Occurrence for the Base Scenario and for CMIP5,
Mid-Century........................................................................................................ 20-15 Figure 20-10. X2 Location with and without Sea Level Rise for Base and Mid-
Century Level Scenarios. .................................................................................... 20-17 Figure 20-11. Average Monthly Delta Outflow with and without Sea Level Rise,
Base and Mid-Century Scenarios ....................................................................... 20-17

CalSim 3.0 Hydrology Development Project
xvi DRAFT – December 2017
List of Tables
Table 2-1. Water Budget Area Nomenclature ............................................................................ 2-7 Table 2-2. Water Budget Areas in Sacramento River Hydrologic Region ................................. 2-9 Table 3-1. Demand Units in CalSim 3.0 by Hydrologic Region ................................................ 3-2 Table 3-2. Demand Unit Naming Key ........................................................................................ 3-3 Table 3-3. Agricultural Demand Units in Sacramento River Hydrologic Region ...................... 3-7 Table 3-3. Agricultural Demand Units in Sacramento River Hydrologic Region
(contd.) .................................................................................................................... 3-8 Table 3-3. Agricultural Demand Units in Sacramento River Hydrologic Region
(contd.) .................................................................................................................... 3-9 Table 3-3. Agricultural Demand Units in Sacramento River Hydrologic Region
(contd.) .................................................................................................................. 3-10 Table 3-4. Non-Project Agricultural Diversions from Sacramento River ................................ 3-11 Table 3-5. Non-District Agricultural Diversions from Feather River ...................................... 3-12 Table 3-6. Urban Demand Units in Sacramento River Hydrologic Region ............................. 3-20 Table 3-6. Urban Demand Units in Sacramento River Hydrologic Region (contd.) ................ 3-21 Table 3-6. Urban Demand Units in Sacramento River Hydrologic Region (contd.) ................ 3-22 Table 3-6. Urban Demand Units in Sacramento River Hydrologic Region (contd.) ................ 3-23 Table 3-6. Urban Demand Units in Sacramento River Hydrologic Region (contd.) ................ 3-24 Table 3-6. Urban Demand Units in Sacramento River Hydrologic Region (contd.) ................ 3-25 Table 3-7. Wetland Demand Units in Sacramento River Hydrologic Region .......................... 3-30 Table 4-1 Naming Convention for Channel Arcs in Sacramento River Hydrologic
Region ..................................................................................................................... 4-6 Table 4-1 Naming Convention for Channel Arcs in Sacramento River Hydrologic
Region (contd.) ....................................................................................................... 4-7 Table 5-1. Rim Watershed Land Cover, Sacramento River Hydrologic Region ........................ 5-9 Table 5-1. Rim Watershed Land Cover, Sacramento River Hydrologic Region
(contd.) .................................................................................................................. 5-10 Table 5-1. Rim Watershed Land Cover, Sacramento River Hydrologic Region
(contd.) .................................................................................................................. 5-11 Table 5-2. Data Sources and Calculation Methods, Sacramento River Hydrologic
Region ................................................................................................................... 5-12 Table 5-2. Data Sources and Calculation Methods, Sacramento River Hydrologic
Region (contd.) ..................................................................................................... 5-13 Table 5-2. Data Sources and Calculation Methods, Sacramento River Hydrologic
Region (contd.) ..................................................................................................... 5-14 Table 5-2. Data Sources and Calculation Methods, Sacramento River Hydrologic
Region (contd.) ..................................................................................................... 5-15 Table 5-3. Flow Correlation, Sacramento River Hydrologic Region ....................................... 5-16 Table 5-3. Flow Correlation, Sacramento River Hydrologic Region (contd.) .......................... 5-17 Table 5-3. Flow Correlation, Sacramento River Hydrologic Region (contd.) .......................... 5-18 Table 5-3. Flow Correlation, Sacramento River Hydrologic Region (contd.) .......................... 5-19

Contents
xvii DRAFT – December 2017
Table 5-4. Rim Watershed Inflows, Sacramento River Hydrologic Region ............................ 5-20 Table 5-4. Rim Watershed Inflows, Sacramento River Hydrologic Region (contd) ................ 5-21 Table 5-5. Rim Watershed Characteristics, Sacramento River Hydrologic Region
(contd.) .................................................................................................................. 5-22 Table 5-5. Rim Watershed Characteristics, Sacramento River Hydrologic Region
(contd.) .................................................................................................................. 5-23 Table 6-1. Data Sources for CalSim 3.0 Hydrologic Input Data ................................................ 6-3 Table 6-2. Spatial Resolution of CalSim 3.0 Hydrologic Input Data ......................................... 6-3 Table 7-1. County Land-Use Surveys ......................................................................................... 7-3 Table 7-2. Existing Level Land Use for Detailed Analysis Units in CalSim 3.0
Sacramento Valley Domain .................................................................................... 7-5 Table 7-3. Irrigated Crop Area for Detailed Analysis Units in CalSim 3.0
Sacramento Valley Domain .................................................................................... 7-6 Table 7-4. Agricultural Land-Use Classification ........................................................................ 7-9 Table 7-4. Agricultural Land-Use Classification (contd.) ........................................................ 7-10 Table 7-5. Urban Land-Use Classification ............................................................................... 7-11 Table 7-6. Managed Wetland and Native Vegetation Land-Use Classification ....................... 7-12 Table 7-7. Existing Level Land Use by Water Budget Area within the
Sacramento Valley ................................................................................................ 7-15 Table 7-8. Existing Level Agricultural Land Use by Demand Unit within the
Sacramento Valley ................................................................................................ 7-16 Table 7-8. Existing Level Agricultural Land Use by Demand Unit within the
Sacramento Valley (contd.) .................................................................................. 7-17 Table 7-8. Existing Level Agricultural Land Use by Demand Unit within the
Sacramento Valley (contd.) .................................................................................. 7-18 Table 7-8. Existing Level Agricultural Land Use by Demand Unit within the
Sacramento Valley (contd.) .................................................................................. 7-19 Table 8-1. Precipitation within the Central Valley ..................................................................... 8-1 Table 8-2. Precipitation Gauge Summary ................................................................................... 8-2 Table 8-3. Precipitation Gauge Weighting Factors for the Sacramento Valley ....................... 8-10 Table 8-3. Precipitation Gauge Weighting Factors for the Sacramento Valley
(contd.) .................................................................................................................. 8-11 Table 8-4. Average Monthly Precipitation by Water Budget Area in the
Sacramento Valley ................................................................................................ 8-13 Table 9-1. Evaporation from Reservoirs, Natural Lakes, and Ponds .......................................... 9-8 Table 9-2. Evaporation Rates for Reservoirs in the Sacramento River Hydrologic
Region ................................................................................................................... 9-12 Table 9-3. Reference Crop Evapotranspiration for Selected CIMIS Stations in the
Sacramento River Hydrologic Region .................................................................. 9-14 Table 9-4. Hargreaves-Samani Equation Calibration Factors for Selected CIMIS
Locations in the Sacramento River Hydrologic Region ....................................... 9-17 Table 9-5. Ratio of Water Budget Area to CIMIS Station Location
Evapotranspiration ................................................................................................ 9-18 Table 9-6. Average Monthly Reference Crop Evapotranspiration by Water
Budget Area .......................................................................................................... 9-19 Table 9-7. Parameters for Crop Coefficient Curves ................................................................. 9-23

CalSim 3.0 Hydrology Development Project
xviii DRAFT – December 2017
Table 9-8. Growing Season and Planting and Harvest Dates ................................................... 9-27 Table 9-9. Mapping of Crops to Crop Categories..................................................................... 9-28 Table 9-10. Crop Evapotranspiration for Zone 12 .................................................................... 9-29 Table 9-11. Crop Evapotranspiration for Zone 14 .................................................................... 9-30 Table 10-1. Hydrologic Soil Groups ......................................................................................... 10-3 Table 10-2. Antecedent Moisture Condition ............................................................................ 10-5 Table 10-3. Curve Numbers for Three Antecedent Moisture Conditions ................................ 10-5 Table 10-4. Curve Numbers by Hydrologic Soil Group and Land Use Type .......................... 10-7 Table 10-5. Area Weighted Curve Numbers by Crop Type and by Water Budget
Area for the Sacramento Valley ............................................................................ 10-8 Table 10-6. Validation of Surface Runoff Model ................................................................... 10-11 Table 10-7. Disposition of Water Budget Areas and Groundwater Aquifer .......................... 10-12 Table 10-8. Surface Runoff Entering Lower American River ................................................ 10-14 Table 10-9. Average Monthly Surface Runoff by Water Budget Area .................................. 10-16 Table 10-10. Surface Runoff Characteristics by Water Budget Area ..................................... 10-17 Table 10-11. CalSim 3.0 Surface Runoff Arcs ....................................................................... 10-18 Table 11-1. Mapping of Crop Categories ................................................................................. 11-6 Table 11-2. Crop Rooting Depths ............................................................................................. 11-8 Table 11-3. Irrigation Methods in the Sacramento River Hydrologic Region ......................... 11-9 Table 11-4. Potential Application Efficiencies by Irrigation Technology .............................. 11-10 Table 11-5. On-Farm Seasonal Application Efficiency for the Sacramento Valley ............... 11-15 Table 11-5. On-Farm Seasonal Application Efficiency (contd.) ............................................ 11-16 Table 11-6. Irrigation Season and Growing Season in the Sacramento Valley ...................... 11-17 Table 11-7. Crop Minimum Soil Moisture ............................................................................. 11-18 Table 11-8. Field Capacity and Soil Porosity ......................................................................... 11-19 Table 11-9. Requirements of Rice Straw Burning Reduction ................................................ 11-22 Table 11-10. Winter Flooding of Rice Fields ......................................................................... 11-23 Table 11-11. Rice Water Use Model Operational Parameters ................................................ 11-25 Table 11-12. Applied Water Demands for the Sacramento Valley ........................................ 11-31 Table 11-13. Flow Paths for Agricultural Water Use ............................................................. 11-33 Table 11-14. Typical Canal Conveyance Loss Factors .......................................................... 11-36 Table 11-15. Minimum Groundwater Pumping...................................................................... 11-42 Table 11-15. Minimum Groundwater Pumping (contd.) ........................................................ 11-43 Table 11-16. Historical and Simulated Agricultural Deliveries ............................................. 11-44 Table 11-17. Feather River Service Area, Historical and Simulated Agricultural
Deliveries ............................................................................................................ 11-46 Table 11-18. CVP Sacramento River Settlement Contractors, Historical and
Simulated Agricultural Deliveries ...................................................................... 11-50 Table 11-19. CVP Sacramento Valley Water Service Contractors, Historical and
Simulated Agricultural Deliveries ...................................................................... 11-54 Table 11-20. Orland and Solano Projects, Historical and Simulated Deliveries .................... 11-58 Table 12-1. Flow Paths for Urban Water Use ………………………………………………...12-2 Table 12-2. Population and Growth Rates by County and Detailed Analysis Unit………… 12-9 Table 12-3. Population-Based Mapping of Demand Units to Detailed Analysis
Units .................................................................................................................... 12-10 Table 12-4. County-DAU 2010 Population Mapped to Water Budget Areas ........................ 12-11

Contents
xix DRAFT – December 2017
Table 12-5. Public and Self-Supplied Water Use by Urban Demand Unit ............................ 12-13 Table 12-5. Public and Self-Supplied Water Use by Urban Demand Unit (contd.) ............... 12-14 Table 12-5. Public and Self-Supplied Water Use by Urban Demand Unit (contd.) ............... 12-15 Table 12-6. Public Water Supply Statistics Water Use Data for Water Budget
Area 02 ................................................................................................................ 12-16 Table 12-6. Public Water Supply Statistics Water Use Data for Water Budget
Area 02 (contd.) .................................................................................................. 12-17 Table 12-7. Monthly Demand Pattern by Demand Unit ......................................................... 12-18 Table 12-7. Monthly Demand Pattern by Demand Unit (contd.) ........................................... 12-19 Table 12-7. Monthly Demand Pattern by Demand Unit (contd.) ........................................... 12-20 Table 12-7. Monthly Demand Pattern by Demand Unit (contd.) ........................................... 12-21 Table 12-8. Surface Water Diversions for Municipal and Industrial Water Supply .............. 12-23 Table 12-9. Conjunctive Use of Surface Water and Groundwater ......................................... 12-28 Table 12-9. Conjunctive Use of Surface Water and Groundwater (contd.) ............................ 12-29 Table 12-9. Conjunctive Use of Surface Water and Groundwater (contd.) ............................ 12-30 Table 12-10. Wastewater Discharge to Surface Waters ......................................................... 12-32 Table 12-10. Wastewater Discharge to Surface Waters (contd.) ............................................ 12-33 Table 13-1. Level 2 and Level 4 Historical Deliveries, Sacramento River
Hydrologic Region ................................................................................................ 13-7 Table 13-2. Managed Wetlands Simulated Water Use ........................................................... 13-10 Table 13-2. Wetlands Water Use Model Output (contd.) ....................................................... 13-11 Table 13-3. Flow Paths for Managed Wetland Water Use ..................................................... 13-12 Table 13-4. Conveyance Losses Associated with Wheeling Agreements for Level
2 Water ................................................................................................................ 13-14 Table 13-5. Historical and Simulated Deliveries to Managed Wetlands ................................ 13-18 Table 14-1. CVP Sacramento River Settlement Contracts ....................................................... 14-3 Table 14-2. CVP Water Service Contracts for Service Areas North of Delta .......................... 14-8 Table 14-2. CVP Water Service Contracts for Service Areas North of Delta
(contd.) .................................................................................................................. 14-9 Table 14-2. CVP Water Service Contracts for Service Areas North of Delta
(contd.) ................................................................................................................ 14-10 Table 14-3. Central Valley Project Municipal and Industrial Water Shortage
Policy .................................................................................................................. 14-11 Table 14-4. Refuge Level 2 and Level 4 Amounts per Exhibit B of Water Service
Contracts ............................................................................................................. 14-15 Table 14-5. Maximum Annual State Water Project Table A Amounts .................................. 14-17 Source: Based on 2010 State Water Project Allocation, State Water Project
Analysis Office, Department of Water Resources. ............................................. 14-17 Table 14-5. Maximum Annual State Water Project Table A Amounts (contd.) .................... 14-18 Table 14-6. Feather River Service Area Contracts and Water Rights .................................... 14-21 Table 14-7. Solano County Water Agency Member Agency Water Supplies ....................... 14-22 Table 14-8. Napa County Flood Control & Water Conservation District Table A
Amounts .............................................................................................................. 14-23 Table 14-9. Selected Appropriative Water Rights Held by CVP Settlement
Contractors .......................................................................................................... 14-27 Table 14-10. Non-Project Agricultural Diversions from Sacramento River .......................... 14-33
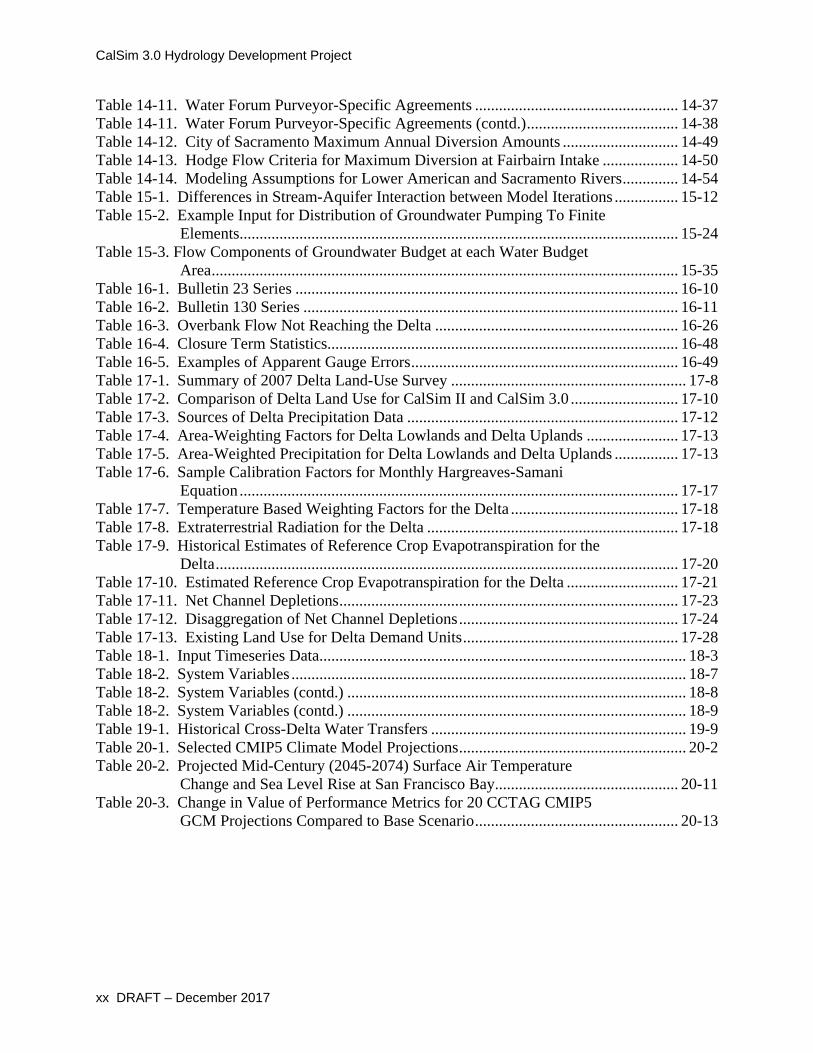
CalSim 3.0 Hydrology Development Project
xx DRAFT – December 2017
Table 14-11. Water Forum Purveyor-Specific Agreements ................................................... 14-37 Table 14-11. Water Forum Purveyor-Specific Agreements (contd.) ...................................... 14-38 Table 14-12. City of Sacramento Maximum Annual Diversion Amounts ............................. 14-49 Table 14-13. Hodge Flow Criteria for Maximum Diversion at Fairbairn Intake ................... 14-50 Table 14-14. Modeling Assumptions for Lower American and Sacramento Rivers .............. 14-54 Table 15-1. Differences in Stream-Aquifer Interaction between Model Iterations ................ 15-12 Table 15-2. Example Input for Distribution of Groundwater Pumping To Finite
Elements.............................................................................................................. 15-24 Table 15-3. Flow Components of Groundwater Budget at each Water Budget
Area ..................................................................................................................... 15-35 Table 16-1. Bulletin 23 Series ................................................................................................ 16-10 Table 16-2. Bulletin 130 Series .............................................................................................. 16-11 Table 16-3. Overbank Flow Not Reaching the Delta ............................................................. 16-26 Table 16-4. Closure Term Statistics........................................................................................ 16-48 Table 16-5. Examples of Apparent Gauge Errors ................................................................... 16-49 Table 17-1. Summary of 2007 Delta Land-Use Survey ........................................................... 17-8 Table 17-2. Comparison of Delta Land Use for CalSim II and CalSim 3.0 ........................... 17-10 Table 17-3. Sources of Delta Precipitation Data .................................................................... 17-12 Table 17-4. Area-Weighting Factors for Delta Lowlands and Delta Uplands ....................... 17-13 Table 17-5. Area-Weighted Precipitation for Delta Lowlands and Delta Uplands ................ 17-13 Table 17-6. Sample Calibration Factors for Monthly Hargreaves-Samani
Equation .............................................................................................................. 17-17 Table 17-7. Temperature Based Weighting Factors for the Delta .......................................... 17-18 Table 17-8. Extraterrestrial Radiation for the Delta ............................................................... 17-18 Table 17-9. Historical Estimates of Reference Crop Evapotranspiration for the
Delta .................................................................................................................... 17-20 Table 17-10. Estimated Reference Crop Evapotranspiration for the Delta ............................ 17-21 Table 17-11. Net Channel Depletions ..................................................................................... 17-23 Table 17-12. Disaggregation of Net Channel Depletions ....................................................... 17-24 Table 17-13. Existing Land Use for Delta Demand Units ...................................................... 17-28 Table 18-1. Input Timeseries Data ............................................................................................ 18-3 Table 18-2. System Variables ................................................................................................... 18-7 Table 18-2. System Variables (contd.) ..................................................................................... 18-8 Table 18-2. System Variables (contd.) ..................................................................................... 18-9 Table 19-1. Historical Cross-Delta Water Transfers ................................................................ 19-9 Table 20-1. Selected CMIP5 Climate Model Projections ......................................................... 20-2 Table 20-2. Projected Mid-Century (2045-2074) Surface Air Temperature
Change and Sea Level Rise at San Francisco Bay .............................................. 20-11 Table 20-3. Change in Value of Performance Metrics for 20 CCTAG CMIP5
GCM Projections Compared to Base Scenario ................................................... 20-13

Contents
xxi DRAFT – December 2017
Abbreviations and Acronyms
AB Assembly Bill ADICU Adjusted Delta Island Consumptive Use AFB Air Force Base ANN artificial neural network ARPS American River Pump Station AW applied water BDCP Bay-Delta Conservation Plan C2VSIM California Central Valley Simulation CABY Cosumnes American Bear Yuba CAD computer-aided drafting CALFED CALFED Bay-Delta Program CalSim California Simulation CalWater California Interagency Watershed Maps CaSIL California Spatial Information Library CDEC California Data Exchange Center CDF cumulative distribution function CDFG California Department of Fish and Game CEQA California Environmental Quality Act cfs cubic-feet per second CIMIS California Irrigation Management System CN case number CSA County Service Area CSD Community Service District CU Consumptive Use CUAW consumptive use of applied water CUI CalSim User Interface CVGSM Central Valley Groundwater Surface water Model CVHJV Central Valley Habitat Joint Venture CVP Central Valley Project CVPIA Central Valley Project Improvement Act DAU Detailed Analysis Unit DCU Delta Consumptive Use Delta Sacramento-San Joaquin Delta DFG California Department of Fish and Game DICU Delta Island Consumptive Use DIRWM Division of Integrated Regional Water Management

CalSim 3.0 Hydrology Development Project
xxii DRAFT – December 2017
DP deep percolation DPH California Department of Public Health DPLA Division of Planning and Local Assistance DSA Depletion Study Area DSIWM Division of Statewide Integrated Water Management DSM2 Delta Simulation Model 2 DSS Data Storage System DU Distribution Uniformity DWC Delta Cross Channel DWR California Department of Water Resources D-XXX Water Right Decision XXX EA Environmental Assessment EBMUD East Bay Municipal Utility District EIR Environmental Impact Report EIS Environmental Impact Statement EPA U.S. Environmental Protection Agency ESRI Environmental Sciences Research Institute
ET evapotranspiration ETAW evapotranspiration of applied water ETo reference crop evapotranspiration FC&WCD Flood Control and Water Conservation District FERC Federal Energy Regulatory Commission FONSI Finding of No Significant Impact FRSA Feather River Service Area FRWP Freeport Regional Water Project ft feet GCM global circulation model GEA Grassland Ecological Area GIS geographic information system GUI graphical user interface HEC-DSS Hydrologic Engineering Center-Data Storage System HUC Hydrologic Unit Code IC Irrigation Company ICA irrigated crop area ID Irrigation District IDC Integrated Demand Calculator IGSM Integrated Groundwater and Surface Water Model ILA irrigated land area

Contents
xxiii DRAFT – December 2017
IRWMP Integrated Regional Water Management Plan ISI Integrated Storage Investigation IWFM Integrated Water Flow Model IWMC California Interagency Watershed Mapping Committee JPA joint powers agreement LAFCO Local Agency Formation Commissions LOD level of development M&I municipal and industrial MAF million acre-feet MG million gallons mg/L milligrams per liter mgd million gallons per day MOU Memorandum of Understanding MP milepost MW Megawatt MWC Mutual Water Company NBA North Bay Aqueduct NCDC National Climate Data Center NCP Navigation Control Point NEH-4 Section 4 of the National Engineering Handbook NEPA National Environmental Policy Act NPDES National Pollutant Discharge Elimination System NRCS National Resources Conservation Service NWR National Wildlife Refuge OCAP Operations Criteria and Plan PAE Potential Application Efficiency PFCMP Plan Formulation Common Modeling Package PG&E Pacific Gas and Electric POU Place of Use PRISM Parameter-Elevation Regressions on Independent Slopes
Model PWSS Public Water System Statistics RCD Resource Conservation District RD Reclamation District RDM Robust Decision Making Reclamation U.S. Department of the Interior, Bureau of Reclamation RF return flow RM River Mile

CalSim 3.0 Hydrology Development Project
xxiv DRAFT – December 2017
RO runoff ROD Record of Decision RPA Reasonable and Prudent Alternatives RWAM Rice Water Use Model RWQCB Regional Water Quality Control Board SB Senate Bill SCS Soil Conservation Service SLDMWA San Luis Delta-Mendota Water Authority SMUD Sacramento Municipal Utility District SR surface runoff SRDOM Sacramento River Daily Operations Model SRESD Sacramento Regional County Sanitation District State State of California SWP State Water Project SWRCB State Water Resources Control Board TAF thousand acre-feet TW tailwater UC Davis University of California, Davis UD urban demand USACE U.S. Corps of Engineers USDA U.S. Department of Agriculture USFS U.S. Forestry Service USFWS U.S. Fish and Wildlife Service USGS U.S. Geological Survey UWMP Urban Water Management Plan WA Water Agency WAP Water Acquisition Program WBA Water Budget Area WBD Watershed Boundary Dataset WC Water Company WCD Water Conservation District WD Water District WPRS Water and Power Resources Services WRESL Water Resources Simulation Language WRIMS Water Resources Integrated Modeling System WTP water treatment plant WW wastewater WWTP wastewater treatment plant

Contents
xxv DRAFT – December 2017
Conversion Factors 1 million gallons per day (mgd) = 1.547 cubic feet per second (cfs) = 3.068 acre-feet per day
1 mgd = 1,120 acre-feet per year
1 acre-foot = 43,560 cubic feet = 324,900 gallons
1 cfs = 1.983 acre-feet per 24 hours = 0.646 mgd