a wavelet-based single-view reconstruction approach for ... · a wavelet-based single-view...
TRANSCRIPT
A wavelet-based single-view reconstruction approach for cone beam x-ray luminescence
tomography imaging Xin Liu,1 Hongkai Wang,2 Mantao Xu,1,3 Shengdong Nie,1,* and Hongbing Lu4,5
1School of Medical Instrument and Food Engineering, University of Shanghai for Science and Technology, Shanghai 200093, China
2Department of Biomedical Engineering, Dalian University of Technology, Dalian 116024, China 3School of Computing, University of Eastern Finland, Box 111, FIN-80101 Joensuu, Finland
4Department of Computation Application, School of Biomedical Engineering, Fourth Military Medical University, Xi’an 710032, China
[email protected] *[email protected]
Abstract: Single-view x-ray luminescence computed tomography (XLCT) imaging has short data collection time that allows non-invasively and fast resolving the three-dimensional (3-D) distribution of x-ray-excitable nanophosphors within small animal in vivo. However, the single-view reconstruction suffers from a severe ill-posed problem because only one angle data is used in the reconstruction. To alleviate the ill-posedness, in this paper, we propose a wavelet-based reconstruction approach, which is achieved by applying a wavelet transformation to the acquired singe-view measurements. To evaluate the performance of the proposed method, in vivo experiment was performed based on a cone beam XLCT imaging system. The experimental results demonstrate that the proposed method cannot only use the full set of measurements produced by CCD, but also accelerate image reconstruction while preserving the spatial resolution of the reconstruction. Hence, it is suitable for dynamic XLCT imaging study.
©2014 Optical Society of America
OCIS codes: (170.6960) Tomography; (170.3010) Image reconstruction techniques; (170.6280) Spectroscopy, fluorescence and luminescence; (110.7440) X-ray imaging; (170.3880) Medical and biological imaging.
References and links
1. G. Pratx, C. M. Carpenter, C. Sun, and L. Xing, “X-ray luminescence computed tomography via selective excitation: a feasibility study,” IEEE Trans. Med. Imaging 29(12), 1992–1999 (2010).
2. G. Pratx, C. M. Carpenter, C. Sun, R. P. Rao, and L. Xing, “Tomographic molecular imaging of x-ray-excitable nanoparticles,” Opt. Lett. 35(20), 3345–3347 (2010).
3. C. Li, K. Di, J. Bec, and S. R. Cherry, “X-ray luminescence optical tomography imaging: experimental studies,” Opt. Lett. 38(13), 2339–2341 (2013).
4. D. Chen, S. Zhu, H. Yi, X. Zhang, D. Chen, J. Liang, and J. Tian, “Cone beam x-ray luminescence computed tomography: A feasibility study,” Med. Phys. 40(3), 031111 (2013).
5. W. Cong, H. Shen, and G. Wang, “Spectrally resolving and scattering-compensated x-ray luminescence/fluorescence computed tomography,” J. Biomed. Opt. 16(6), 066014 (2011).
6. X. Liu, Q. Liao, and H. Wang, “In vivo x-ray luminescence tomographic imaging with single-view data,” Opt. Lett. 38(22), 4530–4533 (2013).
7. V. Ntziachristos, J. Ripoll, L. V. Wang, and R. Weissleder, “Looking and listening to light: the evolution of whole-body photonic imaging,” Nat. Biotechnol. 23(3), 313–320 (2005).
8. X. Liu, B. Zhang, J. Luo, and J. Bai, “4-D reconstruction for dynamic fluorescence diffuse optical tomography,” IEEE Trans. Med. Imaging 31(11), 2120–2132 (2012).
9. G. Wang, W. Cong, K. Durairaj, X. Qian, H. Shen, P. Sinn, E. Hoffman, G. McLennan, and M. Henry, “In vivo mouse studies with bioluminescence tomography,” Opt. Express 14(17), 7801–7809 (2006).
10. Y. Lv, J. Tian, W. Cong, G. Wang, J. Luo, W. Yang, and H. Li, “A multilevel adaptive finite element algorithm for bioluminescence tomography,” Opt. Express 14(18), 8211–8223 (2006).
11. M. Nichkova, D. Dosev, R. Perron, S. J. Gee, B. D. Hammock, and I. M. Kennedy, “Eu3+-doped Gd2O3 nanoparticles as reporters for optical detection and visualization of antibodies patterned by microcontact printing,” Anal. Bioanal. Chem. 384(3), 631–637 (2006).
#222090 - $15.00 USD Received 3 Sep 2014; revised 5 Oct 2014; accepted 6 Oct 2014; published 9 Oct 2014(C) 2014 OSA 1 November 2014 | Vol. 5, No. 11 | DOI:10.1364/BOE.5.003848 | BIOMEDICAL OPTICS EXPRESS 3848
12. A. M. Pires, M. F. Santos, M. R. Davolos, and E. B. Stucchi, “The effect of Eu3+ ion doping concentration in Gd2O3 fine spherical particles,” J. Alloy. Comp. 344(1-2), 276–279 (2002).
13. R. Bazzi, M. A. Flores-Gonzalez, C. Louis, K. Lebbou, C. Dujardin, A. Brenier, W. Zhang, O. Tillement, E. Bernstein, and P. Perriatc, “Synthesis and luminescent properties of sub-5-nm lanthanide oxides nanoparticles,” J. Lumin. 102–103, 445–450 (2003).
14. T. J. Rudge, V. Y. Soloviev, and S. R. Arridge, “Fast image reconstruction in fluorescence optical tomography using data compression,” Opt. Lett. 35(5), 763–765 (2010).
15. N. Ducros, C. D’andrea, G. Valentini, T. Rudge, S. Arridge, and A. Bassi, “Full-wavelet approach for fluorescence diffuse optical tomography with structured illumination,” Opt. Lett. 35(21), 3676–3678 (2010).
16. M. Schweiger, S. R. Arridge, M. Hiraoka, and D. T. Delpy, “The finite element method for the propagation of light in scattering media: Boundary and source conditions,” Med. Phys. 22(11), 1779–1792 (1995).
17. E. J. Candès and M. B. Wakin, “An introduction to compressive sampling,” IEEE Signal Process. Mag. 25(2), 21–30 (2008).
18. A. Jin, B. Yazici, A. Ale, and V. Ntziachristos, “Preconditioning of the fluorescence diffuse optical tomography sensing matrix based on compressive sensing,” Opt. Lett. 37(20), 4326–4328 (2012).
19. K. Schnass and P. Vandergheynst, “Dictionary preconditioning for greedy algorithms,” IEEE Trans. Signal Process. 56(5), 1994–2002 (2008).
20. T. Blumensath and M. E. Davies, “Gradient pursuits,” IEEE Trans. Signal Process. 56(6), 2370–2382 (2008). 21. D. Needell and J. Tropp, “CoSaMP: Iterative signal recovery from incomplete and inaccurate samples,” Appl.
Comput. Harmon. Anal. 26(3), 301–321 (2009). 22. D. L. Donoho, Y. Tsaig, I. Drori, and J. L. Starck, “Sparse solution of underdetermined linear equations by
Stagewise Orthogonal Matching Pursuit (StOMP),” IEEE Trans. Inf. Theory 58(2), 1094–1121 (2012). 23. D. Hyde, R. Schulz, D. Brooks, E. Miller, and V. Ntziachristos, “Performance dependence of hybrid x-ray
computed tomography/fluorescence molecular tomography on the optical forward problem,” J. Opt. Soc. Am. A 26(4), 919–923 (2009).
24. L. A. Feldkamp, L. C. Davis, and J. W. Kress, “Practical cone-beam algorithm,” J. Opt. Soc. Am. A 1(6), 612–619 (1984).
25. N. Ducros, A. Bassi, G. Valentini, G. Canti, S. Arridge, and C. D’Andrea, “Fluorescence molecular tomography of an animal model using structured light rotating view acquisition,” J. Biomed. Opt. 18(2), 020503 (2013).
26. H. Wang, D. B. Stout, and A. F. Chatziioannou, “Estimation of mouse organ locations through registration of a statistical mouse atlas with micro-CT images,” IEEE Trans. Med. Imaging 31(1), 88–102 (2012).
1. Introduction
X-ray luminescence computed tomography (XLCT) has been recently proposed as a new optical molecular imaging modality [1–6]. Compared with other optical molecular imaging, e.g., fluorescence molecular tomography (FMT) [7, 8] or bioluminescence tomography (BLT) [9, 10], an advantage of using XLCT is that autofluorescence can be avoided, which is helpful for improving the sensitivity of imaging. In addition, XLCT has the ability to image deeper since it use high-energy x-ray photons to excite the nanophosphors in tissues, which provides the potential for clinical applications. Further, with the advances in the x-ray-excitable nanophosphors [11–13], more applications can be expected in fundamental researches, pre-clinical and clinical experiments.
In recent years, many efforts have been made to develop new XLCT imaging systems and the corresponding reconstruction methods [1–6]. Using a narrow beam XLCT imaging system [1, 2], Xing et al. firstly reported the tomographic images obtained with XLCT. Further, by using a cone beam x-ray source as irradiation, Tian et al. designed a cone beam XLCT (CB-XLCT) imaging system and decreased the data acquisition time [4]. Recently, by applying compressive sensing (CS) technique to a single-view data acquired by the CB-XLCT imaging system, we further improved the imaging time resolution of XLCT and implement a fast three-dimensional (3-D) XLCT imaging [6]. It extended the application of XLCT for fast dynamic imaging study.
Nevertheless, challenges remain in the XLCT reconstruction method. The main reason is that the reconstruction of XLCT based on photon propagation model is ill-posed. When using the underdetermined data, especially using single-view data, the ill-posedness will further aggravate. To overcome these limitations, a simple and effective strategy is to make full use of the surface measurements in the reconstruction. It is worth nothing that in XLCT reconstruction, all measurements will be used to construct the weight matrix. As a result, the weight matrix, used to map the unknown nanophosphor distribution to known measurements, is generally larger, which will lead to a long computational time. In order to reduce the reconstruction time, while preserving the information content, the concept of data
#222090 - $15.00 USD Received 3 Sep 2014; revised 5 Oct 2014; accepted 6 Oct 2014; published 9 Oct 2014(C) 2014 OSA 1 November 2014 | Vol. 5, No. 11 | DOI:10.1364/BOE.5.003848 | BIOMEDICAL OPTICS EXPRESS 3849
compression (e.g., wavelet transform) has been proposed and applied to the reconstruction of optical tomography [14, 15]. As demonstrated by Ducros et al. [15], by encoding the charge coupled device (CCD) measurements with wavelet transform, they implement a fast reconstruction for FMT imaging. Despite of these successful applications, to our knowledge, the reconstruction study of XLCT based on wavelet transformation has not been reported previously.
In this paper, we propose a wavelet-based reconstruction approach for single-view XLCT imaging. On one hand, this method makes it feasible to use the full set of measurements produced by CCD in reconstruction processes. Hence, it is helpful for partially alleviating the severe ill-posedness of the reconstruction. On the other hand, utilizing the compression property of the wavelet transformation, the computational scale can be reduced. As a result, the computation time can be greatly shortened. To the best of our knowledge, this is the first time that wavelet transformation method is applied to XLCT imaging, especially to single-view XLCT imaging. To evaluate the performance of the proposed method, in vivo experiment was performed based on a cone beam XLCT imaging system. Here, the x-ray-excitable nanophosphor we employed was Gd2O3:Eu3+, due to its NIR emission wavelength. The experimental results indicate that the proposed method can accelerate image reconstruction in XLCT while preserving the spatial resolution of the reconstruction. The recovered location error is less than 0.8 mm and the reconstruction time is less than one second (when 16 wavelet components retained). Hence, the wavelet-based reconstruction provides an attractive method for dynamic XLCT imaging study.
The outline of this paper is as follows. In section 2, the methods and materials used are detailed. In section 3, the experimental results are shown. Finally, we discuss the results and draw conclusions in section 4.
2. Methods and materials
2.1 Imaging model
In x-ray imaging, x-rays are emitted from the x-ray source and travel through tissues. When x-ray is transported to nanophosphors in tissues, the nanophosphors will emit visible or near-infrared (NIR) light, which can be expressed as follows
( ) ( ) ( )X r r rηξ ρ= (1)
where ( )X r is the intensity of the emitted light, η is the light yield, ( )rρ is the
nanophosphor density at position r , 0
0( ) exp[ ( ) ]r
rr dξ ξ μ τ τ= − is the x-ray intensity with
0 ( )rξ being the x-ray source intensity at the initial position 0r and ( )μ τ being the x-ray attenuation coefficient which can be obtained from x-ray transmission data using an attenuation-based CT technique.
In optical imaging, the photon migration in biological tissues can be modeled using the diffusion equation coupled the Robin-type boundary condition [16], as follows
[ ( ) ( )] ( ) ( ) ( )
( )2 ( ) ( ) 0
aD r r r r r r
rD r r r
n
μ
γ
−∇ ⋅ ∇Φ + Φ = Ξ ∈ Ω
∂Φ + Φ = ∈ ∂Ω ∂
(2)
where Ω is the domain of the imaged object, ( )rΞ is the source term, ( )rΦ is the photon
density, ( )a rμ is the absorption coefficient, and ( )D r is the diffusion coefficient of the
tissue. n
denotes the outward normal vector to the boundary ∂Ω , and γ is a constant depending upon the optical reflective index mismatch at the boundary. In this paper, the diffusion equation is solved using the finite-element method.
#222090 - $15.00 USD Received 3 Sep 2014; revised 5 Oct 2014; accepted 6 Oct 2014; published 9 Oct 2014(C) 2014 OSA 1 November 2014 | Vol. 5, No. 11 | DOI:10.1364/BOE.5.003848 | BIOMEDICAL OPTICS EXPRESS 3850
After that, the measured luminescent photon on surface of the imaged object, due to an x-ray source radiation, can be formulated as follows
( ) ( ) ( ) ( )d r VQ r r r r drξ ηρ
∈= Θ Φ (3)
where ( )dQ r is the luminescent photon detected at location dr , ( )rρ is the nanophosphor
density to be reconstructed, V is the volume of interest, and Θ is a calibration parameter depends on generic system characteristics. By discretization, Eq. (3) can be rewritten in a matrix form as follows
Γ = Wρ (4)
where Γ denotes the luminescent measurements acquired from surface of the imaged object. W is a weight matrix used to map the unknown nanophosphor distribution to known measurements. Generally speaking, the size of weight matrix is large. For example, even if using a single-view image, if all measurements from the image are used in constructing the weight matrix, the size of the weight matrix is generally > 104 rows and 103 columns, which will lead to larger computational cost. To address the problem, in this paper, we propose an alternative approach which not only can use the full set of measurements produced by CCD, but also can reduce the computational scale. It is achieved by applying a wavelet transformation to the imaging Eq. (4).
2.2. Wavelet transformation for the imaging model
Let Q represent the two dimensional (2-D) luminescence image acquired by CCD with size
M N× and let Γ be the M N× column vector consisting of elements of Q . Let MH and
NH be the 1-D wavelet transform matrix with size M M× and N N× , respectively. The
wavelet transform of the 2-D image Q can be described by 1-D notation, as follows
( )M N= = ⊗Γ HΓ H H Γ (5)
where ⊗ denotes the Kronecker product and Γ is a M N× column vector consists of wavelet transformation coefficients.
x yn n= ⊗H H H is the ( ) ( )M N M N× × × wavelet
transformation matrix of the 2-D image Q , where each row vector corresponding to a transformation basis vector. Considering that Battle-Lemarié wavelet transform has been proved to be particularly suited to optical imaging [14, 15], in this paper, the Battle-Lemarié wavelet transform is used. The algorithm (Matlab version used here) can be downloaded from http://www.tsc.uvigo.es/~wavelets/matlab_uvi_wave.html.
Based on the compression property of the wavelet transformation, here, we retain the K largest absolute components in the transformed images while discard the other components. This results in the compressed measurements (image) #Γ , as follows
=# #KΓ H Γ (6)
where the columns of matrix #KH contain the K retained basis vector.
Further, to reduce the scale of inverse problem of XLCT, we re-generate the weight matrix #W , as follows
T( )k k=w ξ φ (7)
where kw is the kth row of #W , is the entrywise (Hadamard) product, and T represents
transposition operation. The photon density vector , {1, 2,..., }k k K∈φ is obtained by solving
#222090 - $15.00 USD Received 3 Sep 2014; revised 5 Oct 2014; accepted 6 Oct 2014; published 9 Oct 2014(C) 2014 OSA 1 November 2014 | Vol. 5, No. 11 | DOI:10.1364/BOE.5.003848 | BIOMEDICAL OPTICS EXPRESS 3851
the diffusion Eq. (2) combined with the corresponding detector patterns , {1, 2,..., }k k K∈d .
Here, kd is generated by the corresponding column of matrix #KH . When calculating kφ , the
detector pattern kd is used as source terms ( )rΞ in the diffusion equation.
After obtaining the compressed measurements #Γ and the compressed weight matrix #W , the imaging model based on the wavelet transformation is generated as follows
# .#Γ = W ρ (8)
Compared with the number of rows from the weight matrix W appeared in Eq. (4) ( M N× ),
the number of rows in #W has been reduced to K . Note that K M N× . As a result, the computational time can be greatly reduced.
2.3. Reconstruction for XLCT
Due to the high scattering of light in biological tissues and the use of underdetermined data (single-view data), the reconstruction of XLCT is ill-posed. As a result, it is impractical to solve ρ directly from Eq. (8). Recently, compressed sensing has emerged as an attractive method for reconstruction of images from incomplete data sets. Based on the technique, it is possible to implement the reconstruction of XLCT with fewer measurements. In detail, the CS theory asserts that the signal (image), i.e., ρ , can be efficiently recovered provided that
the following conditions hold [17]: 1) The image vector ρ is sparse or can be sparsified using
a known orthogonal transformation. Sparsity of the vector ρ is true for many XLCT applications, because the nanophosphors used in XLCT imaging are designed to preferentially accumulate in specific areas of interest such as tumors (cancerous) tissue, and these areas are usually very small and sparse. 2) In order to recover a good estimate of ρ from the
incomplete measurements #Γ , the measurement (weight) matrix #W should satisfy the
restricted isometry property (RIP). In other words, the sensing matrix #W should be as incoherent (orthogonal) as possible. However, for the XLCT ill-posed inverse problem, the column vectors (so-called atoms) of the sensing matrix are generally highly correlated, which will reduce the recovery performance. To improve the RIP, i.e., to recover the sparse signal accurately and stably, here, a preconditioning matrix method is used [18, 19]. In detail, by multiplying both sides of Eq. (8) by a preconditioning matrix ℑ , we obtain
#ℑ ℑ#Γ = W ρ (9)
Let us define # #pre =W Wℑ and =# #
preΓ Γℑ . Then, Eq. (9) is changed to
# #pre pre=Γ W ρ (10)
where #preW and #
preΓ is the preconditioned forward matrix and the preconditioned
measurements, respectively. It is well known that the RIP can be affected by preconditioning. However, optimizing ℑ to have the best RIP is a combinatorial optimization problem. Following an approach similar to the one described in [18], in this paper, the preconditioning matrix ℑ is generated as follows
1/ 2( )λ −= +T TΛΛ I Uℑ (11)
where TUΛV is the singular value decomposition (SVD) of the forward matrix #W , I is an
identity matrix, λ is a regularization parameter. After preconditioning, the nanoparticle density distribution ρ can be recovered by solving
the following optimization problem
#222090 - $15.00 USD Received 3 Sep 2014; revised 5 Oct 2014; accepted 6 Oct 2014; published 9 Oct 2014(C) 2014 OSA 1 November 2014 | Vol. 5, No. 11 | DOI:10.1364/BOE.5.003848 | BIOMEDICAL OPTICS EXPRESS 3852
# #
0min . . pre pres t
ρΓ =ρ W ρ (12)
where 0
ρ denotes the 0 -norm of ρ , which simply counts the number of nonzero in ρ .
The main propose of this paper is not about efficient solver of Eq. (12). Considering the time consumption of reconstruction, in this paper, we use a standard orthogonal least squares (OLS) method for the solver Eq. (12). The details of the process can be found in [20]. In addition, we also point out that there are many methods [21, 22] for addressing the optimization problem. These methods can be directly used to further improve the optimization efficiency.
2.4. The imaging system
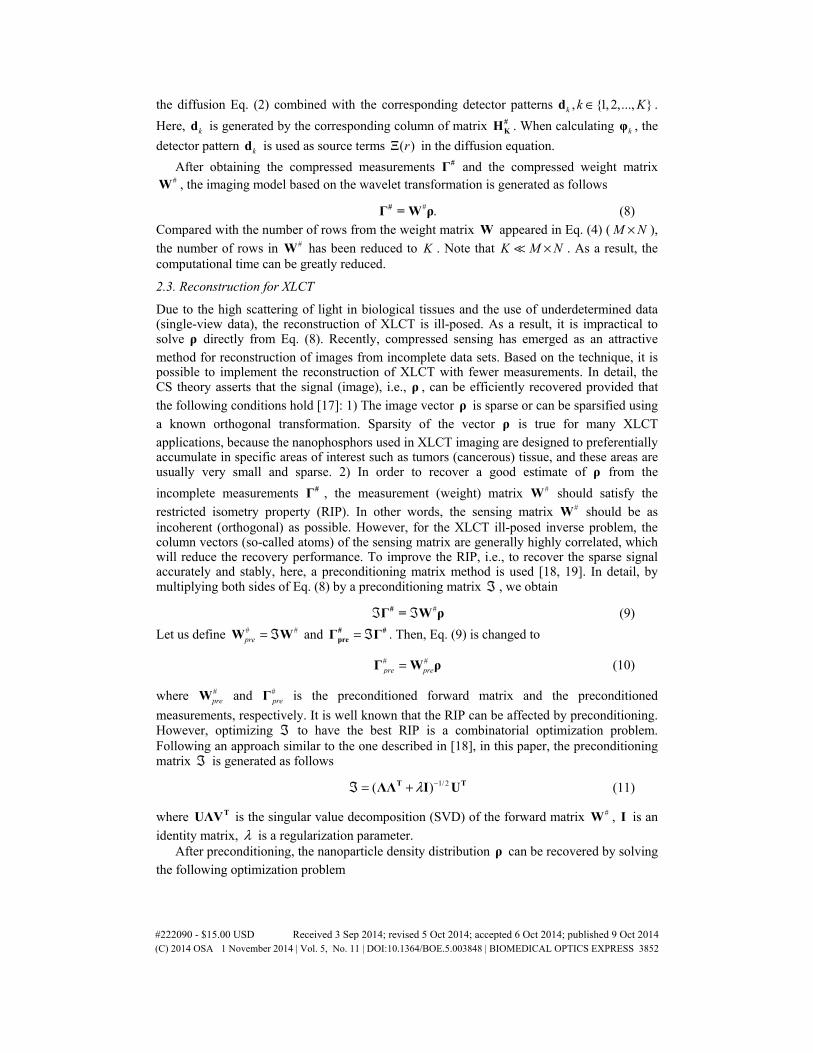
The imaging system used in this work was a hybrid system, which included a custom-made XLCT prototype and a Micro-XCT prototype integrated on an optical bench, similar to that described in Liu et al [6]. As shown in Fig. 1, the XLCT system was placed vertically on the optical bench, while the micro-XCT system was placed horizontally. These two subsystems used a communal rotational stage, which allowed rotation of the imaged object around its longitudinal axis for full-angle projection acquisitions. Note that in this work, only one luminescence projection image need to be used to perform 3-D XLCT imaging. That was, for XLCT imaging, the imaged object (mouse) need not to be rotated. Hence, the rotation stage was unnecessary for XLCT imaging, which was only needed in XCT imaging. In addition, for the XLCT imaging, all the components must be placed in a light-tight black box to avoid the environmental light interference during sampling.
Fig. 1. The custom-made cone beam XLCT imaging system.
In detail, the custom-made XLCT imaging system consisted of a cone beam x-ray source, a CMOS x-ray detector panel, and an electron-multiplying CCD (EMCCD) camera. The x-ray source used in the system was a microfocus x-ray source with maximal power of 80 W (Oxford Instrument, U.K.) and could irradiate cone beam x-rays. It was placed 26.5 cm away from the surface of the imaged object. When the cone beam x-ray beam irradiated the tissue, the nanophosphors in the imaged object would be excited to emit visible-to-near infrared light. The luminescent photons emitted from nanophosphors were imaged from the surface of the imaged object by using an EMCCD camera (iXon DU-897, Andor, U.K.) coupled with a Nikkor 50-mm f/1.8D lens (Nikon, Melville, NY). To minimize the number of unwanted scattered photons entering the detector, the cooled EMCCD was mounted at a 90° angle (perpendicular) to the incident x-ray beam, as shown in Fig. 1. Further, to protect the EMCCD chip from x-ray irradiation, a 4 mm depth of boxed shaped lead shield with an opening front of 70 mm diameter was used.
#222090 - $15.00 USD Received 3 Sep 2014; revised 5 Oct 2014; accepted 6 Oct 2014; published 9 Oct 2014(C) 2014 OSA 1 November 2014 | Vol. 5, No. 11 | DOI:10.1364/BOE.5.003848 | BIOMEDICAL OPTICS EXPRESS 3853
The Micro-XCT imaging was performed by employing the above x-ray tube incorporating a CMOS x-ray flat-panel detector (2923, Dexela, U.K.) with pixel size of 74.8 mμ covering a
3888 3072× digital image matrix. The x-ray detector was placed behind the imaged object along the beam direction to measure transmission x-ray radiation. For XCT reconstruction, 360 x-ray projection images need to be collected by the x-ray detector panel and the reconstruction was performed by Feldkamp–Davis–Kress (FDK) method.
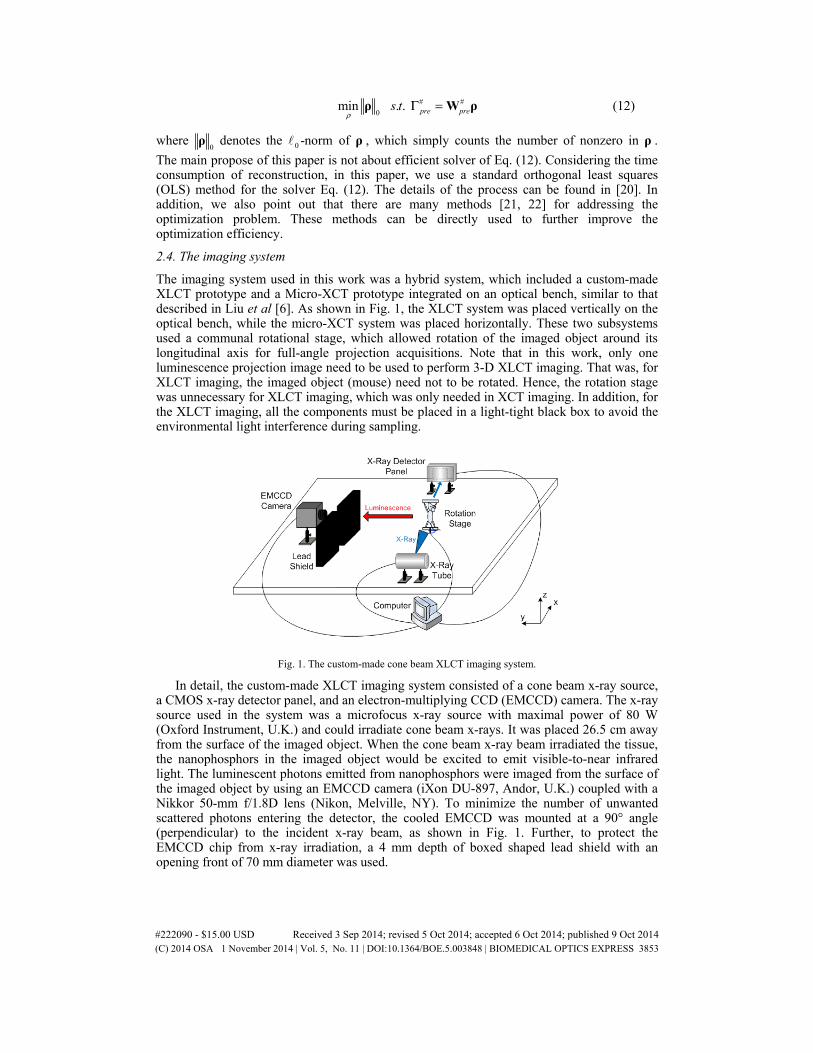
Figure 2 shows the scheme of the acquisition and reconstruction procedures of the proposed method.
Fig. 2. Scheme of the acquisition and reconstruction procedures of the proposed method. Note that in the XLCT reconstruction, only single-view data need to be acquired and then used to perform 3-D XLCT imaging. In the experiments, the single-view luminescence image was acquired by a cone beam XLCT (CB-XLCT) imaging system. For XLCT imaging, the free-
space propagation mapping from the boundary detector ( dr ) of the imaged object (mouse) to
the EMCCD was considered as an orthographic projection. Here, the retained detector pattern
kd was generated based on the corresponding column of compressed wavelet transformation
matrix #
KH . The photon density vector kφ was obtained by solving the diffusion Eq. (2),
where the detector pattern kd was used as source terms ( )rΞ in the diffusion equation.
2.5. In vivo imaging protocol
All animal studies were conducted under the protocol approved by the Institutional Animal Care of the Fourth Military Medical University. In detail, one female, six-week-old nude mouse (~18 g) was used in the experiment. The mouse was anesthetized by an abdominal cavity injection of 1.5% Pelltobarbitalum Natricum (80 mg/kg body weight). A transparent tube (inner diameter ~2.2 mm) filled with the x-ray-excitable nanophosphor was implanted into the body of nude mouse as luminescence target, to simulate tumor applications. The height of the nanophosphor contained in the transparent tube was ~3.3 mm. That is, the nanophosphor contained in the tube was approximately a cylinder, with 2.2 mm diameter and 3.3 mm height. Here, Gd2O3:Eu3+ with a density of 7.4 g/mL was used as the x-ray-excitable nanophosphor, due to its NIR emission wavelength.
When collecting luminescence image, the x-ray source voltage and current were set to 50kV and 1mA, respectively. The integrating time of EMCCD was set to 20 s, the EM gain was set to 260, and the EMCCD binning was set to 1 1× . In this paper, only one luminescence projection image (perpendicular to the incident x-ray beam) was collected to perform 3-D XLCT tomographic reconstruction.
#222090 - $15.00 USD Received 3 Sep 2014; revised 5 Oct 2014; accepted 6 Oct 2014; published 9 Oct 2014(C) 2014 OSA 1 November 2014 | Vol. 5, No. 11 | DOI:10.1364/BOE.5.003848 | BIOMEDICAL OPTICS EXPRESS 3854
When collecting x-ray images, the x-ray source voltage and current were set to 50kV and 1mA, respectively. Full-angle x-ray projection images were obtained with a step of 1 degree, resulting in 360 angular positions. The integrating time of each projection was 300 ms.
In this paper, the reconstructed slices of XLCT and XCT were co-registered by a coordinate system centered to the axis of rotation. To provide the height information for co-registration, a steel anchor point, which could be imaged in both imaging systems, was plastered on the mouse surface.
3. Results
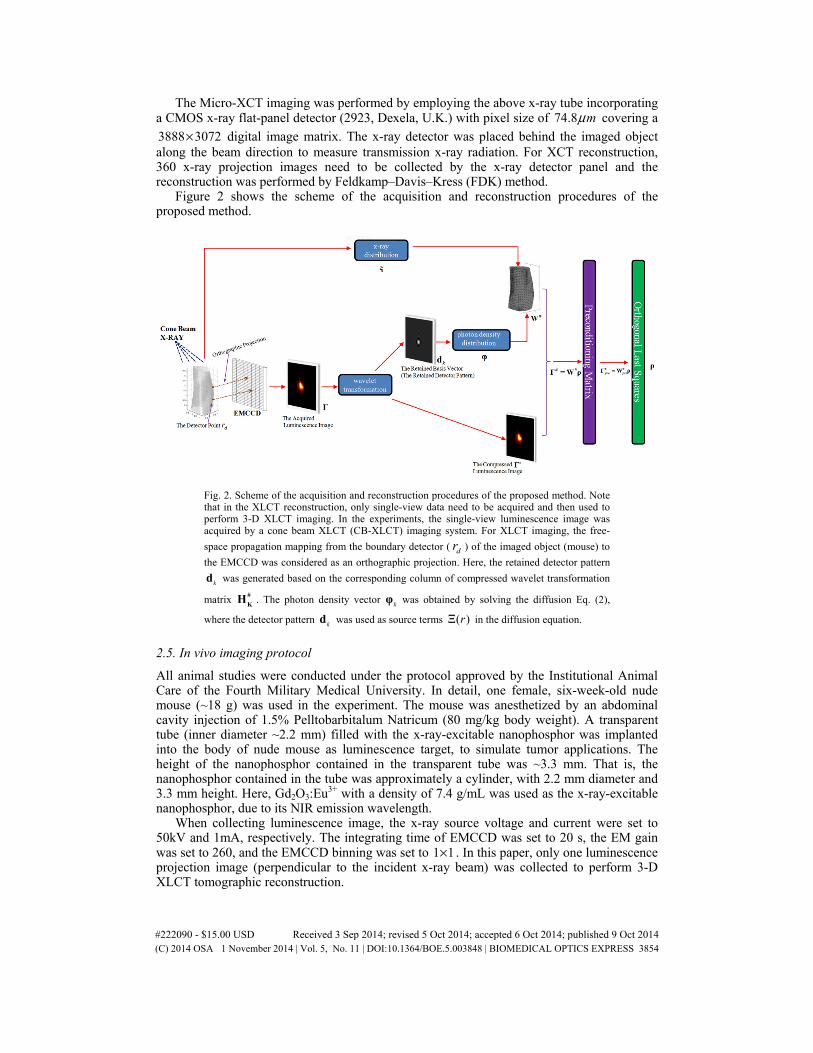
We first investigate the compression ability of Battle-Lemarié wavelet transformation for the acquired luminescence image. Figure 3(a) shows the acquired luminescence image, which was obtained by using a cone beam x-ray source as irradiation and a highly sensitive EMCCD camera as detection. Figure 3(b) shows the compressed image, which was obtained by applying Battle-Lemarié wavelet transformation to original image and then retaining only
256K = wavelet components. The retained wavelet basis vector (detector pattern) is shown in Figs. 3(c) and 3(d). The results indicate that even if only 256 wavelet components are retained, there are only small differences between the original and compressed images.
Fig. 3. Pictogram of how wavelet transformation is used in the proposed method. (a) The acquired luminescence image, which was obtained by using a cone beam x-ray source as irradiation and a highly sensitive EMCCD camera as detection. The hot spots produced by secondary x-rays had been removed from the acquired image. (b) The compressed image, which was obtained by applying Battle-Lemarié wavelet transformation to original image and then retaining only 256K = wavelet components. The results show that there are only small differences between the original and compressed images. (c) and (d) The retained wavelet basis vector (detector pattern).
Next, we perform 3-D reconstructions according to the scheme previously described. Figure 4 shows the reconstructed results in in vivo experiment, obtained from the proposed wavelet-based single-view method with the 256K = largest absolute components retained. Figure 4(a) shows the reconstructed XCT tomographic image. Figure 4(b) shows the reconstructed XLCT tomographic image. The fusion image of the XLCT and XCT is shown in Fig. 4(c). Further, Figs. 4(d) and 4(e) show the 3-D visualization results of the reconstructed XLCT tomographic images from different views, which reflect the 3-D location information of the tube filled with Gd2O3:Eu3+ in the mouse. Note that in the XLCT reconstruction, only single-view data [see Fig. 3(a)] was used. In detail, for the reconstruction, the mouse was discretized into 3945 nodes and 17044 tetrahedral elements. Referring to [23], the homogeneous optical properties ( -1=0.3 cmaμ and ' -110 cmsμ = ) were used in the reconstruction. Reconstructions were performed using OLS method. For the XCT imaging, the reconstruction was performed using FDK method [24]. In this paper, the diffusion equation was solved using COMSOL Multiphysics 3.3 (COMSOL, Inc., Burlington, MA, USA). All the algorithms were coded using Matlab 7.3 (MathWorks, Inc., Natick, MA, USA).
#222090 - $15.00 USD Received 3 Sep 2014; revised 5 Oct 2014; accepted 6 Oct 2014; published 9 Oct 2014(C) 2014 OSA 1 November 2014 | Vol. 5, No. 11 | DOI:10.1364/BOE.5.003848 | BIOMEDICAL OPTICS EXPRESS 3855
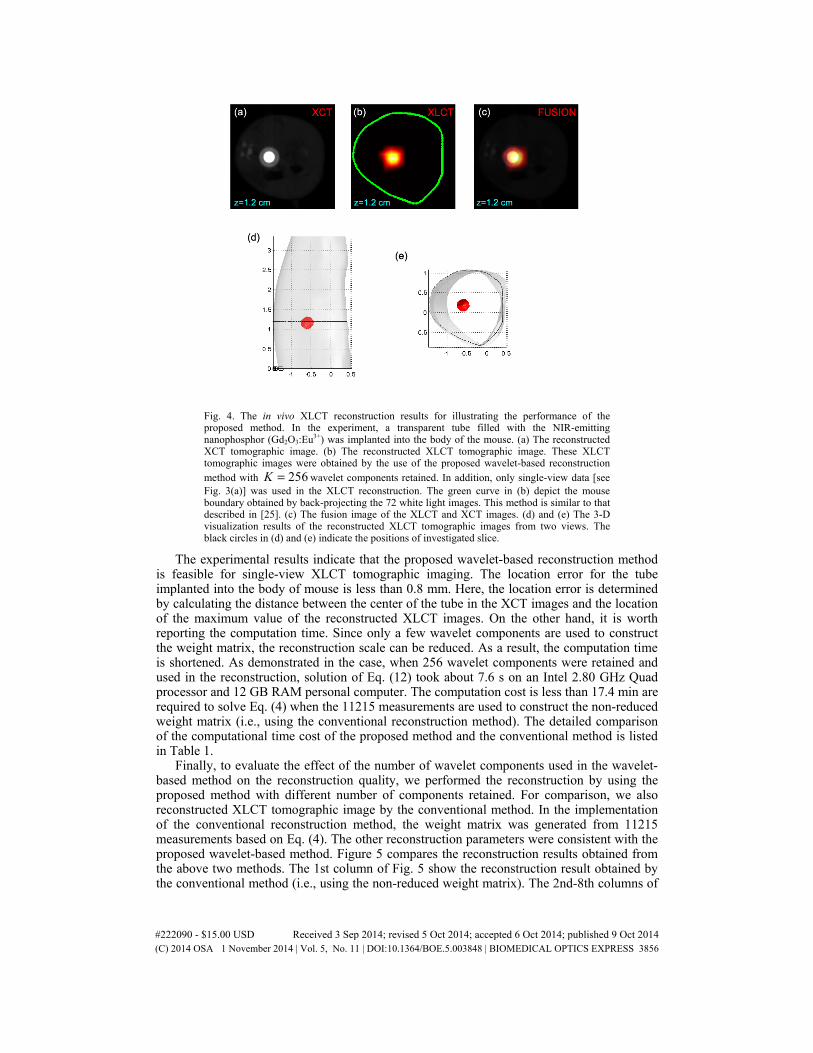
Fig. 4. The in vivo XLCT reconstruction results for illustrating the performance of the proposed method. In the experiment, a transparent tube filled with the NIR-emitting nanophosphor (Gd2O3:Eu3+) was implanted into the body of the mouse. (a) The reconstructed XCT tomographic image. (b) The reconstructed XLCT tomographic image. These XLCT tomographic images were obtained by the use of the proposed wavelet-based reconstruction method with 256K = wavelet components retained. In addition, only single-view data [see Fig. 3(a)] was used in the XLCT reconstruction. The green curve in (b) depict the mouse boundary obtained by back-projecting the 72 white light images. This method is similar to that described in [25]. (c) The fusion image of the XLCT and XCT images. (d) and (e) The 3-D visualization results of the reconstructed XLCT tomographic images from two views. The black circles in (d) and (e) indicate the positions of investigated slice.
The experimental results indicate that the proposed wavelet-based reconstruction method is feasible for single-view XLCT tomographic imaging. The location error for the tube implanted into the body of mouse is less than 0.8 mm. Here, the location error is determined by calculating the distance between the center of the tube in the XCT images and the location of the maximum value of the reconstructed XLCT images. On the other hand, it is worth reporting the computation time. Since only a few wavelet components are used to construct the weight matrix, the reconstruction scale can be reduced. As a result, the computation time is shortened. As demonstrated in the case, when 256 wavelet components were retained and used in the reconstruction, solution of Eq. (12) took about 7.6 s on an Intel 2.80 GHz Quad processor and 12 GB RAM personal computer. The computation cost is less than 17.4 min are required to solve Eq. (4) when the 11215 measurements are used to construct the non-reduced weight matrix (i.e., using the conventional reconstruction method). The detailed comparison of the computational time cost of the proposed method and the conventional method is listed in Table 1.
Finally, to evaluate the effect of the number of wavelet components used in the wavelet-based method on the reconstruction quality, we performed the reconstruction by using the proposed method with different number of components retained. For comparison, we also reconstructed XLCT tomographic image by the conventional method. In the implementation of the conventional reconstruction method, the weight matrix was generated from 11215 measurements based on Eq. (4). The other reconstruction parameters were consistent with the proposed wavelet-based method. Figure 5 compares the reconstruction results obtained from the above two methods. The 1st column of Fig. 5 show the reconstruction result obtained by the conventional method (i.e., using the non-reduced weight matrix). The 2nd-8th columns of
#222090 - $15.00 USD Received 3 Sep 2014; revised 5 Oct 2014; accepted 6 Oct 2014; published 9 Oct 2014(C) 2014 OSA 1 November 2014 | Vol. 5, No. 11 | DOI:10.1364/BOE.5.003848 | BIOMEDICAL OPTICS EXPRESS 3856
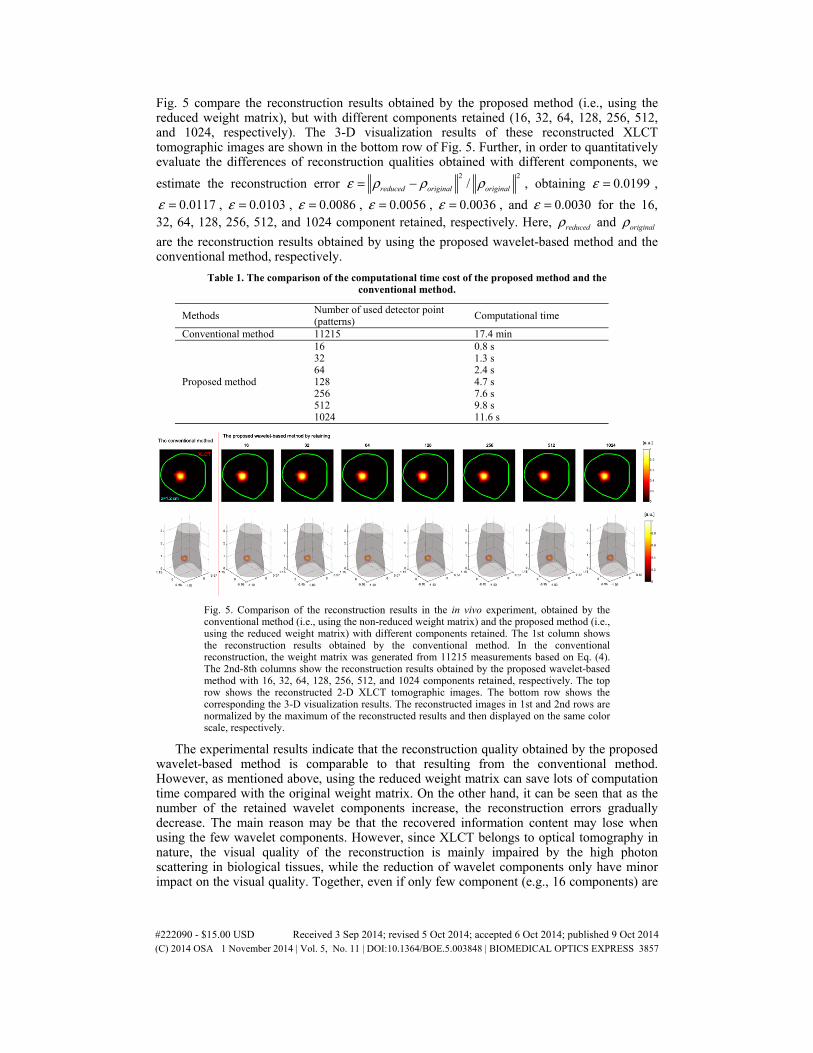
Fig. 5 compare the reconstruction results obtained by the proposed method (i.e., using the reduced weight matrix), but with different components retained (16, 32, 64, 128, 256, 512, and 1024, respectively). The 3-D visualization results of these reconstructed XLCT tomographic images are shown in the bottom row of Fig. 5. Further, in order to quantitatively evaluate the differences of reconstruction qualities obtained with different components, we
estimate the reconstruction error 2 2
/reduced original originalε ρ ρ ρ= − , obtaining 0.0199ε = ,
0.0117ε = , 0.0103ε = , 0.0086ε = , 0.0056ε = , 0.0036ε = , and 0.0030ε = for the 16, 32, 64, 128, 256, 512, and 1024 component retained, respectively. Here, reducedρ and originalρ
are the reconstruction results obtained by using the proposed wavelet-based method and the conventional method, respectively.
Table 1. The comparison of the computational time cost of the proposed method and the conventional method.
Methods Number of used detector point (patterns)
Computational time
Conventional method 11215 17.4 min
Proposed method
16 0.8 s32 1.3 s64 2.4 s128 4.7 s256 7.6 s512 9.8 s1024 11.6 s
Fig. 5. Comparison of the reconstruction results in the in vivo experiment, obtained by the conventional method (i.e., using the non-reduced weight matrix) and the proposed method (i.e., using the reduced weight matrix) with different components retained. The 1st column shows the reconstruction results obtained by the conventional method. In the conventional reconstruction, the weight matrix was generated from 11215 measurements based on Eq. (4). The 2nd-8th columns show the reconstruction results obtained by the proposed wavelet-based method with 16, 32, 64, 128, 256, 512, and 1024 components retained, respectively. The top row shows the reconstructed 2-D XLCT tomographic images. The bottom row shows the corresponding the 3-D visualization results. The reconstructed images in 1st and 2nd rows are normalized by the maximum of the reconstructed results and then displayed on the same color scale, respectively.
The experimental results indicate that the reconstruction quality obtained by the proposed wavelet-based method is comparable to that resulting from the conventional method. However, as mentioned above, using the reduced weight matrix can save lots of computation time compared with the original weight matrix. On the other hand, it can be seen that as the number of the retained wavelet components increase, the reconstruction errors gradually decrease. The main reason may be that the recovered information content may lose when using the few wavelet components. However, since XLCT belongs to optical tomography in nature, the visual quality of the reconstruction is mainly impaired by the high photon scattering in biological tissues, while the reduction of wavelet components only have minor impact on the visual quality. Together, even if only few component (e.g., 16 components) are
#222090 - $15.00 USD Received 3 Sep 2014; revised 5 Oct 2014; accepted 6 Oct 2014; published 9 Oct 2014(C) 2014 OSA 1 November 2014 | Vol. 5, No. 11 | DOI:10.1364/BOE.5.003848 | BIOMEDICAL OPTICS EXPRESS 3857
retained in the reconstruction, the reconstruction error is less than 2%. As a result, it is hard to find visual differences in the reconstruction images obtained by the proposed method with more components retained. As shown in the 2nd and 8th columns Fig. (5), the XLCT images obtained by using 1024 and 16 retained wavelets are almost identical. But, the solution time for 1024 components is approximately 11.6 s falling to around 0.8 s for 16 components, with a smaller number of coefficients taking less computation time (see Table 1).
4. Discussion and conclusion
Single-view XLCT imaging allows fast and non-invasively resolving the 3-D distribution of x-ray-excitable nanophosphors within small animal in vivo, which is helpful for drug delivery research. However, the single-view reconstruction suffers from a severe ill-posed problem because only one angle data is used in the reconstruction. To address the problem, in this paper, we proposed a wavelet-based reconstruction approach and then evaluated its performance using in vivo experiment. In particular, the compressive sensing technique, incorporating a preconditioning matrix method, was used in the reconstruction to further eliminate the ill-posedness of the reconstruction.
It was observed from the in vivo experimental results that the x-ray-excitable nanophosphor (Gd2O3:Eu3+) implanted into the body of nude mouse could be located from the reconstructed XLCT images (see Fig. 4). The location errors were less than 0.8 mm. Moreover, we also found that the number of the retained wavelet components had slight effect on the single-view XLCT reconstruction results (see Fig. 5). It further validated the robustness of the proposed method. On the other hand, since only a few wavelet components were used to construct the weight matrix, the reconstruction time was greatly reduced compared with the conventional method. For example, when 16 wavelet components were retained and used in the reconstruction, the reconstruction time was less than one second (see Table 1). Based on these experimental results, we believe that the proposed wavelet-based reconstruction provides an attractive method for dynamic XLCT imaging study.
It should be noted that in this study, due to the ill-posedness of the reconstruction based on photon propagation model, the spatial resolution of the proposed reconstruction is relatively lower than that of narrow beam XLCT [1, 2]. In addition, in this work, the cone beam x-ray source is considered as a uniform illumination (irradiation) pattern. The structured illumination technique can be used and expected to further improve the spatial resolution of XLCT. Further, we also admit that the density (concentration) of nanophosphor is not quantitatively recovered and the optimal projection for single-view reconstruction is also not determined in this work. It should also be noted that in in vivo experiment, during the interval between the white light image and XCT image collections, some factors (e.g., physiological status of animals and experimental operations) may affect the position of the imaged animal. As a result, this may further influence the registration accuracy. The use of better registration methods [26] may reduce such differences and further improve the imaging performance of XLCT. Finally, the specificity, sensitivity, and toxicity of the nanophosphor in biological tissues need to be thoroughly considered in in vivo experiments. Systematic studies will be investigated in our future work.
In conclusion, by applying wavelet transform to a single-view data, we implement a fast reconstruction of high quality. The recovered location error is less than 0.8 mm and the reconstruction time is less than one second (when 16 wavelet components retained). In future, we will focus on applying the proposed wavelet-based reconstruction method and cone beam XLCT imaging system to image fast biological distributions of the NIR-emitting nanophosphors in vivo.
Acknowledgments
This work is supported by the National Natural Science Foundation of China under Grant No. 81371604, 81230035, 81071220, and 61372046; the Shaanxi Natural Science Foundation under Grant No. 2013JM4008.
#222090 - $15.00 USD Received 3 Sep 2014; revised 5 Oct 2014; accepted 6 Oct 2014; published 9 Oct 2014(C) 2014 OSA 1 November 2014 | Vol. 5, No. 11 | DOI:10.1364/BOE.5.003848 | BIOMEDICAL OPTICS EXPRESS 3858