a welfare state paradox: state interventions and women’s...
TRANSCRIPT

1910 AJS Volume 111 Number 6 (May 2006): 1910–49
� 2006 by The University of Chicago. All rights reserved.0002-9602/2006/11106-0007$10.00
A Welfare State Paradox: StateInterventions and Women’s EmploymentOpportunities in 22 Countries1
Hadas Mandel and Moshe SemyonovTel Aviv University
This study explores the role played by the welfare state in affectingwomen’s labor force participation and occupational achievement.Using data from 22 industrialized countries, the authors examinethe consequences of state interventions for both women’s employ-ment patterns and gender inequality in occupational attainment.The findings reveal a twofold effect: developed welfare states fa-cilitate women’s access into the labor force but not into powerfuland desirable positions. Specifically, nations characterized by pro-gressive and developed welfare policies and by a large public servicesector tend to have high levels of female labor force participation,along with a high concentration of women in female-typed occu-pations and low female representation in managerial occupations.The findings provide insights into the social mechanisms underlyingthe relations between welfare states’ benefits to working mothersand women’s participation and achievements in the labor market.
In recent decades, an increasing number of researchers have begun study-ing the role played by the state in affecting women’s economic activitiesand labor market positions. The growing research on this topic points tothe role of the state as legislator and implementer of social and familyservices, as well as to the role of the welfare state as an employer. Thesetwo bodies of literature operate under the premise that the welfare state,whether as a legislator or as an employer, strongly affects women’s par-ticipation rates and economic opportunities. More specifically, researchers
1 We would like to thank Yasmin Alkalay, Richard Barrett, William Bridges, YinonCohen, Micha Mandel, Anthony M. Orum, and Michael Shalev for their helpful com-ments. An early version of this paper was presented at the meeting of the ISA ResearchCommittee on Social Stratification and Mobility, August 2005, Los Angeles. Directcorrespondence to Hadas Mandel, Department of Sociology and Anthropology, TelAviv University, Israel. E-mail: [email protected]

Women’s Employment
1911
have suggested that progressive social policies and a large public servicesector are likely to provide women with better opportunities to join theeconomically active labor force, and, indeed, to increase women’s eco-nomic activities (see Rein 1985; Esping-Andersen 1990; Alestalo, Bislev,and Furaker 1991; Kolberg 1991; Kolberg and Andersen 1991; Daly 2000;Korpi 2000; Orloff 2002; Gornick and Meyers 2003).
Whereas the impact of the welfare state on women’s labor force par-ticipation is widely studied, little research has further investigated theways that state interventions affect women’s occupational opportunities.2
To address this lacuna, we seek in this article to examine systematicallythe impact of the welfare state on women’s integration into the labormarket, their working time, and their opportunities to attain powerfuland elite occupational positions. We argue that the state, in its roles as alegislator and implementer of family policies, and in its role as an em-ployer, creates sheltered labor markets for women—labor markets inwhich women’s rights are protected and secured. By so doing the welfarestate contributes to increased women’s labor force participation, enhancesthe economic independence of women and mothers, and strengthens theirpower within the household and in society at large (i.e., Sorensen andMcLanahan 1987; Hobson 1990; Bianchi et al. 1999). However, these stateactions do not enhance women’s occupational and economic achieve-ments, since none of them seriously challenge the traditional distributionof market-family responsibilities between men and women. On the con-trary, adjusting the demands of employment to women’s home duties orallowing working mothers reduced working hours and long leaves fromwork are likely to preserve women’s dominant roles as mothers and wives.As such, these interventions impede women’s abilities to compete suc-cessfully with men for powerful and lucrative occupational positions.3
In what follows we first develop the theoretical rationale in which ourarguments are embodied. Next, we test our theoretical expectations withdata for 22 industrialized countries, and, finally, we discuss the findingsin light of sociological theories on welfare-state policies and gender in-equality. By doing so, we will be in a position to better understand theways through which the welfare state affects the economic participationand occupational attainment of women.
2 For a notable exception see the recent study by Chang (2004) of the impact of statepolicies on gender occupational segregation in less developed countries.3 See Mandel and Semyonov (2005) for the consequences of these impediments forgender earnings gaps.
American Journal of Sociology
1912
THEORETICAL CONSIDERATIONS
The Welfare State and Women’s Labor Force Participation
The massive entrance of women into the labor markets of Western so-cieties in recent decades has been affected not only by market forces butalso by state interventions. The impact of the state on women’s employ-ment opportunities is multidimensional and can be attributed to a seriesof factors, especially to the roles of the state as a legislator, as a providerof social services, and as an employer. The extensive literature on thetopic is generally divided into two separate bodies of research, one thatfocuses on the role of the state as an implementer of family services(Gauthier 2000; OECD 2001; Kamerman 2000; Orloff 2002; Wilensky2002; Gornick and Meyers 2003; Kenworthy, forthcoming), and one thatfocuses on the role of the welfare state as an employer (e.g., Rein 1985;Rose 1985; OECD 1987; Cusack, Notermans, and Rein 1989; Esping-Andersen 1990; Alestalo et al. 1991; Kolberg 1991; Kolberg and Esping-Andersen 1991).
In this study we combine the two bodies of research in order to bettercapture the effects of state interventions on women’s employment op-portunities. Specifically, we focus on the role of the state as a legislatorand as an activator of programs aimed to decrease the conflict betweenfamily responsibilities and work, in addition to its role as an employer.For the sake of simplicity we will use the term “welfare state” to refer toall three roles.
In its role as a legislator and family service provider, the state imple-ments and activates a variety of support systems and provides servicesand benefits targeted mostly at families with children. These programsand benefits, often referred to in the literature as “family policies,” reflectboth the state’s responsibility for the care of young children and its effortto facilitate employment for mothers, by providing women with the nec-essary conditions to combine work with family responsibilities (Kamer-man 1991, 2000; Gauthier 2000; OECD 2001; Orloff 2002; Wilensky 2002;Gornick and Meyers 2003; Kenworthy, forthcoming).
Comparative studies that focus on the relations between family policiesand women’s labor force participation find a positive correlation betweenthe two (Esping-Andersen 1999; Daly 2000; Korpi 2000; Orloff 2002; Gor-nick and Meyers 2003; Kenworthy, forthcoming). For example, in theScandinavian countries, which represent the social democratic welfareregime, women’s high levels of employment are supported by generousfamily policies in the form of universal benefits to working mothers. Thesecharacteristics stand in contrast to the other welfare regimes (i.e., liberalor market economies and the conservative welfare regime), in which fam-ily policies are less developed and women’s labor force participation rates

Women’s Employment
1913
are usually lower. The reduced role of the state as a family service providerin the latter regimes leaves a greater role either to the family itself or tothe private market (Esping-Andersen 1990, 1999).
Variation in the scope of family policies is evident across countries, aswell as across welfare regimes. While ranking countries on continuousscales of family policies, Gornick and her associates (e.g., Gornick, Meyers,and Ross 1997; Gornick and Meyers 2003) found a positive and strongassociation between family policy indices and mothers’ rates of labor forceparticipation, reaffirming the argument that such state interventions arelikely to facilitate women’s, especially mothers’, economic activity.
A different body of research links women’s economic activities to therole of the welfare state as an employer. Specifically, the rise of the welfarestate has led to a substantial expansion of public employment, especiallyin health, education, and social services. As a provider of public services—a sector overwhelmingly dominated by women—the state has become amajor employer of women. By offering a large supply of care and servicejobs (which are traditionally designed for women and which partly replacetheir care duties at home) along with convenient working conditions, thepublic service sector facilitates women’s entry into the labor force byreducing their domestic responsibilities on the one hand, and by supplyingthem with new job opportunities on the other hand (e.g., Rein 1985; Rose1985; OECD 1987; Cusack, Notermans, and Rein 1989; Esping-Andersen1990; Alestalo et al. 1991; Kolberg 1991; Kolberg and Andersen 1991).
The Welfare State and Gender Occupational Inequality
Whereas researchers agree that both the development of family policiesand the extension of public services enhance women’s opportunities tobecome economically active, we know very little about the implicationsof the welfare state for women’s occupational opportunities. In whatfollows we argue that state activities, while facilitating women’s entranceinto the labor market, do not facilitate their entry into high-authority andelite positions. Rather, the very same characteristics—generous familypolicies and a large public service sector—seem to reproduce the gendereddivision of labor and, in effect, decrease women’s chances of joiningdesirable occupational positions. Put differently, state efforts to facilitateand protect women’s work may result in lowering and hardening whatis usually referred to in the sociological literature as “the glass ceiling.”
State-provided benefits can affect women’s occupational opportunitiesand influence their working patterns in a variety of ways. Paid maternityleaves, for example, although often viewed as paving the way for mothersback to the labor market, and thus strengthening women’s ties to thelabor market (OECD 2001), actually remove mothers from paid employ-
American Journal of Sociology
1914
ment for several months. In countries where family policies are partic-ularly generous (e.g., Finland and Sweden) paid maternity leave can lastfor an entire year, and in many other places (e.g., Austria, Belgium, France,Germany, Hungary, Italy, Denmark, and Norway) paid maternity leavecan be extended with reduced compensation for up to two years and evenlonger (Kamerman 2000, table 2; Ferrarini 2003, table 2.3). Although paidmaternity leave serves as a device through which women’s employmentrights are protected and secured, a long absence from paid employmentmay discourage employers from hiring women to positions of authorityand power and thus handicap their ability to compete successfully withmen for elite positions.
Likewise, institutional work arrangements, such as regulations man-dating reduced working hours, can further depreciate women’s economicoutcomes (e.g., Jacobs and Gerson 2004, chap. 5). Part-time employment,for example, is a common arrangement that enables women to combinepaid employment with unpaid work. Consequently, part-time work hasbecome one of the major forms of employment for women in most in-dustrial societies, where about one-third of all employed women work ona part-time basis (e.g., Blossfeld and Hakim 1997; Daly 2000; Orloff 2002).
Although part-time employment is not a direct product of states’ pol-icies, it is reinforced by regulation and protected by the welfare state.This is, indeed, the case in many Scandinavian states. In these countries(with Finland as a notable exception), part-time employment has becomea common practice for many mothers. Yet, unlike other countries wherepart-time employment serves as an institutional mechanism throughwhich mothers are incorporated into paid work (e.g., the Netherlands,the United Kingdom, Germany, Belgium, and Australia), in Scandinaviapart-time employees are entitled to full social benefits, paid vacation, andjob security (Borchorst 1994; Sundstrom 1997; Anxo and Flood 1998).The allocation of full benefits to part-time workers reflects the state’sefforts to encourage and support women’s economic activities, whetheron a full-time or a part-time basis.
Part-time employment is not the only mechanism through whichwomen’s working hours are curtailed. In several European countries (e.g.,Sweden, Denmark, France) working hours have been reduced throughregulations that set the standard below the conventional 40 weekly hours(Sundstrom 1997; Gornick and Meyers 2003). Although reduced workinghours can contribute to decreasing the conflict between work and familyresponsibilities for both parents, women are more likely than men to utilizethis option.
Occupational discrimination.—The tendency of women to adopt re-duced working hour arrangements and their tendency to take parentalleave are likely to restrict their opportunities for occupational mobility,

Women’s Employment
1915
as they foster employers’ reluctance to hire women and to promote themto positions that require costly investment in firm-specific knowledge, asrequired in most powerful and elite positions. Tomaskovic-Devey andSkaggs (2002), following Tam’s (1997) findings, highlight the importanceof “on-the-job training” for occupational mobility, and its consequencesfor gender occupational and wage inequality. They suggest that the limitedaccess of women to firm-specific training is one of the most significantcauses of their low occupational achievements compared to men.
One major explanation for the limited access of women to positionsthat require costly qualification and training periods can be cast withinthe framework of the “statistical discrimination model” (see also Tomas-kovic-Devey and Skaggs 1999).4 According to this theoretical model em-ployers have limited access to information on their candidates’ charac-teristics and future productivity. Therefore when searching for workersto fill jobs that require high training costs, employers are likely to dis-criminate against employees belonging to groups with statistically loweraverage levels of expected productivity (Phelps 1972; Aigner and Cain1977).
In this article we contend that in well-developed welfare states wherewomen’s eligibility for social rights supports their absence from work, theexclusion of women from jobs which require costly firm-specific invest-ment will be more acute. In labor markets where women as a group aremore protected by regulations and legislation, and where they enjoy socialrights that interfere with their work continuity, employers are expectedto prefer male workers for positions that require investment in firm-specific human capital. In Hansen’s (1997, p. 85) words: “If women havesocial rights that do not apply to men, or are seldom used by men, andthe practice of these rights is unprofitable for employers, employers maychoose to discriminate against female job applicants,” as indeed has beendemonstrated in many studies of gender inequalities in the Scandinavianlabor markets (see, e.g., Hansen 1997; Asplund 1998; Hemstrom 1998;Longva and Strom 1998; Naur and Smith 1998).
The restricted ability of qualified women to enter high-paying jobs, andtheir limited promotion opportunities in positions of power and authority,can be viewed as part of the glass ceiling phenomenon—“the unseen, yetunbeatable barrier that keeps minorities and women from rising to theupper rungs of the corporate ladder, regardless of their qualifications or
4 Other explanations of occupational inequality between men and women focus mostlyon the supply side, viewing women’s occupational attainments as resulting from theirown aspirations and preferences (Hakim 1997; Shu and Marini 1998), and as a rationalchoice (Polachek 1979) in an attempt to reconcile conflicts between family and workresponsibilities.

American Journal of Sociology
1916
achievements” (Federal Glass Ceiling Commission 1995, p. 4). Followingother studies that have dealt with the glass ceiling (i.e., Dulepp and San-ders 1992; Wright, Baxter, and Birkelund 1995; Athey, Avery, and Zemksy2000; Cotter et al. 2001) in this study we empirically define “powerful”or “high-level” positions as management positions. We argue that theinvisible barriers of the “glass ceiling”—the barriers that prevent womenfrom moving into positions of high authority and high earnings in or-ganizations—are expected to be greater in well-developed welfare stateswhere women are more protected by legislation that supports their ab-senteeism from the labor force and allows them reduced working hours.
The state as an employer.—The role of the welfare state as an employercompletes our argument. With the expansion of public social services,many services have been transferred from the private sphere to the statedomain. This process has a twofold effect on employment opportunitiesfor women; first, it enables mothers to allocate more time to paid work,and second, it provides women with new job opportunities. Moreover,the public-welfare sector offers white-collar and service jobs, many ofwhich are “female-typed” service and semiprofessional occupations. It alsooffers flexible employment hours and programs that tolerate paid absen-teeism. As such, the public service sector has become one of the mostpreferred segments of employment for women (Rein 1985; Esping-An-dersen 1990; Alestalo et al. 1991; Kolberg 1991; Hansen 1995, 1997; Gor-nick and Jacobs 1998). The nature of jobs in the public service sector,coupled with favorable and convenient work conditions, appears to chan-nel women in disproportionate numbers into feminine occupational nichesand away from lucrative and powerful positions. Hence, the expansionof the public service sector is likely to increase gender occupational seg-regation (Rein 1985; Alestalo et al. 1991; Hansen 1995, 1997).
Several studies have demonstrated that the overrepresentation ofwomen in the exceptionally large Swedish and Danish public sectors con-tributes to the lessening of their economic gains (Gornick and Jacobs 1998;Datta Gupta, Oaxaca, and Smith 2000). Feminist scholars have alsopointed out that the rise of the welfare state, accompanied by a massiveentrance of women into the labor force, did not alter the traditional di-vision of labor between men and women. Rather, it actually transferredthe gendered division of labor from the private sphere into the publicdomain. In this process traditional gender roles are perpetuated; womenare disproportionately channeled to public services and care roles, whilemen get hold of more desirable jobs (Hernes 1987; Siim 1988; Langanand Ostner 1991; O’Connor 1993; Chang 2000). Hernes referred to thisprocess in terms of “the family ‘going public’” where “women have becomeclients and employees of a highly developed welfare state with a largepublic service sector” (Hernes 1987, pp. 32, 37).
Women’s Employment
1917
In fact, a high concentration of women in the protected public sectorand the practice of statistical discrimination by employers are not mutuallyexclusive but rather interdependent. Women’s job preferences are influ-enced by both employers’ behavior and labor market opportunities. Inlabor markets where employers are reluctant to hire women to powerfuland high positions, it is less likely that women would be motivated tocompete with men for such positions. On the other hand, a large publicservice sector, which offers job protection and convenient working con-ditions, is likely to attract women. Although we cannot distinguish be-tween employees’ and employers’ preferences, these two mechanisms areinterrelated; their negative impact on women’s occupational attainmentsare expected to be more pronounced in countries with a highly developedwelfare state.
To sum up our arguments: we contend that the massive entrance ofwomen into the labor force of well-developed welfare states has not beenaccompanied by their equivalent entrance into powerful and desirablepositions. On the contrary, in highly developed welfare states the “glassceiling” has become lower and wider. Social rights attached to women’semployment in advanced welfare states are likely to increase employers’tendency to discriminate against women in recruitment to powerful andelite positions in the private sector. Likewise, in a large “protected” publicsector women are likely to be relegated mostly to female-typed servicejobs. Although under these conditions the concentration of women infeminine niches can be seen as a rational choice, we tend not to view itas a purely free choice, mainly because job preferences are shaped bylabor market opportunities, which cannot be separated from employers’discrimination.
Although some of these arguments have been advanced in the feministliterature for quite some time, they have not been systematically testedwith cross-national comparative data. Thus, in the analysis that followswe provide a cross-national empirical examination of the hypotheses thatdeveloped welfare states—measured quantitatively by their family policiesand size of the public service sector—are characterized by high rates oflabor force participation among women, while at the same time they alsoexhibit a high concentration of women in female-typed occupations andlow access for women to positions of power, authority, and high economicrewards.
DATA SOURCES, VARIABLES, AND MEASURES
Our data set has information on both individual-level and country-levelcharacteristics. The individual-level variables were obtained from the

American Journal of Sociology
1918
Luxembourg Income Study (LIS), which serves as an archive for com-parable microdata sets for a large number of industrialized countries.5
The analysis reported here was restricted to the 22 countries that provideddetailed information on demographic and labor market attributes of menand women, ages 25–60, during the middle to the end of the 1990s.6
Information on welfare state characteristics was obtained from a varietyof secondary sources (a detailed list of the data sources for each countryis displayed in app. table A1).
The individual-level variables included in the analysis are those tra-ditionally employed in models predicting economic activity. They wererecoded to ensure comparability as follows: gender (womenp1), maritalstatus (marriedp1), education (academic degreep1), age (in years), num-ber of children, and the presence of preschool children (p1). Althoughthe analysis reported here is primarily concerned with country-level ef-fects, controlling for individual-level variations is crucial since one cannotassume similarity across countries in the distribution of men and womenin such characteristics as education, age, marital status, and presence ofchildren, all of which are significant determinants of economic activityand occupational achievement.
The dependent variables used in the analysis include two indicators ofwomen’s rate of labor force participation, an indicator for the amount ofparticipation (i.e., part-time work vs. full-time employment), and threeindicators of gender occupational inequality. The two indicators of par-ticipation are rate of labor force participation among women ages 25–60and rate of participation among mothers of preschool children, respec-tively. Amount of participation is based on Hakim’s (1997) distinctionbetween four categories of employment: full-time employment (more than39 weekly hours), reduced-hours employment (30–39 weekly hours), half-time employment (15–29 weekly hours), and marginal employment (under15 weekly hours). Gender occupational inequality was measured by thenet odds (women relative to men) to be employed in an occupationalcategory, according to three variables. The first variable captures women’saccess to powerful and elite positions by the net odds of women (relativeto men) to attaining “managerial occupations.” Since definitions of man-agers can vary across countries, and in order to capture confidently eliteand top positions, an alternative is to estimate women’s access to “lucra-tive-managerial occupations.” While managerial occupations were definedaccording to the standard classification of occupations for each country,lucrative-managerial occupations were restricted to those that ranked in
5 http://www.lisproject.org.6 Data for Norway were based on the Norwegian Level of Living Survey 1995.

Women’s Employment
1919
the top three deciles of the occupational earnings distribution.7 The thirdvariable captures women’s occupational segregation. We measured thenet odds of women (relative to men) of being employed in “female-typedoccupations.” Female-typed occupations were defined according to twocombined criteria: the relative proportion of women in an occupationalcategory at the two-digit occupational classification level and a statisticalsignificance test.8
The key independent variable utilized in the analysis is an index thatreflects the overall protection that the welfare state provides to workingmothers (see Mandel and Semyonov 2005). It is designed to capture stateinterventions that affect the employment of women via both family pol-icies and state employment (hereafter WSII or Welfare State InterventionIndex). Following previous researchers (i.e., Gornick, Meyers, and Ross1997; Korpi 2000; Wilensky 2002; Gornick and Mayers 2003) we reliedon indicators that represent the scope of family policies (i.e., paid maternityleave and publicly funded day-care facilities). In addition, we also includedamong the components of the index an indicator of the size of the publicservice sector. It serves us as a proxy for the volume of public servicesprovided by the state and the relative magnitude of the welfare state asan employer.
The three indicators were combined to construct the index: the numberof fully paid weeks of maternity leave (number of paid weeks multipliedby the percentage of wage replacement during the leave), the percentageof preschool children in publicly funded day-care facilities, and the per-centage of the workforce employed in the public welfare sector (publichealth, education, and welfare). Each of the three components capturessomewhat different aspects of the state’s activities. Maternity leave policyindicates the benefits that the state offers to working mothers, while pub-licly funded child-care facilities and the size of the public service sectorcapture the prevalence of social services provided by the state and thedemand for female labor. We believe that when combined into an indexthe three components represent a broad phenomenon that transcends theunique effect of each component. The index was constructed using the
7 The LIS variable “pocc,” combined (when relevant) with the LIS variables “pactiv”and “ptypewk,” which provide information on occupational activity in some countries.8 According to the first criterion the proportion of women in an occupation shouldexceed 150% of the female proportion of a country’s work force. Since the absolutesize of occupations varies substantially across countries, the second criterion was a t-test for statistical difference between proportions (of men and women) in each detailedoccupational category. Occupations in which the proportion of women was both higherand statistically different from the proportion of men (at P ! .01) were coded as female-typed occupations. Since some countries did not provide detailed occupational cate-gories, data on this variable were available for only 19 countries.
American Journal of Sociology
1920
first principal component of a factor analysis and was scaled to rangebetween 0 and 100.9
In addition to the theoretical measures we also included in the analysisa series of country-level control variables that were used in previouscomparative studies on related topics (i.e., gender occupational segregationand wage inequality; see, e.g., Charles [1992], Blau and Kahn [1995],Sjoberg [2004]). These variables are income inequality (measured by theGini index10), economic development (measured by GDP per capita11),unemployment rate (OECD 200612), and gender egalitarianism (estimatedby factor analysis using attitudinal data regarding gender and family rolescollected by the International Social Survey Program13). Other contextualvariables such as the level of “postindustrial economic structure” (com-monly measured by the size of the service sector [Charles 2003]), “leftgovernment,” or “socialist welfare state” (Siaroff 2000) were not includedin the analysis since they are endogenous to our key independent vari-able—the welfare state index. The country-level control variables enableus to examine whether and to what extent these variables could be drivingrelationships between the WSII and gender occupational inequality.
METHOD OF ANALYSIS AND FINDINGS
Method
We start the analysis by plotting correlations between the WSII, women’slabor supply (participation and working hours), and measures of genderoccupational inequality. Gender occupational inequality was estimatedthrough a series of logistic regression equations, one for each country,predicting the odds of employment in each occupational category as afunction of gender, marital status, age, education, number of children,and the presence of preschool children. The exponent of the coefficientfor gender in each equation represents the relative odds of women (vs.
9 All three indicators are highly and positively correlated, as reflected in their factorloadings: WSII p .828#maternity � .721#child care � .845#public services (var-iance explained 64%).10 Data were taken from the LIS Web site (see n. 5) and refer to years 1990–97.11 Data were taken from Penn World Tables, Center for International Comparisons(CIC), University of Pennsylvania. The data pertain to 1996. http://pwt.econ.upenn.edu/php_site/pwt6n_form.php.12 Data are standardized and were taken from the OECD (2004, statistical annex, tableA [data refer to 1995, except Israel of which the data refer to 1997]).13 The selection of items for the construction of this index was based on Sjoberg (2004).Data for most countries were taken from the 1994 module and for a few countriesfrom the 2002 module. Belgium and Luxembourg do not provide data for this variable.

Women’s Employment
1921
men) to be employed in an occupational category (managerial, lucrative-managerial, or female typed), net of all other variables included in theequation. We believe these measures capture the essence of gender oc-cupational inequality as discussed in the theoretical section.
We continue the analysis by employing a logistic hierarchical linearmodel (HLM) to estimate the impact of the WSII on the odds of laborforce participation or employment in a specific occupational category,while controlling for both other country-level characteristics and varia-tions in human capital attributes at the individual level. The HLM modelscan be represented by the following set of equations:
log -odds(manager) p b � b (gender) � b X . (1)ij 0j 1j ij j ij
At the individual level, the dependent variable—manager in this illus-tration—is a binary variable indicating whether a person is employed ina managerial position. The logistic regression models estimate the log-odds of being employed in a managerial position as a linear function ofthe covariates. The coefficient b0j is the country-specific intercept, denotingthe log-odds of being a manager in country j for a man with a vector ofcovariates with the average values.14 “Gender” denotes whether the in-dividual is male or female (coded 0 and 1, respectively), and its coefficientb1j represents the gender log-odds gap in country j. Xij and bj are vectorsof five independent variables (marital status, education, age, number ofchildren, and presence of preschool child) and their respective coefficients.This equation allows the effects of all independent variables (b1j–b6j) andthe intercept (b0j) to vary across countries (i.e., to be random), assumingthat their effects are not necessarily equal across countries.
At the second level, country characteristics are employed to explaincross-country differentials (the random effect of b0j [intercept] and b1j
[gender]), as presented in equations (2)–(3):
b p g � g (WSII) � g X � n , (2)0j 00 01 02 0j
b p g � g (WSII) � g X � n , (3)1j 10 11 12 1j
b p g � n (k p 2, 3, 4, 5, 6). (4)kj k0 kj
In equation (2), the variation between countries in b0j (the “baseline”/“average male” log-odds) is modeled as a function of contextual factors(the WSII and a vector of other country-level characteristics which areintroduced as controls); n0j is the error term of the second level of thehierarchical model and is assumed to follow a normal distribution with
14 All individual-level variables were centered around their grand mean.

American Journal of Sociology
1922
mean zero and unknown variance. Our main interest is in equation (3),which represents the effect of the WSII on the gender odds gaps. b1j—the dependent variable—denotes the effect of gender on the log-odds ofbeing employed in a managerial position (i.e., countries’ log-odds gapbetween men and women). The WSII is introduced to explain the vari-ation across countries in these odds, net of a vector of country-level char-acteristics. A negative sign of g11 would indicate that in countries rankinghigher on the index women tend to have lower odds of being employedin a managerial position compared to men. Equation (4) estimates theaverage effect, across countries, of the individual-level control variables.Estimation of the model consisted of two steps. First, a separate logisticregression was fitted for each country according to model 1. Second, usingthe estimated coefficients and their standard errors, models 2–4 wereestimated using the “V-known” approach (see Bryk and Raudenbush 1992,chap. 7).
Welfare State Intervention Index
The distributions of the index and its three components are displayed infigure 1 and in appendix table A1, respectively. The values reveal con-siderable variation across countries. The variation is most pronouncedwith regard to maternity leave, with an average of 17.3 weeks with fullpay (SDp11.1), and least pronounced with regard to publicly fundedchild-care facilities, with an average of 40.8% (SDp13.7). The relativesize of the public service sector ranges from 25% in Sweden and Denmarkto 5% in Eastern European countries such as the Czech and SlovakRepublics.
In general, the data presented by the index are highly correlated withprevious scales of family policies and are in line with the tripartite welfarestate regimes typology offered by Esping-Andersen (1990).15 Countriestraditionally classified as social democracies (e.g., Sweden, Denmark, Nor-way, and Finland, along with Israel) are at the top of the distribution,while those identified with the liberal regimes (e.g., the United States,Australia, Canada, and Ireland, along with Switzerland) are at the bottomof the distribution. Countries representing the conservative welfare regime(e.g., Italy and Spain, along with Eastern European countries) are at themiddle of the index distribution. The high correlation of WSII with pre-
15 For example, the Spearman correlation between the WSII and Korpi’s rank on the“Dual Earner policy scale” is (Korpi 2000, table 2). The Pearson correlationr p .95between the WSII and the Gornick-Meyers “index of family policy that affect familieswith children under the age of six” is (Gornick and Meyers 2003, table C.3,r p .92index A).

Women’s Employment
1923
Fig. 1.—Distribution of the Welfare State Intervention Index in descending order
vious indices and its affinity with Esping-Andersen’s typology strengthensour confidence in the ability of the index to capture the scope and essenceof state interventions of the kind described here.
Labor Force Participation
At the outset of this article we suggested, following previous researchers,that women’s economic activity is likely to be higher in developed welfarestates. In figure 2 we display labor force participation rates for womenages 25–60 and for mothers of preschool children, respectively, for the 22countries included in the analysis. On average, the rate of participationis higher when computed for all women ages 25–60 (meanp63.6,SDp12.6) than for mothers (meanp56.5, SDp14.5). The two distribu-tions, however, are quite similar, with Scandinavian countries (i.e., Swe-den, Norway, and Denmark) having the highest values and with Spain,Italy, and Ireland having the lowest values. While in most countries par-ticipation rates of mothers of preschool children are lower in comparisonto the total population of women, in Sweden, Norway, and Denmark—countries with the highest rates of female participation—and in Spainand Italy—countries with the lowest rates—there are no significant dif-ferences between the two measures. Belgium is an exception, with lowparticipation rates for the total population of women and very high par-ticipation rates among mothers of preschool children.
In figures 3 and 4 we plot rates of labor force participation for allwomen and for mothers of preschool children against the WSII. The datastrongly support the expectation that a well-developed welfare state isassociated with higher rates of labor force participation among women,
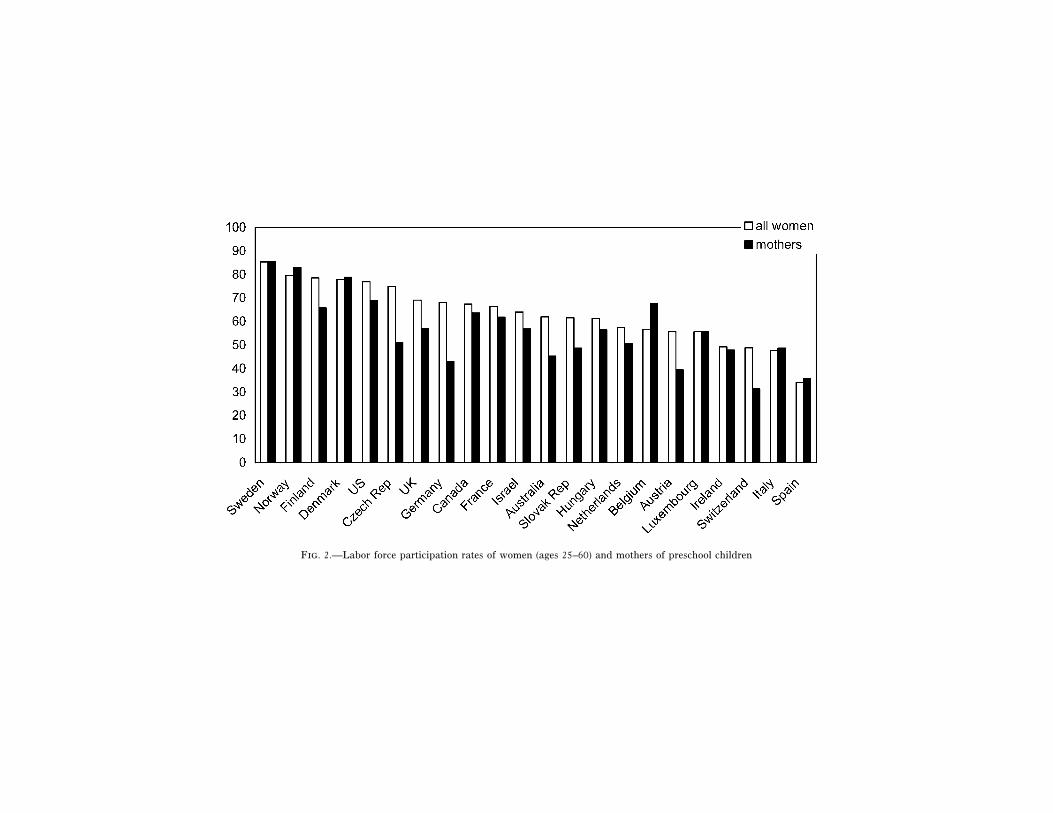
Fig. 2.—Labor force participation rates of women (ages 25–60) and mothers of preschool children

Women’s Employment
1925
Fig. 3.—Labor force participation rates of women (ages 25–60) by Welfare State Inter-vention Index.
especially among mothers of preschool children. The correlation betweenWSII and rate of female labor force participation is ; it becomesr p .43substantially stronger ( ) when participation rate is computed forr p .70the population of mothers of preschool children.
Similar positive and significant correlations are revealed when asso-ciating participation rates for mothers of preschool children with each ofthe three components of the WSII. Participation is positively associatedwith maternity leave policies ( ), with availability of child-carer p .56facilities ( ), and with the size of the public service sector (r p .39 r p
).16 Our data, thus, support the thesis that countries characterized by.70well-developed family policies and by a large public welfare sector providewomen, especially mothers of young children, with better opportunitiesto become economically active. These findings do not eliminate the pos-sibility that rate of participation may affect, in turn, family policies andthe size of the welfare sector (e.g., Huber and Stephens 2000). High par-ticipation rates of women may increase the demand for public services,on the one hand, and generate pressure on policy makers to provide suchservices, on the other hand.
It should be noted, however, that in Canada and the United States therate of participation is higher than expected on the basis of the values ofthe WSII (see figs. 3 and 4). This could be explained by the fact that in
16 The relatively low correlation between child-care facilities and the female partici-pation rate reflects the state’s responsibility for the care of young children regardlessof its effort to facilitate employment for mothers.

American Journal of Sociology
1926
Fig. 4.—Labor force participation rates of mothers of preschool children by Welfare StateIntervention Index.
market-oriented states, social services such as child-care institutions, andother benefits to working mothers such as maternity leave, are provided,to a large extent, by the private market. The WSII, therefore, under-estimates other contextual characteristics that affect women’s employmentin a market-oriented welfare regime.
Part-Time Work
Labor force participation masks substantial differences in the extent ofwomen’s involvement in paid work. While there is very little variationin men’s mode of employment (most men work on a full-time basis),women’s mode of employment ranges from full-time employment to mar-ginal employment. Figure 5 displays Hakim’s (1997) four types of em-ployment: full, reduced, half, and marginal (the figure pertains only toeconomically active women since the distributions for mothers of pre-school children across countries are very similar and thus not shown here).The data reveal enormous variation across countries. Working hours arehighest among women in the Czech Republic, Hungary, and the UnitedStates and lowest in the Netherlands, Sweden, Norway, Ireland, and theUnited Kingdom. Likewise, the proportion of women employed full-timeis substantially higher in the former group of countries than in the lattergroup. Reduced working hours is the most common pattern of employ-ment in Finland, Sweden, France, Norway, and Belgium—all are coun-tries with a high score on the WSII—and least common in the Czech

Fig. 5.—Distribution of working hours among employed women, ages 25–60
American Journal of Sociology
1928
Republic, Hungary, Switzerland, Luxembourg, and the United States,countries with medium and low ranks on the index scale.
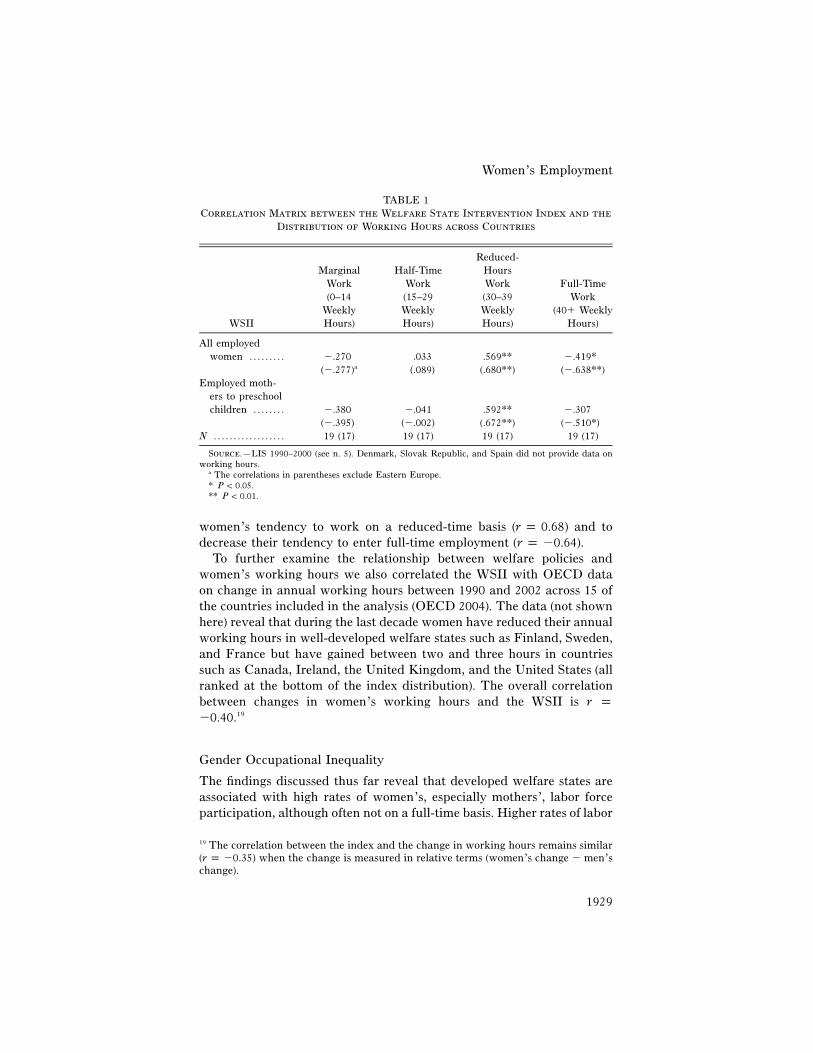
While working hours in general are not related to the development ofwelfare policies, some employment modes are more common in well-developed welfare states. Table 1 presents the correlations between WSIIand Hakim’s categories of working hours to examine whether and towhat extent employment types are systematically related to the scope ofwelfare state interventions. The data reveal that reduced working hoursis a more common employment mode in well-developed welfare states( for all women, and for mothers of preschool children).r p .569 r p .592On the other hand, both marginal employment and full employment areless common in highly developed welfare states. As noted at the outsetof the article, while high levels of part-time employment can be foundacross all welfare regimes (the United Kingdom, Australia, and the Neth-erlands are good examples of high levels of part-time employment in theconservative and liberal regimes) this mode of employment is more com-mon in highly developed welfare states, where large proportions of moth-ers of young children are economically active and a large public servicesector offers attractive part-time jobs with social benefits (e.g., paid va-cation, job security).17 The data presented here thus suggest that the state’sefforts to “decommodify” part-time workers are likely to increase em-ployment on a reduced-time basis, but not on a marginal or full-timebasis.18
The expansion of the welfare state and the increase in part-time em-ployment are also associated with the trend toward the postindustrialsociety. This trend, however, has been less evident in the former socialistcountries than elsewhere (Drobnic 1997). Thus, in order to examine theextent to which the findings presented here were influenced by the inclu-sion of the former socialist countries in the analysis, the correlations be-tween the WSII and mode of employment were estimated while excludingHungary and the Czech Republic (table 1). The results provide additionalsupport to the argument that welfare state policies are likely to increase
17 Indeed, among the three components of our index, the size of the public servicesector has the strongest relationship with working hours. It is positively correlatedwith women’s ( ) and with mothers’ ( ) tendency to work reduced hoursr p 0.59 r p 0.55and is negatively related to women’s and mothers’ tendency to work full-time (withrespective correlations and ).r p �0.557 r p �0.48018 It should be noted that reduced working hours is also a common phenomenon amongmen in developed welfare states such as Sweden, Norway, Finland, Belgium, andFrance. However, marginal and part-time jobs are very rare among men in all coun-tries, and, except for Sweden, the overwhelming majority of men work on a full-timebasis (i.e., more than 39 weekly hours).
Women’s Employment
1929
TABLE 1Correlation Matrix between the Welfare State Intervention Index and the
Distribution of Working Hours across Countries
WSII
MarginalWork(0–14
WeeklyHours)
Half-TimeWork(15–29WeeklyHours)
Reduced-HoursWork(30–39WeeklyHours)
Full-TimeWork
(40� WeeklyHours)
All employedwomen . . . . . . . . . �.270 .033 .569** �.419*
(�.277)a (.089) (.680**) (�.638**)Employed moth-
ers to preschoolchildren . . . . . . . . �.380 �.041 .592** �.307
(�.395) (�.002) (.672**) (�.510*)N . . . . . . . . . . . . . . . . . . 19 (17) 19 (17) 19 (17) 19 (17)
Source.—LIS 1990–2000 (see n. 5). Denmark, Slovak Republic, and Spain did not provide data onworking hours.
a The correlations in parentheses exclude Eastern Europe.* P ! 0.05.** P ! 0.01.
women’s tendency to work on a reduced-time basis ( ) and tor p 0.68decrease their tendency to enter full-time employment ( ).r p �0.64
To further examine the relationship between welfare policies andwomen’s working hours we also correlated the WSII with OECD dataon change in annual working hours between 1990 and 2002 across 15 ofthe countries included in the analysis (OECD 2004). The data (not shownhere) reveal that during the last decade women have reduced their annualworking hours in well-developed welfare states such as Finland, Sweden,and France but have gained between two and three hours in countriessuch as Canada, Ireland, the United Kingdom, and the United States (allranked at the bottom of the index distribution). The overall correlationbetween changes in women’s working hours and the WSII is r p�0.40.19
Gender Occupational Inequality
The findings discussed thus far reveal that developed welfare states areassociated with high rates of women’s, especially mothers’, labor forceparticipation, although often not on a full-time basis. Higher rates of labor
19 The correlation between the index and the change in working hours remains similar( ) when the change is measured in relative terms (women’s change � men’sr p �0.35change).
American Journal of Sociology
1930
force participation among women, nevertheless, are only one aspect ofgender equality. As previously argued, the state’s efforts to minimize gen-der inequality in one sphere (i.e., labor force participation) could resultin opposite effects in other spheres of gender inequality (i.e., occupationalattainment). In the following section we analyze the relationship betweenwelfare state interventions and the three measures of occupationalinequality.
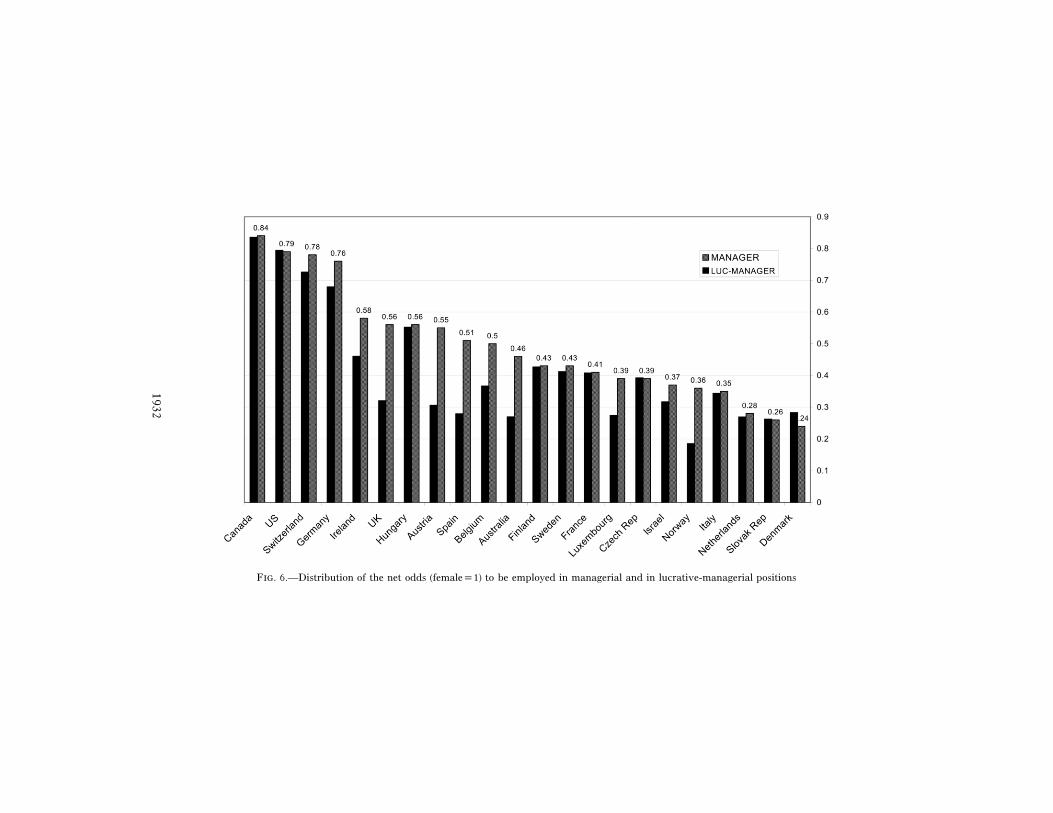
The findings presented in table 2 and figures 6 and 7 demonstrate thatnet of human capital and demographic characteristics, in an average coun-try, women’s odds of attaining a managerial position or a high-incomemanagerial position are less than half of those of men with similar at-tributes. In contrast, women’s relative odds of working in a female-typedjob are almost 12 times higher than men. Women’s relative odds of beingin a managerial position are lowest in Denmark, the Slovak Republic,and the Netherlands (exp. , 0.26, 0.28, respectively) and highestb p 0.24in Canada, the United States, and Switzerland (exp. , 0.79, 0.78,b p 0.84respectively). While in most countries women’s relative odds of employ-ment in managerial and in lucrative-managerial jobs are very similar, inAustria, the United Kingdom, Spain, Australia, and Norway the formerare much higher than the latter.20 Women’s concentration in female-typedjobs is highest in the United Kingdom and all the Scandinavian countriesand lowest in Belgium, the Czech Republic, Ireland, and Switzerland.
To test the hypothesis that developed welfare states are associated withlow representation of women in managerial and lucrative-managerial po-sitions, and with high representation of women in female-typed jobs, weestimated the relations between WSII and each of our measures of oc-cupational inequality. The findings presented in figures 8, 9, and 10 sup-port our hypothesis: women’s relative odds of entering both managerialand lucrative-managerial occupations tend to be lower in countries char-acterized by medium to high scores on the WSII than in countries withlow scores. For example, women’s odds of attaining managerial jobs arelower in Denmark, Norway, the Netherlands, and the Slovak Republicthan in Canada, the United States, and Switzerland (the correlation be-tween WSII and managerial and lucrative-managerial positions are r p�.60 and , respectively). In contrast, women’s relative odds ofr p �.45employment in female-typed occupations tend to be higher in countriesranked at the top of the welfare index distribution (e.g., the Scandinaviancountries) and lower in countries ranked at the bottom (e.g., Switzerland,
20 Possible explanations are self-employed defined as managers and a comparativelyhigh concentration of female managers in the public sector, which is characterized bylower salaries when compared to the private sector.

Women’s Employment
1931
TABLE 2Descriptive Statistics for the Three Measures of Occupational Inequality
ManagerialPositions
Lucrative-ManagerialPositions
Female-TypedOccupations
Mean (SD) . . . . . .49 (.17) .42 (.19) 11.9 (4.7)Minimum . . . . . . .24 .19 5.9Maximum . . . . . . .84 .84 25.9N (countries) . . . 22 22 19a
Source.—LIS 1990–2000 (see n. 5).Note.—Women’s net odds of being employed in each occupational position as compared to men.a Australia, Israel, and Italy did not provide detailed occupational categories and therefore were not
included in this analysis.
the United States, and Ireland), with the correlation between WSII andfemale-typed jobs being .r p .57
Multilevel Analysis
In order to estimate accurately the net effect of the WSII on both ratesof female labor force participation and gender-based occupational in-equality we estimated a series of logistic HLM regression equations. TheHLM enables us to estimate regression equations while simultaneouslycontrolling for both individual-level and country-level characteristics.Whereas the large LIS samples enable inclusion of all relevant individual-level variables in the equations, we were limited in the number of country-level variables that could be included in the analysis. Therefore, country-level (second-level) control variables were introduced into the equations(in addition to the variables of theoretical interest) one at a time.
The results of the HLM are displayed in table 3. In model 1 we letlabor force participation be a function of gender, age, marital status,education, number of children, and presence of preschool children (at theindividual level) plus the WSII (at the country level). In models 2, 4, and6, respectively, we predict the log-odds of attaining managerial occupa-tions, lucrative-managerial occupations, and female-typed occupations asa function of the individual-level attributes plus WSII. In models 3, 5,and 7 we include female labor force participation rate as an additionalcountry-level variable. The results of the analysis provide further insightsinto the differential impact of the welfare state on labor force participationand gender occupational inequality.
The findings revealed by model 1 reconfirm the hypothesis that welfare-state activities increase women’s participation in the labor force. Morespecifically, the individual-level effects in model 1 suggest that the oddsof labor force participation are likely to rise with academic education but
1932
Fig. 6.—Distribution of the net odds (femalep1) to be employed in managerial and in lucrative-managerial positions

1933
Fig. 7.—Distribution of the net odds (femalep1) to be employed in female-typed occupations

American Journal of Sociology
1934
Fig. 8.—Net odds (femalep1) to be employed in managerial positions by Welfare StateIntervention Index.
to decrease with age, number of children, and the presence of preschoolchildren.21 The odds of labor force participation are also higher amongmarried persons and among men. Net of individual-level attributes, theindex does not affect odds of employment among men, while the relativeodds of women’s employment are significantly higher in developed welfarestates. Apparently, other things being equal, women’s odds of employment(compared to men) are almost three times higher in a country ranked atthe top of the WSII scale than in a country ranked at the bottom of thescale ( , exp. ).b p 1.05 b p 2.9
To ensure that the effects of other country characteristics are not mis-takenly attributed to the WSII, all HLM regression equations presentedin table 3 were estimated while controlling for four contextual variables:GDP, unemployment, Gini index, and attitudes toward gender egalitari-anism. None of the four country-level controllers exerted a significanteffect on any of the dependent variables. Moreover, inclusion of country-level control variables in the analysis did not alter the impact of thewelfare index on the dependent variables.22
21 The effects of marital status, presence of preschool child, and number of childrencan differ for men and women. Nevertheless, we chose not to include these interactionvariables in our models since that would alter the meaning of the dependent variablesin the second level, and obviously we have no theoretical interest in examining herethe effects of these individual-level characteristics. As our interest is in country-leveleffects, the individual-level variables (level 1) are introduced to control for differencesbetween countries in the composition of human capital among men and women.22 As noted, because the number of countries included in the analysis is limited, thesecond-level control variables were inserted into the models one at a time. The dataare not presented here for the sake of parsimony but are available from the authorsupon request.
Women’s Employment
1935
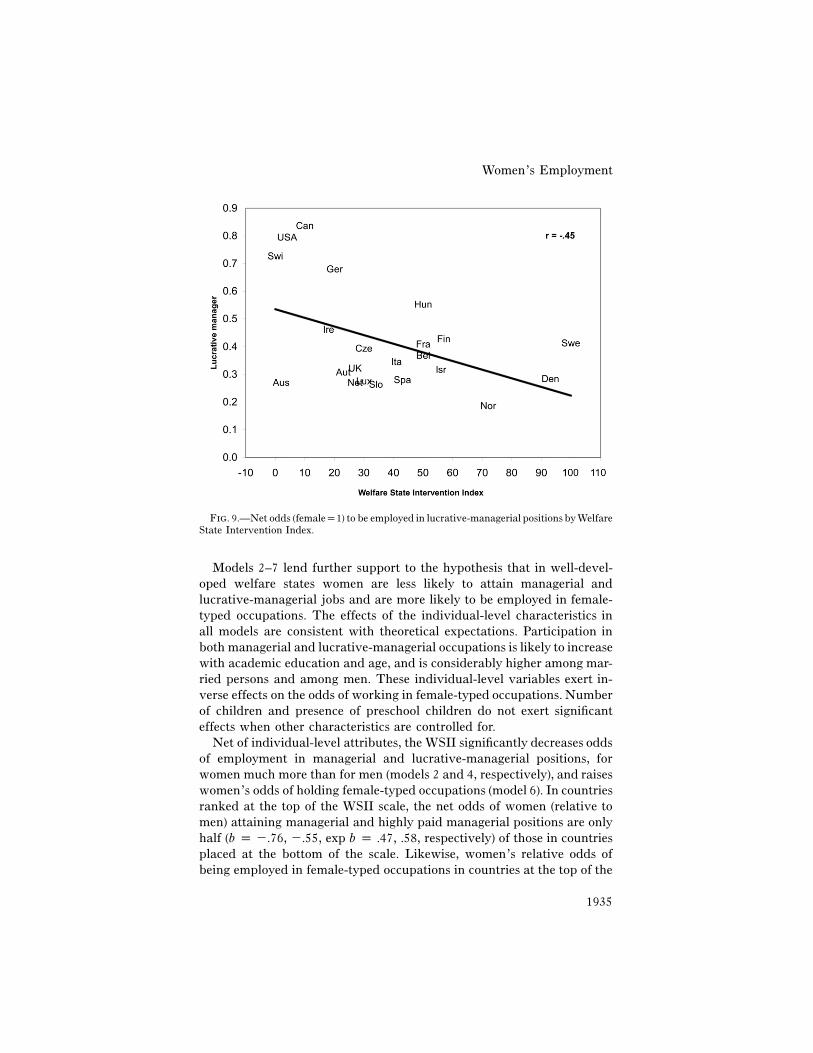
Fig. 9.—Net odds (femalep1) to be employed in lucrative-managerial positions by WelfareState Intervention Index.
Models 2–7 lend further support to the hypothesis that in well-devel-oped welfare states women are less likely to attain managerial andlucrative-managerial jobs and are more likely to be employed in female-typed occupations. The effects of the individual-level characteristics inall models are consistent with theoretical expectations. Participation inboth managerial and lucrative-managerial occupations is likely to increasewith academic education and age, and is considerably higher among mar-ried persons and among men. These individual-level variables exert in-verse effects on the odds of working in female-typed occupations. Numberof children and presence of preschool children do not exert significanteffects when other characteristics are controlled for.
Net of individual-level attributes, the WSII significantly decreases oddsof employment in managerial and lucrative-managerial positions, forwomen much more than for men (models 2 and 4, respectively), and raiseswomen’s odds of holding female-typed occupations (model 6). In countriesranked at the top of the WSII scale, the net odds of women (relative tomen) attaining managerial and highly paid managerial positions are onlyhalf ( , �.55, exp , .58, respectively) of those in countriesb p �.76 b p .47placed at the bottom of the scale. Likewise, women’s relative odds ofbeing employed in female-typed occupations in countries at the top of the

American Journal of Sociology
1936
Fig. 10.—Net odds (femalep1) to be employed in female-typed jobs by Welfare StateIntervention Index.
index are double the odds of their counterparts in countries placed at thebottom of the index ( , exp. ). These effects hardly changeb p .73 b p 2.08when other contextual variables are introduced as control variables.
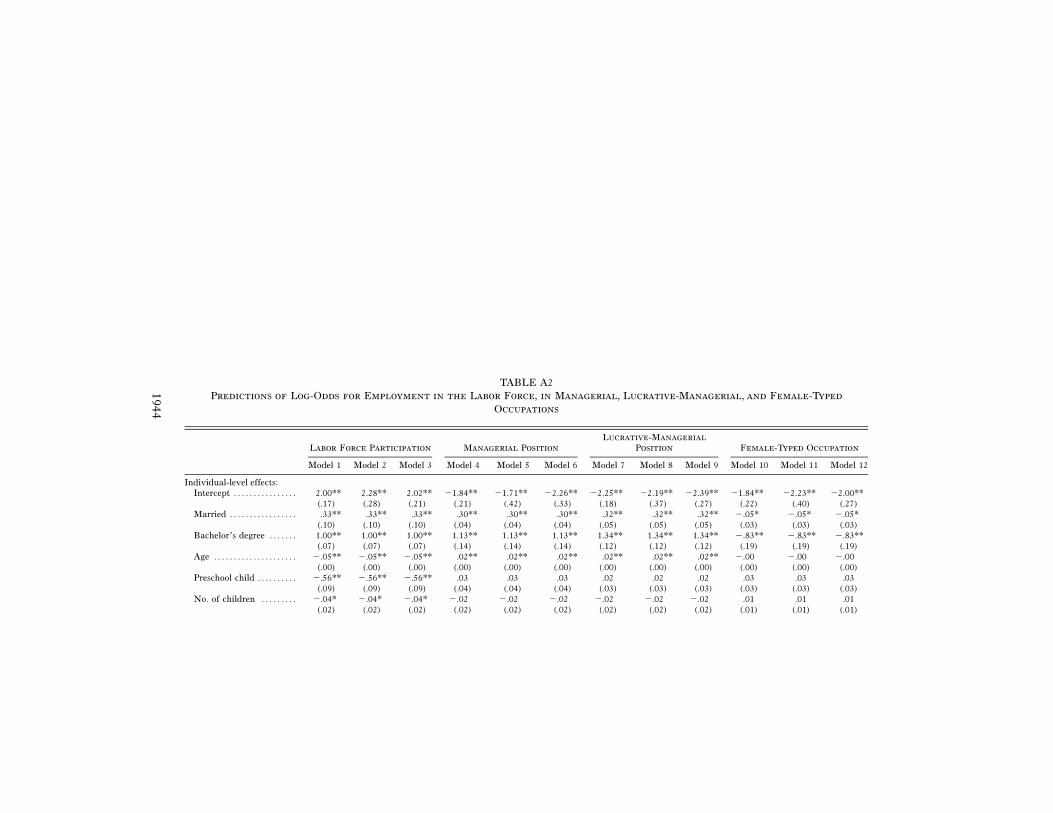
Despite the unequivocal effect of WSII on women’s occupational at-tainment, it is still possible that gender occupational inequality is differ-entially affected by each of the components of the index. In order to refineour understanding of the relationship between welfare state interventionsand occupational inequality we reestimated models 1, 2, 4, and 6 presentedin table 3, replacing WSII by each of its three components, that is, ma-ternity leave, child-care facilities, and the size of the public service sector.The results of the reanalysis are presented in appendix table A2. Re-gardless of the component and regardless of the measure of gender oc-cupational inequality used in the reanalysis, the data reveal similar find-ings and lead to similar conclusions. This is not surprising, given thestrong correlations between the components noted earlier in the paper.
Notwithstanding the general similarities between the effects of the threecomponents on our measures of occupational inequality, some meaningfuldifferences are observed. The negative effect of length of maternity leaveson women’s odds of attaining managerial positions is more pronouncedthan the impact of the other two components, which conforms to ourargument that institutional arrangements which allow long absence frompaid work encourage discrimination by employers.23 The data also revealan especially large (positive) effect of the size of the public service sectoron women’s segregation into the female-typed jobs. This is in line with
23 See also Mandel and Semyonov (2005) for the consequences of maternity leave forgender earnings gaps.

Women’s Employment
1937
our claim that the nature of jobs in the public service sector, coupled withfavorable and convenient work conditions, are likely to attract womenin disproportionate numbers into feminized occupational niches.
These nuances aside, the overall similarities between the effects of theindex and its components on various facets of occupational inequalityreinforce the validity of the WSII. It also provides additional support forour contention that the index as a whole is a better proxy for the overallconfiguration of welfare state interventions than any of its components.Specifically, in contrast to the other two components of the index, child-care arrangements allow women to devote more time to paid work andshould therefore increase their ability to compete with men for powerfuland prestigious positions. On the face of it, the strong negative relationshipof this component to women’s odds of attaining managerial positionstherefore seems counterintuitive. However, extensive child-care provisionusually goes hand in hand with generous maternity leave and extensivepublic social services. We believe that its correlation with these othercomponents of our index is what accounts for the anomaly. This findingthus strengthens our view that the index effectively captures a broadphenomenon of “mother-friendliness” which transcends individual poli-cies. As we have argued theoretically, it is welfare state “interventionism”more than discrete and specific interventions which fuels the mechanismsthat undermine women’s job opportunities.
It might be argued that the effect of the WSII on women’s occupationalattainment should be estimated, net of women’s rate of labor force par-ticipation, given that the WSII was found to be associated with both.Accordingly, in models 3, 5, and 7 of table 3, we let the three occupationalindicators be a function of both the WSII and the rate of women’s laborforce participation. The results lend further support to the hypothesis thatgender occupational inequality is more pronounced in countries charac-terized by developed family policy and large public sector employment.In all models the effect of the index is significant and in the expecteddirection, even after controlling for female participation. As before,women’s odds of attaining managerial and lucrative-managerial positionstend to decline with the values of WSII, while their odds of working infemale-typed jobs tend to rise.
The analysis also reveals that, net of WSII, a high female rate of laborforce participation slightly increases women’s odds of entering well-paidmanagerial positions and also increases women’s odds of joining female-typed occupations. The inclusion of female participation rates in the equa-tions, however, does not alter the effect of the WSII on occupationalattainment. Consequently, we can conclude that the mass entrance ofwomen into the labor force of countries with well-developed welfare statescannot be the sole cause of their high concentration in female-typed oc-

1938
TABLE 3Predictions of Log-Odds for Employment in the Labor Force in Managerial, Lucrative-Managerial, and Female-
Typed Occupations
Labor ForceParticipation
ManagerialPosition
Lucrative-Managerial
PositionFemale-Typed
Occupation
Model 1 Model 2 Model 3 Model 4 Model 5 Model 6 Model 7
Individual-level effects:Intercept . . . . . . . . . . . . . . . . . . . . . . . . . . . . . . 2.06** �2.03** �2.37** �2.36** �2.79** �2.20** �.33
(.16) (.22) (.71) (.18) (.59) (.21) (.52)Married . . . . . . . . . . . . . . . . . . . . . . . . . . . . . . . .33** .30** .30** .32** .32** �.05* �.05*
(.10) (.04) (.04) (.05) (.05) (.03) (.03)Bachelor’s degree . . . . . . . . . . . . . . . . . . . . 1.00** 1.13** 1.13** 1.34** 1.34** �.83** �.83**
(.07) (.14) (.14) (.12) (.12) (.19) (.19)Age . . . . . . . . . . . . . . . . . . . . . . . . . . . . . . . . . . . . �.05** .02** .02** .02** .02** �.00 �.00
(.00) (.00) (.00) (.00) (.00) (.00) (.00)Preschool child . . . . . . . . . . . . . . . . . . . . . . . �.56** .03 .03 .02 .02 .03 .03
(.09) (.04) (.04) (.03) (.03) (.03) (.03)No. of children . . . . . . . . . . . . . . . . . . . . . . . �.04* �.02 �.02 �.02 �.02 .01 .01

1939
(.02) (.02) (.02) (.02) (.02) (.01) (.01)Gender (femalep1) . . . . . . . . . . . . . . . . . . �1.66** �.48** �.83** �.74** �1.52** 2.13** �1.44**
(.23) (.10) (.33) (.13) (.40) (.12) (.35)Country-level effect: On the intercept
WSII . . . . . . . . . . . . . . . . . . . . . . . . . . . . . . . . . . �.10 �1.20** �1.30** �1.22** �1.34** �.69 .14(.34) (.48) (.52) (.40) (.42) (.44) (.38)
Female labor force participation . . . .01 .01 �.03**(.01) (.01) (.01)
Country-level effect: On the gendercoefficient
WSIIa . . . . . . . . . . . . . . . . . . . . . . . . . . . . . . . . . 1.05* �.76** �.86** �.55* �.75** .73** .52**(.50) (.22) (.23) (.29) (.28) (.26) (.25)
Female labor force participation . . . .006 .013* .012*(.005) (.007) (.006)
N . . . . . . . . . . . . . . . . . . . . . . . . . . . . . . . . . . . . . . . . . 22 22 22 22 22 19b 19b
Source.—LIS 1990–2000 (see n. 5).Note.—Results from logistic HLM regression equations. SEs in parentheses.a The values of WSII were divided by 100; the coefficient indicates the gender differences in log-odds to participate in the labor force or to be
employed in a specific occupational category, between a country placed at the bottom of the WSII and a country at the top.b Australia, Israel, and Italy did not provide detailed occupational categories and therefore were excluded from this analysis.* P ! .05, one-tailed test.** P ! .01.
American Journal of Sociology
1940
cupations. Nor can it explain their low representation in managerial po-sitions. These findings lead us to reject the argument that low selectivityof women into the labor force of well-developed welfare states is respon-sible for their low occupational attainments (Hansen 1995, 1997; OECD2002, p. 106).
Integrative Analysis
An important limitation of previous comparative research in this area isthat the multiple dimensions of women’s labor market integration areusually studied in isolation from one another. Our comprehensive ap-proach reveals that no country or group of countries approximates un-ambiguous gender equality. As anticipated, the social-democratic modelof women’s integration into the labor market is accompanied by theircrowding in female-dominated occupations and their relative exclusionfrom managerial occupations. On the other hand, the liberal model is lesseffective in mobilizing women into employment but is more open to theirentry into elite positions. Finally, the conservative model typically dis-advantages women in both respects.
To underline the cross-national diversity of the opportunity structuresthat women face, we conducted a factor analysis procedure using alldependent variables utilized in the analysis (labor force participation,working hours, managerial occupations, lucrative-managerial occupa-tions, and female-typed occupations). Two significant factors, representingtwo unrelated configurations of gendered employment patterns, emergedfrom the analysis (see app. table A3). The first factor, which we dub“participation/segregation,” loads strongly on female participation rates,concentration of women in female-typed occupations, and on reducedworking hours rather than full-time employment. In our data set Swedenand Finland have the highest scores on this factor while the former so-cialist countries, Switzerland, and Luxembourg generate the lowest scores.The second factor captures “equality of opportunity”; it singles out genderequality in access to managerial jobs and also a tendency toward full-time employment among working women. In this respect, the NorthAmerican countries stand at the top of the scale while the Netherlandsand Norway are placed at the bottom.
The thesis advanced in this paper suggests that the two labor marketprofiles (captured by the two factors) should be closely related to the scopeand character of the welfare state. In line with our expectations, thecorrelation between the WSII and the “participation/segregation” factoris positive ( ) while the correlation between the WSII and ther p .555“equality of opportunity” factor is negative ( ). Furthermore,r p �.524when clustering the countries using the two sets of factor scores (not
Women’s Employment
1941
shown) we find that most of them fall into one of three distinctive con-figurations whose membership runs parallel with Esping-Andersen’s(1990) welfare regimes. Of the 16 countries available for the factor anal-ysis, three with the lowest WSII scores (United States, Canada, and Swit-zerland) form a liberal cluster characterized by exceptionally high ratesof entrance into managerial positions (“equality of opportunity” factor).The Scandinavian countries, representing the social-democratic regime,with the highest scores on the WSII, also have exceptionally high scoreson the “participation/segregation” factor and below-average scores for“equality of opportunity.” Finally, most of the Continental states and Ire-land (representing the conservative welfare state regime) cluster with in-termediate levels of WSII and below-average scores on both factors.24
CONCLUSIONS
The objective of the present research has been to provide a systematicexamination of the impact of welfare state activities on the labor forceparticipation of women and on gender occupational inequality. Utilizingdata from 22 industrialized countries we found the impact of welfarestates on women’s employment opportunities to be complex and to varyfrom one aspect of economic activity to another (i.e., labor force partic-ipation and occupational inequality). This impact, therefore, can be prop-erly understood and delineated only when the interrelations among themultiple aspects of women’s economic activity are simultaneouslyconsidered.
Consistent with theoretical expectations and with previous studies, thedata show that women’s rate of labor force participation tends to be higherin countries with progressive welfare states. Apparently, expansion offamily-oriented services, availability of public child-care facilities, and alarge public service sector provide women with better opportunities tobecome economically active. By increasing the incorporation of womeninto the paid economy, the welfare state has significantly contributed toincreasing women’s economic independence, and, by implication, tostrengthening their power within the household and the society at large.
However, once women have become economically active, benefits toworking mothers and high demand for female labor in the public servicesserve to restrict their occupational achievements. Our data show that incountries characterized by a progressive welfare system women are dis-
24 Although most countries fit neatly into the schema described here, three exceptionsare evident: Belgium is located within the conservative group despite having a highWSII score, Germany is placed with the liberal group, and the United Kingdom isplaced close to the Scandinavian countries.

American Journal of Sociology
1942
proportionately underrepresented in managerial positions and overrepre-sented in female-typed jobs. We contend that family-friendly policies andemployment practices assume the primacy of women’s familial respon-sibilities. As such they are designed to allow women time off for the careof young children through extended maternity leaves and support of part-time employment. These policies, in turn, discourage employers from hir-ing women for managerial and powerful positions and foster women’sattachment to female-typed occupations and jobs with convenient workconditions. Although we cannot empirically separate employer discrimi-nation from women’s employment preferences, we have suggested thatthe two are interrelated and jointly have detrimental consequences forwomen’s occupational achievements.
Paradoxically, therefore, the same welfare state activities that promoteone dimension of gender equality appear to inhibit another dimension.This trade-off can best be understood in relation to specific welfare re-gimes. The social-democratic regime promotes women’s integration intothe labor market by providing them with convenient and flexible workingconditions. However, this goal is achieved at the cost of greater occu-pational segregation and restricted opportunities for women to enter themost desirable positions. By contrast, the market-oriented liberal regimeneither restricts nor supports women’s economic activities, and no specialwork arrangements are mandated for mothers. In the liberal market econ-omies women, like men, are expected to work continuously and on a full-time basis. These conditions may not meet the justified desire of manywomen for family-supportive working arrangements, and may discouragemothers from joining the labor force. At the same time, women whobecome economically active are in a better position to compete for high-status managerial jobs than are their counterparts in social-democraticcountries.
It follows that each welfare state configuration has its own advantagesand disadvantages for women. The singular contribution of this study isthat it highlights some negative implications of “women-friendly” inter-ventions that have been insufficiently appreciated. Given the unques-tionable importance of women’s paid work for their economic autonomy,and the utility of family-supportive policies for their incorporation intopaid employment, it is important to draw attention to the unintendedconsequences of these policies. Our research underlines the challenge ofdeveloping institutional arrangements that not only support mothers’ em-ployment but also assist economically active women in successfully com-peting with men.

APPENDIX
TABLE A1The Components of the Welfare State Intervention Index for 22 Countries
Country
Index ofWelfarePolicy*
MaternityLeave(no. of
Fully PaidWeeks)
% Children(Ages 0–6) in
Publicly FundedChild Care
Public WelfareSector as Share
of Total
Sweden . . . . . . . . . . . . . . 100 41 56 25Denmark . . . . . . . . . . . . 93 28 65 25Norway . . . . . . . . . . . . . . 72 42 30 20Finland . . . . . . . . . . . . . . 57 32 35 16Israel . . . . . . . . . . . . . . . . . 56 12 57 18Belgium . . . . . . . . . . . . . 50 12 63 13France . . . . . . . . . . . . . . . 50 16 61 11Hungary . . . . . . . . . . . . . 50 24 48 12Spain . . . . . . . . . . . . . . . . 43 16 45 14Italy . . . . . . . . . . . . . . . . . . 41 17 52 11Slovak Republic . . . . 34 25 44 5Czech Republic . . . . . 30 19 47 5Luxembourg . . . . . . . . 30 16 35 11United Kingdom . . . . 27 8 28 16Netherlands . . . . . . . . . 27 16 39 8Austria . . . . . . . . . . . . . . . 23 16 22 6Germany . . . . . . . . . . . . 20 14 35 7Ireland . . . . . . . . . . . . . . . 18 10 18 11Canada . . . . . . . . . . . . . . 10 8 29 7United States . . . . . . . 4 0 30 8Australia . . . . . . . . . . . . 2 0 23 10Switzerland . . . . . . . . . 0 8 16 7Average . . . . . . . . . . . . . . 38 17.3 40.8 12.1SD . . . . . . . . . . . . . . . . . . . 27 11.1 13.7 5.9Range . . . . . . . . . . . . . . . . 0–100 0–42 16–65 5–25N . . . . . . . . . . . . . . . . . . . . . 22 22 22 22
Source.—Mandel and Semyonov (2005). Can be downloaded from http://www2.asanet.org/journals/asr/2005/048sup4.pdf.
* Listed in descending order of the index values.
1944
TABLE A2Predictions of Log-Odds for Employment in the Labor Force, in Managerial, Lucrative-Managerial, and Female-Typed
Occupations
Labor Force Participation Managerial PositionLucrative-Managerial
Position Female-Typed Occupation
Model 1 Model 2 Model 3 Model 4 Model 5 Model 6 Model 7 Model 8 Model 9 Model 10 Model 11 Model 12
Individual-level effects:Intercept . . . . . . . . . . . . . . . . 2.00** 2.28** 2.02** �1.84** �1.71** �2.26** �2.25** �2.19** �2.39** �1.84** �2.23** �2.00**
(.17) (.28) (.21) (.21) (.42) (.33) (.18) (.37) (.27) (.22) (.40) (.27)Married . . . . . . . . . . . . . . . . . .33** .33** .33** .30** .30** .30** .32** .32** .32** �.05* �.05* �.05*
(.10) (.10) (.10) (.04) (.04) (.04) (.05) (.05) (.05) (.03) (.03) (.03)Bachelor’s degree . . . . . . . 1.00** 1.00** 1.00** 1.13** 1.13** 1.13** 1.34** 1.34** 1.34** �.83** �.83** �.83**
(.07) (.07) (.07) (.14) (.14) (.14) (.12) (.12) (.12) (.19) (.19) (.19)Age . . . . . . . . . . . . . . . . . . . . . �.05** �.05** �.05** .02** .02** .02** .02** .02** .02** �.00 �.00 �.00
(.00) (.00) (.00) (.00) (.00) (.00) (.00) (.00) (.00) (.00) (.00) (.00)Preschool child . . . . . . . . . . �.56** �.56** �.56** .03 .03 .03 .02 .02 .02 .03 .03 .03
(.09) (.09) (.09) (.04) (.04) (.04) (.03) (.03) (.03) (.03) (.03) (.03)No. of children . . . . . . . . . �.04* �.04* �.04* �.02 �.02 �.02 �.02 �.02 �.02 .01 .01 .01
(.02) (.02) (.02) (.02) (.02) (.02) (.02) (.02) (.02) (.01) (.01) (.01)

1945
Gender (femalep1) . . . . . �1.68** �1.69** �1.77** �.48** �.17 �.50** �.74** �.60** �.69** 2.14** 2.21** 1.94**(.25) (.46) (.31) (.12) (.19) (.17) (.14) (.25) (.18) (.15) (.26) (.14)
Country-level effect: Onthe intercept
Maternity leave . . . . . . . . . .001 �.038** �.034** �.024**(.008) (.011) (.009) (.010)
Child care . . . . . . . . . . . . . . �.006 �.019* �.015* �.001(.006) (.010) (.009) (.009)
Public sector . . . . . . . . . . . . .000 �.019 �.036* �.024(.016) (.025) (.020) (.020)
Country-level effect: Onthe gender odds gapb
Maternity leave . . . . . . . . . .024* �.017** �.012* 0.015*(.012) (.006) (.007) (.007)
Child care . . . . . . . . . . . . . . .010 �.014** �.008 .005(.010) (.00) (.005) (.006)
Public sector . . . . . . . . . . . . .042* �.022* �.021 .039**(.023) (.012) (.013) (.010)
N . . . . . . . . . . . . . . . . . . . . . . . . . 22 22 22 22 22 22 22 22 22 19a 19a 19a
Source.—LIS 1990–2000 (see n. 5).Note.—SEs in parentheses.a Australia, Israel, and Italy did not provide detailed occupational categories and were therefore excluded from this analysis.b All models were estimated with and without controlling for female labor force participation. The effects were very similar.* P!.05, one-tailed test.** P!.01.

American Journal of Sociology
1946
TABLE A3Factor Analysis Loadings (Two Factors Solution): Result of a Principal
Component Analysis
Variables
Factor 1:Participation/Segregation
Factor 2:Equality ofOpportunity
Female labor force participation rates . . . .710 .160% women working reduced working
hours . . . . . . . . . . . . . . . . . . . . . . . . . . . . . . . . . . . . . . .846 �.296% women working full-time . . . . . . . . . . . . . . �.679 .435Managerial . . . . . . . . . . . . . . . . . . . . . . . . . . . . . . . . . . .937Lucrative-managerial . . . . . . . . . . . . . . . . . . . . . . .956Female-typed occupation . . . . . . . . . . . . . . . . . . .871Pearson correlation with the WSII . . . . . . . .555 �.524Na . . . . . . . . . . . . . . . . . . . . . . . . . . . . . . . . . . . . . . . . . . . . 16 16
Note.—Total variance explained by the two factors 75.5%. Empty cells indicate absolute valuesless than 0.1.
a Denmark, Slovak Republic, and Spain have no data on working hours; Australia, Israel, and Italyhave no data on female-typed occupation.
REFERENCES
Aigner, D. J., and G. G. Cain. 1977. “Statistical Theories of Discrimination in LaborMarkets.” Industrial and Labor Relations Review 30:175–87.
Alestalo, M., S. Bislev, and B. Furaker. 1991. “Welfare State Employment inScandinavia.” Pp. 36–58 in The Welfare State as Employer, edited by J. E. Kolberg.New York: M.E. Sharpe.
Anxo, D., and L. Flood. 1998. “Patterns of Time Use in France and Sweden.” Pp.91–121 in Women’s Work and Wages, edited by I. Persson and C. Jonung. New York:Routledge.
Asplund, R. 1998. “The Gender Wage Gap in Finnish Industry, 1980–1994.” Pp.190–209 in Women’s Work and Wages, edited by I. Persson and C. Jonung. NewYork: Routledge.
Athey, Susan, Christopher Avery, and Peter Zemksy. 2000. “Mentoring and Diversity.”American Economic Review 90:765–86.
Bianchi, Suzanna M., M. Lynne, and P. K. P. Casper. 1999. “A Cross-National Lookat Married Women’s Earnings Dependency.” Gender Issues 17:3–33.
Blau, F. D., and L. M. Kahn. 1995. “The Gender Earning Gap: Some InternationalEvidence.” Pp. 105–41 in Differences and Changes in Wage Structures, edited by R.B. Freeman and L. F. Katz. Chicago: University of Chicago Press.
Blossfeld, Hans-Peter, and Catherine Hakim, eds. 1997. Between Equalization andMarginalization: Women Working Part-Time in Europe and the United States ofAmerica. New York: Oxford University Press.
Borchorst, Anette. 1994. “The Scandinavian Welfare States: Patriarchal, GenderNeutral or Woman-Friendly?” International Journal of Comparative Sociology 31:1–23.
Bryk, A. S., and S. W. Raudenbush. 1992. Hierarchical Linear Models: Applicationsand Data Analysis Methods. Newbury Park, Calif.: Sage.
Women’s Employment
1947
Chang, Mariko Lin. 2000. “The Evolution of Sex-Segregation Regimes.” AmericanJournal of Sociology 105:1658–1701.
———. 2004. “Growing Pains: Cross-National Variation in Sex Segregation in SixteenDeveloping Countries.” American Sociological Review 69:114–37.
Charles, Maria. 1992. “Cross National Variation in Occupational Sex Segregation.”American Sociological Review 57 (8): 483–502.
———. 2003. “Deciphering Sex Segregation, Vertical and Horizontal Inequalities inTen National Labor Markets.” Acta Sociologica 46:267–87.
Cotter, David A., Joan M. Hermsen, Seth Ovadia, and Reeve Vanneman. 2001. “TheGlass Ceiling Effect.” Social Forces 80:655–82.
Cusack, T. R., T. Notermans, and M. Rein. 1989. “Political-Economic Aspects ofEmployment.” European Journal of Political Research 17:471–500.
Daly, Mary. 2000. “A Fine Balance: Women’s Labor Market Participation inInternational Comparison.” Pp. 467–510 in Welfare and Work in the Open Economy,edited by F. W. Scharpf and V. A. Schmidt. New York: Oxford University Press.
Datta Gupta, Nabanita, Ronald L. Oaxaca, and Nina Smith. 2000. “The Danish GenderWage Gap and Wage Determination in the Private and Public Sectors.” Pp. 53–74in Gender and the Labour Market: Econometric Evidence of Obstacles to AchievingGender Equality, edited by S. Gustafsson and D. Meulders. New York: St. Martin’s.
Drobnic, Sonja. 1997. “Part-Time Work in Central and Eastern European Countries.”Pp. 71–89 in Between Equalization and Marginalization: Women Working Part-Timein Europe and the United States of America, edited by Hans-Peter Blossfeld andCatherine Hakim. New York: Oxford University Press.
Dulepp, Harriet Orcutt, and Seth Sanders. 1992. “Discrimination at the Top: American-Born Asian and White Men.” Industrial Relations 31:416–32.
Esping-Andersen, Gosta. 1990. The Three Worlds of Welfare Capitalism. Princeton,N.J.: Princeton University Press.
———. 1999. Social Foundations of Postindustrial Economies. New York: OxfordUniversity Press.
Federal Glass Ceiling Commission. 1995. “Good for Business: Making Full Use of theNation’s Human Capital.” Washington, D.C.: U.S. Department of Labor.
Ferrarini, Tommy. 2003. “Parental Leave Institutions.” Ph.D. dissertation. StockholmUniversity, Department of Sociology.
Gauthier, Ann Helene. 2000. “Public Policies Affecting Fertility and Families in Europe:A Survey of the 15 Member States.” Paper presented at the annual meeting of theEuropean Observatory on Family Matters, Seville, September.
Gornick, Janet C., and J. A. Jacobs. 1998. “Gender, the Welfare State, and PublicEmployment: A Comparative Study of Seven Industrialized Countries.” AmericanSociological Review 63:688–710.
Gornick, Janet C., and Marcia K. Meyers. 2003. Families That Work, Policies ThatAre Reconciling Parenthood and Employment. New York: Russell Sage.
Gornick, Janet C., Marcia K. Meyers, and Katherine E. Ross. 1997. “Supporting theEmployment of Mothers: Policy Variation across Fourteen Welfare States.” Journalof European Social Policy 7:45–70.
Hakim, Catherine. 1997. Key Issues in Women’s Work. London: Athlone.Hansen, M. N. 1995. “The Vicious Circle of the Welfare State? Women’s Labor Market
Situation in Norway and Great Britain.” Comparative Social Research 15:1–34.———. 1997. “The Scandinavian Welfare State Model: The Impact of the Public Sector
on Segregation and Gender Equality.” Work, Employment and Society 11 (1): 83–99.Hemstrom, M. 1998. “Gender Differences in Pay among Young Professionals in
Sweden.” Pp. 145–69 in Women’s Work and Wages, edited by I. Persson and C.Jonung. New York: Routledge.
Hernes, Helga M. 1987. Welfare State and Women Power: Essays in State Feminism.Oslo: Norwegian University Press.

American Journal of Sociology
1948
Hobson, Barbara. 1990. “No Exit, No Voice: Women’s Economic Dependency and theWelfare State.” Acta Sociologica 33:235–50.
Huber, Evelyne, and John D. Stephens. 2000. “Partisan Governance, Women’sEmployment, and the Social Democratic Service State.” American SociologicalReview 65:323–42.
Jacobs, Jerry A., and Kathleen Gerson. 2004. The Time Divide: Work, Family, andGender Inequality. Cambridge, Mass.: Harvard University Press.
Kamerman, S. B. 1991. “Child Care Policies and Programs: An InternationalOverview.” Journal of Social Issues 47:179–96.
———. 2000. “Early Child Education and Care (ECEC): An Overview of Developmentin the OECD Countries.” International Journal of Education 33:7–29.
Kenworthy, Lane. Forthcoming. “Women-Friendly Policies.” In Jobs with Equality.New York: Russell Sage.
Kolberg, J. E. 1991. “The Gender Dimension of the Welfare State.” InternationalJournal of Sociology 21:119–48.
Kolberg, J. E., and Gosta Esping-Andersen. 1991. “Welfare States and EmploymentRegimes?” Pp. 3–33 in The Welfare State as Employer, edited by J. E. Kolberg. NewYork: M.E. Sharpe.
Korpi, Walter. 2000. “Faces of Inequality: Gender, Class, and Patterns of Inequalitiesin Different Types of Welfare States.” Social Politics 7 (2): 127–91.
Langan, M., and I. Ostner. 1991. “Gender and Welfare: Toward a ComparativeFramework.” Pp. 127–50 in Toward a European Welfare State? edited by G. Room.Bristol: SAUS.
Longva, P., and S. Strom. 1998. “Wage Differentials and Gender in Norway.” Pp.173–89 in Women’s Work and Wages, edited by I. Persson and C. Jonung. New York:Routledge.
Mandel, Hadas, and Moshe Semyonov. 2005. “Family Policies, Wage Structures andGender Gaps: Sources of Earnings Inequality in 20 Countries.” AmericanSociological Review 70:949–67.
Naur, M., and N. Smith. 1998. “Cohort Effects on the Gender Wage Gap in Denmark.”Pp. 122–43 in Women’s Work and Wages, edited by I. Persson and C. Jonung. NewYork: Routledge.
O’Connor, J. S. 1993. “Gender, Class and Citizenship in the Comparative Analysis ofWelfare State Regimes: Theoretical and Methodological Issues.” British Journal ofSociology 44:501–18.
OECD. 1987. “Recent Labour Market Trends.” Pp. 17–42 in Employment Outlook.Paris: OECD.
———. 2001. “Balancing Work and Family Life: Helping Parents into PaidEmployment.” Pp. 129–66 in Employment Outlook. Paris: OECD.
———. 2002. “Women at Work: Who Are They and How Are They Faring?” Pp.61–125 in Employment Outlook. Paris: OECD.
———. 2004. Employment Outlook, chap. 1, Background Material: Annex 1.A2. http://www.oecd.org/document/25/0,2340,en_2649_34495_32388377_1_1_1_1,00.html.
———. 2006. Economic Outlook, 2005, issue 2. http://www.sourceoecd.org/periodical/oedceconomicoutlook.
Orloff, Ann Shola. 2002. “Women’s Employment and Welfare Regimes Globalization,Export Orientation and Social Policy in Europe and North America.” Working Paperno. 12. United Nations Research Institute for Social Development, Geneva.
Phelps, E. S. 1972. “The Statistical Theory of Racism and Sexism.” American EconomicReview 62:659–66.
Polachek, Solomon. 1979. “Occupational Self-Selection: A Human Capital Approachto Sex Differences in Occupational Structure.” Review of Economics and Statistics58:60–69.
Women’s Employment
1949
Rein, M. 1985. “Women, Employment and Social Welfare.” Pp. 37–57 in The Futureof Welfare, edited by R. Klein and M. O’Higgings. New York: Basil Blackwell.
Rose, R. 1985. Public Employment in Western Nations. Cambridge: CambridgeUniversity Press.
Shu, Xiaoling, and M. Mooney Marini. 1998. “Gender-Related Change in OccupationalAspirations.” Sociology of Education 71:44–68.
Siaroff, Alan. 2000. “Women’s Representation in Legislatures and Cabinets inIndustrial Democracies.” International Political Science Review 21 (2): 197–215.
Siim, B. 1988. “Towards a Feminist Rethinking of the Welfare State.” Pp. 160–86 inThe Political Interests of Gender, edited by K. B. Jones and A. G. Jonasdottir.London: Sage.
Sjoberg, Ola. 2004. “The Role of Family Policy Institutions in Explaining Gender-RoleAttitudes: A Comparative Multilevel Analysis of Thirteen Industrialized Countries.”Journal of European Social Policy 14 (2): 107–23.
Sorensen, A., and S. McLanahan. 1987. “Married Women’s Economic Dependency,1940–1980.” American Journal of Sociology 93:659–87.
Sundstrom, Marianne. 1997. “Managing Work and Children: Part-Time Work and theFamily Cycle of Swedish Women.” Pp. 272–88 in Between Equalization andMarginalization: Women Working Part-Time in Europe and the United States ofAmerica, edited by B. H. Blossfeld and C. Hakim. Oxford: Oxford University Press.
Tam, Tony. 1997. “Sex Segregation and Occupational Gender Inequality in the UnitedStates: Devaluation or Specialized Training?” American Journal of Sociology 102:1652–92.
Tomaskovic-Devey, Donald, and Sheryl Skaggs. 1999. “An Establishment-Level Testof the Statistical Discrimination Hypothesis.” Work and Occupations 26 (4): 422–45.
———. 2002. “Sex Segregation, Labor Process Organization, and Gender EarningsInequality.” American Journal of Sociology 108 (1): 102–28.
Wilensky, H. L. 2002. Rich Democracies, Political Economy, Public Policy, andPerformance. Berkeley and Los Angeles: University of California Press.
Wright, Eric Olin, Janeen Baxter, and Gunn Elisabeth Birkelund. 1995. “The GenderGap in Workplace Authority: A Cross-National Study.” American Sociology Review60 (3): 407–35.