a wide-range v h f impedance meter - hp archive · a wide-range v h f impedance meter john h....
TRANSCRIPT
- A Wide-Range V H F Impedance Meter
JOHN H. MENNIE, Senior Engineer
T h e design of a completely self-contained instrument for measuring impedance at V e r y High Frequencies entai ls , as might be expected, a number of interesting engineering prob- lems. Mr. Mennie describes some of those encountered and solved in the development of the BRC RX Meter
Ever since the middle of the last centurywhen Sir Charles Wheatstone first put to practical use a curious electrical balancing network which had been devised a decade before by a fellow Englishman named Christie, the bridge circuit has been accepted a s avaluable and powerful tool in the field of electrical measurement.
Even though today bridges, like almost everything else, have become increasingly complex in order to meet the demands of highly specialized ap- plications, they retain, fcr the most part, the fundamental advantages of convenience, sensitivity and accura- cy which characterized their more straightforward antecedents.
One of the applications in which bridge circuits have been particularly useful in recent years is the measure- ment of impedances at radio frequen-
T y p e 2 5 0 4 .
cies. A number of specialized cir- cuits have been evolved for this pur- pose. One, theScheringBridge, pos- sesses certain features whichmake it outstanding. These features may be summarized a s follows: 1. A constant relationship between the bridge elements is maintained re- gardless of the frequency impressed on the network. 2. Both of the basic variable bridge elements can be air capacitors, which a re infinitely superior to other types of variable impedances for high freq- uency measurement work. 3. The circuit residual impedance can be kept small enough to permit compensation over a wide frequency band. 4. When arranged to measure paral- lel components of impedance, shield- ing problems are drastically reduced.
1
- :Is ~ ./
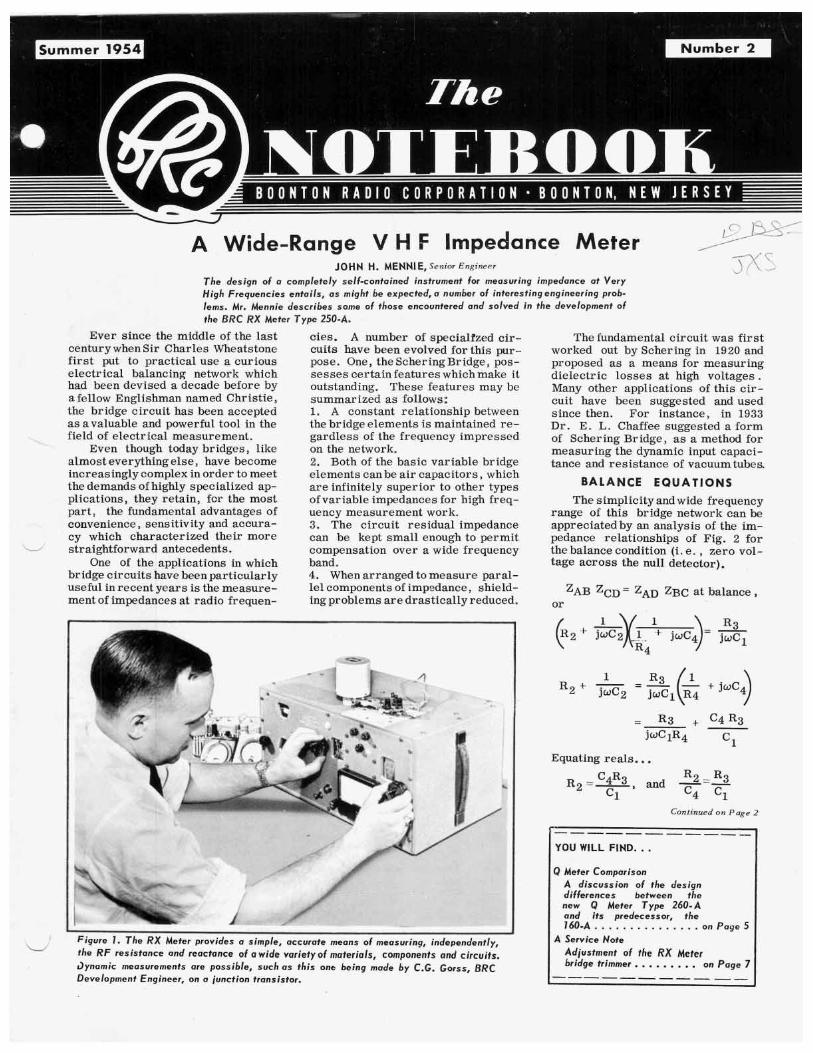
Figure 1 . T h e RX Meter provides a simple, accurate means of measuring, independently, the RF resistance and reactance of a wide variety of materials, components and circuits. dynamic measurements are possible, such as this one being made by C.G. Gorss, BRC Development Engineer, on a junction transistor.
The fundamental circuit was first worked out by Schering in 1920 and proposed a s a means for measuring dielectric losses at high voltages. Many other applications of this cir- cuit have been suggested and used since then. For instance, in 1933 D r . E. L. Chaffee suggested a form of Schering Bridge, a s a method for measuring the dynamic input capaci- tance and resistance of vacuum tubes.
BALANCE E QU A T I 0 N S The simplicity andwide frequency
range of this bridge network can be appreciated by an analysis of the im- pedance relationships of Fig. 2 for the balance condition (i. e. , zero vol- tage across the null detector).
ZAB Z ~ ~ ’ ZAD ZBC at balance, or
Equating rea1.s.. .
Continued on P a g e 2
I-------___
YOU WILL FIND. . . Q Meter Comparison
A discussion of the design differences between the new Q Meter T y p e 260-A and its predecessor, the 160-A . . . . . . . . . . . . . . . on Page 5
Adjustment of the RX Meter bridge t r immer . . . . . . . . . on P a g e 7
A Service Note
--------___

BOONTON RADIO CORPORATION
T H E BRC NOTEBOOK is published four times a year by the Boonton Radio Corporation. I t is nzailed free o f charge to scientists, engineers and other inter- ested persons in the comnzunicatiotzs and electronics fields. The contents may -be reprinted only with written permis- sion from the editor. Your comments and suggestions me welcome, and should be addressed to: Editor, T H E BRC NOTEBOOK, Boonton Radio Corporation, Boonton, N . J.
Impedance Meter (continued)
Equating imaginaries. I.
Figure 2 . The Schering Bridge, arranged to provide measurement of para l le l im- pedance components.
The test sample is connected a- cross corners C and D of the bridge, and its parallel components of re- sistance and reactance effectively change the values of C4 and R4 in the circuit. In order to restore phase and amplitude balance conditions, the variable bridge capacitor C4 must be decreased by an amount equal to the equivalent parallel capacitance of the test sample. If the test sam- ple is inductive, the capacitance of C4 is increased by an amount equal to the resonating capacitance of the parallel inductance.
The parallel resistance of the test i s shunted across R4, reduc- ing its value by a certain percen- tage which changes the R4/C2 ratio and unbalances the bridge. To re- store phase and amplitude balance, variable capacitor C2 is reduced in value by the same percentage that R4 was reduced when shunted by the
test resistance. The variable cap- acitor C2 can thus be calibrated di- rectly in terms of the parallel re- sistance (in ohms) of the component being measured.
T H E RX M E T E R
A refined version of the basic circuit described above forms the heart of the BRC RX Meter Type 250-A, which is designed to measure parallel resistive and reactive im- pedance components at frequencies from 0.5 mc to 250 mc. Unlike most RF impedance measuring devices using the null technique the RX Meter is a self-contained instrument includ- ing withthe bridge circuit its associ- ated oscillators, detector, amplifier and null indicator.
Figure 3 shows a block diagram of the instrument, the operation of which may be briefly described as follows:
The output of the test oscillator, (F l ) , whichcovers a frequency range of 0.5 to250 megacycles, is fed into the bridge circuit. When the im- pedance to be measured is connected across one a r m of the bridge, its parallel resistance and reactance components cause bridge unbalance, and the resulting voltage is applied to the mixer stage. The output of the local oscillator, (F2), which tracks at a frequency 100 kilocycles above F1, is also applied to the mixer, where it heterodynes with the bridge unbalance output frequency, F1, and prbduces a 100 kc difference freq- uency, having a magnitude propor- tional to the bridge unbalance voltage. This voltage is then amplified by a selective 100 kc amplifier to provide the desired bridge balance sensiti- vity. When the bridge controls a re adjusted for balance (minimum in- dicatiod , their respective dials serve as an accurate indication of the paral- lel impedance components of the test sample.
TEST FREQUENCY 100 K C
F I AMPLIFIER
NULL INDICATOR
Figure 3. B lock diagram of the R X Meter T y p e 250-A.
Particular care has been taken, in the mechanical design of the in- strument, to provide adequate shield- ing of the oscillator and mixer in or - der to prevent spurious coupling be-
tween these stages. The detector i s provided with automatic gain control whichprevents the meter from read- ing off scale, thus greatly facilitat- ing the balancing operation when ap- proximate values of the impedance being measured are not known.
'-,'
Figure 4. Convent ioml transformer coup- l ing from bridge corners t o amplif ier.
Use of rugged castings, precision bearings and anti-backlash gears has permitted expansion of the calibrated parallel resistance scale to a useful length of twenty-eight inches, cover- ing from 15 ohms to 100,000 ohms. The "Rp" scale of each instrument is individually calibrated and engraved in spiral form on the surface of a drum dial, the readability being one percentup to 5 ,000 ohms with an ac- curacy of approximately two percent over this range.
BRIDGE COUPLING CONSIDERATIONS
The absence of frequency terms in the balance equation (1) above sug- gests the applicability of this bridge circuit to impedance measurements over an almost unlimited frequency range. Several practical limitations do exist, however, and their effects must be considered in establishing the upper frequency limit for such a device. One of these involves the means used for connecting the signal source and null detector amplifier to the bridge. If the connection intro- duces excessive capacitance across the bridge a rms or excessive loss in the oscillator or detecting system it can seriously affect the operation of the instrument at higher frequencies. This problem can be more readily ap- preciated by a study of Figure 4, which shows a conventional connec- tion between the high bridge corners and the null detector, employing a special type of double-shielded trans- former, T1.
-2-

THE NOTEBOOK
A transformer of this type not only is difficult to design and expen- sive to manufacture but also has an - upper frequency limitation imposed by leakage inductance a s well as the usual low frequency limitation result- ing from low impedance of the wind- ings. The inter-shield capacitance is another handicap, a s it must be in- corporated in the bridge network, thus placing a severe limitation on both frequency and impedance ranges of the bridge. These shortcomings have been overcome by a new approach to the problem, as shown in Figure 5.
Figure 5. Special ly devised system for coupling oscillator t o detector.
The essential feature of this bridge network is that it is divided in two halves, one half being driven by volt- ageE1 and the other half by E2. Let us assume thatvoltages E 1 and E2 are exactly equal in magnitude but opposite in phase, thus producing instantaneous currents 11 and I2 in the direction in- dicated. This arrangement enables us to detect the bridge balance condi- tions by coupling to the null detector through two very small but exactly equal capacitors, ZB and Z c . In the balanced condition, voltage ED be- comes zero, as indicated by our null detector, and the voltage across ZB is exactly equal to that across Z C . This is evident, since the same cur- rent, 13, flows through both ZB and ZC when zero current is drawn by the detector branch. A s X and G are at the same potential, it follows that ZB may be considered effectively in parallel with ZA, and ZC is likewise in parallel with ZD. Thus the voltage across ZA is equal to that across ZD. Now let ZA and ZB in parallel = Z 1 and ZC and ZD in parallel = Z4. Figure 6 represents a simplified form of the bridge networkfor analysis pur- poses.
-,
In Figure 6 E1 = IlZz +- I lZl
E2 = I2Z3 + I2Z4
E1 = E2 (by design)
and I l Z l = I2Z4 at balance
then IlZ2 = I2Z3
. I l Z l 12Z4 and ZlZ3 =Z2Z4 - - - - . . I lzz 12z3 (2)
This impedance a rm relationship is the same as that of a conventional bridge network.
COUPLING TRANSFORMER DESIGN
The above theory is based on the assumption that the transformer sec- ondary voltages be extremely we l l balanced, and it is essential that this be the case over the entire frequency range of 0.5 mc to 250 mc. A very simple transformer was developed (Figure 7) consisting of three Form- ex-insulated wires twisted tightly to- gether and wrapped once around a ferrite core ring. By using one turn the shunt capacitance and leakage in- ductance a re held to a minimum for best high frequency performance. Leakage inductance is only 0.014 microhenry. The high permeability ferrite core serves to hold up the im- pedance of the transformer at the low frequency end. Interwinding capaci- tance C12 is ineffective because 1 and 2 are equipotential points. Although the transformer impedance is quite low, it effectively matches the very low output coupling loop impedance of the oscillator anddrives the bridge with approximately one volt over the entire frequency range from 0.5 to 250 mc.
~ ~~
Figure 6. Simplified bridge network.
COUPLING CAPACITOR DESIGN
The capacitive network used to couple the unbalance output of the bridge to the detector must neces- sarily be very accurately balanced. To achieve such balance the follow- ing requirements were found to be es- sential:
2 IELD AN OUND
w2 T C 3
Figure 7. Balanced coupling transformer design.
3.. Extremely fine adjustment to
2. Loss factor uniformly small for both capacitors.
3. Temperature coefficient uniform- ly small for both capacitors.
4. Mechanical stability to stand vi- bration and aging without change of balance.
5. Complete shieldingto avoid pick- up to grid of detector from any other source than the two bridge corners.
6. Equal lead inductance to maintain effective capacitance balance to 250 mc. The dual capacitor unit which was
speciallydesigned to fulfill these re- quirements is illustrated in Fig. 8.
*o. 001 ppf.
RESIDUAL BRIDGE IMPEDANCES
A s previouslv discussed, the bridge wi l l balance at all frequencies, providing proper relationship between the effective capacitance and resis- tance is maintained up to the highest frequency to be used. Serious de- viations will occur, however, if re- sidual impedances are not either compensated for or made negligible by design.
Figure 9 shows two of the most troublesome residual inductances, L2 and L4. L2 represents the total inductance of series condenser C2
-3-

BOONTON RADIO CORPORATION
T Y P E 260-A Fznal lnstructzon Manuals /or th is in- slrurnenl are now off the press. 11 you have not received your copy please let
I I I us know. I t w i l l be lorwarded zmme-
APPROXIMATELY 2 w w f EACH
I I ' d
P DETECTOR
GRID
Figure 8. Balanced coupling capacitor design.
and resistor R2 and has a value of approximately 0 . 0 3 microhenry. This is sufficient reactance to com- pletely neutralize the effecfive capaci- tance of the 20 ppf condenser C2 at 200 mc. Fortunately this residual inductance, L2, can be effectively removed from the circuit by means of a small shunt capacitance, Cp, across resistor R2. This shunt ca- pacitance, as shown below, is e- quivalent to a series capacitance (c,) whose reactance is very nearly equal and opposite to that of L2 up to the maximum frequency of 250 mc.
R2 - Z of parallel R2 Cp =
1 t wzcp?R2z The series capacitance reactance
For neutralization, let reactance
(within 2.4% at 250 mc. )
Figure 9. Residual impedance in bridge arms.
The second troublesome residual is the inductance, L4, associatedwith the variable condenser standard, C4. This inductance not only causes an ef- fective capacitance inci-ease in C4 at high frequencies but also produces a n e r ror in the resistance readings of highQ reactive components. The lat- ter effect is the result of coupling between L4 and the inductive COIE- ponent of resistor R4. The best so- lution to this problem was found to be a series of fourteen specially de- signed edge-wiping rotor contact springs which provide fourteen in- dividual parallel inductance paths through the condenser, eachpath hav- ing extremely low inductance. By thismeans, the inductance L4 is re- duced to avalue of only 0.0005 micro - henry.
APPLICATION
problem at higher frequencies, and the resulting circuit is often limited in range and application. By com- bining all the necessary test com- ~., ponents in a single, integrated instru- ment, the RX Meter provides ease and rapidity of measurement as well a s unusual flexibility of application.
B I BLlO 0 RA PHY
-. "AC Bridge Methods", B. Hague, 2nd Edition, pp 42-43, 241-242.
2. I'Theory of Thermionic Vacuum Tubes", E. L. Chaffee, 1st Edi- tion, pp 270-271.
3. "ARadio Frequency Bridge for Impedance Measurements from 400 kc to 60 mcV1, Proceedings of the LRE, Nov., 1940.
4. U. S. Patent No. 2,607,827.
THE AUTHOR
TheRX Meter has been found val- uable in a number of diversified in- dustrial and experimental applica- tions. For example, it is being used tomeasure the R F characteristics of balanced and unbalanced transmis- sion lines, of electrical components such a s resistors, and of high and medium loss insulating materials such a s phenolic vacuum tube bases.
The direct measurement of equiv- alent parallel resistance (Rp) of a circuit is particularly useful, since it represents the impedance seen by a vacuum tube or transistor when working into the circuit. Measure- ment ofR also facilitates the deter - mination of power dissipation in a tuned circuit since, when the voltage E across the tankis measured, power dissipation = E2/Rp.
TheRX Meter is particularly ap- plicable to the measurement of trans- istor impedance since DC bias cur- rents up to 50 milliamperes can be passed directly through the sample binding posts without harming the bridge elements. In such applications it is possible to lower the R F test voltage to as low as 20 mv with use- able sensitivity.
P
CONCLUSION
The bridge methods conventional -. ly used for R F impedance measure- ments generally require a composite test circuit consisting of a number of separate interconnected instruments. Setting up such a circuit for specific measurements is usually tedious and time consuming; leakage and un- desirable coupling a re frequently a
-4-
?HE NOTEBOOK
- - - - - - - Q Meter Comparison-------- The recent redesign o f the Q Meter Type 160-A resulted in a more accurate and flexible instrument - the Type 260-A. Here is a detailed discussion o f the changes which were made and how they a f f e c t comparative Q readings on the two instruments.
When the Q Meter Type 260-A was introduced in 1953, its prede- cessors: the Types 100-A and 160-A, had been giving satisfactory labora- tory service for a period of over 18 years, and had long since become a standard for Q measurements.
In spite of the fact that, during recent years, the Type 160-A had proved itself a useful and dependable tool, it had become apparent, in the light of new developments and im- provements in the a r t , that i ts cir- cuit had certainlimitations. For this reason, the& Meter Type 260-A w a s developed, retaining all the valuable characteristics of the 160A, but in- corporating features which elimina- ted or minimized the limitations of the older instrument.
Because these design improve - ments wil l often cause small varia- tions in Q readings between the two instruments, it seems desirable to investigate in detail the reasons for such apparent discrepancies and to formulate an expression for predict- ing them.
D E S I G N D I F F E R E N C E S
Boththe 160-A and 260-A use the same basic measuring circuit, and the blockdiagram shown in Figure 1 ap- plies to either instrument. This de- sign, whichmakesuse of the low im- pedance system of injecting voltage into the measuring circuit, is based on the resonant voltage rise princi- ple described in a previous article!
OSCILLATOR TI INJECTION VOLTAGE MONITOR
QVOLTMETER
I -
(.-/
Figure 7 . Q Meter block diagram.
Thus (for Q 1) 1O)Q E/e, where Q is the quality factor of the measur- ing circuit, e is the injected voltage and E is the voltage across the re- sonating capacitor.
The principle requirements for a successful Q measuring system are ,
1. A low-distortion oscillator. 2. Anaccurate system for moni-
toring the injection voltage. 3. A low injection impedance a-
cross which e is developed.
4. A low-loss internal resonating capacitor,
5. An accurate high impedance Q voltmeter for measuring E.
Each of these must be carefully de- signed to minimize the residual para- meters which tend to make the indi- cated Q (of the Q measuring circuit) differ from the effective Q of the un- known. Primarily, the discrepan- cies in Q readings which may be found between the two Q Meters at certain frequencies are caused by those im- provements in the design of the 260A whichresult inlowered residual para- meters,
S O U R C E S O F E R R O R
1. Oscillator Harmonics The calibration of the Q volt-
meter is dependent on accurate in- dication of the ratio E/e. Er rors in the Q readings can be caused by harmonics present in the oscillator output, due to the fact that the therm- ocouple used to monitor the current in the injection resistor produces a meter deflection proportional to the total heating effect of the distorted current, while, because of the se- lectivity of the measuring circuit, the indication of the Q voltmeter is proportional only to the fundamental component of the oscillator output . Although this effect is considerably reduced because of the square law response of the thermocouple: it may still be noticeable when distortion is present. Early models of the 160-A (serial numbers below 4581) had some harmonic distortion in the oscillator output on the low frequency band (a- round 150 kc), which did introduce some er ror due to this effect. The effect is negligible in the 260-A be- cause of the extremely low distor- tion present. 2. Injection Resistor
The injection resistor (Ri in fig- ure 1) is in ser ies with the resonant circuit, and when components are measured having low equivalent ser- ies resistance (high Q a t high freq- uencies), the value Ri, which adds to the resistance of the unknown, be- comes a large part of the total ser- ies resistance. This causes the Q Meter to indicate a Q value lower than that of the unknown component. Evi- dently it is desirable to keep the in- jectionresistance as low as possible. For this reason, the 0.04 ohm injec-
lion resistor of the 160-Awas reduced to 0.02 ohm in the 260-A.
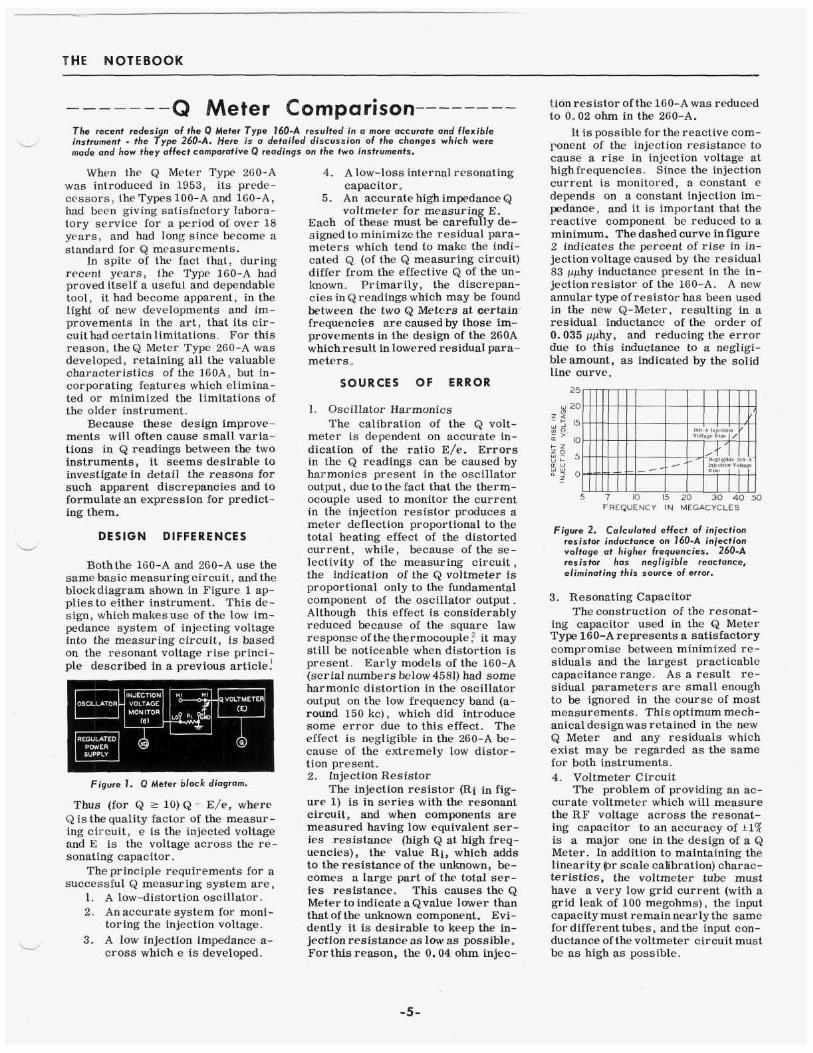
It is possible for the reactive com- ponent of the injection resistance to cause a rise in injection voltage at highfrequencies. Since the injection current is monitored, a constant e depends on a constant injection im- pedance, and it is important that the reactive component be reduced to a minimum. The dashed curve in figure 2 indicates the percent of r ise in in- jection voltage caused by the residual 83 pphy inductance present in the in- jectionresistor of the 160-A. A new annular type of resistor has been used in the new Q-Meter, resulting in a residual inductance of the order of 0.035 pphy, and reducing the e r ror due to this inductance to a negligi- ble amount, as indicated by the solid line curve.
FREQUENCY IN MEGACYCLES
Figure 2 . Calculated e f f e c t of injection resistor inductance on 160-A injection voltage at higher frequencies. 260-A resistor has negligible reactonce, eliminating this source o f error.
3. Resonating Capacitor The construction of the resonat-
ing capacitor used in the Q Meter Type 160-A represents a satisfactory compromise between minimized re- siduals and the largest practicable capacitance range. A s a result re- sidual parameters a re small enough to be ignored in the course of most measurements. This optimum mech- anical designwas retained in the new Q Meter and any residuals which exist may be regarded as the same for both instruments. 4. Voltmeter Circuit
The problem of providing an ac- curate voltmeter which will measure the R F voltage across the resonat- ing capacitor to an accuracy of 11% is a major one in the design of a Q Meter. In addition to maintaining the linearity (or scale calibration) charac- teristics, the voltmeter tube must have a very low grid current (with a grid leak of 100 megohms), the input capacitymust remain nearly the same for different tubes, and the input con- ductance of the voltmeter circuit must be as high as possible.
-5-

BOONTON RADIO CORPORATION
In order to achieve and maintain these characteristics, the use of a special tube is found to be impera- tive. The BRC 105-A is manufac- tured and tested specifically for ap- plication in the Q voltmeter circuit. A review of available tube types dur- ing the development of the Type 260-A confirmed the fact that this was the only tube which could meet such re- quirements, and it was therefore in- cluded in the design of the new in- strument.
Several other changes in the volt- meter circuit were found desirable. The addition of ?'Lo Q" and t t ~ " scales in the new instrument necessitated a slightly different operating point for the voltmeter tube. In addition, the physicalarrangement of the grid cir- cuit was changed to provide a higher natural resonant frequency, and ad- ditional bypassing was added in the plate circuit of the voltmeter, causing the Type 230-A to indicate Q more accurately at low frequencies and at low capacitance settings of the re- sonating capacitor o
TYPICAL EXPERIMENTAL DATA
To illustrate the differences which might be expected in Q readings be- tweenthe Q Meters Types 160-A and 260-A, a set of standard inductors Type 103-A was measured on two re- presentative instruments which were selected to be a s nearly average a s possible after a careful survey of Q readings on several hundred produc- tion units. Figure 6 is a plot of the readings obtained, and figure 3 in- dicates the percent difference in these readings vs frequency. Note that these graphs apply only to inductors with Q values in the ranges indicate d . In general, the percent difference at any frequency is proportional to Q.
FORMULA FOR PREDICTING Q READING DIFFERENCES
The empirical formula at the bot- tom of this page has been suggested byR. E. Laffertyto describe the dif- ferences in& readings obtained on the two instruments. - -
Term C 1
.. -~~
L50-500 kc- 5-10 mc -10-50 mc I
This formula is the result of com- bining actual measurements taken with both average instruments in a form indicated by the known theoreti- cal differences in measuring circuits described previously. It will be ob- served that the terms of the formula are grouped according to frequency domain. Term A represents the dif- ference in input conductance between the two Q voltmeters, term B cor- rects for the difference of insertion resistance value, and term C com- pensates for the inductance of the in- sertion resistor in the Type 160-A Q Meter. The latter term was de- rived using the average value of 83 pphy for this inductance. It will be noted that each term is equal to 1 outside the frequency range speci- fied. Thus, from 50 to 500 kc, only term A is significant, while from 500
Figure 3. Difference in Q readings obtained by measuring a set o f 103-A inductors on both 160-A and 260-A, with the readings o f fhe latter used as o bose. Each line la- belled with a coil number indicates the percent difference in readings obtained by meas- uring the same coil, throughout its resonant frequency range, on both instruments. The lines labelled 35 uuf, 100 uuf, and 400 uuf respectively, indicate the percent difference in Q readings resulting at these internal resonating capacitances.
d
FREQUENCY (K C)
Figure 4. Values o f the factor K, for use in term A of corrdation equation.
kc to 5 mc, all terms are approxi- mately 1 and the two instruments will have good agreement. From 5 to 1 0 mc, term B becomes significant, while terms A and C may be disregar- ded. Above 1 0 mc, B and C must be used. In general, the need for cor- rection is proportional to the magni- tude.
It should be noted that this cor- relation equation does not account for the effects of the harmonic con- tent of the oscillator output of early Q Meters Type 160-A at the upper ends of the low frequency bands. Q
w o
z IO
k 20 n kj 30
' 40 30 50 70 100 200 300 w
U
LL W
W
Y
RESONATING CAPACITANCE M U T
Figure 5 . Colculoted percent differences in Q readings between 260-A (used as base) and 160-A, at three values o f Q as read on the 260-14.
-6-
THE NOTEBOOK
IO0 KC I MC F REQU ENCY
IO-MC
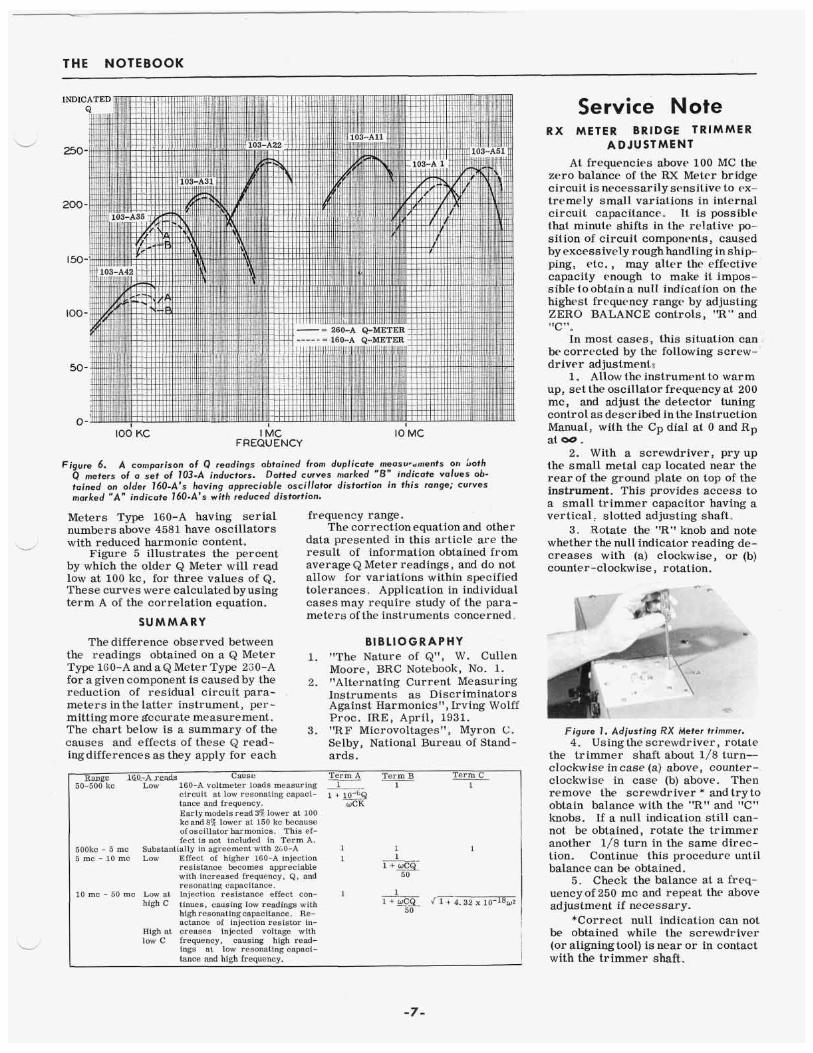
Figure 6. A comparison of Q readings obtained from duplicate measwcments on Loth Q meters of o set of 103-A inductors. Dotted curves marked "8" indicate va lues ob- tained on older 160-A's having appreciable oscil lator distortion in th is range; curves marked "A" indicote 160-A's with reduced distortion.
Meters Type 160-A having serial numbers above 4581 have oscillators
Figure 5 illustrates the percent by which the older Q Meter wil l read low at 100 kc, for three values of Q. These curves were calculated by using term A of the correlation equation.
S U M M A R Y
- with reduced harmonic content,
frequency range. The correction equation and other
data presented in this article are the result of information obtained from average Q Meter readings, and do not allow for variations within specified tolerances. Application in individual cases may require study of the para- meters of the instruments concerned..
The difference observed between B I B L I O G R A P H Y the readings obtained on a Q Meter 1. "The Nature of Qtt , W. Cullen Type 160-A and a& Meter Type 2j0-A for a given component is caused by the 2, IlAlternating Current Measuring reduction of residual circuit para- Instruments as Discriminators meters inthe latter instrument, per- Against Harmonics", Irving Wolff mittingmore ziccurate measurement. Proc. IRE, April, 1931. The chart below is a summary of the 3. 'IRF Microvoltages", Myron C . causes and effects of these Q read- Selby, National Bureau of Stand- ingdifferences as they apply for each ards.
Moore, BRC Notebook, No. 1.
Cause T e r m A T e r m B Term C _ _ _ - R a n S 1GO.-AESa!h 50-500 kc Low 160-A voltmeter loads measuring 1 1 1
circuit at low resonating capaci- 1 + ~JJ-~X tance and frequency. WCK Earlymodelsread 3'%lower at 100 kc and 8% lower at 150 kc because of oscillator harmonics. This ef- fect i s not included in Term A.
500kc - 5 mc Substantially in agreement with 260-A 1 5 mc - 10 mc Low Effect of higher 160-A injection 1
resistance becomes appreciable with increased frequency, Q, and resonating capacitance.
10 mc - 50 mc Low at Injection resistance effect con- tinues, causing low readings with highresonatingcapacitance. Re- actance of injection resistor in-
High at creases injected voltage with low C frequency, causing high read-
ings at low resonating capaci- tance and high frequency.
high C
1 1 +-
50
Service Note R X M E T E R B R I D G E T R I M M E R
A D J U S T M E N T At frequencies above 100 MC the
zero balance of the RX Meter bridge circuit is necessarily scmsitive to ex- tremely small variations in internal circuit capacitance, I t is possible that minute shifts in the relative po- sition of circuit components, caused by excessively rough handling in ship- ping, etc. , may alter the effective capacity enough to make it impos- sible to obtain a null indication on the highest frequency range by adjusting ZERO BALANCE controls, "R" and "C".
In most caseg, this situation can be corrected by the following screw- driver ad justmenta
1. Allow the instrument to warm up, set the oscillator frequency at 200 mc, and adjust the detector tuning control as described in the Instruction Manual, with the Cp dial at 0 and Rp at 00 .
2. With a screwdriver, p ryup the small metal cap located near the rear of the ground plate on top of the instrument. This provides access to a small trimmer capacitor having a vertical : slotted adjusting shaft,
3. Rotate the "R" knob and note whether the null indicator reading de- creases with (a) clockwise, or (b) counter-clockwise , rotation.
c
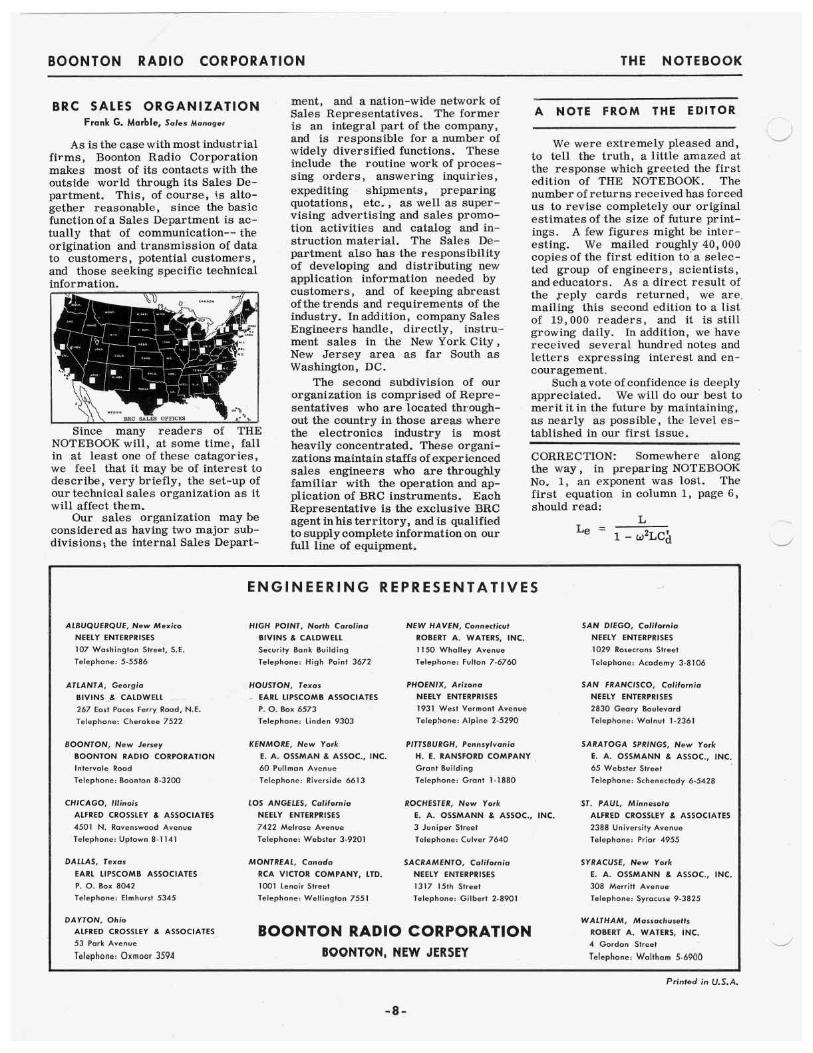
Figure 1 . Adjusting R X Meter trimmer. 4. Using the screwdriver, rotate
the trimmer shaft about 1/8 turn- clockwise in case (a) above, counter- clockwise in case (b) above. Then remove the screwdriver * andtryto obtain balance with the 'IR" and V'' knobs. If a null indication still can- not be obtained, rotate the trimmer another 1/8 turn in the same direc- tion. Continue this procedure until balance can be obtained.
5. Check the balance at a freq- uencyof 250 mc and repeat the above adjustment if necessary.
*Correct null indication can not be obtained while the screwdriver (or aligning tool) is near or in contact with the trimmer shaft.
-7 -
BOONTON RADIO CORPORATION THE NOTEBOOK
BRC SALES ORGANIZATION Frank G. Marble, Sales Monoger
As is the case withmost industrial firms, Boonton Radio Corporation makes most of its contacts with the outside world through its Sales De- partment. This, of course, i s alto- gether reasonable, since the basic function of a Sales Department is ac- tually that of communication-- the origination and transmission of data to customers, potential customers, and those seeking specific technical information.
v - , \"" D O
*.I,<D
BRC S OFFICES
Since many readers of THE NOTEBOOK wiil, at some time, fall in at least one of these catagories, we feel that it may be of interest to describe, very briefly, the set-up of our technical sales organization as it will affect them.
Our sales organization may be considered as having two major sub- divisions; the internal Sales Depart-
ment, and a nation-wide network of Sales Representatives. The former is an integral part of the company, and is responsible for a number of widely diversified functions. These include the routine work of proces- sing orders, answering inquiries, expediting shipments, preparing quotations, etc., as well as super- vising advertising and sales promo- tion activities and catalog and in- struction material. The Sales De- partment also has the responsibility of developing and distributing new application information needed by customers, and of keeping abreast of the trends and requirements of the industry. In addition, company Sales Engineers handle, directly, instru- ment sales in the New York City, New Jersey area as far South as Washington, DC.
The secona subdivision of our organization is comprised of Repre- sentatives who are located through- out the country in those areas where the electronics industry is most heavily concentrated. These organi- zations maintain staffs of experienced sales engineers who a r e throughly familiar with the operation and ap- plication of BRC instruments. Each Representative is the exclusive BRC agent inhis territory, and is qualified to supply complete information on our full line of equipment.
A NOTE FROM THE EDITOR 1 ,
W We were extremely pleased and, to tell the truth, a little amazed at the response which greeted the first edition of THE NOTEBOOK. The number of returns received has forced us to revise completely our original estimates of the size of future print- ings. A few figures might be inter- esting. We mailed roughly 40,000 copies of the first edition to'a selec- ted group of engineers, scientists, andeducators. A s a direct result of the ,reply cards returned, we are mailing this second edition to a list of 19,000 readers, and it is still growing daily. In addition, we have received several hundred notes and letters expressing interest and en- couragement.
Such a vote of confidence is deeply appreciated. We will do our best to merit it in the future by maintaining, as nearly as possible, the level es- tablished in our first issue.
CORRECTION: Somewhere along the way, in preparing NOTEBOOK No. 1, an exponent was lost. The first equation in column 1, page 6 , should read:
L Le =
1 - w2LCB
ALBUQUERQUE, New Mexico NEELY ENTERPRISES 107 Washington Street, S.E. Telephone: 5-5586
ATLANTA, Georgia BlVlNS & CALDWELL 267 East Paces Ferry Road, N.E. Telephone: Cherokee 7522
BOONTON, New Jersey BOONTON RADIO CORPORATION Intervole Rood Telephone: Boonton 8-3200
CHICAGO, Illinois ALFRED CROSSLEY 8 ASSOCIATES
4501 N. Rovenswood Avenue Telephone: Uptown 8-1 141
DALLAS, Texas
EARL LIPSCOMB ASSOCIATES P. 0. Box 8042 Telephone: Elmhurst 5345
E N G I N E E R I N G R E P R E S E N T A T I V E S
HIGH POINT, North Carolina BIVINS & CALDWELL Security Bonk Building Telephone: High Point 3672
HOUSTON, Texas . EARL LIPSCOMB ASSOCIATES
P. 0. Box 6573 Telephone: Linden 9303
KENMORE, New York E. A. OSSMAN & ASSOC., INC. 60 Pullman Avenue Telephone: Riverside 6613
LOS ANGELES, Californim NEELY ENTERPRISES 7422 Melrose Avenue Telephone: Webster 3-9201
MONTREAL, Canada RCA VICTOR COMPANY, LTD. 1001 Lenoir Street Telephone: Wellington 7551
NEW HAVEN, Connecticut ROBERT A. WATERS, INC. 1150 Whalley Avenue Telephone: Fulton 7-6760
PHOENIX, Arizona NEELY ENTERPRISES 1931 West Vermont Avenue Telephone: Alpine 2-5290
PITTSBURGH, Pennsylvania n. E. RANSFORD COMPANY Grant Building Telephone: Grant 1-1880
ROCHESTER, New York E. A. OSSMANN 8 ASSOC., 3 Juniper Streef Telephone: Culver 7640
SACRAMENTO, California NEELY ENTERPRISES 1317 15th Street Telephone: Gilbert 2-8901
DAYTON, Ohio ALFRED CROSSLEY 8 ASSOCIATES
Telephone: Oxmaar 3594
BOONTON RADIO CORPORATION BOONTON, NEW JERSEY
53 Pork Avenue
INC.
SAN DIEGO, California NEELY ENTERPRISES
1029 Rosecrans Street
Telephone: Academy 3-8106
SAN FRANCISCO, California NEELY ENTERPRISES 2830 Geory Boulevard Telephone: Walnut 1-2361
SARATOGA SPRINGS, New York E. A. OSSMANN 8 ASSOC., INC. 65 Webster Street Telephone: Schenectody 6-5428
ST. PAUL, Minnesota ALFRED CROSSLEY 8 ASSOCIATES 2388 University Avenue Telephone: Prior 4955
SYRACUSE, New York E. A. OSSMANN 8 ASSOC., INC. 308 Merritt Avenue Telephone: Syracuse 9-3825
WALTHAM, Massachusetts ROBERT A. WATERS, INC. 4 Gordon Street
Telephone: Wolthom 5-6960
Printed in U.S.A.
- 8 -