a workstation's communication performance … a workstation's communication performance...
TRANSCRIPT

5
A workstation's communication performance benchmark
Kurt Malya, Ajay Gupta b, and Satish Mynam C
a Old Domininion University, Department of Computer Science, Norfolk, Virginia 23529-0162. Fax: (804) 683-4900. email: maly@cs. odu. edu bald Domininion University, Department of Computer Science, Norfolk, Vir'ginia 23529-0162. Fax: (804) 683-4900. email: [email protected] COld Domininion University, Department of Computer Science, Norfolk, Virginia 23529-0162. Fax: (804) 683-4900. email: [email protected]
Abstract In this paper we propose a communication benchmark suite: BTU(Bits To the User). In the BTU benchmarking process, the vendor supplies a workstation running a UNIX* operating system, we install our benchmark program and connect the workstation to a testbed which emulates a LAN/WAN environment. The benchmark run will submit the workstation to a carefully designed combination of tests. The result is a predictor of what the user, at the application level, can expect in terms of bits sent to or received from a remote host. Our benchmark takes into account concurrent activities such as CPU and I/O activities which compete for resources 011 the test machine. The combination of these activities and concurrent activities on the network will interfere with the test machine's communication performance. The automated BTU benchmark test suite produces results at various levels of abstractions ranging from a single number, characterizing average performance in the style of SPEC92, to a TCP time sequence chart for abnormal behaviors. We intend to serve the user of a workstation by providing information which should enable the users to make a reasonable judgment when acquiring a workstation with a specific configuration within certain cost constraints. Our results when used along with existing benchmarks will make a powerful combination for predicting overall performance. Neither price nor SPECmarks are as good a predictor of communication performance as that measured by BTUs. We conclude this paper with a discussion of extensions to faster
*TM of US/' , Inc.
B. Baumgarten et al. (eds.), Testing of Communicating Systems© Springer Science+Business Media Dordrecht 1996

62 Part Three Special Types of Testing
networks and our plans for having the community accept this proposal as a communication benchmark.
Keywords Communication Benchmark, TCP /IP, Ethernet, ATM , FDDI, SPECmarks.
1 INTRODUCTION
In this paper we report on our efforts to develop a benchmark which will test the performance of a workst.ation communicating with other workstations across a network. That is, we will measure how a particular vendor's choices in hardware design and operating system implementation influence that workstation's performance with regard to communication. Vtle are interested in providing a predictor to actual performance in a heterogeneous en vironment when concurrent activities occur on a workstation and on the network and, in particular, provide a predictor at the user level. Hence we call our benchmark the BTU benchmark which will give an indication as to what the typical user can expect a specific workstation to deliver to an application in terms of B(its) T(o the) U(ser) , measured in Mb/s. We restricted the domain of investigation to UNIX in an Ethernet LAN connected to an arbitrary WAN.
At this time there exist a number of benchmarks, e.g., SPEC, which predict how fast workstations will compute. These benchmarks are widely referenced by administrators and users to determine which workstations will best suite their needs. A number of studies have been performed on the maximum performance of various protocol stacks. Typically these studies use ttcp and experiment with various system parameters such as buffer management and window sizes. Invariably, these studies are designed to elicit under which parameter configuration the workstation can push the most data to the network . Although quite useful in themselves these studies do not tell us what we can expect in terms of data in and out of the machine at the user level when competing processes are present on the workstation and the network is loaded with contending traffic.
The client/server computing paradigm is becoming pervasive, distributed computing's importance is increasing, and information accessed over the Internet is becoming a dominant application for workstations and PCs(for the rest of the paper we shall use the term workstation to mean both) . In this environment compute power is only one factor, and not necessarily the most important, in determining the real time an application needs to complete. Very possibly, the dominant factor may be communication. For example, how many people use low end Sun workstations as routers in an Ethernet LAN wit.hout realizing that they limit themselves to fairly low level throughput?
Thus, we believe having a communication benchmark which will rank various vendors ' workstations will be of great use in todays world of network computing. We need to be aware though that communication time depends on two factors: bit network flow rate on the physical channel and bit host processing rate inside the host from the time bits arrive

A workstation :s communication performance benchmark 63
at the interface and are handed over to the application. The first fador depends on wheiJwr the physical network is a 9.6K baud modem line, an Ethernet, an ISS Mbls ATM network, how many routers are between source and destination and similar characteristics; all are totally independent of the the workstatioll. The second factor depends on such things as the protocol stack used, the bus architecture, and the operating system. If the network flow rate is slTJall compared to the bit host processing rate the user will probably see not. much difference in total communication time for different workstations even if they are ranked differently by the benchmark. If, however, the network flow rate is sufficiently high (say > T 1) than the host processing time becomes the dominant aspect of the commllnication time and the ranking will be relevant. Consider workstation A rated at 2.5 IJTUs (2 .. 5 Mbls to the user - to be explained in the rest of the paper) and workstation B rated at 1.6 BTUs, both executing Net.scape (installed OIl a server in an Ethernet LAN) t.o access a page in England (with a .56Kb link somewhere in between). Bringing up a Netscape window involves intensive network commllnication between the server and the client and might take 20s by workstation A but .will take about 305 on workstation B. How(~ver there will be not much difference in retrieving the page from England because the dominant factor will be the slow network flow rate. Another example would be FTP over a T 1, olle would expect workstation A to do significantly better because host processing is the dominant factor.
In this paper we address the lack of sllch a communication benchmark by proposing an automated benchmark s1Iite with results for a specific workstation structunxl by ]('vels of details:
it will provide a single BTU number reflecting the performance of a Illllnlwr of applications in a typical network environments with typical concurrent activities on a host machine together with a penalty factor measuring how much the performance of a workst.ation is degraded when compute and communication processes exist concurrently; it. provides a specification for the testbed together with source code for replication of the test results; it provides BTL" information on the performance for individual, common application classes together with their penalty factors; it. provides detailed data on the performance of individual components of the benchmark test for the knowledgeable user and software and hardware architects; for every abnormal test result it. provides a TCP time sequence number chart for detailed analysis.
In Section 2 of t.his paper we give some of the background on benchmarking in general and performance t.est.ing; in Section :1 we ou(]ine our approach to the design of our proposed benchmark t.est suite. Section 4 describes the implementation and the automalioll process we developed. Sectioll .') provides a discussion of the st.atist.ical methods involv('<i and the result.s of applying our benchmark to a set of machines of variolls vendors with varying operat.ing systems and configurations(SlJN, SGI, PC) over a fixed Et.hernet. VVe conclude with a discllssion and outline of future work and possible models for operating communication benchmarking in Section 6.
2 BACKGROUND
The PARhIJENClI, a comprehensive set of parallel benchmarks (Hockney, 1994), concentrates mainly on CPU performance and includes only one component on network perfor-

64 Part Three Special Types of Testing
mance. It is a test of how well a machine can send data to another host while varying the message length. A number of programs and suites for MACH OS emphasize either low level system calls or study CPU intensive applications like SPECINT, CINT 2.0 and CFP 2.0 and as such are only relevant as far as general benchmark principles are concerned. A great deal of work has been done to determine the performance of networks. Netperf (Rick, 1996) is a public domain database containing network performance data implemented on various workstations. Also, there have been results reported for transport protocols (e.g. TCP) (Nettest, 1992) over various media (e.g. Ethernet, ATM (Allyn, 1993) ) and tests on Network File Servers (NFS). A study on WAN congestion control and performance evaluation of TCP (Ahn, 1994) provides methods to benchmark TCP performance and to visualize the differences between the Tahoe, Reno and Vegas versions of TCP. It uses sequence number versus time plots of the wide area connections. The study reveals the performance of different versions of TCP and the improvement in congestion control using adaptive algorithms in TCP. All of these benchmarks used and defined a large number of inconsistent terms. RFC 1242 attempts to define a set of terminology that vendors can use to measure and report performance of network systems. This provides users with comparable data from different vendors. The emphasis in all these studies, however, is on maximum performance under ideal conditions and no correlation is made with background network, CPU, and 10 activities.
3 APPROACH
The difficulty with designing a benchmark suite for communication is the many fadors which influence overall performance of communication . For example, communication is influenced by the media access protocol, the bus architedure of the workstation , the im· plementation of the higher level protocols, the operating system and most importantly by activities occurring concurrently on the host machine and the net.work. No benchmark can test all the combinations of these factors and we were forced to make choices in our design . First and foremost we decided on a most common situation in the networking environment: UNIX workstations running TCP /IP in a LAN with connections to other hosts in a MAN or WAN. Secondly, we decided early on to concentrate our first. effort on a widely distributed network, albeit slow speed: Ethernet. Our intention is to extend the benchma.rk suite to work for highspeed networks(ATM, FDDI, Fast Ethernet) as well. Thirdly, since this is a proposal for a communication benchmark we limited our study to a small number of well known vendors in the workstation arena: SCI, DEC, SUN, and Intel processor based personal computers(in this paper we give only results for various Sun models, SCI, and one PC). For applications competing for resources we considered ftp, telnet, rlogin, X windows Clients, CPU intensive and disk I/O intensive applica.tions. Applications which are CPU intensive we considered are software compressed/decompressed video and realtime audio applications. Bulk Data transfer applications such as client/server distributed databases, storage and retrieval of multimedia streams from storage devices come under I/O intensive and network intensive applications.
In this paper we will compare and rank a number of workstations. We intend to serve the user of a workstation and provide data on how a particularly configured workstation can be expected to perform in a realistic network environment. The information should
A workstation :s- communication performance benchmark 65
enable the users to make a reasonable judgment when acquiring a workstation with a specific configuration within certain cost constraints. Thus, the results of the benchmark test are given together with a detailed specification of the test machine and its list price.
The second audience group we are addressing is the hardware and software designers of workstations which can use our results to fine tune their operating system and identify hardware and software bottlenecks in the architecture of their workstations. To satisfy both audiences we provide for each machine a report structured by levels of abstractions. One is a greatly abstracted set: the bit rate a user(BTU) can expect, on the average, to communicate in a realistic setting and the penalty incurred by combining net with host activities. Part of this set is also the BTUs and penalties for specific application classes which can be useful if a user needs to have certain applications run efficiently. The second set is a detailed tabulation of the performance of each component of the benchmark test suite and TCP time sequence charts for abnormal cases.
Briefly, our approach is to have workstations from various vendors, preloaded with their implementation of UNIX operating systems and TCP/IP, subjected to our benchmark. The benchmark will create a controlled, fair and replicable test environment. It consists of two major components: the Benchmark Testbed and the Benchmark Suite.
The benchmark testbed: it is used to emulate a communications environment. To emulate a communication environment with a slow link somewhere in its route, the testbed will introduce pre-set packet delays. Similarly, to emulate a lossy environment, the testbed will drop packets(or a sequence of packets) with a pre-set probability at set intervals. Details of the testbed are given in (Maly, 1996). The major components of the testbed are as follows. Test Workstation (Wtest ): this is the workstation which is being tested and monitored to assess its performance. Active Black Box Workstation (Wactive):
this workstation has its operating system kernel modified such that it emulates various communication environments including packet loss and delay. Network traffic is generated between Wactive and Wtest in each of the cases specified in the Benchmark Suite section. This Black Box is called active because of its inherent functionality namely, generating load between itself and Wtest. Almost all the network activity of the benchmark is caused by Wactive except for the two Black Boxes participating in the tests together(as described in cases 5 and 6 of the Benchmark Suite). At the end of the test Wact;ve also postprocesses the raw results to produce the final report . Passive Black Box Workstation (Wpassive): this workstation is used to generate background network traffic between Wtest
and itself and is used to emulate simultaneous sending and receiving from two competing workstations to and from Wtest. Wpassivc also has its kernel modified to allow for WAN emulation for the multiple connections to W te• t . Each of Wactive and Wpa.sive is called a "Black Box" because these workstations present a uniform and replicable communications environment. The only component that is varied in this testbed is W test . As a result, all the workstations under test will undergo the same level of test. All modifications to emulate a new communications environment is done in the Black Boxes (Wpa •• ive and Wactive)
while W. est is not changed at all to reflect the real communication efficiency of the test machine. The network between Wact;v., Wpassive and Wtest for this study is Ethernet. In the implementation section we shall describe the details on the communication between Wactive, Wpassive, and W test necessary to obtain a fair and fully automated benchmark test.
The benchmark suite is the set of programs to be executed on the testbed to test a workstation's communication performance. We have categorized the programs as "Net-

66 Part Three Special Types of Testing
work Activities" and those which compete for resources on Wtest as "Host Activities". Network Activities are the core activities of the entire benchmark. Measurements made during these activities are used to compute the BTU number for Wtest. These activities are classified according to: type of data transfer, multiplicity of connections, direction of traffic, LAN and WAN topology. Host Activities include CPU , I/O and communication intensive applications such as FTP which compete with network activities for shared resources such as bus, memory, media and disk.
In summary, the benchmarking process consists of the following steps: i)initiate network to be emulated; ii) execute Network, CPU, I/O, and FTP activities separately to obtain baselines; iii) execute Network and CPU activities concurrently; iv) execute Network and I/O activities concurrently; v) execute Network and FTP activities concurrently; vi)compute BTU as the normalized average of all Network activities(while competing for resources); vii)compute compound penalty on all activities .
4 THE IMPLEMENTATION
In this section, we describe our implementation of the benchmark we discussed in the previous section. First, we shall describe the technical details of the testbed followed by a description of the components which make up the benchmark suite. Finally, we provide details on the automation of the benchmark process. This latter part proved to be important because of the large number of runs and the time they consume in obtai ning the BTUs for a particular machine.
4.1 TestBed Description
Our current testbed, consists of the three machines Wadi ve, Wpassivc and Wtest. Wa ctive is a SUN SPARC 10 with 1.2GB disk and 32MB RAM, Wpassive is a SUN SPARC 2 with 1.2GB disk and 32 MB RAM. Both of the workstations run SunOS 4.1.3 UNIX operating system. The specific selection of workstations for the blackboxes obviously will influence the performance of the test machine but the test bed will remain the same for a period of at least six months. All machines to be tested will have the same, replicable testbed and the machines selected as black boxes represent machines commonly found in heterogeneous LANs.
We modified the IP layer in Wa ctive and Wpassive to emulate various communications conditions. To emulate a WAN envi ronment we have modified the kernel IP layer to allow for packet delays and drops. To maintain efficiency in the black boxes we did not add a timing functionality to the kernel but used simple counters(of IP packets) to implement the drop and delay of k sequential packets at certain intervals. A major factor in communication performance is how a particular implementation of TCP /IP handles time-outs and acknowledgments, particularly, when losses occur for an entire sequence of packets(such as in buffer overflow at a switch or router). In our implementation we allow for a recurring pattern of dropping k\ packets at packet number n\ mod 100, k2 sequential packets at packet number n2 mod 100, ... , and km sequential packets at packet number nm mod 100, all the drops adding up to an overall drop probability of x%.

A workstation s communication performance benchmark 67
4.2 Benchmark suite
The causes for bandwidth limitation and latency at the user level are twofold: network latencies and host latencies. Network latencies are host independent but dependent on the network load situation and the speed of the physical medium of the network. Host latencies are independent of the network but dependent on the host's CPU speed, hardware architecture, and the operating system. Various factors influence the overhead incurred by a message moving upstream/downstream in the system. They include: copying of data, buffer management, protocol processing, interrupt handling, system call handling, unpredictable overheads obtained due to different message sizes, internal TCP path taken( avoid redundant buffer copying). All these cause reduction in CPU cycle available for other applications. The concurrent network and the host activities contend for network bandwidth and CPU cycles. Host activities include a CPU activity, FTP activity and an I/O activity :
Host-.activities = {CPU, FTP, I/O} (1)
Host activities: Network activities to be measured are run concurrently along with other host activities such as CPU, I/O and other network activities. On Wtest, a CPU activity is a process which keeps the CPU busy 100 percent of the time. This job has two parts; the first part performs complex arithmetic calculations which acts as a basic CPU intensive processing step and the second part allocates and frees chunks of memory, copying the results of the complex calculations in the first part to the a,dditionally alloca,ted memory thus loading the MMU (memory management unit) and occupies a significant bandwidth on the bus interface. This two steps are repeated over a number of times so that the overall baseline CPU time is comparable with the baseline network activity's time. The I/O activity constantly reads a large file and copies it into another file which is repeat.ed a number of times, again to make its time comparable to the baseline network activity's time. Disk I/O contends with network data processing for bus, memory and context switches, Network activities are performed between Wtest, Wpassive and Wacti ve
workstations. At the core of all our components of the benchmark suite is a modified TTCP, we call COMM, which acts as the sending and receiving agent for the user on Wtest·
In order to emulate the heterogeneous nature of networks and the likelihood for a test machine to encounter communication hosts with small window sizes we kept the window sizes on the blackboxes at 4K. To achieve our objective of giving not only average overall performance but also results specific to certain application classes, we used the buffer size to characterize the classes and representative applications to name these classes:
ApplicatiOlu;et = {(Telnet, 100 bytes), (FTP, 1024 bytes), (Audio, 1250 bytes) , (Netscape, 4K bytes) , (Video, 64K bytes)} (2)
These five applications represent an interactive telnet application, ftp or Mosaic or any typical application which uses a standard lK buffer size, a typical 16KHZ audio sample data captured for every 1/8th of a second (1250Bytes) or a compressed 160 x 120 sized video frame, a typical intelligent application which uses 4K to optimize the buffer management, and some hulk data application which needs to transfer large amount of

68 Part Three Special Types of Testing
Wactive Hostrx'F--': _.(8_
11. -...... ------+. G~---~
tj'" : W test. );~I-Netw __ ork_R_esoun:es __ __l
8 ,,-:> LO~<:V CI Netwut Resources : V --0 ,','; CPU Resources
OlMMl c' ,/ CPUResoor=· 8,:::/· I-I/O-SU-b--sys-lem----l 8 <---j-~ Resoun:es
8/,I-IIO-
S-U
b--s-Y,-.. m--I .... .............. .
........ ~ ReIowce AUoc.tioa
'I'CPCoNledioft
~HostAt:tiritiess
o eo.u.tioa lcieati6er
Resources
(8FI'PI
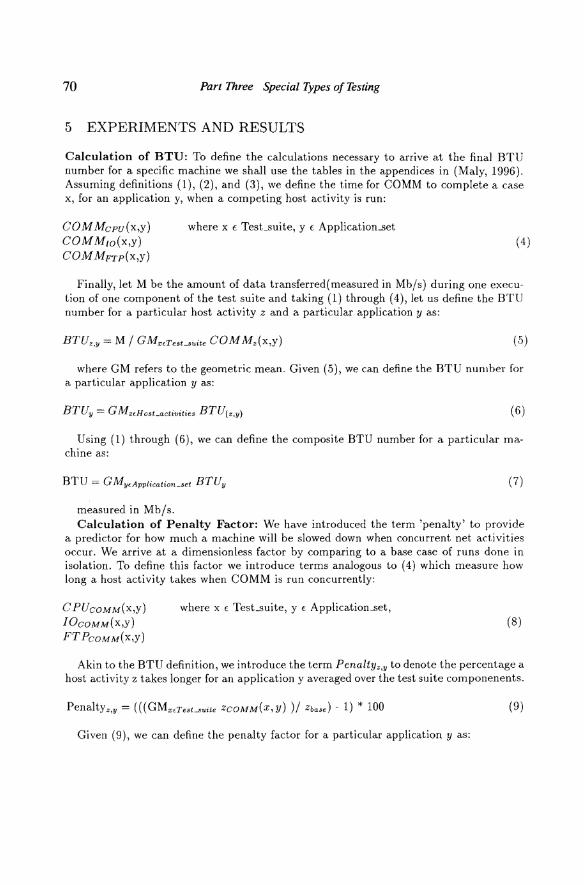
Figure 1 Connectivity of the different workloads and activities in Automated Benchmark
data. The seemingly odd size of L22KB (1250Bytes) was added because, when analyzing software resident in our system we found applications with odd message sizes executed quite frequently.
Benchmark suite components: The benchmark suite consists of six components (described below) which taken together represent a large percentage of network activities in a typical LAN environment and which will exercise most factors influencing communication performance_
Test..suite = {SEND, RECV, SEND+DL, SEND.RECV, 2RECV+DL, 2SEND+DR} (3)
Each component will send 32Mb of data according to the description below. In the cases of the benchmark suite, we make reference to the delay introduced, DL, and the overall drop probability of packets, DR. The range of values for DL is from 0.1 ms to Is and for DR from 0.0001 to 0.01 according to patterns defined earlier(for example: for DR = 0.01 we drop 1 packet at 200, 3 consecutive packets at 400, and repeat this for

A workstation :s communication performance benchmark 69
every 400 packets. The acronym at the end of each case will be used in later discussions to refer to that case: i) execute COMM with Wtest sending the data to Wactive( SEN D)j
ii) execute COMM with W test receiving the data from Wactive( RECV)j iii) execute the COMM with delay added to the IP of Wa ctive and W test sending the data ( SEND+DL)j
iv) execute COMM with two connections to Wtest from Wactive one receiving and one sending ( SEN D_RECV)j v) execute COMM with two connections from Wtest, one to Wactive and another to W"assive along with delay added to the IP of the blackboxesj the test machine is receiving half the amount of total data from each of the blackboxes ( 2 xRECV +DL)j vi) execute COMM with two connections from Wtest, one to Wactive
and another to W"assive along with packet dropping added to the IP of the blackboxesj the test machine is sending half the amount of total data to each of the blackboxes( 2x SEND+DR).
4.3 Automation of the Benchmark Process
We have automated the entire benchmark processing software including data collection and post-processing. The user has to start the server on the two blackboxes and a client program on the test machine. For the typical machine it takes from 1 to 2 hours to complete the benchmarkj upon completion, Wactive collates the results by collecting the data from the test machine. In order to do so, five connections are made between the three machines namely Wactive, W"assive and Wtest. The automation connections which are shown in Figure 1, are: i) connection between Wactive and Wtest (8dj ii) connection between W".ssive and W test (82); iii) a connection between Wactive and Wtest to get control information from Wtest (83 )j iv) a connection between Wactive and Wpassive to get control information ( SBB)j v) a connection between Wactive and Wtest to obtain FTP control (8FTP ).
Each process interacts with the processes on the other machines. Processes are concurrently started on the test machine whenever load (CPU, I/O, FTP activities) is introduced concurrent with the net activity. The network and host activities have been chosen so that the baseline execution times of these activities are comparable. When a host load activity such as a CPU job is run concurrently with a network activity, both of them will obviously finish later than they did in the baseline case. We included a restart capability which became necessary when some machines could not complete a particular component.
The Wactive benchmark process is started with the test machine name as an argument, which then makes connection 8 3 with the test machine and SBB with W"assive. These two connections synchronize the benchmark process till the end of the test. Whenever FTP load is applied on Wtesl> SPTP is used and remains idle in the remaining span of timej idle TCP probe packets are neglected in the calculation of the results. At each step of the test (SEND, RECV, ... ) the results of the activities are collected from Wtest using S3, 8FTP and from W"assive using SBB . A simple token mechanism is used for the proper synchronization of the testbed which occupies a minor amount of network bandwidth. This amount is negligible since the synchronization packets are sent only after each test is performed.
70 Part Three Special Types of Testing
5 EXPERIMENTS AND RESULTS
Calculation of BTU: To define the calculations necessary to arrive at the final BTU number for a specific machine we shall use the tables in the appendices in (Maly, 1996) . Assuming definitions (1), (2), and (3) , we define the time for COMM to complete a case x, for an application y, when a competing host activity is run:
COM Mcpu(x,y) COMMIO(x,y) COM MFTP(x,y)
where x t TesLsuite, y t Application...set (4)
Finally, let M be the amount of data transferred(measured in Mb/s) during one execution of one component of the test suite and taking (1) through (4) , let us define the BTU number for a particular host activity z and a particular application y as:
BTUz,y = M / GMxcTest-,uite COM Mz(x,y) (5)
where GM refers to the geometric mean. Given (5), we can define the BTU number for a particular application y as:
BTUy = GMz<Host_activities BTU(z,y) (6)
Using (1) through (6), we can define the composite BTU number for a particular machine as:
(7)
measured in Mb/s. Calculation of Penalty Factor: We have introduced the term 'penalty' to provide
a predictor for how much a machine will be slowed down when concurrent net activities occur. We arrive at a dimensionless factor by comparing to a base case of runs done in isolation. To define this factor we introduce terms analogous to (4) which measure how long a host act ivity lakes when COMM is run concurrently:
CPUCOMM(X,y) IOcoMM(x,y) FTPcOMM(X,y)
where x € TesL~uite, y € Application...set , (8)
Akin to the BTU definition, we introduce the term Penaltyz,y to denote the percentage a host activity z takes longer for an application y averaged over the test suite componenents.
Penaltyz,y = «(GMnTeSLsuite ZCOMM(X,y) )/ Zbase) - 1) * 100 (9)
Given (9), we can define the penalty factor for a particular application y as:

A workstation s communication performance benchmark 71
Table 1: Final BTU Ranking
BTU Rank Machine Architecture BTU(Mbps) Penality SPEC'92 ($)
Sparc20 2.87 20 76.9 15,195
2 PC (Linux) 2.72 21 32.2 2,900
3 Sparc5( Solaris) 2.45 33 65.3 7,74.5
4 Sparc5(SlInOs4.1.4 ) 2.19 28 65.3 7,715
( 10)
Finally, taking (8) through (10), we can define the penalty factor for a part.i clliar machine as:
Penalty == G MycApplication_sc! Penaltyy ( 11)
measured as a percentage increase of host. activities. Statistics: In the final report (Maly, 1995) we provide for each machine the arith
metic(AM), geometric(GM), and harmonic(HM) means for each of the tables. For statistical analysis, we chose the unweighted geometric mean(GM) as the measure for BTUs and the penalty factor: (5) through (11). Though the harmonic mean preserves the measure by giving better consistency, the comparison of two systems is independent of the reference system only for the weighted HM unweighted GM (Ran, 1995 and Jain , 1995). A small mix of efficient components instead of a large mix of components can rate the systems provided the weights and cases are properly selected, independent of the reference system. Since we do not rate the weights for each application and the cases in the test suite, we chose the unweighted GM as our standard measure of network performance.
5.1 Key results:
In (Maly, 1995) we reported on the results for BTU9.'> where we tested fOIlT different machines(Sparc10, SGI, DEC Alpha, PC) wit.h our benchmark suite. The SPECrna.rks(65, 36, 158, 32 respectively) gave quite a different ranking among the machines than the BTU ranking(2.4, 0.99, 2.37, 2.07) which clearly showed that CPU performance is not the only factor affecting the network throughput . Neither was price an effective predictor for communication performance. For BTU96, the one reported on in this paper, we have made significant changes based on feedback from the community.
For this paper we include the results of testing four differellt workstations. The specific configuration of each machine can be found in (Maly, 1996) . In Table 1 we provide the BTU numbers, the BTU ranking of these machines along with the SPECint '92 numbers (PDS, 1996) , the penalty fa.c tors, and the cost of each machine tested. Finally, we provide
72 Part Three Special IJpes of Testing
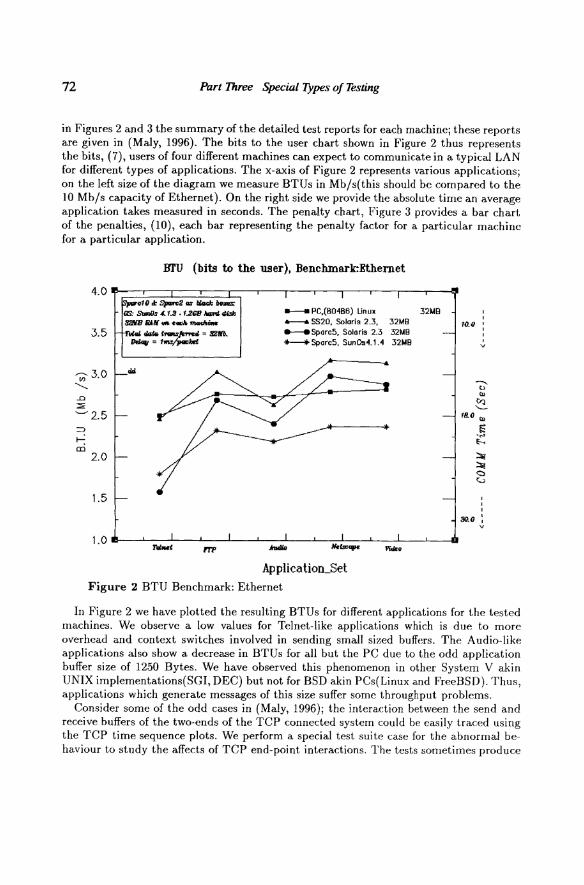
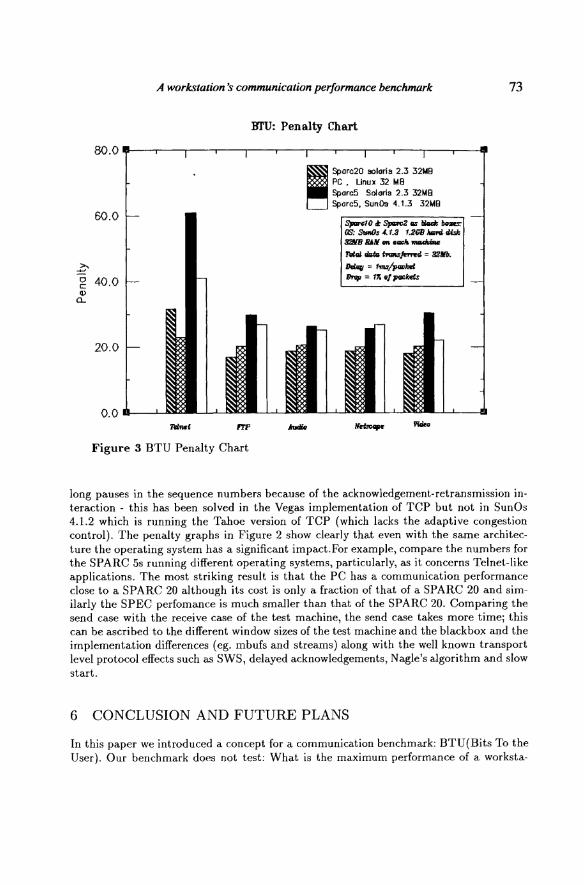
in Figures 2 and 3 the summary of the detailed test reports for each machine; these reports are given in (Maly, 1996). The bits to the user chart shown in Figure 2 thus represents the bits, (7), users of four different machines can expect to communicate in a typical LAN for different types of applications. The x-axis of Figure 2 represents various a.pplications; on the left size of the diagram we measure BTUs in Mb/s(this should be compared to the 10 Mb/s capacity of Ethernet). On the right side we provide the absolute time an average application takes measured in seconds . The penalty chart, Figure 3 provides a bar chart of the penalties, (10), each bar representing the penalty factor for a particular machine for a particular application.
4.0
3.5
--;;;-3.0 '-.. .0 ::::; ~2.5
=> ....: CD
2.0
1.5
cIA
BTU (bits to the user), Bencbmark:Ethernet
___ PC,(B04B6) Unux 32/,11l ..--.. SS20, Solari. 2.3, 32MB _ Spare5, Solari. 2.3 32/,1B *-* Spare5, 5un0s4.1.4 32MB
Application~et
Figure 2 BTU Benchmark: Ethernet
, , 10.0 I , , ,
v
---... l>
'" ~ tll.O '"
~ .",
h
~ ~ <::> <:.>
30.0 : v
In Figure 2 we have plotted the resulting BTUs for different applications for the tested machines. We observe a low values for Telnet-like applications which is due to more overhead and context switches involved in sending small si7,ed buffers. The Audio-like applications also show a decrease in BTUs for all but the PC due to the odd application buffer size of 1250 Bytes. We have observed this phenomenon in other System V akin UNIX implementations(SGI, DEC) but not for BSD akin PCs(Linux and FreeBSD). Thus, applications which generate messages of this size suffer some throughput problems.
Consider some of the odd cases in (Maly, 1996); the interaction between the send and receive buffers of the two-ends of the TCP connected system cou ld be easi ly traced using the TCP time sequence plots. We perform a special test suite case for the abnormal behaviour to study the affects of TCP end-point interactions. The tests sometimes produce
.z:.
A workstation:S comnmnicalion performance benchmark
HfU: Penalty Chart
80.0.---.--,---.--,---.---.--.---.--,---.--,--__
60.0
~ Spare20 solaris 2.3 32t.1B PC, Unux 32 I.IB Spare5 Solaris 2.3 32t.1B Spare5, Sun Os 4.1.3 32MB
SpDn10 tI: S)IIm;I1 .... _ bnEr: OS: SarrIJ. 4.1.8 1.11ClJ""'" <Us); 32NB lAM ... _ ..............
~ ... m....ft!-It = 32Mb.
DtrlfI(I = 1 ..... ;,...,~
g 40.0 IMp = 1T.·IJHII'~
v a...
20.0
O. 0 U-----'--"'"
tTl'
Figure 3 BTU Penalty Chart
73
long pauses in the sequence numbers because of the acknowledgement-retransmission interaction - this has been solved in the Vegas implementation of TCP but not in SunOs 4.1.2 which is running the Tahoe version of TCP (which lacks the adaptive congestion control). The penalty graphs in Figure 2 show clearly that even with the same architecture the operating system has a significant impact.For example, compare the numbers for the SPARC 5s running different operating systems, particularly, as it concerns Telnet-like applications. The most striking result is that the PC has a communication performance close to a SPARC 20 although its cost is only a fraction of that of a SPARC 20 and similarly the SPEC perfomance is much smaller than that of the SPARC 20. Comparing the send case with the receive case of the test machine, the send case takes more time; this can be ascribed to the different window sizes of the test machine and the black box and the implementation differences (eg. mbufs and streams) along with the well known transport level protocol effects such as SWS, delayed acknowledgements, Nagle's algorithm and slow start.
6 CONCLUSION AND FUTURE PLANS
In this paper we introduced a concept for a communication benchmark: BTU(Bits To the User). Our benchmark does not test: What is the maximum performance of a worksta·
74 Part Three Special Types of Testing
tion in a homogeneous network under ideal circumstances? Rather, the benchmaTk will submit the workstation to a carefully designed combination of activities on the host to be tested(e.g., CPU, I/O) and the blackbox network and produce an indicator for what the user can expect in terms of bits sent/received to/from a remote host. Secondary results are the penalty individual activities experience under the influence of net activities. On the one hand we intend these results for the workstation buyer who can use the data together with the configuration specification and the list price to make a well reasoned decision whether or not the workstation meets the user's needs when compared to the results of other workstations, on the other hand we believe these results can provide insights to the architects as to the location and nature of communication bottlenecks of a particular workstation .
We have implemented t.he concept and described in this paper an automated process which will produce for each machine tested a structured report with results of varying detail. Tlw results from testing four different workstations indicate this benchmark produces data sets which are not necessarily related to CPU speeds but are truly an indicat.ion on how a particular hardware architecture and operating systems handles network communication. Neither the speed of the CPU(measured in either Mhz or SPECmarks) nor the price was a predictor of communication performance as measured in BTOs. Thus, we believe we have made the case that this proposed benchmark satisfies the stated objecti ve.
Several issues relating to the testbed remain unresolved to a certain degree. It is not obvious how easy it is to adapt the design of the benchmark such that it will enable us to test a machine's performance over several networks of different speed(ATM, FDDI, and T based 100 Ethernet) . By the time these highspeed networks become prevalent though, we feel confident that we will have such a benchmark suite. We performed a number of experiments to see the dependence of the results on the actual configuration of the testbed. We used various workstations as testbed machines and compared the results. In general, the actual numbers were indeed different but they did not affect the ranking of the tested workstat.ions. Neither did the problem cases for the tested workstat.iono change: the same components for the same message size produced results out.side the normal range. This supports our contention that the t.ype of the testbed machines is not important as long as we keep them representative of current installed bases. It leads though to the problem we are facing: How should such a benchmark suite proceos be run? We see two clearly different. models: one is similar to the testing procedure used by (Scott, 1996) to evaluate network routers and switched internetworking products and the second would emulate SP ECmarks. In the first model, an independent organization such as N 1ST, MITRE or OSF would maintain an up-to-date testbed and periodically publish rankings of machines supplied by vendors for testing. In the second model, we would explicitly specify in great detail the current testbed and provide the software throughout the Web for anybody who can duplicate the testbed . These individuals or organiza.tions could then run the benchmark test themselves. This latter process implies that the testbed would be certified by some cent.ral organization.
Acknowledgment: we are indebted to the help Rajeshkumar Vangala provided in the automation process of the BTU benchmark development.

A workstation s communication performance benchmark 75
REFERENCES
Allyn, Romanow. (1993). Preliminary Report of Performance Results for TCP over ATM with Congestion. Technical Report, SunMicrosystems Inc.
Hockney, R. and Berry, M. (1994). Public International Benchmarks for Parallel Computers: PARKBENCH Committee Report-I. Scientific Programming, vol3 (2), pp. 101-146.
Nettest . (1992) . Nettest a network Benchmarking tool. Technical Report, Cray R esearch Inc.
Clark, D. David. (1982). RFC 813, Window And Acknowledge Strategy in TCP. MIT Laboratory for Computer Science, CSCG.
Stevens, W . Richard . (1994) . TCP/IP Illustrated Volume l. ISBN 0-201-63354-X, pp. 325 - 330; pp. 263 - 285, Addison-Wesley Professional Computer Series.
Jones, Rick. (1996). Network Performance Home Page. http://www.cup.hp.com/netperf/NetperfPage.html.
PDS. (1996) . PDS: The Performance Database Server. http://performance.netlib.org/ performance/html/spec.html.
Bradner, Scott. (1996). Networks Consulting Services. http://www.sncLcom/netrpt.htm. Maly, K., Gupta, A., Mynam, S. and Khanna, S. (1995). B(its) T(o the) U(ser): a Com
munication Benchmark Proposal. Technical Report. Department of Computer Science, OD U, http) / lite.ncstrl.org:3803/Dienst/U 1/2.0/Describe/ncstr!.odu_cs
Maly, K., Gupta, A., Mynam, S. and Khanna, S. (1996). BTU: A Host Communication Benchmark , Technical Report, http://www. cs.odu. edu/~btu/papers/ TechReport96 .ps, Department of Computer Science, ODU, Norfolk, April 96.
Ran, Giladi and Niv, Ahituv. (1995) . SPEC as a Performance Evaluation Measure. IEEE Computer, pp. 33-42.
Jain, R. (1991). The Art of Computer systems Performance Analysis: Techniques for Experimental Design , Measurement, simulation as a Performance Evaluation Measure. Wiley and Sons, New York.
Ahn, J . and Dan>lig, P.B, et .a!. (1994). TCP Vegas: New Techniques for Congestion Detection and Avoidance. SIGCOMM 94.
BIOGRAPHY
Kurt J. Maly received the Dip!. Ing. degree from the Technical University of Vienna, Aust.ria, and the M.S. and Ph.D. Degrees from the Courant Institute of Mathematical Sciences, New York University, New York, NY. He is Kaufman Professor and Chair of Computer Science at Old Dominion University, Norfolk , VA . Before that, he was at the University of Minnesota, both as faculty member and Chair. His research interests include modeling and simulation , very high-performance networks protocols, reliability, interactive multimedia remote instruction, Internet resource access, and software maintenance. His research has been supported by DARPA, NSF, NASA, CIT, ARPA and the U.S. Navy among others.
Ajay Gupta graduated with a B.E. in Electronics Engineering from Bangalore University. He received the M.S. degree in Computer Science from Old Dominion University.
76 Part Three Special Types of Testing
Currently he is Director of Computer Resources, Department of Computer Science, Old Dominion University as well as an adjunct faculty in the same department. His research interests include high speed networking and enterprise security.
Satish K.Mynam is an M.S. student in Computer Science at Old Dominion University. His research interests include Computer Networks, Operating Systems, Distributed Systems and Systems Performance Evaluation. He obtained his B.Tech in Computer Science and Engineering from Jawherlal Nehru Technological University, India.