a1 water resource zones - severn trent · appendix a - how much water do we have available? 1...
TRANSCRIPT

Appendix A - How much water do we have available?
1 Severn Trent Water: Final Water Resources Management Plan 2014
A1 Water Resource Zones
Following the 2009 Water Resources Management Plan, we informed Defra of our plan to review
the structure of our six water resources zones in time for the 2014 WRMP. The purpose of the
review was to ensure that we comply with the EA definition of a water resource zone being the
“largest possible zone in which customers share the same risk of a resource shortfall”.
We completed our review of resource zones in 2009-10 and shared the results and supporting
evidence to Defra and the EA in June 2010. Our review took into consideration the supply and
distribution enhancements we are undertaking during AMP5 and resulted in 15 water resource
zones, as illustrated in figure A1.1 below. The new zones provide a more accurate representation
of how customers will be served by our network at the end of AMP5, and meet the EA’s resource
zone definition. Our 2011 and 2012 WRMP annual reviews have included a summary of the
outturn water supply and demand position for each of these new zones.
Figure A1.1: Severn Trent Water’s new Water Resource Zones
Defining our Water Resource Zones
Our review of water resource zones used a combination of the best available company asset
configuration records along with operational expert judgement. Following this review, we have also
reconfigured the water demand and supply models used for our water resources planning.
Our approach to reviewing the structure of our existing water resource zones was agreed with the
EA in January 2010, and can be summarised as follows:

Appendix A - How much water do we have available?
2 Severn Trent Water: Final Water Resources Management Plan 2014
• We have reviewed our major strategic sources and assessed how the connectivity of our
supply system allows them to support our smaller sources of water.
• For supply / demand investment planning, our scenario is an extended hot, dry season (eg
summer / autumn 2003).
• We have considered to what extent the conjunctive supply system can meet demand without
the need for hosepipe bans / restrictions.
• Where the distribution network constrains our ability to share water between sources to meet
demand, this forms a “cleavage line” between zones.
• Our assessment is based on delivery of the AMP5 supply resilience schemes.
• Our assessment did not include short term emergency risks due to engineering failure or ‘peak
day’ demands as these are not relevant to the definition of a water resource zone. They are
covered by our resilience and isolated communities investment plans and our local distribution
investment plans.
The key steps in our approach to reviewing our Water Resource Zones are summarised in Figure
A1.2 below.

Appendix A - How much water do we have available?
3 Severn Trent Water: Final Water Resources Management Plan 2014
Figure A1.2: The process of defining Water Resource Zones

Appendix A - How much water do we have available?
4 Severn Trent Water: Final Water Resources Management Plan 2014
Characteristics of our Water Resource Zones
The new zones vary widely in scale, from the Strategic Grid zone which supplies the majority of
our customers, to the small zones of Mardy and Bishops Castle which supply much smaller
populated areas. These zones have very different water resources challenges, with some
requiring significant investment in the long term to ensure secure supplies, while others require
minimal investment to maintain the current assets and infrastructure. These future pressures are
explained throughout Appendices A, B and C of this WRMP, while chapter 3 sets out our long
term plans to ensure sufficient supplies are available in each of these zones.
The 2011-12 characteristics of our 15 water resource zones are summarised in Table A1.1.
Table A1.1: Water Resource Zone 2011-12 characteristics
Name Deployable Output (Ml/d)
WAFU (Ml/d)
Number of households
Population served
Leakage (Ml/d)
Distribution Input (Ml/d)
Bishops Castle 4.67 4.57 2,762 7,530 1.32 2.74
Forest & Stroud 44.99 42.05 54,907 130,387 14.52 41.79
Kinsall 5.00 4.81 4,907 11,938 1.42 4.58
Llandinam & Llanwrin
19.85 19.17 17,981 42,309 5.43 14.58
Mardy 3.65 3.54 3,138 8,119 1.02 2.68
Newark 15.5 15.03 20,190 46,080 2.14 11.70
North Staffordshire
149.99 147.50 229,241 523,241 29.53 126.17
Nottinghamshire 269.87 263.77 443,809 1,048,927 49.29 237.32
Rutland 0.00 10.00 11,874 32,376 2.07 8.20
Ruyton 5.32 5.10 4,503 12,428 1.79 4.42
Shelton 142.99 140.5 196,206 470,743 27.07 109.50
Stafford 28.00 27.03 38,976 93,567 6.07 24.43
Strategic Grid 1469.56 1319.58 2,092,597 5,061,528 304.94 1244.19
Whitchurch & Wem
10.90 10.79 12,192 30,398 3.30 9.41
Wolverhampton 66.00 65.4 99,850 232,280 18.92 64.16

Appendix A - How much water do we have available?
5 Severn Trent Water: Final Water Resources Management Plan 2014
A2 Calculating Deployable Output
Deployable Output (DO) is defined in the Environment Agency’s Water Resources Planning
Guidelines as:
“the output for specified conditions and demands of a commissioned source, group of sources or
water resources system as constrained by; hydrological yield, licensed quantities, environment
(represented through licence constraints), pumping plant and/or well/aquifer properties, raw water
mains and/or aqueducts, transfer and/or output mains, treatment, water quality and levels of
service.”
As a concept it is described in the below figure from UKWIR WR27 Water Resources Planning
Tools 2012 guidance (Akande et al., 2011).
Figure A2.1: Deployable Output Concept
We have 15 water resource zones, these are split between conjunctive use zones and
groundwater only zones. The deployable output for the zones is calculated differently depending
on which type of zone they are. The zones and methods used are tabulated below.

Appendix A - How much water do we have available?
6 Severn Trent Water: Final Water Resources Management Plan 2014
Table A2.1: Deployable Output Methodologies Used
Resource Zone Type Method Reason
Strategic Grid Conjunctive
Use
Aquator
Modelling
Both groundwater and surface water
supplies with a complex network.
Nottinghamshire Conjunctive
Use
Aquator
Modelling
Both groundwater with surface water
imports from Strategic Grid zone.
Shelton Conjunctive
Use
Aquator
Modelling
Both groundwater and surface water
supplies.
Wolverhampton Conjunctive
Use
Aquator
Modelling
Both groundwater and surface water
supplies.
Forest and Stroud Conjunctive
Use
Aquator
Modelling
Both groundwater and surface water
supplies.
North Staffordshire Conjunctive
Use
Aquator
Modelling
Both groundwater and surface water
supplies
Newark Conjunctive
Use
Aquator
Modelling
Groundwater with imports from the
Nottinghamshire zone.
Stafford Ground
Water Only
Aquator
Modelling
Historically part of the Aquator
Model
Bishops Castle Ground
Water Only
UKWIR
Assessment Groundwater Only
Mardy Ground
Water Only
UKWIR
Assessment Groundwater Only
Llandinam and
Llanwrin
Ground
Water Only
UKWIR
Assessment Groundwater Only
Kinsall Ground
Water Only
UKWIR
Assessment Groundwater Only
Whitchurch and
Wem
Ground
Water Only
UKWIR
Assessment Groundwater Only
Ruyton Ground
Water Only
UKWIR
Assessment Groundwater Only
Rutland
Bulk Import
Agreed
Import
amount
Import from Anglian Water.
In the following sections we explain how we have derived the deployable output for our zones,
firstly for groundwater and then for the conjunctive use zones.

Appendix A - How much water do we have available?
7 Severn Trent Water: Final Water Resources Management Plan 2014
A2.1 Groundwater Deployable Output Method
The deployable output of all of our operational groundwater sources was assessed in 2006 in
accordance with the UKWIR methodology (UKWIR, 1995 and UKWIR, 2000) to inform our
WRMP09. During 2011-12, we have again reviewed and updated the deployable output of our
groundwater sources in accordance with the guidance in the UKWIR methodologies. This has
included a review of groundwater output capacity in relation to all constraints (licence limitations,
infrastructure limitations, aquifer limitations and distribution limitations), and review of nitrate and
water quality, climate change and EA sustainability changes impacts on groundwater DO.
Source Performance Diagrams (SPDs) were derived for each borehole source in order to
determine the drought year average deployable yield and the peak week deployable yield. In this
document the drought year average DO will be referred to as “average DO” and the drought year
peak week DO as ”peak week DO”.
For the assessment, we have updated all available groundwater datasets to mid 2012, and our
assessment of groundwater DO incorporates the recent 2011/12 drought, which represented some
of the lowest groundwater levels recorded across our resource area.
The review of groundwater DO was carried out in eight stages:
Stage 1: Review of previous DO assessment
The first stage of the process reviewed the groundwater source information reported in our
WRMP09. This forms part of the audit trail for this WRMP.
Stage 2: Source Licence verification
This stage of the process verified the average and peak licence details reported in our
WRMP09 assessment. Several sites were identified to have minor licence changes since
the WRMP09 assessment.
Stage 3: Review of network constraints
This stage of the process identified any network constraints up to the first Distribution
Storage Reservoir (DSR). Several additional constraints to those identified in 2009 were
recorded.
Stage 4: Review of geological / borehole construction logs
This stage of the process re-reviewed the geological and borehole construction logs on a
site by site basis, to determine any additional constraints to those identified in 2009. No
additional constraints were identified.
Stage 5: Operational verification
This stage of the process captured expert judgement from our operational staff on the
deployable output of our groundwater sources. Information on site infrastructure and
processes (pump capacities, pump depths, treatment and booster capacities, operational
interlocks and Programmable Logic Controls) was captured and reviewed and recent actual

Appendix A - How much water do we have available?
8 Severn Trent Water: Final Water Resources Management Plan 2014
production data was also examined. This gave an indication of average and peak DO
capability.
Stage 6: Review, collation and update of manual and telemetry groundwater level data
and spring flow data
This stage of the process reviewed groundwater level and flow data collated as part of the
WRMP09 assessment. Where applicable, manual groundwater dips and telemetry water
level and flow data were collated to mid 2012 and records updated on a source by source
basis. In addition, available EA regional groundwater level data were collated and records
updated to mid 2012.
Stage 7: Source Performance Diagrams update
This stage of the process undertook a systematic update of the SPDs on a site by site basis,
by compiling the data collated from the previous stages and creating new performance
curves. As part of this process the SPDs were updated with: source licence data (from
Stage 2), network constraints (from Stage 3), geological constraints and Deepest Advisable
Pumping Water Level (DAPWL) (from Stage 4), pump depth and capacity (and treatment
and booster capacity where applicable) (from Stage 5) and water level data (Stage 6).
This data was then utilised to create a series of updated performance curves, and determine
the average and peak DO on a source by source basis.
Stage 8: Nitrate assessments
This stage of the process comprised a review of nitrate concentrations and trends, and the
consequent impact on source DO up to 2040. A series of nitrate blend scenarios were
evaluated to determine the impact that rising nitrate concentrations would have on source
DO over this period without interventions.
Other quality issues have not been explicitly included in the DO review. It has been assumed
that any other water quality problems are resolved by treatment or other solutions being
implemented through the company business plan, and that there will therefore be no impact on
DO.
Other groundwater considerations • Groundwater Treatment Losses: a number of new nitrate, water hardness and cryptosporidium
plants have been or are being installed. Currently, where DO is constrained by treatment pumping capacity or throughput through the water treatment works, this loss is accounted for in the DO values reported. No process water losses have been accounted for in the DO numbers reported. Analysis of a sample set of groundwater treatment works indicates that process losses are small in comparison with the groundwater output (generally <1%, but up to 4.5%). For the small number of sites where process losses are applicable, we do not consider process losses to be significant on a zonal scale.
• Time Limited Licences: the Environment Agency has stated (e.g. in the CAMS Stakeholder
Group meetings, Water Resources Planning guideline) that it has a policy of presumption of

Appendix A - How much water do we have available?
9 Severn Trent Water: Final Water Resources Management Plan 2014
renewal for the majority of existing time limited licences. We have assumed this in our planning
process.
Groundwater Source Inputs to Aquator
For conjunctive use zones, groundwater annual average and peak day yields have been updated
as part of the overall groundwater deployable output review discussed above. These updated
yields have been incorporated into the Aquator model as annual yield constraints and daily
maximum capacities respectively. An example of this is shown in Figure A2.2.
Figure A2.2: Updating Annual Yields in Aquator
For spring sources the monthly profile of yield during the drought year has been input into Aquator
as a “monthly” daily maximum capacity, as the effective DO of these sources changes across the
year.
A2.2 Deployable Output Method for conjunctive use zones
For our conjunctive use zones, we derive zonal DO in line with the best practice guidance found in
UKWIR WR27 Water Resources Planning Tools 2012 (Akande et al., 2011). To do this we use
the Aquator water resources simulation model. Aquator is a powerful application for developing
and running simulation models of natural river and water supply systems. The simulation package
facilitates the construction of models comprising a range of components to represent sources,
demand centres and their linkages. These components can then be customised so that
simulations can be produced over a wide range of scenarios and operating rules.
We use Aquator to model the complex nature of our water resources system. Our model includes
the following components and constraints:
• Surface water raw water sources: The raw water sources, or groups of sources, are
represented within each zone. Input data includes their output capacities and details of any
limitations due to abstraction licence, resource availability, pump capacity, treatment capacity

Appendix A - How much water do we have available?
10
Severn Trent Water: Final Water Resources Management Plan 2014
or transfer capacity. Where a source is supplied by a reservoir, the control rules for that
reservoir are used to define the safe output from the source over the year. For run-of-river
sources any abstraction licence or prescribed flow limitations are taken into account in the
model. Each reservoir and river on the model has catchments associated with it, these each
have daily inflow series ascribed to them that cover a simulation period of 91 years starting in
1920.
• Groundwater sources: The source yield of each of our operational groundwater sources are
included as an individual source or a group of sources. This process of assessing individual
groundwater source DO is summarised in Section A2.1 above. This method provides the
basis of the assessment framework for groundwater sources as advocated in the UKWIR
WR27 Water Resources Planning Tools 2012 guidance (Akande et al., 2011). For groundwater
sources drought year average and peak deployable output yield have been calculated and
included in the groundwater aquator component. For the majority of our groundwater sources
the limiting factor is the abstraction licence, although there are hydraulic or operational
restrictions at some sources. The abstraction licence can have daily, annual or multi-year
conditions; these are represented in the Aquator model as appropriate. Additionally, some
blending requirements for water quality purposes in multi-source locations are incorporated
into the model as operating controls.
• Aqueducts and distribution linkages: Aqueducts and distribution linkages are included
between sources and demand centres and their maximum capacities are entered. The model
allows us to identify where distribution constraints limit our ability to deploy water to where it is
needed.
• Imports and exports: These operational import and export transfers are represented between
zones and for bulk supplies to/from other companies.
• Demand centres: There may be one or many demand centres represented in a zone. These
represent areas where both our domestic and industrial customers exist and use water.
The deployable output of the conjunctive use water resources zones are derived within one model.
Therefore where the DO of one zone can affect the DO of another, consideration is taken as to
which zone is modelled first.
To analyse deployable output we use Aquator’s inbuilt DO analyser. This incrementally increases
demand across a water resource zone in small steps; for example for the Strategic Grid zone we
use 5Ml/d increments. The analyser runs the model in daily steps across the full 91 years of our
catchment inflow series, until either there is a failure to supply a demand centre or until there are
more than three crossings of the Temporary Use Ban (TUB) line across the zone. Aquator
calculates the deployable output as the average output across the 91 year record.
For modelling purposes the demand in the surrounding zones is kept static while the demand in
the zone being analysed is increased. Once the deployable output of the first zone has been
derived, this is then set as its DO level and the next zone is analysed and so on.

Appendix A - How much water do we have available?
11
Severn Trent Water: Final Water Resources Management Plan 2014
Due to the connected nature of the zones, the order in which the DO is modelled can have an
effect on the DO of the individual zones. We have modelled the zones in the following order.
• Firstly North Staffordshire and Stafford are modelled as these are not currently connected to
any other zone.
• We then model the Shelton zone as this abstracts from the upper river Severn above the
abstraction points for the other zones affected by the River Severn.
• After this we then model the Wolverhampton zone as this is again above other abstractions on
the river Severn.
• Following this the Strategic Grid zone is modelled as this is the largest zone,
• Nottinghamshire, Newark and Forest & Stroud zones are then modelled, as these are
dependant on the Strategic Grid zone.
• Finally a DO run is carried out with all zones at their DO level, this ensures that zonal transfers
are correct and that running all zones at their maximum DO does not cause any further
failures.
For each of the conjunctive use zones that are modelled in Aquator, transfers between zones are
as listed in Chapter A5. Treatment losses are incorporated within the model for all surface water
treatment works.
Water Resource Zones and Model Structure
Chapter A1 explains that since WRMP09 we have made considerable changes to the structure of our water resources zones. In 2010 we reconfigured our water resource zones (WRZ) to ensure compliance with the Environment Agency’s (EA’s) definition of a WRZ:
“largest possible zone in which customers share the same risk of a resource shortfall”
Previously we had based our Water Resources Planning on six water resource zones. For this
WRMP, our region has now been divided into 15 water resource zones, as shown in Figure A2.3.
Under stressed conditions, resources within each zone can be configured to meet demand within
these boundaries. Customers within these zones share the same risk of a resource shortfall.
We have derived and reviewed the structure of the new zones using a bottom up approach,
looking at local and strategic constraints in our network. The deployable output in eight of the new
zones is constrained by local groundwater yields or local network constraints. The remaining
zones are conjunctive use zones, which use a mixture of groundwater and surface water, and
these tend to be constrained by reservoir yields and large strategic linkages with other zones. For
example the Nottinghamshire zone is supplied by a large amount of groundwater as well as a
number of links to the surface water in the Strategic Grid zone, meaning the two zones are well
integrated. However in times of water stress in the Strategic Grid zone, any spare resource in the
Nottinghamshire zones groundwater sources cannot be used to feed back into the Strategic Grid.

Appendix A - How much water do we have available?
12
Severn Trent Water: Final Water Resources Management Plan 2014
Figure A2.3: Severn Trent Water’s new Water Resource Zones
The changes to our water resource zones have been fully shared with Defra, the Environment
Agency and Ofwat following our review in 2010. More explanation of our water resource zones
can be found in Chapter A1.
Due to the changes in the water resource zones structure it was considered that our water
resources models in Aquator would also need to be fully rebuilt and the inputs updated. As part of
the model rebuild we decided to combine all the sources and assets into one company wide model
which encompasses all of our conjunctive use zones. This is because all of our conjunctive use
zones are linked either by use of the same rivers for abstraction (River Severn for Shelton,
Wolverhampton and Strategic Grid) or by strategic network linkages (Strategic Grid and
Nottinghamshire) or both of these. Our updated model schematic is shown in Figure A2.4.

Appendix A - How much water do we have available?
13
Severn Trent Water: Final Water Resources Management Plan 2014
Figure A2.4: New Severn Trent Water Resources Model
Licenced to Severn Trent Water
Licenced to Severn Trent Water
Severn Trent - Water Resources Model
Selected zones
Bishops Castle
Forest and Stroud
Kinsall
Llandinam and Llanwrin
Mardy
Newark
North Staffs
Nottinghamshire
Rutland
Ruyton
Shelton
Stafford
Strategic Grid
Whitchurch and Wem
Wolverhampton
South Staffs Water
Demand Saving Groups
Shelton GW
Shropshire GW group
Bourne + Blythe gravity + pumped
Hampton Loade & Trimpley
Elan Valley group
Shustoke low er + Whitacre
Leek North Group
Leek Group
Birmingham GW
Clipstone Group (5 Year)
Derwent Valley Reservoirs
Foremark & Staunton Harold
Strategic Grid North Staffs Forest and Stroud
Church Wilne Group
Carsington and Ogston Group
River Severn
Ollerton Group
Blidworth Group 1 Halam Group
SSW Demand Saving
Brownsover
Eathorpe
Willes Meadow
Mitcheldean
Shelton river abs.
Chelmarsh
Nethertown
Trimpley
East West link
Leam - Draycote
Frankley - Whitacre
Highter's Heath
Siskin Drive Transfer
Henley to Redditch
Vyrnwy to NWW
Elan combined
Elan DCC
H. Loade to WolverhamptonH. Loade to South Staffs.
Upper Vyrnw y
Upper Wye
Upper Blithe
Blithe
Trent u/s Colw ick
Severn to Gloucester
Bourne
Blythe
Middle Leam
Avon to Stanford
Cow nw y
Vyrnw y
Clyw edog
Severn to Dolw en
Caban Coch
Pen-y-Garreg
Claerw en
Upper Elan
North West Water
South Staffs
Blackstone
South Shrops
Stourbridge
Birmingham
Coventry
Rugby
Warw ickshire and Leamington
British Waterw ays
South Gloucs
Worcester
Stratford
Cheltenham and Gloucester
Stroud
Forest
Ross BS (Dw r Cymru)
Monmouth (Dw r Cymru)
Usk transfer
Teif i (Dw r Cymru) Caban Coch (Dw r Cymru)
Bristol Water
Shropshire
Shrew sbury
Ironbridge PS
Hampton Loade
Dolw en
Deerhurst
Low er Parting
Erw ood
Redbrook
Sharpness
Buildw as
Blithe d/sColw ick
Bew dley
Bourne
Blythe
Stareton g/s
Princes Drive
Millend Spring
Astley (5)
Roden (6)
Tern III (8)
Wolverhampton GW
South Staffs GW
Munslow and Diddlesbury
Astley
Stourbridge GW
Meriden GW
South Perry (2a)
Coventry GW
Campion Hills GW
Warwick GW
Worcester GW
Stratford GW
Gloucs Springs - Millgrove
Chalford
Forest of Dean GW
EVA emergency sources
Montford (2b)
Leaton (3)
North Perry (7)
Shrewsbury GW
Tern I (1)
Tern II (4)
Severn to Montford
Avon to Evesham
Stour
Teme
Severn To DeerhurstWye to Erw ood
Lugg
Wye to Redbrook
Severn to Saxon's Lode
Perry
Tern
Severn to Buildw as
Worfe
Severn to Bew dley
Avon to Stareton
Upper Leam
Sow e
Vyrnw y regulator
Elan Valley Aqueduct
Clyw edog regulator
Shustoke upper to Low er
Whitacre to Oldbury
Meriden to Coventry
Meriden to Warw ick
Headless Cross to Worcester
SSM Ombersley to Worc.
Ombersley to E Worcs
Trimpley reservoir to WTW
Trimpley to South Shrops
Trimpley to blender
Trimpley to Frankley
Frankley to Stourbridge
Frankley tow ards Birmingham
Bourne to Shustoke upper
Blythe (gravity)Blythe (pump)
Birmingham SW sources
Frankley + Highters Heath to Birmingham
Combined Avon to Draycote
Brow nsover abstraction
Stanford to Draycote
Draycote to Willes Meadow
Leam to Willes Meadow
Campion Hills to Warw ick
SSM Astley to Ombersley
Strensham to Mythe
Strensham to Worc. (Elbury)
Strensham north output
Strensham (aqueduct) to Worc.
Strensham north branch to Stratford
Severn to Meriden
Church Dow n to Chelt & Glouc
Mythe to S. Glous.
Mythe & Mitcheldean to S. Gloucs.
Mitcheldean to StroudMitcheldean to S. Glous.
Mitcheldean to Forest of Dean
Mitcheldean to STW
Shelton GW
Caban Coch regulator
Draycote to Leam
Caban Coch before regulation release
Vyrnw y d/s reservoir
Tern d/s
Shustoke upper to low er
Avon d/s Sow e
Avon d/s Leam
Severn d/s Deerhurst
Caban Coch outf low
d/s Clyw edog
S
Vyrnw y
S
Stanford
S
Draycote
S
Willes Meadow
S
Mitcheldean
S
Claerw en
S
Craig Goch
S
Pen-y-Garreg
S
Caban Coch
S
Clyw edog
S
Chelmarsh
S
Blithfield
S
Trimpley
S
Frankley
S
Shustoke upper
S
Shustoke low er
S Whitacre
Oldbury
Meriden
Headless Cross
Shelton
Mythe
Mitcheldean
Monmouth
Caban Coch
Hampton Loade
Seedy Mill
Trimpley
Frankley
Whitacre
Draycote
Campion Hills
Strensham
Trimpley & ASR to Frankley
Frankley to ASRASR to Frankley
ASR to Birmingham
Heighters Heath SR
Flow from / to ASR 2
S
HH ASR
Upper Churnet
Solomon's Hollow
Deep Hayes
Upper Hulme Springs
Stoke
Moorlands
Stone
Stafford
Market Drayton
Telford
Release GS
Compensation GS
Deep Hayes GS
Basford Br. GS
Highgate
Elmhurst
Hollies
Satnall Grp
M. Drayton Grp
Puleston Bridge
Sheriffhales
Shifnal and Lizard Mill
Newport Grp
Uckington
Poolend
Beckbury and Grindleforge
Swynnerton
Croxton
Burntwood
Wellings
Weston Jones
Neachley and Cosford
Deep Hayes B/H
Wallgrange
Audley
Peckforton Grp
Moddershall Grp
Meir Grp
Hatton Grp
Eastwall
Ladderedge to Moorlands
Wellings to Ashley
Ashley to M DraytonCroxton to Eccleshall
Ladderedge to Stoke
Peasley Bank to Stone
Peasley Bank to Stafford
Hanchurch to Stone
Croxton to N-S link
Wellings to Hanchurch
Croxton to Hanchurch
North South link
Meir to Ladderedge
Hanchurch to Stoke
S
Tittesworth
Ladderedge SR
Meir SR
Cooper's Green SR
Satnall SR
Ashley SR
Hanchurch SR
Peasley Bank SR
Tittesw orth WTW
Ambergate
Homesford
Little Eaton
Draycott to C. Wilne
L.Eaton to C. Wilne
Eggington
Shardlow
Anstey
IO1
IO2
Carsington transfer
Bow mer Rough - Higham
Wing (AW)
Upper Derw ent
Derw ent to Whatstandw ell
Low er Derw ent
Staunton Harold
Cropston
Sw ithlandBlackbrook
Thornton
Rothley Brook
Soar
Middle Trent
Ashop & Alport
Dove
Rolleston Brook
Tame
Upper Trent
Low er Trent
Birmigham GW
Derw ent to St. Mary's Bridge
Noe
Derw ent res. catchment
Ladybow er catchment
Jagger's Clough
Amber
Homesford Sough
Henmore Brook
North Derbyshire
Derby
Nottingham
Chesterf ield
Leicestershire
Worksop
North Notts
New ark
Yorkshire Water
Discharge
Ashop
Sw ithland compensation
Shardlow
Colw ick
Carsington compensation
N. Muskham
Yorkshire Bridge
NoeJagger's
Whatstandw ell
Ogston compensation
St. Mary's Bridge
Rothley Brook
Draycott
Derby
Birmigham Phase 3 - Adelaide Street
Birmigham Phase 4 - The Crescent
Birmigham Phase 5 - Newton Place
Birmigham Phase 6
Birmigham Phase 7
Birmigham Phase 8
Birmigham Phase 9
Notts GW / Burton Joyce Gp
Ompton
Leics small sources
Clay Lane
Sunnyside Group
Caunton
Birmigham Phase 1 - Short Heath
Birmigham Phase 2 - Burbury Park
Higham to Chesterf ield
To Ogston
Ambergate regulator
L. Eaton to Derby
DVA to Nottingham
DVA to Strelley
Church Wilne to Strelley
DVA above Derby
DVA below Church Wilne
Church Wilne to DVA
Witches Oak to C. Wline
Higham to North Notts
DVA to Derby
DVA below Bamford
Homesford to Derby
Sunnyside to Chesterf ield
Thornton
Ashop & Alport to Derw ent
Noe transfer
Jagger's Clough to Ladybow er
Ashop & Alport support SDerw ent
S
Swithland
S
Cropston
SThornton
S
Witches Oak
S
How den
S
Ladybow er
S
Ogston
S
Carsington
S
Church Wilne
S
Foremark
S
Staunton Harold
S
Blackbrook
Ambergate SR
Strelley SR
Hallgates SR
Ragdale SR
Higham
Bamford WTW
Ogston WTW
Homesford WTW
L.Eaton WTW
Church Wilne WTW
Melbourne WTW
Nanpantan WTW
Cropston WTW
Carsington Export Demands
Spondon Works to RWE
RWE Abstraction
RWE Pow er Station
Edgbaston GW
Eyton CG GW
Ruyton
Ruyton
Kinsall
Kinsall
Mardy
Mardy
Llandinam
Llandinam and Llanw rin
Llanwrin
Bishops Castle
Oakley Farm and Clungunford
Wolverhampton North
North Wolves
Wem / Whitchurch CG GW
Whitchurch and Wem
Nuneaton
Whitacre to Meriden
Oldbury to Meriden
Wing
IP1IP2
Astley GW w ith Trimpley
IP1IP2
Willes Meadow blender
IP1
IP2
Shelton river loss
Willes Meadow 2
Chequer house
Sunnyside
Chequer House to Sunnyside
Cheadle
Upstream of Shardlow
R S A
Caunton to Golden Hill
Ompton to Nottingham
Clipstone Forest
Amen Corner
Rufford
Far Baulker
Budby Group
Markham Clinton
Boughton
Halam
Kelham Reservoir
Oversely Green Valve Complex
Chesford Valve House
Abbots Rd CG Link
Budby Blending Tank
Churchdow n SR
Strensham GSOS
Mythe to Hew lets & Tew ksbury
Mythe to Churchdow n
Mitcheldean to Stroud
Whaddon Booster Flow
Cluddley
Telford / Shrew sbury Resilience
Cluddley to Telford
Rodw ay and Woodfield to Cluddley
Bigwell Spring
Lydbrook Spring
Pinnock Spring
Gloucs Springs - Postlip
Coombe Spring
Dow nstream of Blythe Pumped
The reasons for following the single model approach are shown in Table A2.2.
Table A2.2: Pro’s and Con’s of using a single model
Pro’s Con’s
The effect of abstractions taken
upstream on downstream
abstractions, can be modelled
correctly
The time taken to run the
model is significantly
increased.
Linkage / transfers between
WRZs are easily modelled.
There is the ability to prove
future linkages and abstractions
and their effects on other zones.

Appendix A - How much water do we have available?
14
Severn Trent Water: Final Water Resources Management Plan 2014
A2.3 Aquator Model Updates since WRMP09
We have taken the opportunity of the rebuild to fully update and review many of the components/data within the model. These include a full review of the surface and groundwater licences used as constraints in the model, as well as a review of the water treatment works maximum capacities, an example of which we have shown in Figure A2.5.
Figure A2.5: Maximum works capacity updates
Strategic Linkages
We have reviewed the maximum capacities of a number of key pipelines and aqueducts that act
as constraints within the model using both historic flow data and hydraulic modelling to establish
the maximum potential flow along the pipelines. As a result a number of key changes have been
made since the modelling used to inform the WRMP09.
A number of supply areas in the model have been split out to improve the definition and granularity
of the model in particularly complex areas. An example of this is the Nottinghamshire area, which
has a number of group licences covering a large number of groundwater sources. The
configuration of sources and group licences in this area are now better represented in the model.
Reservoir Control Curves
We have reviewed the control of our key reservoirs as part of the update we carried out to produce
our 2014 drought plan. This has included updating the storage alert line control curve which
Aquator uses to determine when and how to use the reservoirs, the temporary use ban line and
non-essential use restriction line as the level 2 and 3 thresholds for demand saving; helping the
model to calculate level of service.
Figure A2.5 is a graph of the updated control lines for Elan Valley Reservoirs. Shown are the
storage alert line and the level 2 and level 3 threshold curves that the model uses to simulate the
timing and effects of imposing demand restrictions.

Appendix A - How much water do we have available?
15
Severn Trent Water: Final Water Resources Management Plan 2014
Figure A2.5: Aquator output graph of Elan Valley Reservoir Control Curves
Demand Saving Groups
The rebuilt Aquator model has been adapted to model the zonal level of service within Aquator,
which we previously calculated outside of the model using output spreadsheets. We can now
derive level of service using the Aquator “Demand Saving Group” component, which allows us to
model “Demand Savings”, such as Temporary Use Bans (TUB) and Non-Essential Use Bans
(NEUB) for a selection of demand centres, and therefore a set water resource zone.
We have set up demand saving groups in the model for the Strategic Grid Zone (using Elan Valley
reservoirs, Derwent Valley reservoirs, Carsington/Ogston and Draycote reservoir), the Forest and
Stroud Zone (using the Elan Valley reservoirs) and the North Staffordshire zone (using Tittesworth
reservoir). Each of these reservoirs has both a TUB trigger line and a NEUB trigger line. These
trigger lines are set on the model to activate demand savings. If the reservoir storage drops below
the TUB line for 7 days or more between April and the end of October, a 5% demand reduction is
introduced across the zone. If reservoir storage continues to fall and drops through the NEUB line
for 7 days or more between April and the end of October, a further reduction of 5% is introduced
giving a total demand reduction of 10%. The highest level of reduction reached will stay in place
in the model for up to 180 days. These simulate the effects that imposing TUBs or NEUBs would
have on demand in a real life situation.
Inflow Series Update
A key update we have undertaken since WRMP09 is on the historic catchment inflow sequences
used in Aquator which are calculated using the HYSIM rainfall-runoff model, HYSIM calculates
runoff in a catchment or group of catchments using data such as rainfall and potential evapo-
transpiration. A flow chart showing how HYSIM works is shown in Figure A2.6.

Appendix A - How much water do we have available?
16
Severn Trent Water: Final Water Resources Management Plan 2014
Figure A2.6 HYSIM configuration
For WRMP09 our flow series was extended up to 2006. As part of the Aquator model update for
WRMP14 we have brought the flow series as up to date as possible. The initial objective of the
update was to extend all the flow series to December 2010. However during the course of the
update project, a number of limitations were identified with the data used in the previous HYSIM
modelling. This included inconsistencies between the historic rainfall data supplied by the Met
Office for the WRMP09 flow extension project and the updated datasets provided in 2011,
problems in the scaling method used to combine the original and updated Met Office gridded
rainfall data in the previous studies and disparity in the data.
Following identification of the various data issues the initial project objectives were expanded to
include an additional data review and recreation of rainfall and PET series for use in the HYSIM
rainfall-runoff model for 79 catchments for the full 91 year record. All of the existing HYSIM models

Appendix A - How much water do we have available?
17
Severn Trent Water: Final Water Resources Management Plan 2014
were recalibrated. In addition new Environment Agency (EA) naturalised data was incorporated
and a joint calibration and verification process introduced. Therefore a full update and restating of
the entire 91 year flow series has been carried out, bringing all the flow series up to December
2010.
In addition to the flow data extension, the study has led to further improvements in the consistency
and reliability of the data sets. In most catchments the revised models show an improved fit
between simulated and recorded flows. A thorough review of the flow series has been undertaken
in order to identify the confidence levels associated with each of the series.
As mentioned we have updated flow series to include the dry summer of 2010, however we have
not included data for the drought of 2011. This is because at the time of the update, data was not
yet available for the whole of 2011. During 2011 we did not introduce restrictions therefore we feel
that the drought period is not worse in terms of surface water than those already in the time series.
Further information on Calibration and Verification of the HYSIM flows
The following text gives further explanation of how we have calibrated and validated the Hysim
flow datasets used in our Aquator model, along with our model outputs. This additional explanation
is in response to queries raised during consultation on our draft WRMP by Natural Resources
Wales regarding the steps we have taken to validate our water resources modelling.
The Hysim flow series were calibrated using a joint period of calibration (generally 2001 to 2010)
and verification (1991 to 2000). Where a good calibration but poor verification results were
achieved, we gave further consideration to the modelling. Where possible, the verification period
results were improved without detracting from the calibration period results.
The goodness of fit and adequacy of a given simulation was measured using the following
criteria:
1. Examination of the daily flow chart to confirm if the model matches the low flow
periods, has a similar rate of recession and matches summer and winter storm
peaks. Not every feature can be replicated with a model, but this assessment
provides an adequate representation of the hydrograph shape and how this might
vary in key years or stages in the calibration period.
2. Examination of the flow duration curve (FDC) to help identify how good the fit is for
lower flows and higher flows. Although the aim is to achieve a good fit over the whole
record, the fit at lower flows is almost always most important for water resource
assessments. The use of a log scale to display FDCs accentuates the lower part of
the FDC allowing, at a glance, assessment of the goodness of the fit at low flows.
3. Comparison of the mean flows, Q50 and Q95 statistics provide further evidence as to
the goodness of fit both over the whole record and at low flows. These statistics
alone are not enough to determine a good fit and it is important that these statistics
support the above two assessments.

Appendix A - How much water do we have available?
18
Severn Trent Water: Final Water Resources Management Plan 2014
4. The root mean squared error (RMSE) is a good statistical measure that was used in
assessing the performance of simulations. It is calculated as the square root of the
mean of the squared difference between the observed (Oi) and simulated (Pi) flows.
This was calculated separately for the full range of flows and the low (Q50-Q95)
flows. To standardise comparisons of RMSE, this was calculated as a percentage of
Q50. Broadly speaking both RMSE statistics follow the same trend.
Table A8.1 gives an over view of the type of reference flows used for the HYSIM modelling
on the Severn, Wye and Upper Trent.
Table A8.1 Overview of HYSIM calibration requirements
(Table produced by Mott Macdonald, 2011)

Appendix A - How much water do we have available?
19
Severn Trent Water: Final Water Resources Management Plan 2014
The statistical output from HYSIM includes the “Correlation Coefficient” and “Percentage of the
explained variance” as two measures of the accuracy of the rainfall-runoff models. These
measures are sensitive to high flows and outliers and are not necessarily appropriate for
examining how well the model fits at low flows. We found that a reasonable correlation coefficient
may give a model with a good fit at high flows but a poor fit at low flows. As a result, we have not
used these statistical measures. We used these measures for assessing the quality of the
calibration alongside physical catchment characteristics from previous experience and the CEH
Hydrometric Register and Statistics. This informed our decisions on parameter values required in
simulation and guided their optimisation.
The main emphasis in HYSIM model calibration was achieving a close agreement between
simulated and recorded flows in terms of the flow duration curve (FDC), particularly the lower part
since high flows are generally not as important in water resources assessment. Whilst the FDC
provides a good overall estimate of the calibration the performance of the model varies from year
to year. We therefore include an element of uncertainty around the accuracy of the flow series in
our target headroom analysis for our Water Resources Planning.
The Wye Basin
Our interest in the Wye basin is primarily the Elan Valley reservoir system which meets most of the
demand from Birmingham. There is also an abstraction at Mitcheldean a short distance upstream
of Redbrook. The following discussion concentrates on the recalibration and verification of the
existing HYSIM models focusing on these two locations of primary interest. EA Wales (now
Natural Resources Wales/ Cyfoeth Naturiol Cymru) provided us with the naturalised flow series for
the six locations shown in Table A8.2.
The 2008 model for the Elan Reservoirs produced a good fit against the naturalised flow series.
Incorporation of updated data required recalibration of this model, and comparison against
updated naturalised flow data to 2010 has resulted in similar results. The new FDC shows a good
fit, particularly at high and low flows, but slightly over-estimates mid range flows (Figure A8.1).
Whilst visual comparison to the previous FDC may suggest a poorer fit, the RMSE as a % of Q50
statistics remain approximately the same; though the mean flows have been more closely
matched. The performance of the most recent simulations are comparable to those undertaken in
2008, but have more robust water balance parameters with the improved input data.
We undertook recalibration of the Ithon at Disserth and Irfon at Cilmery against recorded flow, with
comparable RMSE statistics to the Elan Reservoirs calibration. With significant improvement of
the Irfon at Cilmery compared to that in 2008, we achieved a good fit and statistical performance
at Erwood, as demonstrated in Table A8.2. Since 2008 we received naturalised flows for the Lugg
at Butts Bridge and at Lugwardine. At Lugwardine there was not enough flow data to perform any
verification due to the short record and high flows were truncated in the reference flow series,
preventing an effective comparison of the means.
In addition to various changes to the hydrological parameters for upstream catchments the
hydraulic parameters were revised for the Wye at Belmont and Redbrook catchments in order to
improve fit and statistical performance. These adjustments have contributed to an overall good fit
at Redbrook (Figure A8.2).

Appendix A - How much water do we have available?
20
Severn Trent Water: Final Water Resources Management Plan 2014
The statistical measures summarised in Table 3.2 indicate that the RMSE as a % of Q50 is 61%
for all flows and 19% for low flows (Q50 to Q95). This is a significant improvement on equivalent
statistics from the 2008 calibrations which gave 107% and 32% respectively. A large part of this
calibration improvement will be a result of the revised input data. (Mott Macdonald, 2011)

Appendix A - How much water do we have available?
21
Severn Trent Water: Final Water Resources Management Plan 2014
Table A8.2 Wye catchment calibration statistics
(Table produced by Mott Macdonald, 2011)

Appendix A: How much water do we have available?
22 Severn Trent Water: Final Water Resources Management Plan 2014
Figure A8.1 Elan Reservoirs FDC (2001-2010)
(Graph produced by Mott MacDonald, 2011)
Figure A8.2 Redbrook FDC (1999-2008)
(Graph produced by Mott Macdonald, 2011)

Appendix A: How much water do we have available?
23 Severn Trent Water: Final Water Resources Management Plan 2014
Aquator Output Validation
We derive deployable output (DO) at a resource zone level for our conjunctive use water
resource zones. This is in accordance with the relevant guidance (including the “Unified
Methodology for the determination of Deployable Output from Water Sources, Project
00/WR/18/2”, UKWIR, 2000). We have seven conjunctive use water resource zones, all of
which we model using Aquator.
Our model is built to represent the current (and end AMP 5) supply network using the inputs as
described in section A2.2. It then calculates a Deployable Output using the full 91 year inflow
series and based on the company stated levels of service.
We do not expect the model outputs to exactly match historical flows or actual abstraction for
the following reasons:
it uses a set monthly demand profile which does not vary year to year.
we have not modelled the actual outages that occurred in 2006.
the model incorporates sources that are available now and may not have existed/been in
operation throughout the whole flow record period. For example, it includes AMP5 schemes
such as the DVA duplication as well as reservoirs such as Carsington that did not exist more
than 20 years ago.
the operational control curves on our strategic reservoir sources have been revised and
optimised to fit the current supply network and demand assumptions. Historically we used
different curves on these reservoirs. The model uses the current controls curves and rules.
River Severn regulation is modelled within Aquator using VBA code. Regulation is carried out
throughout the 91 year period. Lyn Clywedog was built in 1964 and completed in 1966. The
EA began regulating the river in 1968.
In validating the outputs of our Aquator model, we have to take all of this into consideration.
We have derived the demand data and demand profiles in Aquator using actual data for
2006/07. In order to validate the model outputs, we are therefore able to use actual data for
2006/07 and compare this against Aquator model outputs for that year. We have created a
state set on Aquator which enables us to set all the reservoir storage levels to start on 1st
January 2006 at the actual storage levels recorded on that day. The inflow series have been
calibrated over a period that includes 2006/07. This means that the model can then decide
which sources to use and when based on actual resource states and demand and the model
outputs should therefore be a reasonable representation of what happened that year.
Reservoir drawdown
We have compared actual reservoir drawdown for 2006/07 with the modelled reservoir
drawdown. The results are shown in Figures A8.3 to ##. The error bars are set to +/- 5%,
which represents a level of relatively high accuracy (equivalent to accuracy band 2 when using

Appendix A: How much water do we have available?
24 Severn Trent Water: Final Water Resources Management Plan 2014
the Ofwat accuracy rating). Actual reservoir drawdown is recorded weekly which accounts for
the stepping in the actual data.
Figure A8.3 Derwent Valley reservoir actual vs modelled drawdown
0
20
40
60
80
100
120
Tota
l re
serv
oir
sto
rage
(%
)
Month
Derwent Valley
Aquator Derwent Valley Actual Derwent Valley
Figure A8.4 Elan Valley reservoir actual vs modelled drawdown
0
20
40
60
80
100
120
Tota
l re
serv
oir
sto
rage
(%
)
Month
Elan Valley
Aquator Elan Valley Actual Elan Valley
As can be seen from the figures above, the modelled drawdown for the naturally refilling
reservoirs Derwent Valley and Elan Valley shows a good fit, with the length of the drawdown
period and the refill period matching closely the actual reservoir drawdown during 2006.

Appendix A: How much water do we have available?
25 Severn Trent Water: Final Water Resources Management Plan 2014
Figure A8.5 Clywedog reservoir actual vs modelled drawdown
0
20
40
60
80
100
120
Tota
l re
serv
oir
sto
rage
(%
)
Month
Clywedog
Aquator Clywedog Actual Clywedog
Clywedog is also a good fit considering the man-made influences on the reservoir drawdown
through the river regulation releases. The number of regulation days triggered on the model
is very close to the number of actual regulation days during the summer of 2006.
Table A8.3 River Severn regulation statistics
2006 Actual 2006 Modelled
Number of regulation days 82 83
Regulation start date 21st June 21st June
Regulation end date 30th September 29th September

Appendix A: How much water do we have available?
26 Severn Trent Water: Final Water Resources Management Plan 2014
Figure A8.6 Carsington and Ogston reservoirs combined actual vs modelled drawdown
0
20
40
60
80
100
120
Tota
l re
serv
oir
sto
rage
(%
)
Month
Carsington and Ogston
Aquator Carsington/Ogston Group Actual Carsington/Ogston Group
Carsington and Ogston are pumped storage reservoirs. The representation on the model
shows what the reservoir drawdown would have been like had we operated the system exactly
as per the licence rules and optimising for cost and resource. It can be seen that this shows a
slightly less good fit than the naturally filled reservoirs. It is likely that this could be due to
outage/restrictions on the pumps at that time.
River flows
We have compared actual river flows for key gauges in the region to the modelled gauge data
derived during the validation model run. For each gauge we have plotted actual gauged flow
against the Aquator modelled gauge flow to produce a graph, flow duration curve and flow
statistics. On the whole the model replicates the low flows very well, with peaks occurring at
the correct time.

Appendix A: How much water do we have available?
27 Severn Trent Water: Final Water Resources Management Plan 2014
Figure A8.7 Redbrook flow analysis
0
5000
10000
15000
20000
25000
30000
35000
40000
45000
Flo
w (
Ml/
d)
Month
Redbrook
Redbrook actual gauged flow Redbrook modelled (Aquator gauge)
y = 0.8847x + 622.86R² = 0.7513
0
5000
10000
15000
20000
25000
30000
35000
40000
45000
0 5000 10000 15000 20000 25000 30000 35000 40000 45000
Mo
de
lled
Flo
w (
Ml/
d)
Gauged Flow (Ml/d)
Redbrook

Appendix A: How much water do we have available?
28 Severn Trent Water: Final Water Resources Management Plan 2014
0.0
5000.0
10000.0
15000.0
20000.0
25000.0
30000.0
35000.0
40000.0
45000.0
00.10.20.30.40.50.60.70.80.91
Flo
w (
Ml/
d)
Probability of Exceedance
Gauged Redbrook flow Modelled Redbrook flow (Aquator)
Figure A8.8 Bewdley flow analysis
0
5000
10000
15000
20000
25000
30000
35000
40000
Flo
w (
Ml/
d)
Month
Bewdley
Bewdley actual gauged flow Bewdley modelled (Aquator gauge)

Appendix A: How much water do we have available?
29 Severn Trent Water: Final Water Resources Management Plan 2014
y = 0.9864x + 299.99R² = 0.8128
0
5000
10000
15000
20000
25000
30000
35000
40000
0 5000 10000 15000 20000 25000 30000
Mo
de
lled
Flo
w (
Ml/
d)
Gauged Flow (Ml/d)
Bewdley
0.0
5000.0
10000.0
15000.0
20000.0
25000.0
30000.0
35000.0
40000.0
00.10.20.30.40.50.60.70.80.91
Flo
w (
Ml/
d)
Probability of Exceedance
Gauged Bewdley Flows Modelled Bewdley flows (Aquator)
The timings in the model at Bewdley are out by 1 day. This is due to the time of travel
assumptions for how long it would take for releases made at Clywedog to reach the gauge at
Bewdley which are correct at low flows. In reality, the releases are often made at a slightly
higher flow and therefore reach Bewdley earlier. In other words the way that the releases are
made in reality can be more precautionary than is the case in Aquator. Overall this slight
misalignment does not impact the modelling as they are correct at lower flows.

Appendix A: How much water do we have available?
30 Severn Trent Water: Final Water Resources Management Plan 2014
Figure A8.9 Derby St Mary’s flow analysis
0
2000
4000
6000
8000
10000
12000
Flo
w (
Ml/
d)
Month
Derwent - Derby St Mary's
Derby St Mary's actual gauged flow Derby St Mary's modelled (Aquator gauge)
y = 0.7307x + 435R² = 0.7099
0
1000
2000
3000
4000
5000
6000
7000
8000
9000
10000
0 2000 4000 6000 8000 10000 12000
Mo
de
lled
Flo
w (
Ml/
d)
Gauged Flow (Ml/d)
Derby St Mary's

Appendix A: How much water do we have available?
31 Severn Trent Water: Final Water Resources Management Plan 2014
0.0
2000.0
4000.0
6000.0
8000.0
10000.0
12000.0
00.10.20.30.40.50.60.70.80.91
Flo
w (
Ml/
d)
Probability of Exceedance
Gauged Derby St Mary's Flows Modelled Derby St Mary's flows (Aquator)
Releases from Caban Coch
We have also compared the actual releases made from Caban Coch reservoir against the
modelled releases on Aquator. The modelled releases are the sum of the Aquator
components “Caban Coch before regulation release” (which includes spill) and “Caban Coch
regulator” (which ensures the regulation and compensation releases are made).

Appendix A: How much water do we have available?
32 Severn Trent Water: Final Water Resources Management Plan 2014
Figure A8.10 Caban Coch flow analysis
0
1000
2000
3000
4000
5000
6000
Flo
w (
Ml/
d)
Month
Caban Coch releases
Gauged Caban Coch dam flow Modelled Caban Coch total releases
y = 0.8975x + 39.632R² = 0.6147
0
1000
2000
3000
4000
5000
6000
0 500 1000 1500 2000 2500 3000 3500 4000 4500 5000
Mo
de
lled
Flo
w (
Ml/
d)
Gauged Flow (Ml/d)
Caban Coch releases
Overall the fit between the gauged flow and modelled flow is relatively good. The key
difference is that the model ensures releases are made exactly as the licence instructs. In

Appendix A: How much water do we have available?
33 Severn Trent Water: Final Water Resources Management Plan 2014
reality, compensation releases are often a little higher than the licence requires; ensuring that
the licence is not breached due to meter error or due to human error.
Demand Centres and Demand Profiles
We have fully reviewed and updated the demand data that is used in our Aquator modelling.
To better represent the spread of demand across the water resource zones we have used a
bottom up approach to build a more granular assessment of the location and usage profiles of
the demand centres.
We used demand data at district metered area (DMA) and control group levels to build our
demand centres. The grouping of DMAs and control groups is based on the sources of water
supplied to that demand area. To do this we used information from a number of our company
databases, such as the distribution contingency plans, control group overview documents,
county schematics and water resource zone technical notes.
The method we used is described in Figure A2.7.
Figure A2.7: Demand Centre Review Flow Diagram
An audit trail showing how each demand centre is built and the information used to create the
demand centres has been created including sections on the data sources used to derive the
demand centres and an explanation of the sources that feed them.

Appendix A: How much water do we have available?
34 Severn Trent Water: Final Water Resources Management Plan 2014
Once the configuration of the demand centres had been completed we looked at which years
of data to use from the DMA demand dataset. We have a good quality DMA data record that
goes back as far as the end of 2003. For a base level demand we chose the 2006/07
financial year as this was a year with a pronounced summer peak, but was not a drought year.
It is worth noting that our water treatment works distribution input data has an enhanced audit
trail post 2000.
In Figure A2.8 which shows distribution input, it can seen that of the years of data we have
DMA level available, the summer with the highest in-year peak is 2006.
Figure A2.8: Distribution input data at a company level from 2004-2009
1000.00
1200.00
1400.00
1600.00
1800.00
2000.00
2200.00
2400.00
Apr May Jun Jul Aug Sep Oct Nov Dec Jan Feb Mar
Ml/
d
Company Level Distribution Input
DI Data 04-05
DI Data 05-06
DI Data 06-07
DI Data 07-08
DI Data 08-09
As part of this review we also updated the monthly demand profiles allocated to the demand
centres. For this we also used the peak to base ratio for the 2006/07 year. As well as giving a
good summer peak this also means that we can easily calibrate the model against this year.
As a result of the demand centre review and update, we now have greater confidence in the
new profiles for which we have a full audit trail and a known methodology. Furthermore we
now have an individual profile for each demand centre, based on historic demand data for that
area. We have shown an example of the old and new profiles in Figure A2.9.

Appendix A: How much water do we have available?
35 Severn Trent Water: Final Water Resources Management Plan 2014
Figure A2.9: Demand Centre profile comparison
Jan Feb Mar Apr May Jun Jul Aug Sep Oct Nov Dec
Derby New 06/07 Profile 0.963 0.980 0.954 0.996 0.996 1.063 1.147 0.992 0.997 0.973 0.970 0.966
Derbyshire Old Aquator Profile 1.017 0.982 0.977 0.965 1.022 1.065 1.14 1.086 0.94 0.934 0.945 0.926
0.000
0.200
0.400
0.600
0.800
1.000
1.200
1.400
Derby Demand Centre Profiles
Surface Water Treatment Works Losses
For all of our zones with surface water treatment works (WTWs), the process losses for these
WTWs have been calculated in the Aquator model. We have derived the process losses using
information from our 2012 annual return to apply a percentage loss to each WTWs. This
allows the model to take account of the process loss within the DO analysis. Table A2.3
shows the percentage process loss for each WTW.
Table A2.3: Surface Water Treatment Works Losses
Water Treatment Works Losses (%)
Bamford 2
Campion Hills 8
Church Wilne 2
Cropston 3
Draycote 7
Frankley 1
Little Eaton 1
Melbourne 2
Mitcheldean 1
Mythe 3
Ogston 1
Shelton 7
Strensham 4
Tittesworth 8

Appendix A: How much water do we have available?
36 Severn Trent Water: Final Water Resources Management Plan 2014
Water Treatment Works Losses (%)
Trimpley 1
Whitacre 2
New AMP5 assets included in our DO Analysis
The baseline deployable output numbers for this plan include a number of planned schemes
that were included in our WRMP09 and which will be in place by 2015. These are schemes
that were identified in the WRMP09 as having both resilience and a deployable output benefit.
The two key schemes are the Derwent Valley Aqueduct (DVA) duplication and the Edgbaston
borehole scheme, these are described below.
Derwent Valley Aqueduct Duplication
The scheme is designed to increase the capacity of the DVA at a pinch point identified
between Ambergate reservoir and Hallgates reservoir. The capacity will be increased from
55Ml/d to 117Ml/d above Sawley valve house and from 85Ml/d to 130Ml/d between Sawley
and Hallgates.
The DVA duplication scheme was identified as having both a resilience benefit and a
deployable output benefit. The resilience benefit enables the north of the Strategic Grid WRZ
to supply water to Leicester and Warwickshire in the case of water treatment works outages.
The scheme also allows “locked-up” deployable output in the north of the Strategic Grid WRZ
to be used across the zone.
Edgbaston Borehole
The Edgbaston borehole scheme is designed to be available both for resilience, in the event of
a works outage affecting Birmingham, but also to have DO benefit, giving increased overall
output into the Strategic Grid zone. The scheme has been modelled with a peak and average
daily licence of 10Ml/d.
Discussions with the Environment Agency
We have briefed the EA on our updated water resources model and new deployable output
assessment at a number of meetings in 2012. In these meetings we took the EA through the
changes and improvements we have made to the Aquator model. This included the model
rebuild project, flow series update, model parameter review (demand centres, component
parameter review, key linkages review) and our updated control curves. We have also
discussed our updated groundwater baseline DO and our conjunctive use zone baseline DO.
The EA commented that the benefits of these meetings were:
• EA better understand the Aquator model and sources of DO information.
• Familiarised the EA with modelling assumptions.
• Transparent audit trail demonstrated.
• Strengthening working relationships and consultation process.

Appendix A: How much water do we have available?
37 Severn Trent Water: Final Water Resources Management Plan 2014
A2.4 Baseline Deployable Output
The baseline deployable output (DO) for each zone is presented in Tables A2.4 to A2.6. This
is the DO provided by our current supply system at our current level of service of customers
not experiencing a Temporary Use Ban (TUB) more frequently than 3 times in 100 years and
does not include the potential impacts of future climate change or sustainability changes. The
deployable output with no level of service restrictions and for the reference scenario level of
service is discussed in section A2.5.
Groundwater Only Zones
For each of our groundwater only zones, the modelled zonal deployable output is equal to the
sum of the individual source deployable output as we have shown in Table A2.4.
Table A2.4: Deployable output of groundwater only zones
WRZ WRMP14 DO
(Ml/d)
Constraint
Bishops Castle 4.7 Groundwater Yield
Kinsall 5.0 Groundwater Yield
Llandinam & Llanwrin 19.9 Groundwater Yield
Mardy 3.7 Groundwater Yield
Ruyton 5.3 Groundwater Yield
Whitchurch & Wem 10.9 Groundwater Yield
Stafford 25.5 Groundwater Yield
and Network Linkage
Surface Water Only Zones
We do not currently have any water resource zones that are purely surface water fed. Our
zones are either groundwater only or conjunctive use; where the surface water and
groundwater sources in a zone are used together to give an improved overall deployable
output.
We do however have one zone which is completely fed by an import from Anglian Water which
is shown in Table A2.5. Our bulk supply agreement is for up to 18Ml/d, 8Ml/d of this is an
import to the Strategic Grid zone
Table A2.5: Deployable output of our surface water zone
WRZ WRMP14 DO
(Ml/d)
Constraint
Rutland 10 Bulk Supply
Agreement

Appendix A: How much water do we have available?
38 Severn Trent Water: Final Water Resources Management Plan 2014
Conjunctive Use Zones
For each of our conjunctive use zones the modelled deployable output of each source is
based on the deployable output of the whole zone, therefore we do not have any zones where
the individual deployable outputs shown in the WRMP tables do not aggregate to the water
resource zone deployable output which is shown in Table A2.6.
Table A2.6: Deployable output of our conjunctive use zones
WRZ WRMP14 DO
(Ml/d)
Constraint
Strategic Grid 1465.8 Zonal Constraint. Constrained by Elan
Reservoir and other surface and ground
water sources at full capacity in 1976.
Linkages to bring further water from north
of grid zone are also at maximum
capacity.
Nottinghamshire 269.9 Zonal Constraint. Constrained by
groundwater yields/ group licence and
imports from the Strategic Grid (SG)
zone. Above this DO failures occur in the
SG zone.
Newark 15.5 Zonal Constraint. Constrained by
groundwater yield of local source, and
available import from Nottinghamshire
zone.
Shelton 143.0 Zonal constraint. Failure point is
Shrewsbury; constraint is based on
restricted groundwater yield in the zone.
Wolverhampton 65.0 Zonal Constraint. Constrained by
groundwater yields and available supply
from River Severn.
Forest and Stroud 45.0 Zonal Constraint. Constraint based on
groundwater yields and regulated river
abstraction on River Wye.
North Staffs 148.0 Zonal Constraint. Failure at higher DO
occurs in Stone area. Constraint due to
groundwater yield and network linkages.
A2.5 Deployable Output and Level of Service As discussed in Appendix D6 our level of service (LOS) of no more than three Temporary Use
Bans (TUBs) in 100 years and not more than 3 Non-essential Use Bans (NEUBs) in 100

Appendix A: How much water do we have available?
39 Severn Trent Water: Final Water Resources Management Plan 2014
years, is met in all of our water resource zones. This LOS is set in our Aquator modelling as a
requirement for our base deployable output (DO) assessment.
We have tested the sensitivity of the link between DO and LOS by carrying out modelling at
other levels of service as indicated in the WRMP Guidelines. We have tested the reference
LOS of 1 in 10 years for TUBs and 1 in 40 for NEUBs. We set this in the model by allowing
only 9 crossings of the TUB line and 2 crossings of the NEUB line in our 91 year model run.
We also tested the “No Restrictions” DO. We simulated this in the model by removing the
TUB and NEUB control lines, therefore allowing the model to calculate the DO level without
implementing any restrictions.
Figure A2.10: Example model set up for reference LOS
In the below Table A2.7 we show the DO for the three different LOS scenarios for each of the
conjunctive use zones.
Table A2.7: Conjunctive Use WRZs DO and LOS
WRZ
DO at
Company
LOS
DO
Reference
LOS
DO with No LOS
restrictions in
place
Strategic Grid 1465.8 1468.7 1450.0
Nottinghamshire 269.9 269.9 269.9
Newark 15.5 15.5 15.5
Shelton 143.0 143.0 143.0
Wolverhampton 65.0 65.0 65.0
Forest and Stroud 45.0 45.0 45.0
North Stafford 148.0 148.0 148.0

Appendix A: How much water do we have available?
40 Severn Trent Water: Final Water Resources Management Plan 2014
It can be seen that for a number of our WRZs there is no change in baseline DO as a result of
changing LOS.
There are a number of reasons for this;
• For zones such as Shelton that are conjunctive use between a run of river abstraction and
groundwater supplies, we have not linked the zone to any levels of service control curve
on a reservoir. This is because the DO and LOS of the zone would not be affected by
storage in any of our reservoirs. We tested the sensitivity of linking the Shelton zone to
Clywedog reservoir, but this showed no difference in DO. It is worth also noting that for
Shelton in particular as the river abstraction is towards the upper reaches of the river, it is
not likely that linking LOS to a certain river level would have any benefit;
• The Nottinghamshire zone DO is based on the groundwater in the zone and a number of
imports from the Strategic Grid zone, therefore we have not currently linked the zone to
any LOS control curves on any reservoir. This therefore gives a flat profile of DO against
LOS. We have checked the sensitivity of linking the Nottinghamshire LOS to the Derwent
Valley reservoirs in the Strategic Grid zone and it has been found that this shows no
increase in DO of the Nottinghamshire zone.
• The Forest and Stroud zone LOS has been linked to the Elan Valley reservoirs, because
the regulation of the River Wye is linked to the levels at Elan. However this is only part of
the constraint on the Forest and Stroud zone and the groundwater and Spring sources in
the zone also of effect the DO. Therefore there is little effect of LOS on DO in this zone.
• Newark DO is based on Groundwater and its link with Nottinghamshire zone only so is not
affected by LOS.
• The LOS trigger in North Stafford zone is based on the level in Tittesworth reservoir.
However the zone’s DO is constrained by groundwater and network capacity.
Figures A2.10 and A2.11 are graphical examples of the relationship between deployable
output and level of service, included are the graph for the Strategic Grid zone and North
Staffordshire zone.

Appendix A: How much water do we have available?
41 Severn Trent Water: Final Water Resources Management Plan 2014
Figure A2.10: Graph of Baseline Deployable Output versus Level of Service – Strategic Grid zone
1440
1445
1450
1455
1460
1465
1470
1475
1 in 10 1 in 33 NA
Reference Scenario LOS Company LOS No Restrictions
DO
(Ml/
d)
LoS Frequency of Water Use Restrictions ( 1 in N, Years)
Strategic Grid WRZ
Figure A2.11: Graph of Baseline Deployable Output versus Level of Service – North Staffordshire
100
110
120
130
140
150
160
1 in 10 1 in 33 NA
Reference Scenario LOS Company LOS No Restrictions
DO
(Ml/
d)
LoS Frequency of Water Use Restrictions ( 1 in N, Years)
North Staffordshire WRZ
It can be seen that for the Strategic Grid zone at base DO level, although there is a definite
benefit of introducing restrictions 3 times in 100 years, there is only a very small benefit to
increasing the number of LOS events further. This is because for this zone above this

Appendix A: How much water do we have available?
42 Severn Trent Water: Final Water Resources Management Plan 2014
Deployable Output level there is a critical failure in 1976, which occurs even with both a TUB
and NEUB in place. In that year, Elan Valley reservoir storage drops to just above emergency
storage and there is insufficient capacity across the rest of the Strategic Grid zone to make up
this shortfall. This is caused by a number of factors including fully utilised licences and
restrictions in capacity between the north and south of the grid.
In our groundwater only zones, the sources of supply are all constrained by either abstraction
licence or infrastructure. As such, alternative levels of service will have no effect on the
deployable output in these zones.
The Stafford water resource zone is supplied by five groundwater sources. The sources
of supply are all constrained by infrastructure.
The Bishops Castle water resource zone is supplied by two groundwater sources. The
sources of supply are constrained by abstraction licence and infrastructure, respectively.
The Mardy water water resource zone is supplied by a single groundwater source. The
source of supply is constrained by infrastructure.
The Llandinam and Llanwrin water resource zone is supplied by two groundwater
sources. The sources of supply are constrained by abstraction licence and
infrastructure, respectively.
The Kinsall water resource zone is supplied by two groundwater sources. Individually,
the sources of supply are constrained by abstraction licence and infrastructure,
respectively. When abstracting together the two sources of supply are further
constrained by an overarching group abstraction licence.
The Whitchurch and Wem water resource zone is supplied by three groundwater
sources. Two of the sources of supply are constrained by abstraction licence. One of
the sources of supply is currently out of supply, and has no deployable output attributed
to it.
The Ruyton water resource zone is supplied by a single groundwater source. The
source of supply is constrained by abstraction licence.
A2.6 Confidence Label Grading of Deployable Output
Following the guidelines for confidence labelling of DO assessments in the UKWIR WR27
Water Resources Planning Tools 2012 guidance (Akande et al., 2011) we have assigned a
confidence label to each water resource zone. The considerations we have used for this are
summarised in Table A2.8. The confidence labels are based on the length of hydrological

Appendix A: How much water do we have available?
43 Severn Trent Water: Final Water Resources Management Plan 2014
data and the availability and consistency of the constraints data used in the DO assessment.
Figure A2.12 shows the matrix that is used in the assessment of the confidence label.
Figure A2.12: Confidence Label Outcomes Matrix taken from UKWIR WR27 (2012)

Appendix A: How much water do we have available?
44 Severn Trent Water: Final Water Resources Management Plan 2014
Table A2.8: Confidence Label and Basis
Water Resource
Zone
Zone Classification and
degree of constraints on
output
Confidence
Label
Basis
Strategic Grid
Conjunctive use zone,
including surface water
(reservoir / river) sources
and groundwater sources,
with inter and intra-zonal
transfers and complex
constraints
Degree of constraints is
assessed as medium to
high.
AB
Constraints include treatment works capacity
(based on pump capacity, infrastructure,
treatment capacity), abstraction licences,
groundwater yields, river regulation, pipeline
capacities. Constraints data is readily available
and is of consistent quality.
DO assessment carried out using 91 years of
Hydrological data, using HYSIM rainfall/ runoff
modelling to create the flow series. Hydro-
geological data is for a shorter period, but makes
up a small proportion of this zone.
Nottinghamshire
Conjunctive use network,
including large transfers
from surface water
sources in the Strategic
Grid zone and a complex
network of groundwater
sources and constraints
Degree of constraints is
assessed as medium to
high.
AC
Constraints include abstraction licences (including
a number of complex group licences) groundwater
yields, pipeline capacities and transfers from the
Strategic Grid zone. Constraints data is readily
available and is of consistent quality.
DO assessment carried out using 91 years of
Hydrological data (Strategic Grid Zone), using
HYSIM rainfall/ runoff modelling to create the flow
series. Site specific hydro-geological data, which
is used for a large proportion of this zone,
generally has a 14 year record. Regional
observation level data has a 43 year record.
Newark
Single groundwater
source with a transfer
from the Nottinghamshire
zone.
Degree of constraints Low
to Medium.
AC
Constraints include abstraction licence,
groundwater yield and a transfer from the
Nottinghamshire zone.
Site specific hydro-geological data for this zone
has a 15 year record. Regional observation level
data has a 43 year record.
Shelton
Conjunctive use zone,
including direct river
abstraction and
groundwater sources, with
intra-zonal transfers and
constraints
Degree of constraints is
assessed as medium to
high.
AC
Constraints include treatment works capacity,
abstraction licences, groundwater yields, pipeline
capacities. Constraints data is readily available
and is of consistent quality.
DO assessment carried out using 91 years of
Hydrological data, using HYSIM rainfall/ runoff
modelling to create the flow series. Site specific
hydro-geological data for this zone has an
average of 19 year record. Regional observation
level data has a 41 year record.
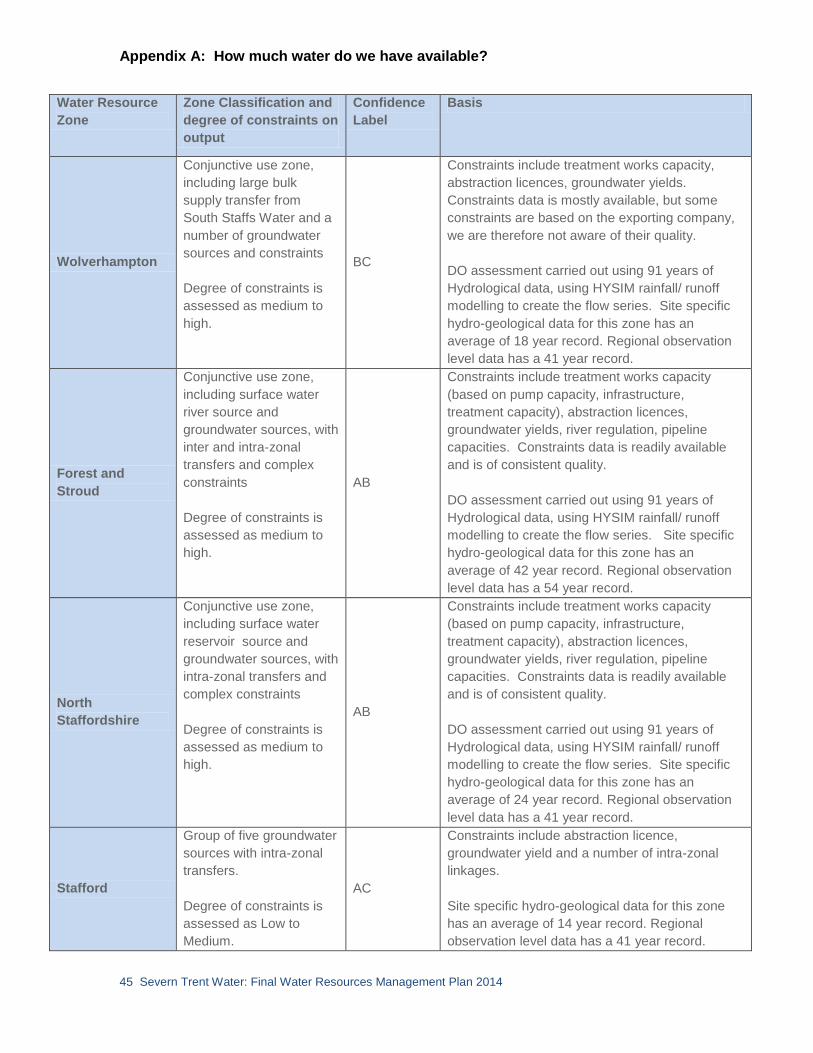
Appendix A: How much water do we have available?
45 Severn Trent Water: Final Water Resources Management Plan 2014
Water Resource
Zone
Zone Classification and
degree of constraints on
output
Confidence
Label
Basis
Wolverhampton
Conjunctive use zone,
including large bulk
supply transfer from
South Staffs Water and a
number of groundwater
sources and constraints
Degree of constraints is
assessed as medium to
high.
BC
Constraints include treatment works capacity,
abstraction licences, groundwater yields.
Constraints data is mostly available, but some
constraints are based on the exporting company,
we are therefore not aware of their quality.
DO assessment carried out using 91 years of
Hydrological data, using HYSIM rainfall/ runoff
modelling to create the flow series. Site specific
hydro-geological data for this zone has an
average of 18 year record. Regional observation
level data has a 41 year record.
Forest and
Stroud
Conjunctive use zone,
including surface water
river source and
groundwater sources, with
inter and intra-zonal
transfers and complex
constraints
Degree of constraints is
assessed as medium to
high.
AB
Constraints include treatment works capacity
(based on pump capacity, infrastructure,
treatment capacity), abstraction licences,
groundwater yields, river regulation, pipeline
capacities. Constraints data is readily available
and is of consistent quality.
DO assessment carried out using 91 years of
Hydrological data, using HYSIM rainfall/ runoff
modelling to create the flow series. Site specific
hydro-geological data for this zone has an
average of 42 year record. Regional observation
level data has a 54 year record.
North
Staffordshire
Conjunctive use zone,
including surface water
reservoir source and
groundwater sources, with
intra-zonal transfers and
complex constraints
Degree of constraints is
assessed as medium to
high.
AB
Constraints include treatment works capacity
(based on pump capacity, infrastructure,
treatment capacity), abstraction licences,
groundwater yields, river regulation, pipeline
capacities. Constraints data is readily available
and is of consistent quality.
DO assessment carried out using 91 years of
Hydrological data, using HYSIM rainfall/ runoff
modelling to create the flow series. Site specific
hydro-geological data for this zone has an
average of 24 year record. Regional observation
level data has a 41 year record.
Stafford
Group of five groundwater
sources with intra-zonal
transfers.
Degree of constraints is
assessed as Low to
Medium.
AC
Constraints include abstraction licence,
groundwater yield and a number of intra-zonal
linkages.
Site specific hydro-geological data for this zone
has an average of 14 year record. Regional
observation level data has a 41 year record.

Appendix A: How much water do we have available?
46 Severn Trent Water: Final Water Resources Management Plan 2014
Water Resource
Zone
Zone Classification and
degree of constraints on
output
Confidence
Label
Basis
Bishops Castle
Groundwater only zone
comprising two sources.
Degree of constraints is
assessed as Low to
Medium.
AC
Constraints data is available and consistent.
Constraints are simple; determined by
infrastructure and licence.
Site specific hydro-geological data for this zone
has a 16 year record. Regional observation level
data has a 41 year record.
Kinsall
Groundwater only zone
comprising two sources.
Degree of constraints is
assessed as Low to
Medium.
AC
Constraints data is available and consistent.
Constraints are simple; controlled by group
licence.
Site specific hydro-geological data for this zone
has a15 year record. Regional observation level
data has a 41 year record.
Llandinam &
Llanwrin
Groundwater only zone
comprising two sources.
Degree of constraints is
assessed as Low to
Medium.
AC
Constraints data is available and consistent.
Constraints are simple; determined by
infrastructure and licence.
Site specific hydro-geological data for this zone
has an average of 17 year record. Regional
observation level data has a 41 year record.
Mardy
Groundwater only zone
comprising one source.
Degree of constraints is
assessed as Low to
Medium.
AC
Constraints data is available and consistent. The
constraint is simple; determined by infrastructure.
Site specific hydro-geological data for this zone
has a 19 year record. Regional observation level
data has a 41 year record.
Ruyton
Groundwater only zone
comprising one source.
Degree of constraints is
assessed as Low to
Medium.
AC
Constraints data is available and consistent. The
constraint is simple; controlled by licence.
Site specific hydro-geological data for this zone
has a 15 year record. Regional observation level
data has a 41 year record.
Whitchurch &
Wem
Groundwater only zone
comprising three sources.
Degree of constraints is
assessed as Low to
Medium.
AC
Constraints data is available and consistent.
Constraints are simple; determined by
infrastructure and licence.
Site specific hydro-geological data for this zone
has a 16 year record. Regional observation level
data has a 41 year record.
Rutland
Zone is based on bulk
supply imports from
Anglian Water.
AA
Constraint is based on the full amount of bulk
supply being available when required as per our
bulk supply agreement.
Appendix A: How much water do we have available?
47 Severn Trent Water: Final Water Resources Management Plan 2014
A3 Future changes to deployable output
Our baseline projections of future deployable output include our assessment of the impacts on
supply of the EA’s Restoring Sustainable Abstraction programme and of climate change. This
chapter explains how we have assessed these impacts and how they have been incorporated
into our baseline deployable output projections.
A3.1 Restoring Sustainable Abstraction
Some of our existing water abstractions may be having a detrimental effect on the
environment, particularly during dry weather periods when river flows are low. Throughout
AMP5 we are investigating the impacts of those abstractions identified by the EA as possibly
causing harm to the environment. Through our investigation work we are gathering site
specific evidence of the extent of damage being caused, and whether our activities are the
main cause, or just part of the problem.
Where our abstractions are identified as ‘confirmed’ or ‘likely’ to be the cause of the problem,
the EA requires us to find and implement solutions. These solutions might include revoking or
reducing our abstraction licences at the affected sites and possibly finding an alternative
source of supply. These sustainability reductions to licences may be required to protect
international or national designated conservation sites (Habitats Directive, Sites of Special
Scientific Interest or Biodiversity 2020 sites), to protect locally important sites or to deliver
Water Framework Directive (WFD) objectives.
In preparing our WRMP, we have worked with the EA to find workable solutions to the
‘confirmed’ and ‘likely’ sites, ranging from local environmental mitigation measures to
alternative sources of supply. The reductions to our baseline deployable output projections
include the impacts of any reduced or revoked abstraction licences at sites where we are likely
to be required to change our abstractions.
The extent of the ‘confirmed’ and ‘likely’ sustainability changes to abstraction licences included
in our final WRMP are summarised below. We then explain the impacts that these will have on
the deployable output of our water resource zones.
Confirmed and Likely Changes
In August 2012 the EA issued phase 1 of their National Environmental Programme (NEP),
which included the list of sustainability changes to abstraction licences that they require us to
included in our final WRMP. The EA provided a list of ‘confirmed’ and ‘likely’ sustainability
changes plus other ‘non-licence change solutions’ required to mitigate local environmental
concerns. The changes identified were based on our current AMP5 investigations, some of
which were inconclusive at that stage, and on schemes identified from our previous AMP4
work.

Appendix A: How much water do we have available?
48 Severn Trent Water: Final Water Resources Management Plan 2014
A second notification was issued in Phase 2 of the NEP in February 2013. This included the
addition of a new site at Batchley Brook and Stanford Reservoir plus the removal of the
Croxden Brook site from the original likely list. The timing of the Phase 2 list means that these
changes have not been able to be included in the final WRMP.
The final formal notification of the sustainability changes required by the EA was issued in
Phase 3 of the NEP in August 2013. However as the final Impact Assessment reports were
completed by the end of December 2013 (as a regulatory delivery date) a further revision was
made in Phase 4 in December 2013, and we believe there will be a further revision to be made
in Phase 5. Changes to the Implementation list include the addition of Dover Beck, Meece
Brook and River Greet, and the removal of Aldford Brook. There are also changes made in
the ‘Investigation and Options Appraisal’ list and ‘Ongoing’ list. We are also in discussion with
the EA about dates for delivery of schemes and Options Appraisal .
The Table below outlines the confirmed and likely sustainability reductions provided by the EA
in the August 2012 Phase 1 NEP and which we have included in our WRMP.

Appendix A: How much water do we have available?
49 Severn Trent Water: Final Water Resources Management Plan 2014
Table A3.1: Confirmed and Likely sustainability changes for groundwater
EA RSA Site NameSTWL Source Licence
Name
Current
Daily
Average
(Ml/d)
New Daily
Average
(Ml/d)
Type
River Blithe Sheepwash 4.54 0.00 Licence Revoked
River Sherbourne Brownshill Green 2.50 0.00Licence Varied - Change of use to
Compensation
Swynnerton Pools Swynnerton 10.25 9.75 Licence Reduction
Rainworth 9.00 0.00 Licence Revoked
Normans Hollow 5.00 0.00 Licence Revoked
Rushley 4.00 0.00 Licence Revoked
Washingstocks 4.49 0.35 Licence Reduction
Whitford 4.50 0.35 Licence Reduction
Wildmoor 8.17 0.00 Licence Revoked
Sherrifhales 5.12 0.00 Licence Revoked
Lizard Mill & Shifnal 15.92 0.00 Licence Revoked
Cosford & Neachley 20.46 10.10 Licence Reduction
Glynch Brook Bromsberrow 6.00 3.00 Licence Reduction
Peckforton 5.85 Licence Reduction
Tattenhall 6.81 Licence Reduction
Tower Wood 5.67 Licence Reduction
Dimmingsdale No Change No Change Local Scheme
The Bratch No Change No Change Local Scheme
Croxden Brook Greatgate No Change No Change Local Scheme
Pinnock SpringsPinnock Pumping
StationNo Change No Change Local Scheme
Worcestershire
Middle Severn
Sandstone -
Hartlebury Common
SSSI
Astley & Green Street No Change No Change Local Scheme
Worcestershire
Middle Severn
Sandstone - Puxton
& Stourvale Marsh
SSSI
Green Street No Change No Change Local Scheme
Worcestershire
Middle Severn
Sandstone - Hurcott
& Podmore Pools
SSSI
Green Street &
BellingtonNo Change No Change Local Scheme
Merryhill Brook
13.70
GROUNDWATER SOURCES
Rainworth Water
Battlefield Brook
Upper Worfe
Aldford Brook

Appendix A: How much water do we have available?
50 Severn Trent Water: Final Water Resources Management Plan 2014
Table A3.2: Confirmed and Likely sustainability reductions for surface water
EA RSA Site NameSTWL Source Licence
Name
Current
Daily
Average
(Ml/d)
New Daily
Average
(Ml/d)
Type
Rivers Blythe and Bourne Whitacre 50.68 Not known Hands off Flow change & Local Solution
Ambergate No Change No Change Potential Reduction
Little Eaton to Little
Eaton WTWNo Change No Change Potential Reduction
Little Eaton to Church
Wilne WTW No Change No Change Potential Reduction
River Wye SAC HD RoCWyelands to
Mitcheldean WTWNo Change No Change Licence change (HOF and Regulation)
Carsington Reservoir &
Henmore BrookCarsington Reservoir No Change No Change
Operational Change
Compensation Flow Variation
Tittesworth Reservoir Tittesworth No Change No ChangeOperational Change
Compensation Flow Variation
Charnwood Reservoirs Blackbrook Reservoir No Change No ChangeOperational Change
Water Level Management
Charnwood ReservoirsCropston and
Swithland ReservoirsNo Change No Change
Operational Change
Water Level Management
River AshopDerwent Reservoirs
(Ashop Diversion)No Change No Change
Operational Change
Additional Compensation Flow
River Noe Derwent Reservoirs
(Noe Diversion)No Change No Change
Operational Change
Additional Compensation Flow
Middle Derwent
SURFACE WATER SOURCES
We have incorporated these abstraction licence changes into our Aquator model to allow us to
demonstrate the impact on water resource zone deployable output. Several of the
groundwater licence changes are at sources that are largely underutilised. As a result, while
the quantity of licensed volume would be reduced by around 81Ml/d, this translates into a loss
of around 37Ml/d in our total deployable output.
For our surface water sources, many of the changes being sought will affect the operating
rules and daily operation for these sources. The changes will alter the flow regime of these
surface water bodies, often by requiring us to provide more flows. Quantifying the impacts of
these changes on deployable output is more complex and requires the changes to the
operating rules to be clarified. We have not completed our assessment of the deployable
output impact of these changes at this stage and we will continue to work with the EA to
understand how these changes should be translated into operational rules. For example, we
will be actively participating in the EA’s forthcoming Significant Water Management Issues
(SWMI) consultation. The EA will be running this consultation from June to December 2013.
One of the issues that we expect this to cover is how best to align this plan with the River
Basin Management Plans (RBMPs) that are due in 2015.
In addition to these ‘confirmed’ and ‘likely’ sustainability changes to our abstraction licences,
we are also affected by the changes required by the Welsh EA to Dwr Cymru Welsh Water’s
(DCWW) abstraction licence at the Elan Valley Reservoirs in the upper River Wye catchment.
As required under the Habitats Directive, Natural Resources Wales have undertaken a review

Appendix A: How much water do we have available?
51 Severn Trent Water: Final Water Resources Management Plan 2014
of consents (ROC) on the River Wye. This has concluded that a number of licence changes
are required to reduce the impact of abstractions on the river. These changes include
DCWW’s licence at Elan Valley Reservoir, which will affect the discharges from the reservoir
for river compensation and regulation.
DCWW provide us with a major bulk supply of water from Elan Valley Reservoirs to our
Strategic Grid zone. Our Aquator modelling indicates that it is the changes to the Elan Valley
Reservoir operation that will have the single biggest impact on deployable output in that zone.
Our final WRMP assessment showed that up to 75Ml/d of deployable output could be lost in
the Strategic Grid zone due to the changes to the reservoir operation.
Since we published the draft WRMP, we have continued to work with Natural Resources
Wales (NRW) to identify ways to minimise the impacts of these changes to the River Wye and
Elan Valley operation.
We have carried out further Aquator modelling, to ensure that the control curves at Elan that
effect the abstraction at Trimpley are optimised, we have explored ways in which we would
reduce the flow from Elan to Birmingham earlier in the summer during dry years based on the
reservoir level at Elan
Through this work we have reduced the impacts of these changes to around 40Ml/d loss of
deployable output.
However this change increases the use of River Severn water (Trimpley Abstraction) which
will have an Opex cost implication due to the extra pumping required from Trimpley to
Frankley.
The impacts on deployable output in those zones affected by the RSA ‘confirmed’ and ‘likely’
changes are explained below.
Strategic Grid zone
The Phase 1 NEP includes likely licence changes in the Bromsgrove area, impacting our
Washingstocks, Wildmoor and Whitford sources, in the Malvern area at Bromsberrow, and the
Coventry area at Brownshill Green, which total a possible 22Ml/d of licence reductions. There
is also a new “hands off flow” on the River Blythe proposed, which could affect the abstraction
to Whitacre water treatment works. In the latest NEP Bromsberrow is no longer at risk and
the Blythe HOF will be the subject of further investigation before any changes are made
The combined effect of these changes on the deployable output of the Strategic Grid is a
reduction of 5Ml/d across the zone. The changes would also impact on the security of supplies
in the area supplied by the Bromsgrove groundwater sources and would effectively isolate this
supply area from the rest of the Strategic Grid water resource zone.

Appendix A: How much water do we have available?
52 Severn Trent Water: Final Water Resources Management Plan 2014
When these licence changes are combined with the changes to DCWW’s licence at Elan
Valley there is a much larger deployable output reduction in the Strategic Grid zone of 45Ml/d.
In summary, the changes at Elan Valley mean that regulation and compensation releases to
the river from the reservoirs are required at much higher flows in the River Wye than currently.
Also, the maximum combined discharges to the river are higher at all times.
The impacts on Strategic Grid deployable output are show in Table A3.3.
Table A3.3: Impacts of sustainability changes on Strategic Grid zone
Scenario Base DO
(Ml/d)
DO with
Sustainability
Changes (Ml/d)
Reduction
(Ml/d)
Sustainability
changes only
1465 1460 5
Sustainability
changes with Wye
HD (ROC) changes
1465 1420 45
The large reduction in zonal deployable output resulting from the licence changes is caused
primarily by the increased regulation and compensation releases from Elan Valley Reservoirs,
reducing the amount of water available to send to the Strategic Grid zone. Our modelling
shows that under the proposed new reservoir operating rules, during dry years much less
water is available for supply from Elan Valley to the Strategic Grid zone.
For example, our modelling shows that during the summer of 1976 (Apr-Sept) 4800Ml more
water would have been released from the reservoir to the River Wye and 4600Ml less would
have been available to the Strategic Grid zone. In the model this causes a large reduction in
the flow to the Strategic Grid in September 1976, as we have shown in Figure A3.1.

Appendix A: How much water do we have available?
53 Severn Trent Water: Final Water Resources Management Plan 2014
Figure A3.1: Reduction in Elan Valley flow to the Strategic Grid
0
50
100
150
200
250
300
350
400
Jan Feb Mar Apr May Jun Jul Aug Sep Oct Nov Dec
Ml/
d A
vera
ge
Elan flow to Birmingham Base (SG DO Demand) Elan flow to Birm. (SG DO Demand)
The increased discharges to the river also cause the reservoirs to draw down more sharply
and more often, making less severe drought events more critical to our zonal deployable
output. As a result, the Elan Valley changes mean there would also be a deterioration in our
level of service around hosepipe ban frequency under the base level DO. Figure A3.2 shows
that under the baseline scenario we have three crossing of the TUB line and one crossing of
the NEUB line over the 91 year model run.

Appendix A: How much water do we have available?
54 Severn Trent Water: Final Water Resources Management Plan 2014
Figure A3.2: Baseline DO – Crossings of Elan Valley TUB and NEUB Lines
0
20
40
60
80
100
120
01
-Jan
09
-Jan
17
-Jan
25
-Jan
02
-Fe
b
10
-Fe
b
18
-Fe
b
26
-Fe
b
05
-Mar
13
-Mar
21
-Mar
29
-Mar
06
-Ap
r
14
-Ap
r
22
-Ap
r
30
-Ap
r
08
-May
16
-May
24
-May
01
-Ju
n
09
-Ju
n
17
-Ju
n
25
-Ju
n
03
-Ju
l
11
-Ju
l
19
-Ju
l
27
-Ju
l
04
-Au
g
12
-Au
g
20
-Au
g
28
-Au
g
05
-Se
p
13
-Se
p
21
-Se
p
29
-Se
p
07
-Oct
15
-Oct
23
-Oct
31
-Oct
08
-No
v
16
-No
v
24
-No
v
02
-De
c
10
-De
c
18
-De
c
26
-De
c
Base DO Elan Valley
Elan Valley Implement TUB Elan Valley Non-Essential Use ban 1944 1976 1984
However with the River Wye HD licence changes if we run the model at the same DO demand
level we would have five crossings of the TUB line and three crossings of the NEUB line, as
illustrated in Figure A3.3.
Figure A3.3: Wye HD (ROC) – Crossings of Elan Valley TUB and NEUB Lines
0
20
40
60
80
100
120
01
-Jan
09
-Jan
17
-Jan
25
-Jan
02
-Fe
b
10
-Fe
b
18
-Fe
b
26
-Fe
b
05
-Mar
13
-Mar
21
-Mar
29
-Mar
06
-Ap
r
14
-Ap
r
22
-Ap
r
30
-Ap
r
08
-May
16
-May
24
-May
01
-Ju
n
09
-Ju
n
17
-Ju
n
25
-Ju
n
03
-Ju
l
11
-Ju
l
19
-Ju
l
27
-Ju
l
04
-Au
g
12
-Au
g
20
-Au
g
28
-Au
g
05
-Se
p
13
-Se
p
21
-Se
p
29
-Se
p
07
-Oct
15
-Oct
23
-Oct
31
-Oct
08
-No
v
16
-No
v
24
-No
v
02
-De
c
10
-De
c
18
-De
c
26
-De
c
Wye ROC Level of Service
Elan Valley Implement TUB Elan Valley Non-Essential Use ban 1921 1944 1976 1984 1989

Appendix A: How much water do we have available?
55 Severn Trent Water: Final Water Resources Management Plan 2014
Forest and Stroud zone
There are no ‘likely’ sustainability changes in the Phase 1 NEP list that affect the groundwater
licences in the Forest and Stroud zone, however this zone is affected by the licence changes
required on the River Wye. The EA’s Review of Consents on the River Wye concluded that
changes are required to our Wyelands (Lydbrook) abstraction licence, which supplies
Mitcheldean WTW This is our only confirmed licence change in the Phase 1 NEP list.
Table A3.4: Impacts of sustainability changes on Forest and Stroud zone
Base DO
(Ml/d)
DO with
Sustainability
Changes (Ml/d)
Reduction
(Ml/d)
45 45 0
Under the new Lydbrook licence conditions, our maximum daily and annual average
abstraction quantities are unchanged. However, the frequency and duration of when the
maximum quantities would be reduced will be greatly increased because the licence threshold
will be linked to a much higher minimum river flow condition. Also there is no longer a mid-
level abstraction rate allowed, and abstraction would be reduced straight from 55Ml/d to
39.8Ml/d, depending on river flows.
The effect of the Lydbrook licence changes do not impact on the deployable output of the
zone, because this is already constrained by the drought output from spring-flow sources
elsewhere in the zone combined with the Lydbrook minimum licence condition during dry
years.
However, Mitcheldean is the largest source of supply in the Forest and Stroud zone, and
provides supply support to the groundwater / spring sources in the area. The licence change
will put wider supply resilience at risk as the alternative supply plans for the neighbouring
groundwater sources will not be operable without the current full Mitcheldean licensed
quantities available to support them.
The risk is that Mitcheldean will not be available to support outages at our groundwater
sources in future because its output will more frequently be restricted to minimum abstraction.
This can be seen clearly in the below two figures which compare the frequency and duration of
the Mitcheldean abstraction being restricted under the current and proposed new licences.
Figure A3.4: Graph of modelled abstraction constraint days per year current licence

Appendix A: How much water do we have available?
56 Severn Trent Water: Final Water Resources Management Plan 2014
0
50
100
150
200
250
300
350
400
1920
1922
1924
1926
1928
1930
1932
1934
1936
1938
1940
1942
1944
1946
1948
1950
1952
1954
1956
1958
1960
1962
1964
1966
1968
1970
1972
1974
1976
1978
1980
1982
1984
1986
1988
1990
1992
1994
1996
1998
2000
2002
2004
2006
2008
2010
Current Wye Regulation, Regulation Days per year
Sum of No Regulation (>1400) 55Ml/d Sum of 1st Regulation (<1400) 45.5Ml/d
Sum of 2nd Regulation (<1209Ml/d Elan above LRC) 45.5Ml/d Sum of Max Reg (<1209Ml/d Elan below LRC) 39.8Ml/d
Figure A3.5: Graph of modelled abstraction constraint days per year Wye ROC
0
50
100
150
200
250
300
350
400
1920
19
22
19
24
19
26
1928
19
30
19
32
1934
19
36
19
38
1940
1942
19
44
19
46
1948
19
50
19
52
1954
1956
19
58
19
60
1962
19
64
19
66
1968
19
70
19
72
1974
1976
19
78
19
80
1982
19
84
19
86
1988
1990
19
92
19
94
1996
19
98
20
00
2002
20
04
20
06
20
08
2010
W382 Wye Option Regulation Days Per Year
Sum of W382 No Regulation (>2350) 55Mld Sum of W382 Max Regulation (<2350) 39.8Ml/d
Key: Max abstraction: Green = 55Ml/d, orange / purple 45.5Ml/d, Red 39.9Ml/d
It can be seen from these graphs that with the new abstraction licence conditions, Mitcheldean
will be on minimum abstraction for many more days each year, and what has historically been
an unusual event will become an annual occurrence.

Appendix A: How much water do we have available?
57 Severn Trent Water: Final Water Resources Management Plan 2014
Shelton zone
The Phase 1 NEP included a total of 31.4Ml/d ‘likely’ sustainability reductions in the Shelton
zone, targeted on our River Worfe sources at Sherrifhales, Lizard Mill, Shifnal, Cosford, and
Neachley groundwater sources.
Table A3.5: Impacts of sustainability changes on Shelton zone
Base DO
(Ml/d)
DO with
Sustainability
Changes (Ml/d)
Reduction
(Ml/d)
143 115 28
These licence changes have the effect of reducing the deployable output in the zone by
28Ml/d. The changes also move the deployable output constraint in the zone from Shrewsbury
to Wolverhampton North, and effectively would mean that the Shelton zone would be split into
two separate water resource zones.
North Staffs zone
The Phase 1 NEP included a total of 9.7Ml/d ‘likely’ sustainability reductions in the North Staffs
zone, targeted at Swynnerton, Sheepwash, Peckforton, Tower Wood and Tattenhall
groundwater sources. In the latest NEP the Aldford Brook (Peckforton, Tower Wood and
Tattenhall) has been moved from Implementation into the Investigation and Options Appraisal
list and so any licece reductions will not be confirmed until 2017 at the earliest.
Table A3.6: Impacts of sustainability changes on North Staffordshire zone
Base DO
(Ml/d)
DO with
Sustainability
Changes (Ml/d)
Reduction
(Ml/d)
148.0 147.0 1
The combined effect of these changes is a 1Ml/d reduction in deployable output for this zone.
The modelled failure point for the zone remains in the Stone demand centre.
Nottinghamshire zone
The Phase 1 NEP included a total of 18Ml/d likely sustainability changes in the
Nottinghamshire zone targeted at the Rainworth, Rushley and Norman’s Hollow abstraction
licences, all of which would be revoked. The latest NEP now also includes licence revocations
for Salterford and Fishpool (Dover Beck) and also a reduction or revocation for Farnsfield
(River Greet).

Appendix A: How much water do we have available?
58 Severn Trent Water: Final Water Resources Management Plan 2014
Table A3.7: Impacts of sustainability changes on Nottinghamshire zone
Base DO
(Ml/d)
DO with
Sustainability
Changes (Ml/d)
Reduction
(Ml/d)
270 270 0
However there is no loss to deployable output for this zone because these sites are currently
disused.
Pragmatic estimate of further sustainability reductions The EA’s August 2012 Phase 1 NEP also provided a list of the remaining water bodies where
the results of our current investigations are inconclusive. The licence changes at these sites
have been classified as “unknown” in the phase 1 NEP and we have not included these
potential sustainability changes in our final WRMP.
However, in October 2012 the EA subsequently provided a ‘pragmatic’ estimate of those
currently unknown sites which they think could become ‘likely’ in the Phase 3 NEP for August
2013. The purpose of this pragmatic list was to allow us to sensitivity test our final WRMP
planning scenarios. These additional assumed reductions are shown in Table A3.8 below and
amount to about 43 Ml/d.
Table A3.8: Pragmatic assumptions around sites where our impacts are currently
unknown
EA RSA Site NameSTWL Source Licence
Name
Current
Daily
Average
(Ml/d)
New Daily
Average
(Ml/d)
Type
Cinderford Brook Buckshaft 6.00 1.00 Licence reduction
Ell Brook Newent 2.50 1.00 Licence reduction
Pool End Licence reduction
Highgate Licence reduction
Dover Beck & Oxton
DumbleBlidworth Group 61.80 57.80 Licence reduction
Rainworth Water Clipstone Group 73.83 65.43 Licence reduction
Copley 4.97 Licence reduction
Hilton 22.80 Licence reduction
Spadesbourne
BrookBromsgrove Group 39.00 37.00 Licence reduction
Chaddesley Corbett 6.83 2.50 Licence reduction
Dunhampton 3.41 0.50 Licence reduction
River Churnet -
Rudyard tributary12.40 11.40
Lower Worfe 13.57
Hadley Brook
GROUNDWATER SOURCES

Appendix A: How much water do we have available?
59 Severn Trent Water: Final Water Resources Management Plan 2014
We have not included this pragmatic estimate of additional sustainability changes in our
baseline deployable output or in our headroom assessment. We have instead used it to test
the impacts of these potential additional changes on the proposals set out in our final WRMP.
Further discussion of the impacts of these potential additional sustainability changes can be
found in Appendix E.
Following the completion of Impact Assessment reports it was shown that of the ‘pragmatic’ list
the only licences that would be changed were those in the Dover Beck waterbody (Salterford
and Fishpool).
A3.2 Impacts of Climate Change on Water Supply
Since the publication of our 2009 Water Resource Management Plan (WRMP09) we have
continued to develop our assessment of the potential impacts of climate change on our water
supply system. Our WRMP09 was informed by the then best available UK Climate Impact
Programme 2002 (UKCIP02) climate change impact scenarios. In 2009, an update to the UK
Climate Projections (UKCP09) was published.
The UKCP09 new set of data and tools enables water companies to carry out a probabilistic
assessment of what the impacts of climate change are likely to be on their supply systems.
The extent of UKCP09 tools and datasets means that there is a wide choice of methodologies
that can be used to carry out impact assessments depending on the user’s needs and
circumstances. Figure A3.6 shows the range of methodologies recommended in the
Environment Agency’s Water Resources Planning Guidelines (WRPG) which was published in
2012.
Figure A3.6: Decision tree showing the climate change analysis options

Appendix A: How much water do we have available?
60 Severn Trent Water: Final Water Resources Management Plan 2014
The range of methodologies is described in detail in the joint UKWIR and Environment Agency
report “Climate change approaches in water resources planning – Overview of new methods”
(2013). Table A3.9 outlines some of the differences between the methodologies available to
water companies now and when their 2009 Water Resource Management Plans were put
together.
Table A3.9: Differences between methods available at WRMP09 and dWRMP13
WRMP09 Method Final WRMP13 Methods
Methodology based on UKWIR06 project which used the UKCIP02 projections
Multiple methods available, based on UKCP09 projections or 11 Regional Climate Models
Method selected depended on whether the company had rainfall-runoff models available to create climate perturbed flow series
Method selected depends on the initial assessment of vulnerability of the water resource zone (WRZ) to the impacts of climate change. Different approaches can be taken for different WRZs if the level of vulnerability is different
Method translated the projections into 3 scenarios – “Mid”, “Wet” and “Dry” (i.e. 3 sets of DO runs in addition to the baseline)
Depending on method selected, outputs range from 11, 20 or 100 scenarios (i.e. 11, 20 or 100 sets of DO runs in addition to the baseline runs)
“Mid” scenario was adopted as the central estimate which was deducted from baseline DO in WRP tables
Companies must decide how to select a suitable central estimate to adopt as the likely reduction in terms of DO
“Wet” and “Dry” scenario outputs were used to provide a range of uncertainty due to climate change in target headroom
Outputs from all other scenarios feed into the range of uncertainty in target headroom
Method produced outputs indicative of the 2020s (2025)
UKCP09 gives a choice of time-slices. Method guidance produces outputs indicative of the 2030s (2035). Use of a different time-slice could produce different outputs
Overview of Approach
Figure A3.7 shows an overview of the methodology we have followed to assess the impact of
climate change on our groundwater and surface water sources. A step by step description of
our approach can be found in section A3.2.2, along with the decisions we have made to
ensure consistency across all of our sources. In accordance with the EA’s WRPG we first
carried out a vulnerability assessment to determine how vulnerable each of our 15 water
resource zones is to the impact of climate change. This then enabled us to determine an
appropriate methodology to use.
An overview of the impacts of climate change on our surface water and groundwater sources
can be found in sections A3.2.3 and A3.2.4 respectively, and details of the impact on our water
resource zone deployable output in section A3.2.5.

Appendix A: How much water do we have available?
61 Severn Trent Water: Final Water Resources Management Plan 2014
Figure A3.7: Overview of methodology followed
Carry out vulnerability assessment
Select suitable methodology based on vulnerability assessment
B2.1 and B2.2 selected
Establish which UKCP09 projections to use – e.g. River Basin,
Administrative area, grid square
Severn Basin selected
Download 10,000 temperature and precipitation change
projections for 2030s, using medium emissions scenario
Use Latin Hypercube Sampling to select a sub-sample of 100 projections
Use Drought Indicator to select ‘smart sampled’ subset of 20 projections
Derive suitable Drought Indicator
Naturalise baseline Aquator inflow series
Aquator modelling to derive impact of the projected inflow
changes and changes in Groundwater DO on zonal deployable
output using the 20 ‘smart samples’ (for 2035)
Determine the central estimate deployable
output (reduction in baseline DO)
Scale the central estimate to calculate reduction in deployable
output for all other years in the planning horizon to 2040
Use the deployable output modelling to create
uncertainty distribution to use in target headroom
modelling
1
Group catchments based on hydrological characteristics
2
Carry out hydrological modelling to derive monthly flow factors for
each catchment for each of the 100 climate projections
3
4
Apply the climate change flow factors to
naturalised baseline Aquator inflow series
5
6
7
8
9
Denaturalise climate change impacted Aquator inflow series
Carry out groundwater assessment
Step number in
method description
(section (A3.2.2)

Appendix A: How much water do we have available?
62 Severn Trent Water: Final Water Resources Management Plan 2014
Vulnerability Assessment: Surface water
In order to decide which method to adopt, we carried out a vulnerability assessment for each
of our water resource zones. By doing this, we were able to identify which of our water
resource zones are likely to be most sensitive to the effects of climate change and require a
more detailed/complex modelling approach. To complete the vulnerability assessment we
used a variety of sources of information, including:
• Model outputs (deployable output modelling, modelled reservoir drawdown, Supply-
Demand Balance)
• The Environment Agency’s Catchment Abstraction Management Strategy
• Our abstraction licence documents and source information
• Our Drought Plan
• Our WRMP09
• Our Climate Change Adaptation Report, which was published in 2011.
We also carried out an initial stage of deployable output modelling to update our
understanding of how our surface water supply system responds to the impact of climate
change. Since we published our 2009 Water Resource Plan, we have increased our water
resource zones from 6 to 15 WRZs which has required subsequent reconfiguration of our
Water Resource Model, Aquator. We have also recalibrated the baseline flow series used in
our deployable output modelling due to changes in the Met Office gridded rainfall
methodology, which resulted in significant changes to the derived historical annual average
and long term average rainfall for much of our region.
All of these changes meant we could not simply use our WRMP09 flow series datasets or
model outputs to assess the likely impacts for our new WRMP. Instead of repeating the
WRMP09 approach (which used the UKCIP02 climate projections) with the new baseline flow
series we carried out initial modelling using approach A1.2 to assess the likely impact of the
UKCP09 projections on our surface water sources. This initial modelling utilised the climate
change analysis that was readily available following the 2009 UKWIR study “Assessment of
the significance to Water Resource Management Plans of the UK Climate Projections 2009”
(2009). The outputs and supporting information for the Future Flows and Groundwater Levels
project were not published until April 2012 so could not be used in our vulnerability
assessment.
The outputs of the A1.2 modelling were then cross-checked against the outputs of the
WRMP09 climate change modelling to derive an overall vulnerability assessment for our
surface water sources and conjunctive use water resource zones. The A1.2 assessment has
been used to generate a magnitude versus sensitivity plot, shown in Figure A3.8.

Appendix A: How much water do we have available?
63 Severn Trent Water: Final Water Resources Management Plan 2014
Figure A3.8: Magnitude versus Sensitivity plot for our conjunctive use water resource zones showing the climate change mid scenarios percentage change in deployable output (from the baseline) and the uncertainty range
-15.0
-10.0
-5.0
0.0
5.0
0.0 5.0 10.0 15.0 20.0
Mid
Sce
nar
io (
%)
Range (Wet-Dry scenario) (%)
Strategic Grid
Nottingham
Newark
Shelton
Wolverhampton
Forest and Stroud
North Staffs
Using the results from the magnitude versus sensitivity plot, we identified the vulnerability
classification for each water resource zone using the vulnerability scoring matrix shown in
Table A3.10.
Table A3.10: Vulnerability scoring matrix
Uncertainty range (% change wet to
dry)
Mid scenario (% change in deployable output)
<-5% >-5% >-10%
<5% Low Medium High
6 to 10% Medium Medium High
11 to 15% High High High
>15% High High High
The magnitude versus sensitivity plot and scoring matrix indicate that our two largest zones,
the Strategic Grid and Nottinghamshire, are both “high” vulnerability. All our other conjunctive
use zones, which use a combination of impounding reservoirs, river abstractions and
groundwater sources to supply our customers, are “low” vulnerability.

Appendix A: How much water do we have available?
64 Severn Trent Water: Final Water Resources Management Plan 2014
The Strategic Grid zone covers a large area of the Severn Trent region, and includes most of
our strategic raw water reservoirs (with the exception of Tittesworth reservoir which is located
in the North Staffordshire WRZ). This zone is classified as being “high” vulnerability as the
modelling produces a wide range of uncertainty - under very wet conditions, the deployable
output could be higher than our baseline and under very dry conditions, deployable output
could be much lower than baseline depending on the scenario used. Although the
Nottinghamshire zone is supplied by a number of groundwater sources, it also relies on an
import from some of the surface water sources in the Strategic Grid. This surface water import
may be impacted by climate change, which has led to the Nottinghamshire zone being
classified as “high” vulnerability.
As discussed earlier in this Chapter, we have developed an integrated water resources
modelling system using Aquator, which incorporates all of our water resource zones. Due to
the complexity of our supply system, we need to ensure that any flow series derived from the
climate change assessment are spatially coherent and can be used together at the same time
in our Aquator model. Although few imports and exports exist between our water resource
zones, several of our zones have “shared resources”. For example, the Shelton,
Wolverhampton and Strategic Grid zones are not physically connected but all abstract from
the River Severn, taking water from different locations.
Our largest abstractions from these shared resources are used to supply the Strategic Grid
zone. Adopting different climate change assessment approaches for our “low” and “high”
vulnerability zones when they are modelled together could result in climate change flow series
which are not spatially coherent, and could over- or underestimate the impact of the changing
climate. We have therefore adopted a “high” vulnerability approach for all 15 zones to ensure
consistency in our zonal deployable output modelling. That is the B2.1 method to derive 100
Latin Hypercube Samples from the full UKCP09 scenarios and then B2.2 to derive a sub-
sample of 20 scenarios using a Drought Indicator derived specifically for the sources in our
region. The selected methods are highlighted by the orange box in Figure A3.9.

Appendix A: How much water do we have available?
65 Severn Trent Water: Final Water Resources Management Plan 2014
Figure A3.9: Summary of climate change impacts assessment methods suitable for
“Medium/High vulnerability” water resource zones
Vulnerability assessment: Groundwater
Our groundwater vulnerability analysis considered three methods of selecting which
groundwater sources to include in the assessment of impacts on groundwater deployable
output (DO) due to Climate Change:
Option 1: Only consider the sources identified as flow or level constrained (i.e.
where the DO defined for the source is limited by the flows or level at the
abstraction point). These sources comprise approximately 15% of STWL GW
sources. Under this assessment, only the sources that were initially screened as
vulnerable to level or flow changes would be assessed for climate change;
Option 2: Consider the sources identified as flow or level constrained and those
in the areas of the West Midlands, Bromsgrove and East Midlands and Yorkshire
Sandstone groundwater model, that comprise a number of licence constrained
sources. This approach is consistent with the approach adopted for WRMP09.
Under this assessment the sources that were initially screened as vulnerable to
level or flow changes would be assessed. Also, under this assessment the
regional groundwater models would be utilised to predict recharge changes to the

Appendix A: How much water do we have available?
66 Severn Trent Water: Final Water Resources Management Plan 2014
groundwater units under the various climate change scenarios. This assessment
would proportionally reduce the deployable output of any licence constrained
sources in the modelled units by the predicted recharge changes to the unit;
Option 3: All groundwater sources, including infrastructure and licence
constrained sources. Under this assessment the sources that were initially
screened as vulnerable to level or flow changes would be assessed. The
sources that were licence constrained and fell within the regional groundwater
models would be assessed (as Option 2) and sources that were licence
constrained and fell outside of the groundwater models would be assessed by
applying a STWL wide change to recharge and proportionally reducing the
deployable output by the predicted recharge (and licence) derived changes to the
unit;
We were able to use outputs of the 2008 assessment and modelling work to undertake the
initial groundwater vulnerability assessment. The 2008 work showed limited impact on level
and constrained sources, whereas sources in the groundwater modelled area were predicted
to have more variation; groundwater recharge in the modelled areas was approximately 32%
and 61% higher in wet scenario (West Mids and Notts Doncaster groundwater models), mid
recharge similar to baseline (1% and 17%) and 28 and 26% lower in the dry scenario. For our
assessment, we selected groundwater sources based on Option 1. This approach was
discussed and agreed with the Environment Agency.
The magnitude versus sensitivity was considered under Option 1, on a water resource Zone
level, for groundwater sources, as shown in Figure A3.10.

Appendix A: How much water do we have available?
67 Severn Trent Water: Final Water Resources Management Plan 2014
Figure A3.10: Magnitude versus Sensitivity plot for our groundwater sources at water
resource zone level showing the climate change mid scenarios percentage change in
deployable output (from the baseline) and the uncertainty range
With the exception of groundwater sources in the Mardy and Forest and Stroud WRZs, the
majority of groundwater sources were considered to be low vulnerability. However, in order to
maintain spatial coherency with the surface water climate change assessment (especially for
zones containing both surface water and groundwater sources), it was decided to assess the
groundwater sources in the “high” vulnerability conjunctive use zones as also having high
vulnerability. This approach was discussed and agreed with the Environment Agency through
a series of workshops and meetings in 2012.
Vulnerability assessment: Water Resource Zone Vulnerability Classification
The vulnerability assessment for our conjunctive use and groundwater only zones followed the
methodology described in the EA’s WRPG (2012). For each zone we have produced a table
containing the information required, as per Table 3.0 of the WRPG, which we have shared with
the EA. Table A.3.11 shows the vulnerability classification for each water resource zone.

Appendix A: How much water do we have available?
68 Severn Trent Water: Final Water Resources Management Plan 2014
Table A3.11: Water Resource Zone vulnerability classification
WRZ Water Scarcity Indicator Supply Demand
Balance (based on
dWRMP)
Vulnerability
Bishops Castle All of the licences we hold for sources in this
zone are in CAMS areas classified as being
No Water Available
In surplus Low
Forest & Stroud 74% of the licences we hold for sources
feeding this zone are in CAMS areas classified
as being Over Abstracted or Over Licensed
In deficit initially, but will
have a small surplus
through the later years of
the planning period
Low/Medium
Kinsall All of the licences we hold for sources feeding
this zone are in CAMS areas classified as
being Over Licensed
In surplus Low
Llandinam &
Llanwrin
All of the licences we hold for sources in this
zone are in CAMS areas classified as being
No Water Available
In surplus Low
Mardy All of the licences we hold for sources feeding
this zone are in CAMS areas classified as
being Over Licensed
In surplus Low
Newark All of the licences we hold for sources feeding
this zone are in CAMS areas classified as
being Water Available
In surplus Low
North
Staffordshire
50% of the licences we hold for sources
feeding this zone are in CAMS areas classified
as being Over Abstracted or Over Licensed.
In surplus (assuming
sustainability reductions
do not increase)
Low
Nottinghamshire 59% of the licences we hold for sources
feeding this zone are in CAMS areas classified
as being Over Abstracted or Over Licensed.
In surplus initially, then
in deficit until the end of
the planning period
High
Rutland Bulk Supply agreement
for a fixed volume.
Low
Ruyton All of the licences we hold for sources feeding
this zone are in CAMS areas classified as
being Over Licensed
In surplus Low
Shelton 66% of the licences we hold for sources
feeding this zone are in CAMS areas classified
as being Over Abstracted or Over Licensed.
Risk to supply demand
balance is driven by
sustainability changes
Low
Stafford 56% of the licences we hold for sources
feeding this zone are in CAMS areas classified
as being Over Abstracted or Over Licensed.
In surplus Low
Strategic Grid 41% of the licences we hold for sources
feeding this zone are in CAMS areas classified
as being Over Abstracted or Over Licensed.
This zone will go into
deficit. Key risks to this
zone are sustainability
changes and climate
change
High
Whitchurch &
Wem
All of the licences we hold for sources feeding
this zone are in CAMS areas classified as
being Over Licensed
In surplus Low
Wolverhampton All of the licences we hold for sources feeding
this zone are in CAMS areas classified as
being Over Abstracted
In surplus Low

Appendix A: How much water do we have available?
69 Severn Trent Water: Final Water Resources Management Plan 2014
A3.2.1 Discussions with the Environment Agency
We have kept the EA involved and fully informed throughout each stage of our climate change
assessment. We did this in a number of ways throughout 2012, including:
Once we had completed our vulnerability assessment we held a “start up” meeting with the
EA to agree which methodology we would be following before embarking on the full
assessment.
We arranged a technical session, focusing on the detail of the approach we followed and
decisions made at each step. We used this session to agree appropriate next steps,
including the groundwater approach as discussed in previous section).
We produced briefing notes and presentations to keep the EA fully appraised of our
progress
We shared the deployable output modelling results as soon as the full assessment was
complete.
Alongside this, we have also briefed Ofwat and Natural England on our approach and
modelling results.
The response we have received following these communications has generally been positive.
A3.2.2 Choice of Climate Change scenarios
Whilst our groundwater sources are less vulnerable than surface water, the interconnectivity of
our system (now and in the future) means that using different methods for the different zones
was not appropriate. Using the same approach for zones supplied by groundwater only
enables us to compare the climate change impacts between zones and to assess future
options for improving the interconnectivity of our supply network. The “high” vulnerability, B2.2
method has therefore also been applied to all groundwater only zones for consistency.
As previously discussed, for consistency and to ensure spatial coherence we opted to carry
out the more rigorous “high” vulnerability methodology for all of our water resource zones.
This gave us a choice of four methodologies (as shown in Figure A3.6), two of which use the
UKCP09 data directly and two which use the outputs of the Environment Agency’s Future
Flows and Groundwater Levels project (known as ‘Future Flows’). We therefore had to give
careful consideration as to which of these methods to use. Figure 3.7 shows an overview of
the methodology we have followed to assess the impact of climate change on our groundwater
and surface water sources.
The Future Flows project outputs were published in April 2012 and use the 11 member
Regional Climate Models (RCM), one of the products of UKCP09. Each of the 11 RCMs
represents a plausible, equally likely potential future. The projections from these RCMs have
been used to produce transient flow series and transient climate series (rainfall and PET)

Appendix A: How much water do we have available?
70 Severn Trent Water: Final Water Resources Management Plan 2014
which cover 1951 to 2098. These transient flow series have been generated using a
hydrological model called CERF. The two alternative methods utilise the 10,000 UKCP09
projections by sub-sampling to a smaller sample size – 100 if Latin Hypercube Sampling is
used, or 20 if a Drought Indicator is used.
Both types of method, Future Flows and UKCP09, offer a number of benefits as well as
drawbacks. The Future Flows outputs enable companies to consider droughts of differing
durations, recurrence and intensities not previously experienced within the historic record used
in our baseline deployable output modelling. The UKCP09 methods perturb the historic
record, making existing events more severe or less severe depending on the climate change
scenario, but do not change their frequency or recurrence. Although Future Flows represents
11 plausible and equally likely potential futures, it does not capture the full range of uncertainty
and potential futures captured in the 10,000 UKCP09 projections. Sub-sampling the 10,000
UKCP09 projections does capture the range of potential futures.
The Future Flows approach presents further difficulties specific to our water resources
modelling methodology. Reconciling the transient flow series from Future Flows with our
existing baseline flow series is problematic as Future Flows and our baseline flow series are
derived using different hydrological models (CERF as opposed to HYSIM which is used in our
baseline modelling). Future Flows is more suitable for companies who do not have their own
hydrological models. The project directly covered 282 river catchments and 24 boreholes. Of
these, 15 river catchments and 2 boreholes are located within our region. For catchments not
included in the Future Flows project, the outputs must be transposed which can start to
introduce some uncertainties in terms of compatibility of data.
Taking all this into consideration, we have used the UKCP09 projections method. The method
adopted is summarised below:
Step1: Selecting the climate change projections
The UKCP09 projections are available at different resolutions – at River Basin level,
Administration District level and individual 25km grid square level. As the Severn Trent region
does not fall completely within the River Basin and Administration Districts used in UKCP09,
the first stage of our analysis was to decide which projection set to use. An analysis of the
different projection sets available for our region showed that the UKCP09 climate projections
from different aggregate areas across our region all provide similar climate change impacts.
The box plots in the charts in Figure A3.11 show the range of variation between aggregate
areas for projected change in annual temperature and rainfall. The box plots summarise the
median (thick black line), 25th/75th percentiles (box), 10th/90th percentiles (whisker tails) and
the remaining values (outlying points).

Appendix A: How much water do we have available?
71 Severn Trent Water: Final Water Resources Management Plan 2014
Figure A3.11: Comparison of UKCP09 projections for annual temperature change (left
plot) and annual rainfall change (right plot)
As previously discussed, the River Severn is an important source of supply for the Strategic
Grid, Shelton and Wolverhampton water resource zones. The Severn River Basin area covers
the headwaters and a large stretch of the River Severn and is also close in proximity to the
headwaters of the River Trent. It was therefore deemed to be a valid approach to apply the
Severn River Basin projection set across the whole of our region, ensuring consistency in the
modelling approach. The UKCP09 Severn River Basin Medium Emissions projections for the
2030s were used for our assessment, with a sub-set of 100 projections being selected using
Latin Hypercube Sampling (LHS) for use in the hydrological modelling.
Step2: Grouping of catchments
In our Aquator water resource model we use 91 years of daily inflow data for 65 catchment
points across the Severn, Trent and Wye catchments. This inflow data series is derived using
79 hydrological models (HYSIM), with the outputs of these HYSIM models being grouped
together and adjusted for artificial influences, such as spray irrigation and sewage effluent
discharges, to allow them to be used in our Aquator model. Modelling all 79 HYSIM
catchments 20 or 100 times using the climate change impacted UKCP09 rainfall and PET data
would have been a major modelling task. Our Aquator model is a complex, representation of
our resource and supply system. We considered simplifying this model to enable faster
modelling of large numbers of climate change runs. However due to the inter-connected
nature of both our supply system, and also the river network within our region, we concluded
that any simplification of this kind would reduce the accuracy of our modelling to an
unacceptable level.
Therefore we have adopted a more streamlined approach to the climate change modelling.
Many of the catchments in our region are physically very similar. An analysis of several
different catchment attributes, including topography, Base Flow Index and SAAR (Standard
Annual Average Rainfall) allowed us to classify all the HYSIM modelled catchments into five

Appendix A: How much water do we have available?
72 Severn Trent Water: Final Water Resources Management Plan 2014
groups with similar hydrological characteristics and responses to climate. The catchment
descriptions are shown in Table A3.12.
Table A3.12: Overview of the catchment groupings derived from hydrological analysis
GroupMinimum
Area (Km²)
Maximum
Area (Km²)
Minimum
SAAR (mm)
Maximum
SAAR (mm)
Minimum Base
Flow Index
Maximum Base
Flow Index
Number
of modelsDescription
1 148 2027 936 1386 0.43 0.58 14Larger intermediary catchments with
generally higher rainfall
2 63 869 641 1165 0.59 0.79 13Catchments with a high Base Flow Index
reflecting a larger dominance of base flow
3 46 795 628 976 0.28 0.55 23Smaller low lying catchments with lower
rainfall
4 885 10443 654 1009 0.40 0.61 17Large downstream, lowland catchments
representing the main river reaches
5 10 246 926 1971 0.33 0.45 9Small typically upland catchments with high
rainfall and a flashy catchment response
Figure A3.12 shows the distribution of the HYSIM hydrological models in the Severn Trent
Region. The catchment types are indicated by the colouring as shown in Table A3.12.
Figure A3.12: Distribution of HYSIM hydrological models in the Severn, Trent and Wye basins
From these catchment groups, five representative “exemplar” HYSIM catchments models were
chosen (one for each catchment group) based on the following criteria:
Calibration method for the baseline flow series – for the exemplar HYSIM catchment models it was preferable to use models which had been calibrated against naturalised flow data

Appendix A: How much water do we have available?
73 Severn Trent Water: Final Water Resources Management Plan 2014
Number of nested upstream models – for the exemplar HYSIM catchment models this was
zero as models nested downstream of another HYSIM model incorporate the hydrological
response of both the upstream catchment(s) and the nested catchment, which could mask
the hydrological response of the nested catchment
Proportional size of artificial influences – for the exemplar HYSIM catchment the proportion
of artificial influences should be as small as possible so that only the impacts on the
natural catchment flow are seen in the climate change modelling. Where artificial
influences were included in the baseline flow series, the artificial influences were removed
from the models for the climate change analysis and were added on again before being
used in the Aquator modelling
Additional information collected during the derivation of the baseline flow series
regarding the confidence in the model itself.
The five exemplar catchments are:
Ithon at Disserth
Wye at Ashford
Wreak at Syston Mill
Teme at Tenbury
Elan Reservoirs
Step 3: Hydrological modelling
The five catchments were modelled in HYSIM using the 100 UKCP09 projections which had
been selected from the 10,000 UKCP09 sample set in stage 1 of our approach. This HYSIM
modelling generated 100 sets of climate change perturbed flow series for each of the five
catchments. These flow series were then used to derive monthly flow factors for each
catchment for each climate scenario. This enabled us to estimate the impacts of climate
change on natural flows.
Step 4: Deriving a suitable Drought Indicator
In order to reduce the number of projections in the assessment from the 100 which were
sampled using Latin Hypercube Sampling, a drought indicator is used to produce a targeted
sample of 20 climate projections. The drought indicator analysis aims to identify the climatic
drivers for historic droughts in our region and sub-samples the extracted 100 UKCP09
scenarios using this data.
An analysis of modelled historic reservoir data, including the drawdown and minima trends
was carried out for four of our key impounding reservoirs – Tittesworth, Derwent Valley, Elan
Valley and Clywedog. These reservoirs are all filled naturally by runoff and other inflows so are
a good indicator of the impacts of climate variability. The drought indicator methodology aims
to create a linear regression model between the reservoir annual minima and different
combinations of the climatological variables. A regression model was created for each of

Appendix A: How much water do we have available?
74 Severn Trent Water: Final Water Resources Management Plan 2014
these reservoirs, with the historic modelled data and historic rainfall and Potential
Evapotranspiration (PET) data being fed in to create an Aridity Index for each reservoir.
For Clywedog reservoir the relationship between aridity and reservoir minima is less well
defined. This is due to the nature of the way this reservoir is operated to help maintain flows in
the River Severn as opposed to being used directly in the water supply system like the
Tittesworth, Elan Valley and Derwent Valley reservoirs. As a result of the different operation of
Clywedog reservoir, storage does not display a particularly strong relationship to climate in
years when storage remains relatively high. The analysis showed that our reservoirs are
sensitive to both annual aridity and shorter term April to August/September aridity. At Elan
Valley, Derwent Valley and Tittesworth the shorter term April to August/September aridity
provided the best relationship. At Clywedog the annual aridity provided the best relationship.
This aridity assessment produced four drought indicators – one for each reservoir.
We also analysed the flow characteristics of the 5 exemplar HYSIM flow series identified in
step 2, looking at mean annual flow change, mean April to September flow change and mean
June to August flow change to develop potential flow indicators of drought.
As a result of the above, we were presented with seven potential drought indicators. These were:
Aridity Index – Tittesworth reservoir
Aridity Index – Elan Valley reservoirs
Aridity Index – Derwent Valley reservoirs
Aridity Index – Clywedog reservoir
Mean annual flow change
Mean April to September flow change
Mean June to August flow change
To enable us to choose which drought or flow indicator was most applicable for our system,
the 100 UKCP09 projections selected using the Latin Hypercube Sampling were applied to the
data sets used to generate the drought and flow indicators (the historic rainfall and PET data
for the drought indicators and flow series for the flow indicators). The 100 sets of climate
perturbed data was then reanalysed and ranked from lowest to highest.
A comparison showed there was relatively good correlation between the Drought Indicators
and Flow Indicators. However, in several instances, the Drought Indicator projections ranked
higher than the Flow Indicator projections ranked. The Drought Indicator is based on statistical
regression, which introduces greater variability. The Flow Indicator is based on hydrological
modelling, which is more robust. We have therefore used the mean April to September flow
change as our “Drought Indicator” as this is based on the more robust hydrological modelling
and uses the information on the climate sensitive period gathered from the Aridity Index
analysis.

Appendix A: How much water do we have available?
75 Severn Trent Water: Final Water Resources Management Plan 2014
The flow factors from step 3 were reviewed and the Drought Indicator was used to identify a
split sample of 20 scenarios for use in our water resources impact modelling. The split sample
provides 20 scenarios covering the full range of expected climate change impacts, but with 10
of these scenarios focussing on the drier end of the range.
Step 5: Flow naturalisation of baseline Aquator inflow series
As previously discussed, our Aquator inflow series is derived using the outputs of 79 HYSIM
catchment models, which are grouped together to form the 65 catchments used in our Aquator
model and adjusted for any in-catchment artificial influences, such as agricultural abstractions.
In creating the climate change impacted inflow series, the artificial influences were removed
from each catchment before the climate change factors generated in step 3 were applied to
the HYSIM flows. This ensured that only the natural flows were being impacted by the impacts
of climate change.
Step 6: Application of climate change flow factors to naturalised baseline inflow
series
Using the Drought Indicator derived in step 4, the 100 UKCP09 projections were sub-sampled
down to a targeted set of 20 projections. The climate change factors generated in step 3 for
the sub-sample were applied to the naturalised flow series, using the catchment groupings to
decide which factors were used for which catchment. This created 20 climate change impact
naturalised flow series for us to use in our Aquator modelling.
Step 7: Denaturalisation of climate change impacted Aquator inflow series
Once the relevant flow factors had been applied to the naturalised inflow series, the artificial
influences were put back in to the flow series and the HYSIM flows were combined into the
Aquator catchments so that they could then be used in our Aquator model.
Step 8: Groundwater assessment
A groundwater assessment was completed using the 20 scenarios identified in step 4; this
produced estimates of changes in GWL and DO for physical and flow constrained sources as
explained in section A3.2.4. Licence constrained sources were assumed to be unchanged.
Step 9: Input of climate change data sets into Aquator
To enable us to model the combined impact of climate change on our inflow series and our
groundwater sources in our conjunctive use water resource zones, we created a sequence set
(to incorporate the climate change impacted inflow series) and a parameter set (to incorporate
the climate change impacted groundwater sources) for each of our 20 climate change
scenarios in our Aquator model, using the UKCP09 sample ID as the identifier.
We imported the climate change impacted flow series into our Aquator model, assigning them
to the relevant catchment and the climate impacted constraint data for the affected
groundwater components. For each climate change run we used the sequence set and
parameter set with the same UKCP09 sample ID to ensure consistency between the datasets
used. To ensure consistency with the baseline modelling, the climate change impacts were

Appendix A: How much water do we have available?
76 Severn Trent Water: Final Water Resources Management Plan 2014
applied to the Aquator model which was used to derive our baseline DO. The same period of
record was used in both our baseline and climate change assessments (1920 to 2010).
A3.2.3 Impact of Climate Change on our surface water sources
As discussed above, step 3 of our assessment involved producing flow factors for our five
catchment groupings. For each of our five exemplar HYSIM catchments, the HYSIM model
was run 100 times using the 100 Latin Hypercube Sampled UKCP09 climate projection data.
The flow outputs for each HYSIM model were then used to create sets of flow factors, showing
the percentage change from the baseline flow series for each month of the year. The 100
future projections were then “smart sampled” using the Drought Indicator to reduce the sample
set to 20 representations of future climate.
Under all 20 of our smart sampled climate change projections, significant changes in monthly
rainfall and temperature are seen to occur, both positive and negative. These changes in
climate will have a knock on effect to the flows in the water courses in our region. The annual
average change in flows for our five catchment groupings is shown in Table A3.13 below.
Monthly variations within these annual averages range from an increase in flows in some
catchments of 58% (compared to the current baseline flows), to a decrease in flows of 85%.
Table A3.13: Annual average change in flows as a percentage change from current baseline flows
Rank UKCP09
ID
Annual Change in flows (%)
Catchment
Group 1
Catchment
Group 2
Catchment
Group 3
Catchment
Group 4
Catchment
Group 5 1 8632 -25 -24 -50 -28 -22 2 9855 -22 -19 -44 -21 -21 3 3111 -21 -20 -46 -22 -21 4 6108 -16 -13 -34 -16 -12 5 1090 -6 -18 -43 -22 -18 6 2203 -20 -17 -38 -19 -18 7 1345 -22 -23 -46 -30 -16 8 8282 -14 -10 -34 -12 -12 9 6461 -15 -10 -31 -11 -13
10 684 -19 -20 -41 -24 -15 15 2726 -14 -13 -34 -17 -11 20 9701 -15 -12 -32 -12 -14 30 3521 -8 -4 -25 -6 -7 40 281 -11 -12 -32 -13 -9 50 3903 -10 -12 -25 -17 -6 60 2745 -3 0 -16 0 -1 70 3306 -8 -12 -22 -18 -4 80 9623 0 1 -5 2 1 90 1467 14 19 18 25 11 95 8764 6 5 7 5 7

Appendix A: How much water do we have available?
77 Severn Trent Water: Final Water Resources Management Plan 2014
Figure A3.13 shows the range of flow changes for the five catchment groupings for the 100
HYSIM runs which were carried out using the 100 UKCP09 climate projections. The boxes
show the quartile range and median with the whiskers extended to the 10th and 90th
percentile.
Figure A3.13: Range of flow changes for the five catchment groupings
Across all of the catchment groupings there is a general seasonal cycle of summer decreases
and small winter increases which reflects the overall pattern of rainfall changes from UKCP09.
However, there are a number of different responses to the changing climate between the five
catchment groupings which are important to note:
Catchment groupings 1 and 5 represent higher rainfall regions, catchment 1
being large intermediary catchments with higher rainfall and catchment 5 being
small, typically upland catchments with high rainfall and a flashy catchment
response. Both of these groups show a similar response to climate change, with
very large reductions in flows during the summer months (up to 83% in August
under some scenarios) and larger increases in flows in the winter (approximately
a 30% increase in December flows under some scenarios).

Appendix A: How much water do we have available?
78 Severn Trent Water: Final Water Resources Management Plan 2014
Catchment grouping 3 represents small catchments in lower rainfall areas. The
flow factors show more prolonged decreases across the summer months and
fewer increases in flows during the winter months.
Catchment grouping 2 which represents catchments with a higher Base Flow
Index, have a much smaller range of flow changes compared with the other
groupings. The largest flow reductions occur in September and October, which is
later in the year compared to the other groupings.
Group 4 represents the largest downstream catchments. The flow factors for this
grouping have more prolonged summer decreases but are smaller in magnitude
and than those seen in group 3. The maximum flow decreases occur later in the
year, in September and October, reflecting the delayed response due to the
larger catchment area.
Comparison with Future Flows and the UKWIR Rapid Assessment
Within our region only one catchment, Teme at Tenbury, has been included in the different
assessments carried out as part of the Future Flows project (Haxton et al, 2012) and the
previous industry standard UKWIR Rapid Assessment (UKWIR, 2009). The flow factors
produced using our methodology outlined above have therefore been compared as this is the
only catchment where comparable data is available.
As part of the Future Flows project, a daily flow series was created for the Teme at Tenbury
simulating the effects of climate change under the 11 scenarios discussed in section A3.4,
using a medium emissions scenario. We converted the flow series into monthly flow factors
for the 2030s time horizon to allow a comparison with the flow factors generated through our
own UKCP09 assessment of the 100 samples.
The Future Flows flow factors cover a similar range to the 100 LHS UKCP09 flow factors
displaying a similar seasonal cycle, with decreases in maximum flow in late summer into
autumn. The overall range of changes is similar, and although some variation exists there is
good corroboration between the two sets of data. It is important to note that the sets of flow
factors are created using different climate projections and hydrological models. Figure A3.14
shows the comparison between the 100 LHS UKCP09 flow factors, which are marked by the
box plots, and the 11 Future Flows derived flow factors, shown by the lines, for the Teme at
Tenbury in the 2030s.

Appendix A: How much water do we have available?
79 Severn Trent Water: Final Water Resources Management Plan 2014
Figure A3.14: Comparison of the 100 LHS UKCP09 flow factors (box plots) and 11
Future Flows derived flow factors (line plot) for the Teme at Tenbury in the 2030s
The UKWIR Rapid Assessment (UKWIR, 2009) aimed to provide a first look at the impacts of
the new UKCP09 climate projections for water supply planning. The project modelled 20
UKCP09 projections for 70 catchments, providing a set of percentiles covering the range of
each monthly flow change. As discussed above, we carried out some initial modelling using
method A1.2, which utilises the outputs of the UKWIR Rapid Assessment to help inform our
vulnerability assessment. The rapid assessment provided flow changes for the 2020s,
whereas our assessment is based around the 2030s as per the EA’s WRPG (2012).
The main difference in flow changes derived by the two different methods is that the flow
factors generated by the UKWIR rapid assessment display smaller decreases in flow between
August and October compared with the flow factors generated using the LHS UKCP09 data.
Between August and October the median LHS UKCP09 flow change is equivalent to the lower
quartile of the UKWIR rapid assessment flow changes. This difference is likely to be a result of
the larger impact of climate change in the 2030s compared with the 2020s. Figure A3.15
shows the comparison between the 100 LHS UKCP09 flow factors, which are marked by the
box plots, and the percentiles generated by the UKWIR Rapid Assessment, for the Teme at
Tenbury.

Appendix A: How much water do we have available?
80 Severn Trent Water: Final Water Resources Management Plan 2014
Figure A3.15: Comparison of the 100 LHS UKCP09 flow factors for the 2030s and the
percentiles from the UKWIR Rapid Assessment in the 2020s for the Teme at Tenbury
A3.2.4 Impact of Climate Change on our groundwater sources
Approximately 34% of our deployable output is abstracted from groundwater sources. Of our
operational groundwater sources, the majority (~88%) abstract from Sherwood Sandstone or
sandstone aquifers in the Midlands region, with a small percentage of sources taking water
from limestone and river gravels.
The sandstone aquifers have substantive storage; meaning they are generally not sensitive to
short term changes in climate. Unlike most chalk or limestone aquifers, the Midlands
sandstones generally show only small annual responses in water level due to extreme wet or
dry conditions and are generally considered to be resilient to drought conditions. In severe
drought it takes several years for water levels to fall in the sandstone aquifers. During the
2008 – early 2012 period, recharge to the Midlands aquifers was significantly depleted by low
average rainfall over this period, and some of the lowest ever groundwater levels were
recorded across the region. Despite this, at our sources, groundwater level decline during this
period was only of the order of <5m. In summary, this means that the impact of climate
change is likely to be limited on our sandstone resources in comparison to other aquifer units
across the UK.
Possible impacts on our limestone and river gravel sources are likely to be more significant as
these aquifers generally have less storage and are potentially more susceptible to changes in
climate.
The process for calculating the change in Deployable Output (DO) for groundwater sources
due to climate change has been calculated by taking the updated UKCP09 projections and
assessing the impacts according the GR2 methodology as originally described in the
UKWIR2006 guidance. This involved:

Appendix A: How much water do we have available?
81 Severn Trent Water: Final Water Resources Management Plan 2014
1. assessing the sensitivity of pumped sources to water level changes resulting
from any changes in recharge;
2. for all zones, use of representative synthesized hydrographs (calibrated to
observed data) at sources to determine the change in recharge to the aquifer
under the various UCKP09 projections, and using the GR2 methodology to
determine the modelled range of water level change for each site;
3. converting the modelled water level change into a range of DO changes using
the Source Performance Diagrams;
4. the assessment of likely changes in summer flows at our spring sources as a
result of changes in recharge in these catchments.
In addition to the above work, we had planned to use the EA’s groundwater models to assess
groundwater response to climate change driven changes to recharge in our region, under
Options 2 and 3 of the vulnerability assessment. This analysis could determine the likely scale
of any future licence reductions needed to mitigate effects on the environment and to prevent
mining of groundwater where sources were currently licence constrained.
We explored this potential approach with the EA and it was confirmed on 10th October 2012
that it would not be appropriate for us to make assumptions about climate change driven
abstraction licence changes in the WRMP. As such, the risks around climate change driven
potential licence changes is not included in our WRMP. The impacts of climate change on our
groundwater sources are therefore limited to those sources vulnerable to short term changes
in water levels or flow.
Initial Screening
For our groundwater sources, an initial review of individual groundwater source sensitivity to
groundwater level change was conducted as a preliminary screening exercise to the overall
vulnerability assessment. This screening assessment utilised the source specific Source
Performance Diagrams, as illustrated in Figure A3.16, to determine what the current constraint
to abstraction was at the source. This can be broken down into five main constituents:
1. Licence constrained – the source can abstract up to licence
2. Infrastructure constrained – the source is constrained by infrastructure (usually
pump capacity, which is set slightly below the licence in order to prevent breach
of licence)
3. Level constrained – the source is constrained by a specific level in the borehole
below which groundwater levels should not be taken in order to preserve
pumping equipment (pump depth), water quality (adits or Deepest Advisable

Appendix A: How much water do we have available?
82 Severn Trent Water: Final Water Resources Management Plan 2014
Pumped Water Level (DAPWL)), aquifer resource (DAPWL), borehole integrity
(borehole casing, DAPWL, adits) etc. These are site specific and may vary
source to source
4. Flow constrained – the source is constrained by gravity fed flows into the site.
This is applicable to spring sources
5. Water Quality constrained – the source may not be able to abstract above a
certain rate in order to preserve water quality
This review highlighted the following number of sources falling into each constraint category as
shown in table A3.14.
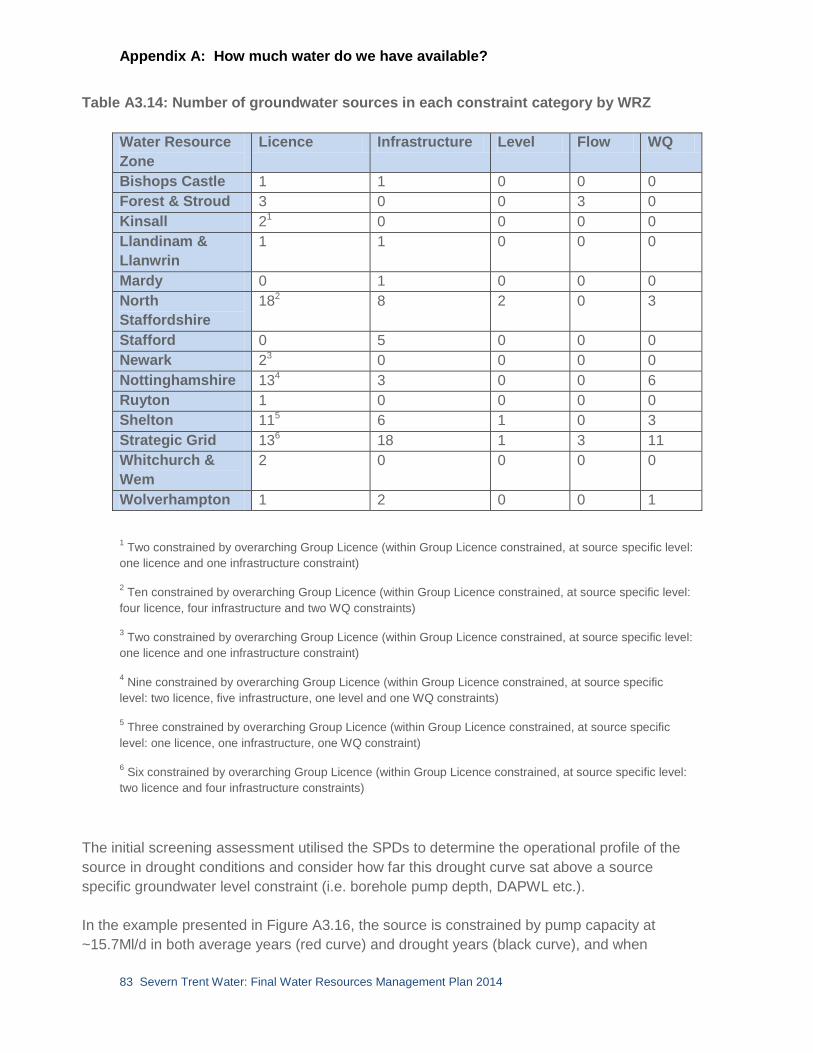
Appendix A: How much water do we have available?
83 Severn Trent Water: Final Water Resources Management Plan 2014
Table A3.14: Number of groundwater sources in each constraint category by WRZ
Water Resource
Zone
Licence Infrastructure Level Flow WQ
Bishops Castle 1 1 0 0 0
Forest & Stroud 3 0 0 3 0
Kinsall 21 0 0 0 0
Llandinam &
Llanwrin
1 1 0 0 0
Mardy 0 1 0 0 0
North
Staffordshire
182 8 2 0 3
Stafford 0 5 0 0 0
Newark 23 0 0 0 0
Nottinghamshire 134 3 0 0 6
Ruyton 1 0 0 0 0
Shelton 115 6 1 0 3
Strategic Grid 136 18 1 3 11
Whitchurch &
Wem
2 0 0 0 0
Wolverhampton 1 2 0 0 1
1 Two constrained by overarching Group Licence (within Group Licence constrained, at source specific level:
one licence and one infrastructure constraint)
2 Ten constrained by overarching Group Licence (within Group Licence constrained, at source specific level:
four licence, four infrastructure and two WQ constraints)
3 Two constrained by overarching Group Licence (within Group Licence constrained, at source specific level:
one licence and one infrastructure constraint)
4 Nine constrained by overarching Group Licence (within Group Licence constrained, at source specific
level: two licence, five infrastructure, one level and one WQ constraints)
5 Three constrained by overarching Group Licence (within Group Licence constrained, at source specific
level: one licence, one infrastructure, one WQ constraint)
6 Six constrained by overarching Group Licence (within Group Licence constrained, at source specific level:
two licence and four infrastructure constraints)
The initial screening assessment utilised the SPDs to determine the operational profile of the
source in drought conditions and consider how far this drought curve sat above a source
specific groundwater level constraint (i.e. borehole pump depth, DAPWL etc.).
In the example presented in Figure A3.16, the source is constrained by pump capacity at
~15.7Ml/d in both average years (red curve) and drought years (black curve), and when

Appendix A: How much water do we have available?
84 Severn Trent Water: Final Water Resources Management Plan 2014
operating at this constraint in drought conditions, there is approximately 12m of groundwater
level “headroom” before water levels would start to be constrained by a level constraint (in this
instance DAPWL), rather than the pump capacity.
From the initial screening assessment, it was considered that sources that are currently level
constrained in drought conditions and sources that are constrained by gravity fed flows (spring
sources) should be taken forward for climate change assessment. Twelve sources were
initially highlighted and these sources were considered to be vulnerable to climate change
(some of these sources were later found to be constrained by Water Quality (WQ) constraints,
so are not shown under the Flow column in Table A3.14).
Furthermore, it was considered that sources that had less than 5m of groundwater level
“headroom” between the intersect of the drought performance curve and an infrastructure
constraint, and a level constraint, should be taken forward for Climate Change assessment as
these were considered to be potentially vulnerable to climate change. Twelve sources were
initially highlighted.
Sources that had greater than 5m of groundwater level “headroom”, or were currently licence
or water quality constrained were considered to be at low vulnerability to climate change and
were not assessed.
In addition to the initial screening, a series of interviews were conducted with STWL
Operational staff which indicated an additional 11 sources which may be potentially sensitive
to dry weather conditions. These sources were considered as potentially vulnerable to climate
change and were taken forward for climate change assessment; even though assessment of
the SPDs suggested that they were likely to have low vulnerability to climate change. The
inclusion of these additional assessments is considered to be conservative.

Appendix A: How much water do we have available?
85 Severn Trent Water: Final Water Resources Management Plan 2014
Figure A3.16: Source Performance Diagram and example initial source vulnerability
screening. Note there is 12m of water level “headroom” in drought conditions, before
the constraint on the source would change from an infrastructure constraint (pump
capacity) to a level constraint (DAPWL). In this instance the initial screening is low
vulnerability to climate change.
Drought performance curve
Average year
performance curve
Deepest Advisable
Pumped Water Level
Infrastructure Constraint at
15.7Ml/d in Average & Drought
Years (Pump Capacity)
Height of water above
level constraint = 12m
Pump capacity

Appendix A: How much water do we have available?
86 Severn Trent Water: Final Water Resources Management Plan 2014
Head Dependent Changes in DO (Pumped Sources)
The majority of our groundwater abstractions are from deep boreholes in the Sherwood
Sandstone. As there is significant storage in this aquifer, water level changes due to recharge
variation are usually buffered and can take several years or decades to have any significant
effect. In addition, due to the depth of many of our boreholes, there would usually be space to
lower the pumps in the borehole and maintain the same output if regional water levels dropped
significantly.
However, for certain sources, a change in recharge could produce a significant borehole water
level change within the planning horizon (i.e. the next 25 years), where:
1. the aquifer has low storage (e.g. fissured limestone) and responds rapidly to
recharge;
2. the pumping water level is already close to the base of the borehole;
3. there is some inflow feature particular to that source that would cause a rapid
loss of yield if water levels dropped beyond a certain level (e.g. an adit or a
fissure zone); or
4. the source is an aquifer of very limited vertical or horizontal extent with limited
capacity to buffer recharge variation
The screening exercise identified approximately 27 sources that might fall into one or more of
the above categories. These were then considered in detail using the UKWIR06 methodology
to predict the likely change in water level and thus DO for each of the UKCP09 scenarios. Of
the 27 sources, only eight were determined to have climate change impacts after detailed
assessment. These are shown in Table A3.15 below.

Appendix A: How much water do we have available?
87 Severn Trent Water: Final Water Resources Management Plan 2014
Table A3.15: Head dependant groundwater source impact
WRZ Source Range of Changes in DO (Ml/d)
using 20 smart sampled UKCP09
scenarios
Min Max
North
Staffordshire
Draycott Cross -0.9 1.0
Mossgate -0.1 0.2
Nottinghamshire Clipstone Forest -1.0 1.0
Shelton Much Wenlock -0.7 1.0
Strategic Grid Lillington -0.5 0.8
Meriden Shafts -0.61 0.67
Campion Well1 1.6 3.0
Ladyflatte1 2.0 3.7 1 For the Campion well and Ladyflatte sources, the estimates were made on the basis of changes in annual recharge.
This is because of the nature of the sources it is not appropriate to apply a conventional GR2 assessment.
The results indicate that none of our groundwater only zones are predicted to have head
(level) dependant deployable output impacts resulting from the modelled climate change
scenarios. The predicted impacts on groundwater sources in conjunctive use zones, as
presented above, were then input into our Aquator model.
Head-Dependent Changes in DO (Gravity-Fed Sources)
We have ten abstraction sources fed by springs or drainage tunnels. As these are gravity-fed
and in fracture-flow aquifers, they are likely be more sensitive to groundwater level changes
than our other sources. The effects on the Homesford source have been considered as part of
the surface water climate change assessment.
Changes to flows in these sources were predicted using the UKWIR06 methodology. This
applies the selected climate change projections to actual or synthesized flows from the
sources, and the outputs are reported for the average yearly minima and the drought year
minima (based on lowest observed year recharge data). Any special conditions at those sites
that constrain reported DO (eg. minimum observed flow, licence condition or infrastructure
constraint), are noted. Of the ten gravity fed spring sources, six were determined to have
climate change impacts after detailed assessment. These are shown in Table A3.16, below.

Appendix A: How much water do we have available?
88 Severn Trent Water: Final Water Resources Management Plan 2014
Table A3.16: Head dependant gravity-fed spring source impact
WRZ Source Range of Changes in DO (Ml/d)
using 20 smart sampled UKCP09
scenarios
Min Max
Forest & Stroud Bigwell - 0.1 0.22
Chalford -1.3 1.2
Lydbrook -0.18 0.36
Strategic Grid Coombe -0.1 0.08
Millend -0.18 0.12
Homesford1 Perturbed flow series provided for
assessment within Aquator 1 Assessed as part of the surface water climate change assessment
Gravity fed springs sources at Pinnock and Postlip were assessed as not impacted by climate
change (WQ constraints), and Charlton Abbots spring was assessed as not impacted by
climate change (disused).
The results indicate that none of our groundwater only zones are predicted to have head
(gravity fed) dependant deployable output impacts resulting from the modelled climate change
scenarios. The predicted impacts on spring sources in conjunctive use zones, as presented
above, were then input into our Aquator model.
A3.2.5 Modelling the impact of Climate Change on Deployable Output
As previously discussed, we have modelled the impact of climate change on our surface water
and groundwater sources in our Aquator model. By adopting method B2.2 we were able to
reduce the 100 UKCP09 projections selected using Latin Hypercube Sampling for method
B2.1, based on a flow indicator to a targeted sample of 20. This targeted sample included 10
projections towards the “dry” end of the projection range and 10 projections which were
equally spaced across the remaining range.
Each of the targeted samples was given a “weighting” to estimate the probability of this
projection occurring. The weight describes the relative probability of each projection in the
sub-sample of 20 with respect to the original 100. Including 10 samples towards the “dry” end
of the projection range means we could be including some “outliers” in our assessment, i.e.
extreme changes in climate which have a low probability of occurring. By applying the
weighting we were able to assign a low probability to these outcomes, but are still able to
consider the full range of potential impacts in our overall assessment.
The current guidance on how to apply the climate change methodologies does not include any
recommendations for how water companies should derive a suitable “central estimate” for use
in the Supply-Demand Balance calculations. Nor is there any best practice guidance on how to
Appendix A: How much water do we have available?
89 Severn Trent Water: Final Water Resources Management Plan 2014
appropriately deal with the wide range of uncertainties presented by the multiple scenarios.
We have therefore tested the impacts of adopting different “central estimates” of future climate
change impacted supplies, along with different approaches to capturing the range of
uncertainty around this estimate.
One option is to derive a “weighted average” impact on deployable output from the full range
of scenarios. This uses a statistical calculation taking into account the weightings assigned to
each scenario and the change the scenario causes to deployable output. Alternatively we
could choose to use the outputs of a particular high-weighted scenario, such as the rank 50
which is also the median of the 100 Latin Hypercube Sample.
There are mathematical reasons for adopting a weighted average approach, because it
includes the full range of scenarios, including all drier scenarios and any potential “outliers”.
However, by applying a weighted average approach we would be unable to relate the
implications back to any one UKCP09 climate change scenario or modelled hydrological
dataset. Instead, by averaging the implications of a number of very different UKCP09
scenarios across the hydrological data, it will produce a scenario that is not actually generated
by UKCP09, meaning we would not be able attach a weighting or probability to this artificial
scenario. Therefore to maintain transparency in our impact assessments, we prefer to base
our modelling on the outputs from the specific UKCP09 climate change scenarios, each of
which have probability weightings attached to them.
Our preference is to use the values from the median model output (rank 50) scenario from the
Latin Hypercube Sample as our central estimate of climate change impacts. We believe this
better represents a physically plausible hydrological scenario and is more representative of
what could happen to our region. We have then assessed the range of uncertainty around this
central estimate, for use in our headroom model.
The full range of the impact of the climate change scenarios on our deployable output are
shown in Figure A3.17 to Figure A3.21. As our vulnerability assessment indicated, the
greatest impacts of climate change are seen in the Strategic Grid and Nottinghamshire water
resource zones.
Both the Strategic Grid and Nottinghamshire zones are most affected by the impacts the
changing climate will have on our surface water sources – the Strategic Grid is affected
directly by reduced river flows and reservoir refill, which in turn reduces the availability of water
in the Strategic Grid zone to export to the Nottinghamshire zone. Our source assessment has
shown that few of our groundwater sources are vulnerable to potential future changes in
climate and where groundwater sources are vulnerable the resultant change in source yield is
likely to be relatively small. The groundwater sources in the Nottinghamshire zone are largely
resilient to climate change.
Following the publication of our draft WRMP we made some improvements to our groundwater
source assessments, which we then incorporated into our baseline deployable output
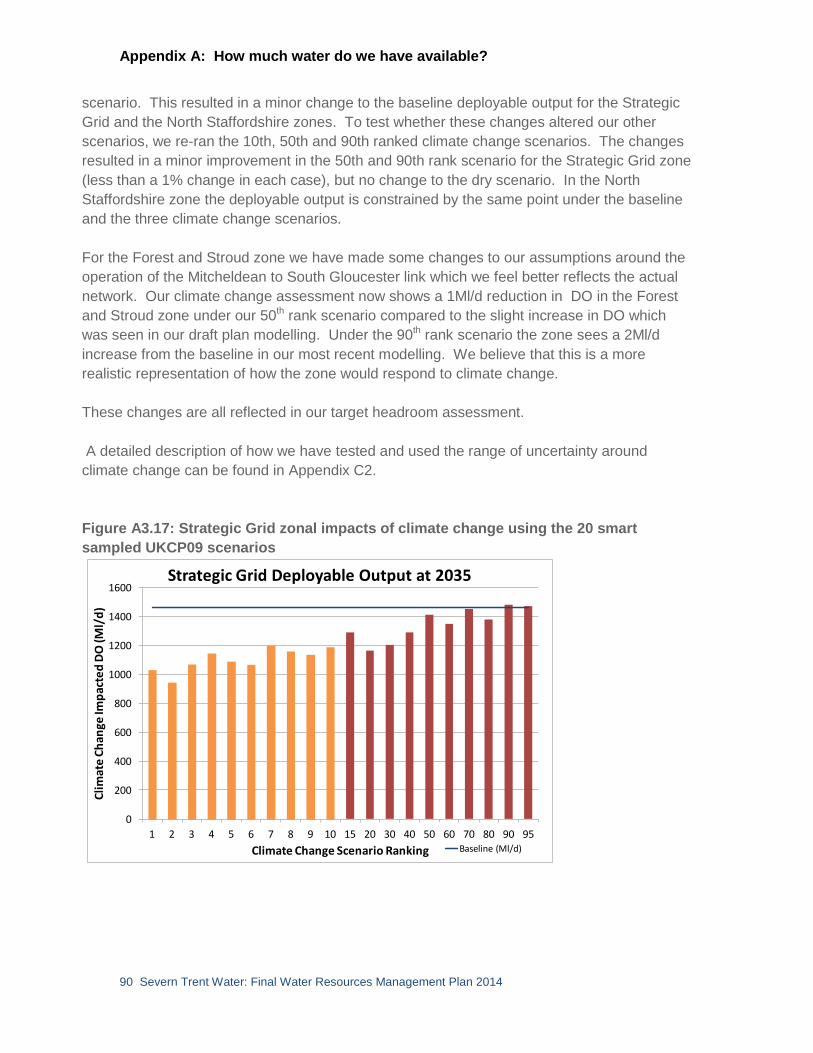
Appendix A: How much water do we have available?
90 Severn Trent Water: Final Water Resources Management Plan 2014
scenario. This resulted in a minor change to the baseline deployable output for the Strategic
Grid and the North Staffordshire zones. To test whether these changes altered our other
scenarios, we re-ran the 10th, 50th and 90th ranked climate change scenarios. The changes
resulted in a minor improvement in the 50th and 90th rank scenario for the Strategic Grid zone
(less than a 1% change in each case), but no change to the dry scenario. In the North
Staffordshire zone the deployable output is constrained by the same point under the baseline
and the three climate change scenarios.
For the Forest and Stroud zone we have made some changes to our assumptions around the
operation of the Mitcheldean to South Gloucester link which we feel better reflects the actual
network. Our climate change assessment now shows a 1Ml/d reduction in DO in the Forest
and Stroud zone under our 50th rank scenario compared to the slight increase in DO which
was seen in our draft plan modelling. Under the 90th rank scenario the zone sees a 2Ml/d
increase from the baseline in our most recent modelling. We believe that this is a more
realistic representation of how the zone would respond to climate change.
These changes are all reflected in our target headroom assessment.
A detailed description of how we have tested and used the range of uncertainty around
climate change can be found in Appendix C2.
Figure A3.17: Strategic Grid zonal impacts of climate change using the 20 smart
sampled UKCP09 scenarios
0
200
400
600
800
1000
1200
1400
1600
1 2 3 4 5 6 7 8 9 10 15 20 30 40 50 60 70 80 90 95
Cli
mat
e C
han
ge Im
pac
ted
DO
(Ml/
d)
Climate Change Scenario Ranking
Strategic Grid Deployable Output at 2035
Baseline (Ml/d)

Appendix A: How much water do we have available?
91 Severn Trent Water: Final Water Resources Management Plan 2014
Figure A3.18: Nottinghamshire zonal impacts of climate change using the 20 smart sampled UKCP09 scenarios
0
50
100
150
200
250
300
350
1 2 3 4 5 6 7 8 9 10 15 20 30 40 50 60 70 80 90 95
Cli
mat
e C
han
ge Im
pac
ted
DO
(Ml/
d)
Climate Change Scenario Ranking
Nottinghamshire Deployable Output at 2035
Baseline Deployable Output (Ml/d)
Figure A3.19: North Staffordshire zonal impacts of climate change using the 20 smart
sampled UKCP09 scenarios
0
20
40
60
80
100
120
140
160
180
200
1 2 3 4 5 6 7 8 9 10 15 20 30 40 50 60 70 80 90 95
Cli
mat
e C
han
ge Im
pac
ted
DO
(Ml/
d)
Climate Change Scenario Ranking
North Staffs Deployable Output at 2035
Baseline Deployable Output (Ml/d)

Appendix A: How much water do we have available?
92 Severn Trent Water: Final Water Resources Management Plan 2014
Figure A3.20: Forest and Stroud zonal impacts of climate change using the 20 smart
sampled UKCP09 scenarios
0
10
20
30
40
50
60
70
1 2 3 4 5 6 7 8 9 10 15 20 30 40 50 60 70 80 90 95
Cli
mat
e C
han
ge Im
pac
ted
DO
(Ml/
d)
Climate Change Scenario Ranking
Forest and Stroud Deployable Output at 2035
Baseline Deployable Output (M/d)
Figure A3.21: Shelton zonal impacts of climate change using the 20 smart sampled
UKCP09 scenarios
0
20
40
60
80
100
120
140
160
180
200
1 2 3 4 5 6 7 8 9 10 15 20 30 40 50 60 70 80 90 95
Cli
mat
e C
han
ge Im
pac
ted
DO
(Ml/
d)
Climate Change Scenario Ranking
Shelton Deployable Output at 2035
Baseline Deployable Output (Ml/d)

Appendix A: How much water do we have available?
93 Severn Trent Water: Final Water Resources Management Plan 2014
3.3 Combined impacts of climate change and Sustainability Reductions
Our initial modelling looked separately at the impacts of climate change and the “confirmed”
and “likely” changes to our licences as part of the Sustainability Reductions. Following on
from our initial modelling work, we have carried out significant sensitivity testing. This work
included modelling the combined impacts of the climate change impacted system with the
licence changes flagged up by the Environment Agency as “confirmed” and “likely” changes to
our abstraction licences which will come into force in 2020.
To ensure consistency with the baseline modelling, the climate change (rank 50 scenario) and
sustainability changes were applied together to the baseline Aquator model. The same period
of record was used in both our baseline and combined impact assessments (1920 to 2010).
In our draft plan modelling for the Strategic Grid zone, when the sustainability reductions were
modelled with the climate change perturbed inflow series and groundwater yield constraints in
the combined run the affects of the sustainability changes were amplified. This was because
the raw water resource availability is reduced under the climate change scenario. The impact
of the River Wye Habitats Directive changes to the operation of Elan Valley was further
compounded by the reduced flows in the River Wye under the climate change scenario, which
trigger increased releases from the Elan Valley reservoirs.
In our modelling for the final plan, following our work with Natural Resources Wales to
minimise the impact of the Wye ROC, the effect of combining the sustainability reductions with
the climate change modelling is a slightly reduced overall impact.
As mentioned in section A3.1 the Nottinghamshire zone is not directly affected by any
sustainability changes. All of our licences in the Nottinghamshire area which the EA are
intending to revoke are for sources which are currently disused and not included in our
baseline deployable output modelling. The impact of climate change in the Nottinghamshire
zone is mainly due to the reduced surface water import available from the Strategic Grid zone.
As noted above the combined impact is greatest in the west of the Strategic Grid zone, where
the changing operation of the Elan Valley system due to the Wye ROC is affected by the
reduced raw water availability under the climate change scenario. There is however spare
resource available in the north east of the grid which can be transferred to the Nottinghamshire
zone via the linkages between the two zones. This reduces the overall impact of climate
change on the Nottinghamshire zonal DO under the combined model run.
The Environment Agency’s Wye ROC licence changes are based on historic and current
baseline flow data. The Environment Agency’s Wye ROC modelling did not investigate the
potential impacts of climate change on the River Wye catchment and how the changing
climate would affect the way the reservoir would need to be operated in the future to improve
river levels.

Appendix A: How much water do we have available?
94 Severn Trent Water: Final Water Resources Management Plan 2014
The impact of the Wye ROC licence change at Mitcheldean when modelled on its own and
combined with climate change, shows little impact on the DO of the Forest and Stroud zone.
However when the climate change perturbed inflow series is modelled on its own there is a
slight impact.
For all of our zones which are affected by both climate change and sustainability changes
apart from the Forest and Stroud zone, we have chosen to use the combined impact model
outputs in our baseline supply demand balance assessment. For the Forest and Stroud zone
we have used the individual modelled outputs, so as to take account of the slight reduction
due to climate change.
The breakdown of these reductions is shown in Table WRP1BL Supply of water resource
planning tables.
Figure A3.22 and Table A3.17 show the variation in the DO projection for the Strategic Grid
zone dependent on how we model the DO reductions.
Figure A3.22: Modelled impacts of climate change and RSA reductions on deployable outputs in the Strategic Grid zone
1200
1250
1300
1350
1400
1450
1500
DO
(Ml/
d)
Deployable Output (baseline profile without reductions)
DO forecast changes joint RSA and Climate Change Modelling
DO forecast changes
Separate RSA and Climate Change Modelling

Appendix A: How much water do we have available?
95 Severn Trent Water: Final Water Resources Management Plan 2014
Table A3.17: Breakdown of impacts of Climate Change and RSA reductions from baseline deployable output - Strategic Grid zone
Climate
Change
Impact (Ml/d)
RSA/Wye
HD Impact
(Ml/d)
Combined
Impact
(Ml/d)
Forecast changes in DO: combined
RSA / rank 50 climate change
modelling
-52* -45* -97
Forecast changes in DO: separate RSA
and rank 50 climate change modelling -52 -47 -99
*assumed split
Figure A3.23 and Table A3.18 show the variation in the DO projection for the Nottinghamshire
zone dependent on how we model the DO reductions.
Figure A3.23: Modelled impacts of climate change and RSA reductions on deployable output in the Nottinghamshire zone
0
50
100
150
200
250
300
DO
(Ml/
d)
Deployable Output (baseline profile without reductions)
DO forecast changes joint RSA and Climate Change
Modelling
DO forecast changes Separate RSA and Climate
Change Modelling

Appendix A: How much water do we have available?
96 Severn Trent Water: Final Water Resources Management Plan 2014
Table A3.18: Breakdown of impacts of Climate Change and RSA reductions from baseline deployable output - Nottinghamshire zone
Climate
Change
Impact (Ml/d)
RSA Impact
(Ml/d)
Combined
Impact
(Ml/d)
Forecast changes in DO: combined
RSA / rank 50 climate change
modelling
-30 * 0 * -30
Forecast changes in DO: separate RSA
and rank 50 climate change modelling -45 0 -45
*assumed split
Figure A3.24 and Table A3.19 show the variation in the DO projection for the Forest and
Stroud zone dependent on how we model the DO reductions.
Figure A3.24: Modelled impacts of climate change and RSA reductions on deployable output in the Forest and Stroud zone
0
5
10
15
20
25
30
35
40
45
50
DO
(Ml/
d)
Deployable Output (baseline profile without reductions)
DO forecast changes joint RSA and Climate Change Modelling
DO forecast changes Separate RSA and Climate Change
Modelling
Table A3.19: Breakdown of impacts of Climate Change and RSA reductions from baseline deployable output – Forest and Stroud zone

Appendix A: How much water do we have available?
97 Severn Trent Water: Final Water Resources Management Plan 2014
Climate
Change
Impact
(Ml/d)
RSA
Impact
(Ml/d)
Combined
Impact
(Ml/d)
Forecast changes in DO: combined RSA
/ rank 50 climate change modelling 0* 0* 0
Forecast changes in DO: separate RSA
and rank 50 climate change modelling -1 0 -1
*assumed split
A3.4 Scaling the impacts of climate change from the base year to 2040
As already discussed, the climate change modelling provides us with estimates of changes in
deployable output at 2035. In order to estimate the impact of climate change for each year of
the planning period from 2013 up to 2040, we scale the DO change using two sets of
equations. These equations enable us to interpolate and extrapolate the 2035 DO estimates
to produce a smooth times series which we can then include in our supply demand balance
calculations.
For the zones which are affected by both climate change and sustainability reductions we
have scaled the climate change impacts, using the climate change portion of the combined
model run.
The scaling equations are described in the EA’s Water Resources Planning Guidelines (2012).
We have applied these equations to our central estimate for each water resource zone.
Equation 1 is used to extrapolate from 2030/31 onwards. In the equation “Year” is the year of
interest.
Scale factor = Year – 1975
2035 – 1975 (Equation 1)
Equation 2 is used to avoid a step change in 2012/13 between baseline deployable output
and the underlying trend. It interpolates linearly between 2013/14 and 2029/30 (inclusive).
Scale factor = Year – 2012
2031 – 2012 (Equation 2)

Appendix A: How much water do we have available?
98 Severn Trent Water: Final Water Resources Management Plan 2014
References
UKWIR, 1995. A Methodology for the Determination of Outputs of Groundwater Sources. UKWIR
Technical Report 95/WR/01/2.
UKWIR, 2000. A Unified Methodology for the Determination of Deployable Output from Water
Sources. UKWIR Technical Report 00/WR/18/2.
UKWIR, 2012. Water Resource Planning Tools 2012. UKWIR WR27 Technical Report 12/WR/27/6.

Appendix A: How much water do we have available?
99 Severn Trent Water: Final Water Resources Management Plan 2014
A4 Outage
Our water supply planning projections include an assessment of the likelihood of source outages
occurring in our system. An outage is defined as a temporary loss of deployable output that lasts
typically for less than 3 months and “includes observed events and perceived risks, resulting in
either partially reduced output of a source or complete closure” (Environment Agency Water
Resource Planning Guidelines, 2012). Outages include events which affect the “water available for
use”, by restricting our ability to supply our customers and also events which do not affect the
“water available for use” but pose a potential risk to supply and can last for longer than 3 months.
However, careful consideration needs to be given to events lasting longer than 3 months.
In 2007 we implemented a new company reporting system for recording planned and unplanned
outages occurring at our major surface water treatment works. Once this recording process was
fully established as business as usual at our surface water treatment works, we increased coverage
to capture outage events at our groundwater sources. We have used this database to inform our
latest assessment of future outage risk. The database records the following information:
which source(s) is affected;
what is the cause of the outage (quality issue, process maintenance etc);
whether the outage was planned or unplanned;
whether the source was fully offline or partially restricted;
the duration of the event;
how much of the capacity of the source could not be deployed as a result of the outage.
As our recording of outages has improved significantly since WRMP09, we have used the recorded
data in our assessment where available. We now have approximately 5 years of historic outage
data for our surface water sources and approximately 3 years of data for our groundwater sources.
Due to the shorter length of our groundwater outage records, not all of our groundwater sources
have experienced issues during this time so we have had to make some assumptions around
potential outage issues in these cases (this will be discussed in more detail in section A4.3).
As with our WRMP09 assessment of outage, we have not included any “extreme” events in the
outage assessment. These are rare, unpredictable events which cannot reasonably be foreseen but
when they occur would result in a major disruption to supplies, such as the failure of one of our
aqueducts. The nature of these kinds of extreme events means that they are outside of our normal
day to day water resources management. These “extreme” events are dealt with separately as part
of our emergency planning and supply resilience investment programme.
In line with our outage assessment for WRMP09, we have considered both planned and unplanned
events in our analysis.
In accordance with the EA’s Water Resource Planning Guidelines (2012) we have considered our
outage allowance outside of our target headroom assessment. This is discussed in more detail in
Appendix C2.1.

Appendix A: How much water do we have available?
100
Severn Trent Water: Final Water Resources Management Plan 2014
A4.1 Our modelling approach
We have used a risk based approach which follows the best practice principles set out in the
UKWIR report Outage Allowances for water resources planning (UKWIR, 1995). This method uses
Monte-Carlo analysis to assess the “allowable” outage (the probability distribution of the combined
risks of the legitimate planned and unplanned outages occurring), with the output of the analysis
enabling us to adopt a suitable level of risk.
As with our other Water Resource Planning models we have reconfigured our outage allowance
modelling tools to represent our 15 new water resource zones. As part of this reconfiguration work,
we have improved our outage model to allow us to use a “bottom up” approach which utilises the
operational outage data and information collated in our database for individual sources in each
water resource zone. This is an improvement over our previous modelling for WRMP09, which
adopted a “top down” approach, using more generic assumptions of outage risk based on the type
of source. We believe the reconfigured model and the use of site specific outage records results in
a more appropriate assessment of future outage risk. Our new outage allowance models use the
data from our specially developed “Event Tracker” tool, which takes the data directly from our
surface water treatment works and groundwater source outage databases. The outage allowance
model uses triangular distributions for assessing the magnitude and duration of outage risks and a
Poisson distribution for event frequency. The Event Tracker interrogates our outage databases to
extract the outage events and consolidate the information into suitable distributions which are
required to perform the Monte Carlo simulations in the outage allowance model.
Our new outage allowance models have been developed with a user interface which enables a
thorough audit trail to be maintained. The user interface captures key pieces of information,
including a full set of input data and output data for the model run.
Due to the interconnectivity of our supply network, outages at the majority of our sources do not
impact on our ability to supply our customers. In most cases other sources in our network are able
to increase output to make up any potential shortfall caused by the partial restriction or full
shutdown of other sources on our “grid”. For operational purposes the daily records of outages at
our surface water sources record how much of the maximum sustainable treatment capacity is
available (and unavailable) due to planned and unplanned restrictions and shutdowns. The outage
allowance model has an additional function built in, which allows us to assess the impact of the
outage in two ways:
1) The outage is included in the model as a proportion of the full source deployable output.
2) The outage event is only recognised by the model if the severity of the event exceeds the buffer
between the source deployable output and the maximum capacity of the source. Furthermore,
when an outage event does exceed this buffer, its calculated magnitude takes this buffer into
account. As a result, outage severity for a source is reduced when calculated against capacity
(unless DO is equal to maximum capacity, in which case it will be equal).
In our modelling for this dWRMP we have used the second option. In most cases, the deployable
output of our sources is constrained by a factor other than the maximum treatment capacity of the
treatment works, such as licence or infrastructure. Applying the outage impact to the full source

Appendix A: How much water do we have available?
101
Severn Trent Water: Final Water Resources Management Plan 2014
deployable output in the modelling would result in a higher Outage Allowance. Adopting the second
option enable us to assess the impact the outage events would have on our dry year deployable
output.
The following is a summary of the approach used to select which issues are to be included in the
outage assessment:
If an actual event has been identified by Event Tracker then it has been included in the outage assessment;
Due to the shorter length of the event records for groundwater, some generic issues have been included such as local and widespread power loss, pump failures, and planned maintenance.
A4.2 Planned outages
We have an ongoing programme of planned maintenance and capital enhancement activities at our
water production sites in order to maintain the long run serviceability of our assets. To minimise the
loss of output from maintenance activities we schedule work to be carried out in a way that limits
risks to customers’ supplies. As previously discussed, since 2007 we have maintained a database
to record all planned and unplanned outages at our sources. We also have a record of actual
planned outages going back to 2005. Our database records the cause, the duration and the impact
of the planned outage events. The records for recent years have been examined and the loss of
output in each month has been identified.
Analysis of the records from our surface water treatment works indicates that output restrictions are
often due to the prolonged partial or complete closure of a works for a major refurbishment.
Planned maintenance is avoided at peak demand periods and this is reflected in very low numbers
of planned outages between June and August. Outages due to repair and maintenance activities
will only affect average deployable outputs and are not expected to influence our ability to supply
our customers during peak demand periods. Furthermore, where possible, planned maintenance is
planned in so that works may be brought back into production at short notice if required.
For our groundwater sources, our records of the outage impacts of planned maintenance of our
boreholes are comparatively short. We have used actual data wherever it is available. Most of our
water resource zone assessments include an element of planned outage due to process
maintenance and capital improvement.
A4.3 Unplanned outages
The Environment Agency’s WRPG (2012) defines an unplanned outage as being “an unforeseen or
unavoidable outage event affecting any part of the sourceworks and which occurs regularly enough
that the probability of occurrence and severity of effect may be predicted from previous events or
perceived risks”. Their definitive list of unplanned events is:

Appendix A: How much water do we have available?
102
Severn Trent Water: Final Water Resources Management Plan 2014
pollution of source
turbidity
algae
power failure
system failure
Surface Water Sources
The risk of unplanned outages has been assessed by examining the operational records in our
outage database of the unplanned events that actually caused loss of output from our water
treatment works. A summary of the key types of issues included in the assessment of unplanned
outage events is given below:
Burst / Leak on the site (leading to a system failure)
Electrical issues on site (leading to a system failure or caused by power failure)
Mechanical issues on site (leading to a system failure)
Pump / Valve issues on site (leading to a system failure
Quality issues (including pollution of source, turbidity problems, algae issues)
Groundwater sources
The main unplanned outage issues for groundwater sources are pump failures and power failures.
There are also issues of flooding at some sources and occasional periodic quality problems,
principally turbidity after heavy rain. Where unplanned outages have occurred and have been
recorded on our groundwater outage database, we have used actual recorded data to inform the
outage assessment. The types of issues included in the assessment are summarised below:
Burst / Leak on the site (leading to a system failure)
Electrical issues on site (leading to a system failure or caused by power failure)
Flooding on site (leading to a system failure)
Mechanical issues on site (leading to a system failure)
Pump / Valve issues on site (leading to a system failure
Quality issues (including pollution of source, turbidity problems)
Although our detailed site outage record for groundwater sources extends back to 2009, several of
our sources have not been affected by outage events during this time. Therefore for groundwater
sources we have included allowances for some key generic risks. These risks are:
Pump failures: a frequency of 0.4 events per source per year; and a duration average of three
days, between a minimum and maximum of one and five days respectively.
Local power loss: a frequency of 1.2 events per source per year; and a duration average of eight
hours, between a minimum and maximum of 0.1 and 24 hours respectively.
Widespread power loss: a frequency of three events per year; and a duration average of eight
hours, between a minimum and maximum of 0.1 and 24 hours respectively.

Appendix A: How much water do we have available?
103
Severn Trent Water: Final Water Resources Management Plan 2014
A4.4 Annual average outage allowances to 2040
The output from the probabilistic analysis of outage risks we have undertaken is summarised in
Table 1. The table shows the likelihood of different outage quantities occurring in the year. For
example, in the Forest and Stroud zone our assessment shows that there is a 60% chance that in
any given year, up to 1.12 Ml/d will be lost due to outage, and a 90% chance that up to 5.55 Ml/d
will be lost due to outage.
Table A4.1: Range of Outage Allowances at different levels of risk
Outage (Ml/d)
Water Resource
Zone
DO
(Ml/d)
60% 70% 80% 90% 100%
(40% risk) (30% risk) (20% risk) (10% risk) (0% risk)
Bishops Castle 4.67 0.01 0.03 0.09 3.31 4.66
Forest & Stroud 44.97 1.12 1.64 2.94 5.55 24.30
Kinsall 5.00 0.04 0.08 0.19 5.00 5.00
Llandinam &
Llanwrin 19.85 0.17 0.30 0.68 15.51 19.85
Mardy 3.65 0.02 0.05 0.11 2.88 2.88
Newark 15.50 0.00 0.00 0.47 11.31 15.50
North Staffordshire 147.99 1.52 1.89 2.49 3.91 64.48
Nottinghamshire 269.97 3.44 4.45 6.10 9.98 270.00
Rutland 0.00 0.00 0.00 0.00 0.00 0.00
Ruyton 5.32 0.04 0.09 0.22 5.30 5.30
Shelton 142.99 1.49 1.89 2.48 3.39 13.32
Stafford 25.50 0.51 0.73 0.97 1.35 4.81
Strategic Grid 1465.75 79.99 112.59 157.98 241.72 1102.54
Whitchurch & Wem 10.90 0.03 0.07 0.11 0.23 2.15
Wolverhampton 65.00 0.14 0.29 0.55 0.85 4.35
As shown in Table A4.1 there is a large difference between the 80th percentile outage value and the
95th and 100th percentile outage values, but that difference between the 80th percentile and the
60th and 70th percentile values is relatively small. In some of the smaller zones, such as Kinsall
and Ruyton, adopting a lower level of risk would increase the Outage Allowance significantly, with
the whole zonal DO being lost to outage. Consistent with WRMP09 we have therefore used the
80th percentile values of the cumulative frequency distribution of outage probabilities in our water
resources planning. Table A4.2 shows the Outage Allowances we have adopted with the
percentage of the zonal deployable output that is affected.

Appendix A: How much water do we have available?
104
Severn Trent Water: Final Water Resources Management Plan 2014
Table A4.2: Summary of Outage Allowances adopted for WRMP14
Water Resource Zone Outage allowance
(Ml/d)
Percentage of
Deployable Output
(%)
Bishops Castle 0.09 1.9
Forest & Stroud 2.94 6.5
Kinsall 0.19 3.8
Llandinam & Llanwrin 0.68 3.4
Mardy 0.11 3.0
Newark 0.47 3.0
North Staffordshire 2.49 1.7
Nottinghamshire 6.10* 2.3*
Rutland 0.00 0
Ruyton 0.22 4.2
Shelton 2.48 1.7
Stafford 0.97 3.5
Strategic Grid 157.98 10.8
Whitchurch & Wem 0.11 1.0
Wolverhampton 0.55 0.9
*from 2020 the Nottinghamshire Outage Allowance reduces to 5.45Ml/d / 2% of zone DO
Overall, the Outage Allowance is low as a percentage of total DO at both a company level and at
individual zone level, being a maximum of 10.8% of DO in the Strategic Grid zone and being less
than 3% in nine of the 15 Zones. At a company level, Outage Allowance is 8% of our total DO.
The allowances vary widely between our Water Resource Zones, according to the nature of the
sources and the degree of supply integration of the zones. The allowances are greatest in the
Strategic Grid zone, which makes up 90% of the company’s whole vulnerability total under the 80th
percentile. As with WRMP09, we are adopting the 80th percentile Outage Allowance across the
whole of our planning period.
A4.5 Components of Outage Allowance
The relative contribution of the various components of the overall outage risk have been estimated
by running the outage model with different events excluded from the calculation. It should be noted
that because a probabilistic model is used, the results from the analysis should be regarded as
indicative rather than definitive. The results, as shown in Table A4.3, are useful in understanding the
sources of outage and can guide management decisions on addressing that risk, and on improving
the information base on which it is assessed.

Appendix A: How much water do we have available?
105
Severn Trent Water: Final Water Resources Management Plan 2014
Table A4.3: Components of Outage Allowances
Water
Resource
Zone
Relative contribution of cause of outage (%)
Quality Process
Maintenance
Burst/
Leak
Capital
Improvement
Electrical Pumps/
Valves
Bishops Castle 0.0 0.0 0.0 0.0 100.0 0.0
Forest & Stroud 1.9 0.0 0.0 0.0 60.7 37.4
Kinsall 0.0 26.2 0.0 0.0 73.8 0.0
Llandinam &
Llanwrin 0.0 100.0 0.0 0.0 0.0 0.0
Mardy 0.0 0.0 0.0 0.0 100.0 0.0
Newark 0.0 0.0 0.0 0.0 100.0 0.0
North Staffs 0.0 23.3 0.0 0.0 63.9 12.9
Nottingham 6.7 23.0 0.0 0.0 54.8 15.6
Ruyton 0.0 0.0 0.0 0.0 100.0 0.0
Shelton 0.0 0.0 0.0 0.0 74.1 25.9
Stafford 0.0 38.9 0.0 0.0 49.2 11.9
Strategic Grid 78.1 18.3 1.2 0.9 0.4 1.1
Whitchurch &
Wem 0.0 100.0 0.0 0.0 0.0 0.0
Wolverhampton 0.0 33.0 0.0 0.0 55.8 11.1
A4.6 Reducing future outage risks
Our wider PR14 investment plans include a major programme of capital maintenance, resilience
and water quality improvement work which will improve the condition of our assets, making
treatment processes more reliable and lowering the risk of their failure. At the time of publishing our
draft WRMP in May 2013, our capital improvement and maintenance plan for AMP6 and beyond
was still being formulated. To help inform our draft WRMP we used an early version of the capital
improvement and maintenance plan to carry out a sensitivity analysis to see what impact the
required work would have on our outage allowance. As our draft WRMP showed, that early work
plan had relatively little impact on outage allowance, except in the Nottinghamshire zone where
borehole maintenance will help reduce outage allowance from the end of AMP6.

Appendix A: How much water do we have available?
106
Severn Trent Water: Final Water Resources Management Plan 2014
The PR14 capital improvement and maintenance plan for water treatment works has now been fully
formulated and has been designed to target those sites which have the highest risks of being
affected by specific water quality and equipment issues. We are now able to link this to our outage
allowance analysis to help assess how the planned risk reduction work will reduce our outage
allowance in the longer term.
The capital improvement and maintenance plan has adopted a risk based approach following the
principles of our Drinking Water Safety Plans (DWSPs). During AMP5 we developed DWSPs for
each of our sources of public water supply, and are where we assess and record our water quality
risks along with the details of controls and corrective actions. We use the DWSPs for regulatory
reporting (Reg 28 reports) and to support the need for water quality capital investment schemes.
They are recognised by DWI and OFWAT.
The DWSP approach has given us a much greater understanding of asset and water quality, and this has revealed the need for a step up in investment at water treatment works in AMP6 compared to previous AMP periods. Our DWSP risk assessment model is broken down as follows:
inherent risk describes the catchment risk, e.g. the presence or absence of cryptosporidium
defined by risk assessment and/or data.
realised risk confirms the existence of the inherent risk through water quality sample data
the Effectiveness of Control (EoC) is a detailed assessment of the effectiveness of a process
at controlling the Water Quality hazard it was designed to control e.g. the effectiveness of a
Rapid Gravity Filtration process to remove cryptosporidium. Assessed biannually through
detailed on-site process reviews against engineering standards.
Figure A4.1: Drinking Water Safety Plan Risk Calculation
Hazarde.g. crypto
Inherent Risk
Effectiveness
of Control
Assessment
Overall
Treatment RiskRealised Risk(data assessment)
EoC has been used to inform asset
condition and prioritise capital investment requirements in the tables below
Title Definition
Inherent Risk Risk posed by the catchment, source or upstream asset
Realised Risk Assessment of water quality sample data
Effectiveness of Control Assessment of how effective our treatment assets are at controlling the
relevant/identified hazards
The Effectiveness of Control (EoC) denotes how effective a treatment process is at controlling the
water quality hazards it is intended to address. Each of our surface water treatment works has
been reviewed on a process by process basis, from AMP6 onwards, using the Drinking Water

Appendix A: How much water do we have available?
107
Severn Trent Water: Final Water Resources Management Plan 2014
Safety Plans as the starting point. From this a Red Amber Green (RAG) status has been assigned
to show the future risks and deterioration of the treatment processes at each works if no capital
maintenance investment is made.
Figure A4.2: Example Drinking Water Safety Plan Effectiveness of Control Matrix
DA
F
Cla
rifi
cati
on
(H
BC
&/o
r F
BC
)
RG
F
Ozo
ne
GA
C
Dis
infe
cti
on
Ph
osp
hate
Flu
ori
de
pH
Co
rrecti
on
Slu
dg
e &
Waste
wate
r
Works A 3 3 1 1 2 1 3
Works B 3 1 2 2 3 1 2 2 4
Works C 1 3 1 1 2 2 2 4
Those processes which currently have or are forecast to have a red EoC are likely to contribute to a
water quality exceedence at a site and result in reduced output or site shut down while the problem
is resolved. The investment plan has been designed to address the highest risk sites and to
remove known current risks, and to prevent future risks arising from deterioration of the assets and
treatment processes. Our PR14 capital improvement and maintenance investment plan will address
the high risk issues at our surface water treatment works.
For this final WRMP, we have incorporated the benefits of our wider PR14 capital maintenance and
water quality investment plans. We have reviewed the record of historic outage events against our
PR14 capital improvement and maintenance plans. We have identified which of the past
“unplanned” outage events are likely to be resolved or prevented in future as a result of our PR14
investment plans. From this we have carried out sensitivity analysis by removing those resolved
“unplanned” issues removed from our outage risk modelling. Our sensitivity testing shows that the
outage risk to deployable output in the Strategic Grid zone will reduce by around 9Ml/d by the end of
AMP6, and by around 24Ml/d by 2040.
Table A4.1 shows the future changes in outage allowance in the Strategic Grid zone resulting from
our wider PR14 investment plans.

Appendix A: How much water do we have available?
108
Severn Trent Water: Final Water Resources Management Plan 2014
Table A4.1: Reductions in Outage Allowance in the Strategic Grid zone following investment
AMP 6 7 8 9 10
Years 2015-19 2020-24 2025-29 2030-34 2035-39
Outage Allowance (Ml/d)
157.98 149.32 147.17 134.11 134.11
% of Deployable Output
10.8 10.2 10.0 9.1 9.1
We have used this outage reduction profile in the final planning supply / demand scenario published
in the accompanying final WRMP data tables.

Appendix A: How much water do we have available?
109
Severn Trent Water: Final Water Resources Management Plan 2014
A5 Imports and exports of water We operate a number of raw and potable transfers and bulk supplies between the water resource
zones within our region, as well as externally to and from third parties.
As we have described in Appendix A1, we have significantly changed our Water Resource Zones
(WRZs) since our 2009 Water Resources Management Plan (WRMP09). We now work to 15
separate WRZs and these more closely align with the WRZ definition set out in the 2012 Water
Resources Planning Guideline. As a result, our 15 WRZs are broadly self contained with little, or
limited, connectivity across borders. The few internal transfers that remain are described in the
following section:
A5.1 Internal transfers
In our water resources deployable output (DO) modelling our Aquator model optimises the use of
internal transfers based on least cost and resource state. In our WRMP tables all of our internal
transfers are included within the DOs. When we calculate DO for our WRZs we ensure that the
import to a receiving WRZ is consistent with the export from the donor WRZ. We do not include
internal transfers as separate rows in the WRMP tables as this would double count them. The
following table shows the utilisation and capacity of these transfers in Mega litres per day (Ml/d)
rounded to one decimal place:
Table A5.1: Inter zonal transfers modelled within baseline deployable output
Name of transfer Exporting
WRZ
Importing
WRZ
Average
91 year
utilisation
(Ml/d)
Max
capacity
(Ml/d)
Derwent Valley Aqueduct (DVA) to
Nottinghamshire (Notts) Grid Notts 22.6 28.0
DVA to Strelley (Notts) Grid Notts 17.2 42.8
Church Wilne to Notts Grid Notts 56.5 84.0
Higham to North Notts Grid Notts 14.9 22.9
Mythe to Mitcheldean Grid Forest &
Stroud 0.0* 0.0*
Notts to Chesterfield Notts Grid 5.6 9.9
Mitcheldean to S. Gloucestershire Forest &
Stroud Grid 0.0 10.0
Notts to Newark Notts Newark 14.8 15.9
* We did not include this transfer in our base DO modelling nor have we included it in the base year (2011-12)
of our WRP tables. However we have assumed a transfer of 2 Ml/d in our WRP tables from 2013-14 onwards.
This is because we do not expect this AMP5 scheme to deliver this benefit until 2013-14.
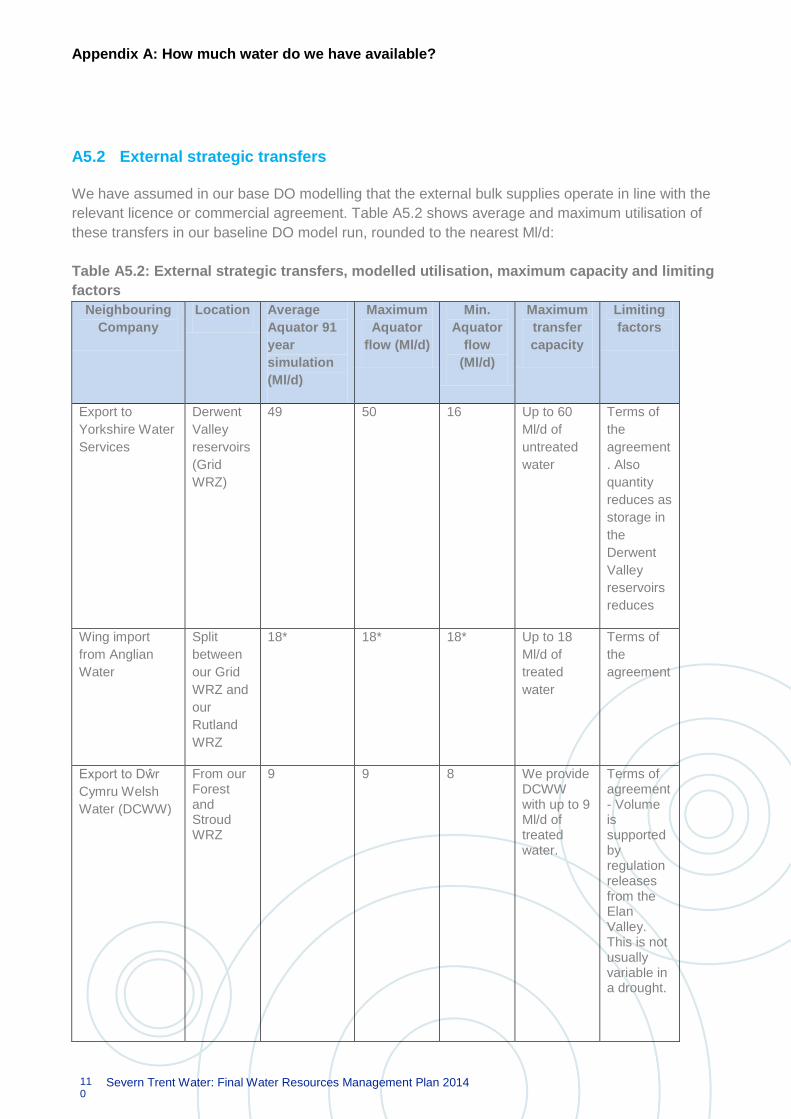
Appendix A: How much water do we have available?
110
Severn Trent Water: Final Water Resources Management Plan 2014
A5.2 External strategic transfers
We have assumed in our base DO modelling that the external bulk supplies operate in line with the
relevant licence or commercial agreement. Table A5.2 shows average and maximum utilisation of
these transfers in our baseline DO model run, rounded to the nearest Ml/d:
Table A5.2: External strategic transfers, modelled utilisation, maximum capacity and limiting
factors
Neighbouring
Company
Location Average
Aquator 91
year
simulation
(Ml/d)
Maximum
Aquator
flow (Ml/d)
Min.
Aquator
flow
(Ml/d)
Maximum
transfer
capacity
Limiting
factors
Export to
Yorkshire Water
Services
Derwent
Valley
reservoirs
(Grid
WRZ)
49 50 16 Up to 60
Ml/d of
untreated
water
Terms of
the
agreement
. Also
quantity
reduces as
storage in
the
Derwent
Valley
reservoirs
reduces
Wing import
from Anglian
Water
Split
between
our Grid
WRZ and
our
Rutland
WRZ
18* 18* 18* Up to 18
Ml/d of
treated
water
Terms of
the
agreement
Export to Dŵr
Cymru Welsh
Water (DCWW)
From our Forest and Stroud WRZ
9 9 8 We provide DCWW with up to 9 Ml/d of treated water.
Terms of agreement - Volume is supported by regulation releases from the Elan Valley. This is not usually variable in a drought.

Appendix A: How much water do we have available?
111
Severn Trent Water: Final Water Resources Management Plan 2014
Neighbouring
Company
Location Average
Aquator 91
year
simulation
(Ml/d)
Maximum
Aquator
flow (Ml/d)
Min.
Aquator
flow
(Ml/d)
Maximum
transfer
capacity
Limiting
factors
Import from Dŵr
Cymru Welsh
Water
To our Grid WRZ from the Elan Valley reservoirs.
338 345
114 DCWW
provide up
to 356 Ml/d
of
untreated
water via
the Elan
Valley
Aqueduct
(EVA). This
reduces to
327 Ml/d
when the
Elan Valley
Licence
Rule Curve
is crossed.
Terms of
agreement
and also
by sustain-
able
capacity of
aqueduct.
Hampton Loade
import from
South
Staffordshire
Water (SSW)
River
Severn to
the
Wolver-
hampton
WRZ
33 48 28 Average of
34 Ml/d
(peak day
of 48 Ml/d)
of treated
water.
Terms of
agreement
Import from
South
Staffordshire
Water (SSW)
Brindley
Bank
1.4** n/a n/a Estimated
at 5 Ml/d
Terms of
agreement
* Although we have this supply in our Aquator model it is not connected to the rest of our network and the flow
does not vary. In our planning we assume that the maximum transfer of 18 Ml/d is available throughout the
planning period. We assume that up to10 Ml/d of this import can supply the Rutland WRZ and the remaining 8
Ml/d enters our strategic grid WRZ.
** We do not model this within Aquator
We have contacted the relevant companies to ensure that the assumptions we make are consistent
with those made by the other party and that there are no significant inconsistencies. The following
text explains how we manage our external transfers in normal years and under a dry year/ drought
year scenario:

Appendix A: How much water do we have available?
112
Severn Trent Water: Final Water Resources Management Plan 2014
Bulk supply arrangements with Yorkshire Water
The normal operation of this bulk supply is governed by an agreement signed by both companies in
1989. The minimum supply rate between Severn Trent Water and Yorkshire Water Services (YWS)
is 35Ml/d unless storage falls below state 5. Operationally we operate to the terms of this agreement
and so does YWS.
However, there is provision in the agreement to modify these rules and this occurred during 1995-
96, in 2003 and 2013. In events like droughts or during major outages in our region we may
approach Yorkshire Water and ask if it can ease pressure on our water resources by taking a
reduced supply.
We understand that the response we receive to these approaches will depend on the water
resources position in Yorkshire. For example, during the drought of early 2012 we explored with
Yorkshire Water the possibility of them reducing their take. However, the prevailing hydrological
conditions changed dramatically before any change to the bulk supply was necessary. Nevertheless
we would make a similar approach in the future if required. The graph below shows the control lines
that help to guide how we work with Yorkshire Water to operate this system:
Figure A5.1: Control lines for Derwent Valley bulk transfer to Yorkshire Water
We are also aware that, as Yorkshire Water has stated in its 2013 drought plan, the decision on
whether to impose restrictions in their supply area is triggered by their resources and not our water
resources situation. The opposite is also true: if Yorkshire Water has imposed restrictions but we
have not, we will make our decision based upon our wider water resources situation. However, in
scenarios of this sort we will work closely with Yorkshire Water, and all other stakeholders, to
minimise the impact of a drought on customers and the environment.

Appendix A: How much water do we have available?
113
Severn Trent Water: Final Water Resources Management Plan 2014
Ultimately the decision on whether to impose customer restrictions lies with each company and
depends on their own water resources position. This applies not only to us and Yorkshire Water but
also to our interaction with all neighbouring companies.
Bulk supply arrangements with Anglian Water
We have a bulk supply agreement with Anglian Water which provides up to 18 Ml/d from their Wing
WTW into the rural areas of the former county of Rutland. Under normal circumstances around 8
Ml/d of this import supplies our Rutland zone while around 6 Ml/d feeds into the strategic grid zone.
When we take the full supply, the split is 10 Ml/d to Rutland and 8 Ml/d to the grid. We have used
these values in our supply demand balances and WRMP tables. In our Aquator modelling this bulk
supply will vary on a daily basis depending on the demands in each of these WRZs.
This bulk supply does not automatically vary with any drought management measures, and the
agreement does not stipulate that we will reflect any drought management measures that Anglian
Water have to impose on its customers that are fed from their Wing WTW system. Nevertheless, in
such circumstances, we will liaise closely with Anglian Water to minimise the impact on our
customers whilst supporting Anglian Water’s efforts to maintain supplies from the Wing WTW
system.
Bulk supply arrangements with Dŵr Cymru Welsh Water (DCWW)
We provide a bulk supply of up to 9 Ml/d to DCWW from our treatment works at Mitcheldean along
with some minor supplies from our Llandinam zone.
We receive a bulk supply from the DCWW reservoirs in the Elan Valley. The quantities of this supply
and how it may vary throughout the year are dictated by the abstraction licences of the associated
water sources. For example, the transfer from the Elan Valley reservoirs is controlled by licence rule
curves. If reservoir storage is below the lower licence rule curve it reduces the licensed maximum
transfer along the Elan Valley Aqueduct (EVA) as well as affecting the required compensation flow.
Bulk supply arrangements with South Staffordshire Water (SSW)
We receive a bulk supply of treated water from SSW to supply the Wolverhampton area. In a severe
drought we would review the way we apportion our respective shares of the joint abstraction licence
on the River Severn with SSW and the Environment Agency (EA). This licence allows for the
transfer of the overall quantity between SSW and us. The intention would be to review our
respective positions with regard to the other resources SSW have at their disposal, and our
resource availability in this part of our region, and allocate the balance between SSW’s and our
abstraction points accordingly. This agreed arrangement has existed for over 15 years and has
worked satisfactorily throughout this time.
The annual River Severn Regulation meetings with SSW, the EA and the Canal and Rivers Trust
provide a forum for collaborative management of water resources on the River Severn. In addition
to this we talk to SSW about the numerous emergency connections between ourselves but, we
place no reliance on such emergency supplies being available for a protracted period during a
drought. We have also been working with SSW so that our and their Aquator modelling assumptions

Appendix A: How much water do we have available?
114
Severn Trent Water: Final Water Resources Management Plan 2014
are aligned. Another area where we are working together is in relation to the potential for us to apply
for a drought permit at Trimpley.
We also receive a smaller supply of potable water from SSW to support our Stafordshire WRZ. This
bulk import provides us with an average of 1.4 Ml/d and we usually refer to it as the Brindley Bank
import. Our working estimate for the peak capacity of this supply is 5 Ml/d.
A5.3 Maximum transfer capacity and factors which limit this capacity
Internal transfers
We earlier described the maximum transfer capacity and the limiting factors for our internal transfers
in table A5.1. The limiting factors for these transfers are the maximum capacities of the pipelines.
The maximum capacities shown in table A5.1 are those we use in our Aquator modelling as model
parameters. These maximum values are either hydraulic capacities or where the flow is limited by
operational factors such as water quality and discolouration risks.
External strategic transfers
The maximum transfer capacity and the limiting factors for our external transfers are described in
table A5.2. We note that in most cases the relevant infrastructure will be sized so that it does not
allow significantly more than the agreed quantity of the bulk transfer:
How we manage our transfers in a dry year scenario
For our internal transfers our DAT (drought action team) makes decisions about intra and inter-
zonal transfers. This decision making process is described in more detail in our drought plan. We
have described above how we manage our external strategic transfers in a dry year scenario.
Reliability of transfers involving neighbouring companies
We have described above the assumptions we make in relation to the reliability of these inter-
company transfers in a drought. We have also provided a high level description of the nature of
these transfers and any limiting factors. We have not provided further details in the WRMP as these
are commercially confidential agreements between the two companies. There have been no
occasions since the WRMP09 when the requested import or export quantities were not provided.

Appendix A: How much water do we have available?
115
Severn Trent Water: Final Water Resources Management Plan 2014
A6 Levels of service
Levels of service are “a contract between a water company and its customers, setting out the
standard of service that customers can expect to receive from a water company.” Our WRMP sets
out our recommended strategy for maintaining the minimum standard of service that our customers
can expect for restrictions on water use.
Our stated levels of service that we provide for our customers are that:
On average, as a result of drought we will need to use temporary use bans to restrict customers’
use of water no more than three times every 100 years
We will need drought orders to restrict non essential use no more than three times in every 100
years
Rota cuts/ standpipes for our customers are unacceptable as a response to drought.
If we ever had to restrict our customers’ use of water we would either impose a temporary use ban
(TUB) or, in a more severe drought we could apply to Government for a drought order to restrict
wider use through a non essential use ban. A TUB is roughly equivalent to what we referred to as a
hosepipe ban in our WRMP09.
As we would not restrict non essential use unless we already had a TUB in place we would not
expect non essential drought orders more than three times in a century. The actual frequency of
non essential use drought orders could conceivably be less than three in 100 years. In fact our
modelled frequency of non essential use bans is approximately 1 in 100. As table A6.1 shows this is
consistent with the levels of service we state to customers as it is not more than 3 in 100. When we
talk to our customers we do not distinguish between temporary use bans and non essential use
bans. We think that this helps to avoid confusion.
A6.1 Links to our drought plan
Our target levels of service are consistent with those we have quoted in other Severn Trent
publications, such as WRMP09 and our 2014 drought plan. In our drought plan we explain how we
have improved the way we respond to changes in drought indicators, such as strategic reservoir
storage, by using new drought trigger zones and an associated action plan. We use these action
plans to help our decision making during a drought.
The example below shows the revised triggers for our reservoir at Tittesworth, in North
Staffordshire. We have given more details of our revised drought trigger zones and the associated
measures in our 2014 drought plan.

Appendix A: How much water do we have available?
116
Severn Trent Water: Final Water Resources Management Plan 2014
Figure A6.1: Drought trigger zones for Tittesworth reservoir
The following table is based on table six in the ‘water resources planning tools 2012: report ref.
No.12/WR/27/6 Deployable Output (DO) report’. We have not included the planned frequency of
media campaigns as these are not specifically part of our stated levels of service.
Table A6.1: Levels of service (LoS) frequency calculations
LoS control
rule
threshold
“level”
Number of events
in the record from
water resources
modelling
simulation
Length of
record
(years)
Frequency
per 91 year
length of
record
(%)
Company
stated
LoS
frequency
Example
description of
LoS frequency
and water use
restriction
measures
Threshold No
1
3 91 3.3 Not >
3 in 100
Temporary use
ban (TUB)
Threshold No
2
1 91 1.1* Not >
3 in 100
Non essential
use ban (NEUB)
Threshold No
3
0 91 0 Not
acceptable
Rota cuts/
standpipes
* This is the frequency of this occurring in our baseline DO model run – it will differ in other modelled
scenarios and does not change the stated company levels of service

Appendix A: How much water do we have available?
117
Severn Trent Water: Final Water Resources Management Plan 2014
Our baseline deployable output (DO) modelling of the 91 year period from 1920 to 2010 shows that
the three most critical droughts in our region are: 1944, 1976 and 1984. Our water resource
modelling shows that these are the three droughts when we would have needed to impose a TUB.
These three droughts are the same critical drought events mentioned in our 2014 drought plan. We
have used our stated three in 100 level of service for TUBs and non essential use bans in both
plans. Our stated and our modelled frequency of restrictions is consistent between our WRMP and
our drought plan.
Our water resource model, our drought trigger zones and our assumptions in relation to demand
reductions are consistent between this final WRMP and our drought plan. As a result there are no
discrepancies between the level of service in our drought plan and the level of service in our final
WRMP.
Although we provide a higher level of service than most companies, we do this at the lowest
possible cost to our customers. If we planned on the basis that we will never impose restrictions
even during times of drought, it would not be economically or environmentally feasible to meet
unrestrained consumer demand in all possible circumstances. If we planned never to restrict the
use of water, customers’ bills would have to be higher. Conversely there are potential savings if we
planned to restrict customers more frequently.
In order to produce this WRMP we carried out extensive water resources modelling using an
Aquator model of our water resources system. This modelling enabled us to review and improve our
estimates of deployable output (DO). Our ‘baseline’ DO is consistent with our existing three in 100
stated level of service. We describe the way that we modelled TUBs and non essential use bans in
Appendix A2, which contains more detail on the modelled frequency of these restrictions and the
associated reduction in demand that we assume in our modelling.
Figure A6.2: Elan Valley modelled baseline DO storage entering drought trigger zones E and F in the 1976 ‘summer’

Appendix A: How much water do we have available?
118
Severn Trent Water: Final Water Resources Management Plan 2014
Figure A6.3: Elan Valley modelled baseline DO storage entering drought trigger zones E and F in the 1921 ‘winter’
We describe how we derived these updated drought triggers and the associated drought
management actions in our 2014 drought plan.
A6.2 A flexible approach to levels of service
Section 2.9 of the EA’s 2012 Water Resources Planning Guidelines suggests that water companies
consider whether they “can deliver a given level of service more efficiently by taking a flexible
approach, bringing forward investment or increasing operating expenditure (for example, to reduce
leakage) when the risk of exceptionally dry weather becomes a reality.” We have recent experience
of this. For example, during the drought which ended in 2012 we implemented several drought
management schemes in the south of our strategic grid WRZ. We did this as a direct response to
low storage in Draycote reservoir. One of these schemes was to transfer water from elsewhere in
our grid to Draycote (see figure below).

Appendix A: How much water do we have available?
119
Severn Trent Water: Final Water Resources Management Plan 2014
Figure A6.4: Transfer from Leamington to Draycote reservoir
Although these schemes increased our operating costs in the short term they reduced the likelihood
that we would need to take more drastic drought management actions such as TUBs or drought
permits. We have provided more operational detail of this and other drought management actions in
our 2014 drought plan.
A6.3 Extending the period of our hydrological analysis
The modelling we undertook to support our WRMP09 used an 88 year flow time series for the
period 1920 to 2007 for catchments across our region. The water resources modelling we have
used to support this plan uses a 91 year flow record. This flow record extends from 1920 to 2010
and we do not have hydrological flows for the period before 1920. However, as a frequency of three
TUBs in 91 years is equivalent to 3.3% of the modelled years having TUBs, we consider this to be
consistent with our three in 100 level of service.
In order to provide us with further confidence in our ability to meet our stated level of service, we
have worked with Liverpool University to study rainfall records within our region that date back to
the 1880s. This research looked at long term rainfall records in three locations: Wallgrange, Rugby
and Nanpantan. The following figure shows the location of these three sites:

Appendix A: How much water do we have available?
120
Severn Trent Water: Final Water Resources Management Plan 2014
Figure A6.5: Location of Liverpool University research study sites
One of the lessons we learned from this research was that, although there were some longer
duration drought events in the forty year period prior to 1920, none of these drought events was
more severe than the worst three droughts between 1920 and 2010. The following graphs show
how the Self Calibrating Palmer Drought Severity Index (scPDSI) varies across the three locations
from the 1870s to 2010.

Appendix A: How much water do we have available?
121
Severn Trent Water: Final Water Resources Management Plan 2014
Figure A6.6: Drought severity index at Wallgrange, Rugby and Nanpantan
We have presented graphs here of a drought index rather than a measure like annual rainfall as we
consider a drought index will correlate more closely with the likelihood that we will need to impose
restrictions on our customers’ use of water. The Liverpool University research demonstrated that
this specific drought severity index is the most appropriate one for this study. This research is
available on request.
As described above we extended our flow record between our WRMP09 and this final plan. We plan
to extend it further before we start to prepare our 2019 WRMP. When we do this it will then include
the flows to cover the period of the drought that ended in 2012.
A6.4 Relationship between levels of service and deployable output (DO)
Appendix A2 demonstrates the sensitivity of the relationship between our level of service and
deployable output. For example, figure A2.10 shows how the DO in our strategic grid water

Appendix A: How much water do we have available?
122
Severn Trent Water: Final Water Resources Management Plan 2014
resource zone (WRZ) is the same with the reference level of service, one TUB every ten years, as it
is for 3 in 100. This graph also shows that, in the strategic grid, if we planned to improve our level of
service to customers so that they received no TUBs then this would reduce the DO available.
We have reviewed the output of the modelled scenarios looking at the sensitivity of our system to
different levels of service. In the modelling we have done to support this final WRMP, a change in
levels of service as an option to balance supply and demand does not make a material difference to
the scale of investment that we would need. This is one reason why we have not selected this
option in our final WRMP. We have also reviewed the available evidence from customer views, set
out below.
A6.5 Customer views on our levels of service
In preparation for our final WRMP we have reviewed the evidence we have about customer support
for different levels of service. In summary, this evidence shows that:
Our 2007 survey supported the current level of service;
Information we collected in 2012 conflicted with this and with at least some customer research
by other water companies;
The evidence from the 2012 survey suggests that customers may not have been clear about the
options that we proposed
Our most recent research shows that our customers support a frequency of restrictions of once
every 38 years.
This is so close to our existing level of service that we do not propose making any changes to it.
When talking to our customers on the question of restrictions we do not distinguish between the
different types of restrictions. We will not make any decisions about the level of service that we offer
our customers without clear evidence. We think that customer support is particularly important if we
were ever to change the levels of service that we provide to our customers. This is true of any
change, but is particularly important if we were to reduce our levels of service, even if this helped
keep bills lower than would otherwise be the case.
A6.6 Consistency between actual and planned levels of service
In the Severn Trent region our customers have not experienced a restriction on their use of water
since the 1995-96 drought. This period includes the twelve month period to February 2012 which
was the driest in the Midlands region since records began in 1910 (source: Environment Agency
water situation report, February 2012). Despite this extremely dry period we were able to manage
our water resources without recourse to customer restrictions.
As our baseline DO modelling showed, the three most critical droughts in our record for the Severn
Trent region are: 1944, 1976 and 1984. There is an apparent inconsistency in the fact that these
three years do not include 1995-96 which was a drought that actually caused us to restrict our
customers demand. However, this is because there are numerous differences between the current
demands and infrastructure that are reflected in our Aquator model and those that existed in reality

Appendix A: How much water do we have available?
123
Severn Trent Water: Final Water Resources Management Plan 2014
during 1995 and 1996. For example, we have reduced leakage significantly since 1996. What this
modelling has shown is that our current water resources network, the demands for water and the
associated infrastructure, as currently modelled, are significantly different to what existed in 1995-
96.
Throughout the planning period (2015 to 2040) we plan to maintain the level of service we currently
provide to our customers. As we described earlier, when we carry out our baseline DO modelling we
set the maximum number of TUBs as three within the 91 year run. These DO values, based on the
three in 100 year level of service, then feed into our baseline WRMP tables. If there is a supply-
demand deficit in any WRZ the timing and the magnitude will be shown in Ml/d. In our final planning
tables we then show how we plan to reduce demand or increase supplies to make up any predicted
deficits. This approach is consistent with our previous WRMP. However, this approach to deriving
our baseline scenario does not allow for the level of service to vary across the planning period. As
mentioned previously we considered this as an option to balance supply and demand but have not
selected it as part of our least cost mix of options.
As this approach to levels of service and DO means that there is no difference between baseline
and planned level of service there is no need to reconcile any differences.

Appendix A: How much water do we have available?
124
Severn Trent Water: Final Water Resources Management Plan 2014
A7 Baseline supply projections
Appendices A1 to A5 describe how we have modelled current and projected water available for use.
Appendix A7 summarises the baseline deployable output projections, showing the impacts of the
Restoring Sustainable Abstraction programme and climate change. We also show the projected
water available for use in each zone, taking account of outage risks and available bulk imports and
exports.
Bishops Castle zone
Figure A7.1: Bishops Castle baseline deployable output
Figure A7.2: Bishops Castle baseline water available for use

Appendix A: How much water do we have available?
125
Severn Trent Water: Final Water Resources Management Plan 2014
Forest and Stroud zone
Figure A7.3: Forest and Stroud baseline deployable output
Figure A7.4: Forest and Stroud baseline water available for use

Appendix A: How much water do we have available?
126
Severn Trent Water: Final Water Resources Management Plan 2014
Kinsall zone
Figure A7.5: Kinsall baseline deployable output
Figure A7.6: Kinsall baseline water available for use

Appendix A: How much water do we have available?
127
Severn Trent Water: Final Water Resources Management Plan 2014
Llandinam and Llanwrin zone
Figure A7.7: Llandinam and Llanwrin baseline deployable output
Figure A7.8: Llandinam and Llanwrin baseline water available for use

Appendix A: How much water do we have available?
128
Severn Trent Water: Final Water Resources Management Plan 2014
Mardy zone
Figure A7.9: Mardy baseline deployable output
Figure A7.10: Mardy baseline water available for use

Appendix A: How much water do we have available?
129
Severn Trent Water: Final Water Resources Management Plan 2014
Newark zone
Figure A7.11: Newark baseline deployable output
Figure A7.12: Newark baseline water available for use

Appendix A: How much water do we have available?
130
Severn Trent Water: Final Water Resources Management Plan 2014
North Staffs zone
Figure A7.13: North Staffs baseline deployable output
Figure A7.14: North Staffs baseline water available for use

Appendix A: How much water do we have available?
131
Severn Trent Water: Final Water Resources Management Plan 2014
Nottinghamshire zone
Figure A7.15: Nottinghamshire baseline deployable output
Figure A7.16: Nottinghamshire baseline water available for use

Appendix A: How much water do we have available?
132
Severn Trent Water: Final Water Resources Management Plan 2014
Rutland zone
Figure A7.17: Rutland baseline deployable output
Figure A7.18: Rutland baseline water available for use

Appendix A: How much water do we have available?
133
Severn Trent Water: Final Water Resources Management Plan 2014
Ruyton zone
Figure A7.19: Ruyton baseline deployable output
Figure A7.20: Ruyton baseline water available for use

Appendix A: How much water do we have available?
134
Severn Trent Water: Final Water Resources Management Plan 2014
Shelton zone
Figure A7.21: Shelton baseline deployable output
Figure A7.22: Shelton baseline water available for use

Appendix A: How much water do we have available?
135
Severn Trent Water: Final Water Resources Management Plan 2014
Stafford zone
Figure A7.23: Stafford baseline deployable output
Figure A7.24: Stafford baseline water available for use

Appendix A: How much water do we have available?
136
Severn Trent Water: Final Water Resources Management Plan 2014
Strategic Grid zone
Figure A7.25: Strategic Grid baseline deployable output
Figure A7.26: Strategic Grid baseline water available for use

Appendix A: How much water do we have available?
137
Severn Trent Water: Final Water Resources Management Plan 2014
Whitchurch and Wem zone
Figure A7.27: Whitchurch and Wem baseline deployable output
Figure A7.28: Whitchurch and Wem baseline water available for use

Appendix A: How much water do we have available?
138
Severn Trent Water: Final Water Resources Management Plan 2014
Wolverhampton zone
Figure A7.29: Wolverhampton baseline deployable output
Figure A7.30: Wolverhampton baseline water available for use