a16 norwood, peterborough strategic outline business case
TRANSCRIPT

0
A16 Norwood, Peterborough
Strategic Outline Business CaseNovember 2020
Appendix 1


Document Control
Job Number: 5080754
Document ref: A16_Norwood_ SOBC Authorisation
Rev Purpose Originated Checked Reviewed Skanska Date
2.0 First Draft JWH RPJ RMJ RMJ 16.10.2020
3.2 Updated following Technical Review JWH RPJ RMJ RMJ 17.11.2020
3.3 Updated to include CPCA Comments JWH RPJ RMJ RMJ 02.12.2020

Table of Contents Executive Summary ................................................................................................................................................ I 1. Introduction .................................................................................................................................................. 1
1.1. Study Area ............................................................................................................................................................. 1
1.2. Growth Context .................................................................................................................................................... 4
1.3. Document Structure ............................................................................................................................................. 5
2. Strategic Case ............................................................................................................................................... 6 2.1. Introduction ........................................................................................................................................................... 6
2.2. Business Strategy ................................................................................................................................................... 6
2.3. Fit with the Wider Policy Context ....................................................................................................................... 10
2.4. The Need for Change .......................................................................................................................................... 12
2.5. Impact of Not Changing ..................................................................................................................................... 18
2.6. Internal Drivers for Change ................................................................................................................................ 21
2.7. External Drivers for Change ................................................................................................................................ 23
2.8. Scheme Objectives .............................................................................................................................................. 24
2.9. Measures of Success ........................................................................................................................................... 26
2.10. Constraints .......................................................................................................................................................... 27
2.11. Interdependencies ............................................................................................................................................... 28
2.12. Key Risks .............................................................................................................................................................. 28
2.13. Stakeholders ........................................................................................................................................................ 29
2.14. Powers and Consents .......................................................................................................................................... 29
2.15. Option Development and Assessment .............................................................................................................. 29
2.16. Shortlisting Summary .......................................................................................................................................... 31
2.17. Option Assessment Summary ............................................................................................................................ 38
3. The Economic Case ..................................................................................................................................... 39 3.1. Introduction ......................................................................................................................................................... 39
3.2. Options Appraised .............................................................................................................................................. 39
3.3. Economic Assessment ......................................................................................................................................... 40
3.4. Additional Qualitative Appraisal ........................................................................................................................ 48
3.5. Key Risks, Sensitivities and Uncertainties ........................................................................................................... 49
3.6. Value for Money Statement ............................................................................................................................... 50

4. The Financial Case ...................................................................................................................................... 51 4.1. Introduction ......................................................................................................................................................... 51
4.2. Scheme Costing ................................................................................................................................................... 51
4.3. Budgets and Funding Cover ............................................................................................................................... 55
5. The Commercial Case ................................................................................................................................. 56 5.1. Introduction ......................................................................................................................................................... 56
5.2. Output Based Specification ................................................................................................................................ 56
5.3. Procurement Strategy ......................................................................................................................................... 56
5.4. Risk Allocation and Transfer ............................................................................................................................... 57
6. The Management Case .............................................................................................................................. 58 6.1. Introduction ......................................................................................................................................................... 58
6.2. Evidence of Similar Projects ................................................................................................................................ 58
6.3. Programme / Project Dependencies ................................................................................................................... 60
6.4. Governance, Organisational Structures, and Roles .......................................................................................... 61
6.5. Programme / Project Reporting .......................................................................................................................... 63
6.6. Programme / Project Plan ................................................................................................................................... 63
6.7. Assurance and Approvals Plan ........................................................................................................................... 64
6.8. Communications and Stakeholder Management ............................................................................................. 64
6.9. Risk Management Strategy ................................................................................................................................ 65
6.10. Scheme Evaluation Plan (Benefits Realisation and Monitoring) ...................................................................... 66
Appendices .......................................................................................................................................................... 71 Appendix A: Wider Policy Context ................................................................................................................................... 71
Appendix B: A16 Norwood Improvement Scheme Appraisal Summary Table (AST) .................................................... 72
Appendix C: Project Risk Register ..................................................................................................................................... 73

Tables
Table 2.1: Wider Policy Context and Impact of Delivering Improvements within the A16 Study Area ........ 11
Table 2.2: Combined Authority Criteria ............................................................................................................. 22
Table 2.3: Study Objectives and Measures of Success ...................................................................................... 26
Table 2.4: Long List of Options for A16 Norwood Improvement Scheme Study ............................................ 30
Table 2.5: Scheme Objectives ............................................................................................................................. 31
Table 2.6: Option Shortlisting Summary ............................................................................................................ 32
Table 2.7: Economic Assessment AMCB Comparison ...................................................................................... 38
Table 3.1: Annualisation Factors ........................................................................................................................ 41
Table 3.2: Package Phasing within Strategic Modelling ................................................................................... 41
Table 3.3: Package 1 Cost Profiles ...................................................................................................................... 42
Table 3.4: Base Investment Cost (2020 Prices) .................................................................................................. 43
Table 3.5: Inflation increases on Construction Costs 2019-2020 ..................................................................... 43
Table 3.6: Economic Case Scheme Cost Estimates ............................................................................................ 44
Table 3.7: A16 Norwood Improvement Scheme AMCB Table (Package 1a) .................................................. 45
Table 3.8: A16 Norwood Improvement Scheme AMCB Table (Package 1b - Part Time Signals) ................... 46
Table 3.9: Non-monetised Time Benefits by Time Saving ................................................................................. 47
Table 3.10: Non-monetised Time Benefits by Distance .................................................................................... 47
Table 3.11: User Benefits by Time Period ........................................................................................................... 47
Table 3.12: Additional Appraisal Elements ........................................................................................................ 49
Table 3.13: Low Growth Economic Assessment AMCB Comparison .............................................................. 50
Table 4.1: Scheme Costing Parameters ............................................................................................................. 51
Table 4.2: Financial Case Scheme Cost Estimates ............................................................................................. 52
Table 4.3: Base Investment Cost (2020 Prices) .................................................................................................. 52

Table 4.4: Risk Adjusted Base Costs (2020 Prices) ............................................................................................. 53
Table 4.5: Inflated Risk Adjusted Cost (2020 Prices) ......................................................................................... 54
Table 6.1: Key Project Milestones....................................................................................................................... 63
Table 6.2: Benefits Realisation Monitoring ....................................................................................................... 68

Figures
Figure 1.1: A16 Norwood Improvement Scheme Study Area ............................................................................ 2
Figure 1.2: A16 Norwood Improvement Scheme Study Area Road Network ................................................... 3
Figure 2.1: CPCA Policy Framework ..................................................................................................................... 7
Figure 2.2: AM Peak Hour (Snapshot at 08:00) Delay to the East of Peterborough ....................................... 13
Figure 2.3: PM Peak Hour (Snapshot at 17:30) Delay to the East of Peterborough ........................................ 14
Figure 2.4: Average Trafficmaster Journey Time (secs – Free Flow, AM, Inter and PM peak hour) ............... 15
Figure 2.5: U-turning Traffic Route from Newborough Road .......................................................................... 16
Figure 2.6: Accident Density Weighted by Severity (2016 – 2019) ................................................................... 17
Figure 2.7: AM Peak Hour Delay (seconds per vehicle) 2036 Do Minimum Scenario (PTM3) ........................ 19
Figure 2.8: PM Peak Hour Delay (seconds per vehicle) 2036 Do Minimum Scenario (PTM3) ........................ 20
Figure 2.9: Site of Special Scientific Interest (SSSI) within the A16 Norwood Study Area .............................. 27
Figure 2.10: 2036 AM Peak Hour Change in Total Delay (seconds per vehicle) – Package 1 impact on DM
Scenario ............................................................................................................................................................... 36
Figure 2.11: 2036 AM Peak Hour Change in Demand Flow – Package 1 impact on DM Scenario ................ 36
Figure 2.12: 2036 PM Peak Hour Change in Total Delay (seconds per vehicle) – Package 1 impact on DM
Scenario ............................................................................................................................................................... 37
Figure 6.1: Junction 20 Improvement (Post Scheme) ........................................................................................ 59
Figure 6.2: Junction 17 (A1M) Improvement (Post Scheme) ............................................................................ 60
Figure 6.3: Key Project Roles and Responsibilities ............................................................................................. 62
Figure 6.4: Norwood Access Study Monitoring and Evaluation Logic Map .................................................... 70
I
Executive Summary This Strategic Outline Business Case makes a strong strategic and economic case for the A16 Norwood
Improvement scheme, which will return High Value for Money.
The package of schemes will add capacity to the highway network, addressing existing problems of peak
hour congestion, and help to facilitate planned residential growth within Norwood.
The Peterborough Local Plan (adopted July 2019) sets out the overall vision, priorities and objectives for
Peterborough up to 2036. The updated strategy identifies the required delivery of 19,440 new homes and
17,600 new jobs by 2036.
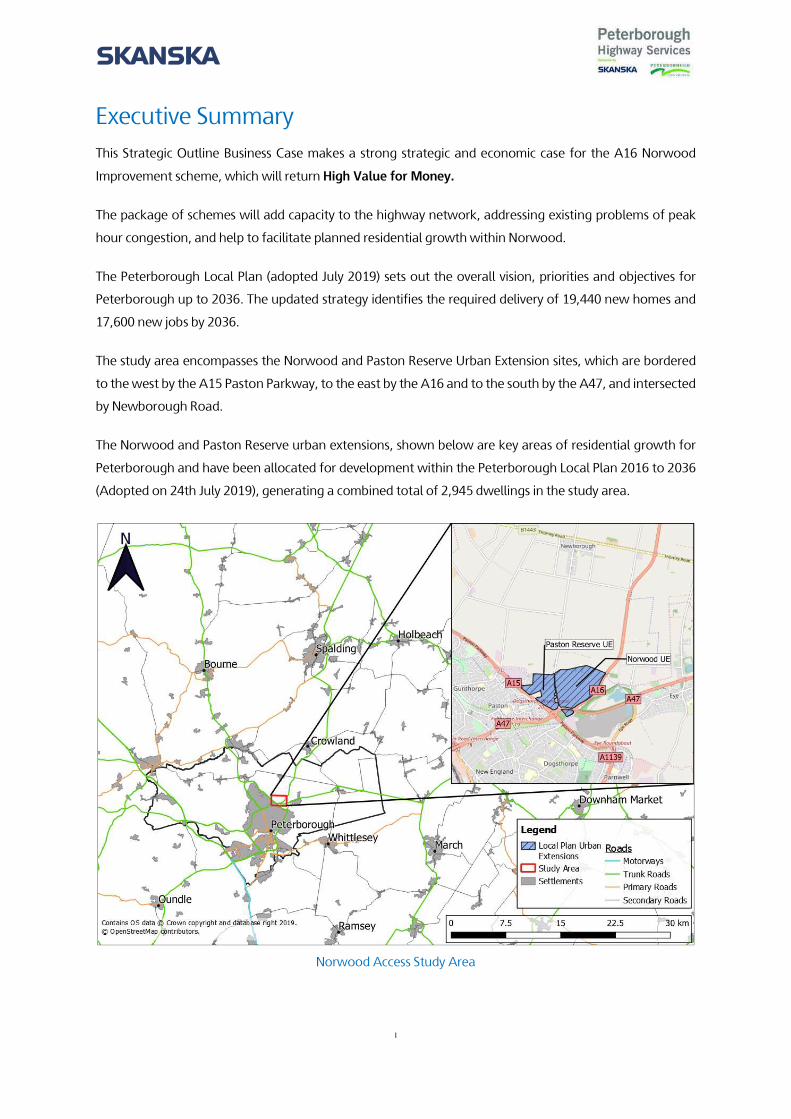
The study area encompasses the Norwood and Paston Reserve Urban Extension sites, which are bordered
to the west by the A15 Paston Parkway, to the east by the A16 and to the south by the A47, and intersected
by Newborough Road.
The Norwood and Paston Reserve urban extensions, shown below are key areas of residential growth for
Peterborough and have been allocated for development within the Peterborough Local Plan 2016 to 2036
(Adopted on 24th July 2019), generating a combined total of 2,945 dwellings in the study area.
Norwood Access Study Area

II
The Strategic Outline Business Case is set out in compliance with the Department for Transport’s (DfT) Five
Case Business Model.
Strategic Case
The Strategic Case has considered the policy context in which a scheme for this location has been developed.
As well as policy, the need for intervention is explained, which includes the following issues that
compromise local growth aspirations:
Extensive queues and delays on the A16
Queueing on the A47
High accident rate at the A16 / A47 / Welland Road Roundabout.
The policy review and data of existing issues has been used to identify scheme objectives, and a long list of
potential improvement options have been assessed against these objectives using the DfT’s Early
Assessment Sifting Tool (EAST). The scheme objectives are set out beneath.
Primary objectives include:
Tackle congestion and improve journey times: Tackle congestion and reduce delay along the A16
and on the primary approaches to the A16 / A47 / Welland Road Roundabout
Support Peterborough’s growth agenda: Ensure that the planned employment and housing
growth at Norwood can be realised
Limit impact on the local environment and improve biodiversity: Fully mitigate any adverse
environmental impacts of a scheme, and ensure a biodiversity net gain within the study area.
In addition to the primary objectives, several secondary objectives were identified:
Positively impact traffic conditions on the wider network: Positively impact the performance of
local routes impacted by the traffic and congestion in and around the A16 corridor, such as the
A47, A15 Paston Parkway, A1139 Eye Road and Newborough Road.
Improve road safety: Reduce accidents and improve personal security for all travellers within the
study area.
Improve sustainable transport infrastructure: Ensure that the scheme provides a comprehensive
network of pedestrian and cycling routes where needed.
The Strategic Case concludes with details of the preferred package of schemes (Package 1) which is the
subject of this Business Case. Full details of the modelling and assessment work undertaken to identify the
preferred package of schemes can be found in the Norwood Option Assessment Report (OAR).

III
The Preferred Option (‘the scheme’) includes:
Closure of Newborough Road access onto A47
Dualling of A16 between A16 / A47 / Welland Road Roundabout and the Norwood Development
Access
Partial signalisation of A16 / A47 / Welland Road Roundabout (A16 southbound approach)
A 50 metre flare added to the A47 westbound approach to provide additional capacity for left
turning traffic to Welland Road
Dedicated Left Turn Lane (LDL) from the A47 eastbound to the A16 northbound.
Economic Case
The Economic Case demonstrates the scheme (Package 1a) achieves a Benefit to Cost Ratio (BCR) of 3.182,
and offers High Value for Money based on transport user benefits alone. A breakdown of the scheme BCR
is provided beneath.
A16 Norwood Improvement Scheme BCR
Value (£’000s) 2010 prices, benefits discounted to 2010
Benefits
Greenhouse Gases -1
Consumer Users (Commuting) 4,168
Consumer Users (Other) 5,442
Business Users/Providers 5,476
Indirect Taxes 53
Present Value of Benefits (PVB) 15,138 Costs
Broad Transport Budget 4,757 Present Value of Costs (PVC) 4,757
Net Benefit / BCR Impact Net Present Value (NPV) 10,381 Benefit/Cost Ratio (BCR) 3.182
The Present Value of Benefits used in the assessment have been derived from the SATURN-based
Peterborough Transportation Model (PTM3) used to assess the impact of the scheme in future years. Results
from this modelling were then assessed using the Transport User Benefits Appraisal (TUBA, 1.9.14) tool to
calculate a scheme BCR. The Present Value of Benefits for the scheme are £15,138,000 in 2010 prices.
The Present Value of Costs used in the Economic Assessment is based upon a robust scheme cost estimate
and has been calculated in line with WebTAG guidance over a 60 year appraisal period. The Present Value
of Costs for the scheme are £4,757,000 in 2010 prices.

IV
Qualitative assessments have also been undertaken for the following areas:
Landscape
Heritage
Arboriculture
Ecology
Noise.
These assessments did not identify any significant concerns, and will be considered in more detail during the
Detailed Design process.
Financial Case
The Financial Case demonstrates that the scheme has been robustly costed in line with WebTAG guidance.
This Scheme Outturn Cost (including risk and inflation) is £6,615,466. This includes a 20% Risk Allowance,
which is comprised of 10% construction Risk and 10%COVID-19 related risk.
The initial scheme cost estimates are presented in the table beneath.
Financial Case Scheme Cost Estimates
It is anticipated that the full scheme Outturn Cost of £6,615,466 will be funded by the CPCA from the Single
Investment Fund.
Peterborough City Council request that the Design Cost of £620,000 is released in advance of the funds
required for construction, in order to undertake the Preliminary Design and produce an OBC. This work is
provisionally programmed to be undertaken between April 2021 and March 2022, with a view to
construction commencing on site in 2024 (closure of Newborough Road).
Cost Stage Cost (£)
4,294,790
Risk Adjusted Base Cost 4,950,733
Risk Adjusted Base Cost with Construction Industry Inflation (Outturn Cost) 6,615,466
Base Investment Cost
V
Commercial Case
The Commercial Case demonstrates that the scheme can be reliably procured and implemented through
existing channels whilst ensuring value for money in delivery of the scheme.
All phases of the scheme, including detailed design, construction and site supervision will be delivered in
house by Peterborough Highway Services (PHS), who have been responsible for all planning and design
work undertaken on the A16 Norwood Improvement Scheme to date.
The scheme will be procured using a Target Cost payment mechanism. This incentivises both parties to work
together to reduce cost through a pain / gain mechanism. To ensure that the procurement remains
commercial competitive and offers value for money, all subcontract packages will be subject to competitive
tendering.
Procuring the scheme directly through the PHS contract enables Peterborough City Council to appoint a
contractor in an efficient manner. Using PHS’ in-house delivery capability offers the following benefits over
alternative procurement routes.
PHS is reliable and has a proven track record of delivering major schemes successfully, and this
serves as a positive indicator of future performance.
The scheme can be procured far quicker than would be the case with alternative procurement
routes. As well as reducing the procurement costs for the procuring authority, the project benefits
will be realised sooner.
The integrated delivery model creates a single point of responsibility and encourages more
effective collaboration between client, designer and contractor to reduce costs. As the scheme has
been identified, planned and designed within PHS, continuity can be assured through to
construction, and any issues identified on site can be quickly resolved by the design team.
A well-established supply chain is already in place which provides Value for Money. All subcontract
packages will be competitively tendered to ensure best value, and will be put to a minimum of three
tenderers where possible.
Strong performance is highly incentivised as all schemes delivered within the PHS contract
contribute to a suite of KPIs which impacts on the term of the contract. Consistent good
performance is rewarded with contract term extensions whereas consistently poor performance
would see a reduction in the contract term.
The contract duration and strong collaborative relationship encourages both parties to work
towards long term gain rather than short term commercial gain.

VI
Management Case
The Management Case demonstrates that Peterborough City Council, through the PHS Framework, has the
necessary experience and governance structure to successfully manage the delivery of the scheme.
The Council, through PHS, have successfully delivered the following highway improvement schemes in
recent years:
Junction 20 Improvement Scheme (A47 Soke Parkway / A15 Paston Parkway) - £5.7m
Junction 17 – Junction 2 Improvement Scheme (A1139 Fletton Parkway) - £18m.
Junction 20 Improvement (post scheme)
The scheme will be delivered by a Project Team led by a Peterborough City Council Project Manager, and
consisting of all the key project delivery partners. The Project Team will be responsible for the daily running
of the project, coordinating with all key stakeholders, and managing the delivery programme.
The existing PHS Project Board will be used to oversee the continued development and delivery of the
scheme by the Project Team, and to make key decisions relating to the delivery of the project. The Project
Board will be supported by technical specialists, and key stakeholders will be invited to attend as necessary.
Every month the Project Manager will also submit a highlight report to the CPCA recording what progress
has been made and whether there are any new risks that could impact the scheme.
VII
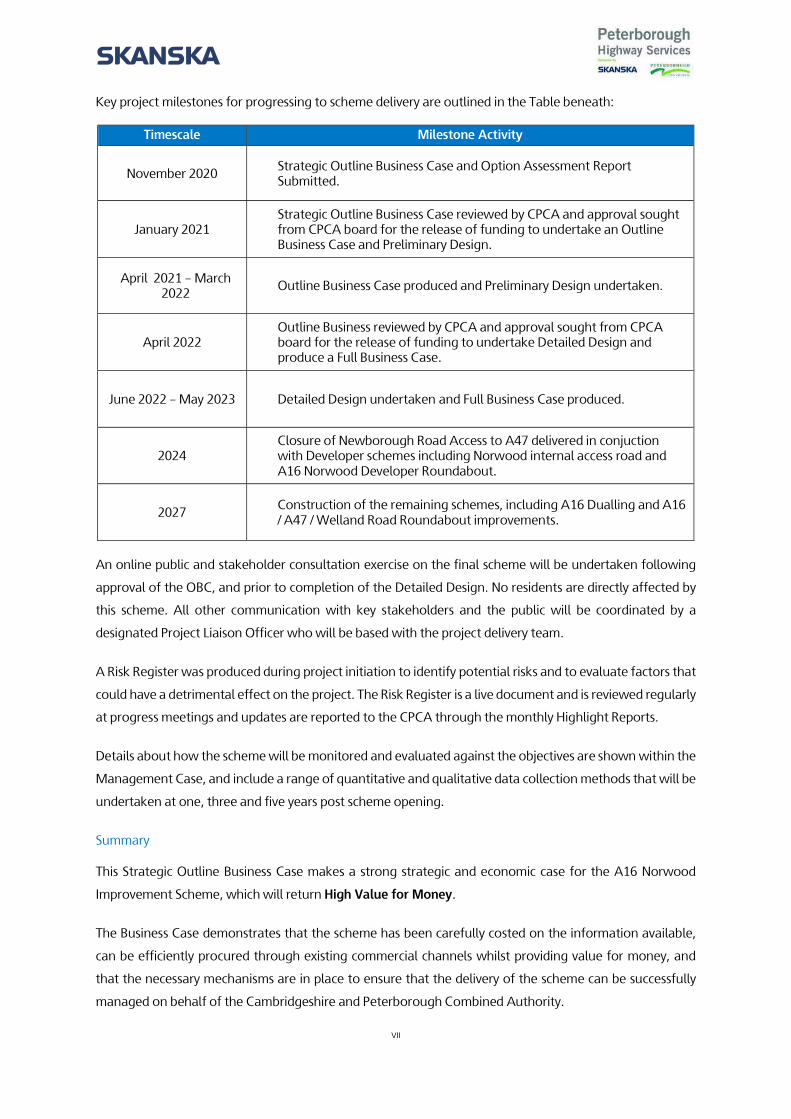
Key project milestones for progressing to scheme delivery are outlined in the Table beneath:
Timescale Milestone Activity
November 2020 Strategic Outline Business Case and Option Assessment Report Submitted.
January 2021 Strategic Outline Business Case reviewed by CPCA and approval sought from CPCA board for the release of funding to undertake an Outline Business Case and Preliminary Design.
April 2021 – March 2022
Outline Business Case produced and Preliminary Design undertaken.
April 2022 Outline Business reviewed by CPCA and approval sought from CPCA board for the release of funding to undertake Detailed Design and produce a Full Business Case.
June 2022 – May 2023 Detailed Design undertaken and Full Business Case produced.
2024 Closure of Newborough Road Access to A47 delivered in conjuction with Developer schemes including Norwood internal access road and A16 Norwood Developer Roundabout.
2027 Construction of the remaining schemes, including A16 Dualling and A16 / A47 / Welland Road Roundabout improvements.
An online public and stakeholder consultation exercise on the final scheme will be undertaken following
approval of the OBC, and prior to completion of the Detailed Design. No residents are directly affected by
this scheme. All other communication with key stakeholders and the public will be coordinated by a
designated Project Liaison Officer who will be based with the project delivery team.
A Risk Register was produced during project initiation to identify potential risks and to evaluate factors that
could have a detrimental effect on the project. The Risk Register is a live document and is reviewed regularly
at progress meetings and updates are reported to the CPCA through the monthly Highlight Reports.
Details about how the scheme will be monitored and evaluated against the objectives are shown within the
Management Case, and include a range of quantitative and qualitative data collection methods that will be
undertaken at one, three and five years post scheme opening.
Summary
This Strategic Outline Business Case makes a strong strategic and economic case for the A16 Norwood
Improvement Scheme, which will return High Value for Money.
The Business Case demonstrates that the scheme has been carefully costed on the information available,
can be efficiently procured through existing commercial channels whilst providing value for money, and
that the necessary mechanisms are in place to ensure that the delivery of the scheme can be successfully
managed on behalf of the Cambridgeshire and Peterborough Combined Authority.

1
1. Introduction This document sets out the Business Case for transport improvements in the A16 Norwood Improvement
Scheme study area in Peterborough. The scheme will address future congestion and delay along the A16
corridor that would compromise the operational efficiency of the surrounding road network, including the
Strategic A47 route. By addressing existing and future issues, and building in additional capacity,
improvements will assist with delivering growth aspirations across Peterborough, and specifically at the
Norwood site.
This Strategic Outline Business Case is the first stage of the decision making process using the format as set
out in “The Transport Business Cases” document published by the Department for Transport (DfT) in
January 2013.
The level of detail provided within the Business Case continually builds as the project progresses from
Strategic Outline Business Case (SOBC) to Outline Business Case (OBC), and then onto Full Business Case
(FBC). This reflects the greater level of detail that becomes available as the list of potential schemes is
refined, and preferred schemes are identified for increasingly thorough consideration.
The primary purpose of the SOBC is to:
Confirm the need for change and the policy fit of a scheme at this location
Demonstrate that a range of options have been considered, and that a preferred option has been
identified that meets the scheme objectives
Evidence that the preferred option offers value for money, and has been robustly costed based on
all information available
Explain how the scheme will be procured, and how delivery of the project will be managed.
1.1. Study Area
The study area encompasses the Norwood and Paston Reserve Urban Extension sites, which are bordered
to the west by the A15 Paston Parkway, to the east by the A16 and to the south by the A47, and intersected
by Newborough Road.
The Norwood and Paston Reserve urban extensions, shown below in Figure 1.1, are key areas of residential
growth for Peterborough and have been allocated for development within the Peterborough Local Plan
2016 to 2036 (Adopted on 24th July 2019), generating a combined total of 2,945 dwellings in the study area.
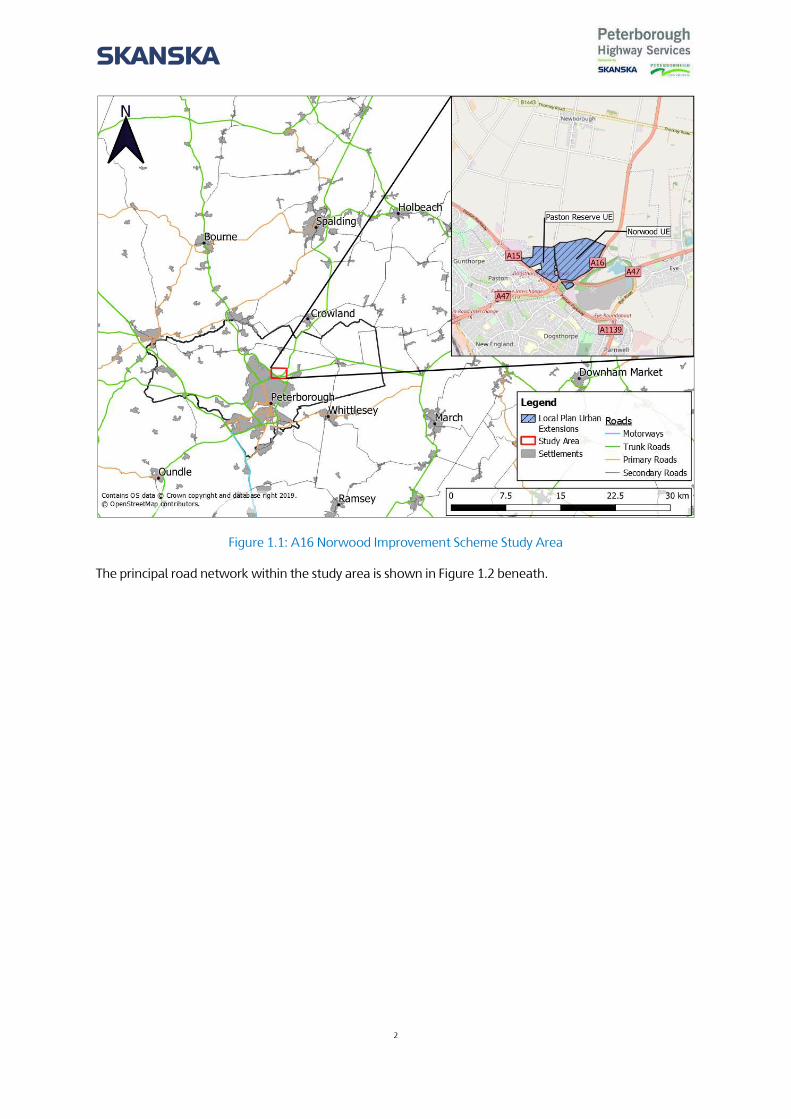
2
Figure 1.1: A16 Norwood Improvement Scheme Study Area
The principal road network within the study area is shown in Figure 1.2 beneath.

3
Figure 1.2: A16 Norwood Improvement Scheme Study Area Road Network
The A16 is a 125 km principal road connecting Grimsby (Lincolnshire) and Peterborough, along with other
primary destinations such as Boston and Spalding. The southern section of the A16 ends in Peterborough
at the A16 / A47 / Welland Road Roundabout, which is operating over capacity with significant queueing
and delays during the AM peak hour.
The A47 is a 309 km east-west trunk road linking Birmingham to Lowestoft and passes through
Peterborough. The significant queueing and delays along the A47 approach of the A16 / A47 / Welland Road
Roundabout in Peterborough consequently encourages vehicles to rat-run via the A1139 Eye Road and
increase queueing and delays at the A15 / A1139 / Parnwell Way signalised roundabout (Junction 8).

4
1.2. Growth Context
The population of Peterborough has grown considerably over recent years, increasing by 29% from 156,061
to 201,041 residents between 2001 and 2018 (based on Office for National Statistics estimates).
Peterborough’s population is the 33rd fastest growing out of 382 local authorities between 2013 and 2018.
To date Peterborough’s transport network, which was fundamentally redesigned in the 1970s to
accommodate the then “Peterborough New Town”, has served the city well. However, as a consequence
of recent and planned housing and employment growth, capacity issues are now emerging on the road
network, resulting in congestion and delay. As congestion increases on the strategic network, and queues
form at key junctions, the potential for delivering new homes and jobs in the area will become increasingly
constrained. Peterborough City Council are committed to addressing these highway constraints to ensure
that its full growth aspirations can be realised.
The Peterborough Local Plan 2016 to 2036 (Adopted on 24th July 2019) sets out the overall vision, priorities
and objectives for Peterborough for the period up to 2036. The strategy identifies the required delivery of
approximately 19,440 dwellings and 17,600 jobs between 2016 and 2036. It is estimated that urban
extensions would account for approximately 59% of all residential growth in Peterborough.
The Norwood and Paston Reserve urban extensions, shown previously in Figure 1.1, have been allocated for
development within the Peterborough Local Plan 2016 to 2036 (Adopted on 24th July 2019). The 80 hectare
Norwood site will provide 2,000 dwellings, a local centre and primary school. The delivery of the
development has been split into two phases.
The first phase of development (2019 – 2031) is known as the Land off Newborough Road (Leeds Farm
Development), which includes up to 870 dwellings and auxiliary uses, including a primary school and local
centre, and would initially be accessed via Newborough Road.
The second phase of development (2026 – 2031) will complete the build out the Norwood site, and will
include the remaining dwellings.
It is expected that the entire Norwood site will ultimately have a primary point of access onto the A16 via a
developer funded / built roundabout, with the secondary point of access being via Newborough Road. It is
currently understood that the two points of access will be connected by an internal road, providing all
residents with direct access to the A16.
Adjacent to the Norwood site (to the west of Newborough Road) is the Paston Reserve Urban Extension.
Development at this site has begun, with 87 dwellings now complete, and the site will eventually include
945 dwellings, a local centre, a primary school and a secondary school with space for 900 pupils. Primary
access to the Paston Reserve site is currently via Manor Drive and Junction 21 of the A15 Paston Parkway,
with secondary access provided by Newborough Road and the A47.

5
The current access points for the Norwood site are the:
A16 / A47 / Welland Road Roundabout
A47 / Newborough Road priority junction.
Alternative access points are located to the north and are limited to:
B1443 / Guntons Road / Willow Drove priority junction
A16 / B1443 Roundabout.
The A16 / A47 / Welland Road Roundabout and A47 / Newborough Road priority junction accommodate a
large number of peak hour commuter trips between Peterborough, Newborough, Crowland, Spalding, Eye,
Thorney, March and Wisbech, and as a result suffers from severe peak period congestion and delays. This is
exacerbated by a high number of u-turning vehicles, coming from Newborough Road, which has an adverse
impact on the capacity of the A16 / A47 / Welland Road Roundabout.
The Norwood study area is identified as a key residential growth area in the Peterborough Local Plan.
However, the local transport network is likely to constrain the amount of development that can take place
at this location and limit its full potential.
This Business Case demonstrates the need for, and value of, investing in schemes that together will provide
the necessary increase in highway capacity to unlock congestion and significantly reduce delay along the
A16 corridor. This will help to support the growth at Norwood, and Paston Reserve, as well as providing
wider network benefits.
1.3. Document Structure
Based on the context outlined above, the remainder of this report will consist of the following sections, with
the aim of providing a thorough picture of baseline transport and development conditions across the study
area, and the need for, and value in, investment to enable growth:
Chapter 2: The Strategic Case identifies the need for an improvement at this location, considers
an initial long list of options, and how these perform against CPCA, Peterborough City Council
and the scheme objectives.
Chapter 3: The Economic Case demonstrates that the preferred option offers value for money,
and details the quantitative and qualitative Economic Assessment undertaken to date on the
scheme.
Chapter 4: The Financial Case shows how the scheme has been costed, and the expected funding
arrangement for delivering the scheme.
Chapter 5: The Commercial Case sets out how Peterborough City Council will procure in a way
that delivers value for money.
Chapter 6: The Management Case explains how successful delivery of the scheme will be
managed.

6
2. Strategic Case
2.1. Introduction
This chapter sets out the strategic case for the A16 Norwood Improvement Scheme package of
improvements. It demonstrates why improvements are needed at this location, and considers how the
package of schemes fit with local, regional and national policy, assisting Peterborough to deliver its planned
growth.
2.2. Business Strategy
The Government’s strategy for facilitating further economic growth requires continued investment in
transport infrastructure to enable businesses to invest in job creation and the provision of new residential
developments. Achieving economic growth, increasing living standards and the provision of new housing
are key Government objectives at national, regional and local level. This section details how highway
improvements within the Norwood area will contribute to achieving these strategic aims and polices.
Department for Transport Single Departmental Plan
The Single Departmental Plan published in June 20191 sets out the DfT’s objectives and the plans for
achieving them.
The objectives are:
Support the creation of a stronger, cleaner, more productive economy
Help to connect people and places, balancing investment across the country
Make journeys easier, modern and reliable
Make sure transport is safe, secure and sustainable
Prepare the transport system for technological progress and a prosperous future outside the EU
Promote a culture of efficiency and productivity in everything they do.
An improvement scheme along the A16 corridor, and within the general study area, has the potential to
reduce congestion and improve journey time reliability. The delivery of these benefits will support housing
and economic growth, As such, delivery of a scheme will provide benefits aligned to delivering the main
objectives of the DfT’s Single Departmental Plan.
1 https://www.gov.uk/government/publications/department-for-transport-single-departmental-plan

7
Cambridgeshire and Peterborough Combined Authority
The CPCA was formed in 2017, as a Mayoral Combined Authority. It is made of seven local authorities
(Cambridgeshire County Council, Peterborough City Council, Huntingdonshire District Council, East
Cambridgeshire District Council, Fenland District Council, Cambridge City Council and South
Cambridgeshire District Council) and the Business Board (Local Enterprise Partnership).
The focus of the CPCA is on strategic issues (such as housing, transport and infrastructure demand) which
cross council borders and span the entire Cambridgeshire and Peterborough area. The Devolution Deal for
Cambridgeshire and Peterborough runs for 30 years and sets out key ambitions for the CPCA as well as
including a list of specific projects, which the CPCA and its member councils will support over that time.
To help achieve these ambitions and provide the requisite support, the CPCA has set out a short-term
business plan2 that is aimed at giving a clear pathway to deliver on their ambitious and transformational
agenda for Cambridgeshire and Peterborough. Figure 2.1 sets out the CPCA Policy Framework.
Figure 2.1: CPCA Policy Framework
The CPCA Mayor’s Growth Ambition Strategy sets out the area’s priorities for achieving ambitious levels of
inclusive growth and meeting the commitments of the Devolution Deal. The Strategy is based upon
significant work undertaken by the Cambridgeshire and Peterborough Independent Economic Review
(CPIER).
The CPIER3 was commissioned by the Combined Authority and other local partners to provide a robust and
independent assessment of the Cambridgeshire and Peterborough Economy and its potential for growth.
The assessment makes a number of recommendations for the CPCA to take forward over the short, medium
and long-term.
2 https://cambridgeshirepeterborough-ca.gov.uk/assets/Uploads/CPCA-Business-Plan-2019-20-dps.pdf
CPIER Growth Ambition Strategy
Local Industrial Strategy
Local Transport Plan

8
The success of Cambridgeshire and Peterborough as a project of national importance is highlighted in the
CPIER. This is because the area contains some of the most important companies and institutions in the
country, much of the country’s high value agricultural land, and the cities and towns that continue to
support both.
The CPIER identifies Peterborough as a city with a dynamic business environment, built on its history of
industry including brickmaking and manufacturing. It is an attractive place for business due to its position
on the A1 and East Coast Main Line, as well as for aspirational workers who want easy access to London,
the Midlands and the North. However it also states that it has a lower proportion of high-level skills than
elsewhere in the area, and educational and health outcomes in Peterborough are relatively poor. The CPIER
believes a strong focus on these issues is needed to improve productivity and well-being, which should also
include new higher education provision.
The Local Industrial Strategy4 sets out the economic strategy for Cambridgeshire and Peterborough, taking
a lead role in implementing the business growth, productivity and skills elements of the Growth Ambitions
Strategy. The Local Industrial Strategy is focussed around five key foundations of productivity established in
the UK Industrial Strategy:
People
Ideas
Business Environment
Infrastructure
Place.
It is a core principle of the Local Industrial Strategy that the fifth foundation of place reflects the findings of
the CPIER, responding to the three sub-economies identified:
Greater Cambridge
Greater Peterborough
The Fens.
The CPCA Assurance Framework states that investments will only be made if they can demonstrate that
they will support the delivery of the Growth Ambitions Statement and the Local Industrial Strategies, as well
as the more detailed place and sector strategies.
3 https://www.cpier.org.uk 4 https://assets.publishing.service.gov.uk/government/uploads/system/uploads/attachment_data/file/818886/Cambridge_SINGLE_PAGE.pdf

9
In January 2020, the CPCA adopted a Local Transport Plan for Cambridgeshire and Peterborough5 and it
replaces the interim Local Transport Plan published in 2017. The plan describes how transport interventions
can be used to address current and future challenges and opportunities for Cambridgeshire and
Peterborough, and sets out the policies and strategies needed to secure growth and ensure that planned
large-scale development can take place in the county in a sustainable way.
The Local Transport Plan is split in to two main parts: The ‘Local Transport Plan’ which sets out the vision,
goals and objectives and the policies designed to deliver the objectives, and the ‘Transport Delivery Plan’
(2019 to 2035) which explains how the Local Transport Plan strategy will be delivered. It details programmes
for delivery of improvements to the transport network and for its day to day management and
maintenance.
The development of the Local Transport Plan was undertaken concurrently with the CPIER and the Growth
Ambition Strategy which enabled the challenges and opportunities detailed in these documents to be
reflected within the Local Transport Pan. The Local Transport Plan completes the suite of documents which
articulates the Combined Authority’s response to the CPIER.
The vision for the Local Transport Plan is:
‘To deliver a world-class transport network for Cambridgeshire and Peterborough that supports sustainable
growth and opportunity for all’.
The goals of the Local Transport Plan outline the wider outcomes the transport network in Cambridgeshire
and Peterborough will aim to achieve. They are:
Economy – Deliver economic growth and opportunity for all communities
Society – Provide an accessible transport system to ensure everyone can thrive and be healthy
Environment – Protect and enhance our environment and tackle climate change together.
The objectives of the Local Transport Plan underpin the delivery of the goals for an improvement within the
A16 Norwood Improvement Scheme study area, and form the basis against which scheme, initiatives and
policies will be assessed. The initial scheme objectives for an A16 Norwood Improvement Scheme were
devised at the beginning of the study and pre-date the objectives of the Local Transport Plan. Since the
introduction of the CPCA’s Local Transport Plan, these initial scheme objectives have been refined to ensure
they meet those objectives both locally (for Peterborough) and regionally (for the CPCA). The scheme
objectives for an A16 Norwood Improvement Scheme are set out later in this chapter.
5 https://cambridgeshirepeterborough-ca.gov.uk/assets/Transport/Draft-LTP.pdf

10
The objectives of the CPCA Local Transport Plan are:
Housing – support new housing and development to accommodate a growing population and
workforce
Employment – connect all new and existing communities so all residents can easily access jobs
within 30 minutes by public transport
Business and Tourism – Ensure all of our region’s businesses and tourist attractions are connected
sustainably to our main transport hubs, ports and airports
Resilience – build a transport network that is resilient and adaptive to human and environmental
disruption, improving journey time reliability
Safety – embed a safe systems approach in to all planning and transport operations to achieve
Vision Zero (zero fatalities or serious injuries)
Accessibility – promote social inclusion through the provision of a sustainable transport network
that is affordable and accessible for all
Health and Well-being – provide ‘healthy streets’ and high quality public realm that puts people
first and promotes active lifestyles
Air Quality – ensure transport initiatives improve air quality across the region to exceed good
practice standards
Environment – deliver a transport network that protects and enhances our natural, historic and
built environments
Climate Change – reduce emissions to as close to zero as possible to minimise the impact of
transport and travel on climate change.
The A16 is identified within the Local Transport Plan as a corridor in need of improvement to relieve
congestion and support the development at Norwood.
2.3. Fit with the Wider Policy Context
The wider policy context is set out in Table 2.1 overleaf. Each policy document is set out alongside its
objectives and how the proposed scheme will support and facilitate the objectives of each policy document.
Appendix A details other local policies that are relevant to improvements in the A16 Norwood Improvement
Scheme study area.

11
Table 2.1: Wider Policy Context and Impact of Delivering Improvements within the A16 Study Area
Policy Framework Policy Function Objectives Study Impact
Department for
Transport Single
Departmental Plan
Sets out the DfT’s objectives and the plans for achieving them
Support the creation of stronger, cleaner, more productive economy
Help to connect people and places, balancing investment across the country
Make journeys easier, modern and reliable
Make sure transport is safe secure and sustainable
Prepare the transport system for technological progress and a prosperous future
outside the EU
Promote a culture of efficiency and productivity in everything we do.
Improvements within the A16 study area will:
Support the housing and economic growth ambitions of the city
Improve reliability for drivers on this section of the city’s road network
Cambridgeshire and
Peterborough
Combined Authority
Local Transport Plan
Describes how transport interventions can be used to address
current and future challenges and opportunities. Sets out
policies and strategies needed to secure growth and ensure
planned large scale development can take place in the county in
a sustainable way. The Local Transport Plan completes the suite
of documents which articulates the Combined Authority’s
response to the CPIER
Housing – support new housing and development to accommodate a growing
population and workforce
Employment – connect all new and existing communities so all residents can easily
access jobs within 30 minutes by public transport
Business and Tourism – Ensure all of our region’s businesses and tourist attractions
are connected sustainably to our main transport hubs, ports and airports
Resilience – build a transport network that is resilient and adaptive to human and
environmental disruption, improving journey time reliability
Safety – embed a safe systems approach in to all planning and transport operations
to achieve Vision Zero (zero fatalities or serious injuries)
Accessibility – promote social inclusion through the provision of a sustainable
transport network that is affordable and accessible for all
Health and Well-being – provide ‘healthy streets’ and high quality public realm that
puts people first and promotes active lifestyles
Air quality – ensure transport initiatives improve air quality across the region to
exceed good practice standards
Environment – deliver a transport network that protects and enhances our natural,
historic and built environments
Climate Change – reduce emissions to as close to zero as possible to minimise the
impact of transport and travel on climate change.
Improvements within the A16 study area will:
Support the housing and economic growth ambitions of the city
Improve journey time reliability for drivers on this section of the city’s
road network
Reduce the number of accidents.
Peterborough City
Council Strategic
Priorities
The Council’s priorities to help meet its vision to
‘create and bigger and better Peterborough that grows the right
way, and through truly sustainable growth
Drive growth, regeneration and economic development
Improve educational attainment and skills
Safeguard vulnerable children and adults
Implement the Environment Capital Agenda
Support Peterborough’s culture and leisure trust Vivacity
Keep all our communities safe, cohesive and healthy
Achieve the best health and wellbeing for the city
Improvements within the A16 study area will:
Support the housing and economic growth ambitions of the city
Improve journey time reliability for drivers on this section of the city’s
road network
Reduce the number of accidents.
Peterborough City Council Local Plan
Updates the 2011 Core Strategy and looks to deliver 21,315 homes and 17,600 jobs by 2036

12
2.4. The Need for Change
There is a very clear and compelling case for change within the A16 Norwood corridor. The Local Plan has
allocated Norwood as a residential urban extension along with further residential development on the
neighbouring site at Paston Reserve, totalling over 2,500 new homes.
Evidence of existing and future condition of the highway network within the study area demonstrate that
there are already congestion issues during the peak hours. If the transport infrastructure is not improved
and increased transport capacity is not provided, it will impact the delivery of the proposed development.
These challenges are documented in the Option Assessment Repot (OAR) and are set out beneath in the
following themes:
Peak Hour Congestion and Delay (particularly on the A47 and A16)
U-turning traffic from Newborough Road
High accident rate.
Proposed growth at the Norwood site is forecast to exacerbate these existing issues.
If not resolved, these factors will compromise the city’s growth aspirations as well as the Council’s objectives
to keep Peterborough a pleasant place to live and work.
Congestion and Delay
Figure 2.2 and Figure 2.3 overleaf show the typical delays at 08:00 and 17:30 on a neutral weekday to the
east of Peterborough. There is significant delay in both the AM and PM peak periods at the following
junctions:
A16 / A47 / Welland Road roundabout
A47 / A1139 roundabout
A1139 / Peterborough Road roundabout
A15 / A1139 / Parnwell Way signalised roundabout (Junction 8)
A47 / Crowland Road roundabout
A15 / Gunthorpe Road / Manor Drive roundabout (Junction 21).

13
Figure 2.2: AM Peak Hour (Snapshot at 08:00) Delay to the East of Peterborough
Figure 2.2 shows delay along the A16 southbound and A47 westbound on the approach to the A16 / A47 /
Welland Road Roundabout. This is due to the volume of traffic and tidal nature of trips into Peterborough
during the AM peak hour. Two significant inbound traffic flows (A16 and A47) merge at the A16 / A47 /
Welland Road Roundabout, and capacity at the junction is compromised by a high proportion of u-turning
traffic from Newborough Road.

14
Figure 2.3: PM Peak Hour (Snapshot at 17:30) Delay to the East of Peterborough
The tidal nature of delay is evident again in the PM peak hour, as delay forms on the A47 eastbound and
Welland Road approaches to the A16 / A47 / Welland Road Roundabout as vehicles depart Peterborough
to the east at the end of the day.
Satellite Navigation data (2018) has been used to better investigate journey times and delay within the study
area. Figure 2.4 overleaf shows the journey times for the Free Flow period (FF, 00:00 – 05:00), AM peak hour
(08:00 – 09:00), Inter peak hour (14:00 – 15:00) and PM peak hour (17:00 – 18:00) within the study area for
weekdays in October 2018.

15
Figure 2.4: Average Trafficmaster Journey Time (secs – Free Flow, AM, Inter and PM peak hour)

16
There are some significant increases in journey times in the AM peak hour when compared to the free flow
period, including a 20 second increase per vehicle on the A16 southbound. There is also an increase in
journey time on the A47 westbound towards the A16 / A47 / Welland Road Roundabout of 17 seconds per
vehicle in the AM peak when compared to the free flow period.
It should be noted that not enough trips were recorded along Newborough Road in the free flow period for
a journey time record to be ascertained.
As with the AM peak hour, the Inter peak hour experiences an increase in average journey time (25 seconds
per vehicle) along the A16 southbound compared to the free flow period. The majority of other journey
times are similar to those in the free flow period.
In the PM peak hour there are increases in average journey time compared to the free flow period along the
A16 southbound (13 seconds per vehicle), A16 northbound (19 seconds per vehicle) and the A47 eastbound
exit from the A16 / A47 / Welland Road Roundabout (20 seconds per vehicle).
U-turning Traffic
Part of the capacity constraint at the A16 / A47 / Welland Road Roundabout is caused by u-turning traffic
from Newborough Road. The A47 / Newborough Road junction is a left in / left out only junction, and so
any vehicle from Newborough Road destined for Peterborough must u-turn at the roundabout, as shown
in Figure 2.5 below.
Figure 2.5: U-turning Traffic Route from Newborough Road
Vehicles on the busier A16 and A47 westbound movements (AM peak hour) must stop and give–way to
every u-turning vehicle from Newborough Road. If not resolved, this issue will be exacerbated in future with
the development of Paston Reserve and Norwood both having direct access to Newborough Road, and
existing developer proposals to formalise this movement through the provision of a traffic signal controlled
junction.
17
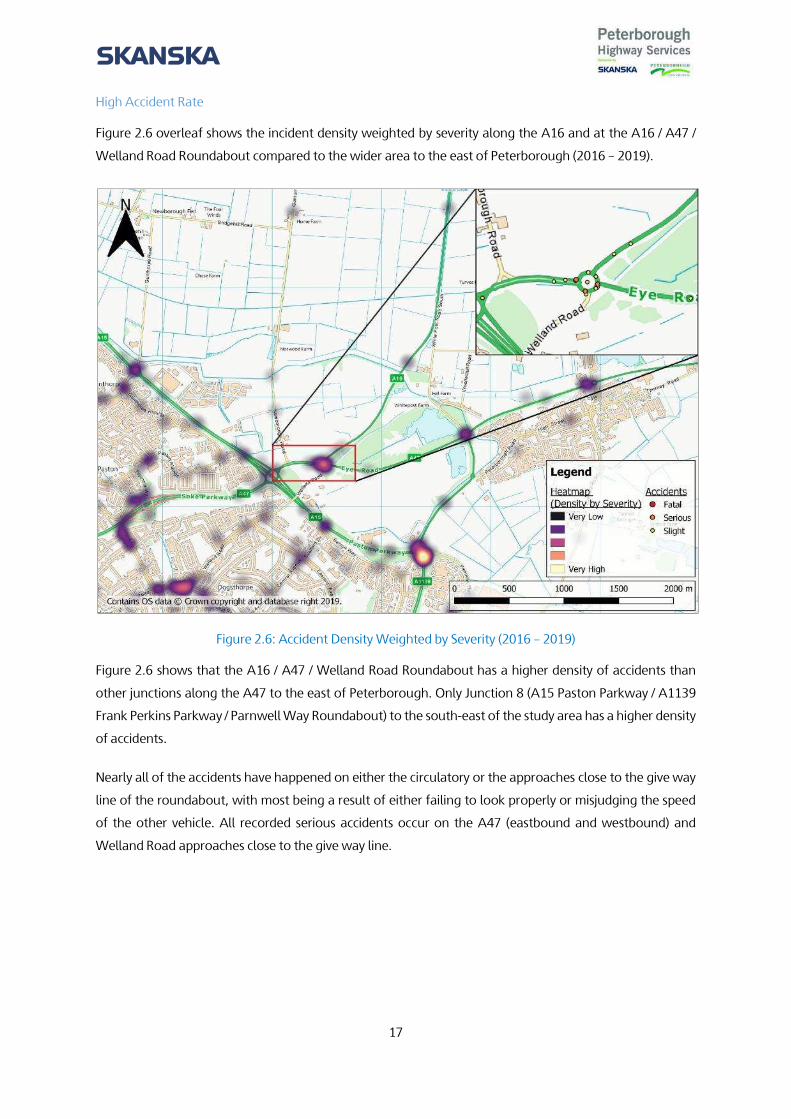
High Accident Rate
Figure 2.6 overleaf shows the incident density weighted by severity along the A16 and at the A16 / A47 /
Welland Road Roundabout compared to the wider area to the east of Peterborough (2016 – 2019).
Figure 2.6: Accident Density Weighted by Severity (2016 – 2019)
Figure 2.6 shows that the A16 / A47 / Welland Road Roundabout has a higher density of accidents than
other junctions along the A47 to the east of Peterborough. Only Junction 8 (A15 Paston Parkway / A1139
Frank Perkins Parkway / Parnwell Way Roundabout) to the south-east of the study area has a higher density
of accidents.
Nearly all of the accidents have happened on either the circulatory or the approaches close to the give way
line of the roundabout, with most being a result of either failing to look properly or misjudging the speed
of the other vehicle. All recorded serious accidents occur on the A47 (eastbound and westbound) and
Welland Road approaches close to the give way line.

18
2.5. Impact of Not Changing
As highlighted above, Norwood and Paston reserve are identified as an area of growth in the Peterborough
Local Plan, with residential expected to come forward before 2036.
Without intervention, the existing issues of peak hour delay and congestion along the A16 and A47 will
deteriorate further. This will impact on the operational performance of the highway network across the
study area, and compromise the viability of local growth aspirations within the Norwood area.
The Peterborough Transportation Model (PTM3) model has been used to assess conditions within the
Norwood study area in future years should the growth occur without any highway improvements (Do
Minimum (DM) Scenario).
PTM3 was developed using SATURN (v11.4.07H), which is a suite of network analysis programs. SATURN
allows the user to model baseline and future year traffic conditions, such as traffic volumes, capacities and
delays, at a strategic level and analyse the impact of potential road-investment schemes.
PTM3 has been constructed to represent the morning (08:00 - 09:00), Inter (14:00 - 15:00) and evening
(17:00 - 18:00) peak hours, to reflect the most congested time periods across Peterborough’s network, and
it models cars, LGVs, HGVs and buses. The base model was validated using traffic count and travel time data
from 2019.
The PTM3 forecast models use the base model and applies traffic growth sourced from the Department for
Transport's Trip End Model Presentation Program (TEMPro), National Road Traffic Forecasts (NRTF) and trip
rates for local developments. Forecast growth has been calculated for 2026, 2031 and 2036 to align with
the Local Plan.
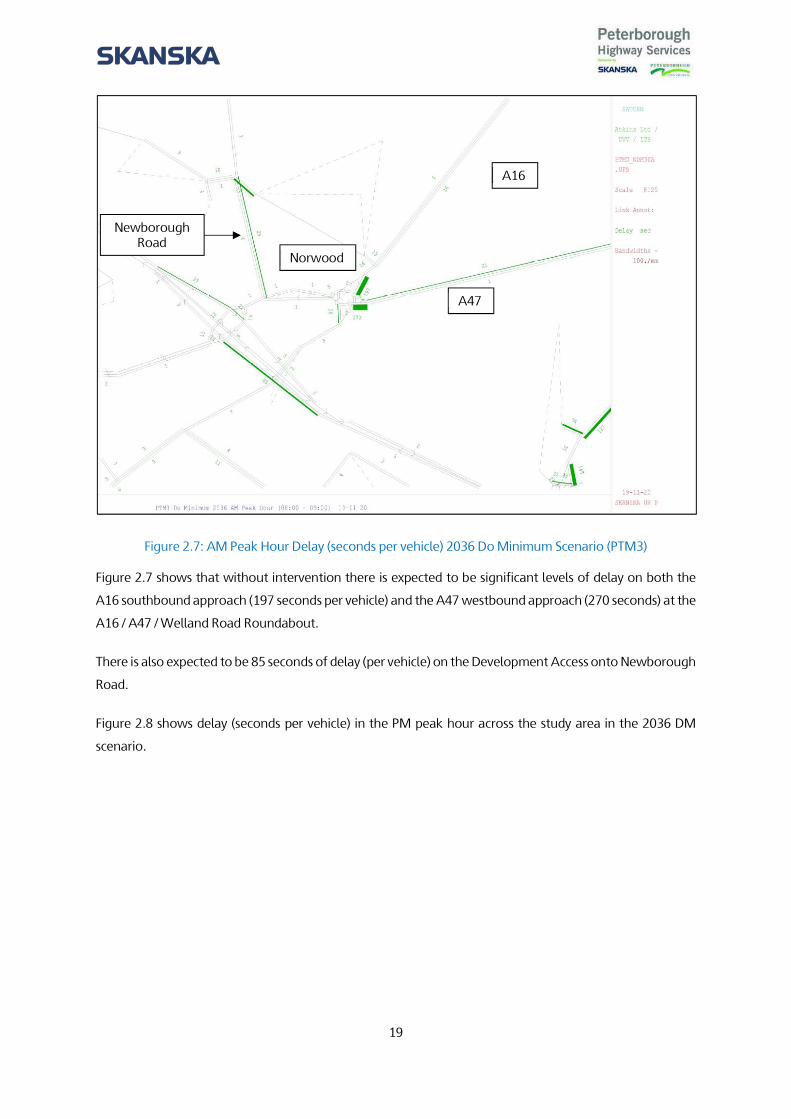
Figure 2.7 shows delay (seconds per vehicle) in the AM peak hour across the study area in the 2036 DM
scenario.
19
Figure 2.7: AM Peak Hour Delay (seconds per vehicle) 2036 Do Minimum Scenario (PTM3)
Figure 2.7 shows that without intervention there is expected to be significant levels of delay on both the
A16 southbound approach (197 seconds per vehicle) and the A47 westbound approach (270 seconds) at the
A16 / A47 / Welland Road Roundabout.
There is also expected to be 85 seconds of delay (per vehicle) on the Development Access onto Newborough
Road.
Figure 2.8 shows delay (seconds per vehicle) in the PM peak hour across the study area in the 2036 DM
scenario.
A16
A47
Newborough Road
Norwood

20
Figure 2.8: PM Peak Hour Delay (seconds per vehicle) 2036 Do Minimum Scenario (PTM3)
Figure 2.8 suggests that delay is less pronounced in the PM peak hour, however delay is evident on the A47
eastbound in several places. Existing and future issues of delay are expected to be at their worst during the
AM peak hour. This is as a result of the tidal nature of traffic entering Peterborough during the morning
peak hour, when more vehicles use the A16 southbound and A47 westbound approaches towards
Peterborough.
Likelihood Accidents will Increase
There is an increasing likelihood that accidents at the A16 / A47 / Welland Road roundabout will rise. As
shown above, the forecast increase in delay and travel time is expected to rise which will entail more
stopping and starting on approach to the roundabout.
Attractiveness of Norwood as a place to live and Peterborough as a place to work will decrease
The A16 corridor provides a main access point to the east of Peterborough, which contains many businesses
and developments that will be affected by its operation. As traffic, queueing and delays increase, it is likely
the area will become more congested in peak times. Businesses and their employees in the east of
Peterborough will increasingly become frustrated with the difficulty of accessing and exiting their premises
and may look to relocate or work elsewhere.
A16
A47
Newborough Road
Norwood

21
This may also have a detrimental impact on the Council’s objective for Peterborough to be an attractive
place to live and work. If residents and employees experience increased journey times around the city when
accessing employment opportunities, they may choose to work elsewhere. In addition, companies looking
to relocate to the city may instead consider other towns and cities with better transport conditions.
The location of Norwood by the A47 and A16, and the impact of delay and congestion along the A16 and
at the A16 / A47 / Welland Road Roundabout (often encouraging commuters to reroute via the A1139 Eye
Road during the peak periods) means that issues at this location have an impact across the east of
Peterborough, and also on strategic long distance trips that have no suitable alternatives for east-west
travel.
2.6. Internal Drivers for Change
Internal drivers for change are the factors that are driving the need for change, and come from the scheme
promoter. Examples include aspirations for growth, or increasing network resilience. In this instance, the
scheme promoters are the CPCA and Peterborough City Council.
The internal drivers for improvements along come from local growth aspirations, and the structured
framework of support provided by the CPCA to enable this growth to be realised.
Local Growth Aspirations
Peterborough is forecast to experience significant employment and population growth over the next few
decades, reflecting a continuation of past trends. Peterborough is one of the fastest growing cities in
England, with 19,440 new homes required between 2016 and 2036. This level of growth will in turn
strengthen the city’s economy, contribute to regional growth, and increase the demand for travel on the
local network.
Peterborough strives to become a “destination of choice”, and to be continually recognised as a regional
centre. With the attractiveness of the city set to increase as a place to live, work, and travel, this in turn
creates pressure related to housing and employment growth. The consequence of this is increased strain on
the cities’ transport infrastructure. Improving the existing infrastructure to enable Peterborough’s strong
history of growth to continue is the primary internal driver for change within the A16 Norwood area.
It is acknowledged by the Council that if no changes are made to existing congestion and delay on major
routes across the city, then growth aspirations will be compromised. The Local Transport Plan identifies the
major infrastructure requirements that are needed to address existing capacity constraints on the network,
and those that are required to enable the travel demand to increase in accordance with the city’s growth
aspirations. Longer-term highway improvements along the A16, such as partial dualling at the southern
end, are considered key to the CPCA’s Local Strategy for Peterborough.

22
Combined Authority Support
The CPCA has identified a number of strategic projects which it believes will provide transformational
benefits for the area. This feasibility study for highway improvements along the A16 corridor is one of the
studies shortlisted as a priority and was begun in the 2017 / 2018 financial year.
The CPCA recognises that the development of a wider, multi-year pipeline of transport schemes can also
contribute towards its objectives. The benefits of such a pipeline include:
The provision of a steady flow of transport improvements over the short, medium, and long term
including potential strategic projects of the future
Greater opportunity to consider local issues and spread investment around the Combined Authority
area
Early investment in the development of schemes places the Combined Authority in a strong position
to bid for and secure additional funding as alternative sources become available.
In order to facilitate the pipeline of work, the process includes initially exploring the feasibility of schemes,
and then developing business cases. These are essential steps in defining an improvement and securing
funding for its realisation.
In October 2017 the CPCA methodology was set out for prioritising investment, which was based on the
criteria shown in Table 2.2 below.
Table 2.2: Combined Authority Criteria
Case Criteria
Strategic Reduce congestion Unlock housing and jobs
Economic Scale of impact Value for money
Financial Other funding sources / contributors
Management Delivery certainty Project risks Stakeholder support
The A16 corridor has been prioritised for investment by the CPCA, and the CPCA’s investment strategy is
another internal driver for change, and an enabler for a scheme to be developed at this location.

23
2.7. External Drivers for Change
External drivers for change are factors that are driving the need for change, that are outside of the scheme
promoter’s organisation. Examples include public opinion, legislative changes, or response from other
events.
The A47 Alliance
The A47 Alliance is an campaign group consisting of 19 organisations including Local Authorities, Local
Enterprise Partnerships, Chambers of Commerce and the RAC Foundation, with wider support from
businesses and stakeholders along the A47. Its primary objective is to campaign for full dualling along the
A47, which will:
Boost the regional economy as a result of new employment
Unlock housing developments planned along the route
Reduce additional costs to businesses from as a result of delays along the A47
Improve productivity.
Improvements at the A16 / A47 / Welland Road Roundabout will be necessary in order to:
Boost the attractiveness of the east of Peterborough as an employment area through reducing
delays and queueing along the A47
Unlock planned growth in the Norwood area
Reduce additional costs to businesses in the east of Peterborough through reducing delays and
queueing along the A47.
Improvements at the junction at the A16 / A47 / Welland Road Roundabout will be considerate of future
aspirations for dualling from this junction to the east.

24
2.8. Scheme Objectives
A transport scheme can have both primary and secondary objectives. The primary objectives are the
fundamental outputs required from the scheme and therefore must be achieved. Secondary objectives are
other outputs that are achieved along the way, but are not necessary to the success of the scheme. The
secondary objectives tend to be delivered as a consequence of delivering the primary objectives.
The primary objectives therefore represent the transport outcomes required by the scheme.
The objectives of for A16 Norwood improvement scheme were developed ahead of the Option
Development Workshop to provide a framework against which to score potential options. The objectives
are based on the goals and outcomes from local policy documents such as the Peterborough Local Plan.
Although some of these objectives pre-date those of the CPCA, all closely align to, or match existing CPCA
objectives:
Primary objectives include:
Tackle congestion and improve journey times: Tackle congestion and reduce delay along the A16
and on the primary approaches to the A16 / A47 / Welland Road Roundabout
Support Peterborough’s growth agenda: Ensure that the planned employment and housing
growth at Norwood can be realised
Limit impact on the local environment and improve biodiversity: Fully mitigate any adverse
environmental impacts of a scheme, and ensure a biodiversity net gain within the study area.
Secondary objectives include:
Positively impact traffic conditions on the wider network: Positively impact the performance of
local routes impacted by the traffic and congestion in and around the A16 corridor, such as the
A47, A15 Paston Parkway, A1139 Eye Road and Newborough Road.
Improve road safety: Reduce accidents and improve personal security for all travellers within the
study area.
Improve sustainable transport infrastructure: Ensure that the scheme provides a comprehensive
network of pedestrian and cycling routes where needed.
Any schemes developed for the A16 Norwood Improvement study will need to satisfy all of the primary
objectives, and as many of the secondary objectives as possible.
Both the CPCA and Peterborough City Council have committed to combatting climate change and moving
towards net zero carbon emission in communities and economies, as well as to protect and increase
biodiversity. Any transport scheme must take this into account and work towards these objectives.

25
Any scheme identified for the A16 Norwood study area will look to mitigate any carbon emission and
biodiversity issues throughout the design stage in a number of ways, including but not limited to:
Tree planting
Improvements to localised sustainable transport routes
Use of sustainable material in construction
Improved ways of working.
All Peterborough City Council decisions require a Carbon Impact Assessment to be undertaken prior to a
project being given the go ahead. This is one of the governance steps the council has set up in relation to it
declaring a climate emergency (net zero by 2030), which details what benefits and implications there could
be and mitigation measures.
The scheme objectives were compared and aligned to the CPCA objectives and the Council’s strategic
priorities (also shared by the Council’s Core Strategy, Local Plan and the CPCA Local Transport Plan), and is
illustrated in Table 2.3 below.

26
2.9. Measures of Success
Table 2.3 beneath sets out the measures for success against which any potential improvements should be
monitored. The primary objectives are shown in white and the secondary objectives are shown in blue.
Table 2.3: Study Objectives and Measures of Success
Objective Scheme Outcome
Tackle congestion and improve journey times
Reduced congestion and delay on the approaches to the A16 / A47 / Welland Road Roundabout.
Support Peterborough’s growth agenda
Ensure successful delivery of committed and statutory development at Norwood, through increasing capacity on the road network, in order to cater for existing and future traffic demand.
Limit impact on the local environment and improve
biodiversity
Mitigate and offset any detrimental environmental impacts of a scheme, and enhance natural and historic features around the scheme at all opportunities.
Positively impact traffic conditions on the wider
network
Positively impact the interaction the A16, A47 and A1139, and reduce delay within the wider area.
Improve road safety Reduce accidents across all modes of transport.
Improve sustainable transport infrastructure
Provide increased pedestrian and cycling connectivity within the local area.

27
2.10. Constraints
The following constraints have been identified:
Funding: The cost of the scheme will need to compete with other transport infrastructure funding
priorities which may exceed the CPCA’s core transport investment budget allocation
Environmental: Land to the east of the A16 is identified as a being a Site of Special Scientific
Interest, as shown below in Figure 2.9 (below), and is an important wildlife site. Scheme design will
need to be mindful of this.
Structural / Highway Boundary: Improvements will need to be achievable within the land
available.
HE Agreement and Permissions: Essential improvements that form part of the preferred package
are located along the A47. HE agreement and permissions will be essential to deliver the scheme,
and early engagement will be undertaken as a priority.
Disapproval from the Public or Stakeholders: The scheme should not be considered controversial,
and should be capable of gaining support during stakeholder and public consultation
COVID-19: it is not yet known what long term impact the COVID-19 pandemic will have on how the
general public will interact with transport systems moving forward. Data collection from the
Peterborough area demonstrates that peak hour road traffic is currently back to approximately
90% of pre COVID-19 levels, and this will continue to be monitored as further work is undertaken
to develop the scheme. Specific COVID-19 sensitivity tests will be undertaken as part of the
Economic Assessment reported at OBC.
Figure 2.9: Site of Special Scientific Interest (SSSI) within the A16 Norwood Study Area

28
2.11. Interdependencies
Improvements along the A16 corridor are required as part of planning applications at the Norwood Urban
Extension, to accommodate new housing. The developer is required to make the following improvements:
New access roundabout with the A16
New access priority junction with Newborough Road.
These improvements are being considered as part of the wider option development and assessment, and
are considered necessary for traffic from the development to be able to access and interact with the wider
network as planned.
2.12. Key Risks
The scheme is considered to be low risk in construction terms. However, the COVID-19 pandemic saw a
significant drop in highway usage during the national lock-down earlier in the year. It is not yet known what
long term impact the COVID-19 pandemic will have on how the general public will interact with transport
systems moving forward.
Data collection from the Peterborough area demonstrates that peak hour road traffic is currently back to
approximately 90% of pre COVID-19 levels, and this will continue to be monitored as further work is
undertaken to develop the scheme. A low growth scenario sensitivity test has been undertaken to measure
the scheme benefits against a scenario where traffic growth doesn’t match pre-COVID-19 levels.
Other key strategic risks identified include:
Delay to decision on scope of scheme
Project progress on hold
Delay in obtaining approval to commence the next stage
Delay in sign off of grant agreement
Delay to project
Not coming to an agreement with developer
Delay to delivery of the development
Appendix C contains the Project Key Risk Register which identifies each of these risks and considers
mitigation. The Risk Register is a live document which is managed by Peterborough City Council and
reviewed regularly by the CPCA.

29
2.13. Stakeholders
The key stakeholders are considered to be:
Cambridgeshire and Peterborough Combined Authority (CPCA)
Peterborough City Council (The Council)
Highways England
Norwood Developers
Ward Councillors and local residents, including those along Newborough Road
English Heritage
Emergency Services
Land owners and Businesses affected by the scheme.
Engagement and communication with key stakeholders is an essential element of the planning process for
major transport schemes. Stakeholder’s needs and requirements should be considered as part of the final
scheme design.
The CPCA and Peterborough City Council are directly involved in developing the scheme. Public consultation
will be undertaken at the next stage of the scheme development, and results from the exercise will be
reported in the OBC.
Stakeholder engagement with the HE has begun as part of the SOBC, and within the context of the Leeds
Farm Planning Application (part of the Norwood Development). Peterborough City Council are also in the
process of formally engaging with the different land owners within the Norwood site about the proposed
scheme.
2.14. Powers and Consents
Peterborough City Council is the local highway authority and have all the necessary powers under the
Highways Act 1980 to undertake the works within their highway boundary. These powers extend to Skanska
under the PHS contract, which was granted following a full competitive tendering process.
Any improvement works on the A47 will require consent from Highways England, and early dialogue has
started with representatives from Highways England to look at all scheme improvements.
2.15. Option Development and Assessment
An option development workshop was held on the 24th February 2020 and attended by representatives
from Skanska and Peterborough City Council. The workshop reviewed the existing conditions and issues
within the A16 Norwood improvement scheme study area, explored its relationship with the surrounding
road network and various constraints, and discussed planned growth at the site. The purpose of the
workshop was to develop potential improvement options to be considered within this study.

30
A total of nine options were devised, with potential schemes ranging in estimated cost and potential level
of impact on the network. These nine options form the ‘Long List’, and are summarised in Table 2.4.
Table 2.4: Long List of Options for A16 Norwood Improvement Scheme Study
A47 / Newborough Road Priority Junction
Signalisation of A47 / Newborough Road Junction to make it all movement
Creation of a roundabout at the A47 / Newborough Road Junction
Tunnel Newborough Road under the A47
Closure of Newborough Road between the A47 and Norwood Lane
A16
Roundabout on the A16 at Norwood eastern development access
Dual A16 between A16 / A47 / Welland Road Roundabout and Norwood Development Access
A16 / A47 / Welland Road Roundabout
Full signalisation of A16 / A47 / Welland Road Roundabout
Expand existing roundabout and create a ‘Hamburger’ style junction
Dedicated left turn from A47 to A16
EAST Assessment
The DfT’s Early Assessment and Sifting Tool (EAST) was used to assess the Long List of options against
objectives to discount any schemes that are not considered to meet the fundamental scheme objectives.
The objectives used in the EAST assessment were formulated to reflect CPCA, Peterborough City Council
and scheme objectives, as well as other factors which can influence the deliverability of a scheme (such as
likely public and stakeholder support). Scores were based on the discussion and collective opinion of the
workshop delegates. The objectives used are outlined in Table 2.5 beneath.

31
Table 2.5: Scheme Objectives
Strategic Objectives
Ability to reduce congestion/ improve journey times
Making the best use of existing infrastructure
Ability to make Safety Improvements
Ability to support the local growth agenda, including housing and employment growth
Economic Objectives
Affordability (Value for Money)
Scale of impact on local environment (ecology, noise, air)
Management / Deliverability Objectives
Land Acquisition and CPO
Scheme Risk / Buildability
Stakeholder Support and public acceptability
The EAST scoring assessment is reported within the OAR. Scores were given in relation to the proportion of
the expected impact on the entire junction and not just the section of road it occurs on. A neutral score was
given when the score against an objective is uncertain, or there is a comparable negative and a positive
element associated with the scheme.
2.16. Shortlisting Summary
Table 2.6 summarises the EAST assessment and identifies which options were shortlisted for inclusion within
the traffic modelling. Following the Option Development Workshop, discussions between Peterborough
City Council and developers confirmed that Option 5 (Roundabout on the A16 at Norwood eastern
development access) would be delivered by the developer as part of their planning obligation. Consequently
this has been removed from the option testing and included within the DM scenario.
.

32
Table 2.6: Option Shortlisting Summary
Option Option Description EAST Score Shortlisted
1 Signalisation of A47 / Newborough Road Junction to make it all movement 10
2 Creation of a roundabout at the A47 / Newborough Road Junction 3
3 Tunnel Newborough Road under the A47 -1
4 Closure of Newborough Road between the A47 and Norwood Lane 16
5 Roundabout on the A16 at Norwood eastern development access 7
6 Dual A16 between A16 / A47 / Welland Road Roundabout and Norwood Development Access 11
7 Full signalisation of A16 / A47 / Welland Road Roundabout 11
8 Expand existing roundabout and create a ‘Hamburger’ style junction 0
9 Dedicated left turn from A47 to A16 7

33
Technical and Economic Assessment (Shortlisting)
The technical assessment of shortlisted options has been undertaken using the PTM3 model, and is reported
in the A16 Norwood OAR. Note that the improvements discussed within this chapter are highway
improvements, but that further design work will also identify sustainable transport improvements to
compliment the internal layout of the Norwood Development (once known). These will provide pedestrians
and cyclists with a high standard of connectivity between the development and the wider transport
network.
PTM3 has been developed using SATURN (Version 11.4.07), a traffic and assignment model which can be
used to evaluate potential traffic schemes. Saturn focuses on whether a defined network can cope with a
defined vehicle demand in a defined period of time.
The Saturn traffic model has been constructed to represent the morning (AM) peak hour from 08:00 to
09:00, and an evening (PM) peak hour from 17:00 to 18:00, in order to represent the most congested time
periods. In addition, an Inter-Peak (14:00 to 15:00) model has also been constructed to understand the
impact of any improvements outside of the congested periods of the day.
PTM3 has a 2019 baseline, and the model is validated and calibrated to ensure it represents the traffic
conditions experienced on the network during the survey period.
To understand traffic conditions in future years, growth factors have been derived from the DfT’s Trip End
Model Presentation Program (TEMPro) from the appropriate National Trip Ends Model (NTEM) zone for
each traffic input zone to the network in the forecast years 2026, 2031 and 2036. Local growth of LGV and
HGV traffic has been estimated using 2015 Road Traffic Forecast data produced from the National Transport
Model (NTM).
Do-Minimum (DM) models for 2026, 2031 and 2036 have been produced to enable an assessment of the
options and a comparison to what would happen if no transport intervention(s) were delivered.
The technical assessment undertaken at this stage of the Norwood Access Study has concentrated on the
2036 future year to capture the full impact of the Local Plan growth.
Package Development
Two packages of options were developed to address the existing and future issues identified within the
study area, and were based on options considered within the Option Development Workshop. The Packages
differ in the improvements proposed for the A16 / A47 / Welland Road Roundabout.
Each of the packages build from a common starting point, which has been broken down into a series of
stages that are discussed below.

34
Stage 1
Based on the observations from existing conditions, and the DM modelling, the first stage in the package
development was to close Newborough Road’s access onto the A47, effectively removing this junction from
the Strategic Network. As a result of this closure, access to the Norwood area (and beyond) is provided via
the following locations:
A16 and Developer Roundabout (predominantly for Norwood)
Junction 21 (A15 Paston Parkway) and Manor Drive (predominantly for Paston Reserve)
A16 / A15 and B1443 (predominantly for Newborough).
Stage 2
To address the delay caused by an increase in traffic flow from the Norwood site, the 500m section of the
A16 between the developer roundabout the A16 / A47 / Welland Road Roundabout was then dualled (in
both directions).
This option successfully removed the link delay along the A16 between the two roundabouts, and
expectedly increased the level of delay on the A16 southbound approach to the A16 / A47 / Welland Road
Roundabout as reduced congestion on the A16 meant that vehicles were moved more efficiently along the
link.
Stage 3
Having addressed the distribution and routing issues created by the Newborough Road access onto the A47,
different options were considered to reduce delay at the A16 / A47 / Welland Road Roundabout. It is at this
point that the two packages emerged, each containing the interventions discussed above, but differing in
their approach to addressing delay at the A16 / A47 / Welland Road Roundabout. The different packages
were based on:
Package 1: Partial signalisation of the A16 / A47 / Welland Road Roundabout (at-grade
improvements)
Package 2: New Grade Separated Junction (grade separated improvements)
Each package was developed iteratively, with different components added to address specific issues
identified by the transport modelling. For example, partial signalisation of the A16 / A47 / Welland Road
Roundabout led to an increase in delay during the PM peak hour on the A47 eastbound approach, with left
turning vehicles (towards A16 northbound) disproportionately affected. Consequently a Left Dedicated
Lane (LDL) from the A47 to the A16 was incorporated into the package, which removed the delay.
The packages in full consisted of the following schemes.
Package 1:
Closure of Newborough Road access onto A47

35
Dualling of A16 between A16 / A47 / Welland Road Roundabout and the Norwood Development
Access
Partial signalisation of A16 / A47 / Welland Road Roundabout on the A16 southbound approach
A 50 metre flare added to the A47 westbound approach to provide additional capacity for left
turning traffic to Welland Road
Dedicated Left Turn Lane (LDL) from the A47 eastbound to the A16 northbound.
Package 2:
Closure of Newborough Road access onto A47
Dualling of A16 between A16 / A47 / Welland Road Roundabout and the Norwood Development
Access
Creation of a Grade-separated junction at the existing A16 / A47 / Welland Road Roundabout.
The technical and economic assessment of both options identified that Package 1 was the preferred option.
These assessments are reported in full in the OAR, and are summarised beneath.
Technical Assessment
Figure 2.10 below shows the change in delay (per vehicle) between the 2036 DM scenario and Package 1
during the AM peak hour. Note that blue denotes a decrease in delay as a result of Package 1, and green an
increase in delay.
A16
A47
Newborough Road
Norwood

36
Figure 2.10: 2036 AM Peak Hour Change in Total Delay (seconds per vehicle) – Package 1 impact on DM Scenario
Figure 2.10 shows that Package 1 is expected to have a significant improvement to the level of delay
experienced on the A16 southbound approach to the A16 / A47 /Welland Road Roundabout, with delay
reduced by 180 seconds per vehicle compared to the DM scenario.
The A47 westbound approach also demonstrates a decrease in delay of 256 seconds per vehicle compared
to the DM Scenario.
Figure 2.11 below shows the change in traffic demand flow between the DM scenario and Package 1 in the
AM peak hour.
Figure 2.11: 2036 AM Peak Hour Change in Demand Flow – Package 1 impact on DM Scenario
Figure 2.11 demonstrates that the measures contained within the package successfully remove trips from
Newborough Road, including u-turning traffic at the A16 / A47 / Welland Road Roundabout. As these trips
re-route, there is an increase in traffic flow along the A16, however delay along this route is significantly
reduced as demonstrated in Figure 2.10.
A16
A47
Newborough Road
Norwood

37
Package 1: 2036 PM Peak Hour Results
Figure 2.12 below shows the change in delay (per vehicle) between the 2036 DM scenario and Package 1
during the PM peak hour. Note that blue denotes a decrease in delay as a result of Package 1, and green an
increase in delay.
Figure 2.12: 2036 PM Peak Hour Change in Total Delay (seconds per vehicle) – Package 1 impact on DM Scenario
Figure 2.12 shows that Package 1 has a negligible impact on delay during the PM peak hour as the issue of
congestion is less pronounced in this time period. There is a 15 second increase on the northern circulatory
of the A16 / A47 / Welland Road Roundabout which is transient delay associated with the installation of
traffic signals.
Economic Assessment
The Economic Assessment undertaken as part of the Option Assessment Report calculated a Benefit to Cost
Ratio (BCR) for Package 1 (including a sensitivity test) and Package 2. The sensitivity test considered the
impact of operating the partial signalisation of the A47 / A16 in Package 1 on a part time basis (i.e. signals
switched off outside of peak hours, and the junction reverts back to priority rules). From this point on the
A16
A47
Newborough Road
Norwood

38
scenario in which the Package 1 traffic signals operate full time is named Package 1a, and the scenario in
which the traffic signals operate on a part time basis is named Package 1b.
A comparison of the results from this assessment are presented in Table 2.7 beneath.
Table 2.7: Economic Assessment AMCB Comparison
The Economic Assessment within the OAR demonstrated that Package 1 (both 1a and 1b) will provide High
Value for Money. Package 2 is expected to provide Poor value for money, due to the significantly higher
cost compared to Package 1.
2.17. Option Assessment Summary
The Option Assessment identified two packages of options to remove u-turning trips from Newborough
Road and address existing and future delay on the A16 southbound and A47 westbound approach to the
A16 / A47 / Welland Road Roundabout.
Both packages of options performed quite similarly within the technical assessment, and successfully
resulted in transferring trips from Newborough Road onto the A16, and reducing delay on the two
approaches where significant delay is forecast in the DM scenario.
An Economic Assessment was undertaken on the two packages, as reported in the OAR, and identified that
Package 1 is the preferred option as it returned a positive value for money (in both the 1a and 1b tests).
Further details of the Package 1 Economic Assessment are reported in the Economic Case in the following
chapter.
Value (£’000s) 2010 prices, benefits discounted to 2010
Package 1a(Full Time Signals)
Package 1b (Part Time Signals) Package 2
Greenhouse Gases -1 13 -17Consumer Users (Commuting) 4,168 4,531 1,521
Consumer Users (Other) 5,442 7,657 5,144Business Users/Providers 5,476 6,656 6,601
Indirect Taxes 53 23 56Present Value of Benefits (PVB) 15,138 18,880 13,305
Broad Transport Budget 4,757 4,757 22,035Present Value of Costs (PVC) 4,757 4,757 22,035
Net Present Value (NPV) 10,381 14,123 -8,730Benefit/Cost Ratio (BCR) 3.182 3.969 0.604
Value for Money Statement High High Poor
Benefits
Costs
Net Benefit / BCR Impact

39
3. The Economic Case
3.1. Introduction
This section sets out the approach taken to assess the economic case for the A16 Norwood improvement
scheme, and demonstrates that the proposed scheme would offer High Value for Money.
The scheme appraisal focuses on the aspects of scheme performance that are relevant to the nature of the
intervention and uses the latest WebTAG guidance (July 2020). These impacts are not limited to those
directly impacting on the economy or those which can be monetised. The economic, environmental, social
and distributional impacts of the proposal are all examined, using qualitative, quantitative and monetised
information where appropriate.
3.2. Options Appraised
Details of the option development and assessment process are summarised in the Strategic Case and full
details are provided in the OAR.
The technical assessment documented in the OAR has identified that both packages assessed within the
modelling offered network wide benefits and performed similarly, and so an Economic Assessment was
undertaken for each package. The Economic Assessment concluded that only Package 1 would return a
positive value for money. The Economic Assessment for Package 1 is reported throughout this chapter, and
details of the Economic Assessment undertaken for Package 2 (which offered Poor Value for Money) are
contained within the OAR.
For reference, Package 1 consisted of the following components:
Closure of Newborough Road access onto A47
Dualling of A16 between A16 / A47 / Welland Road Roundabout and the Norwood Development
Access
Partial signalisation of A16 / A47 / Welland Road Roundabout on the A16 southbound approach
A 50 metre flare added to the A47 westbound approach to provide additional capacity for left
turning traffic to Welland Road
Dedicated Left Turn Lane (LDL) from the A47 eastbound to the A16 northbound.
Note that two variants of Package 1 have been tested. The first is Package 1a which operates the A47 / A16
Welland Road traffic signals on full time, and the second is Package 1b which operates these signals during
the peak hours only, beyond which the junction reverts to priority rules.

40
3.3. Economic Assessment
Approach to Appraisal
Given the nature of the scheme, which consists of highway improvements to existing road infrastructure,
the Economic Case is focused on the following aspects:
Assessing the monetised direct, localised and economic efficiency benefits of the scheme
Qualitative appraisal of wider scheme benefits, such as an environmental, noise, and
enablement of planned development
Offsetting identified benefits against the scheme costs to provide a Benefit to Cost (BCR) ratio.
Details regarding the benefits and costs are presented beneath.
The transport benefits of the scheme were assessed using the SATURN based PTM3. The model / appraisal
forecast years developed in the SATURN model are 2021, 2026 and 2031, which have been used to appraise
the impacts of the core scenario.
Full details relating to the calibration and validation of the model can be found in the Local Model Validation
Report (LMVR), and details about the forecasting procedure can be found in the Forecasting Report.
The key objective of the SATURN model is to forecast, accurately, the likely transport impacts that the
proposed schemes would have on highway users of the surrounding road network. User benefits can be
calculated by modelling the highway network, in various years, and comparing with / without scheme
scenarios to determine how introducing a scheme will impact on travel behaviour and patterns.
The model analysis provided in the OAR demonstrates that Package 1 will reduce congestion, leading to
less delay and travel time. The difference between the DM and Package 1 scenario demonstrates the
benefits of implementing the scheme.
The model output files were then entered into the Transport User Benefits Appraisal (TUBA, 1.9.13)
software to undertake the Economic Assessment and calculate a BCR. The annualisation factors shown
below in Table 3.1 were specified within TUBA to calculate the likely annual transport user benefits for the
AM, Inter and PM peak hours and have been derived from nearby Highways England WebTRIS data. It was
found that the 07:00 – 08:00 and 16:00 – 17:00 hour flows closely resembled the total flows observed within
the modelled AM and PM peak hours. AM and PM annualisation factors have therefore been calculated
that convert the single peak hour demand to annual peak period demand.

41
Table 3.1: Annualisation Factors
A proportionate approach focused on transport user benefits (Transport Economic Efficiency, TEE) has been
undertaken to demonstrate the value for money that can be expected from the scheme.
Package Phasing
The technical and economic assessment undertaken in the OAR identified the need to phase delivery of the
various components within Package 1. This determined that Package 1 should include the closure of the
Newborough Road access onto the A47 by 2026, and the remaining schemes within the package from 2031
onwards (built between 2026 – 2031), as shown in Table 3.2 beneath.
Table 3.2: Package Phasing within Strategic Modelling
Assessment Year Package 1
2026 Closure of Newborough Road access onto A47.
2031 & 2036
Closure of Newborough Road access onto A47
Dualling of A16 between A16 / A47 / Welland Road Roundabout and the Norwood
Development Access
Partial signalisation of A16 / A47 / Welland Road Roundabout on the A16 southbound
approach
A 50 metre flare added to the A47 westbound approach to provide additional capacity for
left turning traffic to Welland Road
Dedicated left turn lane from the A47 eastbound to the A16 northbound.
Table 3.3 shows the cost profile used within the Economic Assessment for Package 1, which is derived from
the broader project programme.
Time Slice Duration (min) Annualisation Period Description
1 60 488 1 Convert from 08:00 – 09:00 to annual
07:00 – 09:00 period
2 60 525 2 Convert from 17:00 – 18:00 to annual
16:00 – 18:00 period
3 60 1,624 3 Convert from 14:00 – 15:00 to annual
10:00 – 16:00 period

42
Table 3.3: Package 1 Cost Profiles
The activities shown in Table 3.3 include:
2021 – Preliminary Design and Outline Business Case
2022 / 2023 – Detailed Design and Full Business Case
2024 – Construction / Supervision of Closure of Newborough Road
2027 – Construction / Supervision of Remaining Schemes (Package 1)
2028 – Construction complete and scheme open for use.
Present Value Costs
A scheme cost estimate has been produced. The Base Investment Costs are detailed in Table 3.4 below, and
the subsequent steps taken to calculate the Present Value Costs (PVC) are described beneath.
The Economic Assessment has undertaken for a 60 year assessment period (2020 to 2080).
The Base Investment Cost is the capital cost required to construct the scheme in current year (2020) prices,
without a risk allowance. This is derived from the scheme cost estimate based on initial design information.
All Sunk Costs (those already incurred) have been omitted from the Economic Assessment.
Table 3.4 shows the Base Investment Cost profiled over calendar years, and broken down into Construction,
Land, Design and Supervision costs.
Calendar Year Preparation Costs (%) Construction Costs (%) Supervision Costs
2021 57%
2022 33%
2023 10%
2024 10% 9%
2025
2026
2027 90% 91%

43
Table 3.4: Base Investment Cost (2020 Prices)
Note that there are not expected to be any land or property costs associated with the scheme at this stage,
and that the Preparation and Supervision Costs include Business Case development, all design work
including site surveys and supervision during the construction phases.
The PVC for use in the Economic Assessment has been calculated using the following steps:
Real Cost increases were calculated based on the Base Investment Cost spend profile. The Base Cost
adjustment factor was calculated by dividing the Construction Industry Inflation Rate (5%) by the
Annual GDP Factor derived from the TAG Databook (July 2020) for each of the years within the
assessment period. The inflation rate of 5% was derived from construction output price indices as
well as knowledge of costs associated with past schemes in Peterborough. Peterborough Highways
Services works is measured using BCIS indices, Table 3.5 shows the categories and price increase
(%) for 2019-2020.
Table 3.5: Inflation increases on Construction Costs 2019-2020
A Risk Allowance of 20% (10% Construction Risk, 10% COVID-19 working practices) was then
applied during the years of construction. The total cost of the Risk Allowance is £655,943. The risk
associated with post-COVID19 includes altered working practices that meet social distancing
requirements, such as additional welfare facilities on site and increased site compound size.
Calendar Year Construction Costs (£)
Land & Property Costs (£)
Preparation / Supervision
Costs (£) Total (£)
2021 0 0 465,000 465,0002022 0 0 264,684 264,6842023 0 0 78,346 78,3462024 350,000 0 21,000 371,0002025 0 0 0 02026 0 0 0 02027 2,929,714 0 186,046 3,115,760Total 3,279,714 0 1,015,076 4,294,790
Category Price increase 2019-2020WC10/ 1 Routine, Cyclic and Time Charge Works 3.25%WC10/ 2 Renewals and Construction Works 1.81%WC10/ 3 Professional Services 3.62%WC10/ 4 Machine Surfacing 4.23%WC10/ 5 Hand Surfacing/Patching 3.04%WC10/ 6 Surface Dressing 5.38%WC10/ 7 Road Markings 1.76%WC10/ 8 Street Lighting 1.56%

44
Optimism Bias was then applied in line with guidance provided in TAG unit A1.2 (July 2017). An
Optimism Bias of 44% was applied to represent the maturity of the design. The total Optimism Bias
applied was £2,564,308.
Costs were then rebased back to 2010 using factors derived from the TAG Databook (July 2020)
GDP Deflator.
Costs were then discounted to 2010 in line with guidance provided in TAG unit A1.2 (July 2017).
Finally, costs were converted to 2010 Market Prices using a factor of 1.19.
Table 3.6 beneath shows the costs described above.
Table 3.6: Economic Case Scheme Cost Estimates
Present Value Benefits
The transport benefits of the scheme were assessed using the SATURN based PTM3 (built in v11.4.07H).
Full details relating to the calibration and validation of the model can be found in the Local Model Validation
Report (LMVR), and details about the forecasting procedure can be found in the Forecasting Report.
Two core network scenarios were developed for the Economic Assessment, these were the Do Minimum
(DM) and Do Something (DS) scenarios. The DM scenario represents future growth without highway
intervention (without scheme), and the DS scenario includes the package of schemes within the model
network (with scheme) with the same level of future traffic growth.
Description of Cost Type Cost (£)
Risk Adjusted Base Cost with Real Cost Increases and Optimism Bias 8,392,279
Base Investment Cost 4,294,790
Base Cost with Real Cost Increases 5,172,029
Risk Adjusted Base Cost with Real Cost Increases 5,827,972
Rebased to 2021 Price Year
Discounted to 2010 Prices
Adjusted to Market Prices
7,057,681
4,087,731
4,864,399

45
The difference between the DM and DS scenarios demonstrate the benefits of implementing the scheme.
These benefits are measured using:
Network assignment statistics
Link flow changes
Journey times
Journey routing.
The Model output files were then entered into the Transport User Benefits Appraisal (TUBA, 1.9.14)
software to undertake the Economic Assessment and calculate a BCR.
TUBA produces figures for a number of benefits, including Greenhouse Gases, Transport User benefits, and
Indirect Taxation. Indirect taxation often provides a negative benefit figure. This is a result of the reduced
fuel being purchased as journeys become more efficient with the improvements. This in turn reduces the
money the government receives in fuel taxes.
This identifies the Present Value Benefits (PVB) to be £15,138,000. A breakdown of these benefits are shown
in Table 3.6 beneath.
Benefit Cost Ratio
The Benefit Cost Ratio (BCR) is the ratio of PVB to PVC. Table 3.7 beneath summarises the BCR for the
scheme (Package 1a) as calculated using TUBA.
Table 3.7: A16 Norwood Improvement Scheme AMCB Table (Package 1a)
Value (£’000s) 2010 prices, benefits discounted to 2010
Benefits
Greenhouse Gases -1
Consumer Users (Commuting) 4,168
Consumer Users (Other) 5,442
Business Users/Providers 5,476
Indirect Taxes 53
Present Value of Benefits (PVB) 15,138 Costs
Broad Transport Budget 4,757 Present Value of Costs (PVC) 4,757
Net Benefit / BCR Impact Net Present Value (NPV) 10,381 Benefit/Cost Ratio (BCR) 3.182

46
The DfT uses the following thresholds to determine the Value for Money statement associated with a BCR:
Poor Value for Money if BCR < 1.0
Low Value for Money if BCR = 1.0 to 1.5
Medium Value for Money if BCR = 1.5 to 2.0
High Value for Money if BCR = 2.0 to 4.0
Very High Value for Money if BCR > 4.0.
Based on transport user benefits alone, this scheme will provide High Value for Money.
A sensitivity test undertaken on Package 1a to determine the impact of operating the partial signalisation
of the A16 / A47 / Welland Road Roundabout on a part time basis (peak hour only) identified that this would
increase the PVB to £18,880,000, generating a BCR of 3.969. The results from this Sensitivity Test, named
Package 1b, are provided beneath, and further details are provided in the OAR.
Table 3.8: A16 Norwood Improvement Scheme AMCB Table (Package 1b - Part Time Signals)
Value (£’000s) 2010 prices, benefits discounted to 2010
Benefits
Greenhouse Gases 13 Consumer Users (Commuting) 4,531
Consumer Users (Other) 7,657
Business Users/Providers 6,656 Indirect Taxes 23
Present Value of Benefits (PVB) 18,880 Costs
Broad Transport Budget 4,757 Present Value of Costs (PVC) 4,757
Net Benefit / BCR Impact Net Present Value (NPV) 14,123 Benefit/Cost Ratio (BCR) 3.969
Whilst the sensitivity test shows that part-time signals provide a higher BCR than full-time signals, the
implementation of full-time signals would be preferable from an operational point of view and would still
provide high value for money. Part-time signals, such as those on the A1 / A47 Wansford Junction, could
lead to increased driver confusion.

47
Spread of Benefits
The TUBA results include a detailed breakdown of the scheme benefits including (but not limited to) benefits
by time saving and benefits by distance. These benefits are broken down by vehicle type and journey
purpose to better understand how different user types will benefit from the scheme. Table 3.9 below shows
the time benefits saving by vehicle type.
Table 3.9: Non-monetised Time Benefits by Time Saving
Table 3.9 shows that car users experience the greatest time benefit from the implementation of the scheme
and that within car users, those that are undertaking other journeys (not for business or commuting)
experience the greatest impact, which is in keeping with the composition of trip types across the model.
Table 3.10 below shows the journey time benefits by distance.
Table 3.10: Non-monetised Time Benefits by Distance
The table shows that those making trips of between 10km - 25km and 25km – 50km benefit most from the
proposed scheme. As with the time savings, car users experience the greatest level of benefit, and these
apply mostly to those who commute or travel for other purposes.
Table 3.11 below shows that the scheme benefits are greater in the AM peak hour than in the PM peak
hour, but that both peak hours have benefits.
Table 3.11: User Benefits by Time Period
Vehicle Type Purpose Type < -5 mins -5 to -2 mins -2 to 0 mins 0 to 2 mins 2 to 5 mins > 5 minsCar Business 0 -61 -515 692 85 1Car Commuting 0 -306 -2091 2890 428 0Car Other -2 -477 -6076 8136 1119 0
LGV Freight -1 -71 -650 998 208 1OGV1 -7 -51 -290 459 157 7
NON MONETISED TIME BENEFITS BY TIME SAVINGTime benefits (thousands of person hours) by size of time saving
Vehicle Type Purpose Type < 1 km 1 to 5 kms 5 to 10 kms 10 to 25 kms 25 to 50 kms 50 to 100 kms 100 to 200 kms > 200 kmsCar Business 4 6 1 86 79 13 -1 14Car Commuting 16 -3 13 449 406 22 9 9Car Other 50 55 16 1146 816 244 61 311
LGV Freight 1 4 27 188 238 1 10 16OGV1 0 -4 -4 30 50 6 68 129
NON MONETISED TIME BENEFITS BY DISTANCETime benefits (thousands of person hours) by distance
Vehicle Type User TimeAM 11,378PM 1,838
User Benefits and Changes in Revenues (£'000s)

48
3.4. Additional Qualitative Appraisal
The scheme appraisal has focussed on the impacts directly impacting on the economy or those which can
be monetised. An initial qualitative analysis has been undertaken for environmental, social and
distributional impacts of the proposed scheme, and input in to an Appraisal Summary Table (AST) in
Appendix B.
The additional appraisal elements are detailed in Table 3.12 overleaf, along with the proposed assessment
approach for the next stage of the Business Case process.

49
Table 3.12: Additional Appraisal Elements
Element Approach to Assessment at OBC Comments
Road Safety
(Social)
Safe design and qualitative
assessment
A qualitative assessment will be undertaken at OBC to
provide an assessment of the likely impact that the
scheme will have on Road Safety (which is listed as an
objective).
Noise
(Environmental)
Quantitative assessment made
using the SATURN model outputs
A quantified assessment of the impact of the scheme
on Noise will be undertaken at OBC using outputs
from the PTM3 model.
Air Quality
(Environmental)
A quantified assessment of the impact of the scheme
on Air Quality will be undertaken at OBC using
outputs from the PTM3 model.
Landscape,
Townscape,
Historic
Environment,
Ecology and Water
Environment
Qualitative assessment to be
undertaken at OBC stage to inform
the design process
The scheme is not expected to have any detrimental
impact on any of these elements, and provides the
opportunity to enhance the landscape and
biodiversity.
Physical Activity
(Social) Qualitative The scheme will include improvements to pedestrian
and cycle infrastructure to improve provision and
increase connectivity. A qualitative assessment of
these will be undertaken at OBC. Access/Severance Qualitative
Due to the nature of the scheme, the appraisal and Value for Money statement has focused on TEE benefits
at this stage of the assessment.
3.5. Key Risks, Sensitivities and Uncertainties
The scheme is considered to be low risk in construction terms, especially since the required land is within
ownership of Peterborough City Council or Highways England.
As the benefits of the scheme largely relate to reducing delay to existing and future traffic, a lower than
anticipated future growth in traffic levels, or a delay / reduction to the growth at Norwood, is considered to
be the greatest risk to the scheme. Sensitivity tests considering the impact of these scenarios on the Business
Case have been undertaken using the low growth methodology outlined within WebTAG Unit M4.

50
Table 3.13 below summarises the results of the low growth economic assessment for Packages 1a and 1b.
Table 3.13: Low Growth Economic Assessment AMCB Comparison
The COVID-19 pandemic resulted in a significant drop in highway usage as part of the national lockdown.
Although it is not yet know what the long term impact of this will be, Peterborough has seen a steady
increase in traffic levels since restrictions were eased over the summer months and peak hour traffic flow
on the strategic network within Peterborough has returned to approximately 90% (October 2020) of pre-
pandemic levels. Monitoring of the impacts of COVID-19 will continue across Peterborough. It is considered
that the low growth scenario most closely resembles the impact of COVID-19 on local traffic.
3.6. Value for Money Statement
VFM Category
Based on the Economic Assessment reported within the Economic Case, it is considered reasonable that the
proposed A16 Norwood Improvement Scheme will achieve High Value for Money.
Value (£’000s) 2010 prices, benefits discounted to 2010
Package 1a(Full Time Signals)
Package 1b (Part Time Signals)
Greenhouse Gases -42 -53Consumer Users (Commuting) 4,185 4,529
Consumer Users (Other) -82 2,526Business Users/Providers 2,529 3,886
Indirect Taxes 151 162Present Value of Benefits (PVB) 6,741 11,050
Broad Transport Budget 4,757 4,757Present Value of Costs (PVC) 4,757 4,757
Net Present Value (NPV) 1,984 6,293Benefit/Cost Ratio (BCR) 1.417 2.323
Value for Money Statement Low High
Benefits
Costs
Net Benefit / BCR Impact

51
4. The Financial Case
4.1. Introduction
This section presents the Financial Case for the A16 Norwood Improvement Scheme. It concentrates on the
affordability of the proposal and its funding arrangements.
4.2. Scheme Costing
The scheme cost estimates for the Financial Case have been prepared in line with WebTAG guidance set out
in TAG Unit A1-2 Scheme Costs (DfT, May 2019). Each of the steps taken to produce the cost estimates are
explained beneath. The estimate has been costed based on high level design information, and include a
20% Risk Allowance which includes COVID-19 related construction risk costs.
The scheme costs have been prepared using the parameters shown in Table 4.1 beneath.
Table 4.1: Scheme Costing Parameters
DfT Base Year 2010Scheme Cost Estimate Year 2020Present Year (Assessment Year) 2020Scheme Start Year 2021Scheme Year of Opening 2028Analysis Period (Years) 60
Market Price Factor (Indirect Taxation) 1.19Normal Inflation Rate 1.025Construction Inflation Rate 1.05
Risk Allowance £655,943Optimism Bias Total £2,564,308Optimism Bias Rate - Highways 44%Optimism Bias Rate - Structures 66%Optimism Bias Rate - Maintenance 0%
Input
Years
Economic Values
Risk & Optimism Bias

52
The initial scheme cost estimates are presented in Table 4.2 beneath, and each is explained in further detail
beneath. Note that Optimism Bias is not included within the Financial Case.
Table 4.2: Financial Case Scheme Cost Estimates
Base Investment Cost
The Base Investment Cost is the capital cost required to design and construct the scheme in current year
(2020) prices, without a risk allowance or inflation. This is the scheme cost estimate based on the initial
design estimates.
Table 4.3 shows the Base Investment Cost broken down into Construction, Land, Design and Supervision
costs (note that there are no ‘Land’ or ‘Other’ costs).
Table 4.3: Base Investment Cost (2020 Prices)
The scheme Base Investment Cost in 2020 prices is £4,294,790. This includes £3,279,714 of Construction
related costs and £1,015,076 of Design and Supervision costs (£808,030 Design and Surveys / £207,046
Supervision). The Design costs include all necessary surveys required to undertake Preliminary and Detailed
Designs.
Cost Stage Cost (£)
4,294,790
Risk Adjusted Base Cost 4,950,733
Risk Adjusted Base Cost with Construction Industry Inflation (Outturn Cost) 6,615,466
Base Investment Cost
Calendar YearConstruction
Costs (Highways)(£)
Preparation and Supervision Costs
(£)
Total Base Investment Cost
(£)
2021 - 465,000 465,000 2022 - 264,684 264,684 2023 - 78,346 78,346 2024 350,000 21,000 371,000 2025 - - - 2026 - - - 2027 2,929,714 186,046 3,115,760 Total 3,279,714 1,015,076 4,294,790

53
The cost profile assumes the following:
2021 – Preliminary Design and Outline Business Case
2022 / 2023 – Detailed Design and Full Business Case
2024 – Construction / Supervision of Closure of Newborough Road
2027 – Construction / Supervision of Remaining Schemes (Package 1).
There are no land or property costs associated with this scheme, as all the required land is within the
Council’s ownership, or that of Highways England.
Risk Adjusted Base Cost
The Risk Adjusted Base Cost includes a component for risk. A 20% Risk Allowance has been included within
the cost estimate, which includes 10% for construction risk and 10% for COVID-19 related risk.
Table 4.4: Risk Adjusted Base Costs (2020 Prices)
The addition of the Risk Allowance (£655,943) takes the Risk Adjusted Base Cost to £4,950,733.
Inflated Risk Adjusted Cost (Outturn Cost)
The Inflated Risk Adjusted Cost, or Outturn Cost, is the Risk Adjusted Base Cost with construction industry
inflation applied. An inflation rate of 5% per annum has been used based on the Office for National
Statistics (ONS) Construction Output Price Indices6 (2019 / Q4) for ‘New Work / Infrastructure’. The inflation
rate of 5%, as well as being derived from Construction Output Price Indices, has been derived using
knowledge of costs associated with recent schemes in Peterborough. Peterborough Highways Services
works are measured using BCIS indices.
Inflation has been applied in line with the construction profile assumed within the scheme costing and the
Economic Assessment, and the cost of this is presented beneath in Table 4.5.
6 https://www.ons.gov.uk/businessindustryandtrade/constructionindustry/datasets/interimconstructionoutputpriceindices
Calendar YearConstruction
Costs (Highways)(£)
Preparation and Supervision Costs
(£) Risk Allowance
(£)
Risk Adjusted Base Cost (£)
2021 - 465,000 - 465,000 2022 - 264,684 - 264,684 2023 - 78,346 - 78,346 2024 350,000 21,000 70,000 441,000 2025 - - - - 2026 - - - - 2027 2,929,714 186,046 585,943 3,701,703 Total 3,279,714 1,015,076 655,943 4,950,733

54
Table 4.5: Inflated Risk Adjusted Cost (2020 Prices)
The cost of inflation is £1,664,732, which brings Scheme Outturn Cost to £6,615,466. The Outturn Cost
represents the amount required by Peterborough City Council to deliver the scheme.
Maintenance
Future maintenance costs have not been included for the scheme. All maintenance costs associated with
the existing infrastructure will continue to occur separate to the Norwood scheme, and so have not been
included within the assessment.
The addition of new infrastructure, such as the new lanes on the A16, is considered to be offset by the
closure of Newborough Road. Newborough Road is considered to be a significant maintenance liability, like
many of the Fen roads in the area. The single carriageway is built on a soft soil embankment flanked by
drainage ditches. Subsidence is common on these roads as a result of ground conditions in the Fens, and
movement caused by the regular rise and fall of the water table. This subsidence causes the road haunches
to fail more often than on other roads, and regularly require expensive maintenance. The A16 and A47 by
contrast, are built on wider embankments with offset drains, meaning that the damage caused by
subsidence (and subsequent maintenance) is much less of a concern on routes where the new infrastructure
will be provided.
Further Cost Estimate Refinement
The scheme cost estimate will be revaluated based on more mature design information, including site
surveys, Preliminary Designs and a Quantified Risk Assessment, as the preferred scheme is carried forward
to OBC. The scheme cost will then be used to identify and secure funding, and to undertake further
economic assessment using the Transport User Benefit Appraisal package (TUBA) at the OBC stage to re-
determine value for money.
Future maintenance costs / works associated with the schemes will also be considered and added to the
maintenance inventory and funded from the Council’s maintenance budgets. However, it is anticipated that
the provision of new or upgraded assets will not significantly impact upon future maintenance liabilities.
Calendar Year Risk Adjusted Base Cost (£)
Cost of Inflation (£)
Total withInflation (£)
2021 465,000 23,250 488,250 2022 264,684 27,130 291,815 2023 78,346 12,349 90,695 2024 441,000 95,038 536,038 2025 - - - 2026 - - - 2027 3,701,703 1,506,965 5,208,668 Total 4,950,733 1,664,732 6,615,466

55
4.3. Budgets and Funding Cover
Funding Cover
It is anticipated that the full scheme Outturn Cost of £6,615,466 will be funded by the CPCA from the Single
Investment Fund.
The CPCA have an infrastructure delivery budget of £20 million per year, allocated for the next 30 years.
This funding will be invested into the Cambridgeshire and Peterborough Single Investment Fund, in order
to boost growth within the region. The CPCA have committed to providing £16 million of funding within its
first four years, to complete major highway improvements that decrease congestion and support local
growth. No local or developer contribution have yet been confirmed to support this scheme, although
developer funded commitments, including the Norwood internal access road and the new A16 Norwood
Development Roundabout, will support the delivery of this package.
There are not known to be any financial constraints beyond the availability of funding from the CPCA Single
Investment Fund.
Completion of the Business Case
Subject to acceptance of the SOBC, Peterborough City Council intend to move to Preliminary Design and
production of an OBC.
Costs for the further design and Business Case tasks are included within the scheme costs reported within
this chapter and the Value for Money assessment undertaken within the Economic Case, however funding
to progress the Preliminary Design and OBC needs to be secured to enable this work to progress.
Peterborough City Council request that the design cost of £620,000 is released in advance of the funds
required for construction, in order to undertake the Preliminary Design and produce an OBC.

56
5. The Commercial Case
5.1. Introduction
The Commercial Case demonstrates that the scheme can be reliably procured and implemented through
existing channels whilst ensuring value for money in delivery of the scheme.
5.2. Output Based Specification
The A16 Norwood Option Assessment Report (OAR) details the work undertaken to develop multiple
improvement options at this location, and the modelling undertaken to identify the preferred scheme.
The OAR discusses the process through which the preferred scheme has been identified. The scheme will
include the following outputs:
Closure of Newborough Road Junction with A47
Dualling of the A16 between the Norwood Development Roundabout and the A16 / A47 / Welland
Road Roundabout
Partial Signalisation of the A16 / A47 / Welland Road Roundabout (A16 approach)
Creation of a flare to provide a third lane on the A47 westbound approach
Creation of a Left Dedicated Left (LDL) from the A47 eastbound approach to the A16 northbound
exit.
The scheme will meet all of the primary scheme objectives outlined in the Strategic Case. Details of how the
scheme will be measured against these objectives are discussed within the Management Case.
5.3. Procurement Strategy
All phases of the scheme, including Design, Construction and Site Supervision will be delivered in house by
Peterborough Highway Services (PHS).
PHS is a ten-year NEC3 Term Service Contract between Peterborough City Council and Skanska, with
responsibility for improving and maintaining Peterborough’s highway network. The collaboration began in
2013 and runs to 2023, with the possibility of a further ten-year extension.
The contract is built upon a collaborative and multi-disciplined team capable of developing schemes from
policy concept right through to design and construction, and then maintaining them.

57
Market Maturity
The team has successfully developed and delivered multiple highway schemes around Peterborough since
the beginning of the contract in 2013, including several schemes on behalf of the CPCA. PHS has been
responsible for all planning and design work undertaken on the A16 Norwood Improvement Scheme to
date. All skills and competencies to deliver this scheme are available within the local PHS contract.
To ensure that the procurement remains commercially competitive and offers value for money, all
subcontract packages will be subject to competitive tendering.
5.4. Risk Allocation and Transfer
Because the PHS contract is already established there is limited opportunity to modify the allocation of risk,
however the contract does include inherent features that encourage effective risk management and
mitigation, such as:
Each party is required notify each other of any matter which could affect the cost, completion,
progress or quality of the project through Early Warning Notices. This is to promote early
intervention which could reduce the impact of any potential risk
In the case of Option C (Target Price) both parties are incentivised to reduced cost through the pain
/ gain mechanism.
The above will also be supplemented with good project management practices during the delivery of the
scheme. Both parties will maintain a shared Risk Register, which will be reviewed regularly at project
progress meetings. Further details on the management of risk are provided in the Management Case.
Detail about the allocation of project risk between the CPCA and PCC, and the responsibilities for managing
this, can be found within Chapter 6 of the CPCA’s Assurance Framework.
However, in summary, risk is allocated to the CPCA by default, but the CPCA reserve the right to reallocate
this risk to PCC in the event that the risk has not been managed appropriately. The signed Funding
Agreement, and Project Initiation Document, will be used to determine whether PCC has managed the
project risk appropriately, and therefore where the risk should be allocated.

58
6. The Management Case
6.1. Introduction
The Management Case explains how the scheme promoter will successfully manage delivery of the
proposed scheme and achieve the expected outcomes.
6.2. Evidence of Similar Projects
Peterborough has a long history of significant growth spanning back to its designation as a New Town in
1967, and consequently the City is used to managing and delivering large highway infrastructure projects.
The Council, through PHS, has completed the following highway improvement schemes in recent years.
Both of these schemes are located on the Parkway Network at strategically sensitive locations, and
demonstrate PHS’ ability to successfully manage and deliver highway schemes of this scale.
Junction 20 Improvement Scheme (A47 Soke Parkway / A15 Paston Parkway) - £5.7m
This scheme was constructed between summer 2016 and spring 2017, and involved fully signalising a grade
separated roundabout and adding significant capacity through the creation of additional lanes on the
approaches and the circulatory of the roundabout. The scheme was required to relieve congestion and to
enable nearby housing growth.
Since completion, the scheme has met its objectives and reduced congestion and improved journey times at
a crucial section of the network. It has also provided additional network capacity, enabling the initial phase
of development at Paston Reserve to be progressed, which will ultimately include 945 homes and a
secondary school.
Junction 20 is a major interchange on Peterborough’s network, located approximately 500 metres to the
west of the A16, and at the time of construction up to 4,500 vehicles an hour passed through it. With such
a high traffic demand, the careful planning and implementation of the traffic management required to
construct the scheme was crucial. Close collaboration between all delivery partners meant that this was
achieved with limited disruption to the highway network.
The Junction 20 scheme was completed on time and within the £5.7m budget. Funding for the scheme was
secured from the Greater Cambridgeshire and Greater Peterborough Local Enterprise Partnership.

59
Figure 6.1: Junction 20 Improvement (Post Scheme)
Junction 17 – Junction 2 Improvement Scheme (A1139 Fletton Parkway) - £18m
This scheme was constructed between spring 2014 and summer 2015 and consisted of the widening of the
A1139 Fletton Parkway from two to three lanes between the A1 (M) and Junction 2 in Peterborough to
provide significant and critically needed capacity improvements. The total cost of the scheme was £18
million, funded through the Greater Cambridgeshire and Greater Peterborough Local Enterprise
Partnership, Developer Funding and Council Capital Funding.
The scheme successfully delivered a major upgrade to Peterborough’s Parkway network. Despite extensive
ground investigations during the design phase, abnormally high levels of soil contamination were
discovered during construction throughout the site, and significant volumes of soil had to be sent for
specialist treatment and disposal. However, through careful management and collaborative working
amongst all partners, there was a minimal impact on the scheme delivery programme, and additional
funding was provided by the DfT due to the severity of the contamination which had not been detected
despite all of the industry standard Waste and Contamination (WAC) tests being undertaken.

60
Figure 6.2: Junction 17 (A1M) Improvement (Post Scheme)
6.3. Programme / Project Dependencies
The scheme programme will need to consider the following key dependencies:
Norwood Development: The proposed package is intended to facilitate growth at the Norwood
site, and beyond. The Local Plan currently expects this growth to occur between 2019 (Local Plan
adoption year) and 2036, however the Business Case and scheme programme will need to adjust if
the development programme changes.
Programme Constraints: the construction programme will need to carefully consider any other
infrastructure works that may be underway on the highway network during the same period. The
programme will be planned to avoid works that may compound the disruption caused to road users
as a result of the A16 Norwood Improvement Scheme, although this will be limited through the
careful planning of traffic management arrangements. Careful liaison with Highways England will
be necessary to ensure that the scheme does not conflict with any planned works that they have
along this section of the route.
Construction Disruption: The Council have significant recent experience of undertaking
maintenance and delivering improvements on its highway network, particularly on strategic routes,
and is proficient in mitigating the impact of this.

61
6.4. Governance, Organisational Structures, and Roles
The CPCA are the organisation ultimately responsible for the delivery of the A16 Norwood Improvement
Scheme, and the Council are nominated as the delivery partner.
Delivery of the scheme will be managed by a Project Team led by a Peterborough City Council Project
Manager, and consisting of all the key project delivery partners. The Project Team will be responsible for the
daily running of the project, coordinating with all key stakeholders, and managing the delivery programme.
The existing PHS Project Board will be used to oversee the continued development and delivery of the
scheme by the Project Team, and to make key decisions relating to the delivery of the project. The Project
Board will be supported by technical specialists, and key stakeholders will be invited to attend as necessary.
Project Management Team
The Project Management Team will report to the Project Board and ultimately to the CPCA Board.
The Project Management Team will be responsible for delivery and day-to-day management of the
consultants and contractors. They will co-ordinate inputs from technical advisors responsible for the delivery
of key work streams within an agreed programme, including:
Stakeholder Engagement
Design Development
Transport Modelling
Environmental Assessment
Business Case Development
Early Contractor Involvement (ECI) and Scheme delivery.
The key roles and lines of accountability for the development and delivery of the scheme are shown beneath
in Figure 6.3.
The team has successfully developed and delivered multiple highway schemes around Peterborough since
the beginning of the contract in 2013, including several CPCA schemes. PHS has been responsible for all
planning and design work undertaken on the A16 Norwood Improvement Scheme to date. All skills and
competencies to deliver this scheme are available within the local PHS contract.

62
Figure 6.3: Key Project Roles and Responsibilities
Combined Authority Combined Authority Project Board Responsibilities include:- To support Peterborough City Council in the development of the scheme- To undertake a Technical Review of the Business Case- To make recommendations to the CPCA Board on future stages of the Project
Lead Cabinet Member Cabinet Member for Strategic Planning and Commercial Strategy and Investments
Responsibilities include:- To review and approve recommendations made by the Project Board
Project Board Senior Responsible Officers:Contract ManagerTransport Planning LeadDesign Team LeadProject Programme LeadEngineering LeadMajor Schemes Delivery Lead
Responsibilities include:- To hold monthly meetings to discuss progress and issues- To review, and if required, approve recommendations made by the Project Team
Project Team Responsible Officers:Transport Planning OfficersProject Engineers
Responsibilities include:- Manage and review day-to-day project issues- Monitor progress against key project milestones- Report issues that require discussion / approval by Project Board- Report project progress to Project Board- Engage with stakeholders
Delivery Team Responsible Officers:Transport PlanningHighway DesignEnvironmentDrainageNetwork ManagerStreet Works Co-ordinator
Responsibilities include:- Technical delivery of scheme- Highlighting risk- Identifying options for reducing cost

63
6.5. Programme / Project Reporting
The Project Manager will report how the project is performing against the project objectives / key
milestones. This will be completed using established finance and programme management tools such as
Verto and reported on a regular basis to the Project Board.
Every month the Project Manager will also submit a highlight report to the CPCA recording what progress
has been made and whether there are any new risks that could impact the scheme. Financial progress will
be reported to the PHS Dashboard, which monitors the progress of work delivered through the PHS
contract, and approval for any key decisions is made by the Project Board.
Regular Project Progress Meetings will be held throughout the duration of the scheme to allow key staff to
discuss important issues that could affect the delivery of the scheme.
Delivery of the scheme through the PHS Framework contract ensures that all stages of work are conducted
in-house, ensuring a smooth transition of information and communication between the different delivery
teams.
6.6. Programme / Project Plan
Key project milestones for progressing to scheme delivery are outlined in Table 6.1 overleaf.
Table 6.1: Key Project Milestones
Timescale Milestone Activity
November 2020 Strategic Outline Business Case and Option Assessment Report Submitted.
January 2021 Strategic Outline Business Case reviewed by CPCA and approval sought from CPCA board for the release of funding to undertake an Outline Business Case and Preliminary Design.
April 2021 – March 2022 Outline Business Case produced and Preliminary Design undertaken.
April 2022 Outline Business reviewed by CPCA and approval sought from CPCA board for the release of funding to undertake Detailed Design and produce a Full Business Case.
June 2022 – May 2023 Detailed Design undertaken and Full Business Case produced.
2024 Closure of Newborough Road Access to A47 delivered in conjuction with Developer schemes inluding Norwood internal access road and A16 Norwood Developer Roundabout.
2027 Construction of the remaining schemes, including A16 Dualling and A16 / A47 / Welland Road Roundabout improvements.
These dates are indicative only and assume that funding will be available to progress each of the stages. The
milestones shown above may change as the scheme evolves, or to reflect changes in external factors, such
as the Norwood development programme.

64
6.7. Assurance and Approvals Plan
The Council will manage the project in line with their existing assurance and approvals process. The Project
Manager will be responsible for the daily running of the project, and any approvals required will be provided
by the Project Board.
The Cambridgeshire and Peterborough Combined Authority Assurance Framework sets out the
fundamental principles in relation to the use and administration of the Cambridgeshire and Peterborough
Investment and outlines a culture underpinned by processes, practices and procedures. The Assurance
Framework sits alongside a number of other Cambridgeshire and Peterborough Combined Authority
documents including the Constitution and Devolution Deal.
Further to the above the Combined Authority has developed the 10 Point Guide which outlines project
management governance requirements which should be followed throughout the life cycle of the project.
It details the requirements at project initiation including, establishing a Project Board with the Combined
Authority and delivery partners. The purpose of the Project Board is to provide oversight to the project,
ensure appropriate governance, risk management and to provide assurance in accordance with the scope,
budget and programme.
The Project board is to be held monthly and should be attended by the Combined Authority’s head of
Transport and Transport Programme Manager alongside Peterborough City Council’s Project manager and
by Group Manager for Highways and Transport. The project board should also establish a RACI chart, a
copy of the RACI template is in the Combined Authority’s 10 Point Guide.
6.8. Communications and Stakeholder Management
Communication and Stakeholder engagement will consist of:
Providing regular updates on delivery progress and key activities for the local community,
businesses, and key stakeholder
Engaging with the local community, businesses, and key stakeholders regarding delivery. This is to
ensure local needs are taken into account throughout the duration of the project
Ensuring information is shared using appropriate methods of communication to all sectors of the
community, business, and key stakeholders.
Project Liaison Officer
A designated Project Liaison Officer (PLO) will be assigned to the scheme throughout the public consultation
period and during construction and act as a single point of contact for outgoing and incoming
communication. The PLO will be attached to the scheme delivery team and their responsibilities will include
issuing progress updates via email and social media in the lead up to, and during construction, and
coordinating responses to members of the public and key stakeholders when queries are raised.

65
Stakeholder Consultation
Stakeholder consultation will be undertaken by the Project Team as part of the Outline Business Case and
Preliminary Design. This consultation will enable feedback from key stakeholders to be taken into
consideration ahead of the Detailed Design stage.
The key stakeholders identified for this consultation event include:
Cambridgeshire and Peterborough Combined Authority (CPCA)
Peterborough City Council (The Council)
Highways England
Norwood Developers
Ward Councillors and local residents, including those along Newborough Road
English Heritage
Emergency Services
Land owners and Businesses affected by the scheme.
All key Stakeholders will be consulted via email for comments. Key Stakeholders will also be communicated
to regularly throughout the construction phase by the PLO.
Stakeholder engagement with Highways England has begun as part of the SOBC, and within the context of
the Leeds Farm Planning Application (part of the Norwood Development). Peterborough City Council are
also in the process of formally engaging with the different land owners within the Norwood site about the
proposed scheme.
Public Consultation
Public consultation on the concept of a scheme at this location has already been undertaken as part of the
CPCA Local Transport Plan7 that was adopted in January 2020.
An online consultation exercise will be undertaken at the next stage of scheme development, and results
from this consultation will be reported in the OBC and used to inform future Detailed Design., and ahead
of the Detailed Design. Subject to Covid-19 restrictions, it is anticipated that a public consultation event will
be held ahead of construction.
6.9. Risk Management Strategy
A Risk Register was produced during project initiation to identify potential risks and to evaluate factors that
could have a detrimental effect on the project. The Risk Register identifies potential risks, considers the
impact they may have, the likelihood of them occurring, and the measures that will be taken to mitigate
these.
7 https://cambridgeshirepeterborough-ca.gov.uk/assets/Transport/Draft-LTP.pdf

66
The Risk Register is a live document and is reviewed regularly at progress meetings and updates are reported
to the CPCA through the monthly Highlight Reports. A copy of the Risk Register has been provided in
Appendix C.
6.10. Scheme Evaluation Plan (Benefits Realisation and Monitoring)
This Scheme Evaluation Plan for the A16 Norwood Improvement Scheme will be prepared prior to scheme
construction to set out guidance detailing how this scheme’s effects should be evaluated following
implementation of the scheme.
The Scheme Evaluation Plan comprises the Benefits Realisation Plan and the Monitoring and Evaluation
Plan.
The purpose of the Scheme Evaluation Plan is to clearly set out which indicators should be monitored to
verify that the scheme achieves its objectives. Post monitoring is important for determining that the scheme
has been successful.
Expected Benefits
The scheme objectives, outputs and outcomes are summarised below. These objectives are described within
the Strategic Case and explain what the scheme is expected to deliver.
Primary objectives include:
Tackle congestion and improve journey times: Tackle congestion and reduce delay along the A16
and on the primary approaches to the A16 / A47 / Welland Road Roundabout
Support Peterborough’s growth agenda: Ensure that the planned employment and housing
growth at Norwood can be realised
Limit impact on the local environment and improve biodiversity: Fully mitigate any adverse
environmental impacts of a scheme, and ensure a biodiversity net gain within the study area.
Secondary objectives include:
Positively impact traffic conditions on the wider network: Positively impact the performance of
local routes impacted by the traffic and congestion in and around the A16 corridor, such as the
A47, A15 Paston Parkway, A1139 Eye Road and Newborough Road.
Improve road safety: Reduce accidents and improve personal security for all travellers within the
study area.
Improve sustainable transport infrastructure: Ensure that the scheme provides a comprehensive
network of pedestrian and cycling routes where needed.

67
Benefits Monitoring and Evaluation
The Monitoring and Evaluation plan for the A16 Norwood Improvement Scheme will take a proportionate
and targeted approach, which will aim to demonstrate how the scheme has performed in relation to its
objectives and intended outcomes. The principal aims of Monitoring and Evaluation are to determine
whether a scheme has been delivered as planned, and whether it has delivered the expected benefits.
Where outcomes differ from those expected, data collected for the Monitoring and Evaluation evidence
base will assist in understanding the reasons for this and the lessons that can be learnt.
Monitoring and evaluation of the schemes performance against its objectives must be undertaken to
determine whether the scheme has been a success. Initial details of how this will be measured are provided
in Table 6.2 beneath.

68
Table 6.2: Benefits Realisation Monitoring
Indicator / Metrics Source Reporting Programme
Ownership Indicative Cost Baseline Implementation Post
Implementation Inputs
Scheme Funding CPCA Funding CPCA Funding submission Final Scheme Cost Data
Planned Actual - CPCA / PCC
Outputs
Infrastructure Infrastructure delivered as
part of the scheme Site Inspection 2023 2024 - 2026 2028 PCC / HE £1,000
Outcomes
Tackle congestion Average AM and PM peak
journey time Trafficmaster / Tom Tom data 2022 - 2024 Summer 2028 PCC
£500 cost to process the data
Address journey time reliability on the primary
approaches to the A47 / A16 roundabout
Queue Length Data Automatic Traffic Counters
Video survey footage 2022 - 2024 Summer 2028 PCC
£1000 cost of surveys and
processing data
Improve walking and cycling routes
New walking and cycling infrastructure
Site Inspection / Video survey footage
2022 - 2024 Summer 2028 PCC
Improved Road Safety Number of KSI incidents Peterborough database of road
traffic records 2022 - 2024 Summer 2028 PCC
£250 cost to process the data
Mitigate any negatie impacts on the local envinroment
(Noise / Air Quality) Air quality / noise surveys Air quality / noise monitoring
Available at PCC
Summer 2028 PCC £1,000 cost to
process the data
Improve Biodiversity Biodiversity Calculation Site Survey and desk based
assessment 2022 – 2024 2028 PCC £2,000
Support Growth Agenda encouraging new homes and
jobs
Local economic growth and development figures
post scheme opening
PCC Planning Portal Local and regional economic
reports
Available on-line
2036 PCC/CPCA £250 cost to
process the data
Reporting Baseline and Year 1 reports summarising the outcomes of the monitoring and evaluation work 2024 2030 PCC £3,000 Year 5 report summarising local economic growth, scheme impacts and development figures
prior and post opening of the scheme 2036 PCC £3,000
Total Monitoring and Evaluation Budget £12,000

69
Scheme Logic Mapping
The logic map detailed in Figure 6.4 highlights the links between context, inputs, outputs,
outcomes and impacts of the scheme and gives a visual representation of where Monitoring and
Evaluation should be focused. The logic model outlines the causal chain of events that represent
the process by which the desired outcomes and scheme objectives are to be achieved. The logic
model has informed the approach proposed in this M&E plan and will help ensure monitoring
resources are targeted appropriately through the timeline of scheme development and provide
effective measurement of objectives and outcomes.
The implementation of the Monitoring and Evaluation Plan will help provide an understanding of
the following:
Inputs (did we apply the money and resources that we said we would?)
Outputs (how much did we build / provide?)
Outcomes (what changes in behaviour came about as a result?)
Impacts (what effect did the outcomes have on the economy, society and environment?).
The logic model also incorporates the use of bounding objectives which represent positions
beyond which it is not proposed to attribute effects resulting from the scheme. However, the
outcomes of the Monitoring and Evaluation plan will help understand the potential for wider
impacts resulting from the scheme as outlined in the Logic Map.
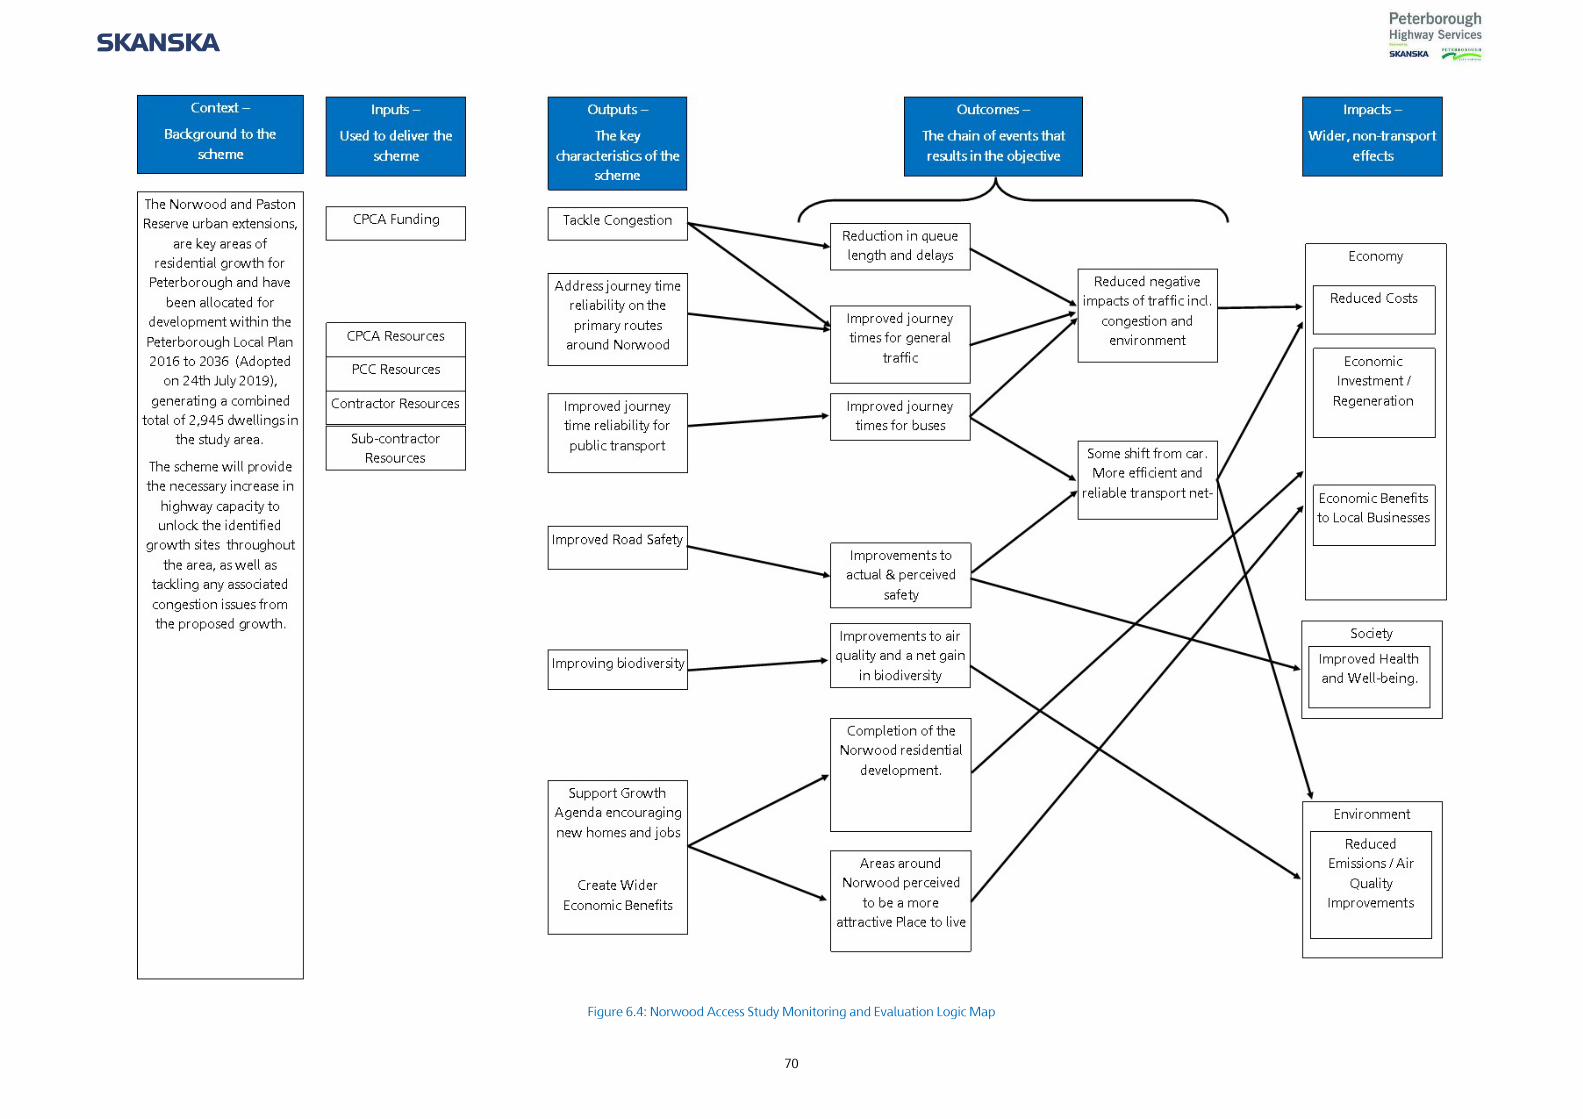
70
Figure 6.4: Norwood Access Study Monitoring and Evaluation Logic Map

71
Appendices
Appendix A: Wider Policy Context

Appendix A: Wider Policy Context
National Planning Policy Framework The National Planning Policy Framework (NPPF) sets out the Government’s planning policies for
England and should be considered in the preparation of development plans. Proposed
development that accords with an up to date Local Plan should be approved unless other
material considerations indicate otherwise.
The NPPF states that all plans are expected to be based upon and to reflect the presumption in
favour of sustainable development with clear policies that will guide how the presumption
should be applied locally.
The scheme will contribute to delivering the following NPPF objectives:
Delivering a sufficient supply of homes. The scheme will provide crucial transport
capacity along the network which will support the housing growth set out for
Peterborough within the Local Plan.
Building a strong, competitive economy. The NPPF states that development proposals
should support economic growth and productivity. The scheme will provide essential
network capacity at a crucial location to enable Peterborough to deliver the homes set
out in the Local Plan.
Promoting healthy and safe communities and sustainable transport. The NPPF
stipulates that communities should be safe, accessible and supportive of a healthy
lifestyle through the provision of cycling and walking facilities. The scheme not only
provides highway capacity for strategic trips, but will also include local sustainable
transport infrastructure improvements to the immediate area.
Department for Transport Single Departmental Plan
The single departmental plan for the Department for Transport sets out the strategic objectives
to 2020 and the plans for achieving them. The DfT’s overall mission is to create a safe, secure,
efficient and reliable transport system that works for the people who depend on it; supporting
a strong productive economy and the jobs and homes people need.

The objectives outlined in the plan are:
Support the creation of a stronger, cleaner more productive economy
Help to connect people and places, balancing investment across the country
Make journeys easier, modern and reliable
Make sure transport is safe, secure and sustainable
Prepare the transport system for technological progress, and a prosperous future
outside the EU
Promote a culture of efficiency and productivity in everything we do.
Peterborough City Council’s Vision and Strategic Priorities
The Council’s vision is to
‘Create a bigger and better Peterborough that grows the right way and through truly
sustainable development and growth:
Improves the quality of life of all its people and communities, and ensures that all
communities benefit from the growth and the opportunities is brings
Creates a truly sustainable Peterborough, the urban centre of a thriving sub-regional
community of villages and market towns, a healthy, safe and exciting place to live, work
and visit, famous as the environmental capital of the UK’.
The strategic priorities for the Council are:
Drive growth, regeneration and economic development
Improve education attainment and skills
Safeguard vulnerable children and adults
Implement the Environment Capital agenda
Support Peterborough’s culture and leisure trust Vivacity
Keep all our communities safe, cohesive and healthy
Achieve the best health and wellbeing for the city
Peterborough City Council Local Plan
The Local Plan (adopted July 2019) updates the 2011 Core Strategy and looks to deliver 21,315
new homes between 2017 and 2036, and 17,600 jobs between 2015 and 2036. The
development strategy for the new Local Plan is to focus the majority of new housing
development in, around and close to the urban area of the city of Peterborough. Only a small
percentage of residential development is allocated to the villages and rural area. Similarly,
employment development will be focussed on the city centre, urban area or urban extensions.

The Local Plan will deliver the council’s corporate priorities (listed below) which aim to improve
the quality of life for all residents and communities.
Drive growth, regeneration and economic development
Improve education attainment and skills
Safeguard vulnerable children and adults
Implement the Environment Capital agenda
Support Peterborough’s culture and leisure trust Vivacity
Keep all our communities safe, cohesive and healthy
Achieve the best health and wellbeing for the City.
Policy LP13: Transport states that the impact of growth on the city’s transport infrastructure will
require careful planning and that new development must ensure that appropriate provision is
made for the transport need that it will create.
Policy LP14: Infrastructure identifies that the major growth and expansion of Peterborough will
be supported by necessary infrastructure such as roads, schools and health and community
facilities is in place to help the creation of sustainable communities.

72
Appendix B: A16 Norwood Improvement Scheme Appraisal Summary Table (AST)

A16 Norwood SOBC Appendix B – Appraisal Summary Table
Impacts Summary of key impacts Assessment
Qualitative Quantitative (Monetary)
Econ
omy
Business Users & Transport Providers
Transport user benefits have been calculated using the Peterborough Transportation Model 3 (PTM3) and Transport User Benefits Appraisal (TUBA) tool. Benefits have been discounted to the 2010 base year and expressed in 2010 market prices. This identifies that the benefit to Business Users & Transport Providers is expected to be £5,476,000. Not Assessed £ 5,476,000 (PVB)
Reliability Impact on Business Providers Commuters are expected to benefit from more reliable journey times because of congestion and delay reductions. Not Assessed Not Assessed
Regeneration No regeneration proposals in the vicinity of the scheme Not Assessed Not Assessed Other impacts – impact on local business
The Study Area is a large residential development to the north-east of Peterborough. Any proposed measures to improve journey time reliability and reduce congestion should help to keep the area as an attractive location for homes and businesses. Slight Beneficial Not Assessed
Envi
ronm
enta
l
Noise The reduction in queueing, and therefore idling is anticipated that the overall impact will be neutral, however further noise assessment may be required as the scheme progresses. Neutral Not Assessed
Air Quality The reduction in queueing, and therefore idling, may have a beneficial impact on air quality at receptors near the scheme site. However, further assessments will be required as the scheme progresses. Slight Beneficial Not Assessed
Greenhouse Gases Although a decrease in AM Peak Hour congestion, there is a small negative impact on greenhouse gas emissions will be seen upon scheme completion. Further assessments will be undertaken as the scheme progresses to mitigate this dis-benefit Slight dis-benefit £-1,000 (PVB)
Landscape Most of the works are within the highway boundary and designs will be sensitive to local area – neutral impact Neutral Not Assessed
Townscape Most of the works are within the highway boundary and designs will be sensitive to local area – neutral impact Neutral Not Assessed
Historic Environment Most of the works are within the highway boundary and designs will be sensitive to local area – neutral impact Neutral Not Assessed
Biodiversity Biodiversity will be assessed as the scheme progresses and any mitigation measures identified. Neutral Not Assessed
Water Environment Water environment will be assessed as the scheme progresses Neutral Not Assessed
Soci
al
Commuting & Other Users Transport user benefits have been calculated using the Peterborough Transportation Model 3 (PTM3) and Transport User Benefits Appraisal (TUBA) tool. Benefits have been discounted to the 2010 base year and expressed in 2010 market prices. This identifies that the benefit to Commuting & Other users is expected to be £9,610,000. Users are expected to benefit from improved journey times because of reduced congestion.
Not Assessed £ 9,610.000 (PVB)
Physical Activity Improvements for pedestrians and cyclists will be considered as part of the scheme. Slight Beneficial Not Assessed
Journey Quality Driver’s frustration caused by unreliable journey times is likely to be reduced significantly. Overall improvement in safety. Slight Beneficial Not Assessed
Accidents Scheme improvements at junctions is expected to have a slight benefit on road safety. Slight Beneficial Not Assessed
Personal Security No improvements yet identified for walking and cycling, but these will be included at FBC. Slight Beneficial Not Assessed Access to the transport system No significant improvements in accessibility to the transport network, however journeys will be more reliable Slight Beneficial Not Assessed
Affordability No specific changes to the cost of travel (public transport fares, road user pricing or car parking increases Neutral Not Assessed
Severance Improvements in pedestrian facilities could ease severance, Neutral Not Assessed
Option & Non-Use Values Not Applicable Not Assessed Not Assessed
Publ
ic A
ccou
nts
Cost to Broad Transport Budget The cost to the Broad Transport Budget (PVC) has been calculated as £4,790,000. Not Assessed £4,790,000
(PVC)
Indirect Tax Revenues Calculated to be £53,000. Not Assessed £53,000

73
Appendix C: Project Risk Register

Risk ID Date Identified Cause(s) Risk Event Effect(s) Risk Type Risk Status Proximity Date Last
Review Mitigation Plan Action Owner Date Mitigation Due Date Action Closed Likelihood
(1-5)Impact (1-5) RAG score Approx. Financial
Impact (£k) Comments/Notes/Assumptions Risk Owner Escalation Required? Date Closed
(likelihood x impact)
TOTAL £0
9 Feb-20 Budget escalationMore funding required
Work to develop options or time take to model the options may take longer than originally anticpated
Likely effect is that more funding would be required Financial Open Imminent Oct-20
Programme has allowed for additional time for option development and modelling tasks based on experience of pervious priojects. Overall budget for project is being managed closely to ensure it is to programme, and early warnings can be goven if an overspend is likely.
Lewis Banks Aug-20 3 3 9 Spend is close to budget, this will be monitored. Lewis Banks Yes
15 May-20 Limited benefits compared to costsLow score BCR
Potential for poor scheme BCR (due to limited benefits compared to costs).
Risk scheme may not offer value for money or achieve the outcomes desired Financial Open Close Jul-20 Will monitor closely during economic assessment
and wider benefits explored if necessary. Lewis Banks May-20 2 3 6 This is a possible risk and will therefore be closely monitored. Lewis Banks No
3 Mar-20 Delay to projectCoronavirus outbreak
There is risk that with the rise of coronavirus cases that some of the staff working on the project may become infected and would have to.self isolate.
Likely effect is that a delay would be caused Internal Open Imminent Oct-20
Government guidance would be followed. Any member of staff or their family do become unwell, they would be recommended to work from home for a 14 day period/self islolate.
Lewis Banks Mar-20 2 2 4 This will be closely monitored with the number of cases rising. Lewis Banks Yes
6 Dec-19 Results of surveys which may necessitate alterations to proposed works scope or methodology
Change in proposals
There also is a possibility that the data may provide results that may require change in what we propose as improvements.
Likely effect is that a delay would be caused Strategic Open Distant May-20 Ensure all investigations are carried out at an early design stage Lewis Banks Mar-20 2 2 4 This risk will be monitored Lewis Banks No
8 Dec-19 Public and stakeholder objectionsConsultation
There is good possibility that we may receive objections for the improvements that we may decide to undertake for the project.
Likely effect is that a delay would be caused Political Open Distant Dec-19
Early consultation/notification as deemed necessary by PCC. Develop publicity strategy and liaise with businesses/residents affected by the works and scheme mobilisation
Lewis Banks TBC 2 2 4 This is a possible risk, but we feel confident that it can be dealt with should it arise. Lewis Banks No
10 Feb-20 Failure to achieve project outcomesNot meeting outcomes
Preferred option does not deliver the original project outcomes
likely effect is the scheme will not resolve the original problems identified. Political Open Distant Feb-20
Scheme objectives will be developed based on the problems identified at the junction and the wider policy objectives. Options will be scored against scheme objectives to ensure that they fit with what is to be achieved.
Lewis Banks TBC 2 2 4 Not an issue at the moment, but will be monitored. Lewis Banks Yes
11 Feb-20 Poor value for moneyBCR Score
BCR for scheme is poor/low value for money. Likely effect is the scheme will not be deliverable/funded Financial Open Approaching Feb-20
Options are developed with a good understanding of the existing problems, including an understanding of the current congestion/delay at the junction. Therefore is is likely that a preferred scheme would deliver a postivie BCR. If a only a poor BCR is achieveable, the project will be halted at SOBC stage and not progressed further.
Lewis Banks TBC 2 2 4 This is a possible risk, but we feel confident that it can be dealt with should it arise. Lewis Banks No
12 Feb-20 Unknnown STATSUnknown Stats
STATS maybe found at the junction and cause a delay to design or construction if not found early enough
Likely effect is that a delay would be caused External Open Approaching Feb-20
STAT Plans are being requested at an early stage of the project prioir to design to ensure engineers are aware of the STATS that are present within the vicnity of the junction
Lewis Banks TBC 2 2 4 This is a possible risk and will therefore be monitored. Lewis Banks No
13 Feb-20 Unknown Envrionmental IssuesEnvironmental Issues
Environmental Issues such as noise, air or ecology may cause a delay to design and construction if suitable mitigation approaches not considered
Likely effect is that a delay would be caused External Open Approaching Feb-20
Desktop Environmental study will be undertaken at SOBC stage to identify any possible environmental issues. At OBC stage an environmental report will be undertaken to indentify any environmental impacts and mitigation measures
Lewis Banks TBC 2 2 4 This is a possible risk and will therefore be monitored. Lewis Banks No
14 Feb-20 Adverse publicityDisruption to network
There is possibility that adverse publicity may be received due to the disruption to the network during construction
Likely effect is that a delay would be caused External Open Distant Feb-20Advise the public as early as possible about the consutruction timetable. Avoid busy periods such as christmas to minimis the delays to travelling public
Lewis Banks TBC 2 2 4 This is a possible risk and will therefore be monitored. Lewis Banks No
16 Oct-20
Delay in obtaining approval to commence next stage of the project - OBC
Raising order to Skanska
Delay to start of OBC
Due to not receiving approval it becomes difficult to set time frames for programme of works.
We will not be in a postion to raise an order. Skanska will not able to start work on the Outline Business Case. External Open Approaching Oct-20
We will monitor when the review of the SOBC will be completed and will then look for the upcoming board meeting where we can request approval to commence the next stage. A draft programme will be prepared looking at timescales for each of the tasks.
Lewis Banks Jan-21 2 2 4 This is a possible risk and will therefore be monitored. Lewis Banks No
2 Nov-19Delay in obtaining approval to commence project
Raising order to Skanska
Fully spending grant within financial year
Due to the project starting late, it will become difficult to spend all of the grant allocated (£130k) before end of March 2020.
There will be grant unspent, which could impact future grant allocations for other projects. Financial Closed Imminent Mar-20
To hold a meeting with Skanska to discuss what can be achieved within funding period. Also inform CPCA at the earliest opportunity so that the necessary processes and approvals are obtained in order to slip the unspent grant allocation into 2020/21.
Lewis Banks Feb-20 Apr-20 3 3 9
We are currently working with our internal finance team and Skanska colleagues to understand how much we think we are likely to spend in 2019/20 - UPDATE Project is to continue into 2020/21.
Lewis Banks Yes (Corporate) Apr-20
5 Oct-19Delay in obtaining approval to commence project
Raising order to Skanska
Time frames for delivery
Due to not receiving approval it becomes difficult to set time frames for programme of works.
Skanska will not be able to provide accurate programme of works for the project. Therefore it will not be known how much of the budget will be spent.
Financial Closed Imminent Jan-20
Utilise Peterborough Highways contract to ensure best use of available time and resources. Getting the programme confirmed early so that arrangements can be made to slip money if required.
Lewis Banks Dec-19 2 3 6We are working closely with our Skanska colleagues and providing them with an update as to how we are progressing with the approval process.
Lewis Banks No Jan-20
1 Feb-20 Delay in use of PTM3Modelling Issues
The PTM3 Saturn Model is still being validated and therefore any delays to the PTM3 programme will impact on this programme
Likely effect is that a delay would be caused External Closed Imminent Oct-20Priority is being given to the PTM3 project in terms of resources to ensure it is ready to test options for this project.
Lewis Banks Apr-20 Oct-20 2 2 4
There is a delay to the PTM and we are monitoring this risk. - UPDATE issues are stil being experienced hindering progress therefore score has been increased. FURTHER UPDATE - model now validated, therefore score has been reduced.
Lewis Banks No Oct-20
4 Dec-19 Inaccuracy or delay in receiving survey informationData issues
Issues with the data such as a road closure/accident may not provide accurate data.
If needed we may decide to undertake another survey to provide us with more data to analyse. Strategic Closed Close Oct-20
We will plan to schedule the survey at a time when there are no other road works on the network close to the site of the survey.We will contact survey company at an early stage so they can provide a date when the survey can be carried out to avoid a delay, if there is delay then we will contact other survey companies to ask if they have availability/resource to carry out the survey.
Lewis Banks Feb-20 Oct-20 2 2 4 This is a possible risk, but we feel confident that it can be dealt with should it arise. Lewis Banks No Oct-20
7 Sep-19 Delay in obtaining approval to commence projectUnable to raise order to Skanska
Without approval to start the project we will not be able to get a works order over to Skanska.
Skanska will not able to start work on business case. Financial Closed Imminent Jan-20 To hold a meeting with Skanska to discuss order and schedule of works for rest of the financial year Lewis Banks Dec-19 2 2 4 Currently working on internal governance process to get
approval to raise order. Lewis Banks No Jan-20

Skanska UK www.skanska.co.uk
Maple Cross House Denham Way Maple Cross Rickmansworth Hertfordshire WD3 9SW Tel: +44 (0)1923 776666 [email protected]