a1605 spo09 dt 2020 35 f en
TRANSCRIPT
HELLENIC REPUBLIC
Piraeus, 16 November 2020
HELLENIC STATISTICAL AUTHORITY
PRESS RELEASE
DATA ON WEEKLY DEATHS: 1st to 35th week, 2020
The Hellenic Statistical Authority (ELSTAT) announces an ad-hoc press release with provisional statistical data
depicting the weekly evolution of death counts for the time period from the 1st to the 35th week of 2020. The
data refer to the deaths that occurred in the Greek territory during that period due to various causes including
deaths attributed to Covid-19.
The data included in this publication are compiled within the framework of the Vital Statistics Survey and are
provided from all the Municipal Civil Registers of Greece according to the vital events that have been declared
and registered up until the date of data transmission. Overdue registrations of deaths are integrated at a later
stage in the date of occurrence.
The following tables present data on the weekly evolution of deaths during the first thirty-five (35) weeks of
2020 by gender, age group and usual residence (NUTS 2) of the deceased.
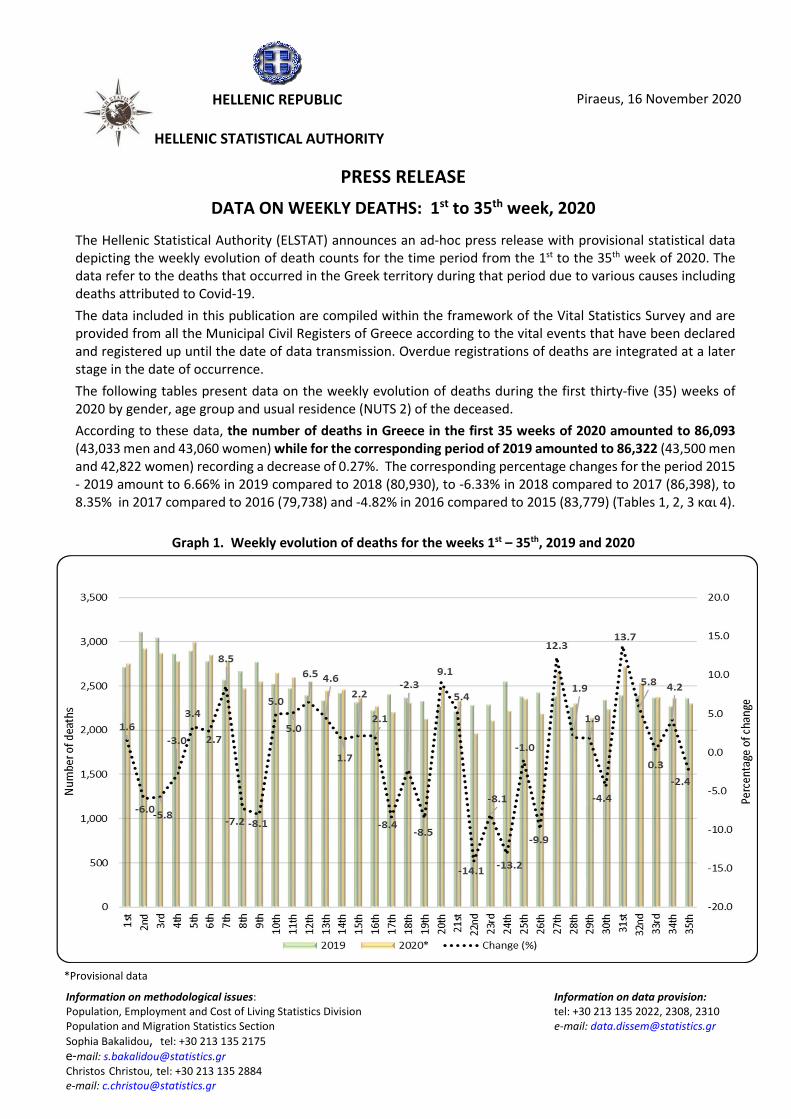
According to these data, the number of deaths in Greece in the first 35 weeks of 2020 amounted to 86,093
(43,033 men and 43,060 women) while for the corresponding period of 2019 amounted to 86,322 (43,500 men
and 42,822 women) recording a decrease of 0.27%. The corresponding percentage changes for the period 2015
- 2019 amount to 6.66% in 2019 compared to 2018 (80,930), to -6.33% in 2018 compared to 2017 (86,398), to
8.35% in 2017 compared to 2016 (79,738) and -4.82% in 2016 compared to 2015 (83,779) (Tables 1, 2, 3 και 4).
Graph 1. Weekly evolution of deaths for the weeks 1st – 35th, 2019 and 2020
*Provisional data
Information on methodological issues: Information on data provision:
Population, Employment and Cost of Living Statistics Division tel: +30 213 135 2022, 2308, 2310
Population and Migration Statistics Section e-mail: [email protected]
Sophia Bakalidou, tel: +30 213 135 2175
e-mail: [email protected]
Christos Christou, tel: +30 213 135 2884
e-mail: [email protected]
2
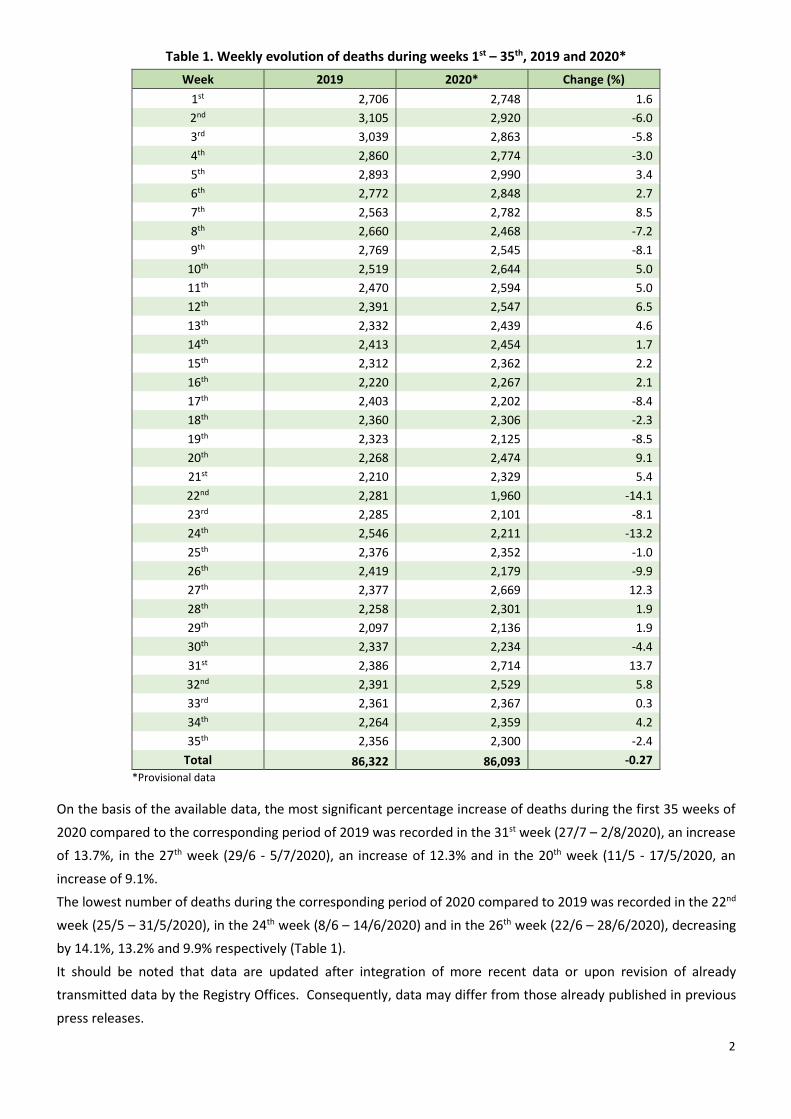
Table 1. Weekly evolution of deaths during weeks 1st – 35th, 2019 and 2020*
Week 2019 2020* Change (%)
1st 2,706 2,748 1.6
2nd 3,105 2,920 -6.0
3rd 3,039 2,863 -5.8
4th 2,860 2,774 -3.0
5th 2,893 2,990 3.4
6th 2,772 2,848 2.7
7th 2,563 2,782 8.5
8th 2,660 2,468 -7.2
9th 2,769 2,545 -8.1
10th 2,519 2,644 5.0
11th 2,470 2,594 5.0
12th 2,391 2,547 6.5
13th 2,332 2,439 4.6
14th 2,413 2,454 1.7
15th 2,312 2,362 2.2
16th 2,220 2,267 2.1
17th 2,403 2,202 -8.4
18th 2,360 2,306 -2.3
19th 2,323 2,125 -8.5
20th 2,268 2,474 9.1
21st 2,210 2,329 5.4
22nd 2,281 1,960 -14.1
23rd 2,285 2,101 -8.1
24th 2,546 2,211 -13.2
25th 2,376 2,352 -1.0
26th 2,419 2,179 -9.9
27th 2,377 2,669 12.3
28th 2,258 2,301 1.9
29th 2,097 2,136 1.9
30th 2,337 2,234 -4.4
31st 2,386 2,714 13.7
32nd 2,391 2,529 5.8
33rd 2,361 2,367 0.3
34th 2,264 2,359 4.2
35th 2,356 2,300 -2.4
Total 86,322 86,093 -0.27
*Provisional data
On the basis of the available data, the most significant percentage increase of deaths during the first 35 weeks of
2020 compared to the corresponding period of 2019 was recorded in the 31st week (27/7 – 2/8/2020), an increase
of 13.7%, in the 27th week (29/6 - 5/7/2020), an increase of 12.3% and in the 20th week (11/5 - 17/5/2020, an
increase of 9.1%.
The lowest number of deaths during the corresponding period of 2020 compared to 2019 was recorded in the 22nd
week (25/5 – 31/5/2020), in the 24th week (8/6 – 14/6/2020) and in the 26th week (22/6 – 28/6/2020), decreasing
by 14.1%, 13.2% and 9.9% respectively (Table 1).
It should be noted that data are updated after integration of more recent data or upon revision of already
transmitted data by the Registry Offices. Consequently, data may differ from those already published in previous
press releases.
3
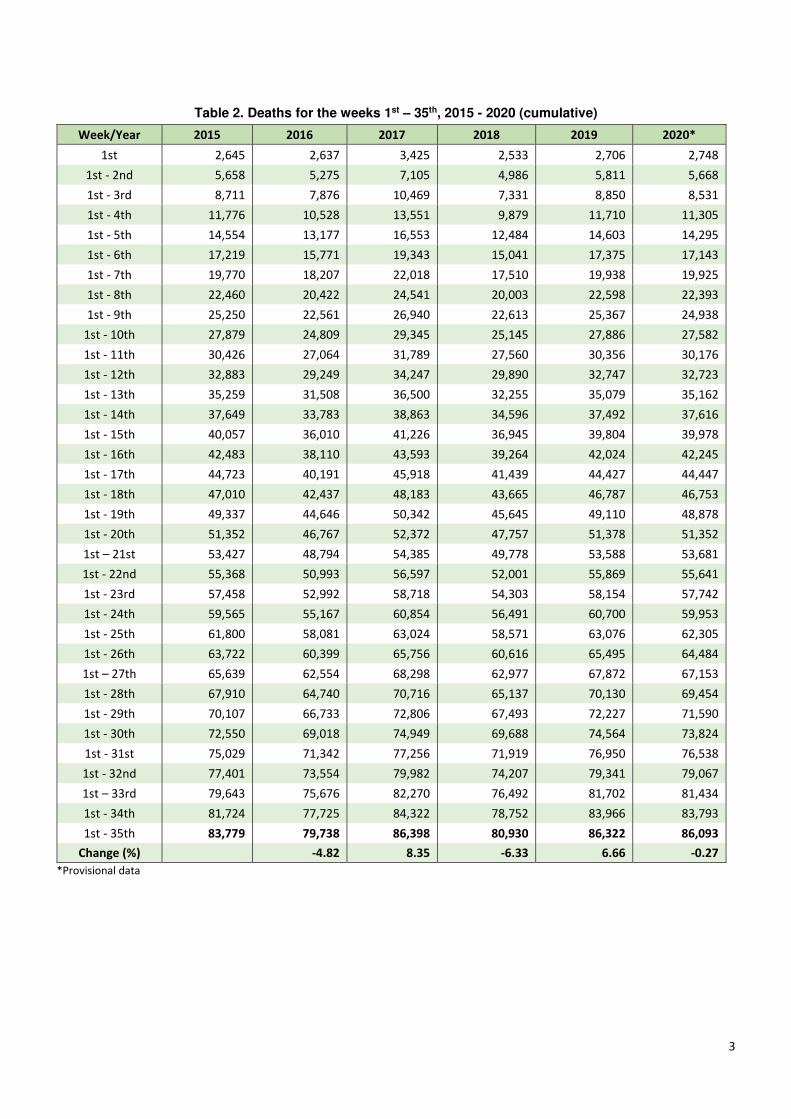
Table 2. Deaths for the weeks 1st – 35th, 2015 - 2020 (cumulative)
Week/Year 2015 2016 2017 2018 2019 2020*
1st 2,645 2,637 3,425 2,533 2,706 2,748
1st - 2nd 5,658 5,275 7,105 4,986 5,811 5,668
1st - 3rd 8,711 7,876 10,469 7,331 8,850 8,531
1st - 4th 11,776 10,528 13,551 9,879 11,710 11,305
1st - 5th 14,554 13,177 16,553 12,484 14,603 14,295
1st - 6th 17,219 15,771 19,343 15,041 17,375 17,143
1st - 7th 19,770 18,207 22,018 17,510 19,938 19,925
1st - 8th 22,460 20,422 24,541 20,003 22,598 22,393
1st - 9th 25,250 22,561 26,940 22,613 25,367 24,938
1st - 10th 27,879 24,809 29,345 25,145 27,886 27,582
1st - 11th 30,426 27,064 31,789 27,560 30,356 30,176
1st - 12th 32,883 29,249 34,247 29,890 32,747 32,723
1st - 13th 35,259 31,508 36,500 32,255 35,079 35,162
1st - 14th 37,649 33,783 38,863 34,596 37,492 37,616
1st - 15th 40,057 36,010 41,226 36,945 39,804 39,978
1st - 16th 42,483 38,110 43,593 39,264 42,024 42,245
1st - 17th 44,723 40,191 45,918 41,439 44,427 44,447
1st - 18th 47,010 42,437 48,183 43,665 46,787 46,753
1st - 19th 49,337 44,646 50,342 45,645 49,110 48,878
1st - 20th 51,352 46,767 52,372 47,757 51,378 51,352
1st – 21st 53,427 48,794 54,385 49,778 53,588 53,681
1st - 22nd 55,368 50,993 56,597 52,001 55,869 55,641
1st - 23rd 57,458 52,992 58,718 54,303 58,154 57,742
1st - 24th 59,565 55,167 60,854 56,491 60,700 59,953
1st - 25th 61,800 58,081 63,024 58,571 63,076 62,305
1st - 26th 63,722 60,399 65,756 60,616 65,495 64,484
1st – 27th 65,639 62,554 68,298 62,977 67,872 67,153
1st - 28th 67,910 64,740 70,716 65,137 70,130 69,454
1st - 29th 70,107 66,733 72,806 67,493 72,227 71,590
1st - 30th 72,550 69,018 74,949 69,688 74,564 73,824
1st - 31st 75,029 71,342 77,256 71,919 76,950 76,538
1st - 32nd 77,401 73,554 79,982 74,207 79,341 79,067
1st – 33rd 79,643 75,676 82,270 76,492 81,702 81,434
1st - 34th 81,724 77,725 84,322 78,752 83,966 83,793
1st - 35th 83,779 79,738 86,398 80,930 86,322 86,093
Change (%) -4.82 8.35 -6.33 6.66 -0.27
*Provisional data

4
Graph 2. Deaths for the weeks 1st – 35th, 2015 - 2020 (cumulative)
Graph 3. Weekly evolution of deaths by sex for the weeks 1st – 35th, 2020*
*Provisional data

5
Table 3. Weekly evolution of deaths by sex for the weeks 1st – 35th, 2020*
Week Total Men Women
1st 2,748 1,387 1,361
2nd 2,920 1,509 1,411
3rd 2,863 1,398 1,465
4th 2,774 1,391 1,383
5th 2,990 1,457 1,533
6th 2,848 1,406 1,442
7th 2,782 1,393 1,389
8th 2,468 1,247 1,221
9th 2,545 1,292 1,253
10th 2,644 1,319 1,325
11th 2,594 1,272 1,322
12th 2,547 1,251 1,296
13th 2,439 1,183 1,256
14th 2,454 1,257 1,197
15th 2,362 1,189 1,173
16th 2,267 1,092 1,175
17th 2,202 1,085 1,117
18th 2,306 1,156 1,150
19th 2,125 1,049 1,076
20th 2,474 1,214 1,260
21st 2,329 1,188 1,141
22nd 1,960 1,031 929
23rd 2,101 1,078 1,023
24th 2,211 1,130 1,081
25th 2,352 1,178 1,174
26th 2,179 1,109 1,070
27th 2,669 1,339 1,330
28th 2,301 1,155 1,146
29th 2,136 1,098 1,038
30th 2,234 1,117 1,117
31st 2,714 1,301 1,413
32nd 2,529 1,225 1,304
33rd 2,367 1,199 1,168
34th 2,359 1,171 1,188
35th 2,300 1,167 1,133
Total 86,093 43,033 43,060
*Provisional data

6
Graph 4. Deaths by age group and sex, weeks 1st – 35th, 2019 and 2020
Table 4. Deaths by age group and sex, weeks 1st – 35th, 2019 and 2020
Year 2019 2020*
Age Total Males Females Total Males Females
0 - 4 260 134 126 252 138 114
5 - 9 23 12 11 23 16 7
10 - 14 34 19 15 22 13 9
15 - 19 83 56 27 76 55 21
20 - 24 162 129 33 128 103 25
25 - 29 176 139 37 164 123 41
30 - 34 233 172 61 219 159 60
35 - 39 365 269 96 339 238 101
40 - 44 646 444 202 622 404 218
45 - 49 993 665 328 1,037 679 358
50 - 54 1,795 1,202 593 1,686 1,098 588
55 - 59 2,594 1,792 802 2,508 1,683 825
60 - 64 3,684 2,546 1,138 3,688 2,491 1,197
65 - 69 4,835 3,227 1,608 5,038 3,330 1,708
70 - 74 7,084 4,447 2,637 7,032 4,445 2,587
75 - 79 9,011 5,239 3,772 8,795 5,113 3,682
80 - 84 15,868 7,893 7,975 15,285 7,495 7,790
85 - 90 19,637 8,429 11,208 19,643 8,469 11,174
90+ 18,833 6,681 12,152 19,524 6,972 12,552
Unknown 6 5 1 12 9 3
Total 86,322 43,500 42,822 86,093 43,033 43,060
*Provisional data
As regards the breakdown of data by sex and age, it is observed that during the first 35 weeks of 2020, deaths
outnumbered those in the corresponding period of 2019 , mostly in the age groups 45 to 49, 65 to 69 and over
90 years old by 4.4%, 4.2% and 3.7% respectively (Table 4).
7
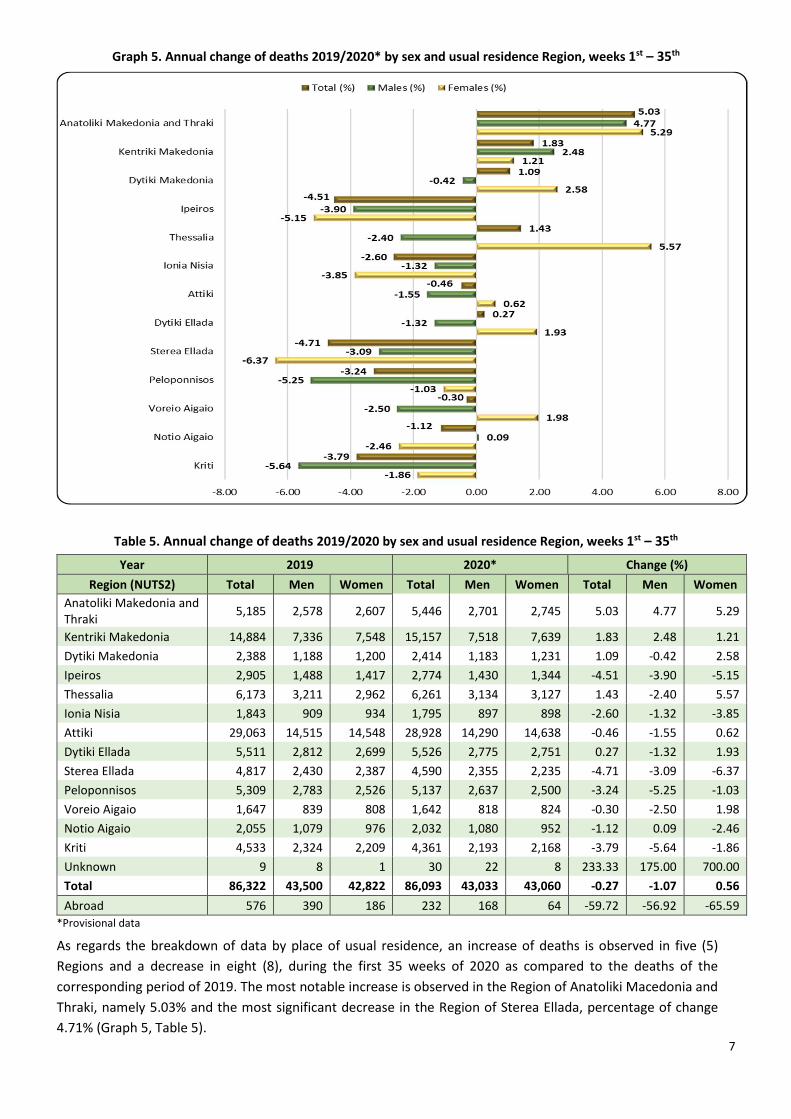
Graph 5. Annual change of deaths 2019/2020* by sex and usual residence Region, weeks 1st – 35th
Table 5. Annual change of deaths 2019/2020 by sex and usual residence Region, weeks 1st – 35th
Year 2019 2020* Change (%)
Region (NUTS2) Total Men Women Total Men Women Total Men Women
Anatoliki Makedonia and
Thraki 5,185 2,578 2,607 5,446 2,701 2,745 5.03 4.77 5.29
Kentriki Makedonia 14,884 7,336 7,548 15,157 7,518 7,639 1.83 2.48 1.21
Dytiki Makedonia 2,388 1,188 1,200 2,414 1,183 1,231 1.09 -0.42 2.58
Ipeiros 2,905 1,488 1,417 2,774 1,430 1,344 -4.51 -3.90 -5.15
Thessalia 6,173 3,211 2,962 6,261 3,134 3,127 1.43 -2.40 5.57
Ionia Nisia 1,843 909 934 1,795 897 898 -2.60 -1.32 -3.85
Attiki 29,063 14,515 14,548 28,928 14,290 14,638 -0.46 -1.55 0.62
Dytiki Ellada 5,511 2,812 2,699 5,526 2,775 2,751 0.27 -1.32 1.93
Sterea Ellada 4,817 2,430 2,387 4,590 2,355 2,235 -4.71 -3.09 -6.37
Peloponnisos 5,309 2,783 2,526 5,137 2,637 2,500 -3.24 -5.25 -1.03
Voreio Aigaio 1,647 839 808 1,642 818 824 -0.30 -2.50 1.98
Notio Aigaio 2,055 1,079 976 2,032 1,080 952 -1.12 0.09 -2.46
Kriti 4,533 2,324 2,209 4,361 2,193 2,168 -3.79 -5.64 -1.86
Unknown 9 8 1 30 22 8 233.33 175.00 700.00
Total 86,322 43,500 42,822 86,093 43,033 43,060 -0.27 -1.07 0.56
Abroad 576 390 186 232 168 64 -59.72 -56.92 -65.59
*Provisional data
As regards the breakdown of data by place of usual residence, an increase of deaths is observed in five (5)
Regions and a decrease in eight (8), during the first 35 weeks of 2020 as compared to the deaths of the
corresponding period of 2019. The most notable increase is observed in the Region of Anatoliki Macedonia and
Thraki, namely 5.03% and the most significant decrease in the Region of Sterea Ellada, percentage of change
4.71% (Graph 5, Table 5).

8
EXPLANATORY NOTES
Vital
Statistics-
Data on
weekly deaths
For the Vital statistics Survey, data are provided by Civil Register Offices from all over the Country. Data
presented in this press release refer to the weekly evolution of death counts for the time period from
week 1 to week 35 of the current year. This is an ad-hoc data processing for the purpose of depicting the
evolution of deaths during the Covid-19 pandemic.
Legal
Framework
Law 344/76 concerning the “Registration of vital events” which lays down the obligations of the Civil
Register Offices to collect and then transmit the data, as well as by Law 3832/2010 on the “Greek Statistical
System”, as amended.
Coverage
Definitions
Methodology
Geographical
classification
The Vital Statistics survey is an exhaustive survey and covers all deaths of usual resident population that
occur in the Greek territory.
All deaths of usual residents taking place in the Greek territory are recorded, regardless of the cause of
death. Deaths of usual resident population of other countries are also recorded but not counted. The
deaths of migrants-refugees during their attempt to approach the Greek islands from the Turkish shores
(drownings) are not included.
Causes of death are defined according to the International Statistical Classification of Diseases and
Related Health Problems (ICD-10) and basic breakdowns are Diseases of the Circulatory System, Diseases
of the Respiratory System, Neoplasms, Infectious and Parasitic Diseases, Violent deaths and other causes,
Covid-19 included.
Data on deaths and vital statistics undergo the necessary quality checks, are processed and presented in
the form of tables.
Geographical classification is based on the Nomenclature of Territorial Units for Statistics (NUTS). Data
are disseminated at Country and Region (NUTS2) level.
Map of the Regions (NUTS2) of Greece

9
Reference
Period
2020: 30/12/2019 - 30/08/2020
2019: 31/12/2018 - 01/09/2019
Weeks by year are defined according to international standard ISO8601 as follows:
WEEK 2019 2020
1st 31/12/2018 - 6/1/2019 30/12/2019 - 5/1/2020
2nd 7/1/2019 - 13/1/2019 6/1/2020 - 12/1/2020
3rd 14/1/2019 - 20/1/2019 13/1/2020 - 19/1/2020
4th 21/1/2019 - 27/1/2019 20/1/2020 - 26/1/2020
5th 28/1/2019 - 3/2/2019 27/1/2020 - 2/2/2020
6th 4/2/2019 - 10/2/2019 3/2/2020 - 9/2/2020
7th 11/2/2019 - 17/2/2019 10/2/2020 - 16/2/2020
8th 18/2/2019 - 24/2/2019 17/2/2020 - 23/2/2020
9th 25/2/2019 - 3/3/2019 24/2/2020 - 1/3/2020
10th 4/3/2019- 10/3/2019 2/3/2020 - 8/3/2020
11th 11/3/2019 - 17/3/2019 9/3/2020 - 15/3/2020
12th 18/3/2019 - 24/3/2019 16/3/2020 - 22/3/2020
13th 25/3/2019- 31/3/2019 23/3/2020 - 29/3/2020
14th 1/4/2019 - 7/4/2019 30/3/2020 - 5/4/2020
15th 8/4/2019 - 14/4/2019 6/4/2020 - 12/4/2020
16th 15/4/2019 - 21/4/2019 13/4/2020 - 19/4/2020
17th 22/4/2019 - 28/4/2019 20/4/2020 - 26/4/2020
18th 29/4/2019 - 5/5/2019 27/4/2020 - 3/5/2020
19th 6/5/2019 - 12/5/2019 4/5/2020 - 10/5/2020
20th 13/5/2019 - 19/5/2019 11/5/2020 - 17/5/2020
21st 20/5/2019 - 26/5/2019 18/5/2020 - 24/5/2020
22nd 27/5/2019 - 2/6/2019 25/5/2020 - 31/5/2020
23rd 3/6/2019 - 9/6/2019 1/6/2020 - 7/6/2020
24th 10/6/2019 - 16/6/2019 8/6/2020 - 14/6/2020
25th 17/6/2019 - 23/6/2019 15/6/2020 - 21/6/2020
26th 24/6/2019 - 30/6/2019 22/6/2020 - 28/6/2020
27th 1/7/2019 - 7/7/2019 29/6/2020 - 5/7/2020
28th 8/7/2019 - 14/7/2019 6/7/2020 - 12/7/2020
29th 15/7/2019 - 21/7/2019 13/7/2020 - 19/7/2020
30th 22/7/2019 - 28/7/2019 20/7/2020 - 26/7/2020
31st 29/7/2019 - 4/8/2019 27/7/2020 - 2/8/2020
32nd 5/8/2019 - 11/8/2019 3/8/2020 - 9/8/2020
33rd 12/8/2019 - 18/8/2019 10/8/2020 - 16/8/2020
34th 19/8/2019 - 25/8/2019 17/8/2020 - 23/8/2020
35th 26/8/2019 - 1/9/2019 24/8/2020 - 30/8/2020
References: More information (tables, graphs, methodology) is available on the website of ELSTAT:
http//www.statistics.gr, at the link Statistics > Population and Social Conditions > Demography.