a2a2 h1h1 h2h2 the food web primary producers primary consumers d detritus and associated microflora...
Post on 19-Dec-2015
212 views
TRANSCRIPT

A2
H1 H2
The food web
Primary producers
Primary consumers
D Detritus and associatedMicroflora (bacteria/fungi)
P
Death and sedimentation
herbivore detritivore
A1
inedible
Secondary Productivity:Primary production supportsa web of consumers—a simple example
Productivity
Biomass

ratedeath specific theis and rategrowth or production specific theis
,population theofty productivi thecalled is birth term The
formed. is biomass newat which rate theisty Productivi
lost. and formed isit at which rate the
between difference theis biomass of rategrowth net theisthat
balance mass a as written becan biomassfor equation rateA
mb
mBbBdt
dB
Defining some productivity terms
Birth (production) term
Death (loss) termB
bB/t
mB/t
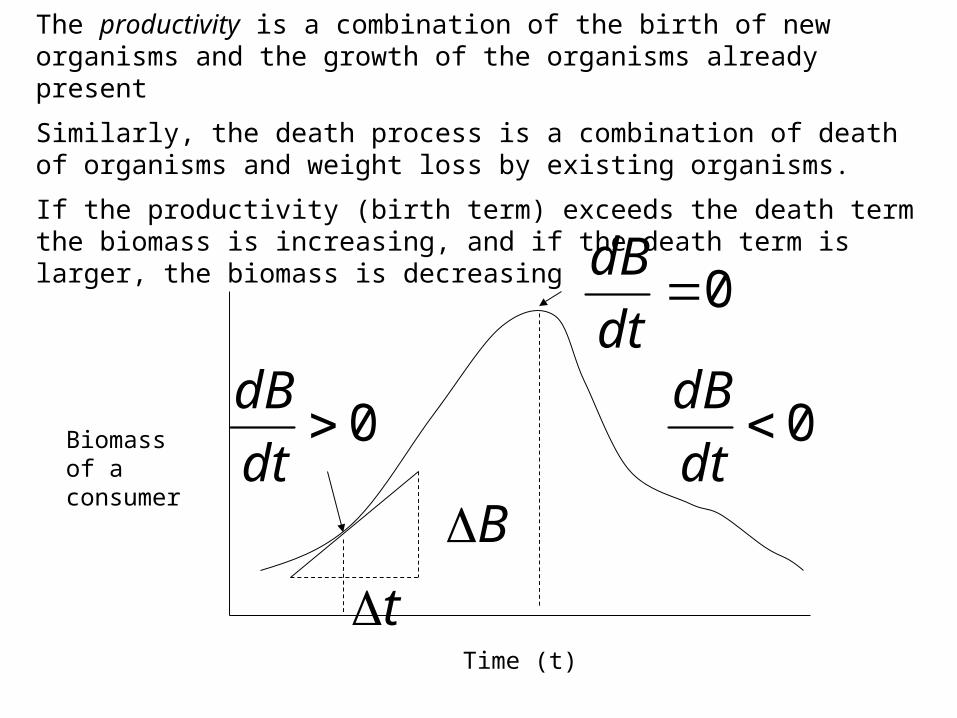
The productivity is a combination of the birth of new organisms and the growth of the organisms already present
Similarly, the death process is a combination of death of organisms and weight loss by existing organisms.
If the productivity (birth term) exceeds the death term the biomass is increasing, and if the death term is larger, the biomass is decreasing
Time (t)
Biomass of a consumer
0dt
dB
B
t
0dt
dB
0dt
dB
Time (t)
RotiferBiomass
0dt
dR
R
t
0dt
dR
0dt
dR
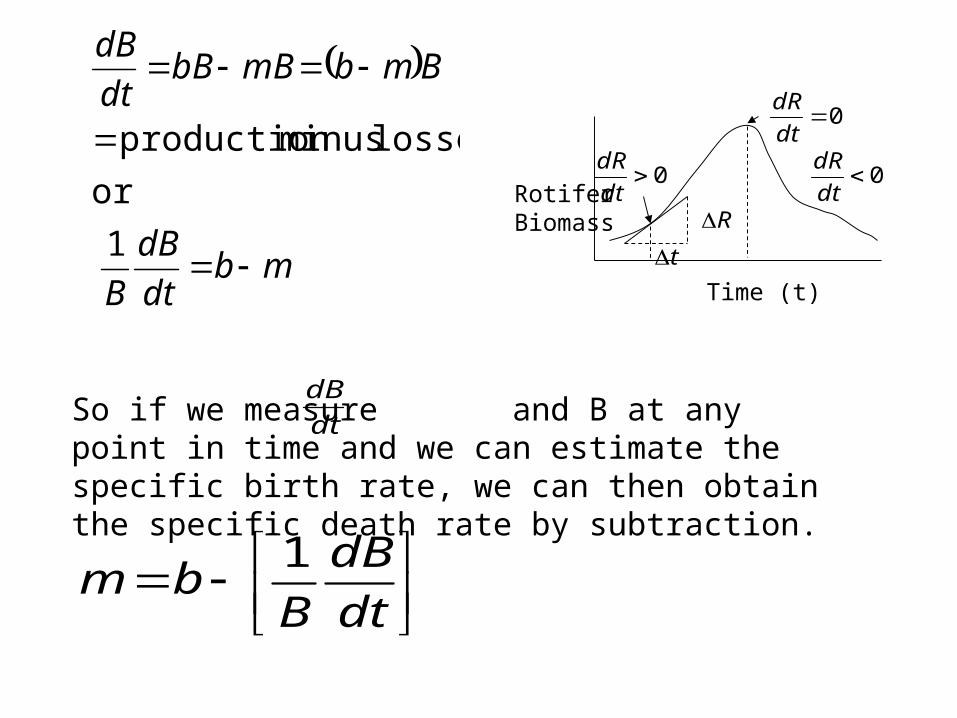
So if we measure and B at any point in time and we can estimate the specific birth rate, we can then obtain the specific death rate by subtraction.
dt
dB
dt
dB
Bbm
1
mbdt
dB
B
BmbmBbBdt
dB
1
or
losses minus production

•For a tiny consumer like a rotifer the birth rate is easy to estimate since the adult females carry their eggs around until they hatch
•When they hatch they come out as full sized rotifers. •If we know the fraction of adults carrying egs and the average time it takes for eggs to hatch, we can calculate the birth rate. •Since the rotifers are born more or less full size, so there is no need to model or measure the growth of individuals.
A tiny organism like a rotifer is born at full size, so productivity amounts to measuring the rate at which new animals are born
Rotifers carrying eggs

1-d
rate hatching1
(d) hatchingfor required timeavg
,adults#
eggs#
T
Eb
T
T
E
dt
dB
BT
Em
1
Time (t)
RotiferBiomass
0dt
dR
R
t
0dt
dR
0dt
dR

For a large organism like a fish, biomass production occurs mostly from individual growth. New born fish are so tiny that birth of individuals makes a negligible contribution to biomass production
1W2W
3W
4W
t
tt
W
WSGR
1ln
Year classes
The Wt represent the Weights of each year class
•We can calculate the growth rate of biomass individual fish by weighing fish and determining their age and then seeing how much weight they gain each year.
•The productivity of each age class is the Specific growth rate (SGR) of that age class times the total biomass of that age class in the population.

t
t
B
Bt
t
avg
it
tt
i t
SGRSGR
BSGRP
*
*
be would tablelife wholeover the species afor SGR Average
category trophicin the species allover summed and classes, age ofeach for
present] biomass timesrategrowth [specific of sum Production
This approach assumes that the size vs age relationship is relatively constant.
1W2W
3W
4W
t
tt
W
WSGR
1ln
The Wtrepresent the Weights of each year class
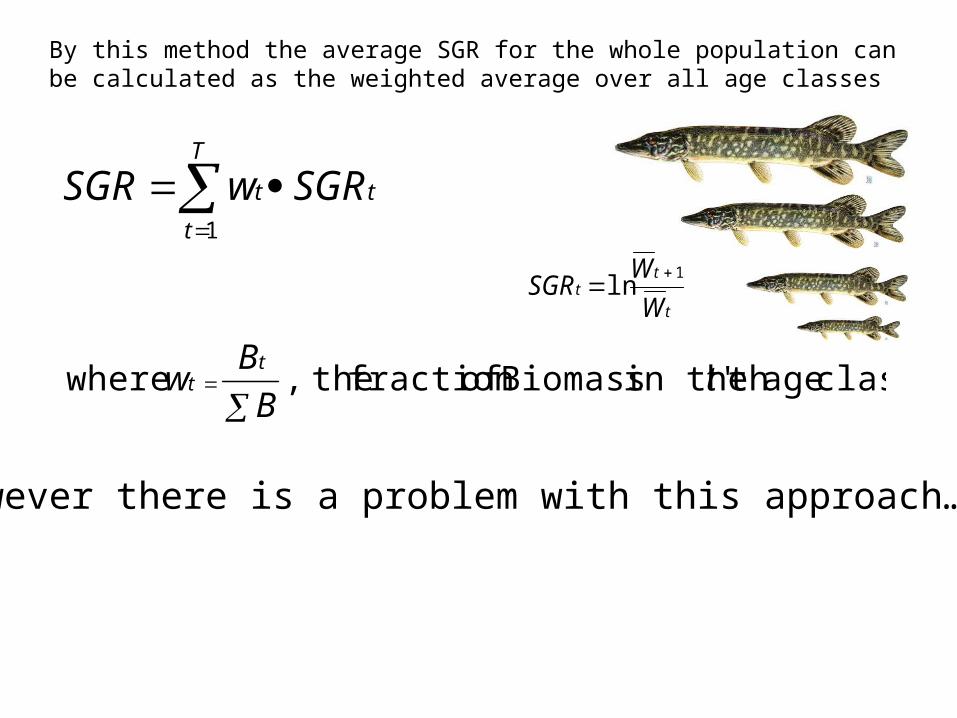
By this method the average SGR for the whole population can be calculated as the weighted average over all age classes
However there is a problem with this approach…???
1
t
T
t
t SGRwSGR
class ageth ' in the Biomass offraction the, where tB
Bw
tt
t
tt
W
WSGR
1ln

However there is a problem with this approach.
By considering only the gain in weight across age classes, this method ignores weight gained and lost within the same year, eg Gonad tissue Adult fish usually convert a considerable portion of their body mass to gonads and release it during spawning every year.Thus it does not add to next year’s weight and would not be recorded as growth
We can quite easily correct for this by factoring in gonad production (add GSI)
weighttotal
weightgonad matureindex) atic(Gonadosom where
GSI
GSISGRt
We would of course only make this GSI correction on adult age classes.

Scales of a chum salmon
2+
3+
4+
Measuredistances fromscale center to eachannulus along a chosenaxis
T
A
L
L
length scale total
annulus todistance
How can we tell how old a fish is?

LA
Age yr
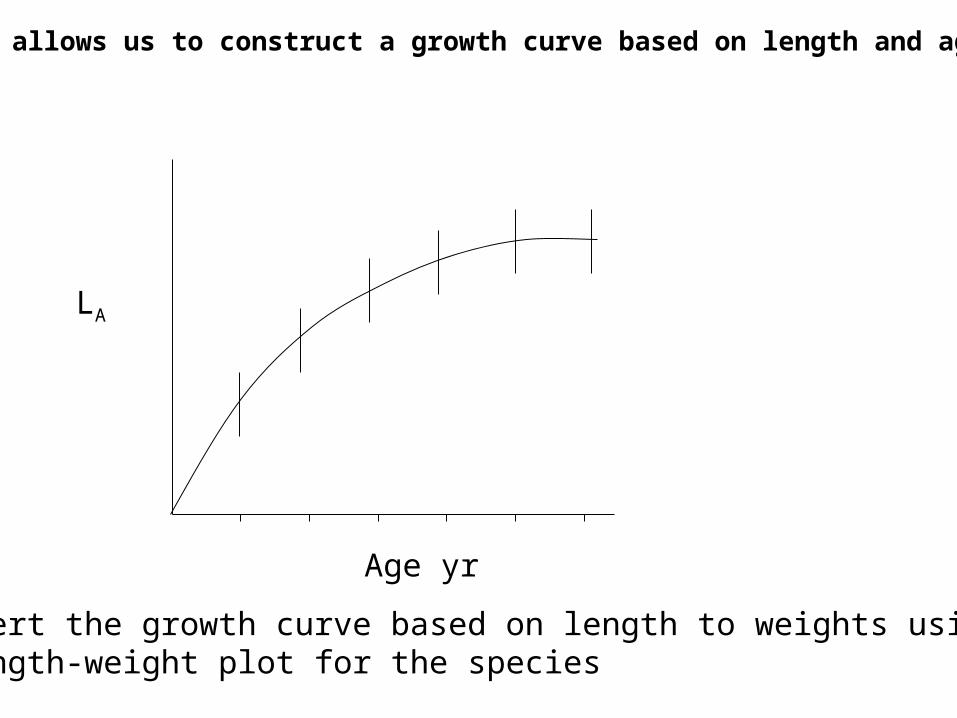
Convert the growth curve based on length to weights usinga length-weight plot for the species
This allows us to construct a growth curve based on length and age.

Many types of bony structures are commonly used to determine age of fish
Scale Otolith Opercular bone
These three structures are all from the same 3+ year old 30 cm cutthroat trout

The specific death rates can also be estimated from the population structure. This time we assume that the age structure of the population is constant, and that the numbers of individuals of each age within a sample reflects the proportion of that age group in the population.Assume we have a sample of 215 pike from a population.
215
1101
t
tN
N
552 N
303 N
204 N
The Nt / Nt represent the proportion of the population in each year class
69.0110
55ln1 m
61.055
30ln2 m
41.030
20ln3 m
t
tt
N
Nm
1ln

Age1 3 50
*
*
*
*
110
30
55
20
#
0
50
100
The survivorship curve assuming stable age structure for the population looks like this
t
tt
N
Nm
1ln
m1 =0.69
150
m3 =0.41
m2 =0.61

equal. are terms two thepopulation stable aFor
biomassin decreasing is population theotherwise
biomassin growing is population thelosses, exceedsty productivi If
processes loss andgrowth itsbetween difference the
as modelledusually is species afor biomass of change of rate The
mSGRBGSImBGSISGRBdt
dB
Productivity term loss term
Summary