a30 - draft report on the near-field smolt behavior study … · upper baker near field smolt...
TRANSCRIPT

Upper Baker Near Field Smolt Behavior Study
Baker River Relicensing Page iAcoustic tracking study 2002.doc
DRAFT REPORT ON THE NEAR-FIELD SMOLTBEHAVIOR STUDY IN BAKER LAKE,
WASHINGTON
Prepared for
Puget Sound Energy
By
November 2002Unpublished work, Copyright 2002, Puget Sound Energy, Inc.

Upper Baker Near Field Smolt Behavior Study
Baker River Relicensing Page iiAcoustic tracking study 2002.doc

Upper Baker Near Field Smolt Behavior Study
Baker River Relicensing Page iiiAcoustic tracking study 2002.doc
TABLE OF CONTENTS
1.0 NEAR FIELD SMOLT BEHAVIOR STUDY............................................................................... 1
1.1 Introduction .............................................................................................................................. 1
1.2 Study Area ................................................................................................................................ 11.2.1 Project Facilities and Operations..................................................................................... 3
1.3 Objectives ................................................................................................................................. 4
1.4 Study Methods.......................................................................................................................... 41.4.1 Study Design ................................................................................................................... 41.4.2 Acoustic Tag System Configuration ............................................................................... 61.4.3 Smolt Collection.............................................................................................................. 91.4.4 Smolt Tagging............................................................................................................... 101.4.5 Smolt Release................................................................................................................ 101.4.6 Acoustic Fish Tracking ................................................................................................. 161.4.7 Data Analysis ................................................................................................................ 16
1.5 Study Results and Discussion................................................................................................. 191.5.1 Tagging Mortality & Tag Activation Errors ................................................................. 191.5.2 Descriptive Results of Fish Behavior from Fish Tracks and Density Plots .................. 191.5.3. Incomplete Fish Detections and Missing Fish ............................................................. 361.5.4. Manual Tracking Outside the Forebay......................................................................... 37
1.6 References .............................................................................................................................. 39
LIST OF APPENDICES
Appendix A. Individual fish tracks for acoustically-tagged fish released in Baker Lake,Washington (2002).
Appendix B. Density plots for coho and sockeye salmon smolts released in Baker Lake,Washington (2002).
Appendix C. Master Schedule of Near Field Smolt Behavior Study At Baker Lake,Washington (2002).
Appendix D. Acoustic Manual Tracking Zones used in Baker Lake, Washington (2002).

Upper Baker Near Field Smolt Behavior Study
Baker River Relicensing Page ivAcoustic tracking study 2002.doc
LIST OF TABLES
Table 1. Summary information for coho salmon and sockeye salmon smolts releasedwith acoustic tags in Baker Lake, Washington (2002). SC=Surface Collector,SE=Standard Error, UB=Upper Baker, OLB=Outer Log Boom, LS=Lake Shannon ...........12
Table 2. Approach vectors of coho salmon and sockeye salmon smolts into the UpperBaker forebay during Spring 2002. Approach vectors were determined from 3Dinterpolations of an individual fish’s position with the acoustic array. OLB=OuterLog Boom...............................................................................................................................21
Table 3. Categorical breakdown of fish behavior during their approach and residencetime in the Upper Baker forebaly from individual fish tracks generated withAcousticTag software. Coho salmon and sockeye salmon smolts were released intoBaker Lake, Washington (2002). ...........................................................................................23
Table 4. Diving behavior of coho salmon and sockeye salmon smolts detected in theUpper Baker forebay in Spring 2002. OLB=Outer Log Boom, SC=SurfaceCollector .................................................................................................................................24
Table 5. Proportion of coho salmon and sockeye salmon that exhibited milling behaviorin the Upper Baker forebay, as shown by individual fish tracks generated withAcousticTag software. Coho salmon and sockeye salmon smolts were released intoBaker Lake, Washington (2002). ...........................................................................................28
Table 6. Categorical breakdown of fish crossing behavior in the forebay of Baker Lakefrom individual fish tracks generated with AcousticTag software. Coho salmon andsockeye salmon smolts were released into Baker Lake, Washington (2002). .......................32
Table 7. Proportion of coho salmon and sockeye salmon that crossed the guide net, asshown by individual fish tracks generated with AcousticTag software. Coho salmonand sockeye salmon smolts were released into Baker Lake, Washington (2002)..................32
Table 8. Categorical breakdown of fish crossing behavior in front of the surface collectorfrom individual fish tracks generated with AcousticTag software. Coho salmon andsockeye salmon smolts were released into Baker Lake, Washington (2002). .......................33
Table 9. Coho salmon and sockeye salmon smolts detected during manual trackingoutside of Upper Baker forebay (2002). Reservoir Zones are depicted in AppendixD. Italics indicate fish that had no or too few detections by the fixed array within theforebay....................................................................................................................................38

Upper Baker Near Field Smolt Behavior Study
Baker River Relicensing Page vAcoustic tracking study 2002.doc
LIST OF FIGURES
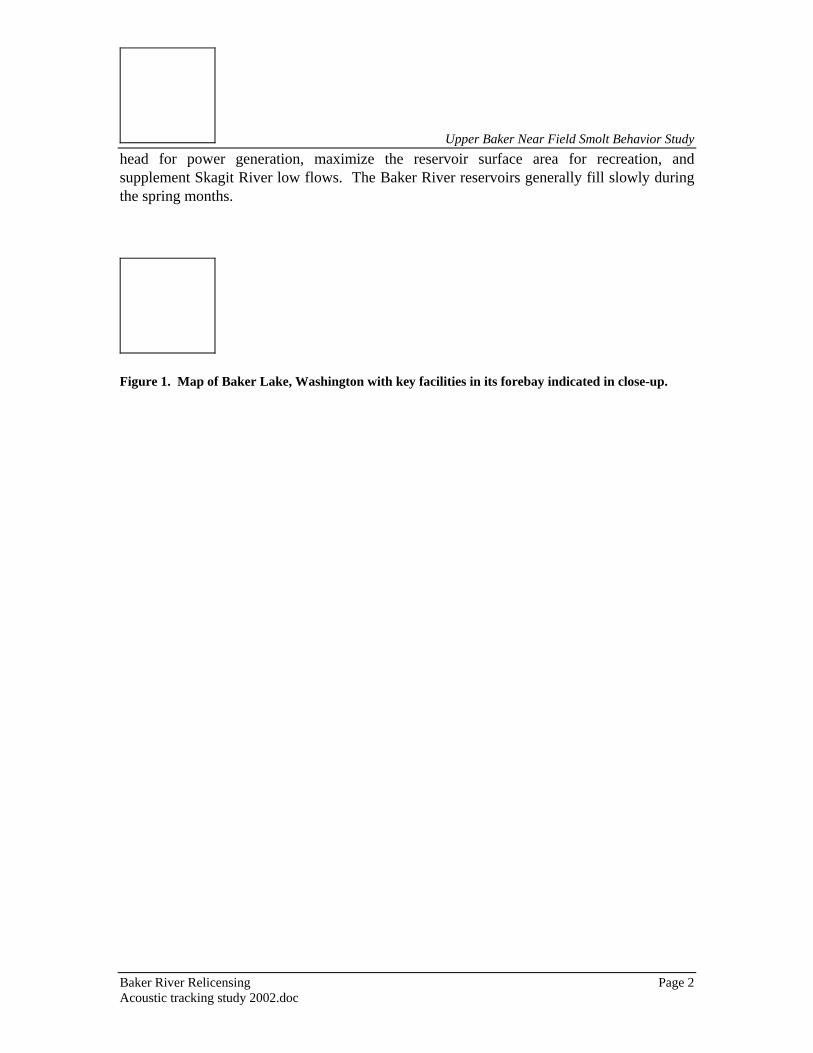
Figure 1. Map of Baker Lake, Washington with key facilities in its forebay indicated inclose-up.......................................................................................................................................... 2
Figure 2. Pool level during 2002 downstream studies with coho salmon releases denoted.Coho salmon were released at the surface collection barge (squares) and the outer logboom (diamonds) on the third day of 7-day treatment periods (ON/OFF) in low and highpool conditions............................................................................................................................... 5
Figure 3. Pool level during 2002 downstream studies with sockeye salmon releases denoted.Sockeye salmon were released 1 mile upstream of the outer log boom (squares) on thethird day of 7-day treatment periods (ON/OFF) in high pool conditions. ..................................... 6
Figure 4. Hydrophone array for the near field smolt behavior study at Baker Lake,Washington. ................................................................................................................................... 7
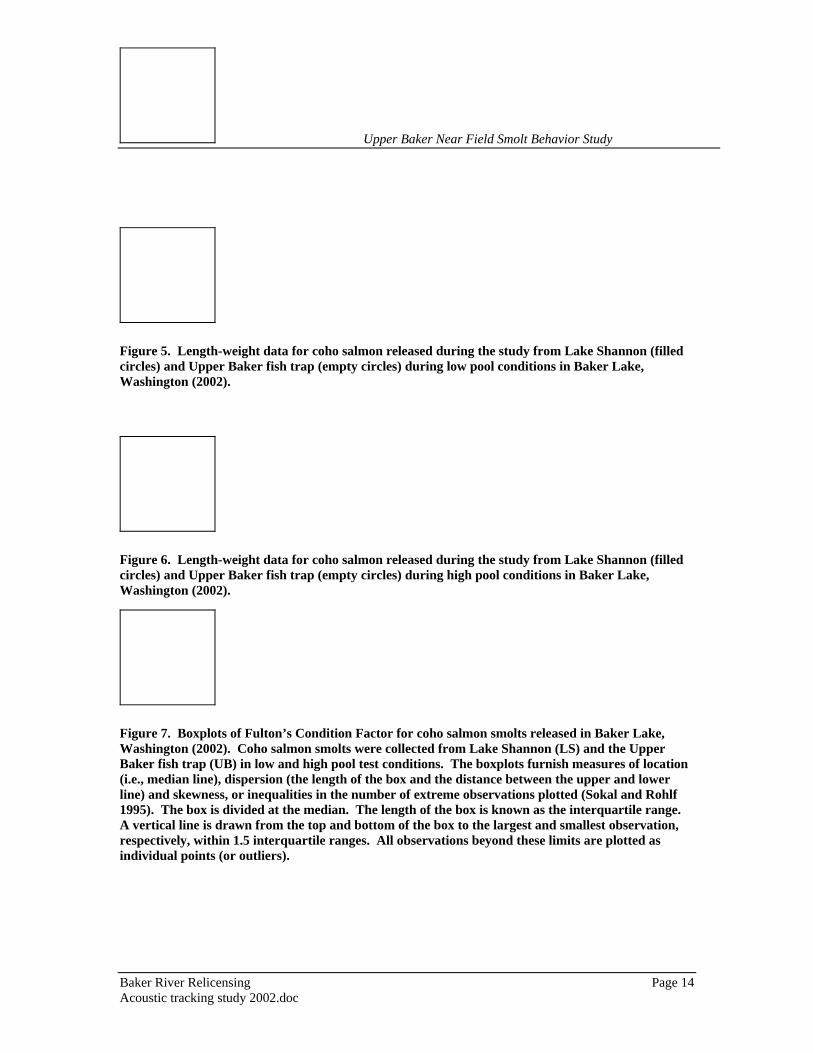
Figure 5. Length-weight data for coho salmon released during the study from Lake Shannon(filled circles) and Upper Baker fish trap (empty circles) during low pool conditions inBaker Lake, Washington (2002).................................................................................................. 14
Figure 6. Length-weight data for coho salmon released during the study from Lake Shannon(filled circles) and Upper Baker fish trap (empty circles) during high pool conditions inBaker Lake, Washington (2002).................................................................................................. 14
Figure 7. Boxplots of Fulton’s Condition Factor for coho salmon smolts released in BakerLake, Washington (2002). Coho salmon smolts were collected from Lake Shannon (LS)and the Upper Baker fish trap (UB) in low and high pool test conditions. The boxplotsfurnish measures of location (i.e., median line), dispersion (the length of the box and thedistance between the upper and lower line) and skewness, or inequalities in the numberof extreme observations plotted (Sokal and Rohlf 1995). The box is divided at themedian. The length of the box is known as the interquartile range. A vertical line isdrawn from the top and bottom of the box to the largest and smallest observation,respectively, within 1.5 interquartile ranges. All observations beyond these limits areplotted as individual points (or outliers). ..................................................................................... 14
Figure 8. Length-weight data for sockeye salmon released during the study from the UpperBaker fish trap during high pool conditions in Baker Lake, Washington (2002)........................ 15
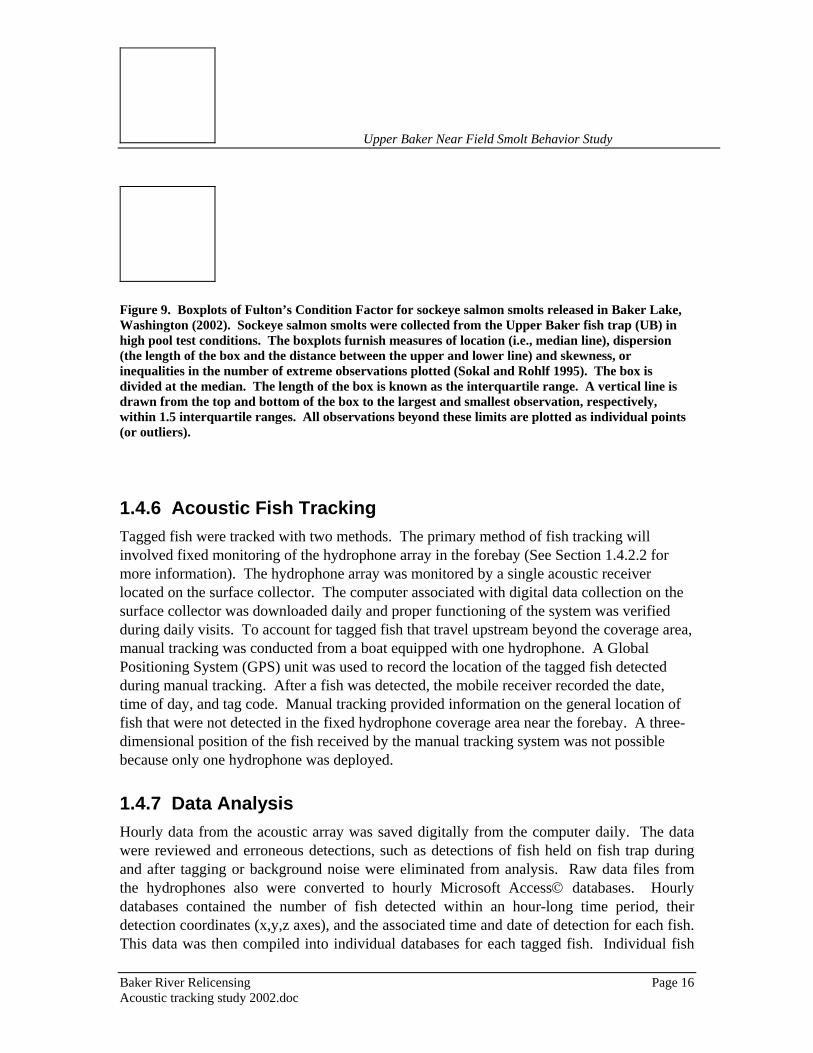
Figure 9. Boxplots of Fulton’s Condition Factor for sockeye salmon smolts released in BakerLake, Washington (2002). Sockeye salmon smolts were collected from the Upper Bakerfish trap (UB) in high pool test conditions. The boxplots furnish measures of location(i.e., median line), dispersion (the length of the box and the distance between the upperand lower line) and skewness, or inequalities in the number of extreme observationsplotted (Sokal and Rohlf 1995). The box is divided at the median. The length of thebox is known as the interquartile range. A vertical line is drawn from the top andbottom of the box to the largest and smallest observation, respectively, within 1.5interquartile ranges. All observations beyond these limits are plotted as individualpoints (or outliers)........................................................................................................................ 16

Upper Baker Near Field Smolt Behavior Study
Baker River Relicensing Page viAcoustic tracking study 2002.doc
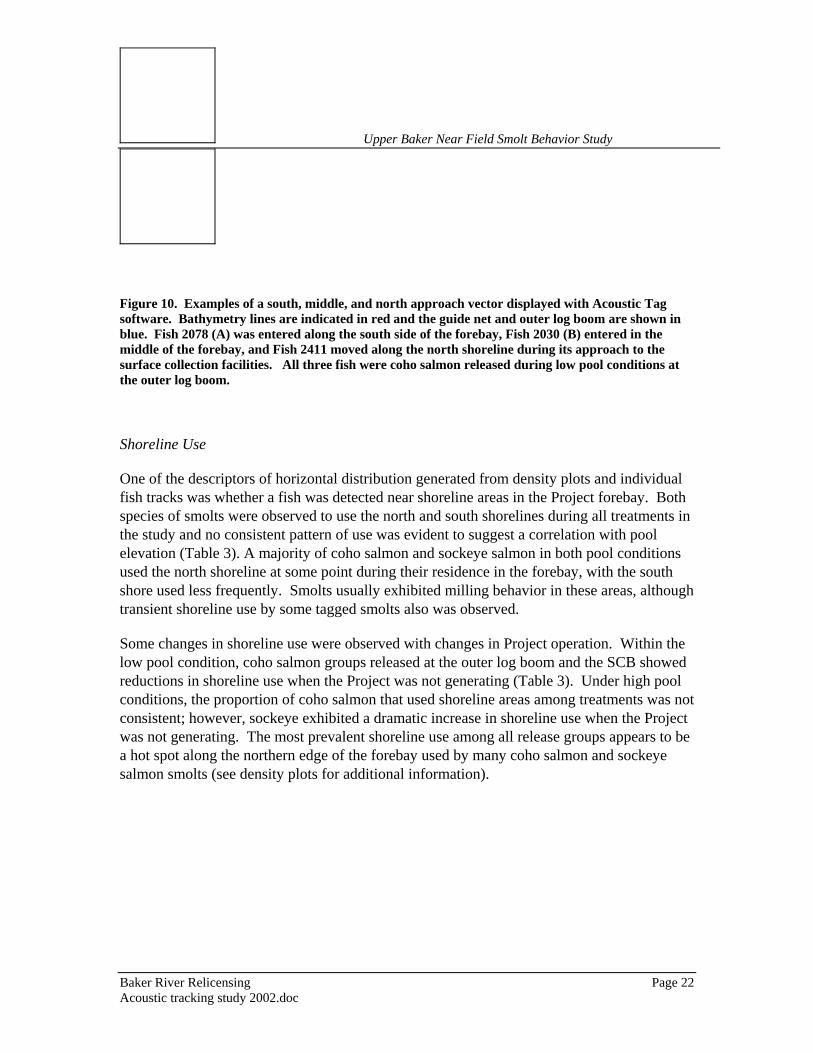
Figure 10. Examples of a south, middle, and north approach vector displayed with AcousticTag software. Bathymetry lines are indicated in red and the guide net and outer logboom are shown in blue. Fish 2078 (A) was entered along the south side of the forebay,Fish 2030 (B) entered in the middle of the forebay, and Fish 2411 moved along thenorth shoreline during its approach to the surface collection facilities. All three fishwere coho salmon released during low pool conditions at the outer log boom........................... 22
Figure 11. Example of diving behavior along guide net in Upper Baker forebay displayedwith Acoustic Tag software. Coho salmon #2105 was released at the outer log boomunder the non-generating treatment in high pool conditions. ...................................................... 26
Figure 12. Density plot example (top and side views) that shows four typical “hot spots” inthe Upper Baker forebay. Coho salmon that compose this density plot were released atthe outer log boom during Project generation and low pool conditions. ..................................... 29
Figure 13. Typical example of milling behavior along guide net in Upper Baker forebaydisplayed with Acoustic Tag software. Coho salmon #2528 was released at the outerlog boom under the generating treatment in low pool conditions. .............................................. 30
Figure 14. Categorical distribution of residence time in Upper Baker forebay foracoustically-tagged coho salmon. Coho salmon were released in low pool conditionsduring Spring 2002 at the outer log boom (top) and the mouth of the SCB (bottom). Thenumber of detected smolts in each release group is indicated in the figure legend..................... 35
Figure 15. Categorical distribution of residence time in Upper Baker forebay foracoustically-tagged coho salmon released in high pool conditions. Coho salmon werereleased at the outer log boom (top) and mouth of the SCB (bottom). The number offish detected in each release group is depicted in the figure legend............................................ 36
Figure 16. Categorical distribution of residence time in Upper Baker forebay foracoustically-tagged sockeye salmon released in high pool conditions. Sockeye salmonwere released at 1 mile upstream of the outer log boom. ............................................................ 36
Upper Baker Near Field Smolt Behavior Study
Baker River Relicensing Page 1Acoustic tracking study 2002.doc
1.0 NEAR FIELD SMOLT BEHAVIOR STUDY
1.1 IntroductionIn 2000, Puget Sound Energy (PSE) initiated the process for relicensing the Baker RiverHydroelectric Project (Project), FERC #2150. In the early stages of this process, PSE andrelicensing participants identified several priority issues. One of these issues was improvingdownstream fish passage facilities. Many downstream passage improvements are beingconsidered by PSE and relicensing participants. In order to proceed with selecting the bestpossible alternative, more information is needed on the migratory behavior of fishes in thereservoirs and the effectiveness of existing passage facilities. As such, the Baker RiverRelicensing Fish Passage Technical Workgroup, composed of engineers and biologists fromPSE, National Marine Fisheries Service (NMFS), U.S. Fish and Wildlife Service (USFWS),U.S. Forest Service (USFS), National Park Service (NPS), Skagit System Tribal Cooperative(SSC), Trout Unlimited (TU), and Washington Department of Fish and Wildlife (WDFW),identified four field studies in 2002 to identify migratory pathways of smolts and possibleProject influences on their migration. The fourth study was a fish tagging investigation thatused acoustic tags to better understand the behavior of migratory juvenile salmonids as theymoved through the forebay and approached the Upper Baker collection barge. The acoustictagging study was designed to complement radio telemetry and PIT-tagging studies as well asongoing mark-recapture efforts with wild salmon smolts emigrating from Little Park Creek.
Acoustic technology has been used to monitor fish movement for over 25 years (Timko et al.2001). This technology was chosen over other tracking methods for this near field studybecause it allows remote tracking of fish in three dimensions. Three-dimensional tracking ofjuvenile salmonids was used to better understand how fish behave in the forebay of the UpperBaker Dam, how they approach the surface collection barge (SCB), and the potential effectsof reservoir conditions and Project operations on the behavior of downstream migrants.
1.2 Study AreaThe Baker River is located within Skagit and Whatcom counties in northwest Washington. Itdrains approximately 297 square miles from the summit of Mount Baker to its confluencewith the Skagit River near Concrete, Washington. PSE operates two hydroelectric facilitieson the Baker River. The Lower Baker Development is located approximately 0.5 miles northof Concrete. The Lower Baker Dam impounds Lake Shannon, a reservoir approximatelyseven miles long with a volume of 160,000 acre-ft of water and an area of 2,280 acres atnormal full pool (elevation 438.6 ft) (PSE 2000). The Upper Baker Dam impounds BakerLake, a reservoir approximately nine miles long with a volume of 285,000 acre-ft and an areaof 5,000 acres at normal full pool (elevation 724.0 ft) (PSE 2000) (Figure 1). Both reservoirsare operated for hydroelectric power and flood control. The general pattern of reservoiroperations results in lower reservoir levels during winter to create space for storage duringspring high flow events, and higher reservoir levels during summer to maximize hydraulic
Upper Baker Near Field Smolt Behavior Study
Baker River Relicensing Page 2Acoustic tracking study 2002.doc
head for power generation, maximize the reservoir surface area for recreation, andsupplement Skagit River low flows. The Baker River reservoirs generally fill slowly duringthe spring months.
Figure 1. Map of Baker Lake, Washington with key facilities in its forebay indicated in close-up.
Upper Baker Near Field Smolt Behavior Study
Baker River Relicensing Page 3Acoustic tracking study 2002.doc
1.2.1 Project Facilities and OperationsThe Baker River is home to numerous fish species, including five species of Pacific salmon,cutthroat trout, and bull trout. The natural migratory pathway of these fishes was cut off withthe closure of the Lower Baker Dam in 1925. The completion of the Upper Baker Dam in1959 further reduced the available migratory corridor for these anadromous species. In orderto accommodate the migratory life histories of these species, PSE constructed fish passagefacilities, starting with the Lower Baker upstream barrier dam and fish trap in 1954. In 1958and 1959, downstream passage facilities were constructed at both Upper and Lower Bakerdams. The current downstream facility at each dam consists of barrier nets that guide fishinto a surface collection barge (SCB). From the entrance of the barge, the fish pass down anarrowing channel that dewaters before entering a fish trap. Under current operations fishare removed from the trap, transported around one or both dams, and subsequently releasedin the free-flowing Skagit River downstream.
Fish passage facilities at Baker Lake are operated by PSE to improve downstream fishpassage. A surface-to-bottom guide net (maximum depth of 285 ft) with a one-quarter inchmesh size is used for guiding migrants into the entrance of the collection barge (PSE 2002).The net remains in the reservoir throughout the year. The net has a 4-inch diameter inflatablehose for flotation at the surface, continuous cork floats at a depth of 50 feet, and one-poundweights sewn in along the bottom at one-foot intervals following the contour of the reservoirbottom (PSE 2002). When the reservoir spills, the top 50 feet of the net is submerged toreduce net drag and surface pull toward the spillgates (PSE 2002). This net is lowered toprevent damage to the guide net and spillgate facilities. The barrier net is immediately raisedafter the spill event to maximize fish passage into the surface collector. The top portion ofthe net also may become submerged temporarily as debris accumulates along its face.
Fish are guided into the barge entrance, which is centrally located in the forebay at thesurface of the reservoir (PSE 2002). Two log booms are located in the forebay of Baker Laketo protect the SCB from debris. The entrance channel to the barge is 12 ft by 35 ft long (PSE2002). The collection barge draws water from just below the reservoir surface and generatesa flow of 160 cfs in the channel. An adjustable weir dewaters the channel into a flume thatleads to a gravity-flow pipe connected to the fish trap (PSE 2002). Two 34,000 gpm pumpsdraw water from the fish channel to the gravity-flow pipe (PSE 2002). The collection bargefacility draws water from the impoundment surface, which varies normally between 724 feetand 674 feet elevation (R2 Resource Consultants, Inc. 2002). The turbine intakes are locatedat an elevation of 634 feet (R2 Resource Consultants, Inc. 2002)
The fish trap is constructed of concrete flotation modules and a submersible steel box, withballast that is compartmentalized into four raceway channels (PSE 2002). The raceways areused for holding and sorting downstream migrants for sampling. After personnel samplesmolts at the fish trap, the smolts are placed in hoppers, which are raised by crane to the topof the dam and released into a 400-gallon fish tank-trailer (PSE 2002). The fish tank-trailer
Upper Baker Near Field Smolt Behavior Study
Baker River Relicensing Page 4Acoustic tracking study 2002.doc
is equipped with aeration and oxygen diffusion. The smolts are transported to the mouth ofthe Baker River for release.
A review of historic data at the Project showed typical migration patterns for juvenileanadromous salmonids in the upper Baker River. Salmonids usually began movingdownstream through the passage facilities in March, although migrants have been detected asearly as January in some years. The downstream migration continues through spring andsummer with smaller numbers of fish migrating past the Project through the end of July.Peak migration periods have been consistently documented in May and June. Coho andsockeye salmon currently are the dominant stocks in the system and average 94% of theadults returning to the Baker River upstream migrant trap. Although other species ofsalmonids are of concern to PSE and the relicensing participants, the preponderance ofsockeye salmon and coho in the system make them the ideal representative species for use indownstream fish passage study efforts.
1.3 ObjectivesThe primary objective of this study was to describe the behavior of migratory coho andsockeye salmon in the forebay of Upper Baker Lake under varying Project elevations andgeneration treatments. In order to evaluate the objectives, the following behaviors weredescribed:
• assessing the horizontal and vertical distributions of smolts as they enter the forebayand encounter existing fish passage facilities,
• describing behavior of smolts that enter the forebay (e.g., milling behavior, divingpatterns, forebay movement),
• determining individual residence times from time of entrance into the acoustic arrayto the final detection,
• determining if the proportion of acoustically-tagged fish moving through the passagefacility changes during Project operations,
• assessing the diel pattern of passage at the facility, and,
• determining if fish enter the surface barge collector and leave.
1.4 Study Methods
1.4.1 Study DesignCoho Salmon

Upper Baker Near Field Smolt Behavior Study
Baker River Relicensing Page 5Acoustic tracking study 2002.doc
Coho smolt behavior was evaluated under 7-day generating and non-generating operationsduring both low and high pool reservoir conditions. In each pool condition, tagged cohosalmon smolts were released at two locations, the outer log boom and at the mouth of theSCB (Figure 2). The outer log boom release site was chosen to allow the tagged fish toacclimate and select a migration route prior to entering the array. For each treatment, asmaller, experimental group of coho salmon were released at the mouth of the SCB to betterunderstand their behavior in the near vicinity of the collection channel. A figure depictingthe master schedule for the near field smolt behavior study is located in Appendix C. Thefirst two releases were conducted during low pool conditions while the Project wasgenerating. A third and fourth release of coho salmon occurred one week later, still in lowpool conditions and under no Project generation. During high pool conditions, two groups ofcoho salmon were released one week apart. Two coho releases, at the SCB and outer logboom, occurred while the Project was generating and the final two occurred under non-generating conditions. All fish were released at dusk to minimize potential predation.
Figure 2. Pool level during 2002 downstream studies with coho salmon releases denoted. Cohosalmon were released at the surface collection barge (squares) and the outer log boom (diamonds) onthe third day of 7-day treatment periods (ON/OFF) in low and high pool conditions.
Sockeye Salmon
Sockeye salmon were released experimentally during the high pool condition to evaluatewhether this species could be successfully tagged in Baker Lake. Sockeye salmon smoltbehavior was evaluated under 7-day generating and non-generating operations from a releasesite one mile upstream of the outer log boom. Sockeye salmon releases occurred during thefirst and second weeks of high pool conditions (Figure 3). A figure depicting the masterschedule for the near field smolt behavior study is located in Appendix C.

Upper Baker Near Field Smolt Behavior Study
Baker River Relicensing Page 6Acoustic tracking study 2002.doc
Figure 3. Pool level during 2002 downstream studies with sockeye salmon releases denoted. Sockeyesalmon were released 1 mile upstream of the outer log boom (squares) on the third day of 7-daytreatment periods (ON/OFF) in high pool conditions.
1.4.2 Acoustic Tag System Configuration
1.4.2.1 Acoustic TagsTwo types of acoustic tags were used in this study. Both types of acoustic tags wereencapsulated and contained omnidirectional pingers with field programmable pulse rates andpulse widths. The tags transmitted at a frequency of 307.2 kHz and were coded with varyingping rates of 1 ping per 2000 milliseconds to 1 ping per 2700 milliseconds (1000milliseconds = 1 second). The acoustic tags transmitted a signal with an effective pulsewidth of 0.3 milliseconds. The pulse rates and width of the acoustic tags were determinedwith field tests prior to the study to maximize data collection within our study design. Thesefield tests were initiated to obtain course estimates of travel time within the Upper Bakerforebay.
Model 795A Acoustic Tags were used to tag coho salmon. These tags were 6.5 mm indiameter by 14.7 mm long and weighed 0.9 grams in air (HTI 2002). The useful life of eachModel 795A tag was approximately 5.5 days (fish were held one day after tagging).
Sockeye salmon smolts were generally larger than coho salmon smolts and could support alarger acoustic tag. Therefore, Model 795E acoustic tags were used for sockeye salmonsmolts and some large coho salmon. The Model 795E tags, weighing 1.5 grams in air, had adiameter of 7.0 mm and a length of 17.7 mm. The weight of the heavier Model 795E tagswas attributed to a larger battery. The tag life of Model 795E tags was approximately 14days.
1.4.2.2 Acoustic Tag Tracking SystemThe HTI Model 290 Acoustic Tag Tracking System used one receiver and 15 fixed omni-directional hydrophones to monitor the forebay area. The hydrophones, each connected tothe receiver via cables, were deployed in the forebay area between the outer log boom andthe SCB (Figure 4). The layout of the hydrophones enabled tagged fish to be mapped withina three-dimensional grid provided that a pulse transmitted from the tag was detected by four

Upper Baker Near Field Smolt Behavior Study
Baker River Relicensing Page 7Acoustic tracking study 2002.doc
hydrophones that were not located on the same plane. The exact location of the tagged fishwithin the grid was triangulated by determining the difference in arrival time for each pulsedetected by each of the hydrophones within the array (Steig and Timko 2001).
The x, y and z dimensional positions of the 15 hydrophones were accurately measured priorto the study. Since all of the hydrophones were attached to structures that float, and thusmoved with the surface elevation of the reservoir, the positions of the hydrophones were“pinged” weekly to maintain accuracy of the acoustic tag system and check properfunctioning of the hydrophones. In addition to periodic checks of the hydrophone system,debris was cleared away from floating hydrophone mounts as needed. During pre-studycalibration (January 10, 2002), detection range was found to be at least 700 ft and almost nobackground noise was detected at the frequency of the test tags.
In Spring 2002, Upper Baker Lake experienced wide fluctuations in depth associated withdebris in the forebay, alternating periods of Project operation and natural fluctuations ininflow from the Baker River. In addition to vertical movement of the hydrophones,horizontal movement of the hydrophones occurred likely due to water currents, loose tie-downs associated with hydrophone mounts, or through contact with debris. Hydrophonesmounted in the surface collector channel also may have experienced horizontal movementdue to fluctuations in tension of the anchoring system between the fish trap facility and thedam. Because of these fluctuations in the reservoir, the actual accuracy of any three-dimensional fish position is unclear. Under best-case scenarios, the Model 290 Acoustic TagTracking System has an error of about one meter (M. Timko, HTI, Inc., personalcommunication). In Spring 2002, the error associated with three-dimensional positions fortagged fish likely was higher in most cases. All echoes were analyzed with the “auto track”feature in AcousticTag instead of the manual track feature, which limited the detectionaccuracy associated with three-dimensional positions. Therefore, we refrained fromquantifying small-scale movements of tagged fish (e.g., fish movement in and out of surfacecollection channel). Instead, fish behavior was described in courser detail and categoricallyquantified.
Figure 4. Hydrophone array for the near field smolt behavior study at Baker Lake, Washington.

Upper Baker Near Field Smolt Behavior Study
Baker River Relicensing Page 8Acoustic tracking study 2002.doc
1.4.2.3 System ConfigurationFour hydrophones were mounted within the gulper (Figure 4). The remaining 11hydrophones were positioned in pairs, with one located at the surface and one at the bottomof the reservoir (Figure 4). The depth of the hydrophones mounted at the bottom of thereservoir was variable, depending on the bathymetry of the forebay. All of the hydrophoneswere mounted with an anchor/buoy system. Three pairs of hydrophones were mounted nearthe guide net and one surface hydrophone was mounted near the upstream end of the floatline extending from the SCB entrance. Two pairs of hydrophones were mounted between theinner and outer log booms in the north and south zones of the forebay.
Fixed Receivers in Acoustic Array
Fixed receivers were secured in the following locations:
1. North Zone of Upper Baker Forebay Between Inner and Outer Log Booms (onesurface and one bottom mounted hydrophone)
2. South Zone of Upper Baker Forebay Between Inner and Outer Log Booms (onesurface and one bottom mounted hydrophone)
3. Surface Collection Barge (four hydrophones mounted within the collection barge)
4. North Zone of Guide Net (one surface and one bottom mounted hydrophone)
5. Center Zone of Guide Net (one surface and one bottom mounted hydrophone)
6. South Zone of Guide Net (one surface and one bottom mounted hydrophone)
7. Center Zone of Upper Baker Forebay at the Upstream End of the Float Line Extendingfrom the Surface Collector Entrance (one surface mounted hydrophone)
Fixed Receiver
The receiver and computer were housed in a building located on the surface collector. Thisdata processing center was used to store tag detections for each hydrophone simultaneously.Raw hourly data (.RAT and .SUM type files) from the hydrophones were saved daily tocompact discs. From these raw data files, another set of computer files were generated (.TATtype file) within AcousticTag© (HTI, Inc., Version 2.12 (10/16/02)) to filter out backgroundnoise and display the three-dimensional paths of the tagged smolts. This interactive programallowed the movement of individual fish to be tracked in multiple perspectives (Steig 1999)and enabled background features to be included in three-dimensional fish tracks (HTI 2002).Aerial photographs, forebay bathymetry, and water elevation data were then used to createbackground structures and digital templates of the study area for three-dimensional display ofdata.
Upper Baker Near Field Smolt Behavior Study
Baker River Relicensing Page 9Acoustic tracking study 2002.doc
Mobile Receiver
Manual tracking was conducted five times during the study on May 17th, June 1st, 2nd, 7th, and9th. Actually tracking involved traveling along the entire reservoir margin, followed by oneor more passes down the middle of the reservoir along the channel (following a zigzag coursein wide areas). The route was a standard circuit that began and ended at the same location.The same sweep pattern was followed each time; however, the start/end point was varied(starting from one of the five launch sites). The time of day for daily sweeps was variedbetween daylight and evening hours based on crew availability. When the signal from anacoustic tagged fish was encountered, the sensitivity of the hydrophone was turned down andthe boat was maneuvered in such a way as to increase the observed signal strength. Therecord for which maximum signal is recorded indicated the best estimate of the fish’slocation. Once a fish’s location was determined, tracking resumed along the pre-establishedtrack. For purpose of data presentation, the reservoir was broken up into four distinct zones(Appendix D). Data obtained from manually tracking fish include the presence of individualfish within a zone of the reservoir.
1.4.3 Smolt CollectionThe majority of smolts tagged in this study originated from collection facilities at the UpperBaker fish trap. At the fish trap, suitable coho and sockeye salmon smolts were separatedfrom other fish at the fish trap following classification by PSE or Tribal biologists, and weremoved to a holding station adjacent to the sorting facility. Suitability was determined basedindicators on smolt condition, general fish health, and size limitations. Smolts were selectedfor acoustic tagging if they were “smolt-like” and healthy in appearance and their fork lengthexceeded 115 mm. Hatchery-origin smolts also were collected from Lake Shannon facilitieswhen suitable numbers of natural fish were not present. Smolts from the net pens weresimilar in size (within one standard deviation) and were assumed to behave similarly tonatural fish. To achieve target release numbers hatchery-origin smolts were collected fromLake Shannon net pens. These fish were transported to Upper Baker dam in a fish truck thatsupplied oxygen and darkness during transport. The fish were then lowered into the fish trapusing a hopper.
Holding conditions were similar for all smolts collected. Holding tubs were placed tominimize exposure to the sun and shade netting or lids were used to keep fish in darkness. A3-hp submersible pump supplied fresh water from the lake through the fish holding facility.In most cases, smolts were held for two days prior to tagging to minimize stress associatedwith handling during collection. When mortalities or dead tags required additional fishcollections, these make-up fish that were tagged were not held two days prior to tagging sothat release targets could be maintained.
Upper Baker Near Field Smolt Behavior Study
Baker River Relicensing Page 10Acoustic tracking study 2002.doc
1.4.4 Smolt Tagging199 coho salmon and 39 sockeye salmon smolts were collected at the Upper Baker fish trapand Lake Shannon net pens for acoustic tagging. Prior to tagging, lengths and weights ofhealthy smolts were recorded. Any smolts with wounds, excessive descaling or fork lengthsless than 115 mm were excluded from the sample group. Juveniles suitable for tagging weretransported from the sorting station to a tagging station approximately 30 feet away. Fishwere held in aerated freshwater for approximately 15-20 minutes just prior to tagging. Waterwas replaced approximately every 15-30 minutes. Small batches of sockeye salmon andcoho salmon juveniles were anesthetized with a 9:1 solution of clove oil and ethanol (60ppm) for about two minutes, or until fish lost equilibrium. A diluted clove oil solution,having a concentration of 30 ppm, was used during surgery. To help alleviate stressassociated with holding, artificial fish slime (Stress Coat®, Aquarium Pharmaceuticals, Inc.)was used during tagging, and in holding and 15-gal recovery tubs at the tagging station.
Each anesthetized fish was measured for fork length (mm) and tagged with an acoustictransmitter. Acoustic tags were surgically implanted in the body cavity (Wagner et al. 2000).After tagging, fish were held in recovery buckets with aerated water for approximately 5-15minutes. Once fish had revived, they were placed in 15-gal holding containers with free-flowing lake water until release. Tagged smolts were separated by release group and held incovered flow-through containers at the fish trap for approximately two days prior to releaseto ensure fish survival and tag retention.
Efforts to minimize stress to fish during collection, handling, tagging, transport and releaseincluded:
• holding fish before and after tagging procedures in covered fish troughs,
• use of an isotonic solution (SureHaul®, Kent Marine, Inc.) and artificial fish slime(Stress Coat®, Aquarium Pharmaceuticals, Inc.) during recovery and transport,
• water-to-water transfers of fish, and
• acclimation of study fish at release time from the transport tanks to the reservoir.
1.4.5 Smolt ReleaseA total of 176 coho salmon and 36 sockeye salmon smolts were released during this study.Tagged fish were transported to each release site with oxygen and released at dusk tominimize predation. Under low pool conditions, 36 coho salmon were released at the outerlog boom during generating conditions and a similar number of coho salmon were releasedunder non-generation conditions (Table 1). Under high pool conditions, 36 coho salmon alsowere released at the outer log boom under the generating condition (Table 1), while 30 cohosalmon were released under the non-generating treatment. An unusual combination of dead
Upper Baker Near Field Smolt Behavior Study
Baker River Relicensing Page 11Acoustic tracking study 2002.doc
tags and pre-release mortalities compromised the release number for the high pool,generation off treatment. Additionally, 18 sockeye salmon were released 1 mile upstream ofthe outer log boom during high pool, generating and non-generating conditions (Table 1).
Lengths of coho salmon and sockeye salmon smolts varied slightly by collection origin andspecies (Figure 5, 6, and 8). As expected, coho salmon collected from Upper Baker fish trapshowed more variability in size than coho salmon collected from Lake Shannon net pens(Figure 5, 6, and 8). Sockeye salmon generally were bigger than coho salmon collected atthe Upper Baker fish trap or Lake Shannon net pens during both test conditions (Figure 8).Overall, there were no detectable size differences among release groups.
Average values of Fulton’s Condition Factor (K=W/L3; Kohler and Hubert 1993) for cohosalmon and sockeye salmon smolts in both test conditions was near 1.0, although naturalcoho salmon had lower average condition factors than hatchery smolts (Figure 7). Sockeyesalmon also had slightly lower condition factors than coho salmon from either collectionlocation (Figure 9). There was a slight decrease in condition factor for Upper Baker cohosalmon released during high pool treatments (approximately 0.9) as compared with low poolreleases (approximately 1.0). Differences in condition factor appeared to be related todecreases in fish weights in later tag groups.

Upper Baker Near Field Smolt Behavior Study
Baker River Relicensing Page 12Acoustic tracking study 2002.doc
Table 1. Summary information for coho salmon and sockeye salmon smolts released with acoustic tags in Baker Lake, Washington (2002). SC=SurfaceCollector, SE=Standard Error, UB=Upper Baker, OLB=Outer Log Boom, LS=Lake Shannon
SpeciesRelease
SiteRelease
Date Release TimeTest
ConditionGeneration
StatusReleaseGroup
FishOrigin
NumberReleased
MeanFork
Length(mm) SE
Range ofFork
Lengths(mm)
UB 10 155 36.7 119-145Coho OLB 5/8 20:57 Low Pool ON 1
LS 27 135 7.1 119-145UB 31 152 28.1 122-225
Coho OLB 5/15, 5/16 21:45, 22:01 Low Pool OFF 3LS 5 132 7.1 124-143
Coho SC 5/8 20:24 Low Pool ON 2 LS 9 139 6.3 132-148
Coho SC 5/15, 5/16 21:45, 22:01 Low Pool OFF 4 LS 10 132 5.5 124-142
UB 20 145 15.1 126-197Coho OLB 5/29, 5/30 21:52, 20:42 High Pool ON 5
LS 16 135 7.5 117-171UB 5 151 31.5 128-205
Coho OLB 6/5, 6/6 20:14, 19:50 High Pool OFF 8LS 20 136 9.6 121-154UB 1 140 --- ---
Coho SC 5/29, 5/30 21:52, 20:42 High Pool ON 6LS 9 133 6.6 121-141UB 1 130 --- ---
Coho SC 5/29, 5/30 21:52, 20:42 High Pool OFF 9LS 8 139 4.9 131-144
Sockeye1 mile
upstreamOLB
5/29 21:38 High Pool ON 7 UB 18 169 28.3 140-231
Sockeye1 mile
upstreamOLB
6/5 20:14 High Pool OFF 10 UB 18 165 15.5 152-217
Upper Baker Near Field Smolt Behavior Study
Baker River Relicensing Page 13Acoustic tracking study 2002.doc
Upper Baker Near Field Smolt Behavior Study
Baker River Relicensing Page 14Acoustic tracking study 2002.doc
Figure 5. Length-weight data for coho salmon released during the study from Lake Shannon (filledcircles) and Upper Baker fish trap (empty circles) during low pool conditions in Baker Lake,Washington (2002).
Figure 6. Length-weight data for coho salmon released during the study from Lake Shannon (filledcircles) and Upper Baker fish trap (empty circles) during high pool conditions in Baker Lake,Washington (2002).
Figure 7. Boxplots of Fulton’s Condition Factor for coho salmon smolts released in Baker Lake,Washington (2002). Coho salmon smolts were collected from Lake Shannon (LS) and the UpperBaker fish trap (UB) in low and high pool test conditions. The boxplots furnish measures of location(i.e., median line), dispersion (the length of the box and the distance between the upper and lowerline) and skewness, or inequalities in the number of extreme observations plotted (Sokal and Rohlf1995). The box is divided at the median. The length of the box is known as the interquartile range.A vertical line is drawn from the top and bottom of the box to the largest and smallest observation,respectively, within 1.5 interquartile ranges. All observations beyond these limits are plotted asindividual points (or outliers).

Upper Baker Near Field Smolt Behavior Study
Baker River Relicensing Page 15Acoustic tracking study 2002.doc
Figure 8. Length-weight data for sockeye salmon released during the study from the Upper Bakerfish trap during high pool conditions in Baker Lake, Washington (2002).
Upper Baker Near Field Smolt Behavior Study
Baker River Relicensing Page 16Acoustic tracking study 2002.doc
Figure 9. Boxplots of Fulton’s Condition Factor for sockeye salmon smolts released in Baker Lake,Washington (2002). Sockeye salmon smolts were collected from the Upper Baker fish trap (UB) inhigh pool test conditions. The boxplots furnish measures of location (i.e., median line), dispersion(the length of the box and the distance between the upper and lower line) and skewness, orinequalities in the number of extreme observations plotted (Sokal and Rohlf 1995). The box isdivided at the median. The length of the box is known as the interquartile range. A vertical line isdrawn from the top and bottom of the box to the largest and smallest observation, respectively,within 1.5 interquartile ranges. All observations beyond these limits are plotted as individual points(or outliers).
1.4.6 Acoustic Fish TrackingTagged fish were tracked with two methods. The primary method of fish tracking willinvolved fixed monitoring of the hydrophone array in the forebay (See Section 1.4.2.2 formore information). The hydrophone array was monitored by a single acoustic receiverlocated on the surface collector. The computer associated with digital data collection on thesurface collector was downloaded daily and proper functioning of the system was verifiedduring daily visits. To account for tagged fish that travel upstream beyond the coverage area,manual tracking was conducted from a boat equipped with one hydrophone. A GlobalPositioning System (GPS) unit was used to record the location of the tagged fish detectedduring manual tracking. After a fish was detected, the mobile receiver recorded the date,time of day, and tag code. Manual tracking provided information on the general location offish that were not detected in the fixed hydrophone coverage area near the forebay. A three-dimensional position of the fish received by the manual tracking system was not possiblebecause only one hydrophone was deployed.
1.4.7 Data AnalysisHourly data from the acoustic array was saved digitally from the computer daily. The datawere reviewed and erroneous detections, such as detections of fish held on fish trap duringand after tagging or background noise were eliminated from analysis. Raw data files fromthe hydrophones also were converted to hourly Microsoft Access© databases. Hourlydatabases contained the number of fish detected within an hour-long time period, theirdetection coordinates (x,y,z axes), and the associated time and date of detection for each fish.This data was then compiled into individual databases for each tagged fish. Individual fish

Upper Baker Near Field Smolt Behavior Study
Baker River Relicensing Page 17Acoustic tracking study 2002.doc
databases were used to generate fish tracks in AcousticTag© and density plots in Tecplot©(AMTEC Engineering, Version 9.2). Fish tracks that were generated with this program had athree-dimensional view of detections, a two-dimensional top view, and a two-dimensionalside view that showed depth fluctuation (Appendix A).
Density plots were generated for each release group showing overall patterns of acousticdetections during the study (Appendix B). Density plots were constructed from the numberof echoes occurring in a time period within a 10’ cubic cell. Approximately 250,000 cubeswere delineated with the acoustic array in the Upper Baker forebay during the study. Alldensity plots are comprised of data from cells where more than 250 echoes were detectedwithin the relevant time period. The plots are not specific for other variables such as fishorigin and do not account for fish that may be emigrating and immigrating into the detectionarray. Separate density plots were generated to assess differences in density patterns duringday and night and within-treatment conditions and post-treatment conditions (Appendix B).For illumination of diel patterns, fish detected in the array were segmented into day and nightcategories using sunrise and sunset tables. Pooled density plots also were generated for allfish detected four hours before and after the shift in generation period to account for behaviorchanges associated with changes in generation status (Appendix B).
Once individual fish tracks were generated with AcousticTag, they were printed and suitablylabeled (e.g., species, release group, and fish number). Both qualitative and quantitativecriteria were used by fisheries professionals to describe or “score” the fish track. Each fishtrack was scored independently by two fisheries professionals and differences in opinionwere resolved before data was entered into a database. Individual fish tracks were scored forcategorical parameters to describe the smolt behavior as follows.
To determine the horizontal and vertical distribution of smolts throughout the forebay, weused density plots showing concentrations of tag echoes as well as individual fish tracks.Density plots were not intended to describe individual fish behavior, but represent the totaldistribution of echoes throughout the forebay for a release group and/or time period. Metricsscored from individual fish tracks provided fish-specific information and included descriptorsof a fish’s approach to the guide net/surface collection barge, including approach vectors(North, Middle, South), direct versus indirect approach path, shoreline use, and divingbehavior.
The general behavior of smolts in the forebay was determined with both density plots andindividual fish tracks. Density plots were used to identify areas used more heavily by groupsof smolts in the forebay. Individual fish tracks provided fish-specific behavior that includedmilling behavior, use of the entire forebay (forebay cross vs. site fidelity), moving across theguide net, a fish’s behavior near the surface collector.
The fixed hydrophones at the outer log boom provided information on gross residence timeof smolts in the forebay. The residence time for a tagged smolt was computed for each fishfrom individual fish databases. Residence time was computed by subtracting the last

Upper Baker Near Field Smolt Behavior Study
Baker River Relicensing Page 18Acoustic tracking study 2002.doc
detection time within the treatment period from the initial time and date that the fish enteredthe array. Thus, residence time may not take into account periods when a tagged fish mayhave not been detected by the array.
In some cases during the study, coho and sockeye salmon released during a specificgeneration treatment were detected in the array after generation condition changed. Due totag life, only small numbers of fish from each treatment group had the potential to bedetected in the array beyond the treatment condition of release. Based on examination ofthree-dimensional fish tracks (Appendix A) and density plots (Appendix B), the behavior ofthese tagged fish appear to be similar during and after their intended treatments. Thus,quantitative comparisons for categorical variables (e.g., milling behavior, occupy shoreline)were not made for those fish with treatment and post-treatment data.
Data Limitations and Study Assumptions
Several study assumptions and limitations affected the methodology used to analyze fishbehavior in the Upper Baker forebay. For example, we were not able to fully evaluatewhether tagged fish moved in and out of the surface collection barge because the positionalaccuracy associated with the use of Autotrack was too low. A courser description of fishbehavior around the surface collection barge was instead used to identify movement patternsof tagged smolts. Other data limitations and study assumptions were:
• The current version of AcousticTag© software did not allow individual fish tracksto be readily associated with time.
• The two-dimensional side-view of the reservoir showed depth changes that aresteeper because the winder was compressed for display purposes.
• Vertical and horizontal movement of surface collection facilities increased theerror of the acoustic array to greater than 1 meter. This was associated withdebris and daily changes in reservoir conditions and prevented a fine-scaleanalysis of movements in and out of the SCB.
• Hatchery-origin smolts were assumed to behave similarily to natural smolts in theUpper Baker forebay.

Upper Baker Near Field Smolt Behavior Study
Baker River Relicensing Page 19Acoustic tracking study 2002.doc
1.5 Study Results and Discussion
1.5.1 Tagging Mortality & Tag Activation ErrorsTagging mortality was less than or equal to 5% for coho salmon and sockeye salmon releasedunder both pool conditions. Pre-release mortality for coho salmon ranged from 2-5%, withslightly higher mortality (10 %) observed in the last release group (high pool/generationOFF). Sockeye salmon tagged in high pool conditions had a mortality rate of 5% (2 of 43fish). Tagging mortality did not appear to be size related or related to their collectionlocation.
A total of 15 (6%) known acoustic tags had errors in activation after tagging. Three deadtags were discovered prior to fish being released in the non-generating treatment with lowpool conditions. Under high pool conditions, four coho salmon released during thegenerating treatment had faulty tags. Two sockeye salmon and at least six (two tags withunknown failures were excluded from this estimate) coho salmon had faulty tags during thenon-generating treatment in high pool conditions. Activation problems were attributed totags that never activated, tags that were difficult to activate or deactivate, or tags that lostbattery life quicker than expected prior to release. Fish with faulty acoustic tags wereeuthanized and their tags removed. New fish were retagged to meet target numbers of fishfor each release group.
The estimate of failure rates for acoustic tags is likely conservative, as tagged fish from thefirst release group were not scanned prior to release to confirm correct tag operation. If weassumed a similar tag failure rate for the first release group (Releases 1&2), we estimate thatan additional four coho salmon smolts had faulty tags. With this assumption, tag activationerror would increase to 8 %.
1.5.2 Descriptive Results of Fish Behavior from Fish Tracks andDensity Plots
A total of 201 fish were tracked by the fixed array located in the forebay of the upperBaker Dam (Appendix A). Within the low pool test condition, 36 coho salmon weretracked from releases during Project generation and 36 from no generation releases. Atotal of 71 coho salmon were tracked during high pool conditions, 41 from coho releasesduring Project generation and 30 from no generation releases. A total of 14 sockeyesalmon were tracked in the forebay during high pool conditions. Eight sockeye weretracked from Project generation releases and 6 in the non-generating releases. Inaddition, tracks were generated for a total of 44 fish that entered or remained in theforebay after the release condition (Appendix A). These tracks represent movements offish from eight out of ten release groups.
Upper Baker Near Field Smolt Behavior Study
Baker River Relicensing Page 20Acoustic tracking study 2002.doc
Horizontal and Vertical Distribution of Smolts in Forebay
Approach to Guide Net/Surface Collection Barge
Density plots and individual fish tracks were used to describe patterns of fish as theymigrated downstream into the forebay and approached the guide net and SCB. Smolts weredistributed widely across the forebay, particularly close to the guide net and SCB, and theyoccupied depths from the surface to the bottom of the reservoir. Fish were observed toapproach the SCB and guide net from all directions. Many coho salmon and sockeye salmonhad convoluted approach vectors that indicated a searching pattern, with the majority of fishutilizing shoreline areas at least once during their residence time in the forebay.Approximately one-quarter of coho salmon and sockeye salmon smolts approached the guidenet and surface collector in a direct fashion.
Although fish approached to the SCB and guide net from all directions, the patterns of fishapproaches varied with generating treatment. Under both pool conditions, more coho salmonapproached along the north shore during the generating treatment (Table 2). When theProject was not generating, a greater percentage of coho salmon approach from the middle ofthe forebay (Table 2). In three of four coho salmon groups released at the outer log boom,fewer coho salmon smolts approached along the south shore compared to north and middleapproach vectors (Table 2).
Individual fish tracks showed that sockeye salmon also approached the surface collector andguide net from all directions (Table 2). Sockeye salmon smolts used the south shore for theirapproach most often during Project generation. In the non-generating treatment, sockeyesalmon were detected along the north shore most often during their initial approach into theforebay. A similar percentage of sockeye salmon used the middle of the forebay during theirapproach in both treatments.
Patterns of smolt approach did not vary noticeably with species or between pool conditions.Coho salmon used both sides of the forebay during their initial approach toward the dam inhigh and low pool conditions (Table 2). When coho salmon were pooled across treatments inlow pool conditions, 52% approached on the north side of the forebay and 14% migratedalong the south shore. A number of tagged coho salmon (34%) migrated down the center ofthe forebay. When coho salmon were pooled across treatments under high pool conditions, asimilar proportion of fish used each of the three approach vectors (47% N, 34% M, and 19%S). An example of a north, south, and middle approach vector is shown in Figure 10.
Searching Behavior versus Direct Approach

Upper Baker Near Field Smolt Behavior Study
Baker River Relicensing Page 21Acoustic tracking study 2002.doc
In addition to categorizing smolts’ approach vectors into the Upper Baker forebay, we usedindividual fish tracks to evaluate the proportion of smolts that approached the SCB and guidenet directly and those that exhibited a searching behavior pattern. Coho salmon and sockeyesalmon exhibited both approaches with searching patterns observed most often compared todirect approach patterns. For both species, only about one-quarter of smolts moved straightto the surface collector after their entrance into the forebay (Table 3). Changes in generationstatus within test conditions did not appear to affect the proportion of coho salmon andsockeye salmon that moved straight to the surface collector.
Most of the salmon smolts with tracks that led directly to, or near, the SCB did notimmediately enter the collection facilities. Instead, these fish were detected in the forebay foras long as several days following their initial approach to the SCB. No consistent pattern wasevident to suggest that changes in pool elevation and Project operation affected the smoltroute selection.
Table 2. Approach vectors of coho salmon and sockeye salmon smolts into the Upper Baker forebayduring Spring 2002. Approach vectors were determined from 3D interpolations of an individualfish’s position with the acoustic array. OLB=Outer Log Boom
Upper Baker Near Field Smolt Behavior Study
Baker River Relicensing Page 22Acoustic tracking study 2002.doc
Figure 10. Examples of a south, middle, and north approach vector displayed with Acoustic Tagsoftware. Bathymetry lines are indicated in red and the guide net and outer log boom are shown inblue. Fish 2078 (A) was entered along the south side of the forebay, Fish 2030 (B) entered in themiddle of the forebay, and Fish 2411 moved along the north shoreline during its approach to thesurface collection facilities. All three fish were coho salmon released during low pool conditions atthe outer log boom.
Shoreline Use
One of the descriptors of horizontal distribution generated from density plots and individualfish tracks was whether a fish was detected near shoreline areas in the Project forebay. Bothspecies of smolts were observed to use the north and south shorelines during all treatments inthe study and no consistent pattern of use was evident to suggest a correlation with poolelevation (Table 3). A majority of coho salmon and sockeye salmon in both pool conditionsused the north shoreline at some point during their residence in the forebay, with the southshore used less frequently. Smolts usually exhibited milling behavior in these areas, althoughtransient shoreline use by some tagged smolts also was observed.
Some changes in shoreline use were observed with changes in Project operation. Within thelow pool condition, coho salmon groups released at the outer log boom and the SCB showedreductions in shoreline use when the Project was not generating (Table 3). Under high poolconditions, the proportion of coho salmon that used shoreline areas among treatments was notconsistent; however, sockeye exhibited a dramatic increase in shoreline use when the Projectwas not generating. The most prevalent shoreline use among all release groups appears to bea hot spot along the northern edge of the forebay used by many coho salmon and sockeyesalmon smolts (see density plots for additional information).

Upper Baker Near Field Smolt Behavior Study
Baker River Relicensing Page 23Acoustic tracking study 2002.doc
Table 3. Categorical breakdown of fish behavior during their approach and residence time in theUpper Baker forebaly from individual fish tracks generated with AcousticTag software. Cohosalmon and sockeye salmon smolts were released into Baker Lake, Washington (2002).
Diving Behavior
Smolts’ vertical distribution in the water column and diving behavior was evaluated withdensity plots (Appendix B) and individual fish tracks (Appendix A). Most coho salmon andsalmon smolts were detected in the upper 50 ft of the water column in the Upper Bakerforebay (see density plots in Appendix B). A majority of coho salmon and sockeye salmonin all treatments dived at least once during their forebay residence. The depth of dives variedconsiderably for both species, with dives ranging from just a few feet in depth to dives thatwent to the bottom of the reservoir (Figure 11). Coho salmon usually occupied depths lessthan 50 ft and exhibited shallower dives compared to sockeye salmon (see individual fishtracks for more information). Sockeye salmon smolts occasionally dove and occupied depthsgreater than 50 ft, but usually only for short time intervals. The proportion of smolts thatexhibited diving behavior by release group was not noticeably different between Projectoperation or pool elevation treatments (Table 4).
Upper Baker Near Field Smolt Behavior Study
Baker River Relicensing Page 24Acoustic tracking study 2002.doc
Table 4. Diving behavior of coho salmon and sockeye salmon smolts detected in the Upper Bakerforebay in Spring 2002. OLB=Outer Log Boom, SC=Surface Collector

Upper Baker Near Field Smolt Behavior Study
Baker River Relicensing Page 25Acoustic tracking study 2002.doc
Fish 2105, Coho, Release 8 at Outer Log Boom, High PoolGeneration OFF

Upper Baker Near Field Smolt Behavior Study
Baker River Relicensing Page 26Acoustic tracking study 2002.doc
Figure 11. Example of diving behavior along guide net in Upper Baker forebay displayed with Acoustic Tag software. Coho salmon #2105 was releasedat the outer log boom under the non-generating treatment in high pool conditions.

Upper Baker Near Field Smolt Behavior Study
Baker River Relicensing Page 27Acoustic tracking study 2002.doc
General Behavior of Smolts in the Forebay
The general behavior of smolts in the forebay was determined using a combination of densityplots and individual fish tracks. Density plots were used to identify areas used more heavilyby smolts in the forebay. Individual fish tracks provided fish-specific behavior that includedmilling behavior, use of the entire forebay (forebay cross vs. site fidelity), moving across theguide net, and a fishes’ behavior near the surface collector.
Site Fidelity (i.e., hot spots)
Density plots and categorical information from individual fish tracks revealed that bothspecies of tagged salmon smolts occupied four “hot spots” along the guide net (Figure 12).Coho salmon sockeye salmon had the highest densities in all treatment conditions near theentrance to the surface collector (Appendix B). Consistent, but lower, densities were presentin all release groups on the northern side of the surface collector, extending to approximately200 ft along the guide net in the northern direction. A third area on the northern side of thesurface collector occurred near the north shore along the guide net. Another area of theforebay with consistent presence on the density plots was approximately 100 feet due southof the surface collector near the guide net. These four hot spots along the guide net areconsistent with signal detections of radio-tagged coho salmon in the concurrent radio-telemetry study.
Density plots for coho salmon and sockeye salmon smolts did not show differences in dieldensity patterns, changes in behavior between treatment conditions, or differences four hoursbefore and after changes in Project generation (Appendix B). These plots did show thattagged fish used areas within about 100 ft upstream of the guide net in the Upper Bakerforebay.
Milling Behavior
Individual fish tracks were used to quantify the proportion of fish that showed millingbehavior in the forebay. Milling behavior is defined as a fish swimming in an area forextended periods (Steig et al. 2001). A majority of coho salmon and sockeye salmon smoltsin all treatments and at all release locations (>55%) exhibited milling behavior in the forebay(Table 5). Fish generally exhibited milling behavior along the north shoreline upstream ofthe guide net and along the face of the guide net. A typical example of milling behavioralong the north shoreline is shown in Figure 13. Fish that milled along the guide net usuallycrossed near the entrance of the surface collector at least once before their eventual entranceinto collection facilities or their apparent exit from the array. Discernable patterns in millingbehavior associated with changes in generation status were not observed for coho salmon orsockeye salmon in either pool condition (Table 5).

Upper Baker Near Field Smolt Behavior Study
Baker River Relicensing Page 28Acoustic tracking study 2002.doc
Table 5. Proportion of coho salmon and sockeye salmon that exhibited milling behavior in the UpperBaker forebay, as shown by individual fish tracks generated with AcousticTag software. Cohosalmon and sockeye salmon smolts were released into Baker Lake, Washington (2002).
Upper Baker Near Field Smolt Behavior Study
Baker River Relicensing Page 29Acoustic tracking study 2002.doc
Figure 12. Density plot example (top and side views) that shows four typical “hot spots” in the UpperBaker forebay. Coho salmon that compose this density plot were released at the outer log boomduring Project generation and low pool conditions.

Upper Baker Near Field Smolt Behavior Study
Baker River Relicensing Page 30Acoustic tracking study 2002.doc
Figure 13. Typical example of milling behavior along guide net in Upper Baker forebay displayed with Acoustic Tag software. Coho salmon #2528 wasreleased at the outer log boom under the generating treatment in low pool conditions.
Fish 2528, Release 1 at Outer Log Boom, Low Pool,Generation ON
Upper Baker Near Field Smolt Behavior Study
Baker River Relicensing Page 31Acoustic tracking study 2002.doc
Use of Entire Forebay
Smolts’ movement patterns in the forebay were categorized using individual fish tracks. Alarge number of coho salmon and sockeye salmon smolts crossed from one side of theforebay to the other side in the area starting approximately 100 ft upstream of the guide netupstream to the outer log boom. The large numbers of fish that exhibited crossing behaviorin the forebay indicate that salmon smolts show a low tendency for moving straight into thecollection facilities after their initial approach.
In the forebay outside the immediate vicinity of the surface collector, the proportion ofsmolts that exhibited crossing behavior did not vary considerably across treatment groups.The percentage of tagged coho salmon that exhibited forebay crossing behavior was slightlyhigher in high pool conditions (71 %) compared to low pool conditions (50 %). Sockeyesalmon released during the generating treatment had the lowest percentage (22%)of smoltsthat showed forebay crossing behavior. The occurrence of this behavior in non-generatingconditions was much higher (71%), but small numbers (5 versus 8) of detected fish in bothrelease groups make rigorous comparisons difficult. For those fish that changed sides of theforebay during their residence time, a majority crossed more than one time (Table 6).
Movement Across Guide Net
In addition to categorizing fish movement upstream of the guide net, individual fish trackswere used to describe the behavior of those fish that crossed over, or through, the guide netduring the study. Coho and sockeye salmon from seven of ten release groups weredocumented moving back and forth across the guide net during the study. While thereservoir was in the low pool condition, two coho salmon were detected on the downstreamside of the guide net during Project generation and six during non-generating conditions(Table 7). In high pool conditions, six coho salmon and one sockeye salmon were detectedon the downstream side of the net (Table 7). Tagged fish that were observed crossing the netappeared to use the north side more often than the area south of the surface collectionentrance. Observations of smolt movement across the guide net in this study also areconsistent with findings in the concurrent radio-telemetry study, and with anecdotalobservations of smolts congregating at the surface of the reservoir between the face of thedam and the guide net.

Upper Baker Near Field Smolt Behavior Study
Baker River Relicensing Page 32Acoustic tracking study 2002.doc
Table 6. Categorical breakdown of fish crossing behavior in the forebay of Baker Lake fromindividual fish tracks generated with AcousticTag software. Coho salmon and sockeye salmon smoltswere released into Baker Lake, Washington (2002).
Table 7. Proportion of coho salmon and sockeye salmon that crossed the guide net, as shown byindividual fish tracks generated with AcousticTag software. Coho salmon and sockeye salmon smoltswere released into Baker Lake, Washington (2002).
Surface Collection Barge Attraction
Upper Baker Near Field Smolt Behavior Study
Baker River Relicensing Page 33Acoustic tracking study 2002.doc
The positional accuracy of the acoustic array available with the “auto track” analysis featurewas insufficient to fully evaluate whether tagged fish moved in and out of the SCB. Inaddition, accuracy of the acoustic array was diminished by fluctuations in depth associatedwith alternating periods of Project operation and natural fluctuations in inflow from theBaker River. In addition to vertical movement of the hydrophones, horizontal movement ofthe hydrophones occurred, likely due to water currents, tension in the anchoring system,loose tie-downs associated with hydrophone mounts, or through contact with debris. Sincethe accuracy of the system was uncertain, but similar the dimensions of the surface collectionchannel, we refrained from quantifying small-scale movements of tagged fish (e.g., fishmovement in and out of surface collection channel). Instead, fish behavior was described incourser detail and categorically quantified.
Greater than 64% of all smolts tracked showed movement across the entrance of the surfacecollection facility. The percentage of coho salmon that crossed the mouth of the surfacecollector during low pool conditions was about 70% for those released at the outer log boomand ranged from 57-89% for SCB release groups (Table 8). Similar percentages of cohosalmon and sockeye salmon smolts crossed the mouth of the surface collector during highpool conditions and their respective treatments (Table 8). For those fish that crossed in frontof the surface collector, a majority crossed the mouth more than once. A majority of fishdisplayed substantial activity in front of the SCB entrance without moving into the fish trap.
Table 8. Categorical breakdown of fish crossing behavior in front of the surface collector fromindividual fish tracks generated with AcousticTag software. Coho salmon and sockeye salmon smoltswere released into Baker Lake, Washington (2002).
Furthermore, within each of the generating treatments during the study associated with fishreleases, the proportion of fish that crossed the mouth of the surface collector at least once(64 –100%) was greater than the proportion of fish that were actually recovered in the UpperBaker fish trap (21%). The large numbers of fish that exhibited crossing behavior at themouth of the surface collector without subsequent entry into the fish trap suggests thatsalmon smolts may be avoiding the SCB or alternatively that attraction flow in the SCB isinefficient for guiding smolts into the fish trap.
Upper Baker Near Field Smolt Behavior Study
Baker River Relicensing Page 34Acoustic tracking study 2002.doc
A total of 44 (21%) tagged coho salmon were collected in the Upper Baker fish trap duringthe study. A total of 36 fish tagged fish were collected under low pool conditions. For thelow pool releases when the Project was generating 22 tagged fish (48%) were collected andtheir tags recovered. Four (18%) of these recovered tags were identified to pulse rateindicating that these four fish were released at the outer log boom. Fish for the low pool,non-generating releases had a 30% recapture rate with 14 fish tagged fish collected. Onlyfour of the 14 recovered tags were identifiable to pulse rate; two tags were from fish releasedin the surface collector and two tags were from fish released at the outer log boom. Limitedbattery life prevented identification of pulse rates for the other 28 recovered tags. Thus, wewere not able to determine specifically which release group these fish came from.
Beginning with high pool release groups, acoustic tags were physically marked with uniquecolor pattern that allow identification of tag-specific pulse rates even for dead tags. A total ofeight coho salmon (6%) were collected in the trap during high pool conditions. Six smolts(13%) were collected from the high pool generating releases. Tag recovery indicated thatone of these fish had been released at the surface collector and the other five had beenreleased at the outer log boom. Only two tagged coho salmon we collected from the highpool, generation off releases; both fish had been released at the surface collector.
Distinct differences in tag recoveries are apparent for coho salmon collected in the fish trapduring the study, with recoveries during low pool conditions greater than high pool andrecoveries during generating treatments greater than non-generating. The tag recapture rateduring this study was lower than rates calculated during 2002 mark-recapture studies with finclipped coho salmon in Baker Lake (40-55%) (D. Bruland, PSE, personal communication).However, this study was designed to describe the behavior of the fish and not for statisticalcomparisons among release groups. Thus, we caution making conclusions from patterns inthese recapture data. In addition, because of the very short tag life for coho salmon tags andthe need to reuse tags due to activation problems, it is likely that some unknown number ofsmolts entered the trap after the tags had expired and thus were not detected and may nothave been noticed by the fish trap crew. It’s also possible that some unknown number ofsmolts entered the fish trap undetected because they were swimming very rapidly (greaterthat the 2.5 second ping rate of tags) downstream through the SCB. The tracking data alsosuggests that between 7 and 22% of the coho salmon smolts crossed the guide net behind theentrance to the SCB.
Although we have tracking data (fixed and manual) on 24 out of 36 sockeye salmon, noacoustically tagged sockeye salmon were recovered in the fish trap during the study. Inaddition, two of the sockeye salmon in the forebay were tracked moving across the guide netbehind the entrance to the SCB. These results are similar to the low detection rate seen forthe sockeye released as part of the concurrent pit tag study (5-66%) as well as mark-recapturestudies conducted in 2002 with fin clipped sockeye salmon (n=4300 sockeye smolts) thatshowed recapture rates between 16-33% (D. Bruland, PSE, personal communication). Giventhe low detection rates seen in other concurrent studies, the small sample size used in this

Upper Baker Near Field Smolt Behavior Study
Baker River Relicensing Page 35Acoustic tracking study 2002.doc
study and the fact that this study was not designed for statistical power, the lack of sockeyerecaptures appears reasonable. Furthermore larger proportion of the tagged sockeye salmonwere manually tracked outside of the forebay (44%) as compared to the coho salmon (22%),suggesting that many sockeye did not use the forebay during the study window.
Smolt Residence Time in Forebay
In general treatment conditions did not appear to affect residence time of tagged salmon.Coho salmon released in both low pool treatments exhibited a wide range of residence timesin the Upper Baker forebay that did not appear affected by Project operation status. Underlow pool treatments, the residence times for all tagged coho salmon ranged between 0-4.2days for all four release groups. The median residence time for all tagged coho salmon was1.4 days when the Project was generating and 0.8 days when the turbines were off. Themajority of fish in both treatments had residence times less than two day (Figure 14).
Coho salmon released under high pool conditions exhibited a similar range of residence timesto those coho salmon released in low pool conditions. The median residence time for highpool release groups was 1.1 days under generating conditions and 1.2 days when the turbineswere off. The majority of coho salmon released in both treatments had residence times lessthan two days (Figure 15). Residence times ranged between 0-4.1. Under high poolconditions, coho salmon released in the vicinity of the surface collector had shorter residencetimes compared to those fish released at the outer log boom. However, some fish released atthe mouth of the surface collector did not immediately enter the facility and were detected asmuch as 3.1 days after release in the hydrophone array (Figure 15). This pattern was notevident for low pool releases.
Figure 14. Categorical distribution of residence time in Upper Baker forebay for acoustically-taggedcoho salmon. Coho salmon were released in low pool conditions during Spring 2002 at the outer logboom (top) and the mouth of the SCB (bottom). The number of detected smolts in each release groupis indicated in the figure legend.

Upper Baker Near Field Smolt Behavior Study
Baker River Relicensing Page 36Acoustic tracking study 2002.doc
Figure 15. Categorical distribution of residence time in Upper Baker forebay for acoustically-taggedcoho salmon released in high pool conditions. Coho salmon were released at the outer log boom (top)and mouth of the SCB (bottom). The number of fish detected in each release group is depicted in thefigure legend.
Sockeye salmon smolts did not appear to have differences in residence time betweengenerating treatments in high pool conditions (Figure 16). Sockeye salmon had a medianresidence time of 2.4 days in the generating treatment and 1.6 days during the non-generationperiod. In both treatments, sockeye salmon had residence times less than four days. Therange of residence times indicated for sockeye salmon was similar to coho salmon.
Figure 16. Categorical distribution of residence time in Upper Baker forebay for acoustically-taggedsockeye salmon released in high pool conditions. Sockeye salmon were released at 1 mile upstream ofthe outer log boom.
1.5.3. Incomplete Fish Detections and Missing Fish
A total of 8 (4.5%) of the tagged coho salmon smolts were not detected by the acoustic array.In low pool conditions, five of these coho salmon smolts were released during generatingconditions. We believe that at least four of these fish may have had tag failures, assumingsimilar tag failure rates as the other release groups. Two coho salmon released during thenon-generating treatment were never detected by the hydrophone array. One coho salmonwas released at the mouth of the surface collector and one was release at the outer log boom.One coho salmon was not detected from its release during the non-generating treatment inhigh pool conditions.
Forty-nine (28%) additional coho salmon and sockeye salmon (26 coho and 23 sockeye)were detected by at least one hydrophone during the study, but not by four hydrophones in
Upper Baker Near Field Smolt Behavior Study
Baker River Relicensing Page 37Acoustic tracking study 2002.doc
the proper configuration (4 hydrophones not in same planes) needed to generate three-dimensional fish tracks. Three of 28 untrackable smolts were coho salmon that were releasedat the mouth of the surface collector, 23 were coho salmon released at the outer log boom,and 23 were sockeye salmon released one mile upstream of the outer log boom. Tosummarize, there was insufficient data from the fixed array on 19% of the tagged cohosalmon and 64% of the tagged sockeye salmon to generate individual fish tracks or for thesefish to make a contribution to density plots.
Of the 49 untrackable smolts, 24 (15 coho and 9 sockeye) were detected on one or more datesduring manual tracking in the reservoir (Table 9). The fact that 54% of the untrackable cohosalmon were detected upstream of the forebay during manual tracking suggests that manytagged coho salmon moved out of the forebay after release and did not return withinapproximately 5 days (tag life of the coho salmon acoustic tags). The fact that 25% of theuntrackable sockeye salmon and were detected outside the forebay indicates many taggedsockeye salmon did not migrate to the forebay within the two-week window that their tagswere active.
1.5.4. Manual Tracking Outside the Forebay
A total of 55 fish were detected upstream of the forebay during manual tracking (Table 9).Fish detected represented eight out of 10 release groups and include both surface collectionbarge and outer log boom releases. No fish were detected outside of the forebay for SCBreleases 2 (low pool, generation on) and 6 (high pool, generation on).
Most of the manual tracking detections occurred one to three days after release. Six cohosalmon and two sockeye salmon from multiple release groups were detected outside theforebay one week after release. Multiple detections that occurred in different zones withinthe same day may be attributable to fish movement and long range detection conditions.Four out of the six sockeye salmon detected outside the forebay on separate dates had few orno subsequent detections within the fixed array. The other two fish (2066 and 2645) didmove into the forebay and were tracked by the fixed array.
Although many fish moved upstream from their release location, the fish generally appearedto remain in the lower portion of the reservoir. Sockeye salmon exhibited less movementthroughout the reservoir than coho salmon. The majority of the fish detected during manualtracking were located in reservoir zones III and IV (Table 9, Appendix D) from just upstreamof the outer log boom to downstream of Sandy Creek. There was one sockeye salmon andone coho salmon detected within zone III, but upstream of Sandy Creek, and 7 coho salmondetected in zones I and II. None of the fish detected upstream from Sandy Creek weresubsequently tracked in the forebay.
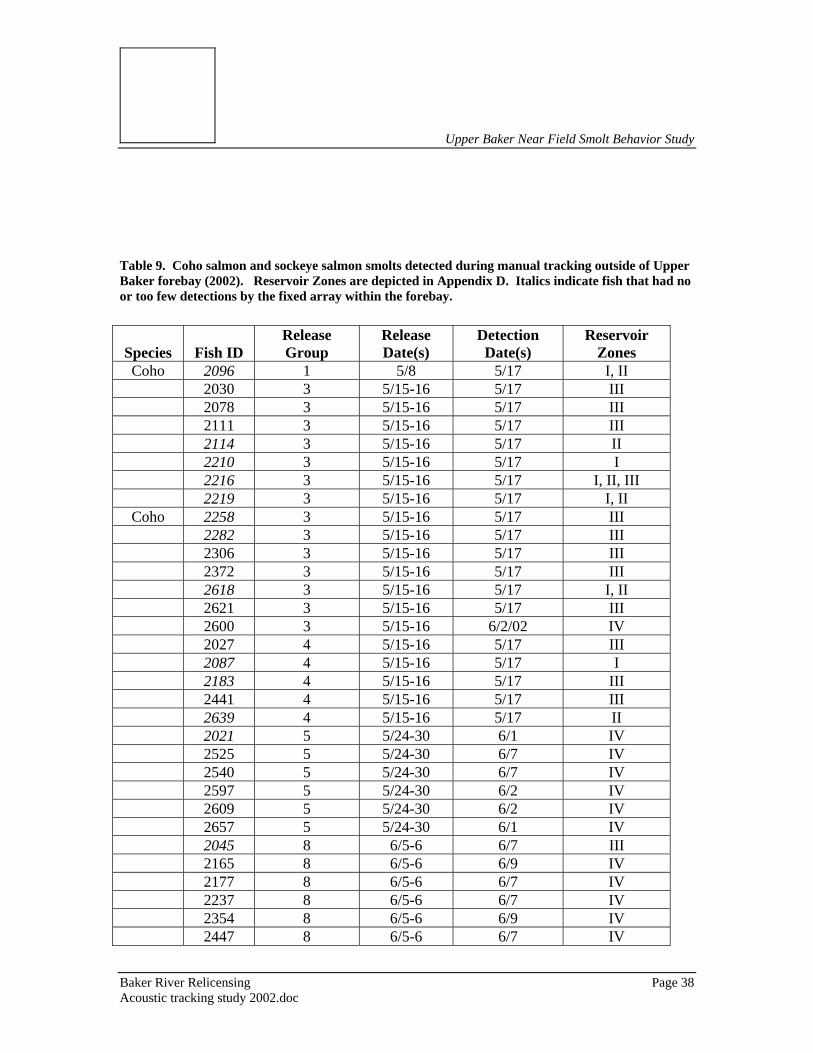
Upper Baker Near Field Smolt Behavior Study
Baker River Relicensing Page 38Acoustic tracking study 2002.doc
Table 9. Coho salmon and sockeye salmon smolts detected during manual tracking outside of UpperBaker forebay (2002). Reservoir Zones are depicted in Appendix D. Italics indicate fish that had noor too few detections by the fixed array within the forebay.
Species Fish IDReleaseGroup
ReleaseDate(s)
DetectionDate(s)
ReservoirZones
Coho 2096 1 5/8 5/17 I, II2030 3 5/15-16 5/17 III2078 3 5/15-16 5/17 III2111 3 5/15-16 5/17 III2114 3 5/15-16 5/17 II2210 3 5/15-16 5/17 I2216 3 5/15-16 5/17 I, II, III2219 3 5/15-16 5/17 I, II
Coho 2258 3 5/15-16 5/17 III2282 3 5/15-16 5/17 III2306 3 5/15-16 5/17 III2372 3 5/15-16 5/17 III2618 3 5/15-16 5/17 I, II2621 3 5/15-16 5/17 III2600 3 5/15-16 6/2/02 IV2027 4 5/15-16 5/17 III2087 4 5/15-16 5/17 I2183 4 5/15-16 5/17 III2441 4 5/15-16 5/17 III2639 4 5/15-16 5/17 II2021 5 5/24-30 6/1 IV2525 5 5/24-30 6/7 IV2540 5 5/24-30 6/7 IV2597 5 5/24-30 6/2 IV2609 5 5/24-30 6/2 IV2657 5 5/24-30 6/1 IV2045 8 6/5-6 6/7 III2165 8 6/5-6 6/9 IV2177 8 6/5-6 6/7 IV2237 8 6/5-6 6/7 IV2354 8 6/5-6 6/9 IV2447 8 6/5-6 6/7 IV

Upper Baker Near Field Smolt Behavior Study
Baker River Relicensing Page 39Acoustic tracking study 2002.doc
2483 8 6/5-6 6/7 IV2543 8 6/5-6 6/7 IV2570 8 6/5-6 6/7 IV2630 8 6/5-6 6/7 IV2654 8 6/5-6 6/9 IV2669 9 5/29-30 6/7 IV2675 9 5/29-30 6/7 IV
Sockeye 2009 7 5/29 6/7&9 IV2066 7 5/29 6/1&2 IV2120 7 5/29 6/9 IV2309 7 5/29 6/2 IV2459 7 5/29 6/1 III2579 7 5/29 6/7 II2603 7 5/29 6/2 IV2645 7 5/29 6/2&7 IV2006 10 6/5 6/7&9 IV2069 10 6/5 6/7&9 III2075 10 6/5 6/7 IV2399 10 6/5 6/7 IV2402 10 6/5 6/7&9 IV2507 10 6/5 6/7 IV2546 10 6/5 6/7 IV2651 10 6/5 6/7 IV
1.6 ReferencesHydroacoustic Technology, Incorporated. 2002. Model 290 Acoustic Tag Tracking System.
Seattle, Washington.
Kohler, C.C., and W.A. Hubert (editors). 1993. Inland Fisheries Management in NorthAmerica. American Fisheries Society, Bethesda, Maryland.
Puget Sound Energy. 2000. Baker River Project Relicense Project Information Package.
Puget Sound Energy. 2002. Initial Consultation Document. Bellevue, Washington. March,2002.
R2 Resource Consultants, Inc. 2002. Assessing Effectiveness of Turbine Intake BaffleModifications for Improving Downstream Passage of Juvenile Salmon: 2001 StudyResults. Final Report prepared for Puget Sound Energy, Inc. Bellevue, Washington.

Upper Baker Near Field Smolt Behavior Study
Baker River Relicensing Page 40Acoustic tracking study 2002.doc
Steig, T.W. 1999. The use of acoustic tags to monitor the movement of juvenile salmonidsapproaching a dam on the Columbia River. Presented at the 15th InternationalSymposium on Biotelemetry, Juneau, Alaska. 9-14 May 1999. 7 pages.
Steig, T.W. and M.A. Timko. 2001. Feasibility study: assessing the viability of usingacoustic tags for three-dimensional positioning at Lower Granite Dam. Prepared forUSGS Columbia River Field Station. Hydroacoustic Technology, Incorporated. Seattle,Washington.
Steig, T.W., B.H. Ransom, and M.A. Timko. 2001. Monitoring the behavior of acousticallytagged chinook and steelhead smolts approaching Rocky Reach Dam on the ColumbiaRiver. Presented at Waterpower XII, July 9-11, Salt Lake City, Utah.
Timko, M., T.D. Brush, P. Nealson, and R. Huen. 2001. Draft report for Clackamas FishPassage Technical Subgroup Review, approach, congregation areas, and passage ofacoustically tagged spring chinook salmon smolts in the forebay of North ForkDevelopment, Clackamas River, Oregon. Report prepared for PGE, Portland, OR, andClackamas River Project Fish Passage Technical Subgroup.
Wagner, G.N., E.D. Stevens and P. Byrne. 2000. Effects of suture type and patterns onsurgical wound healing in rainbow trout. Transactions of the American Fisheries Society129: 1196-1205.
Upper Baker Near Field Smolt Behavior Study
Baker River Relicensing Appendix AAcoustic tracking study 2002.doc
APPENDIX A. INDIVIDUAL FISH TRACKS FOR ACOUSTICALLY-TAGGEDFISH RELEASED IN BAKER LAKE, WASHINGTON (2002).

Upper Baker Near Field Smolt Behavior Study
Baker River Relicensing Appendix BAcoustic tracking study 2002.doc
APPENDIX B. DENSITY PLOTS FOR COHO AND SOCKEYE SALMONSMOLTS RELEASED IN BAKER LAKE, WASHINGTON (2002).
Upper Baker Near Field Smolt Behavior Study
Baker River Relicensing Appendix CAcoustic tracking study 2002.doc
APPENDIX C. MASTER SCHEDULE OF NEAR FIELD SMOLT BEHAVIORSTUDY AT BAKER LAKE, WASHINGTON (2002).
Upper Baker Near Field Smolt Behavior Study
Baker River Relicensing Appendix DAcoustic tracking study 2002.doc
APPENDIX D. ACOUSTIC MANUAL TRACKING ZONES USED IN BAKERLAKE, WASHINGTON (2002).
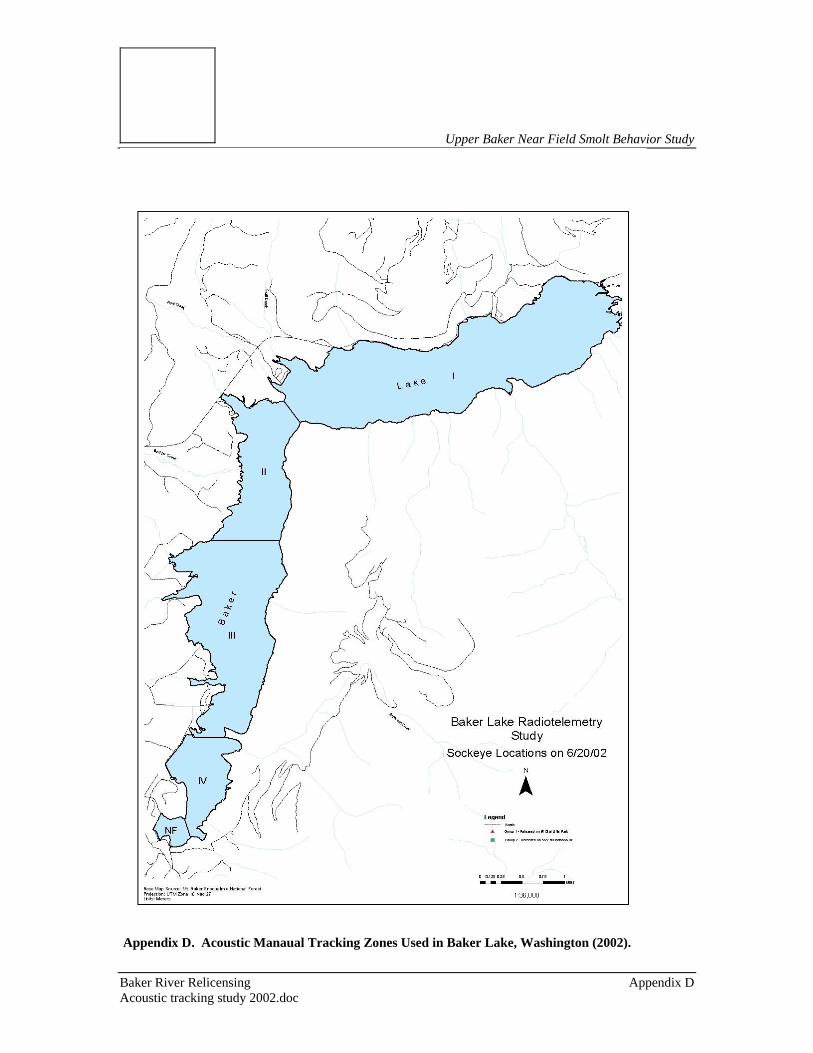
Upper Baker Near Field Smolt Behavior Study
Baker River Relicensing Appendix DAcoustic tracking study 2002.doc
Appendix D. Acoustic Manaual Tracking Zones Used in Baker Lake, Washington (2002).

Upper Baker Near Field Smolt Behavior Study
Baker River Relicensing Appendix DAcoustic tracking study 2002.doc
Hydroacoustic ManualTracking Zones in Baker
Lake, Washington