a306 session 7: data wise leadership feb. 5, 2008
Post on 20-Dec-2015
214 views
TRANSCRIPT
A306
Session 7:
Data Wise
Leadership
Feb. 5, 2008

A306
Session 7:
Data Wise
Leadership
Feb. 5, 2008

Plan for Today
4:10-4:30 Data Wise in Action
4:30-5:00 The Gardner School in Action
5:00-5:30 Evolving as a Learning Organization:Principal Almi Abeyta, McKay K-8
School
5:30-5:40 Break
5:40-6:20 Final Word Protocol “Good Teaching Matters”
6:20-7:00 Team Time, Meet with Teaching Fellow

Today’s Objectives1. Transition from “learning what” to
“learning how”
2. Continue building our community of shared practice
3. Draw inspiration from a Data Wise alum
4. Experience a discussion of a text you could share with colleagues
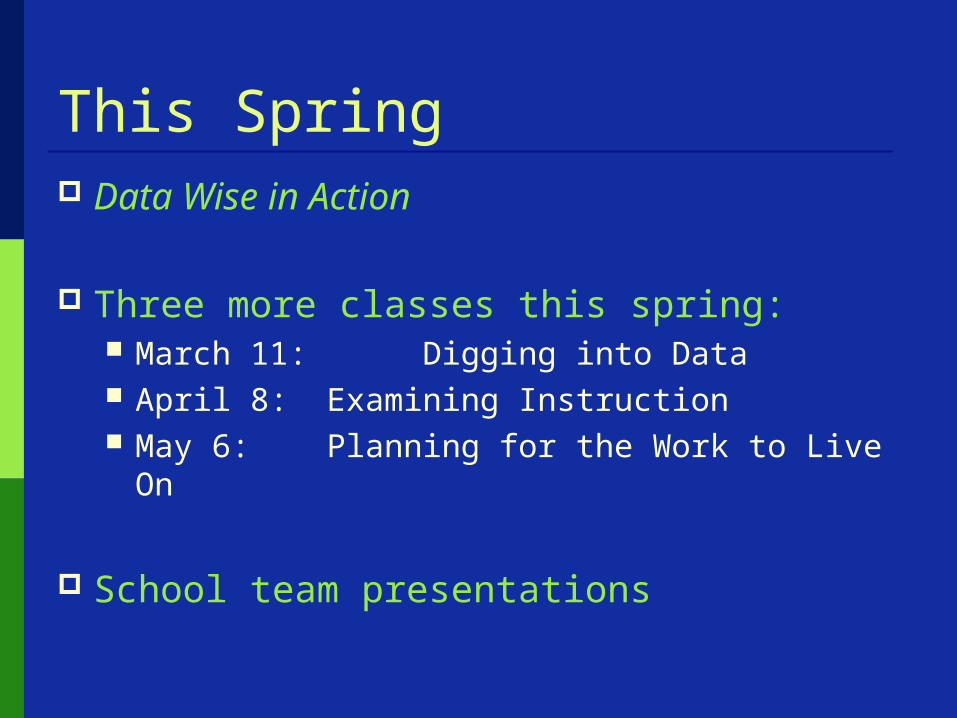
This Spring Data Wise in Action
Three more classes this spring: March 11: Digging into Data April 8: Examining Instruction May 6: Planning for the Work to Live On
School team presentations

Your Colleagues
In Action

East Boston Early Education Center Creating individual action plans for children
scoring below 10 on the DRA assessment
Bringing in doctoral students from BC to work 4 hours/week supporting advanced reading in 1st grade, thus allowing teachers to concentrate on emergent readers.
Looking at student work once a month for writing and math.

Emerson Evaluating the performance of ELL students
enrolled in SEI and regular classrooms.
Categorizing the academic performance of individual students to develop interventions to meet the needs of students performing at a variety of levels.
Creating data collection templates and PowerPoint presentation templates to help teachers collect and evaluate student data and provide the data team with a common format for presenting school-wide data to the faculty.

Hennigan Working with literacy specialists on strategies to
improve vocabulary across disciplines.
Creating a knowledge management system to capture the work that has been leading up to using student data to drive classroom instruction and to benchmark the school's academic performance.
Focusing on culturally sensitive teaching throughout the school.

Mather Using MCAS and district writing prompt data to develop
consistent, student-friendly writing rubrics across the grades.
Providing targeted math instruction for fourth-graders identified as close to proficiency in third grade or who have shown a decline in proficiency from third to fourth grade.
Triangulating data using FAST-R skill codes and MCAS to find patterns of strength and weakness in literacy instruction. This analysis will lead to cross-grade discussions about how each grade, K-5, can respond to identified needs.

Ohrenberger Creating a structured data system for collecting,
organizing and analyzing data; investigating what has worked for other schools.
Presenting the system to the ILT and discussing how data can be best used to support the work of the school.

Shaw Developing a week-in-review template for all 3rd-
5th grade classes; teachers will implement this review beginning in late February.
Using writing data and teacher input to develop a school-wide framework for writing, including benchmark expectations by grade level, exemplars, and a writing products calendar.
Offering weekend MCAS prep classes for students and families that encourage family involvement in academic skill development while providing students with test prep skills.
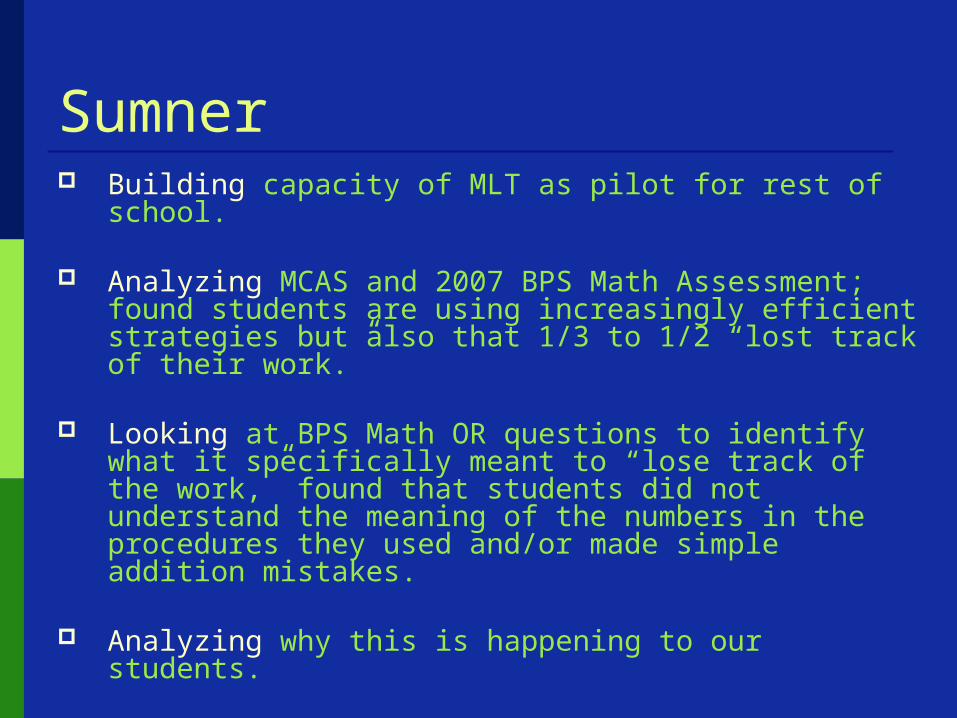
Sumner Building capacity of MLT as pilot for rest of school.
Analyzing MCAS and 2007 BPS Math Assessment; found students are using increasingly efficient strategies but also that 1/3 to 1/2 “lost track of their work.”
Looking at BPS Math OR questions to identify what it specifically meant to “lose track of the work,” found that students did not understand the meaning of the numbers in the procedures they used and/or made simple addition mistakes.
Analyzing why this is happening to our students.

Gardner Pilot Academy
Allston, MA
ELA Initiatives for Spring 2008

Gardner Pilot Academy At a Glance
• Total enrollment: 337 students• 89% of our students qualify for free and reduced lunch• Special Education: 48 students
– 30 students receive mainstream special ed. Support– 18 students are enrolled in our SAR and ESD programs
• SEI Program: 63 students• Limited English Prof: 108 students
– 11 Beginners– 32 Early Intermediate– 26 Intermediate– 23 Transitioning– 16 recommended for FLEP

Gardner 3rd, 4th and 5th Grade Reading/ELA Scores Compared to the District and the State
0%
10%
20%
30%
40%
50%
60%
70%
80%
90%
100%
3rdGrade
Reading2007
(n=44)
District State 4thGradeELA2007
(n=41)
District State 5thGradeELA2007
(n=37)
District State
Group
Per
cen
tag
e o
f Stu
den
ts
Advanced
Proficient
Needs Improvement
Warning

ELA initiatives“Response to Intervention”
1. Oral Reading Fluency2. Benchmark System3. Levels of Questions/Open Response
We will…• Explain the components of our plan• Describe the data that is used (or will be used)
to collect this information• Talk about why these areas are particularly
important for improvement in ELA as demonstrated on the MCAS

Response to Intervention
• It’s the practice of providing high quality instruction and interventions matched to student need, monitoring progress frequently to make changes in instruction based on individual progress (Rechly, 2005)
• It is not a directed program where there is no room for teacher input or ideas.– It is not a scripted program
• It’s a differentiated instruction program

TIER 1Scientifically-based
Instructional Reading Program(SIRP)
TIER 3One-on-One
Tier 1 – Primary Prevention
•Universal Screening (CBM probes)
•All students•Progress monitoring of ELL’s•Progress monitoring of high-
risk
Tier 2 – Small Group Tutoring
•15-20 week sessions & weekly PM
•Respond to intervention (RTI) base on 4-6 data points
•Add, change and/or refer
Tier 3 – Tertiary Prevention
•1:1 and Progress Monitoring (PM)
•MDT evaluation (IAP)•Eligibility & IEP
• Oral English proficiency &Academic language proficiency
• Monthly PM & strategy identification
TIER 2Additional SIRP
Increasing needs based intervention
Figure 1.Response to Intervention:(adapted from Fuchs & Fuchs, 2007)
UniversalScreening
Pre-referralIntervention
Referral toSpecial Ed.

Initiative One: Continuation of Oral Reading
Fluency Work What is this?• Examination of each students’ DIBELS scores (monthly) • Students are coded by Tier (1,2 or 3)• Teachers discuss what should be done in each class and/or
for individual students monthly
What does the data look like?• Individual students’ scores• School level data:
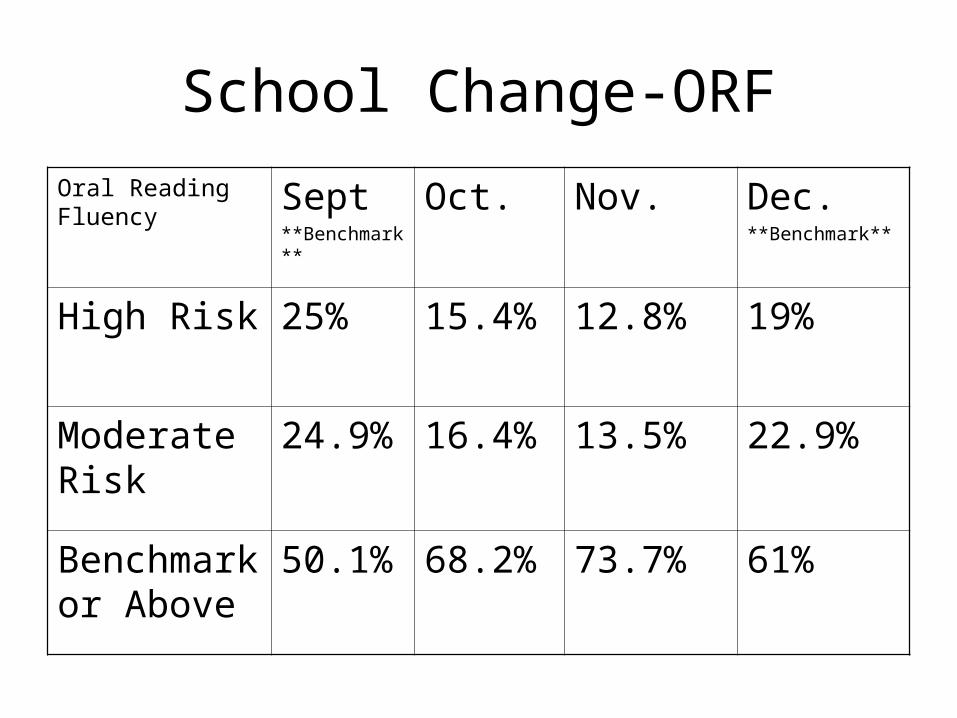
School Change-ORF
Oral Reading Fluency
Sept**Benchmark**
Oct. Nov. Dec.**Benchmark**
High Risk 25% 15.4% 12.8% 19%
Moderate Risk
24.9% 16.4% 13.5% 22.9%
Benchmark or Above
50.1% 68.2% 73.7% 61%
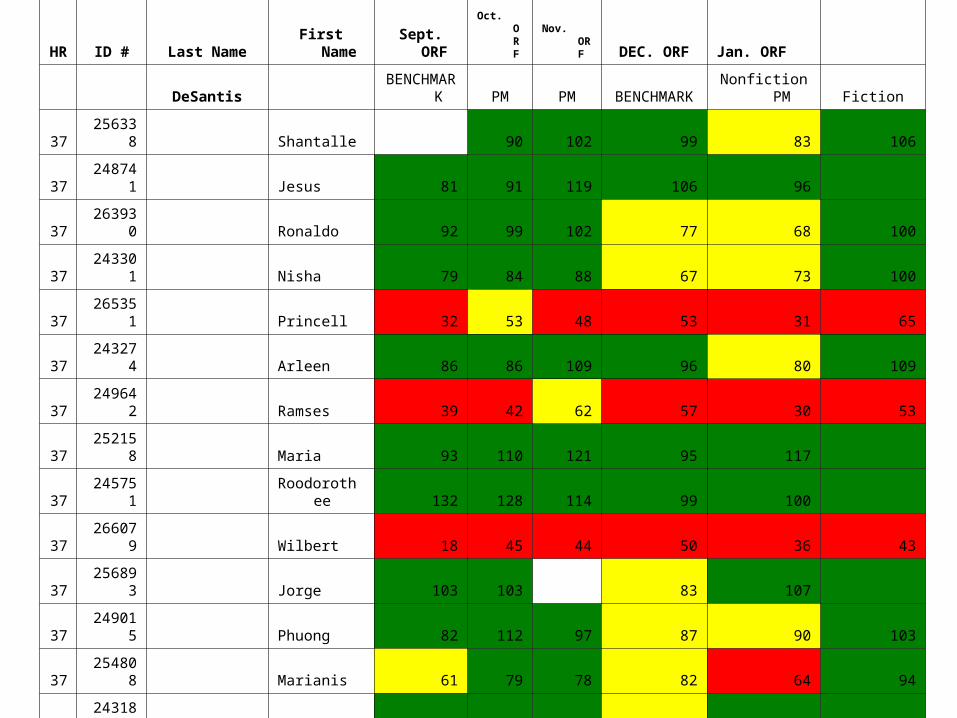
HR ID # Last Name First Name Sept. ORF Oct. ORF Nov. ORF DEC. ORF Jan. ORF
DeSantis BENCHMAR
K PM PM BENCHMARK Nonfiction PM Fiction
37 256338 Shantalle 90 102 99 83 106
37 248741 Jesus 81 91 119 106 96
37 263930 Ronaldo 92 99 102 77 68 100
37 243301 Nisha 79 84 88 67 73 100
37 265351 Princell 32 53 48 53 31 65
37 243274 Arleen 86 86 109 96 80 109
37 249642 Ramses 39 42 62 57 30 53
37 252158 Maria 93 110 121 95 117
37 245751 Roodorothee 132 128 114 99 100
37 266079 Wilbert 18 45 44 50 36 43
37 256893 Jorge 103 103 83 107
37 249015 Phuong 82 112 97 87 90 103
37 254808 Marianis 61 79 78 82 64 94
37 243186 Lianna 91 99 95 79 98
37 245850 Amilcar 122 105 110 114 88 88
37 242837 Carlos 111 139 130 116

Oral Reading Fluency Work Continued…
What do teachers do as a result of the data they get?• Plan for whole class instruction: Add or change centers, discuss with
other teachers how to maximize time with certain groups of students
• Plan for individual students: Project Read, Great Leaps, Visualizing and Verbalizing, extra practice of current strategies, speech and language therapy, ESL
• Revisit student data the subsequent month: Did the new initiatives work? Did one class improve drastically? Why might this have happened?
Why is this important for improving reading?• Teachers are able to see student progress monthly and target
instruction based on individual students’ performances.• Oral reading fluency is highly correlated with reading
comprehension.
Initiative Two: Benchmark System
What is this?• In addition to the DIBELS scores Gardner has
just begun implementing a new "benchmark system."
• It will provide a better understanding of each student’s instructional reading level (K-5) in order to plan for effective guided reading instruction
• Consistent across all grades (K-5)


Benchmark System Continued…
What does the data look like?• Currently, this data is tracked on monthly charts and displayed on the
school wide data wall. The next step will be designing a better school tracking system.
• The tracking system will have information for each child and each class throughout the year. Each time a student moves to a new level, the level will be entered in (perhaps bimonthly) so there is information about progress of each child.
What will teachers learn from this data?• At what independent reading level each student is currently reading
• Which students are progressing quickly/ slowly
• Skills that students need to move to the next level

Initiative Three: Questioning
What is this?• Based on MCAS scores it was seen that Gardner Students did not perform as high on questions requiring students to analyze and think about implicit meaning about what they read, especially on the MCAS open response prompts
•Starting in Jan. 2008 we will give MCAS open response assessments three times a year in 3rd, 4th and 5th grade using a school based MCAS rubric to monitor progress.
•In order to measure ongoing progress as to how students will perform on the MCAS all students in grades 3-5 will take monthly FAST-R passages. These passages will be used as instructional tools during guided reading.

Types and Levels of Thinking Assessed on Grade 5 ELA MCAS 2007
0% 5%
41%
8%
32%
3%
11%
FE 1: identify evidence stated in text
FE 2: recognize evidence stated atmultiple locations
MI 1: determine implicit meaning fromparticular words in the text
MI 2: determine implicit meaning fromthe total text
MI 3: determine implicit meaning byunderstanding organization ofinformation
MI 4: determine the implicit meaningand apply the meaning beyond thecontext
MI 5: determine the implicit meaning byincorporating literary knowledge
Types and Levels of Thinking Assessed on 3rd Grade Reading MCAS 2007
14%
20%
20%8%
19%
0%
19%
FE 1: identify evidence stated in text
FE 2: recognize evidence stated atmultiple locations
MI 1: determine implicit meaning fromparticular words in the text
MI 2: determine implicit meaning fromthe total text
MI 3: determine implicit meaning byunderstanding organization ofinformationMI 4: determine the implicit meaningand apply the meaning beyond thecontextMI 5: determine the implicit meaning byincorporating literary knowledge

Questioning Continued…
What will the data look like?
• The data will be collected to show how each student individually performed on the open response prompts as well as how we performed as a school. (tracking sheet being designed)
• BPE generates data sheets for each class and individually for each student for each FAST-R passage
What will teachers do with the data they get?
• Teachers will use a questioning planning sheet to track the level of questions asked (Blooms) to be used during guided reading and while planning class lessons (making meaning)
• Grade level teams (beginning with 4th and 5th grades) will analyze open response data and begin to plan, develop and implement mini-lessons to explicit teach this content area.

Response from Teachers
The best thing about today’s session was: – Looking at the actual data / talking to Claudia 1 on 1 to get
clarification on independent reading at the upper grades– Time to plan; looking at data and figuring out what to do next– Visual display of data– Looking at data– The data was useful; it’s encouraging to see growth.– Collaborating with other teachers and other grade levels.– Seeing students progress; supporting Susan and her students
by helping her make instructional changes– I like the line plot graphs better – they are easier to read.– The charts/data prepared– Time to look at the graphs and talk about individual students
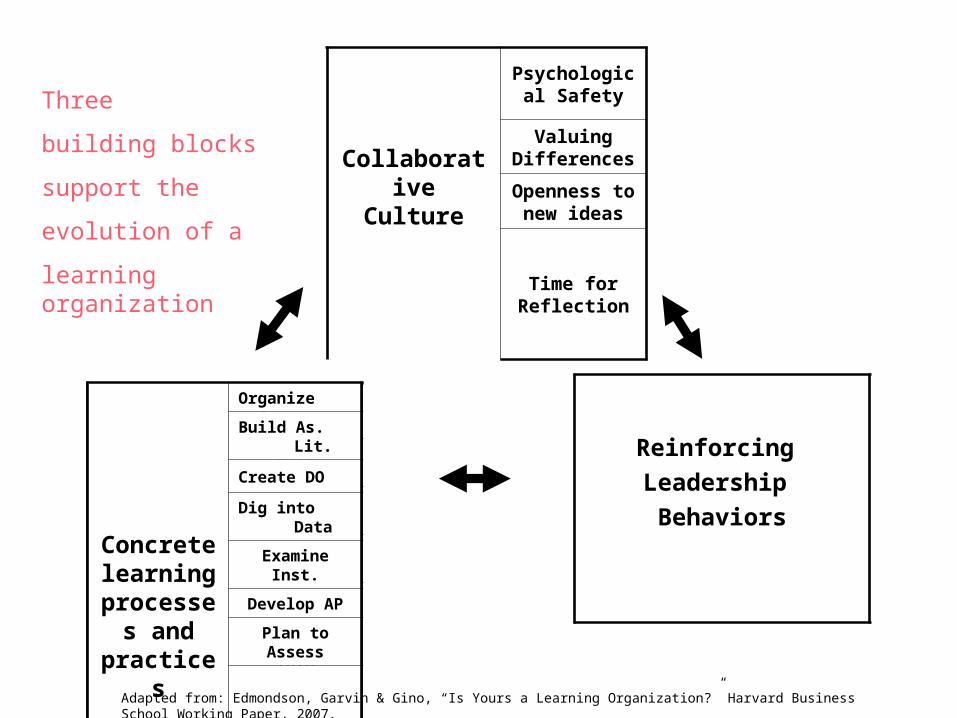
Collaborative Culture
Psychological Safety
Valuing Differences
Openness to new ideas
Time for Reflection
Concrete learning
processes and
practices
Experiment-ation
Info Collection
Analysis
Ed & Training
Info Transfer
Reinforcing
Leadership
BehaviorsConcrete learning
processes and
practices
Organize
Build As. Lit.
Create DO
Dig into Data
Examine Inst.
Develop AP
Plan to Assess
Act & Assess
Three
building blocks
support the
evolution of a
learning organization
Adapted from: Edmondson, Garvin & Gino, “Is Yours a Learning Organization?” Harvard Business School Working Paper, 2007.
McKay K-8 School
Tracking Our Evolution
As a
Learning Organization

Collaborative Culture
Reinforcing Leadership
Where we were: 2004-2005

Step 2004-2005
1. Organize
2. Build Assess. Literacy
3. Create Data Overview
4. Dig into Data
5. Examine Instruction
6. Develop Action Plan
7. Plan to Assess
8. Act and Assess
2005-2006
2006-2007
Reinforcing Leadership
Collaborative Culture
2007-2008
DW ClassHow have we grown over time?

Collaborative Culture
Reinforcing LeadershipWhere we are today:
2007-2008

Save the Last Word Protocol
Person 1ReadsQuote
Person 2Responds
2 min.First Round
Second Round
Person 3Responds
2 min.
Person 1Has Last
Word3 min.
Person 2ReadsQuote
Person 3Responds
2 min.
Person 1Responds
2 min.
Person 2Has Last
Word3 min.
Third Round
Person 3ReadsQuote
Person 1Responds
2 min.
Person 2Responds
2 min.
Person 3Has Last
Word3 min.
Choose Timekeeper!
Debrief How to best engage colleagues in ideas in this article?
Team Time Make your own checklist Plan upcoming meetings, TF visit
For next class: Read Data Wise in Action Chapter 3 Chapter 4
Chapter 7 (optional)