a4 report template - boston consulting groupimage-src.bcg.com/bcg_com/building-new-india-feb... ·...
TRANSCRIPT

Building a New India: The Role of Organized Retail in Driving Inclusive Growth A
Building a New IndiaThe Role of Organized Retail in Driving Inclusive Growth
Since 1895
The Boston Consulting Group (BCG) is a global management consulting firm and the world’s leading advisor on business strategy. We partner with clients in all sectors and regions to identify their highest–value opportunities, address their most critical challenges, and transform their businesses. Our customized approach combines deep in sight into the dynamics of companies and markets with close collaboration at all levels of the client organization. This ensures that our clients achieve sustainable compet itive advantage, build more capable organizations, and secure lasting results. Founded in 1963, BCG is a private company with 71 offices in 41 countries. For more information, please visit www.bcg.com.
The Confederation of Indian Industry (CII) works to create and sustain an environment conducive to the growth of industry in India, partnering industry and Government alike through advisory and consultative processes.CII is a non–government, not–for–profit, industry led and industry managed organization, playing a proactive role in India’s development process. Founded over 115 years ago, it is India’s premier business association, with a direct membership of over 8100 organizations from the private as well as public sectors, including SMEs and MNCs, and an indirect membership of over 90,000 companies from around 400 national and regional sectoral associations.CII catalyses change by working closely with Government on policy issues, enhancing efficiency, competitiveness and expanding business opportunities for industry through a range of specialized services and global linkages. It also provides a platform for sectoral consensus building and networking. Partnerships with over 120 NGOs across the country carry forward our initiatives in integrated and inclusive development, which include health, education, livelihood, diversity management, skill development and environment, to name a few.CII has taken up the agenda of ‘Business for Livelihood’ for the year 2010–11. The focus for 2010-11 would be on the four key Enablers for Sustainable Enterprises: Education, Employability, Innovation and Entrepreneurship. While Education and Employability help create a qualified and skilled workforce, Innovation and Entrepreneurship would drive growth and employment generation.With 64 offices and 7 Centres of Excellence in India, and 7 overseas in Australia, China, France, Singapore, South Africa, UK and USA, and institutional partnerships with 223 counterpart organizations in 90 countries, CII serves as a reference point for Indian industry and the international business community.
Since 1895

Building a New IndiaThe Role of Organized Retail in Driving Inclusive Growth
bcg.com
Abheek Singhi
Amitabh Mall
February 2011
© The Boston Consulting Group, Inc. 2011. All rights reserved.
For information or permission to reprint:
Please contact BCG at:E–mail: bcg–[email protected]: +91 22 6749 7001, attention BCG/PermissionsMail: BCG/Permissions The Boston Consulting Group (India) Private Limited Nariman Bhavan 14th Floor Nariman Point Mumbai 400 021 India
Please contact CII at:E–mail: [email protected] • Website: www.cii.inFax: +91 11 2462 6149, attention CII/PermissionsTel: +91 11 24629994 – 7Mail: The Mantosh Sondhi Centre 23, Institutional Area Lodi Road New Delhi–110 003 India
CII Membership Helpline: +91 11 435 46244 / +91 99104 46244CII Helpline Toll free No: 1800–103–1244

Building a New India: The Role of Organized Retail in Driving Inclusive Growth 3
Contents
Foreword 4
Preface 5
Executive Summary 6
Context : Why Inclusion? 10
Driving Inclusive Growth: Role of Organized Retail 12Producer Perspective 12Worker Perspective 16Consumer Perspective 20
Impact: Scenarios of Growth and Size of Prize 24
Call to Action: Imperatives for the Sector 28
Appendix 1 – 2010 Size of Organized Retail in India 31
Appendix 2 – Scenarios for Growth of Organized Retail 33
Note to the Reader 35
For Further Reading 36

4 The Boston Consulting Group
I am very happy to present this report from Confederation of Indian Industry (CII) and the Boston Consulting Group (BCG). This report will highlight the important role that the Indian retail sector can play towards the national agenda of inclusive growth and the way forward for all the stakeholders towards achieving the dual goal of profitable and socially responsible growth. This report draws attention towards benefits that organized retail can assure to all the stakeholders, namely the consumer, producer and employee. The paper also highlights
different challenges that have to be addressed to enable retail industry as a key driver of inclusion and suggests relevant imperatives to mitigate these challenges.
The year 2010 has been an inflexion point for the retail industry in India. With rapid economic growth manifested through 8.5–9.0 percent in GDP, we are at a point where consumption growth will witness not just increased penetration in existing categories but also the launch of a number of new products and categories in India.
I am sure that with your support and the support of all other retail stakeholders in India, we will put India on the retail map of the world in the coming years. I look forward to working even more closely with you to help develop and grow this industry to its true potential in this country.
I would like to take this opportunity to thank all the members of the CII National Committee on Retail for the year 2010–11 for their valuable contribution towards the findings of this report.
Thomas Varghese Chairman CII National Committee on Retail 2010–11 and Chief Executive Officer Aditya Birla Retail Ltd.
Foreword

Building a New India: The Role of Organized Retail in Driving Inclusive Growth 5
Preface
Inclusion has been a key topic of discussion in recent times. Inclusive growth is a key thrust area for the 12th five–year plan of the Government. Multiple stakeholders including Government, NGOs, the corporate sector and the broader civil society are getting aligned to deliver against the ambitious target of achieving inclusive growth. Organized retail is usually associated with increased consumption, larger storefronts and scale benefits. The impact of the sector in driving inclusion is discussed rarely, if at all. While there has been ample anecdotal
evidence about the impact of the sector on driving growth within the economy, there is absence of a holistic perspective on the same. CII and BCG have worked together to assess the impact of organized retail on India’s inclusive agenda for the first time in this report.
The objective of this study has been to develop a fact–based, analytical view of the issue. To that end we met with industry leaders to understand their perspective on the topic and identify relevant examples. A survey of retailers was conducted to understand their aspirations as well as the impact generated on different dimensions. The team interviewed several consumers, especially from the lower economic strata to assess the benefit they have realized. It also interviewed several entry level employees in both organized retail as well as other alternate professions. Further, the team conducted extensive interviews of farmers and traders in areas like the Azadpur mandi, Narayangaon and Vashi APMC market. All this was coupled with a comprehensive scan of secondary research available on the topic.
This report is an outcome of four months of extensive research conducted by the BCG and CII teams. We hope you will find it both interesting and insightful. We’d be happy to discuss any findings, or answer any queries that you may have regarding issues related to the retail sector.
Abheek Singhi Amitabh Mall Partner and Director Principal The Boston Consulting Group The Boston Consulting Group

6 The Boston Consulting Group
Inclusive growth is believed to be the most sustainable economic growth model for India
India has moved from being the 10th largest economy ◊ in the world in 1990 to the 4th largest today in terms of Purchasing Power Parity (PPP). Average annual Gross Domestic Product (GDP) growth has increased consistently, rising from 5.0 percent in 1985–1994 to 6.2 percent in 1995–2004 to almost 9 percent in 2005–2009.
However, challenges of inequity remain pervasive. ◊ Some parts of the economy are lagging behind — for instance, agriculture has grown at a mere 2 percent per year from 2001–2010, compared to almost 9.5 percent for services. As a result, not everyone is deriving the benefits. For example, the gap between urban and rural incomes for salaried / regular wage workers has widened from 27 percent in 1993–94 to 39 percent in 2007–08.
A few years back, the World Economic Forum (WEF) ◊ and CII had evaluated different scenarios of economic development for India on two dimensions — degree of inclusiveness and degree of integration with the world. Economists from the Oxford University and the National Council for Applied Economic Research (NCAER) evaluated these scenarios and found that the scenario high on both inclusion and global integration had the highest economic growth rate over the long run.
Organized retail (also referred to as modern trade or modern retail) can play a crucial role in driving inclusive growth by impacting three key stakeholders: producers, workers and consumers. At the same time
it enhances the ability of the Government to facilitate the inclusive agenda
Inclusion is about improving the quality of life of ◊ those sections of the population that would otherwise not benefit largely from growth. There are several facets to inclusion — economic inclusion is about fair income and opportunity for growth, social inclusion is about non–discrimination and integration with the society, financial inclusion is about access to channels of savings, borrowing and remittances, and so on.
The organized retail sector has the ability to directly ◊ drive inclusion for a very large number of people falling into three stakeholder categories: producers, workers and consumers.
The sector also allows the Government greater ◊ transparency throughout the supply chain, making it easier to monitor product safety as well as price movements.
Organized retail can help improve income for producers by increasing price realization and providing opportunities for growth that may not otherwise have been available to them
With close to 60 percent of the Indian population ◊ dependent on agriculture, farmers are by far the largest ‘producer’ set in the country.
However, farmers in India today receive a small share ◊ of the end consumer price. As an example, for tomatoes, farmers in India earn only ~30 percent of consumer price while in more developed markets this is in the 50–70 percent range.
Executive Summary

Building a New India: The Role of Organized Retail in Driving Inclusive Growth 7
A significant portion of this markup is due to a large ◊ number of intermediaries. This results in margin payouts at several steps in the chain, as well as losses due to multiple handling. The fragmented industry structure also results in low investments in technology and supply chain management. In the case of tomatoes, as much as 23 percent of the consumer price is lost in leakages and another 23 percent is earned by intermediaries as profit.
Organized retail has the potential to drive efficiencies ◊ in this chain by (a) increasing price realization for farmers by 10–30 percent by sourcing directly or closer to the farm (b) reducing handling and wastage by 25–50 percent through consolidation as well as investments in technology, either directly or through aggregators (c) upgrading the farmer’s capabilities by providing know–how and capital.
On the non–farming side, modern retail provides an ◊ efficient go–to–market model to small manufacturers who lack the distribution scale to cover the market. For instance, several private label suppliers of national retailers are typically local unbranded players who get an opportunity to expand their sales footprint.
A significant portion of employment generated by organized retail goes to individuals with lower education levels. These jobs would provide (a) fair wages and benefits (b) opportunities for further development and growth, and (c) better working environment than most alternatives available to such employees
While India’s ‘demographic dividend’ is much talked ◊ about, it is not as commonly known that there is a mismatch between qualifications of the labour supply and demand. Over 90 percent of new labour supply in India from 2011–2020 is estimated to have an educational qualification of class XII or below, while the demand for such individuals from the high growth services sector is <70 percent.
The demand for labour in organized retail, however, ◊ is more closely matched to the supply, with almost 70–80 percent of this demand for individuals with education level of class XII or below. In comparison, the same number for IT and BPO is closer to 10–15 percent.
The typical earnings in the organized retail sector for ◊ an individual with low education levels, surpass most available alternatives by 15–30 percent. Given that a part of the earnings comes as benefits, this also improves the quality of life for these individuals.
Compared to unorganized options available to such ◊ individuals, organized retail provides a more distinct career path and a significant opportunity for growth. The income of a class X or XII pass individual can grow by 2x in 4–5 years – something unheard of in other sectors.
Additionally, investment in training by retailers ◊ further adds to their personal development. For example, in 2010, hypermarket and supermarket formats spent between Rs. 4,000–14,000 per employee per year on training activities and specialty stores spent upwards of Rs. 22,000 per employee. On an average a typical hypermarket entry level employee would go through 40–50 hours of training per year to build skills.
With controlled work hours, ongoing skill development, ◊ pre–determined holidays and the pride of working in a modern setting, organized retail offers a good working environment to its employees. In particular, it is one of the few organized sectors that provide a good option for women with low education level as well as people with handicaps.
Organized retail provides consumers with an assurance of quality, increased affordability and wider choice
Testing conducted for over 1.6 million random ◊ samples in 2008 by the Government under the Prevention of Food Adulteration Act, 1954 reported an adulteration of over 7 percent in food products. This is exacerbated for lower income households, with serious consequences on health.
The fragmented nature of traditional trade makes it ◊ difficult for the Government to fully enforce adulteration laws. On the other hand, there is greater transparency and ease of monitoring in the case of organized retail, which sets stringent standards that are executed through pre–defined processes and technology.

8 The Boston Consulting Group
Given its ability to drive efficiencies and leverage ◊ scale, modern trade is able to increase affordability for consumers. For a low income family, organized retail has the ability to lower the cost of the monthly consumption basket by as much as 5–10 percent.
Unorganized retail involves a large number of ◊ intermediaries who earn larger profits during times of shortage. For instance, during the current onion crisis, the consumer price jumped ~ 2.7 times in a matter of months. The largest portion of this rise went to the profit margins of the intermediaries, which went up ~5.4 times.
With reduction of intermediaries and greater ability ◊ to provide transparency, a large–enough organized retail sector has the potential to help contain the impact on the consumer in such situations.
Currently, India is witnessing a rapid proliferation of ◊ needs which are manifesting in the form of greater demands for variety and customized offerings. This phenomenon is not restricted to just the higher income segment. With its ability to manage complexity in a cost–effective manner, growth of organized retail is crucial to meeting these demands.
There are two distinct scenarios for the future of organized retail sector. The first is the one where modern trade meets its ‘true potential’. In this scenario the size of the sector is estimated to reach ~US$ 260 billion by 2020 or ~21 percent retail penetration
The current size of organized retail is currently ◊ estimated at close to US$ 28 billion or 6–7 percent of total retail. This includes food and beverages, clothing and accessories, electronics and appliances, furniture and furnishings, health and personal care, food services and drinking places, sporting goods, hobby, books, music, leisure and entertainment and other miscellaneous items.
The total retail market is projected to be US$ 1,250 ◊ billion by 2020 based on macro–economic factors such as GDP growth, private consumption growth and mix of goods and services within private consumption.
The scenario of modern trade meeting its ‘true ◊ potential’ would be characterized by a few features.
There would be high saturation in major urban centres and rapid expansion to smaller cities and towns. Large sub–sectors like food and grocery which have been lagging behind, would see significantly greater penetration. Profitability of players would be stable and global majors would be playing a greater role through strategic investments and transfer of know–how.
The penetration of organized retail in such a scenario ◊ would grow at an aggressive pace and in line with top quartile growth of penetration witnessed in other countries. This will lead to a size of ~US$ 260 billion by 2020.
In this scenario, by 2020, organized retail would have a significant impact on the economy at large and the key stakeholders in particular
Producers: 10–30 percent higher remuneration to ◊ farmers. Aggregate increase in income of ~US$ 35–45 billion per year for all producers combined.
Employees: ~3–4 million new direct jobs which will ◊ earn an incremental income of 15–30 percent over other alternatives. ~4–6 million new indirect jobs will be created in the logistics sector, contract labour in the distribution and repackaging centers, housekeeping and security staff in the stores. In addition, significant number of new supplier jobs will also be created.
Consumers: Savings of 5–10 percent of consumer ◊ spend in specific categories, leading to an aggregate ~US$ 25–30 billion. This translates to almost 0.5 percent of GDP per year.
Such growth will require an investment of ~US$ 60 ◊ billion over the next decade, including real estate development which has several second order benefits.
The exchequer will likely receive an additional income ◊ of ~US$ 25–30 billion by way of a variety of taxes.
The second scenario is the ‘as–is’ scenario where historical constraints that have held back the sector persist. In this scenario, by 2020, organized retail would only reach US$ 170 billion or ~14 percent penetration and the impact on economy and stakeholders would be only about 2/3 of the above

Building a New India: The Role of Organized Retail in Driving Inclusive Growth 9
Growth of organized retail in the recent past has been ◊ slower than the expectations set a few years ago.
This is best exhibited by the food and grocery portion ◊ of retail (currently constitutes ~ 2/3 of all retail in India) where organized penetration has moved from about 1 percent to 2 percent in the last five years whereas several other markets have moved by 5 percent points in that time frame.
The ‘as–is’ scenario would be characterized by ◊ features such as large number of sub–scale players with continued profitability challenges, concentration of footprint in large cities, challenges in speed and quality of real estate development, persistent bureaucratic hurdles and insignificant presence of global majors.
The India retail story has been part reality and part mirage so far. It is critical that concerted action be taken to make it fully real, such that the economy derives all the inclusive benefits that come along with it. For that to happen, both the Government and the retailers need to work together to make sure that a set of key imperatives are acted upon:
Finding, training and retaining talent1.
Developing and leveraging the right know–how2.
Driving scale and investment in back–end using 3. collaborative platforms
Decreasing bureaucracy and legal hurdles in every 4. step of the chain

10 The Boston Consulting Group
India has emerged as a powerful player in the global economic arena in the recent past. Over the last two decades, India has risen from being the 10th largest to the 4th largest economy in the world at PPP, next only to the United States,
China and Japan1.
Over time, India’s average GDP growth within a decade has gradually gone up while volatility has reduced. Interestingly India’s current economic performance on several parameters, including size of retail, is very
similar to that of China, a few years back (as shown in Exhibit 1).
As India stands at the cusp of the next wave of growth, several questions have been raised on the sustainability of its growth and the choice of economic model that would get the country there. The WEF and CII developed scenarios of economic development for India along two
Context: Why Inclusion?
Exhibit 1. India currently at a threshold of the next wave of growth
Source: MOSPI; EIU; BCG analysis.
1Ministry of Statistics and Programme Implementation (MOSPI)and Economic Intelligence Unit (EIU).
Positive trajectory in GDP growth India mirrors China's retail evolution with a lag
‘05– 09‘
Real GDP growth rate (%)
8.7%
‘95– 04‘
5.0%6.2%
‘75– 84‘
4.3%
‘65– 74‘ ‘85– 94‘
3.2%
US$ Bn
0
400
800
1,200
‘98 ‘01 ‘04 ‘07 ‘10 ‘19
–6
–3
0
3
6
9
12
‘13 ‘16
Max
Average
Min
India size of retail
China size of retail (shifted by a few years)
China size of retail

Building a New India: The Role of Organized Retail in Driving Inclusive Growth 11
Exhibit 2. The scenario high on inclusion and global integration is expected to bring the most sustained growth in India
Source: Original CII World economic forum study; Modeling by Oxford Economic Forecasting (OEF) and the NCAER.
axes. The first was the degree of integration / isolation with the world. The second was the inclusiveness / exclusiveness of this growth and development.
Three distinct scenarios were developed and defined along economic performance, social development, external relationships and leadership and governance.
For instance, the scenario of ‘Pahale Bharat’ was high on inclusion as well as global integration. It was defined as the one where countrywide campaigns for social issues such as poverty alleviation and effective governance were coupled with global and regional trade participation. This would effectively drive a larger
middle class, lower poverty and strong global position in FDI and trade.
Economic forecasters from the Oxford University and the National Council for Applied Economic Research (NCAER ) then estimated what the growth prospects for the country would be under these scenarios. The study found that the scenario that was high on both inclusion and global integration had the highest economic growth rate over the most sustained period of time (as shown in Exhibit 2).
In other words, ‘inclusion’ is not a choice but a necessity for long term, sustained economic development.
'Bolly World'
'Atakta Bharat'
'Pahale India –India First'
Inclusivegrowth anddevelopment
Exclusivegrowth and
development
Isolationform
the world
Integrationwith
the world
Real GDP growth p.a. (moving 5–yr averages)
BollyWorld
PahaleIndia
AtaktaBharat
Only scenario that willbring sustained growth
Various scenarios for growth in India Comparative analysis
‘95 ‘00 ‘05 ‘10 ‘15 ‘20 ‘25
12
10
8
6
4
2
0Actual Projected
%

12 The Boston Consulting Group
Inclusiveness is about improving the quality of life of the sections of the population that would otherwise not benefit from growth. There are several facets to inclusion — economic inclusion is about fair income and opportunity for growth,
social inclusion is about non–discrimination and integration with the society, financial inclusion is about access to channels of savings, borrowing and remittances, and so on.
Inclusive growth implies a more broad–based growth where opportunities and benefits of growth are not concentrated in the hands of a few but shared with a large section of the society. Inclusive growth will include different prerogatives for different stakeholders depending on the industry.
In the context of retail, we believe that there are three key stakeholders to consider. Organized retail has the ability to drive inclusive growth for each of them, in different ways, while also enabling the Government to play a facilitator (as shown in Exhibit 3). This report explores the impact of modern retail in driving inclusive growth in India from the lens of these three stakeholders.
Producer Perspective
Farmers are by far the largest ‘producer’ set in India. About 233 million people2, or 57 percent of the total working population is engaged in agriculture and allied
Driving Inclusive Growth: Role of Organized Retail
Exhibit 3. Organized retail has the ability to drive inclusion for different stakeholders
2NSSO, MOSPI and RBI estimates for 2008–09.
Improved and stable income
Enhanced opportunities togrow business
Higher remunerationand benefits
Opportunity for growth
Superior working environment
Superior quality
Increased affordability
Greater choice
2 3Producers Employees Consumers
Government
1
Greater transparency and control over supply chainHigher revenues by taxes
Building a New India: The Role of Organized Retail in Driving Inclusive Growth 13
activities3. However they contribute only 16 percent to India’s GDP.
The traditional retail model from farmer to fork is fraught with redundancies and inefficiencies. This results in losses that lead to low price realization for the producer and fluctuating prices for the consumer. For the small farmer, these problems are compounded by lack of resources like finance and technical know–how which limit him from growing his business. These problems are equally relevant for artisans and other small manufacturers.
Organized retail has the ability to do the following: a) Improve and stabilize incomes b) Enhance opportunities to grow business
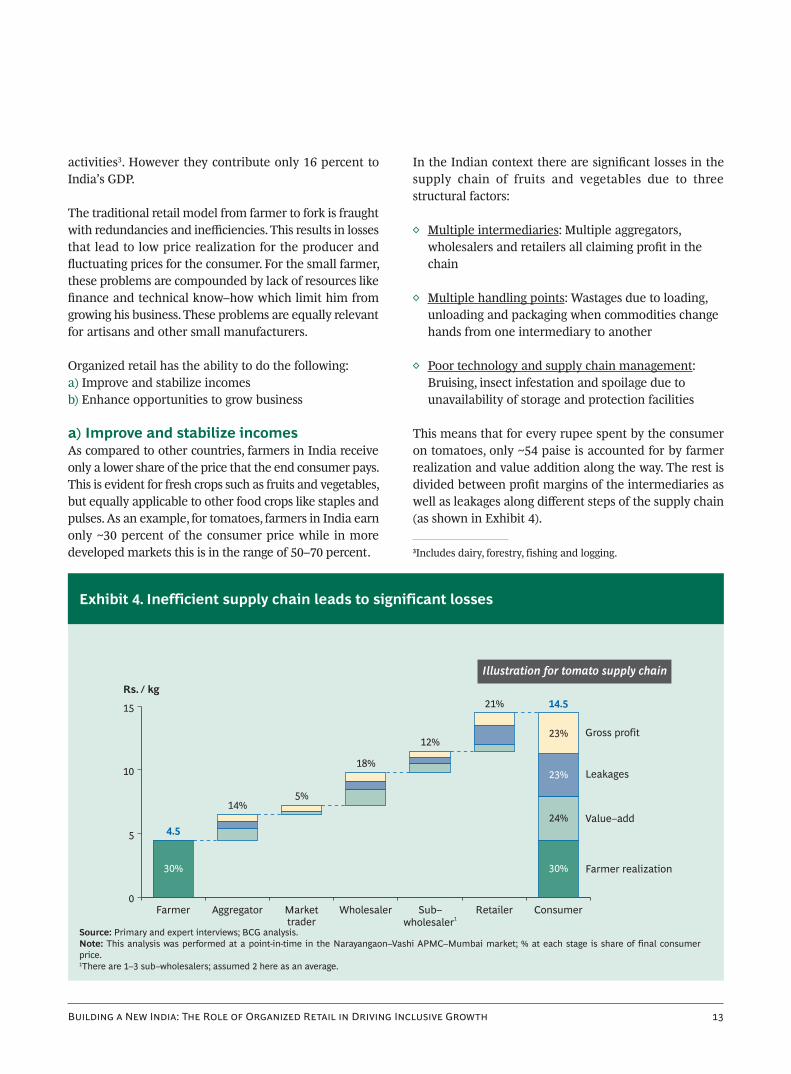
a) Improve and stabilize incomesAs compared to other countries, farmers in India receive only a lower share of the price that the end consumer pays. This is evident for fresh crops such as fruits and vegetables, but equally applicable to other food crops like staples and pulses. As an example, for tomatoes, farmers in India earn only ~30 percent of the consumer price while in more developed markets this is in the range of 50–70 percent.
In the Indian context there are significant losses in the supply chain of fruits and vegetables due to three structural factors:
Multiple intermediaries◊ : Multiple aggregators, wholesalers and retailers all claiming profit in the chain
Multiple handling points◊ : Wastages due to loading, unloading and packaging when commodities change hands from one intermediary to another
Poor technology and supply chain management◊ : Bruising, insect infestation and spoilage due to unavailability of storage and protection facilities
This means that for every rupee spent by the consumer on tomatoes, only ~54 paise is accounted for by farmer realization and value addition along the way. The rest is divided between profit margins of the intermediaries as well as leakages along different steps of the supply chain (as shown in Exhibit 4).
3Includes dairy, forestry, fishing and logging.
Exhibit 4. Inefficient supply chain leads to significant losses
Source: Primary and expert interviews; BCG analysis.Note: This analysis was performed at a point-in-time in the Narayangaon–Vashi APMC–Mumbai market; % at each stage is share of final consumer price.1There are 1–3 sub–wholesalers; assumed 2 here as an average.
Markettrader
5%
Aggregator
14%
Farmer
4.5
Rs. / kg
Farmer realization
Value–add
Leakages
Gross profit
Consumer
14.5
24%
23%
23%
Retailer
21%
Sub–wholesaler
1
12%
Wholesaler
18%
Illustration for tomato supply chain
0
5
10
15
30%30%

14 The Boston Consulting Group
Exhibit 5. Australian fruits and vegetables supply–chain leaner and more efficientOrganized retailers play a key role
Source: Industry interviews; BCG analysis.
The power of organized retail is apparent when one compares the value chain in India with that of more mature retail markets. Exhibit 5 below lays out one such comparison of the Indian tomato supply chain with that of typical tomato supply chains in Australia.
In the Australian context, organized retail has created the following impact:
Upgraded capabilities by investing capital and ◊ integrated packaging to reduce wastage by collaborating with large farmers.
Consolidated demand, allowing aggregators to invest ◊ in technology and processes to reduce wastage.
Ensured greater visibility and control over price ◊ movements by reducing the number of intermediaries.
An interesting side–effect of this is that independent retailers also benefit from these improvements and get a good price and reliable supply by leveraging systems developed for organized retail.
b) Enhance opportunities to grow businessThe benefits of direct sourcing go far and beyond increased price realization as the scale of operations expand and relationships are being built. Organized retail has the ability to lend the following advantages to the small farmers and manufacturers:
Provide access to a larger market◊ : By engaging local producers, organized retail provides them with an access to a much broader consumer set. For instance, a leading retailer operating in India has engaged a local pickle manufacturer in Amritsar and invested to upgrade his equipment. As a result, this manufacturer is now present across markets that were traditionally beyond his reach.
Improve capabilities◊ : Retailers often partner with farmers to develop their overall capabilities by providing access to finance, technical support and inputs. Other than setting up sourcing hubs, major Indian retailers are actively working with farmers by assisting them with best farming practices. A few have also invested in setting up facilities for education and medical benefits near their source.
Illustrative: Chain for tomatoes
India
Australia
xx–xx% Share of consumer pricexx–xx% Volume share of total sales
40–45%
Independentretailers
25–30%50–60% 15–20%
Traditionalfarmer
Aggregator /wholesale market
35–40%
Modernfarmer
Organizedretailers
65–70% 30–35%
Markettrader RetailersAggregator Wholesale
Sub–wholesaler
18–23%30–35% 4–6%12–15% 15–20% 10–15%
Traditionalfarmer
15–25%
Aggregator /wholesale market
25–30%50–60% 15–20%
Traditionalfarmer
Organizedretailers

Building a New India: The Role of Organized Retail in Driving Inclusive Growth 15
Organized retail: Improving income and providing opportunities for growth
Probably the best example of this point is FabIndia. Set up in 1960 as an export company of home furnishings, today FabIndia links over 40,000 rural producers to modern urban markets, creating sustainable rural jobs. FabIndia has invested in affiliate companies called Community Owned Companies (COC) of which a
minimum 26% stake is owned by the artisan community. It has helped artisans receive a fair price for their products by reducing middlemen margins. Today, the company has >US$ 95mn revenues from 135+ retail outlets in India and 4 abroad.
Who is Tukaram?
A 28–year old farmer near Narayangaon, about 60km from Pune, Maharashtra. He grows vegetables such as tomatoes, gourds, cucumber, brinjal, beetroot and has recently started growing fruits such as grapes and banana.
Tukaram used to supply to a local mandi until 4 years back but now supplies to big retailers ABRL, Reliance and Spencers.
What does he have to say?
“I used to send my produce to the local mandi where I had to pay 8% tax, 8% commission, and transport cost.
I used to get cheated in the weight and quality. Often I had to accept prices.
Now I don’t have to transport my produce to the mandi — the collection center is 2–3 km away — I save money there. No cess or commission.
I get the market rate or better — sometimes as much as 30% savings! Why would I go to mandi now?”
Source: Field interviews; BCG analysis.
His life 4 years ago… His life now…
At mandis, 20–50 km away At farm collection centers, within 2–3 km
Transport, labour, commissions, Governmenttax – ~15–20% of the sales price
Only local transport and sometimes retailersends truck for collection
No say in price, cheated on weight and quality Electronic calibrated weights, pre–definedquality specifications
Non–existent, except credit at high interest ratesFarm inputs, knowledge on practices andtraining to improve yield and quality
Ownership transfer
Selling expenses
Selling experience
Farm extensionservices
Effective realization Rs. 20–25 / kg Rs. 25–30 / kg
Volume 20–25 tons / year 25–35 tons / year
Income Rs. 4–6 lakhs / year Rs. 6–10 lakhs / year

16 The Boston Consulting Group
Worker Perspective
Today there is a great deal of mismatch between the demand and supply levels of the talent pool in India. There is an oversupply at the lower education levels. Over 90 percent of the new labour supply in India from 2011–2020 is estimated to have an educational qualification of class XII or below, while the demand for such individuals from the high growth services sector is <70 percent. A recent BCG–CII study estimated a shortage of 1.5 million jobs by 2012 for persons who have studied till class XII and lower.
While the ideal solution to bridge the mismatch is education and training the talent pool, a more immediate approach is to encourage professions and sectors that are better suited to the supply of the workforce.
Organized retail employs majority of its staff in stores, back–end logistics, transportation and distribution centers, where attitude and not education, is the most critical recruitment criteria. Our primary survey of organized retailers suggests that 70–80 percent of direct jobs created by the sector are suitable for XII class
graduates and below. This is a huge number as compared to high profile sectors like IT / BPO where the capacity to absorb this educational cross–section is merely 10–15 percent (as shown in Exhibit 6). Additionally, there are many classes in our society for which organized retail becomes the only attractive option, for example, women with lower education, people with handicaps, etc.
Organized retail benefits individual workers in the following ways:a. Higher remuneration and benefits b. Opportunity for growth c. Superior working environment
a) Higher remuneration and benefitsOrganized retail provides better overall remuneration, especially to people who have limited alternatives. It provides for benefits such as medical and life insurance, retirement and provident funds, sick and personal leaves, etc. For example, in a major city suburb, an organized retail employee earns ~Rs. 6,000 which is higher than most other jobs available to a X standard graduate (as shown in Exhibit 7).
Exhibit 6. Organized retail’s talent demand better meets India’s supply
Source: Expert interviews; responses to BCG questionnaire; CII–BCG report ‘India’s Demographic Dilemma’; NASSCOM; BCG analysis.
Workforce supply and demand (2011–2020) by qualification
20–30%
Supply ofIndian workforce
90–95%
5–10%
% split of the workforce
50
100
0Demand from
IT and BPO
10–15%
85–90%
Demand fromorganized retail
70–80%
XII pass and below Graduated and diploma holders

Building a New India: The Role of Organized Retail in Driving Inclusive Growth 17
Exhibit 7. Higher remuneration and opportunities for growth offered by organized retail
Source: Primary interviews; BCG analysis.1In a mid–sized company
Organized retail offers higher overall benefits over most true alternatives
3100–3400
Peon / delivery boy1
3100–3400
Shop floor at unorganized factory
Unorganized retail 4000–4500
4000–4500
Organized manufacturing
Approximate starting cost–to–company / month (Rs.)
Community services (cleaning / maintenance) 2600–2800
Security 2800–3000
Courier / delivery boy
BPO / back–office 7000–7500
5750–6250
Driver 6500–7000
Bonus Leave etc. – equivalent monies Benefits – medical, retirementAverage basic salary
0 2,500 5,000 7,500 10,000
Fast–paced career progression opportunities within a typical organized retailer
Startingsalary
8X
40–60%
5–15%
5–20%
% employeespromoted
2.0–4.0 years
1.5–3.0 years
1.5–3.5 years
1.0–2.5 years
Years topromotion
40–60%
Typical entry
3X
2X
X
5X
Entry level job opportunities for class X educated people in a major city suburb
Zonal/ HO
Supervisory storestaff / floor manager
Assistant storemanager / in–charge
Storemanager
Basic store staff – backroom,housekeeping, assistance, cashier
Outsourced staff – cleaning, security etc.
6000–6500
Organized retail

18 The Boston Consulting Group
b) Opportunities for growthUnlike many of the other opportunities available to lower educated individuals, organized retail also provides a well–defined career progression. Depending on the skills, capabilities and development capacity, an entry–level employee at the store can grow to be the store manager in as less as 6 years. For most unorganized job opportunities, such options do not exist.
With the rapid growth of retail, there is an intrinsic demand for better trained and skilled labour. To address this, organized retail provides various training opportunities and self and professional development programmes for employees who demonstrate potential and motivation. In 2010, hypermarket and supermarket formats spent between Rs. 4,000–14,000 per employee, per year, on training activities and specialty stores spent upwards of Rs. 22,000. Some retailers have established institutes that offer vocational training to entry level candidates to increase their employability in the retail sector.
An example is Bharti–Walmart, which has started training centres in collaboration with the state
governments of Punjab and Delhi and Centum Learning at Amritsar and Delhi to offer 2–3 weeks of vocational training courses to students. In just about two years, these centres have enrolled more than 4000 candidates, almost 25 percent of whom come from rural areas. Almost 95 percent of these have completed the certification. Over 1200 of them — with almost a quarter being female — have been placed in jobs with a number of retailers, including Bharti–Walmart Best Price Modern Wholesale stores.
c) Superior working environmentWorking in a retail environment provides employees with an intangible but important dignity of labour. They have smart uniforms and are given customer–facing roles. They are often trained on soft skills, interact with knowledgeable superiors and are treated as professionals. Well–defined roles, limited work hours (shifts of typically 9 hours), personal leaves and well designed set–up create a favourable working environment.
Of course, there is a long way to go before the industry is fully able to realize the potential of its employees. It is crucial to ensure that these employees feel ‘cared’ for.
Exhibit 8. Organized retail provides planned career growth with multiple up–skilling opportunities
Note: Names changed on request.Source: Primary interviews; BCG analysis.
Examples of employees with potential and capabilities who have made significant career progression
No. of direct reportsRs. ‘000 / month
10
40
30
20
50
0Y13Y12Y11Y10Y9Y8Y7Y6Y5Y4Y3Y2Y1Y0
No of direct reports
Salary (cost–to–company)
Nisha, 24 yearsEducational background:HSC / 12th pass, basic English
Rohan, 30 yearsEducational background:graduate / agronomist
Customerserviceassociate
Seniorcustomerserviceassociate
Supervisor
Promotion with significant
additional responsibility
Point of entry
Current position
Assistantstore
manager
Store manager
Area manager
0
40
80
120
160
200
E
C
C
C
E
E

Building a New India: The Role of Organized Retail in Driving Inclusive Growth 19
Organized retail provides higher remuneration, better opportunities for growth and a superior working environment
Minakshi
20 years old
10th pass
Organized retailer
Rs. 4,300 (basic) + Rs. 300 (cashiering) + Rs. 100–500 (incentives) + ESIC + PF
Fast–track program promoting to supervisor in 1 year, with possible promotions to assistant store manager in 3 years
9–hour shift with 30 minutes break
Basic store training — (2 days common, 3 days in–store), soft–skills training (1 day), 1 day monthly training for supervisory role, on–the–spot sessions on selling, managing customers etc. conducted by store manager for 1–2 hours in a month
Well–defined role: customer assistance, or cashier, or stock handling for a category
Sick and personal leaves (total 21 paid leaves), weekly off
“There are clear incentives and a defined path. I will one day manage my own store. If I show capability, I will get support, and I’ll achieve it. I feel empowered and dignified at this job”
Raju Yadav
23 years old
10th pass
Kirana store
Rs. 4,000 + Rs. 300 (bonus)
Nil, in the same business; earnings improve by Rs. 200–300 every year
12–15 hours (9 am to midnight)
No formal training. Ongoing instructions from proprietor
Multiple roles: counter, cashier, delivery
No leaves, no guaranteed off
“There is no future here — I will always remain a worker in the store. Everything depends on the whims of the owner. If I get an opportunity elsewhere, I’d be glad to move on”
Who are they?
Employer
Remuneration
Opportunities for growth
What do they have to say?
Work Environment

20 The Boston Consulting Group
Consumer Perspective
Indian consumers are becoming increasingly demanding — they want good quality and great choice at affordable prices. These demands are not only restricted to the high income consumers but have become increasingly common for all.
Organized retail is uniquely equipped to serve these consumers and provides three inclusive benefits:a) Superior qualityb) Increase affordabilityc) Greater variety
a) Superior quality Consumers often suffer due to non–compliance of unorganized retailers with food safety standards and counterfeit products. For example, adulteration continues to be a cause of concern in India. Testing conducted for over 1.6 million random samples in 2008 by the Government under the Prevention of Food Adulteration Act, 1954 reported adulteration of over 7 percent in food products. This is exacerbated for lower income households, with serious consequences on health.
Adulteration is high not only in categories like milk and staples, but also fruits and vegetables, where chemicals are added to the fruit to retain colour and shelf life. It is known to have serious impact on health and well–being causing temporary sickness, chronic disorders and so on.
While the Government has put in place necessary laws to prevent food adulteration, the large number of retail outlets makes it difficult to enforce these laws. In Maharashtra alone, courts have more than 10,000 pending cases over the last decade pertaining to food adulteration.
Organized retail provides higher quality of goods on account of pre–defined and stringent standards adopted by the retailers (as shown in Exhibit 9). This is due to increased responsibility, brand–image and the very nature of modern trade being organized. Multiple check–points, avoidance of counterfeit products and strong processes ensure that these standards are enforced and traceability maintained across the supply chain, right from procurement till the end consumer purchase. Process automation that reduces the number of handlings, quality training for employees at all levels, sensitization
Exhibit 9. Organized retail has strict internal processes to enhance food safety
Source: Quality specifications at a leading Indian retailer; primary and expert interviews and BCG analysis.
Illustrative for toor dal
No testingAbsentNMT30Aflatoxin (microgram/kg)
No testingAbsentNMT100Uric acid (mg/kg)
No testingAbsentAbsentColour (artificial) impurities
No testingAbsentAbsentKeshari dal admixture
2–3Max 0.1NMT3%Weevilled grain (% by count)
3–4Max 0.1Immature / shrinked / shrivelled (% w/w)
1–2AbsentMax 6Other edible grain (% w/w)
Foreign matter (% w/w)
4–5
Max 1.0
Grain with husk (% w/w)
2–3
Damage / discoloured (% w/w)
14–16Max 12Max 14Moisture content (% w/w)
Local kiranaOrganized retailPFA specificationQuality parameters
1.5–2
Max 0.5
Max 1
Max 0.25
Max 0.25
3–5Max 5
Broken / split (% w/w)

Building a New India: The Role of Organized Retail in Driving Inclusive Growth 21
and awareness programmes for producers, employees and consumers alike, all help to increase the overall quality of all items.
b) Increased affordabilityOrganized retail passes on some of its scale benefits to its customers as a result of which it offers reduced prices. A dipstick survey to compare the prices of a sample monthly basket at an organized retailer to that in the unorganized retail sector (or kirana) shows a point–in–time saving of ~6.3 percent (on a basket of ~Rs. 2,100). This money can be used to pay one month’s electricity bill or for insurance premium for a systematic investment plan to secure a child’s future (as shown in Exhibit 10).
Organized retail is thus a more affordable alternative, especially for low–income groups. The Indian Council for Research on International Economic Relations4 (ICRIER) survey shows that typical savings range from 5–10 percent, and the number increases as the household income drops. Households earning less than Rs. 10,000 per month are indicated to be the biggest beneficiaries of organized retail, saving between 8–10 percent when buying from organized retailers.
c) Greater varietyWith companies increasing the number of offerings and the media educating customers, the demand for variety has increased manifold in the recent past. This demand is not restricted to the affluent classes but is more widespread. A BCG study of the Next Billion Consumers5 showed that as incomes rise, the lower income consumers spend less on basic items and more on cosmetics, entertainment, etc. as a fraction of their total income and are already consuming a broad range of products in FMCG, apparel and durables.
Due to limitations of space and economics of a traditional retail store, it is impossible to harbor the variety that will be required. With its self service model and larger store sizes, organized retail is well equipped to handle the variety at the front–end. At the back–end, with their sophisticated supply chain capabilities, modern retailers can manage this complexity efficiently.
Exhibit 10. Organized retail offers a more affordable alternative for low–income groups
Source: Customer interview; Store visit; BCG analysis.
4ICRIER Study on Impact of Organized Retailing on Unorganized Retail in India.5The Next Billions: Unleashing Business Potential in Untapped Markets
Wheat: Loose Lokwan – 15 kg
7%4643Hair Oil: Parachute – 80 g
2%4544Toothpaste: Colgate – 150 g
128110Detergent: Rin – 2 kg
2%5251Bath Soap: Cinthol – 4x100 g
5049Biscuits – Parle–G – 10x88 g
146141Tea: Red Label – 490 g
400380Dal: Moong – 4 kg
8%1211Salt: – 1 kg
8%260232Oil: Sunflower – 4 l
124120Sugar: – 4 kg
0%9696Potato: (medium) – 6 kg
300270Onion: (dry / medium) – 6 kg
11%495441
2,244
360
6.3%2,102Total
330 8%Rice: Loose Parimal – 15 kg
14%
2%
3%
5%
3%
10%
KiranaOrganizedretail SaveItem
Illustrative monthlyshopping list
Monthly shopping list cheaper by ~6% at organized retail compared to kiranas
Saving of canbe used by the
consumer to paythe
6.3%
monthlypremium of
child's educationplan
A consumer withmonthly family
income ofRs. 10,000
spends ~Rs. 2,100purchasing foodand grocery

22 The Boston Consulting Group
Food inflation has been a major news item in India over the last few months. With prices close to tripling, onions have found themselves at the forefront of this story. Given the direct linkage with affordability and hence inclusion, our team probed the phenomenon through a combination of primary interviews (farmers, intermediaries and retailers) as well as secondary research.
The usual path
Before we get into our understanding of the crisis, let us first lay out the ‘typical’ value chain. The chain starts with the farmer who usually sells his produce to aggregators at upstream mandis such as Alwar in Rajasthan or Lasalgaon / Pimpalgaon in Maharashtra. The aggregators are usually large players who collate truck loads of material and transport it to the Agricultural Produce Market Committee (APMC) markets like Azadpur for auctions conducted by the market traders. The wholesalers buy large quantities
and transport it to the city based sub–wholesalers, who sell it to the retailers (roadside carts, vegetable grocers, etc.) who sell to the consumers. At each step of the process, there could be a value addition (e.g. transport, packing, sorting), leakages (e.g. rotting, pilferage) and gross profit of the intermediary, that adds on to the consumer price. As the chart below shows, a farmer typically earns 40–50 percent of the consumer price, 15–20 percent is spent on value addition and 12–16 percent lost in leakages. At a consumer price of Rs. 30–35 / kg, the intermediaries make about Rs. 5–7 / kg or 18–22 percent.
Start of the trail
The crisis was triggered by the unseasonal rains in October in the onion producing areas of Maharashtra leading to a scarce farm supply. While this was the root cause of the price increase, it appears that the extent of rise may have been aggravated by the inefficiencies in the chain.
On the onion trail
Source: Primary and expert interviews in Delhi / Azadpur mandi, Narayangaon, Vashi APMC market; BCG analysis.Note: % at each stage is share of final consumer price.1There are 1–3 sub–wholesalers; assumed 2 here as an average.
8–12%
Wholesaler
7–9%
Markettrader
Farm
Leakages
Gross profit
4–6%
Aggregator
12–16%
Farmer Consumer
30–35
40–50%
12–16%
18–22%
Retailer
15–20%
Sub–wholesaler
1
Rs. / kg
Value–add15–20%
Typical onion value chain: October 2010 Delhi / Azadpur mandi
0
10
20
30
40
12–18
40–50%

Building a New India: The Role of Organized Retail in Driving Inclusive Growth 23
When our team visited the Azadpur mandi in mid January, we heard two scenarios playing out simultaneously. A part of the product being auctioned was the recently farmed ‘wet’ onion. The farmers had more than doubled the price to Rs. 40–50 / kg, partly to cover their loss from the low yield. For the intermediaries, the percentage margin was the same but absolute profits were higher. Overall, the intermediary profits had gone up by 3–4 times or about Rs. 20–25 / kg. While we don’t have precise numbers, our hypothesis is that any loss in volume would have been more than made up by the rise in profits.
More interestingly, a large portion of the material being auctioned were in fact ‘dry’ onions which the upstream aggregators had procured in November / December and stored in anticipation of prices rising. In this case, the farm price had risen marginally to
Rs. 20–30 / kg while the consumer price had touched Rs. 75–85 / kg. A significant part of the increase was being captured by the aggregators with the total intermediary profits in the range of 40–50 percent of the price or Rs. 30–40 / kg.
Unfortunately, data on the relative proportion of the two scenarios is difficult to get. However, our sense is that the second scenario (where middle–men would have earned substantial profits) seemed to be more prevalent around our visit to the market.
End of the trail
While the reduced supply is a root cause of this crisis, the multiple touch points and lack of transparency in the chain compounds the pain. Direct sourcing by retailers or large consolidated aggregators can certainly provide greater visibility to the Government in such situations and help contain it.
Source: Primary and expert interviews in Delhi/Azadpur mandi, Narayangaon, Vashi APMC market; BCG analysis.Note: % at each stage is share of final consumer price.1There are 1–3 sub–wholesalers; assumed 2 as an average.
Rs. / kg
Consumer
75–85
25–35%
6–8%
18–22%
40–50%
Retailer
12–16%
Sub–wholesaler
1
6–8%
Wholesaler
3–5%
Markettrader
4–6%
Aggregator
35–45%
Farmer
20–30
25–35%
Rs. / kg
Consumer
75–85
50–60%
4–8%
12–16%
20–30%
Retailer
12–16%
Sub–wholesaler
1
6–8%
Wholesaler
2–4%
Markettrader
4–6%
Aggregator
14–18%
Farmer
50–60%
Farm Value–add Leakages Gross profit
Scenario 1: Recently harvested ‘wet’ onions;January 2011 Delhi / Azadpur mandi
Scenario 2: Old stored ‘dry’ onions;January 2011 Delhi / Azadpur mandi
0
50
100
0
50
100
40–50

24 The Boston Consulting Group
The current size of the retail market in India is estimated to be ~US$ 425 billion and is projected to rise to US$ 1,250 billion by 2020, based on the macro–economic environment (see Appendix 1 for definition
and size of retail). The organized retail sector is currently estimated to be ~US$ 28 billion, amounting to a 6–7 percent penetration of the total retail market (as shown in Exhibit 11). This is much lower than projections that were made 3–5 years ago by several observers when the sentiments were very different.
Our outlook towards the future is based on two scenarios of industry growth.
The ‘True Potential’ Scenario
In the scenario where organized retail meets its ‘true potential’, the size of the sector would reach ~US$ 260 billion by 2020, implying a ~21 percent share of total retail (see Appendix 2). There are a number of structural factors that could bolster this growth — rising incomes, increasing consumerism, changing consumer preferences
Impact: Scenarios of Growth and Size of Prize
Exhibit 11. Size of organized retail in 2010 is ~US$ 28 billion with a 6–7% share and has two possible scenarios for growth
Source: Images / IRIS; BCG analysis.Note: Exchange rate used: US$ 1 = Rs. 451Includes accessories 2Includes appliances and electronics 3Includes sporting goods, hobby, book and music4Includes home furnishing stores 5Includes jewellery and watches 6Health and personal care
Footwear
Accessories5
2.6 (9%)
3.5 (12%)Food and beverages
Furniture4
2.2 (8%)
US$ Bn
Organized retail
0.7 (2%)
1.8 (6%)Leisure3
HPC6 0.2 (1%)
1.7 (6%)
Food services
Pharmacy
1.5 (5%)
Durables2 3.8 (14%)
Clothing1 10.1 (36%)
US$ Bn
2010 2020‘As–is’
scenario
2020‘True
potential’
Detailed size of retail market Scenarios of future growth
260
170
28
0
100
200
300
28.1
0 10 20 30

Building a New India: The Role of Organized Retail in Driving Inclusive Growth 25
towards better quality, wider assortment and higher value–for–money, apart from the positive action steps (described later) by the relevant stakeholders.
This scenario will be characterized by a few features. There would be high saturation in the major urban centers and rapid expansion to smaller cities and towns. Large sub–sections such as food and grocery which have been lagging behind would see a significant penetration. Profitability of players would be stable and global majors would play a greater role through investments and transfer of know–how. The penetration of organized retail in such a scenario will have grown at an aggressive pace and in line with top quartile growth as witnessed in other countries. The growth of organized retail will have a significant impact on the Indian economy at large.
The ‘As–Is’ Scenario
Historically, the pace of growth of Indian organized retail has been below most global benchmarks. This has been true for food and grocery which, at ~67 percent, is today the largest portion of total retail in the country. Food and grocery in India has moved from a penetration of 1 percent
to 2 percent in the last five years whereas most emerging markets like Turkey, Thailand, Malaysia, etc. would have moved by ~5 percent (as shown in Exhibit 12).
If the organized retail sector in India continues to grow at historical rates and continues to be dampened by hurdles including limited availability of real estate, talent, infrastructure and strategic investment, organized retail would manage only around US$ 170 billion by 2020, which is about 14 percent of the total retail market. As a result, the impact on the economy would be only two–thirds of that in the ‘true potential’ scenario.
This ‘as–is’ scenario would be characterized by features such as a large number of sub–scale players with continued profitability challenges, concentration of footprint in large cities, challenges in speed and quality of real estate development, persistent bureaucratic hurdles and lack of significant presence of global majors.
Size of Prize
If organized retail were to reach its ‘true potential’, it would have a significant impact on the inclusive agenda.
Exhibit 12. Historical growth has been below expectations and benchmarks
Source: Planet retail; BCG analysis.Note: Grocery retail includes share of discount; supermarket; hypermarket; cash and carry and convenience.
Chile
Italy
France
Germany
India
Morocco
Turkey
Malaysia
Thailand
Russia
China
South Africa
na
na
na
4 years
8 years
8 years
6 years
6 years
6 years
7 years
7 years
na
India's penetration slower:4 years to get from 1% to 2%
Timespan to reach from 1–5%
Example: Food and grocery penetration across markets
Penetration of organized grocery retail (%)
‘09‘05‘00‘95‘90‘85‘80‘75
0
30
60
90

26 The Boston Consulting Group
Exhibit 13. Organized retail would have a significant impact on all stakeholders
Additionally, increase in contribution to the exchequer by ~US$ 25–30 billion and investments of ~US$ 60 billion
1This includes additional jobs created in the logistics sector, contract labour in the distribution and repackaging centers, housekeeping and security staff in the stores; does not include additional producer jobs.
The benefits would be felt by each stakeholder as well as the Government. Exhibit 13 summarizes the total impact.
However, one needs to be cognizant of a few things. Firstly, whether this scenario becomes a reality or not, depends on a set of imperatives. The next chapter covers
these in detail. Secondly, the impact on small retailers will need to be understood (see adjacent box) and their concerns addressed. Finally, whether the benefits are fully realized by these beneficiaries or not, will be driven by how seriously retailers take their role as catalysts for inclusion. They need to embrace this role and go beyond business-as-usual to proactively drive inclusion.
Increased employmentopportunities
~3–4 Mn direct jobs,75% non–graduates
Additional income of~US$ 14–16 Bn / year
~4–6 Mn indirect jobs1
Higher remuneration andbenefits
15–30% higher pay thanunorganized sector
Opportunity for growth
Superior working environment
Superior qualityBetter health, safetyand nutrition
Increased affordability5–10% savings acrosscategories
Total savings of~US$ 25–30 Bn / year
Greater choiceProducts to match everyneed and choice
Improved and stable income10–30% better realizations
Increased income of~US$ 35–45 Bn / year
Enhanced opportunities togrow business
Capability building
Access to credit
Increased demand
Increased reach
Producers Employees Consumers2 31

Building a New India: The Role of Organized Retail in Driving Inclusive Growth 27
The rise of organized retail has raised many concerns regarding the future of small retailers. While it is not feasible to predict the fate of individual independent retailers, there are a few things to keep in mind about the entire set.
Firstly, it is important to recognize that traditional trade is not declining. Even in the last 3 years when modern retail has grown 24%, unorganized retail has continued to grow, albeit at a slower rate of 10%. Going forward, while modern retail is expected to gain share due to a strong consumer proposition, traditional trade will continue to have its own place.
Similar concerns were raised at the time when dereservation of Small Scale Industries (SSIs) was introduced in India in the 90s. At that time, there was a lot of speculation around the eventual decline of SSIs. Since then several studies have shown that the sector continues to demonstrate a healthy growth in the number of units, output and employment.
As an example, the growth in the early period of liberalization (1993–1994 to 1998–1999) which was 16%, fell slightly for the next 5 years (1998–1999 to 2004–2005) to 12%, before accelerating to 19% in the last 5 years (2004–2005 to 2008–2009). Similarly, the employment generated by registered SSIs grew at ~6% in the pre–liberalization era 1979–1980 and 1989–1990, at ~4% in the first decade of the post liberalization era (1993–1994 to 2003–2004), and accelerated to ~19% in the last 5 years (2003–2004 to 2008–2009). This is testimony to both, the entrepreneurial spirit of Indians
and the underlying economic growth that deregulation can drive.
ICRIER conducted an empirical study on the ‘Impact of Organized Retailing on the Unorganized Sector’ to explore this topic in 2008. The study found that unorganized retailers in the vicinity of organized retailers did experience a decline in their business and profit in the initial years, but this impact weakened over time. The study found no evidence of a decline in overall employment in the unorganized sector as a result of the entry of organized retailers. Interestingly, the study also found such small retailers increasing their effort to enhance their customer proposition through steps such as adding new product lines and brands, better display, renovation of the store, introduction of self service, enhanced home delivery, more credit sales, acceptance of credit cards, etc.
It is important to note that there are some fundamental aspects of unorganized retail which have a significant appeal even in the new environment. For instance, a recent consumer survey conducted by BCG showed that convenience was valued highly by consumers for a set of purchases — something that small retailers provide through their proximity and home delivery mechanisms. In other mature markets as well, smaller, locally–owned businesses have developed business models allowing them to do things that organized retail chains find difficult and financially unviable to do. Such innovation, based on deep consumer knowledge and personal connect with consumers, will play a key role in the evolution of unorganized retail in India.
Impact on small retailers

28 The Boston Consulting Group
The India retail story has been part reality and part mirage so far. It is critical that concerted action is taken to make it fully real such that the economy derives all the inclusive benefits that come along with it. For that to happen, both the Government and the retailers need to work together to make sure that a set of imperatives are acted upon:a) Identifying, training and retaining talentb) Developing and leveraging the right know–howc) Driving scale and investment for the back–end, using
collaborative platforms
d) Decreasing bureaucracy and legal hurdles at every step of the chain
These imperatives require active participation from the Government as well as retailers.
a) Identifying, training and retaining talent
The retail industry in India faces multiple challenges in terms of scale, employability and shortage of relevant
Call to Action: Imperatives for the Sector
Exhibit 14. Multiple challenges across all levels
Source: Industry interviews.
Profile Skill requirement Hiring pool Issues
Store staffbasic skills
Store staffadvanced skills(supervisor, etc)
Store managers
Visualmerchandiser
Entry levelexecutives
(operations, etc)Retail not preferred careeroption yet
Understanding of consumers / product,good negotiation skills, people managing skills
Shortage of experience peopleDiploma /vocational
Good aesthetic sense, appreciation ofconsumer behaviour
People management skills, understandingof day to day operation, basic accounting skills
Basic computer skills and / or reasonablecommand over English / vernacular language
Basic customer assistance, basic knowledgeof vernacular language, house keeping, etc.
Graduates /MBAs
XII /Graduates
VII – XII,Diploma /Graduates
Lack of skilled people
Lack of communication skills,service attitude and productknowledge
High requirement and highattrition
Scale
Employability
Shortage of relevant skills
Graduates /MBAs

Building a New India: The Role of Organized Retail in Driving Inclusive Growth 29
skills (as shown in Exhibit 14).
Managing this challenge requires the Government to:
Create recognized courses and industry–wide ◊ accreditations for basic training for entry level employees with pre–defined quality standards.
Provide an impetus to Government–run educational ◊ establishments to introduce retail programs.
Provide incentives and support to retailers to create ◊ training bodies for development of employees.
Similarly, retailers need to:
Expand their recruiting pool to non–traditional but ◊ qualified individuals such as college students, retirees, housewives etc.
Make collective investments towards developing ◊ training facilities in collaboration with the Government.
Invest in cutting edge training methodologies such as ◊ ‘learning stores’ and leverage technology (online, mobile).
b) Develop and leverage the right know–how
Given the absence of history in India and the limited depth of senior professionals, the organized retail industry has been learning through trial and error. As such, modern retail in India is at the beginning of a learning curve in terms of systems, processes and organizational capabilities. In order to drive profitable growth, retailers need fundamental re–thinking around many dimensions — from format reinvention, incorporating consumer needs to supply chain optimization that drive savings.
Global retailers can play a significant role in shortening this learning curve. To enable this, the most critical action required from the Government is the deregulation of FDI in the sector in order to leverage the experience of global majors.
The Indian retailers, in the meantime, need to not only partner with successful retailers to learn best practices
but also rely on content experts with an international exposure.
c) Drive scale and investment for the back–end, using collaborative platforms
Most Indian retailers are currently at sub–ideal levels as per global norms. This prevents them from incurring any cost benefits. Additionally, poor public and private infrastructure around multi–modal transport hubs, warehouses, distribution centers, mis–managed supply chains with cold–storage and other facilities drive inefficiencies. This leads to unpredictability of supply and often results in stock–outs or surpluses.
To combat this challenge, retailers should:
Invest ahead of the curve to develop supply chains◊
Collaborate and create shared infrastructure — co ◊ invest in building warehouses / packaging centres and also lease transportation.
In addition, the Government needs to:
Enhance both the quantum and quality of ◊ infrastructure investments in roads, ports, railway, etc.
Create a concerted policy effort and provide fiscal ◊ incentives to drive investments in developing cold chains and modern logistics facilities
Encourage resource sharing — e.g. provide space for ◊ retailers to create shared facilities
d) Decrease bureaucracy and legal hurdles at every step of the chain
There are significant bureaucratic and legal hurdles that a retailer faces at every step. For instance, it takes 23 separate approvals to open a hypermarket in India. Some of the other bottlenecks are summarized below (as shown in Exhibit 15).
As in other countries, changes in legal norms such as those on zoning, store sizes, opening hours, import taxes can shape the emergence of retail and select formats. For example, in Malaysia, the absence of regulation in zoning / size favored hypermarket and in France, regulation of

30 The Boston Consulting Group
large formats, significantly boosted the development of small formats. The Government needs to carefully plan the way it wants to shape the retail industry and adopt norms accordingly.
Apart from deregulation of FDI, the Government should:
Simplify and streamline the licensing and approval ◊ processes, create a single window clearance up to the extent feasible.
Ensure uniform implementation of updated laws like ◊ APMC Act, etc.
Update existing laws like Shops and Establishment Act ◊ to make it audit based or self reporting.
Introduce new laws e.g. zoning laws to encourage ◊ organized retail development.
Retailers should at the same time work proactively with the Government in raising and resolving potential issues in a constructive manner.
Exhibit 15. Several bureaucratic and legal hurdles that exist today
Agricultural Produceand MarketingCommittee Act notuniformlyimplemented – makesdirect sourcing difficult
Essential commoditieslimits on stockquantities and interstate movements
Multiple licensesrequired to open astore — e.g. fordifferent categoriesand locations fromdifferent Governmentbodies
Compliance andmonitoring for Shopsand EstablishmentAct makes itcumbersome to run astore
Sourcing Supply chain Store opening Ongoing business

Building a New India: The Role of Organized Retail in Driving Inclusive Growth 31
There are wide variations in the current estimates of the size and penetration of organized retail in India. Depending on which of the 15–20 publicly available reports are used as the source, the 2010 size of organized retail is estimated to be anywhere from US$ 17 billion to US$ 77 billion, with the share of total retail being 4.7 percent to 22 percent.
One key reason for this variation is the inconsistent or ambiguous definition of organized retail. To ensure a more standardized approach we have defined organized retail as detailed below.
We started with the US Government definition of retail and adapted it to arrive at a definition for India (see box on the following page). We
Included most of the goods categories on the basis of ◊ similarities in categories, maturity and profile.
Excluded certain categories on the basis of typical ◊ ticket sizes, relative category size, model and dynamics of selling, market maturity, Government control and reporting / availability of data.
Additionally, included categories that are typically a ◊ part of the organized retail industry and follow similar dynamics.
Based on this definition of organized retail, the current size of the organized retail in India is about US$ 28 billion with a 6–7 percent penetration (as shown in Exhibit 16).
Appendix 1 – 2010 Size of Organized Retail in India
Note: Unless otherwise mentioned, the exchange rate used throughout this report is US$ 1 = Rs. 45.
Exhibit 16. 2010 size of organized retail is ~$28bn with 6-7% share
Source: Images / IRIS.1Includes accessories2Includes appliances and electronics3Includes sporting goods, hobby, book and music4Includes home furnishing stores 5Includes jewellery and watches6Health and personal care
Footwear
Accessories5
2.6 (9%)
3.5 (12%)Food and beverages
Furniture4
2.2 (8%)
US$ Bn
Organized retail
0.7 (2%)
1.8 (6%)Leisure3
HPC6 0.2 (1%)
1.7 (6%)
Food services
Pharmacy
1.5 (5%)
Durables2 3.8 (14%)
Clothing1 10.1 (36%)
Detailed size of retail market
28.1
0 10 20 30

32 The Boston Consulting Group
Methodology for defining retail for this report
Categories from the USGovernment definition
included in theIndian definition
Categories from the USGovernment definition
excluded from theIndian definition
Categories not in the USGovernment definition
in theIndian definitionincluded
Typically part of malls withsimilar dynamics
Leisure and entertainment(includes multiplexes, game parlours, etc.)
Food services and drinking places(includes all restaurants, bars, fast–food)
Nascent, small and lack ofreported data
Non store retailers(includes e–commerce, mail–order,teleshopping)
Government controlled, mature marketGasoline stations
Largely non–existent inorganized retail as of today
Building material and gardenequipment and supplies dealers
Extremely large ticket sizes,different model, mature market
Motor vehicle and parts dealers(includes sales, service, resale)
Miscellaneous store retailers(includes office supplies, stationery,gift, novelty)
General merchandise stores(includes department stores)
Sporting goods, hobby, book, and musicstores(includes hobby, toy, game stores)
Clothing and clothing accessories stores(includes apparel, fabric / cloth, footwear,jewellery watches)
Health and personal care stores(includes pharmacies, gyms, salons)
Food and beverage stores(includes supermarkets, hypermarkets,grocery, alcohol)
Electronics and appliance stores = CDIT(includes computers, software soldwith new PC)
Similarities in categorymaturity and profile
Reasons / commentsCategories
Furniture and home furnishings stores

Building a New India: The Role of Organized Retail in Driving Inclusive Growth 33
‘True Potential’ Scenario
The ‘true potential’ scenario uses macroeconomic factors such as the growth in GDP and the share of goods in the Private Final Consumption Expenditure (PFCE) adjusted for retail as defined in Appendix 1, to estimate the total retail size.
Based on the historical shifts in penetration in India and those in other economies of the world like China, Malaysia, Thailand, etc. in the recent past, the share of organized retail as a percentage of total retail is estimated
in the table below.
Thus, in 2020, the ‘true potential’ scenario pegs the size of organized retail at ~US$ 260 billion with a penetration of ~21 percent (as shown in Exhibit 17).
‘As–Is’ Scenario
The ‘as–is’ scenario uses the historical growth of organized retail and the change in the rate of growth to estimate future growth.
Appendix 2 – Scenarios for Growth of Organized Retail
Exhibit 17. Forecast for ‘true potential’ scenario
Source: NSSO; MOSPI; RBI; EIU and BCG analysis.Note: All numbers above use nominal prices; Exchange rates used from 2004–09 are average exchange rates as reported by EIU; For all other years, exchange rates used are US$ 1 = Rs. 45.
21%19%17%15%13%12%11%9%8%7%7%6%5%5%4%3%3%% share
2622101681341068569554435282219151186Organizedretail(US$ Bn)
1,2481,1231,007899799725653590528471425368362316276244220Total retail(US$ Bn)
2,7982,5002,2261,9741,7421,5701,4051,2601,121992891744727676554487427PFCE(US$ Bn)
5,7595,0634,4523,9143,4413,0252,6602,3392,0561,8081,5901,2981,2601,187958837718GDP(US$ Bn)
'20F'19F'18F'17F'16F'15F'14F'13F'12F'11F'10E'09'08'07'06'05'04
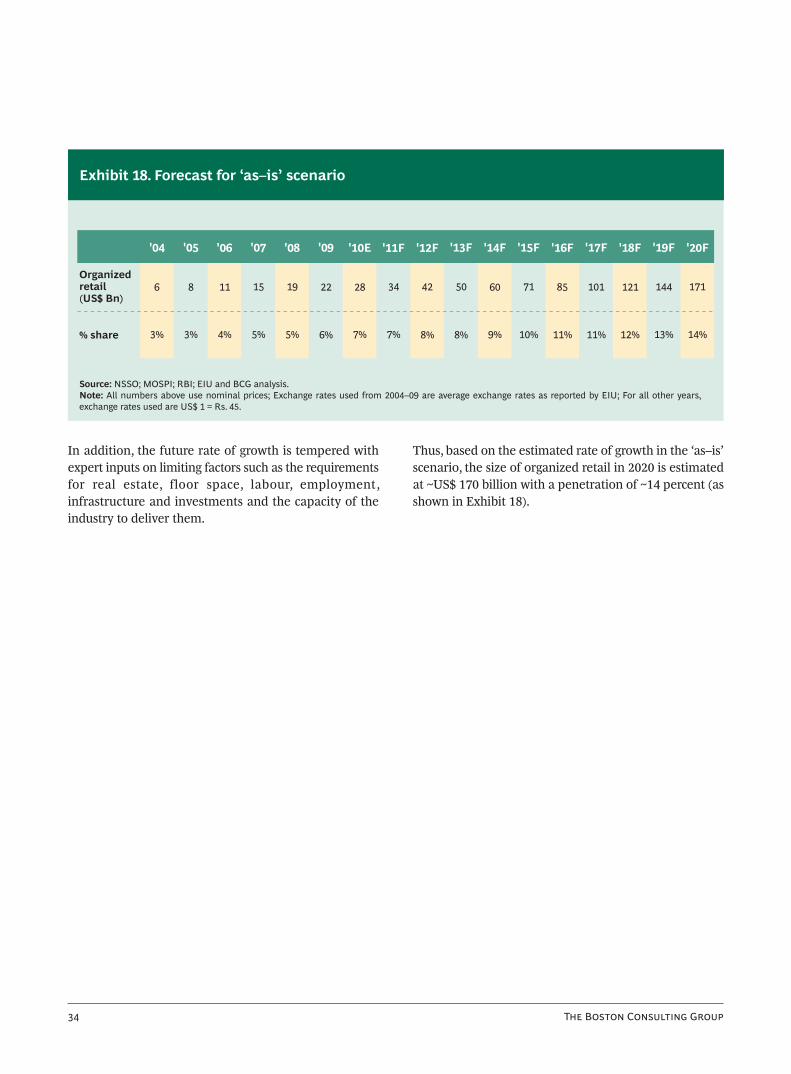
34 The Boston Consulting Group
In addition, the future rate of growth is tempered with expert inputs on limiting factors such as the requirements for real estate, floor space, labour, employment, infrastructure and investments and the capacity of the industry to deliver them.
Thus, based on the estimated rate of growth in the ‘as–is’ scenario, the size of organized retail in 2020 is estimated at ~US$ 170 billion with a penetration of ~14 percent (as shown in Exhibit 18).
Exhibit 18. Forecast for ‘as–is’ scenario
Source: NSSO; MOSPI; RBI; EIU and BCG analysis.Note: All numbers above use nominal prices; Exchange rates used from 2004–09 are average exchange rates as reported by EIU; For all other years, exchange rates used are US$ 1 = Rs. 45.
14%13%12%11%11%10%9%8%8%7%7%6%5%5%4%3%3%
171144121101857160504234282219151186
% share
Organizedretail(US$ Bn)
'20F'19F'18F'17F'16F'15F'14F'13F'12F'11F'10E'09'08'07'06'05'04

Building a New India: The Role of Organized Retail in Driving Inclusive Growth 35
About the authorsAbheek Singhi is a Partner and Director at BCG, based at the firm’s Mumbai office. Amitabh Mall is a Principal at the firm’s Mumbai office.
For further contactIf you would like to discuss the themes and content of this report, please contact:
Abheek SinghiBCG Mumbai+91 22 6749 [email protected]
Amitabh MallBCG Mumbai+91 22 6749 [email protected]
AcknowledgementsThis study was undertaken by The Boston Consulting Group (BCG) with support from the Confederation of Indian Industry (CII).
Special thanks to Thomas Varghese, Chairman, CII National Committee on Retail 2010–2011 & CEO, Aditya Birla Retail Ltd. for his passion and guidance.
We would also like to thank the CII Secretariat members: Daniel Romans, Divyasri Nair, Greeta Varughese and Radhika Dhall.
We would also like to thank the executives and institutions that participated in the research effort and helped enrich this report:Aloke Banerjee, CEO, Rosebys; Animesh Saran, VP - HR, Aditya Birla Retail Ltd.; Anuj Puri, Chairman & Country Head, Jones Lang LaSalle; Arjun Uppal, Head, New Businesses, DCM Shriram Consolidated Ltd.; Asim Dalal, MD, The Bombay Store; B. S. Nagesh, Vice-Chairman, Shoppers Stop; Birinder Soin, GM Strategy, Walmart India; Jamshed Daboo, CEO, Trent Hypermarket Ltd.; Kabir Lumba, MD, Lifestyle International Pvt. Ltd.; Neville Norhonha,CEO, Avenue Supermarts Pvt. Ltd.; Prableen Sabhaney, Head of Communications, FabIndia Overseas Pvt. Ltd.; Radhakrishnan, Director, Finance & Accounts, Connaught Plaza Restaurants Pvt. Ltd. (McDonalds India - North & East); Raj Jain, President, Walmart India; Rajesh Gupta, President, DSCL Hariyali Kisan Bazaar; Rajeev Bakshi, MD, Metro Cash & Carry India; Rakesh Biyani, Director & CEO, Retail, Future Group; Sasi Kumar, EA to CEO, Aditya Birla Retail Ltd.; Shubranshu Pani, MD, Retail Services, Jones Lang LaSalle; Siva Nagarajan, MD, Mother Dairy Fruit & Vegetable Private Limited; Sunil Bansal, CEO, F&V Business, Mother Dairy Fruit & Vegetable Private Limited; Vikram Bakshi, MD, McDonalds India; William Bissell, MD, FabIndia Overseas Pvt. Ltd.
We would like to thank Vivek Kumar, MD, Images Retail Intelligence Services (IRIS) and Sanjay Bakshi, Senior Project Manager, IRIS for the 2010 estimates of organized retail.
We gratefully acknowledge the contribution of Amita Parekh, Arup Halder, Hrishikesh Thite, Kanishka Raja, Neetu Vasanta and Sachin Kotak from BCG India. Anand Raghuraman has played a pivotal role in the conceptualization and writing of this report.
The following experts from the global BCG team helped us with international perspectives on the topic: Aftab Hussain, Jeffery Walters, Jonathan Fahey, Julien Garcier, Justin Fung, Peter Butler, Sandeep Chugani and Waldermar Jap. Our grattitude to Rune Jacobsen, BCG’s global sector leader for Retail, for his guidance and support.
Special mention to Anne-Marie Moreau, Bill Urda, Heidi Huang, Mamta Ghalian, Meg Neill for their assistance in the analysis.
We would also like to thank Jamshed Daruwalla and Rahul Surve for their contributions to the editing, design and production of this report.
We also appreciate the marketing efforts of Payal Sheth for giving this report the wide coverage it deserves.
Note to the Reader

36 The Boston Consulting Group
For Further ReadingFor Further Reading
The Boston Consulting Group has published other reports which may be of interest to the reader. Some examples include:
Financial Inclusion: From Obligation to OpportunityA report by the Boston Consulting Group, Scheduled to be published in February 2011
2011 BCG Global Challengers: Companies on the MoveA report by the Boston Consulting Group, January 2011
The Consumer’s Voice – Can Your Company Hear It?A report by the Boston Consulting Group, November 2009
Women Want MoreOpportunities for Action in Consumer Markets, September 2009
Fast-Moving Consumer Goods: Accelerating Out of the DownturnA White Paper by the Boston Consulting Group, April 2009
The Next Billions: Unleashing Business Potential in Untapped MarketsA report by the World Economic Forum, prepared in collaboration with The Boston Consulting Group, January 2009
India’s Demographic Dilemma: Talent Challenges for the Services SectorA report by the Boston Consulting Group, published with the Confederation of Indian Industry (CII), December 2008
Coping with the Commodities CrisisOpportunities for Action in Consumer Markets, November 2007 Focus by The Boston Consulting Group, September 2008
Decoding the Next Billion ConsumersOpportunities for action in Consumer Markets, November 2008

For a complete list of BCG publications and information about how to obtain copies, please visit our Web site at www.bcg.com/publications.
To receive future publications in electronic form about this topic or others, please visit our subscription Web site at www.bcg.com/subscribe.
02/11

Since 1895