aa 2000.pdf
TRANSCRIPT

AMR CORPORATION AN N U A L RE P O RT 2000
The Right Thing To Do AM E R I C A N AI R L I N E S
More Room Throughout Coach

Letter to Shareholders, Customers
and Employees 1
Operating Aircraft Fleets 5
Management’s Discussion and Analysis 6
Consolidated Financial Statements 14
Notes to Consolidated Financial Statements 19
Eleven Year Comparative Summary 36
This year’s AMR annual report looks a bit different, and for
good reason. For the first time, we are delivering our annual report
message through three different media – print, CD-ROM and the Web.
The theme of this year’s annual report, “The Right Thing To Do,”
applies very well to our More Room Throughout Coach initiative
pictured on the front and back covers. We felt it also applied to the
many things we did in 2000 and are continuing to do for our share-
holders, customers and employees. And we considered it equally
applicable to our use of different media to distribute this report. You
can read more about our efforts during 2000 in the Chairman’s Letter
on the opposite page. You can get a multi-media view of them on the
CD-ROM that accompanies the annual report. And on our Web site,
http://www.amrcorp.com/ar2000/index.html, you’ll find the informa-
tion that we traditionally have included in the shareholder, customer
and employee essays of our printed annual report.
TA B L E O F CO N T E N T S AB O U T O U R AN N U A L RE P O RT
OPERATING REVENUES
($ in millions)
2000 1999 1998
$17,516$17,730
$19,703
OPERATING INCOME
($ in millions)
$1,988
$1,156
$1,381
2000 1999 1998
EARNINGS PER SHARE
$6.38
$4.17
$4.81
2000 1999 1998
RATIO OF DEBT TO CAPITAL
64.7%65.3%62.4%
2000 1999 1998
LE T T E R T O SH A R E H O L D E R S , CU S T O M E R S A N D EM P L O Y E E S
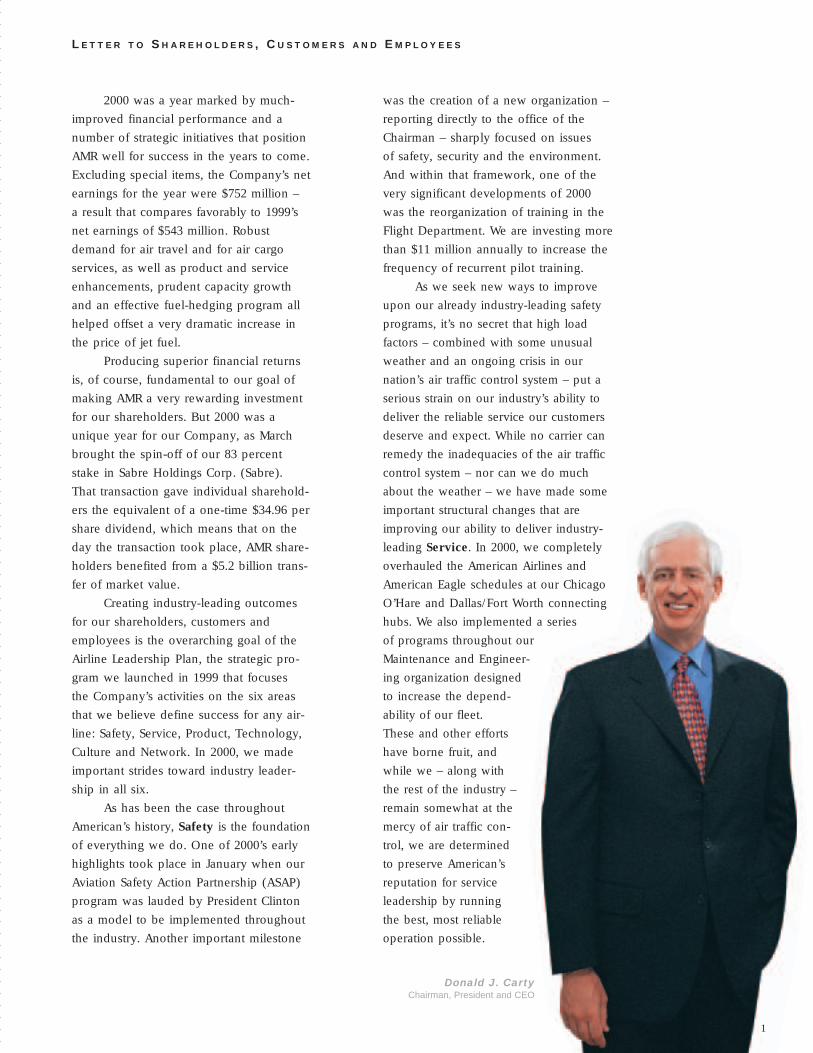
2000 was a year marked by much-
improved financial performance and a
number of strategic initiatives that position
AMR well for success in the years to come.
Excluding special items, the Company’s net
earnings for the year were $752 million –
a result that compares favorably to 1999’s
net earnings of $543 million. Robust
demand for air travel and for air cargo
services, as well as product and service
enhancements, prudent capacity growth
and an effective fuel-hedging program all
helped offset a very dramatic increase in
the price of jet fuel.
Producing superior financial returns
is, of course, fundamental to our goal of
making AMR a very rewarding investment
for our shareholders. But 2000 was a
unique year for our Company, as March
brought the spin-off of our 83 percent
stake in Sabre Holdings Corp. (Sabre).
That transaction gave individual sharehold-
ers the equivalent of a one-time $34.96 per
share dividend, which means that on the
day the transaction took place, AMR share-
holders benefited from a $5.2 billion trans-
fer of market value.
Creating industry-leading outcomes
for our shareholders, customers and
employees is the overarching goal of the
Airline Leadership Plan, the strategic pro-
gram we launched in 1999 that focuses
the Company’s activities on the six areas
that we believe define success for any air-
line: Safety, Service, Product, Technology,
Culture and Network. In 2000, we made
important strides toward industry leader-
ship in all six.
As has been the case throughout
American’s history, Safety is the foundation
of everything we do. One of 2000’s early
highlights took place in January when our
Aviation Safety Action Partnership (ASAP)
program was lauded by President Clinton
as a model to be implemented throughout
the industry. Another important milestone
was the creation of a new organization –
reporting directly to the office of the
Chairman – sharply focused on issues
of safety, security and the environment.
And within that framework, one of the
very significant developments of 2000
was the reorganization of training in the
Flight Department. We are investing more
than $11 million annually to increase the
frequency of recurrent pilot training.
As we seek new ways to improve
upon our already industry-leading safety
programs, it’s no secret that high load
factors – combined with some unusual
weather and an ongoing crisis in our
nation’s air traffic control system – put a
serious strain on our industry’s ability to
deliver the reliable service our customers
deserve and expect. While no carrier can
remedy the inadequacies of the air traffic
control system – nor can we do much
about the weather – we have made some
important structural changes that are
improving our ability to deliver industry-
leading Service. In 2000, we completely
overhauled the American Airlines and
American Eagle schedules at our Chicago
O’Hare and Dallas/Fort Worth connecting
hubs. We also implemented a series
of programs throughout our
Maintenance and Engineer-
ing organization designed
to increase the depend-
ability of our fleet.
These and other efforts
have borne fruit, and
while we – along with
the rest of the industry –
remain somewhat at the
mercy of air traffic con-
trol, we are determined
to preserve American’s
reputation for service
leadership by running
the best, most reliable
operation possible.
Donald J. CartyChairman, President and CEO
1

In the third area of airline leadership,
Product, we made tremendous progress
in 2000. We put 43 new jet aircraft into
service at American and introduced 29
new regional jets at American Eagle. More
dramatically, we seized industry leadership
in onboard comfort with the launch and
implementation of our More Room
Throughout Coach program, which is
enhancing the comfort, satisfaction, loyalty
and disposition of virtually every American
Airlines coach customer. We have also
increased legroom in Business Class and
introduced two major enhancements to our
premium cabin – the 767 fully flat seat,
and the new Flagship Suite Concept on
our 777 aircraft serving Europe and Latin
America. In addition to our aircraft-related
product enhancements, we also improved
our onboard entertainment options, contin-
ued to refresh and improve our physical
infrastructure at airports all over the world,
and began a partnership with America
Online to create AOL/AAdvantage miles,
which gives AAdvantage members a
wealth of new opportunities to earn and
redeem miles, online and off.
The AOL/AAdvantage program is a
good example of how new technology is
changing virtually every part of our busi-
ness – and why technology leadership is
a critically important element of our over-
all strategy. In 2000, we made important
strides to better leverage the changes tak-
ing place in technology to produce posi-
tive results for our shareholders, customers
and employees. At airports and reserva-
tions centers through-
out the American
Airlines system,
we are in
the throes
of major re-
engineering
projects
designed
to give our people better, easier-to-use
tools that will enable them to provide even
better customer service.
From a marketing perspective, the
Internet revolution is creating enormous
opportunities for American. In 2000, our
Web site, AA.com, was hailed by CIO mag-
azine as one of the top 50 business Inter-
net sites. No other airline site made the
list. Kudos are nice, but what’s even nicer
is the ability AA.com has given us to lever-
age the strength of AAdvantage and offer
our best customers a wide range of indi-
vidualized promotions. While the business
of travel distribution continues to evolve
very quickly – with new online channels
emerging on what seems like a daily basis
– American is also exploring ways to
exploit the connective power of the Inter-
net to reduce procurement costs. In fact,
we are collaborating with several other
carriers to create a new business-to-busi-
ness site that we think will streamline, and
wring significant expense and investment
from, our supply chain.
Technology leadership has been a
hallmark of American’s strategy for
decades. Sustaining that leadership in an
environment as fast changing as today’s is
tougher than ever. That’s a big reason why
we launched the on-time on-line home
computer program in 2000. This program,
which provides our people with dis-
counted home computers and Internet
access, is an acknowledgement that we
are taking the technology challenge very
seriously and that we will need the partic-
ipation of the entire American team if we
are going to meet it.
Technology is obviously an area of
our business that has changed dramatically
in recent years. But one part of our man-
agement challenge that hasn’t changed is
the imperative to consider the interests of
our employees in every decision we make.
Culture leadership is a strategic imperative
Creating industry-
leading outcomes for
our shareholders,
customers and employ-
ees is the overarching
goal of the Airline
Leadership Plan.

every bit as important as the other five
areas of the Airline Leadership Plan,
and in 2000 American launched a num-
ber of “people initiatives” with that in
mind. These include the aforementioned
on-time on-line program, enhancements
to our 401(k) program, improved flight
privileges, the introduction of domestic
partner benefits and a new long-term care
benefit. We also reinvigorated our corpo-
rate training programs with the opening
of FlagShip University, created a People
Selection Center focused on more quickly
identifying qualified new-hire candidates,
and reaffirmed our commitment to giving
our people a greater voice through
360 degree performance reviews and
a company-wide employee survey.
These positive initiatives notwith-
standing, as we enter 2001, we face a
number of unresolved issues associated
with the unions representing many of
our people, and those issues inject an ele-
ment of uncertainty into our 2001 forecast.
Nonetheless, we are confident that we will
be able to reach agreements that meet the
needs of the Company and all our employ-
ees, while avoiding any disruption of the
American operation.
As we scan the horizon for other
matters affecting our business in 2001 and
beyond, it is clear that Network – the sixth
area of our Airline Leadership Plan – will
continue to be key to American’s success.
In 2000, we pursued our goal of network
leadership in a number of ways. First, we
grew our domestic network in a very strate-
gic manner, expanding our operations in
cities like Boston, New York, Los Angeles
and San Jose – cities that are very impor-
tant to our prime business customers. In
2001, we will build on our success by
continuing to expand our San Jose sched-
ule with new service to both Paris and
Taipei. The Taipei service is particularly
notable in that it will enable us to begin
the expan-
sion of our
Pacific net-
work by
linking
Silicon Valley
with the very
important technol-
ogy industries of Taiwan.
Closer to home, we’re
also pursuing Network Leadership through
American Eagle’s aggressive deployment
of regional jets. In addition to strengthen-
ing and feeding our hubs – and putting
hundreds of thousands of customers on
American flights – these new aircraft have
been effective weapons as we explore
new point-to-point opportunities in mar-
kets previously considered other airlines’
strongholds. At the end of 2000, the Eagle
RJ fleet was 83 strong, and as we continue
to grow and strengthen the Eagle fleet and
network, the overall American network
will get stronger as well.
In the global arena, while the past
two years have been a somewhat uncer-
tain time when it comes to airline
alliances, we continue to believe that with
our oneworld partners – combined with
our bilateral relationships with carriers
such as Swissair, Sabena, JAL and EVA
of Taiwan – we have built the industry’s
premier set of alliances. Indeed, despite
a few speed bumps along the way, the
effectiveness of our alliance strategy is
clear. The traffic connecting to American
from our partners has grown dramatically
over the past two years.
While our 2000 network progress
was impressive, three transactions
announced in January 2001 represent a
giant leap forward for our network build-
ing efforts. First, we agreed to purchase
substantially all the assets of TWA for
approximately $625 million in cash and
the assumption of over $3 billion of
We seized industry
leadership in onboard
comfort with the
launch and implemen-
tation of our More
Room Throughout
Coach program.
3

TWA’s
obliga-
tions.
Second,
American
will acquire
certain key
strategic assets
from US Airways,
including 14 gates, 36 slots
and 86 aircraft. We will also lease the
gates and slots necessary for us to share
the operation of the Northeast Shuttle with
United Airlines. Under the terms of this
transaction, we have agreed to pay $1.2
billion in cash to United Airlines and to
assume approximately $300 million in air-
craft operating leases. And third, American
will acquire a 49 percent stake in DC Air, a
new-entrant carrier operating out of Wash-
ington Reagan Airport. DC Air – to whom
we will wet lease up to 14 Fokker 100 air-
craft – will participate in the AAdvantage
program, and American will have a right of
first refusal on the acquisition of the
remaining 51 percent of the new airline.
The consummation of the DC Air transac-
tion, as well as our acquisition of assets
from US Airways, is contingent on the
closing of United’s proposed merger with
US Airways.
These three transactions mark the
beginning of an exciting new chapter in
American Airlines history and represent
a very positive outcome for all three of
our constituency groups. For our employ-
ees, these are terrific developments. We
are growing the airline in a way that will
bring a wealth of hiring and promotional
opportunities for the people of American.
For our customers, the benefits of a
much broader network are clear. Our best
customers – both individuals and large cor-
porate accounts – increasingly expect their
airline of choice to take them everywhere
they want to go. We are determined to cre-
ate a domestic and international network
that is second to none. But at the same
time, we do not intend to add more capac-
ity to the industry than the growth in
demand can justify.
Our shareholders will be happy to
know that these transactions will enable
us, in a very economical way, to dramati-
cally grow our airline without introducing
incremental industry capacity. For a com-
mitment of just over $5 billion, we are
adding more than 270 airplanes to our
fleet and acquiring a wealth of other
assets in critical and strategic parts of our
network. There is no other series of deals
we could have made that would have
given us this much breadth and strength
for the amount of money we have commit-
ted. Moreover, even with $5 billion com-
mitted to these transactions, AMR’s balance
sheet remains one of the strongest in the
airline industry.
As always, the forecast for the year
ahead contains a few unknowns, including
the direction of both the U.S. economy
and the price of jet fuel. Nonetheless,
I believe AMR is in excellent shape to
handle whatever 2001 has in store for us.
Demand for our product – which we are
working hard to improve – continues to
grow. We’re committed to building a pre-
mier global network. We’ve got the best
team of employees in the business, and
new technologies are enabling all of us
to do our jobs better and more profitably.
Add it all up, and I believe that we
have, in American and American Eagle,
a very powerful and well-positioned fran-
chise. And you have my assurance that all
of us will be working hard in 2001 – to
build on our 2000 success and to create
positive outcomes for our customers,
employees and shareholders.
Donald J. Carty
Culture leadership is a
strategic imperative
every bit as important
as the other five areas
of the Airline Lead-
ership Plan.
4

5
OP E R AT I N G AI R C R A F T FL E E T S
WeightedAverage
Current Seating Capital Operating AgeAs of December 31, 2000 Capacity1 Owned Leased Leased Total (Years)
American Aircraft
Airbus A300-600R 192/250/251 10 – 25 35 11
Boeing 727-200 138 55 5 – 60 24
Boeing 737-800 134 51 – – 51 1
Boeing 757-200 176 58 13 31 102 8
Boeing 767-200 165 8 – – 8 18
Boeing 767-200 Extended Range 158 9 13 – 22 14
Boeing 767-300 Extended Range 190/207/228 32 7 10 49 8
Boeing 777-200 Extended Range 230/237/252/254 27 – – 27 1
Fokker 100 56/87 66 5 4 75 8
McDonnell Douglas MD-11 238 7 – – 7 8
McDonnell Douglas MD-80 112/125/127/129 128 22 126 276 13
McDonnell Douglas MD-90 135 – – 5 5 4
Total 451 65 201 717 11
AMR Eagle Aircraft
ATR 42 46 20 – 11 31 10
Embraer 135 37 33 – – 33 1
Embraer 145 50 50 – – 50 2
Super ATR 64/66 40 – 3 43 6
Saab 340 34 22 57 – 79 9
Saab 340B Plus 34 – – 25 25 5
Total 165 57 39 261 6
1American’s current seating capacity includes the effect of aircraft reconfigured under the Company’s More Room Throughout Coach program.
SCHEDULED RPMS AND ASMS
RPMS ASMS LOAD FACTOR
* 2000 has been adjusted for the Company’s More Room Throughout Coach program
2000* 1999 1998100,000
110,000
120,000
130,000
140,000
150,000
160,000
170,000
65%
70%
75%
MillionsLoadFactor
SCHEDULED RPMS AND ASMS
RPMS ASMS LOAD FACTOR
* 2000 has been adjusted for the Company’s More Room Throughout Coach program
2000* 1999 1998100,000
110,000
120,000
130,000
140,000
150,000
160,000
170,000
65%
70%
75%
MillionsLoadFactor

6
MA N A G E M E N T ’S DI S C U S S I O N A N D AN A LY S I S
AMR Corporation (AMR or the Company) was incor-
porated in October 1982. AMR’s principal subsidiary,
American Airlines, Inc. (American), was founded in
1934. AMR’s operations fall almost entirely in the
airline industry.
RE S U LT S O F OP E R AT I O N S
AMR’s net earnings in 2000 were $813 million, or
$5.43 per common share ($5.03 diluted). AMR’s income
from continuing operations before extraordinary loss
in 2000 was $779 million, or $5.20 per common share
($4.81 diluted). The results for 2000 include the follow-
ing special items: (i) a gain of $57 million ($36 million
after tax) from the sale of the Company’s warrants to
purchase 5.5 million shares of priceline.com Incorpo-
rated (priceline) common stock, (ii) a gain of approx-
imately $41 million ($26 million after tax) from the
recovery of start-up expenses from the Canadian
Airlines International Limited (Canadian) services
agreement, and (iii) a charge of $56 million ($35 mil-
lion after tax) for the Company’s employee home
computer program.
AMR’s net earnings in 1999 were $985 mil-
lion, or $6.46 per common share ($6.26 diluted).
AMR’s income from continuing operations in 1999
was $656 million, or $4.30 per common share
($4.17 diluted). A labor disagreement that disrupted
operations during the first quarter of 1999 negatively
impacted the Company’s 1999 results by an estimated
$225 million ($140 million after tax). The results for
1999 also include the following: (i) American’s Decem-
ber 1998 acquisition of Reno Air, Inc. (Reno) and AMR
Eagle’s March 1999 acquisition of Business Express, Inc.
(Business Express), (ii) a gain of $83 million ($64 mil-
lion after tax) on the sale of AMR Services, AMR Combs
and TeleService Resources, which is included in dis-
continued operations, (iii) a gain of approximately
$213 million ($118 million after taxes and minority
interest) resulting from the sale of a portion of the
Company’s holding in Equant N.V. (Equant), of which
approximately $75 million ($47 million after tax) is
included in income from continuing operations, (iv) a
gain of $40 million ($25 million after tax) from the
Company’s sale of its investment in the cumulative
mandatorily redeemable convertible preferred stock
of Canadian and a $67 million tax benefit resulting from
the tax loss on the Company’s investment in Canadian,
and (v) a charge of approximately $37 million ($25 mil-
lion after tax) relating to the provision for certain litiga-
tion items.
RE V E N U E S
2000 Compared to 1999 The Company’s revenues
increased approximately $2.0 billion, or 11.1 percent,
versus 1999. American’s passenger revenues increased
by 11.4 percent, or $1.7 billion. American’s yield (the
average amount one passenger pays to fly one mile)
of 14.05 cents increased by 7.1 percent compared to
1999. For the year, domestic yields increased 7.5 per-
cent while European, Latin American and Pacific yields
increased 9.9 percent, 4.2 percent and 3.8 percent,
respectively. The increase in revenues was due pri-
marily to a strong U.S. economy, which led to strong
demand for air travel both domestically and internation-
ally, a favorable pricing climate, the impact of a domes-
tic fuel surcharge implemented in January 2000 and
increased in September 2000, a labor disruption at
one of the Company’s competitors which positively
impacted the Company’s revenues by approximately
$80 to $100 million, and a schedule disruption which
negatively impacted the Company’s operations in 1999.
American’s domestic traffic increased 2.7 percent
to 78.5 billion revenue passenger miles (RPMs), while
domestic capacity, as measured by available seat miles
(ASMs), decreased 1.6 percent. The decrease in domes-
tic capacity was due primarily to the Company’s More
Room Throughout Coach program. (The Company’s
More Room Throughout Coach program reconfigures
American’s entire fleet to increase the seat pitch from
the present industry standard of 31 and 32 inches to
a predominant seat pitch of 34 and 35 inches.) Inter-
national traffic grew 6.8 percent to 38.1 billion RPMs
on capacity growth of 3.1 percent. The increase in
international traffic was led by a 12.2 percent increase
in the Pacific on capacity growth of 2.5 percent, an
8.5 percent increase in Europe on capacity growth of
6.7 percent, and a 4.1 percent increase in Latin America
on capacity growth of 0.4 percent. In 2000, American
derived approximately 70 percent of its passenger
revenues from domestic operations and approximately
30 percent from international operations.

7
AMR Eagle’s passenger revenues increased
$158 million, or 12.2 percent. AMR Eagle’s traffic
increased to 3.7 billion RPMs, up 10.7 percent, while
capacity increased to 6.3 billion ASMs, or 10.9 percent.
The increase in revenues was due primarily to growth
in AMR Eagle capacity aided by a strong U.S. economy,
which led to strong demand for air travel, and a favor-
able pricing environment.
Cargo revenues increased 12.1 percent, or
$78 million, due primarily to a fuel surcharge imple-
mented in February 2000 and increased in October
2000 and the increase in cargo capacity from the addi-
tion of 16 Boeing 777-200ER aircraft in 2000.
1999 Compared to 1998 The Company’s revenues
increased $214 million, or 1.2 percent, versus 1998.
American’s passenger revenues increased by 0.1 per-
cent, or $12 million. American’s yield of 13.12 cents
decreased by 2.7 percent compared to 1998. For the
year, domestic yields decreased 1.1 percent, while
European, Pacific and Latin American yields decreased
7.2 percent, 6.0 percent and 4.5 percent, respectively.
The decrease in domestic yield was due primarily to
increased capacity, the labor disagreement during the
first quarter of 1999, and the impact of international
yield decreases on domestic yields. The decrease
in international yields was due primarily to weak
economies in certain parts of the world, large industry
capacity additions and increased fare sale activity.
American’s domestic traffic increased 2.1 percent
to 76.4 billion RPMs, while domestic capacity increased
4.1 percent. The increase in domestic traffic was due
primarily to the addition of Reno. International traffic
grew 4.6 percent to 35.7 billion RPMs on a capacity
increase of 3.1 percent. The increase in international
traffic was led by a 44.2 percent increase in the Pacific
on capacity growth of 44.1 percent and a 5.7 percent
increase in Europe on capacity growth of 7.3 percent,
partially offset by a 1.9 percent decrease in Latin
America on a capacity decrease of 5.1 percent. In
1999, American derived approximately 70 percent of
its passenger revenues from domestic operations and
approximately 30 percent from international operations.
AMR Eagle’s passenger revenues increased
$173 million, or 15.4 percent. AMR Eagle’s traffic
increased to 3.4 billion RPMs, up 20.9 percent, while
capacity increased to 5.6 billion ASMs, or 26.1 percent,
due primarily to the addition of Business Express in
March 1999.
OP E R AT I N G EX P E N S E S
2000 Compared to 1999 The Company’s operating
expenses increased 10.5 percent, or approximately
$1.7 billion. American’s cost per ASM increased by
10.5 percent to 10.38 cents, partially driven by a
reduction in ASMs due to the Company’s More Room
Throughout Coach program. Adjusting for this pro-
gram, American’s cost per ASM grew approximately
7.2 percent. Wages, salaries and benefits increased
$663 million, or 10.8 percent, primarily due to an
increase in the average number of equivalent employ-
ees and contractual wage rate and seniority increases
that are built into the Company’s labor contracts,
an increase of approximately $93 million in the
provision for profit-sharing, and a charge of approxi-
mately $56 million for the Company’s employee home
computer program. Aircraft fuel expense increased
$799 million, or 47.1 percent, due to an increase of
42.0 percent in the Company’s average price per gal-
lon and a 3.7 percent increase in the Company’s fuel
consumption. The increase in fuel expense is net of
gains of approximately $545 million recognized during
2000 related to the Company’s fuel hedging program.
Depreciation and amortization expense increased
$110 million, or 10.1 percent, due primarily to the
addition of new aircraft, many of which replaced older
aircraft. Maintenance, materials and repairs expense
increased $92 million, or 9.2 percent, due primarily to
an increase in airframe and engine maintenance vol-
umes at the Company’s maintenance bases and an
approximate $17 million one-time credit the Company
received in 1999. Commissions to agents decreased
10.8 percent, or $125 million, despite an 11.4 percent
increase in passenger revenues, due primarily to com-
mission structure changes implemented in October 1999
and January 2000, and a decrease in the percentage of
commissionable transactions.

8
1999 Compared to 1998 The Company’s operating
expenses increased 6.7 percent, or approximately
$1 billion. American’s cost per ASM increased by
1.5 percent to 9.39 cents. Wages, salaries and benefits
increased $327 million, or 5.6 percent, primarily due
to an increase in the average number of equivalent
employees and contractual wage rate and seniority
increases that are built into the Company’s labor con-
tracts, partially offset by a decrease in the provision for
profit-sharing. Aircraft fuel expense increased $92 mil-
lion, or 5.7 percent, due to a 5.5 percent increase in
the Company’s fuel consumption and a 0.2 percent
increase in the Company’s average price per gallon.
The increase in fuel expense is net of gains of approxi-
mately $111 million recognized during 1999 related to
the Company’s fuel hedging program. Depreciation and
amortization expense increased $52 million, or 5.0 per-
cent, due primarily to the addition of new aircraft, par-
tially offset by the change in depreciable lives and
residual values for certain types of aircraft in 1999
(see Note 1 to the consolidated financial statements).
Maintenance, materials and repairs expense increased
7.3 percent, or $68 million, due primarily to the addi-
tion of Reno and Business Express aircraft during 1999.
Commissions to agents decreased 5.2 percent, or
$64 million, despite a 1.2 percent increase in passen-
ger revenues, due to the benefit from the changes in
the international commission structure in late 1998 and
the base commission structure in October 1999, and a
decrease in the percentage of commissionable transac-
tions. Other rentals and landing fees increased 12.3 per-
cent, or $103 million, due primarily to higher facilities
rent and landing fees across American’s system and the
addition of Reno and Business Express. Food service
increased $65 million, or 9.6 percent, due primarily to
rate increases and the addition of Reno. Aircraft rentals
increased $61 million, up 10.7 percent, primarily due
to the addition of Reno and Business Express aircraft.
Other operating expenses increased $342 million, or
12.0 percent, due primarily to increases in outsourced
services, travel and incidental costs and booking fees.
OT H E R IN C O M E (EX P E N S E)
Other income (expense) consists of interest income and
expense, interest capitalized and miscellaneous – net.
2000 Compared to 1999 Interest income increased
$59 million, or 62.1 percent, due primarily to higher
investment balances. Interest expense increased $74 mil-
lion, or 18.8 percent, resulting primarily from financing
new aircraft deliveries. Interest capitalized increased
28.0 percent, or $33 million, due to an increase in pur-
chase deposits for flight equipment. Miscellaneous –
net increased $38 million due primarily to a $57 million
gain on the sale of the Company’s warrants to purchase
5.5 million shares of priceline common stock in the
second quarter of 2000 and a gain of approximately
$41 million from the recovery of start-up expenses
from the Canadian services agreement. During 1999,
the Company recorded a gain of approximately $75 mil-
lion from the sale of a portion of American’s interest in
Equant and a gain of approximately $40 million related
to the sale of the Company’s investment in the preferred
stock of Canadian. These gains were partially offset by
the provision for the settlement of litigation items and
the write-down of certain investments held by the Com-
pany during 1999.
1999 Compared to 1998 Interest income decreased
$38 million, or 28.6 percent, due primarily to lower
investment balances throughout most of 1999. Interest
expense increased $21 million, or 5.6 percent, resulting
primarily from an increase in long-term debt. Interest
capitalized increased 13.5 percent, or $14 million, due
to an increase in purchase deposits for flight equipment
throughout most of 1999. Miscellaneous – net increased
$50 million due primarily to the sale of a portion of
American’s interest in Equant in 1999, which resulted in
an approximate $75 million gain, and a gain of approxi-
mately $40 million from the sale of the Company’s
investment in the preferred stock of Canadian. These
gains were partially offset by the provision for the set-
tlement of litigation items and the write-down of certain
investments held by the Company during 1999.

9
OP E R AT I N G STAT I S T I C S
The following table provides statistical information for
American and AMR Eagle for the years ended Decem-
ber 31, 2000, 1999 and 1998.
Year Ended December 31,
2000 1999 1998
American AirlinesRevenue passenger miles (millions) 116,594 112,067 108,955Available seat miles (millions) 161,030 161,211 155,297Cargo ton miles (millions) 2,280 2,068 1,974Passenger load factor 72.4% 69.5% 70.2%Breakeven load factor 65.9% 63.8% 59.9%Passenger revenue yield
per passenger mile (cents) 14.05 13.12 13.49Passenger revenue
per available seat mile (cents) 10.17 9.12 9.46Cargo revenue yield
per ton mile (cents) 31.31 30.70 32.85Operating expenses
per available seat mile (cents) 10.38 9.39 9.25Operating aircraft at year-end 717 697 648
AMR EagleRevenue passenger miles (millions) 3,731 3,371 2,788Available seat miles (millions) 6,256 5,640 4,471Passenger load factor 59.6% 59.8% 62.4%Operating aircraft at year-end 261 268 209
LI Q U I D I T Y A N D CA P I TA L RE S O U R C E S
Operating activities provided net cash of $3.1 billion in
2000, $2.3 billion in 1999 and $2.8 billion in 1998. The
$878 million increase from 1999 to 2000 resulted prima-
rily from a decrease in working capital.
Capital expenditures in 2000 totaled $3.7 billion,
compared to $3.5 billion in 1999 and $2.3 billion in
1998, and included aircraft acquisitions of approxi-
mately $3.1 billion. In 2000, American took delivery
of 27 Boeing 737-800s and 16 Boeing 777-200ERs.
AMR Eagle took delivery of 24 Embraer 135 aircraft
and five Embraer 145 aircraft. These expenditures, as
well as the expansion of certain airport facilities, were
funded primarily with internally generated cash and
the $559 million cash dividend from Sabre Holdings
Corporation, except for (i) 11 Boeing aircraft which
were financed through secured mortgage agreements,
and (ii) the Embraer aircraft acquisitions which were
funded through secured debt agreements.
At December 31, 2000, the Company had com-
mitments to acquire the following aircraft: 66 Boeing
737-800s, 23 Boeing 757-200s, 20 Boeing 777-200ERs,
146 Embraer regional jets and 25 Bombardier CRJ-700s.
Deliveries of all aircraft extend through 2006. Future
payments for all aircraft, including the estimated
amounts for price escalation, will approximate $2.7 bil-
lion in 2001, $1.6 billion in 2002, $900 million in 2003
and an aggregate of approximately $1.3 billion in 2004
through 2006. In addition to these commitments for
aircraft, the Company expects to spend approximately
$1.0 billion in 2001 for modifications to aircraft, ren-
ovations of – and additions to – airport and off-airport
facilities, and the acquisition of various other equipment
and assets, of which approximately $855 million has
been authorized by the Company’s Board of Directors.
The Company expects to fund its 2001 capital expendi-
tures from the Company’s existing cash and short-term
investments, internally generated cash or new financing
depending upon market conditions and the Company’s
evolving view of its long-term needs.
On January 10, 2001, the Company announced
three transactions that are expected to substantially
increase the scope of its existing network. First, the
Company announced that it had agreed to purchase
substantially all of the assets of Trans World Airlines,
Inc. (TWA) for approximately $500 million in cash and
to assume approximately $3.5 billion of TWA’s obliga-
tions. The Company’s agreement with TWA contem-
plated that TWA would file for bankruptcy protection
under Chapter 11 of the U.S. Bankruptcy Code and
conduct an auction of its assets under the auspices of
the Bankruptcy Court. During the auction, other credi-
ble offers would compete with the Company’s offer.
TWA filed for bankruptcy protection on January 10,
2001. In conjuction therewith, the Company also agreed
to provide TWA with up to $200 million in debtor-in-
possession financing to facilitate TWA’s ability to main-
tain its operations until the completion of this transac-
tion. The amount available under this facility was later
increased to $330 million. As of March 19, 2001,
approximately $289 million had been provided via the
debtor-in-possession financing.

10
The auction of TWA’s assets was commenced on
March 5, 2001, and recessed to March 7, 2001. During
the recess, the Company increased its cash bid to $625
million and agreed to leave in the TWA estate certain
aircraft security deposits, advance rental payments and
rental rebates that were estimated to bring approxi-
mately $117 million of value to TWA. The Company
expects that the increase in the Company’s bid will be
more that offset, however, by the benefit to the Com-
pany of the reductions in rental rates the Company has
negotiated with TWA’s aircraft lessors. On March 7,
2001, TWA’s board selected the Company’s bid as the
“highest and best” offer, and on March 12, 2001, the
U.S. Bankruptcy Court, District of Delaware, entered an
order approving the sale of TWA’s assets to the Com-
pany. Consummation of the transaction is subject to
several contingencies, including the waiver by TWA’s
unions of certain provisions of their collective bargain-
ing agreements. The approval of the U.S. Department of
Justice was obtained on March 16, 2001. Certain parties
have filed appeals of the Bankruptcy Court’s sale order,
and have sought a stay of the transaction, pending the
appeals. A provision of the Bankruptcy Code will per-
mit the Company to close the transaction, despite pend-
ing appeals, unless a stay is granted. If a stay is
granted, the Company would anticipate that the appeal
process would be expedited. Upon the closing of the
transaction, TWA will be integrated into American’s
operations with a continued hub operation in St. Louis.
The Company expects to fund the acquisition of TWA’s
assets with its existing cash and short-term investments,
internally generated cash or new financing depending
on market conditions and the Company’s evolving view
of its long-term needs.
Secondly, the Company announced that it has
agreed to acquire from United Airlines, Inc. (United)
certain key strategic assets (slots, gates and aircraft) of
US Airways, Inc. (US Airways) upon the consummation
of the previously announced merger between United
and US Airways. In addition to the acquisition of these
assets, American will lease a number of slots and gates
from United so that American may operate half of the
northeast Shuttle (New York/Washington DC/Boston).
United will operate the other half of the Shuttle. For
these assets, American will pay approximately $1.2 bil-
lion in cash to United and assume approximately $300
million in aircraft operating leases. The consummation
of these transactions is contingent upon the closing of
the proposed United/US Airways merger. Also, the
acquisition of aircraft is generally dependent upon a
certain number of US Airways’ Boeing 757 cockpit crew
members transferring to American’s payroll.
Finally, American has agreed to acquire a 49 per-
cent stake in, and to enter into an exclusive marketing
agreement with, DC Air LLC (DC Air). American has
agreed to pay $82 million in cash for its ownership
stake. American will have a right of first refusal on the
acquisition of the remaining 51 percent stake in DC Air.
American will also lease to DC Air a certain number of
Fokker 100 aircraft with necessary crews (known in the
industry as a “wet lease”). These wet leased aircraft will
be used by DC Air in its operations. DC Air is the first
significant new entrant at Ronald Reagan Washington
National Airport (DCA) in over a decade. DC Air will
acquire the assets needed to begin its DCA operations
from United/US Airways upon the consummation of the
merger between the two carriers. American’s investment
in DC Air and the other arrangements described above
are contingent upon the consummation of the merger
between United and US Airways.
American has $1.0 billion in credit facility agree-
ments that expire December 15, 2005, subject to cer-
tain conditions. At American’s option, interest on these
agreements can be calculated on one of several differ-
ent bases. For most borrowings, American would antic-
ipate choosing a floating rate based upon the London
Interbank Offered Rate (LIBOR). At December 31, 2000,
no borrowings were outstanding under these agreements.
AMR (principally American Airlines) historically
operates with a working capital deficit as do most other
airline companies. The existence of such a deficit has
not in the past impaired the Company’s ability to meet
its obligations as they become due and is not expected
to do so in the future.
OT H E R IN F O R M AT I O N
Environmental Matters Subsidiaries of AMR have been
notified of potential liability with regard to several envi-
ronmental cleanup sites and certain airport locations. At
sites where remedial litigation has commenced, poten-
tial liability is joint and several. AMR’s alleged volumet-
ric contributions at these sites are minimal compared to
others. AMR does not expect these matters, individually
or collectively, to have a material impact on its results
of operations, financial position or liquidity. Additional
information is included in Note 3 to the consolidated
financial statements.

11
New Accounting Pronouncement Financial Accounting
Standards Board Statement of Financial Accounting
Standards No. 133, “Accounting for Derivative Instru-
ments and Hedging Activities”, as amended (SFAS 133),
was adopted by the Company on January 1, 2001.
SFAS 133 requires the Company to recognize all deriva-
tives on the balance sheet at fair value. Derivatives that
are not hedges must be adjusted to fair value through
income. If the derivative is a hedge, depending on the
nature of the hedge, changes in the fair value of deriv-
atives will either be offset against the change in fair
value of the hedged assets, liabilities, or firm commit-
ments through earnings or recognized in other com-
prehensive income until the hedged item is recognized
in earnings. The ineffective portion of a derivative’s
change in fair value will be immediately recognized
in earnings. The adoption of SFAS 133 did not have a
material impact on the Company’s net earnings. How-
ever, the Company recorded a transition adjustment of
approximately $100 million in accumulated other com-
prehensive income in the first quarter of 2001.
OU T L O O K F O R 2001
The Company is cautious in its outlook for 2001. On
the revenue front, the primary concern is a slowing
U.S. economy. American’s strong revenue performance
the past several years was marked by a growing U.S.
economy coupled with a modest increase in industry
capacity. Our revenue performance in 2001 will be
dictated by how well the industry manages that relation-
ship going forward.
Absent the TWA, United/US Airways and DC Air
transactions, American’s capacity in 2001 is expected to
grow about three percent, slightly less than the industry
average. AMR Eagle’s capacity will grow about 11 per-
cent, reflecting the delivery of 31 new regional jets
(RJs). Should the demand for air travel slow more
quickly than expected, both carriers have the flexibility
to further accelerate the retirement of certain older air-
craft to keep the Company’s capacity growth in line
with general economic conditions.
With the transactions, if approved, the Company
expects to strengthen its position in several key domes-
tic markets. The TWA transaction will provide American
with a hub operation in St. Louis which will serve to
strengthen the Company’s position as an east/west car-
rier. In addition, these proposed transactions will allow
the Company to gain additional slots and real estate at
New York’s Kennedy and LaGuardia airports, Washing-
ton Reagan, Boston and other major airports across the
domestic system. At the same time, the Company will
continue to improve the regional airline feed to Ameri-
can by strengthening AMR Eagle with the replacement
of turboprop aircraft with RJs and the expansion of
connecting service at Chicago O’Hare, DFW and key
East Coast cities. The Company has reached agreements
with three regional carriers feeding TWA in St. Louis.
These agreements will provide for continued feed traffic
from St. Louis should the TWA transaction be approved.
On the international front, the Company will con-
tinue to pursue its relationship with Swissair/Sabena,
and its bilateral agreement with EVA of Taiwan –
coupled with the Company’s existing Asian carrier
alliances – will allow the Company to strengthen its
presence in several Asian markets. The Company is
also working to make the oneworld alliance pay off
in more significant ways, in part by strengthening its
relationship with British Airways.
Pressure to reduce costs will continue, although
the volatility of fuel prices makes any prediction of
overall costs very difficult. Excluding fuel expense and
the impact of the Company’s More Room Throughout
Coach program, the Company anticipates an increase
in unit cost of one to two percent driven primarily
by higher labor and aircraft ownership costs. On the
labor front, the Company has or will have all three of
its union contracts open for negotiation in 2001. The
expected result is upward pressure on labor rates. Air-
craft depreciation and maintenace, materials and repairs
expense will also be up, reflecting 2000 and 2001 air-
craft deliveries. Other expense lines will see volume-
driven increases and inflationary pressures. Partially off-
setting these expected increases, the Company
anticipates future reductions in distribution costs due to
reduced commission expense and increased penetration
rates for electronic tickets. And although oil prices are
largely expected to decrease in 2001 as compared to
2000 levels, the resulting benefit will be offset by lower
fuel hedging gains in 2001 from the Company’s fuel
hedging program.
Lastly, as a result of the proposed TWA, United/US
Airways and DC Air transactions, and for several other
reasons, American and American Eagle have initiated
an impairment review of certain fleet types in accor-
dance with Statement of Financial Accounting Standards

12
No. 121, “Accounting for the Impairment of Long-Lived
Assets and for Long-Lived Assets to Be Disposed Of.”
This review could result in an impairment charge to
be taken by the Company in 2001. The size of any
resulting 2001 charge is not presently known, but
may be significant.
FO RWA R D-L O O K I N G IN F O R M AT I O N
The preceding Letter to Shareholders, Customers and
Employees and Management’s Discussion and Analysis
contain various forward-looking statements within the
meaning of Section 27A of the Securities Act of 1933,
as amended, and Section 21E of the Securities Exchange
Act of 1934, as amended, which represent the Com-
pany’s expectations or beliefs concerning future events.
When used in this document and in documents incor-
porated herein by reference, the words “expects,”
“plans,” “anticipates” and similar expressions are
intended to identify forward-looking statements.
Forward-looking statements include, without limita-
tion, expectations as to results of operations and
financial condition, including changes in capacity,
revenues and costs, expectations as to future financ-
ing needs, overall economic projections and the
Company’s plans and objectives for future operations,
including its ability to successfully integrate into its
operations assets the Company may acquire in its previ-
ously announced transactions with TWA, United/US
Airways and DC Air, and plans to develop future code-
sharing programs and to evaluate new alliances. All
forward-looking statements in this report are based
upon information available to the Company on the date
of this report. The Company undertakes no obligation
to publicly update or revise any forward-looking
statement, whether as a result of new information,
future events or otherwise. Forward-looking statements
are subject to a number of factors that could cause
actual results to differ materially from our expectations.
The following factors, in addition to other possible
factors not listed, could cause the Company’s actual
results to differ materially from those expressed in
forward-looking statements: uncertainty of future
collective bargaining agreements and events; economic
and other conditions; commodity prices; competition in
the airline industry; changing business strategy; govern-
ment regulation; uncertainty in international operations;
and industry consolidation. Additional information
concerning these and other factors is contained in the
Company’s Securities and Exchange Commission filings,
including but not limited to Form 10-K for 2000, copies
of which are available from the Company without
charge.
MA R K E T RI S K SE N S I T I V E IN S T R U M E N T S
A N D PO S I T I O N S
The risk inherent in the Company’s market risk sensi-
tive instruments and positions is the potential loss aris-
ing from adverse changes in the price of fuel, foreign
currency exchange rates and interest rates as discussed
below. The sensitivity analyses presented do not con-
sider the effects that such adverse changes may have
on overall economic activity, nor do they consider
additional actions management may take to mitigate
its exposure to such changes. Actual results may differ.
See Note 6 to the consolidated financial statements for
accounting policies and additional information. In addi-
tion, the following analyses exclude any impact of the
proposed transactions discussed on pages 9 and 10.
Aircraft Fuel The Company’s earnings are affected by
changes in the price and availability of aircraft fuel. In
order to provide a measure of control over price and
supply, the Company trades and ships fuel and main-
tains fuel storage facilities to support its flight opera-
tions. The Company also manages the price risk of
fuel costs primarily utilizing swap and option contracts.
Market risk is estimated as a hypothetical 10 percent
increase in the December 31, 2000 and 1999 cost per
gallon of fuel. Based on projected 2001 fuel usage,
such an increase would result in an increase to air-
craft fuel expense of approximately $194 million in
2001, net of fuel hedge instruments outstanding at
December 31, 2000. Comparatively, based on projected
2000 fuel usage, such an increase would have resulted
in an increase to aircraft fuel expense of approximately
$131 million in 2000, net of fuel hedge instruments out-
standing at December 31, 1999. The change in market
risk is due primarily to the increase in fuel prices. As of
December 31, 2000, the Company had hedged approxi-
mately 40 percent of its 2001 fuel requirements, approx-
imately 15 percent of its 2002 fuel requirements, and
approximately seven percent of its 2003 fuel require-
ments, compared to approximately 48 percent of its
2000 fuel requirements and 10 percent of its 2001 fuel
requirements hedged at December 31, 1999.

13
Foreign Currency The Company is exposed to the
effect of foreign exchange rate fluctuations on the U.S.
dollar value of foreign currency-denominated operating
revenues and expenses. The Company’s largest expo-
sure comes from the Canadian dollar, British pound,
Japanese yen, Euro and various Latin and South Ameri-
can currencies. The Company uses options to hedge a
portion of its anticipated foreign currency-denominated
ticket sales. The result of a uniform 10 percent strength-
ening in the value of the U.S. dollar from December 31,
2000 and 1999 levels relative to each of the currencies
in which the Company has foreign currency exposure
would result in a decrease in operating income of
approximately $33 million and $39 million for the years
ending December 31, 2001 and 2000, respectively, net
of hedge instruments outstanding at December 31, 2000
and 1999, due to the Company’s foreign-denominated
revenues exceeding its foreign-denominated expenses.
This sensitivity analysis was prepared based upon pro-
jected 2001 and 2000 foreign currency-denominated rev-
enues and expenses as of December 31, 2000 and 1999.
Interest The Company’s earnings are also affected
by changes in interest rates due to the impact those
changes have on its interest income from cash and
short-term investments, and its interest expense from
variable-rate debt instruments. The Company has
variable-rate debt instruments representing approxi-
mately 29 percent and 21 percent of its total long-term
debt, respectively, at December 31, 2000 and 1999, and
interest rate swaps on notional amounts of approxi-
mately $158 million and $696 million, respectively, at
December 31, 2000 and 1999. During 2000, the Com-
pany terminated interest rate swap agreements on
notional amounts of approximately $425 million. The
cost of terminating these interest rate swap agreements
was not material. If interest rates average 10 percent
more in 2001 than they did at December 31, 2000, the
Company’s interest expense would increase by approxi-
mately $11 million and interest income from cash and
short-term investments would increase by approxi-
mately $15 million. In comparison, at December 31,
1999, the Company estimated that if interest rates aver-
aged 10 percent more in 2000 than they did at Decem-
ber 31, 1999, the Company’s interest expense would
have increased by approximately $10 million and inter-
est income from cash and short-term investments would
have increased by approximately $11 million. These
amounts are determined by considering the impact
of the hypothetical interest rates on the Company’s
variable-rate long-term debt, interest rate swap agree-
ments, and cash and short-term investment balances
at December 31, 2000 and 1999.
Market risk for fixed-rate long-term debt is esti-
mated as the potential increase in fair value resulting
from a hypothetical 10 percent decrease in interest
rates, and amounts to approximately $148 million and
$156 million as of December 31, 2000 and 1999, respec-
tively. The fair values of the Company’s long-term
debt were estimated using quoted market prices or
discounted future cash flows based on the Company’s
incremental borrowing rates for similar types of borrow-
ing arrangements.
Investments The Company is subject to market risk
related to its ownership of approximately 1.2 million
depository certificates convertible, subject to certain
restrictions, into the common stock of Equant, as of
December 31, 2000 and 1999. The estimated fair value
of these depository certificates was approximately
$32 million and $136 million as of December 31, 2000
and 1999, respectively, based upon the market value
of Equant common stock.
In addition, the Company holds investments in
certain other entities which are subject to market risk.
However, the impact of such market risk on earnings
is not significant due to the immateriality of the carry-
ing value and the geographically diverse nature of
these holdings.

14
CO N S O L I D AT E D STAT E M E N T S O F OP E R AT I O N S
Year Ended December 31,
(in millions, except per share amounts) 2000 1999 1998
Revenues
Passenger – American Airlines, Inc. $ 16,377 $ 14,707 $ 14,695
– AMR Eagle 1,452 1,294 1,121
Cargo 721 643 656
Other revenues 1,153 1,086 1,044
Total operating revenues 19,703 17,730 17,516
Expenses
Wages, salaries and benefits 6,783 6,120 5,793
Aircraft fuel 2,495 1,696 1,604
Depreciation and amortization 1,202 1,092 1,040
Maintenance, materials and repairs 1,095 1,003 935
Commissions to agents 1,037 1,162 1,226
Other rentals and landing fees 999 942 839
Food service 777 740 675
Aircraft rentals 607 630 569
Other operating expenses 3,327 3,189 2,847
Total operating expenses 18,322 16,574 15,528
Operating Income 1,381 1,156 1,988
Other Income (Expense)
Interest income 154 95 133
Interest expense (467) (393) (372)
Interest capitalized 151 118 104
Miscellaneous – net 68 30 (20)
(94) (150) (155)
Income From Continuing Operations Before Income Taxes
and Extraordinary Loss 1,287 1,006 1,833
Income tax provision 508 350 719
Income From Continuing Operations Before Extraordinary Loss 779 656 1,114
Income From Discontinued Operations, Net of ApplicableIncome Taxes and Minority Interest 43 265 200
Gain on Sale of Discontinued Operations, Net of Applicable Income Taxes – 64 –
Income Before Extraordinary Loss 822 985 1,314
Extraordinary Loss, Net of Applicable Income Taxes (9) – –
Net Earnings $ 813 $ 985 $ 1,314
Earnings Per Share:
Basic
Income from continuing operations $ 5.20 $ 4.30 $ 6.60
Discontinued operations 0.30 2.16 1.18
Extraordinary loss (0.07) – –
Net earnings $ 5.43 $ 6.46 $ 7.78
Diluted
Income from continuing operations $ 4.81 $ 4.17 $ 6.38
Discontinued operations 0.27 2.09 1.14
Extraordinary loss (0.05) – –
Net earnings $ 5.03 $ 6.26 $ 7.52
The accompanying notes are an integral part of these financial statements.

15
CO N S O L I D AT E D STAT E M E N T S O F CA S H FL O W S
Year Ended December 31,
(in millions) 2000 1999 1998
Cash Flow from Operating Activities:
Income from continuing operations after extraordinary loss $ 770 $ 656 $ 1,114
Adjustments to reconcile income from continuing operations after
extraordinary loss to net cash provided by operating activities:
Depreciation 928 864 830
Amortization 274 228 210
Deferred income taxes 461 183 268
Extraordinary loss on early extinguishment of debt 14 – –
Gain on sale of other investments, net (57) (95) –
Gain on disposition of equipment and property – (15) (19)
Change in assets and liabilities:
Decrease (increase) in receivables (169) 261 (185)
Increase in inventories (111) (140) (36)
Increase in accounts payable and accrued liabilities 579 42 343
Increase in air traffic liability 438 84 128
Other, net 15 196 144
Net cash provided by operating activities 3,142 2,264 2,797
Cash Flow from Investing Activities:
Capital expenditures, including purchase deposits on flight equipment (3,678) (3,539) (2,342)
Net decrease (increase) in short-term investments (438) (253) 348
Acquisitions and other investments (50) (99) (137)
Proceeds from:
Dividend from Sabre Holdings Corporation 559 – –
Sale of equipment and property 238 79 262
Sale of other investments 94 85 –
Sale of discontinued operations – 259 –
Other – 18 –
Net cash used for investing activities (3,275) (3,450) (1,869)
Cash Flow from Financing Activities:
Payments on long-term debt and capital lease obligations (766) (280) (547)
Proceeds from:
Issuance of long-term debt 836 1,956 246
Exercise of stock options 67 25 85
Short-term loan from Sabre Holdings Corporation – 300 –
Sale-leaseback transactions – 54 270
Repurchase of common stock – (871) (945)
Net cash provided by (used for) financing activities 137 1,184 (891)
Net increase (decrease) in cash 4 (2) 37
Cash at beginning of year 85 87 50
Cash at end of year $ 89 $ 85 $ 87
Activities Not Affecting Cash
Distribution of Sabre Holdings Corporation shares to AMR shareholders $ 581 $ – $ –
Payment of short-term loan from Sabre Holdings Corporation $ – $ 300 $ –
Capital lease obligations incurred $ – $ 54 $ 270
The accompanying notes are an integral part of these financial statements.

16
CO N S O L I D AT E D BA L A N C E SH E E T S
December 31,
(in millions) 2000 1999
ASSETS
Current Assets
Cash $ 89 $ 85
Short-term investments 2,144 1,706
Receivables, less allowance for uncollectible accounts (2000 – $27; 1999 – $57) 1,303 1,134
Inventories, less allowance for obsolescence (2000 – $332; 1999 – $279) 757 708
Deferred income taxes 695 612
Other current assets 191 179
Total current assets 5,179 4,424
Equipment and Property
Flight equipment, at cost 20,041 16,912
Less accumulated depreciation 6,320 5,589
13,721 11,323
Purchase deposits for flight equipment 1,700 1,582
Other equipment and property, at cost 3,639 3,247
Less accumulated depreciation 1,968 1,814
1,671 1,433
17,092 14,338
Equipment and Property Under Capital Leases
Flight equipment 2,618 3,141
Other equipment and property 159 155
2,777 3,296
Less accumulated amortization 1,233 1,347
1,544 1,949
Other Assets
Route acquisition costs and airport operating and gate lease rights, less accumulated amortization (2000 – $498; 1999 – $450) 1,143 1,191
Other 1,255 2,472
2,398 3,663
Total Assets $ 26,213 $ 24,374
The accompanying notes are an integral part of these financial statements.

17
December 31,
(in millions, except shares and par value) 2000 1999
LIABILITIES AND STOCKHOLDERS’ EQUITY
Current Liabilities
Accounts payable $ 1,267 $ 1,115
Accrued salaries and wages 955 849
Accrued liabilities 1,276 1,107
Air traffic liability 2,696 2,258
Current maturities of long-term debt 569 302
Current obligations under capital leases 227 236
Total current liabilities 6,990 5,867
Long-Term Debt, Less Current Maturities 4,151 4,078
Obligations Under Capital Leases, Less Current Obligations 1,323 1,611
Other Liabilities and Credits
Deferred income taxes 2,385 1,846
Deferred gains 508 613
Postretirement benefits 1,706 1,669
Other liabilities and deferred credits 1,974 1,832
6,573 5,960
Commitments and Contingencies
Stockholders’ Equity
Common stock – $1 par value; shares authorized: 750,000,000;
Shares issued: 2000 and 1999 – 182,278,766 182 182
Additional paid-in capital 2,911 3,061
Treasury shares at cost: 2000 – 30,216,218; 1999 – 34,034,110 (1,865) (2,101)
Accumulated other comprehensive income (2) (2)
Retained earnings 5,950 5,718
7,176 6,858
Total Liabilities and Stockholders’ Equity $ 26,213 $ 24,374

18
CO N S O L I D AT E D STAT E M E N T S O F ST O C K H O L D E R S ’ EQ U I T Y
AccumulatedAdditional Other
Common Paid-in Treasury Comprehensive Retained(in millions, except share amounts) Stock Capital Stock Income Earnings Total
Balance at January 1, 1998 $ 182 $ 3,104 $ (485) $ (4) $ 3,419 $ 6,216
Net earnings and total comprehensive income – – – – 1,314 1,314
Repurchase of 14,342,008 common shares – – (944) – – (944)
Issuance of 2,495,148 shares from Treasury pursuant to stock option, deferred stock and restricted stock incentive plans, net of tax benefit of $17 – (29) 141 – – 112
Balance at December 31, 1998 182 3,075 (1,288) (4) 4,733 6,698
Net earnings – – – – 985 985
Adjustment for minimum pension liability, net of tax expense of $1 – – – 3 – 3
Unrealized loss on investments, net of tax benefit of $1 – – – (1) – (1)
Total comprehensive income 987
Repurchase of 14,062,358 common shares – – (871) – – (871)
Issuance of 955,940 shares from Treasury pursuant to stock option, deferred stock and restricted stock incentive plans, net of tax benefit of $4 – (14) 58 – – 44
Balance at December 31, 1999 182 3,061 (2,101) (2) 5,718 6,858
Net earnings – – – – 813 813
Adjustment for minimum pension liability, net of tax expense of $3 – – – (5) – (5)
Unrealized gain on investments, net of tax expense of $2 – – – 5 – 5
Total comprehensive income 813
Distribution of Sabre Holdings Corporation shares to AMR shareholders – – – – (581) (581)
Issuance of 3,817,892 shares from Treasury pursuant to stock option, deferred stock and restrictedstock incentive plans, net of tax benefit of $11 – (150) 236 – – 86
Balance at December 31, 2000 $ 182 $ 2,911 $(1,865) $ (2) $ 5,950 $ 7,176
The accompanying notes are an integral part of these financial statements.

19
NO T E S T O CO N S O L I D AT E D FI N A N C I A L STAT E M E N T S
1. SU M M A RY O F AC C O U N T I N G PO L I C I E S
Basis of Presentation The consolidated financial state-
ments include the accounts of AMR Corporation (AMR
or the Company) and its wholly owned subsidiaries,
including its principal subsidiary American Airlines, Inc.
(American). All significant intercompany transactions
have been eliminated. The results of operations, cash
flows and net assets for Sabre Holdings Corporation
(Sabre), AMR Services, AMR Combs and TeleService
Resources have been reflected in the consolidated
financial statements as discontinued operations. Unless
specifically indicated otherwise, the information in the
footnotes relates to the continuing operations of AMR.
All share and per share amounts reflect the stock split
on June 9, 1998, where appropriate. Certain amounts
from prior years have been reclassified to conform with
the 2000 presentation.
Use of Estimates The preparation of financial state-
ments in conformity with generally accepted accounting
principles requires management to make estimates and
assumptions that affect the amounts reported in the
consolidated financial statements and accompanying
notes. Actual results could differ from those estimates.
Inventories Spare parts, materials and supplies relating
to flight equipment are carried at average acquisition
cost and are expensed when incurred in operations.
Allowances for obsolescence are provided, over the
estimated useful life of the related aircraft and engines,
for spare parts expected to be on hand at the date air-
craft are retired from service, plus allowances for spare
parts currently identified as excess. These allowances
are based on management estimates, which are subject
to change.
Equipment and Property The provision for deprecia-
tion of operating equipment and property is computed
on the straight-line method applied to each unit of
property, except that major rotable parts, avionics and
assemblies are depreciated on a group basis.
The depreciable lives used for the principal depreciable
asset classifications are:
Depreciable Life
Boeing 727-200 aircraft 20031
Other American jet aircraft 20–30 yearsRegional aircraft and engines 16–20 yearsMajor rotable parts, Life of equipment to
avionics and assemblies which applicableImprovements to leased flight equipment Term of leaseBuildings and improvements 10–30 years or term
(principally on leased land) of leaseFurniture, fixtures and other equipment 3–20 yearsCapitalized software 3–10 years
1 Approximate final aircraft retirement date.
Residual values for aircraft, engines, major rotable
parts, avionics and assemblies are generally five to
10 percent, except when a guaranteed residual value
or other agreements exist to better estimate the resid-
ual value.
Effective January 1, 1999, in order to more
accurately reflect the expected useful life of its aircraft,
the Company changed its estimate of the depreciable
lives of certain aircraft types from 20 to 25 years and
increased the residual value from five to 10 percent. It
also established a 30-year life for its new Boeing 777
aircraft, first delivered in the first quarter of 1999. As
a result of this change, depreciation and amortization
expense was reduced by approximately $158 million
and net earnings were increased by approximately
$99 million, or $0.63 per common share diluted, for
the year ended December 31, 1999.
Equipment and property under capital leases are
amortized over the term of the leases or, in the case of
certain aircraft, over their expected useful lives, and
such amortization is included in depreciation and amor-
tization. Lease terms vary but are generally 10 to 25
years for aircraft and seven to 40 years for other leased
equipment and property.
Maintenance and Repair Costs Maintenance and repair
costs for owned and leased flight equipment are
charged to operating expense as incurred, except
engine overhaul costs incurred by AMR Eagle Holding
Corporation (AMR Eagle) and costs incurred for mainte-
nance and repair under power by the hour mainte-
nance contract agreements, which are accrued on the
basis of hours flown.
Intangible Assets Route acquisition costs and airport
operating and gate lease rights represent the purchase
price attributable to route authorities, airport take-off
and landing slots and airport gate leasehold rights
acquired. These assets are being amortized on a
straight-line basis over 40 years for route authorities,
primarily 25 years for airport take-off and landing
slots, and the term of the lease for airport gate lease-
hold rights.
Passenger Revenues Passenger ticket sales are ini-
tially recorded as a component of air traffic liability.
Revenue derived from ticket sales is recognized at
the time service is provided. However, due to various
factors, including the complex pricing structure and
interline agreements throughout the industry, certain
amounts are recognized in revenue using estimates
regarding both the timing of the revenue recognition
and the amount of revenue to be recognized. Actual
results could differ from those estimates.
Advertising Costs The Company expenses the costs
of advertising as incurred. Advertising expense was
$221 million, $206 million and $196 million for the
years ended December 31, 2000, 1999 and 1998,
respectively.
Frequent Flyer Program The estimated incremental
cost of providing free travel awards is accrued when
such award levels are reached. American sells mileage
credits and related services to companies participating
in its frequent flyer program. The portion of the rev-
enue related to the sale of mileage credits is deferred
and recognized over a period approximating the period
during which the mileage credits are used. The remain-
ing portion of the revenue is recognized upon receipt
as the related services have been provided.
Statements of Cash Flows Short-term investments,
without regard to remaining maturity at acquisition, are
not considered as cash equivalents for purposes of the
statements of cash flows.
Stock Options The Company accounts for its stock-
based compensation plans in accordance with Account-
ing Principles Board Opinion No. 25, “Accounting for
Stock Issued to Employees” (APB 25) and related Inter-
pretations. Under APB 25, no compensation expense
is recognized for stock option grants if the exercise
price of the Company’s stock option grants is at or
above the fair market value of the underlying stock
on the date of grant.
2. IN V E S T M E N T S
Short-term investments consisted of (in millions):
December 31,
2000 1999
Overnight investments and time deposits $ 361 $ –
Corporate and bank notes 906 1,173U.S. Government agency mortgages 442 94Asset backed securities 361 145U.S. Government agency notes – 234Other 74 60
$2,144 $ 1,706
Short-term investments at December 31, 2000, by
contractual maturity included (in millions):
Due in one year or less $ 994Due between one year and three years 1,104Due after three years 46
$2,144
All short-term investments are classified as avail-
able-for-sale and stated at fair value. Unrealized gains
and losses, net of deferred taxes, are reflected as an
adjustment to stockholders’ equity.
During 1999, the Company entered into an
agreement with priceline.com Incorporated (priceline)
whereby ticket inventory provided by the Company
may be sold through priceline’s e-commerce system. In
conjunction with this agreement, the Company received
warrants to purchase approximately 5.5 million shares
of priceline common stock. In the second quarter of
2000, the Company sold these warrants for proceeds
of approximately $94 million, and recorded a gain of
$57 million, which is included in Miscellaneous – net on
the accompanying consolidated statements of operations.
At December 31, 1998, the Company owned
approximately 3.1 million depository certificates con-
vertible, subject to certain restrictions, into the common
stock of Equant N.V. (Equant), which completed an ini-
tial public offering in July 1998. Approximately 1.7 mil-
lion of the certificates were held by the Company on
behalf of Sabre. During 1999, the Company acquired
20

21
approximately 400,000 Equant depository certificates
from other airlines. In addition, based upon a realloca-
tion between the owners of the certificates in July 1999,
the Company received an additional 2.6 million certifi-
cates, of which approximately 2.2 million certificates
were held for the benefit of Sabre. In connection with
two secondary offerings by Equant in February and
December 1999, the Company sold approximately 2.7
million depository certificates for a net gain of approxi-
mately $118 million, after taxes and minority interest.
Of this amount, approximately $75 million is included
in Miscellaneous – net and approximately $71 million,
net of taxes and minority interest, related to depository
certificates held by the Company on behalf of Sabre, is
included in income from discontinued operations on
the accompanying consolidated statements of operations.
As of December 31, 2000 and 1999, the Company
holds approximately 1.2 million depository certificates
with an estimated market value of approximately
$32 million and $136 million, respectively. The
carrying value of the Company’s investment in the
depository certificates as of December 31, 2000 and
1999, was approximately $20 million, and is included
in other assets on the accompanying consolidated bal-
ance sheets.
In December 1999, the Company entered into an
agreement to sell its investment in the cumulative
mandatorily redeemable convertible preferred stock
of Canadian Airlines International Limited (Canadian)
for approximately $40 million, resulting in a gain of
$40 million, which is included in Miscellaneous – net
on the accompanying consolidated statements of opera-
tions. In addition, the Company recognized a tax bene-
fit of $67 million resulting from the tax loss on the
investment, representing the reversal of a deferred tax
valuation allowance since it is more likely than not that
the tax benefit will be realized. The valuation allowance
was established in 1996 when the investment was writ-
ten-off because, at that time, it was not more likely than
not that the tax benefit of the write-off would be real-
ized. During 2000, the Company recorded a gain of
approximately $41 million from the recovery of start-up
expenses (previously written-off) from the Canadian
services agreement entered into during 1995, which is
included in Miscellaneous – net on the accompanying
consolidated statements of operations.
3. CO M M I T M E N T S A N D CO N T I N G E N C I E S
At December 31, 2000, the Company had commitments
to acquire the following aircraft: 66 Boeing 737-800s,
23 Boeing 757-200s, 20 Boeing 777-200ERs, 146
Embraer regional jets and 25 Bombardier CRJ-700s.
Deliveries of all aircraft extend through 2006. Future
payments for all aircraft, including the estimated
amounts for price escalation, will approximate $2.7 bil-
lion in 2001, $1.6 billion in 2002, $900 million in 2003
and an aggregate of approximately $1.3 billion in 2004
through 2006. In addition to these commitments for air-
craft, the Company’s Board of Directors has authorized
expenditures of approximately $2.8 billion over the
next five years for modifications to aircraft, renovations
of – and additions to – airport and off-airport facilities,
and the acquisition of various other equipment and
assets. AMR expects to spend approximately $855 mil-
lion of this authorized amount in 2001.
The Miami International Airport Authority is cur-
rently remediating various environmental conditions at
the Miami International Airport (the Airport) and fund-
ing the remediation costs through landing fee revenues
and other cost recovery methods. Future costs of the
remediation effort may be borne by carriers operating
at the Airport, including American, through increased
landing fees and/or other charges since certain of the
potentially responsible parties are no longer in busi-
ness. The future increase in landing fees and/or other
charges may be material but cannot be reasonably esti-
mated due to various factors, including the unknown
extent of the remedial actions that may be required, the
proportion of the cost that will ultimately be recovered
from the responsible parties, and uncertainties regard-
ing the environmental agencies that will ultimately
supervise the remedial activities and the nature of that
supervision. In addition, the Company is subject to
environmental issues at various other airport and non-
airport locations. Management believes, after consider-
ing a number of factors, that the ultimate disposition of
these environmental issues is not expected to materially
affect the Company’s consolidated financial position,
results of operations or cash flows. Amounts recorded
for environmental issues are based on the Company’s
current assessments of the ultimate outcome and,
accordingly, could increase or decrease as these
assessments change.

22
The Company has agreed to sell its McDonnell
Douglas MD-11 aircraft to FedEx Corporation (FedEx).
No significant gain or loss is expected to be recognized
as a result of this transaction. As of December 31, 2000,
the carrying value of the remaining aircraft American
has committed to sell was approximately $462 million.
AMR and American have included event risk
covenants in approximately $2.2 billion of indebted-
ness. These covenants permit the holders of such
indebtedness to receive a higher rate of return (bet-
ween 75 and 650 basis points above the stated rate)
if a designated event, as defined, should occur and the
credit rating of such indebtedness is downgraded below
certain levels within a certain period of time following
the event.
Special facility revenue bonds have been issued
by certain municipalities, primarily to purchase equip-
ment and improve airport facilities that are leased by
American. In certain cases, the bond issue proceeds
were loaned to American and are included in long-term
debt. Certain bonds have rates that are periodically
reset and are remarketed by various agents. In certain
circumstances, American may be required to purchase
up to $544 million of the special facility revenue bonds
prior to scheduled maturity, in which case American
has the right to resell the bonds or to use the bonds to
offset its lease or debt obligations. American may bor-
row the purchase price of these bonds under standby
letter of credit agreements. At American’s option, certain
letters of credit are secured by funds held by bond
trustees and by approximately $540 million of short-
term investments.
4. LE A S E S
AMR’s subsidiaries lease various types of equipment
and property, including aircraft, and airport and off-
airport facilities. The future minimum lease payments
required under capital leases, together with the present
value of such payments, and future minimum lease pay-
ments required under operating leases that have initial
or remaining non-cancelable lease terms in excess of
one year as of December 31, 2000, were (in millions):
Capital OperatingYear Ending December 31, Leases Leases
2001 $ 320 $ 9842002 276 9212003 195 9312004 246 9132005 178 9002006 and subsequent 867 11,306
2,0821 $ 15,9552
Less amount representing interest 532
Present value of net minimum lease payments $ 1,550
1 Includes $191 million guaranteed by AMR relating to special facility revenue
bonds issued by municipalities.2 Includes $6.4 billion guaranteed by AMR relating to special facility revenue
bonds issued by municipalities.
At December 31, 2000, the Company had 201 jet
aircraft and 39 turboprop aircraft under operating
leases, and 65 jet aircraft and 57 turboprop aircraft
under capital leases. The aircraft leases can generally be
renewed at rates based on fair market value at the end
of the lease term for one to five years. Most aircraft
leases have purchase options at or near the end of the
lease term at fair market value, but generally not to
exceed a stated percentage of the defined lessor’s cost
of the aircraft or at a predetermined fixed amount.
During 1996, American made prepayments on the
cancelable operating leases it had on 12 of its Boeing
767-300 aircraft. Upon the expiration of the amended
leases, American can purchase the aircraft for a nominal
amount. As a result, the aircraft were recorded as flight
equipment under capital leases. During 2000 and 1999,
the Company exercised its option to purchase six and
two of the Boeing 767-300 aircraft for a nominal fee,
respectively. As such, these aircraft were reclassified
from flight equipment under capital leases to owned
flight equipment.
Rent expense, excluding landing fees, was
$1.3 billion for 2000 and 1999, and $1.1 billion for 1998.

23
5. IN D E B T E D N E S S
Long-term debt (excluding amounts maturing within
one year) consisted of (in millions):
December 31,
2000 1999
Secured variable and fixed rate indebtednessdue through 2016 (effective rates from 6.71%–9.597% at December 31, 2000) $3,209 $ 2,556
7.875%–10.62% notes due through 2039 345 8129.0%–10.20% debentures due through 2021 332 4376.0%–7.10% bonds due through 2031 176 176Unsecured variable rate indebtedness
due through 2024 (3.55% at Decem-ber 31, 2000) 86 86
Other 3 11
Long-term debt, less current maturities $4,151 $ 4,078
Maturities of long-term debt (including sinking
fund requirements) for the next five years are: 2001 –
$569 million; 2002 – $201 million; 2003 – $169 million;
2004 – $228 million; 2005 – $482 million.
During the third quarter of 2000, the Company
repurchased prior to scheduled maturity approximately
$167 million in face value of long-term debt. Cash from
operations provided the funding for the repurchases.
These transactions resulted in an extraordinary loss of
$14 million ($9 million after-tax).
American has $1.0 billion in credit facility
agreements that expire December 15, 2005, subject
to certain conditions. At American’s option, interest
on these agreements can be calculated on one of sev-
eral different bases. For most borrowings, American
would anticipate choosing a floating rate based upon
the London Interbank Offered Rate (LIBOR). At Decem-
ber 31, 2000, no borrowings were outstanding under
these agreements.
Certain debt is secured by aircraft, engines,
equipment and other assets having a net book value
of approximately $3.4 billion. In addition, certain of
American’s debt and credit facility agreements contain
restrictive covenants, including a minimum net worth
requirement, which could limit American’s ability to
pay dividends. At December 31, 2000, under the most
restrictive provisions of those debt and credit facility
agreements, approximately $1.5 billion of the retained
earnings of American was available for payment of divi-
dends to AMR.
Cash payments for interest, net of capitalized
interest, were $301 million, $237 million and $277 mil-
lion for 2000, 1999 and 1998, respectively.
6. F I N A N C I A L IN S T R U M E N T S A N D RI S K MA N A G E M E N T
As part of the Company’s risk management program,
AMR uses a variety of financial instruments, including
interest rate swaps, fuel swap and option contracts,
and currency exchange agreements. The Company
does not hold or issue derivative financial instruments
for trading purposes.
Notional Amounts and Credit Exposures of
Derivatives The notional amounts of derivative finan-
cial instruments summarized in the tables which follow
do not represent amounts exchanged between the
parties and, therefore, are not a measure of the
Company’s exposure resulting from its use of deriva-
tives. The amounts exchanged are calculated based
on the notional amounts and other terms of the instru-
ments, which relate to interest rates, exchange rates or
other indices.
The Company is exposed to credit losses in the
event of non-performance by counterparties to these
financial instruments, but it does not expect any of the
counterparties to fail to meet its obligations. The credit
exposure related to these financial instruments is repre-
sented by the fair value of contracts with a positive fair
value at the reporting date, reduced by the effects of
master netting agreements. To manage credit risks, the
Company selects counterparties based on credit ratings,
limits its exposure to a single counterparty under
defined guidelines, and monitors the market position of
the program and its relative market position with each
counterparty. The Company also maintains industry-
standard security agreements with the majority of its
counterparties which may require the Company or the
counterparty to post collateral if the value of these
instruments falls below certain mark-to-market thresh-
olds. As of December 31, 2000, no collateral was
required under these agreements, and the Company
does not expect to post collateral in the near future.
Interest Rate Risk Management American utilizes inter-
est rate swap contracts to effectively convert a portion
of its fixed-rate obligations to floating-rate obligations.
These agreements involve the exchange of amounts
based on a floating interest rate for amounts based on
24
fixed interest rates over the life of the agreement with-
out an exchange of the notional amount upon which
the payments are based. The differential to be paid or
received as interest rates change is accrued and recog-
nized as an adjustment of interest expense related to
the obligation. The related amount payable to or receiv-
able from counterparties is included in current liabilities
or assets. The fair values of the swap agreements are
not recognized in the financial statements. Gains and
losses on terminations of interest rate swap agreements
are deferred as an adjustment to the carrying amount of
the outstanding obligation and amortized as an adjust-
ment to interest expense related to the obligation over
the remaining term of the original contract life of the
terminated swap agreement. In the event of the early
extinguishment of a designated obligation, any realized
or unrealized gain or loss from the swap would be rec-
ognized in income coincident with the extinguishment.
During 2000, the Company terminated interest rate
swap agreements on notional amounts of approximately
$425 million which had effectively converted a portion
of its fixed-rate obligations to floating-rate obligations.
The cost of terminating these interest rate swap agree-
ments was not material.
The following table indicates the notional amounts
and fair values of the Company’s interest rate swap
agreements (in millions):
December 31,
2000 1999
Notional NotionalAmount Fair Value Amount Fair Value
Interest rate swap agreements $158 $ 4 $ 696 $ (9)
The fair values represent the amount the Com-
pany would receive or pay if the agreements were ter-
minated at December 31, 2000 and 1999, respectively.
At December 31, 2000, the weighted-average
remaining life of the interest rate swap agreements in
effect was 9.7 years. The weighted-average floating
rates and fixed rates on the contracts outstanding were:
December 31,
2000 1999
Average floating rate 6.798% 5.855%Average fixed rate 6.631% 6.593%
Floating rates are based primarily on LIBOR and
may change significantly, affecting future cash flows.
Fuel Price Risk Management American enters into fuel
swap and option contracts to protect against increases
in jet fuel prices. Under the fuel swap agreements,
American receives or makes payments based on the dif-
ference between a fixed price and a variable price for
certain fuel commodities. Under the fuel option agree-
ments, American pays a premium to cap prices at a
fixed level. The changes in market value of such agree-
ments have a high correlation to the price changes of
the fuel being hedged. Effective gains or losses on fuel
hedging agreements are recognized as a component of
fuel expense when the underlying fuel being hedged is
used. Any premiums paid to enter into option contracts
are recorded as assets. Gains and losses on fuel hedg-
ing agreements would be recognized immediately
should the changes in the market value of the agree-
ments cease to have a high correlation to the price
changes of the fuel being hedged. At December 31,
2000, American had fuel hedging agreements with bro-
ker-dealers on approximately 2.3 billion gallons of fuel
products, which represented approximately 40 percent
of its expected 2001 fuel needs, approximately 15 per-
cent of its expected 2002 fuel needs, and approximately
seven percent of its expected 2003 fuel needs. The fair
value of the Company’s fuel hedging agreements at
December 31, 2000, representing the amount the
Company would receive to terminate the agreements,
totaled $223 million. At December 31, 1999, American
had fuel hedging agreements with broker-dealers on
approximately 2.0 billion gallons of fuel products,
which represents approximately 48 percent of its
expected 2000 fuel needs and approximately 10 percent
of its expected 2001 fuel needs. The fair value of the
Company’s fuel hedging agreements at December 31,
1999, representing the amount the Company would
receive to terminate the agreements, totaled $232 million.
Foreign Exchange Risk Management To hedge against
the risk of future exchange rate fluctuations on a por-
tion of American’s foreign cash flows, the Company
enters into various currency put option agreements on a
number of foreign currencies. The option contracts are

25
denominated in the same foreign currency in which the
projected foreign cash flows are expected to occur.
These contracts are designated and effective as hedges
of probable quarterly foreign cash flows for various
periods through December 31, 2001, which otherwise
would expose the Company to foreign currency risk.
Realized gains on the currency put option agreements
are recognized as a component of passenger revenues.
At December 31, 2000 and 1999, the notional amount
related to these options totaled approximately $456 mil-
lion and $445 million, respectively, and the fair value,
representing the amount AMR would receive to termi-
nate the agreements, totaled approximately $20 million
and $14 million, respectively.
The Company has entered into Japanese yen
currency exchange agreements to effectively convert
certain yen-based lease obligations into dollar-based
obligations. Changes in the value of the agreements
due to exchange rate fluctuations are offset by changes
in the value of the yen-denominated lease obligations
translated at the current exchange rate. Discounts or
premiums are accreted or amortized as an adjustment to
interest expense over the lives of the underlying lease
obligations. The related amounts due to or from coun-
terparties are included in other liabilities or other assets.
The net fair values of the Company’s yen currency
exchange agreements, representing the amount the
Company would pay or receive to terminate the agree-
ments, were (in millions):
December 31,
2000 1999
Notional Fair Notional FairAmount Value Amount Value
Japanese yen 31.0 billion $ (5) 33.6 billion $ 41
The exchange rates on the Japanese yen agree-
ments range from 66.5 to 113.5 yen per U.S. dollar.
Fair Values of Financial Instruments The fair values of
the Company’s long-term debt were estimated using
quoted market prices where available. For long-term
debt not actively traded, fair values were estimated
using discounted cash flow analyses, based on the
Company’s current incremental borrowing rates for sim-
ilar types of borrowing arrangements.
The carrying amounts and estimated fair values of the
Company’s long-term debt, including current maturities,
were (in millions):
December 31,
2000 1999
Carrying Fair Carrying FairValue Value Value Value
Secured variable and fixed rate indebtedness $ 3,366 $ 3,455 $ 2,651 $ 2,613
7.875%–10.62% notes 749 759 1,014 1,0249.0%–10.20% debentures 332 358 437 4696.0%–7.10% bonds 176 179 176 174Unsecured variable rate
indebtedness 86 86 86 86Other 11 11 16 16
$ 4,720 $ 4,848 $ 4,380 $ 4,382
All other financial instruments, except for the
investment in Equant, are either carried at fair value or
their carrying value approximates fair value.
Financial Accounting Standards Board Statement
of Financial Accounting Standards No. 133, “Accounting
for Derivative Instruments and Hedging Activities”, as
amended (SFAS 133), was adopted by the Company on
January 1, 2001. SFAS 133 requires the Company to rec-
ognize all derivatives on the balance sheet at fair value.
Derivatives that are not hedges must be adjusted to fair
value through income. If the derivative is a hedge,
depending on the nature of the hedge, changes in the
fair value of derivatives will either be offset against the
change in fair value of the hedged assets, liabilities, or
firm commitments through earnings or recognized in
other comprehensive income until the hedged item is
recognized in earnings. The ineffective portion of a
derivative’s change in fair value will be immediately
recognized in earnings. The adoption of SFAS 133 did
not have a material impact on the Company’s net earn-
ings. However, the Company recorded a transition
adjustment of approximately $100 million in accumu-
lated other comprehensive income in the first quarter
of 2001.

26
7. IN C O M E TA X E S
The significant components of the income tax provision
were (in millions):
Year Ended December 31,
2000 1999 1998
Current $ 47 $ 167 $ 451Deferred 461 183 268
$ 508 $ 350 $ 719
The income tax provision includes a federal
income tax provision of $454 million, $290 million
and $628 million and a state income tax provision of
$47 million, $49 million and $78 million for the years
ended December 31, 2000, 1999 and 1998, respectively.
The income tax provision differed from amounts
computed at the statutory federal income tax rate as fol-
lows (in millions):
Year Ended December 31,
2000 1999 1998
Statutory income tax provision $ 450 $ 352 $ 641State income tax provision,
net of federal benefit 30 32 51Meal expense 19 19 18Change in valuation allowance – (67) (4)Other, net 9 14 13
Income tax provision $ 508 $ 350 $ 719
The change in valuation allowance in 1999 relates
to the realization of a tax loss on the sale of the
Company’s investment in Canadian (see Note 2). The
change in valuation allowance in 1998 relates to the uti-
lization of foreign tax credits.
The components of AMR’s deferred tax assets and
liabilities were (in millions):
December 31,
2000 1999
Deferred tax assets:Postretirement benefits other than pensions $ 632 $ 614Rent expense 522 449Frequent flyer obligation 362 307Gains from lease transactions 225 238Alternative minimum tax credit carryforwards 184 289Other 541 520
Total deferred tax assets 2,466 2,417
Deferred tax liabilities:Accelerated depreciation and amortization (3,822) (3,381)Pensions (89) (50)Other (245) (220)
Total deferred tax liabilities (4,156) (3,651)
Net deferred tax liability $(1,690) $(1,234)
At December 31, 2000, AMR had available for fed-
eral income tax purposes approximately $184 million of
alternative minimum tax credit carryforwards which are
available for an indefinite period.
Cash payments for income taxes were $49 million,
$71 million and $408 million for 2000, 1999 and 1998,
respectively.
8. CO M M O N A N D PR E F E R R E D ST O C K
On June 9, 1998, a two-for-one stock split in the
form of a stock dividend was effective for shareholders
of record on May 26, 1998. All prior period share and
earnings per share amounts reflect the stock split. The
Company has 20 million shares of preferred stock
(without par value) authorized at December 31, 2000
and 1999.
9. ST O C K AWA R D S A N D OP T I O N S
Under the 1998 Long Term Incentive Plan, as amended,
officers and key employees of AMR and its subsidiaries
may be granted stock options, stock appreciation rights,
restricted stock, deferred stock, stock purchase rights,
other stock-based awards and/or performance-related
awards, including cash bonuses. The total number of
common shares authorized for distribution under the
1998 Long Term Incentive Plan is 23,700,000 shares.
The 1998 Long Term Incentive Plan, the successor to
the 1988 Long Term Incentive Plan, which expired
May 18, 1998, will terminate no later than May 21, 2008.
Options granted under the 1988 and 1998 Long Term
Incentive Plans (collectively, the Plans) are awarded
with an exercise price equal to the fair market value of
the stock on date of grant, become exercisable in equal
annual installments over five years following the date of
grant and expire 10 years from the date of grant. Stock
appreciation rights may be granted in tandem with
options awarded.
As a result of the Sabre spin-off in March 2000,
AMR’s stock price was adjusted from $609⁄16 to $259⁄16 by
the New York Stock Exchange. Accordingly, all out-
standing stock options and other stock-based awards,
including the related exercise prices, were adjusted to
preserve the intrinsic value of the stock options and
awards. See Note 12 for information regarding the
Sabre spin-off.
In 2000, 1999 and 1998, the total charge for
stock compensation expense included in wages, salaries
and benefits expense was $52 million, $53 million and
$52 million, respectively. No compensation expense
was recognized for stock option grants under the Plans
since the exercise price was the fair market value of the
underlying stock on the date of grant.
27
Stock option activity was:
In May 1997, in conjunction with the labor
agreement reached between American and members
of the Allied Pilots Association (APA), the Company
established the Pilots Stock Option Plan (The Pilot
Plan). The Pilot Plan granted members of the APA the
option to purchase 11.5 million shares of AMR stock
at $41.69 per share, $5 less than the average fair market
value of the stock on the date of grant, May 5, 1997.
These shares were exercisable immediately. In conjunc-
tion with the Sabre spin-off, the exercise price was
adjusted to $17.59 per share. Pilot Plan option activity was:
Year Ended December 31,
2000 1999 1998
Outstanding at January 1 5,420,028 5,791,381 7,438,220Sabre adjustment 7,421,048 – –Exercised (1,850,886) (371,353) (1,646,839)
Outstanding at December 31 10,990,190 5,420,028 5,791,381
The weighted-average grant date fair value of all
stock option awards granted during 2000, 1999 and
1998 was $16.54, $23.17 and $21.15, respectively.
Shares of deferred stock are awarded at no cost to
officers and key employees under the Plans’ Career
Equity Program and will be issued upon the individual’s
retirement from AMR or, in certain circumstances, will
vest on a pro rata basis. Deferred stock activity was:
Year Ended December 31,
2000 1999 1998
Outstanding at January 1 2,310,680 2,401,532 2,457,190Sabre adjustment 3,165,632 – –Granted – 146,200 185,812Issued (479,177) (122,042) (190,911)Canceled (40,638) (115,010) (50,559)
Outstanding at December 31 4,956,497 2,310,680 2,401,532
The weighted-average grant date fair value of
career equity awards granted during 1999 and 1998 was
$63.54 and $57.77, respectively.
Year Ended December 31,
2000 1999 1998
Weighted Weighted WeightedAverage Average AverageExercise Exercise Exercise
Options Price Options Price Options Price
Outstanding at January 1 5,219,634 $ 52.06 4,147,124 $ 46.60 3,506,774 $ 38.77Sabre adjustment 7,150,899 – – – – –Granted 6,003,111 30.21 1,539,585 63.19 1,216,720 63.01Exercised (1,557,034) 32.85 (258,875) 68.17 (470,810) 31.82Canceled (247,703) 23.38 (208,200) 49.96 (105,560) 42.34
Outstanding at December 31 16,568,907 $ 25.42 5,219,634 $ 52.06 4,147,124 $ 46.60
Exercisable options outstanding at December 31 5,334,444 $ 19.79 2,012,889 $ 40.63 1,586,974 $ 36.49
The following table summarizes information about the stock options outstanding at December 31, 2000:
Weighted Weighted WeightedNumber of Average Average Number of AverageOptions Remaining Exercise Options Exercise
Range of Exercise Prices Outstanding Life (years) Price Exercisable Price
Under $20 3,073,130 4.21 $ 14.93 2,769,990 $ 14.75$20–$30 8,113,906 8.26 24.71 1,992,625 23.62Over $30 5,381,871 9.14 32.48 571,829 30.83
16,568,907 7.79 $ 25.42 5,334,444 $ 19.79

28
A performance share plan was implemented in
1993 under the terms of which shares of deferred stock
are awarded at no cost to officers and key employees
under the Plans. The fair value of the performance
shares granted is equal to the market price of the Com-
pany’s stock at the date of grant. The shares vest over a
three-year performance period based upon certain spec-
ified financial measures of AMR. Performance share
activity was:
Year Ended December 31,
2000 1999 1998
Outstanding at January 1 1,215,644 1,565,616 1,737,274Sabre adjustment 1,665,432 – –Granted 1,277,539 509,822 644,680Issued (399,517) (208,265) (205,458)Awards settled in cash (1,200,177) (513,370) (522,234)Canceled (51,166) (138,159) (88,646)
Outstanding at December 31 2,507,755 1,215,644 1,565,616
The weighted-average grant date fair value of
performance share awards granted during 2000, 1999
and 1998 was $32.93, $62.95 and $62.06, respectively.
The Company has adopted the pro forma disclo-
sure features of Statement of Financial Accounting
Standards No. 123, “Accounting for Stock-Based
Compensation” (SFAS 123). As required by SFAS 123,
pro forma information regarding income from continu-
ing operations before extraordinary loss and earnings
per share from continuing operations before extraordi-
nary loss has been determined as if the Company had
accounted for its employee stock options and awards
granted subsequent to December 31, 1994 using the
fair value method prescribed by SFAS 123. The fair
value for the stock options was estimated at the date
of grant using a Black-Scholes option pricing model
with the following weighted-average assumptions for
2000, 1999 and 1998: risk-free interest rates ranging
from 5.01% to 6.15%; dividend yields of 0%; expected
stock volatility ranging from 29.9% to 43.5%; and
expected life of the options of 4.5 years for the Plans
and 1.5 years for The Pilot Plan.
The Black-Scholes option valuation model was
developed for use in estimating the fair value of
traded options that have no vesting restrictions and
are fully transferable. In addition, option valuation
models require the input of highly subjective assump-
tions, including the expected stock price volatility.
Because the Company’s employee stock options have
characteristics significantly different from those of
traded options, and because changes in the subjective
input assumptions can materially affect the fair value
estimate, in management’s opinion, the existing models
do not necessarily provide a reliable single measure
of the fair value of its employee stock options. In addi-
tion, because SFAS 123 is applicable only to options
and stock-based awards granted subsequent to Decem-
ber 31, 1994, its pro forma effect is not fully reflected
in years prior to 1999.
The following table shows the Company’s pro
forma income from continuing operations before
extraordinary loss and earnings per share from con-
tinuing operations before extraordinary loss assuming
the Company had accounted for its employee stock
options using the fair value method (in millions,
except per share amounts):
Year Ended December 31,
2000 1999 1998
Income from continuing operationsbefore extraordinary loss:
As reported $ 779 $ 656 $ 1,114Pro forma 772 651 1,114
Basic earnings per share from continuingoperations before extraordinary loss:
As reported $ 5.20 $ 4.30 $ 6.60Pro forma 5.15 4.27 6.60
Diluted earnings per share from continuingoperations before extraordinary loss:
As reported $ 4.81 $ 4.17 $ 6.38Pro forma 4.77 4.14 6.38
10. RE T I R E M E N T BE N E F I T S
All regular employees of the Company are eligible to
participate in pension plans. The defined benefit plans
provide benefits for participating employees based on
years of service and average compensation for a speci-
fied period of time before retirement. Airline pilots and
flight engineers also participate in defined contribution
plans for which Company contributions are determined
as a percentage of participant compensation.
In addition to pension benefits, other postretire-
ment benefits, including certain health care and life
insurance benefits, are also provided to retired employ-
ees. The amount of health care benefits is limited to
lifetime maximums as outlined in the plan. Substantially
all employees of American and employees of certain
other subsidiaries may become eligible for these bene-
fits if they satisfy eligibility requirements during their
working lives.

29
Certain employee groups make contributions
toward funding a portion of their retiree health care
benefits during their working lives. AMR funds benefits
as incurred and makes contributions to match employee
prefunding.
The following table provides a reconciliation of
the changes in the plans’ benefit obligations and fair
value of assets for the years ended December 31, 2000
and 1999, and a statement of funded status as of
December 31, 2000 and 1999 (in millions):
Pension Benefits Other Benefits
2000 1999 2000 1999
Reconciliation of benefit obligation
Obligation at January 1 $ 5,628 $ 6,117 $ 1,306 $ 1,526Service cost 213 236 43 56Interest cost 467 433 108 108Actuarial loss (gain) 499 (849) 328 (311)Plan amendments – 75 – –Benefit payments (373) (388) (77) (70)Curtailments/Special
termination benefits – 4 – (3)
Obligation at December 31 $ 6,434 $ 5,628 $ 1,708 $ 1,306
Reconciliation of fair value of plan assets
Fair value of plan assetsat January 1 $ 5,282 $ 5,564 $ 72 $ 62Actual return on plan assets 735 7 5 1Employer contributions 85 100 88 79Benefit payments (373) (388) (77) (70)Transfers 2 (1) – –
Fair value of plan assetsat December 31 $ 5,731 $ 5,282 $ 88 $ 72
Funded statusAccumulated benefit
obligation (ABO) $ 5,306 $ 4,700 $ 1,708 $ 1,306Projected benefit
obligation (PBO) 6,434 5,628 – –Fair value of assets 5,731 5,282 88 72
Funded status at December 31 (703) (346) (1,620) (1,234)Unrecognized loss (gain) 523 288 (51) (395)Unrecognized prior
service cost 129 139 (35) (40)Unrecognized transition
asset (6) (7) – –
Prepaid (accrued) benefit cost $ (57) $ 74 $(1,706) $(1,669)
At December 31, 2000 and 1999, plan assets of
approximately $88 million and $71 million, respectively,
were invested in shares of mutual funds managed by a
subsidiary of AMR.
The following tables provide the components of
net periodic benefit cost for the years ended Decem-
ber 31, 2000, 1999 and 1998 (in millions):
Pension Benefits
2000 1999 1998
Components of net periodicbenefit cost
Defined benefit plans:Service cost $ 213 $ 236 $ 213Interest cost 467 433 418Expected return on assets (490) (514) (478)Amortization of:
Transition asset (1) (4) (11)Prior service cost 10 5 4Unrecognized net loss 17 21 22
Settlement loss – – 6
Net periodic benefit cost for defined benefit plans 216 177 174
Defined contribution plans 174 155 158
Total $ 390 $ 332 $ 332
Other Benefits
2000 1999 1998
Components of net periodicbenefit cost
Service cost $ 43 $ 56 $ 52Interest cost 108 108 99Expected return on assets (7) (6) (5)Amortization of:
Prior service cost (5) (5) (5)Unrecognized net gain (14) – (2)
Net periodic benefit cost $ 125 $ 153 $ 139
The following table provides the amounts recog-
nized in the consolidated balance sheets as of Decem-
ber 31, 2000 and 1999 (in millions):
Pension Benefits Other Benefits
2000 1999 2000 1999
Prepaid benefit cost $ 107 $ 244 $ – $ –Accrued benefit liability (225) (170) (1,706) (1,669)Additional minimum liability (21) (15) – –Intangible asset 72 13 – –Accumulated other
comprehensive income 10 2 – –
Net amount recognized $ (57) $ 74 $(1,706) $(1,669)
The following assumptions were used by the
Company in the measurement of the benefit obligation
as of December 31:
Pension Benefits Other Benefits
2000 1999 2000 1999
Weighted-average assumptionsDiscount rate 7.75% 8.25% 7.75% 8.25%Salary scale 4.26 4.26 – –Expected return on plan assets 9.50 9.50 9.50 9.50

30
The assumed health care cost trend rate was
changed to seven percent, effective December 31, 2000,
decreasing gradually to an ultimate rate of four percent
by 2004. The previously assumed health care cost trend
rate was five percent in 1999, decreasing gradually to
an ultimate rate of four percent by 2001.
A one percentage point change in the assumed
health care cost trend rates would have the following
effects (in millions):
One percent One percentincrease decrease
Impact on 2000 service and interest cost $ 20 $ (19)Impact on postretirement benefit obligation
as of December 31, 2000 $ 137 $(131)
Effective January 1, 2001, American established a
defined contribution plan for non-contract employees
in which the Company will contribute a match up to
5.5 percent on employee contributions of pensionable
earnings to the Company’s existing 401(k) plan. During
2000, American provided a one-time election for current
non-contract employees to remain in the defined bene-
fit plan or discontinue accruing future credited service
in the defined benefit plan as of January 1, 2001 and
begin participation in the defined contribution plan.
11. EA R N I N G S PE R SH A R E
The following table sets forth the computation of basic
and diluted earnings per share (in millions, except per
share amounts):
Year Ended December 31,
2000 1999 1998
Numerator:Numerator for earnings per share –
income from continuing operationsbefore extraordinary loss $ 779 $ 656 $ 1,114
Denominator:Denominator for basic earnings per
share – weighted-average shares 150 152 169Effect of dilutive securities:
Employee options and shares 27 12 13Assumed treasury shares purchased (15) (7) (7)
Dilutive potential common shares 12 5 6Denominator for diluted earnings per
share – adjusted weighted-averageshares 162 157 175
Basic earnings per share from continuingoperations before extraordinary loss $ 5.20 $ 4.30 $ 6.60
Diluted earnings per share from continuing operations beforeextraordinary loss $ 4.81 $ 4.17 $ 6.38
12. D I S C O N T I N U E D OP E R AT I O N S
During the first quarter of 1999, the Company sold
AMR Services, AMR Combs and TeleService Resources.
As a result of these sales, the Company recorded a gain
of approximately $64 million, net of income taxes of
approximately $19 million.
On February 7, 2000, the Company declared its
intent to distribute AMR’s entire ownership interest in
Sabre as a dividend on all outstanding shares of its
common stock. To effect the dividend, AMR exchanged
all of its 107,374,000 shares of Sabre’s Class B common
stock for an equal number of shares of Sabre’s Class A
common stock. Effective after the close of business on
March 15, 2000, AMR distributed 0.722652 shares of
Sabre Class A common stock for each share of AMR
stock owned by AMR’s shareholders. The record date
for the dividend of Sabre stock was the close of busi-
ness on March 1, 2000. In addition, on February 18,
2000, Sabre paid a special one-time cash dividend of
$675 million to shareholders of record of Sabre com-
mon stock at the close of business on February 15,
2000. Based upon its approximate 83 percent interest
in Sabre, AMR received approximately $559 million of
this dividend. The dividend of AMR’s entire ownership
interest in Sabre’s common stock resulted in a reduc-
tion to AMR’s retained earnings in March of 2000
equal to the carrying value of the Company’s invest-
ment in Sabre on March 15, 2000, which approximated
$581 million. The fair market value of AMR’s investment
in Sabre on March 15, 2000, based upon the quoted
market closing price of Sabre Class A common stock
on the New York Stock Exchange, was approximately
$5.2 billion. In addition, effective March 15, 2000, the
Company reduced the exercise price and increased
the number of employee stock options and awards
by approximately 19 million to offset the dilution to
the holders, which occurred as a result of the spin-off.
These changes were made to keep the holders in the
same economic position as before the spin-off. This
dilution adjustment was determined in accordance
with Emerging Issues Task Force Consensus No. 90-9,
“Changes to Fixed Employee Stock Option Plans as
a Result of Equity Restructuring”, and had no impact
on earnings.

31
The results of operations for Sabre, AMR Services,
AMR Combs and TeleService Resources have been
reflected in the consolidated statements of operations
as discontinued operations. Summarized financial
information of the discontinued operations is as follows
(in millions):
Year Ended December 31,
2000 1999 1998
SabreRevenues $ 542 $ 2,435 $ 2,306Minority interest 10 57 40Income taxes 36 196 140Net income 43 265 192
AMR Services, AMR Combs and TeleService Resources
Revenues $ – $ 97 $ 513Income taxes – – 7Net income – – 8
The historical assets and liabilities of Sabre, AMR
Services, AMR Combs and TeleService Resources at
December 31, 1999, which have been reflected on a net
basis in other assets on the consolidated balance sheets,
are summarized as follows (in millions):
Current assets $ 976Total assets 1,951Current liabilities 525Total liabilities, including minority interest 912Net assets of discontinued operations 1,039
13. SE G M E N T RE P O RT I N G
Statement of Financial Accounting Standards No. 131,
“Disclosures about Segments of an Enterprise and
Related Information”, as amended (SFAS 131), requires
that a public company report annual and interim finan-
cial and descriptive information about its reportable
operating segments. Operating segments, as defined,
are components of an enterprise about which separate
financial information is available that is evaluated regu-
larly by the chief operating decision maker in deciding
how to allocate resources and in assessing performance.
The Company has two primary operating seg-
ments, consisting primarily of American and AMR Eagle,
which represent one reportable segment. American is
one of the largest scheduled passenger airlines in the
world. At the end of 2000, American provided sched-
uled jet service to more than 169 destinations through-
out North America, the Caribbean, Latin America,
Europe and the Pacific. American is also one of the
largest scheduled air freight carriers in the world,
providing a full range of freight and mail services to
shippers throughout its system. AMR Eagle owns two
regional airlines which do business as “American Eagle”
– American Eagle Airlines, Inc. and Executive Airlines,
Inc. The American Eagle carriers provide connecting
service from eight of American’s high-traffic cities to
smaller markets throughout the United States, Canada,
the Bahamas and the Caribbean.
Revenues from other segments are below the
quantitative threshold for determining reportable seg-
ments and consist primarily of revenues from AMR
Investment Services, Inc., Americas Ground Services
and Airline Management Services. The difference
between the financial information of the Company’s
one reportable segment and the financial information
included in the consolidated statements of operations
and balance sheets as a result of these entities is
not material.
The Company’s operating revenues by geographic
region are summarized below (in millions):
Year Ended December 31,
2000 1999 1998
Domestic $13,881 $ 12,563 $ 12,262Latin America 2,907 2,697 2,830Europe 2,338 1,984 2,039Pacific 577 486 385
Total consolidated revenues $19,703 $ 17,730 $ 17,516
The Company attributes operating revenues by
geographic region based upon the origin and destina-
tion of each flight segment. The Company’s tangible
assets consist primarily of flight equipment which is
mobile across geographic markets and, therefore, has
not been allocated.

32
14. QU A RT E R LY FI N A N C I A L DATA (UN A U D I T E D)
Unaudited summarized financial data by quarter for 2000 and 1999 (in millions, except per share amounts):
First Second Third FourthQuarter Quarter Quarter Quarter
2000
Operating revenues $ 4,577 $ 5,011 $ 5,256 $ 4,859Operating income 212 517 572 80Income from continuing operations
before extraordinary loss 89 321 322 47Net earnings 132 321 313 47Earnings per share:
BasicFrom continuing operations
before extraordinary loss 0.60 2.15 2.14 0.31Net earnings 0.89 2.15 2.08 0.31
DilutedFrom continuing operations
before extraordinary loss 0.57 1.96 1.96 0.29Net earnings 0.86 1.96 1.91 0.29
1999
Operating revenues $ 4,007 $ 4,541 $ 4,695 $ 4,487Operating income 46 414 426 270Income from continuing operations 17 216 213 210Net earnings 158 268 279 280Earnings per share:
BasicFrom continuing operations 0.11 1.41 1.42 1.42Net earnings 0.99 1.76 1.86 1.89
DilutedFrom continuing operations 0.11 1.36 1.38 1.37Net earnings 0.96 1.70 1.76 1.84
During the second quarter of 2000, the Company
recorded an after-tax gain of approximately $36 million
from the sale of the Company’s warrants to purchase
5.5 million shares of priceline common stock (see Note
2). During the third quarter of 2000, the Company
recorded a $9 million after-tax extraordinary loss on the
repurchase prior to scheduled maturity of long-term
debt (see Note 5). Results for the fourth quarter of 2000
include an after-tax gain of approximately $26 million
for the recovery of start-up expenses related to the
Canadian services agreement (see Note 2) and an after-
tax charge of approximately $35 million for the Com-
pany’s employee home computer program.
During the first quarter of 1999, the Company
recorded an after-tax gain of approximately $64 million
from the sale of AMR Services, AMR Combs and Tele-
Service Resources, and a $37 million after-tax gain from
the sale of a portion of the Company’s holdings in
Equant, of which approximately $18 million is recorded
in income from discontinued operations (see Note 2).
Results for the fourth quarter of 1999 include the
following: (i) a $25 million after-tax gain related to the
Company’s sale of its investment in the preferred stock
of Canadian and a $67 million tax benefit resulting from
the tax loss on the Company’s investment in Canadian
(see Note 2), (ii) an after-tax gain of approximately
$81 million related to the sale of a portion of the
Company’s holdings in Equant, of which approximately
$53 million is recorded in income from discontinued
operations (see Note 2), (iii) a $28 million after-tax
increase in passenger revenue resulting from a change
in estimate related to certain passenger revenues earned
during the first nine months of 1999, and (iv) a $25 mil-
lion after-tax provision for certain litigation settlements.

33
15. SU B S E Q U E N T EV E N T S
On January 10, 2001, the Company announced three
transactions that are expected to substantially increase
the scope of its existing network. First, the Company
has announced that it had agreed to purchase substan-
tially all of the assets of Trans World Airlines, Inc.
(TWA) for approximately $500 million in cash and to
assume approximately $3.5 billion of TWA’s obligations.
The Company’s agreement with TWA contemplated that
TWA would file for bankruptcy protection under Chap-
ter 11 of the U.S. Bankruptcy Code and conduct an
auction of its assets under the auspices of the Bank-
ruptcy Court. During the auction, other credible offers
would compete with the Company’s offer. TWA filed for
bankruptcy protection on January 10, 2001. In conjunc-
tion therewith, the Company also agreed to provide
TWA with up to $200 million in debtor-in-possession
financing to facilitate TWA’s ability to maintain its oper-
ations until the completion of this transaction. The
amount available under this facility was later increased
to $330 million. As of March 19, 2001, approximately
$289 million had been provided via the debtor-in-pos-
session financing.
The auction of TWA’s assets was commenced on
March 5, 2001, and recessed to March 7, 2001. During
the recess, the Company increased its cash bid to $625
million and agreed to leave in the TWA estate certain
aircraft security deposits, advance rental payments and
rental rebates that were estimated to bring approxi-
mately $117 million of value to TWA. On March 7,
2001, TWA’s board selected the Company’s bid as the
“highest and best” offer, and on March 12, 2001, the
U.S. Bankruptcy Court, District of Delaware, entered an
order approving the sale of TWA’s assets to the Com-
pany. Consummation of the transaction is subject to
several contingencies, including the waiver by TWA’s
unions of certain provisions of their collective bargain-
ing agreements. The approval of the U.S. Department of
Justice was obtained on March 16, 2001. Certain parties
have filed appeals of the Bankruptcy Court’s sale order,
and have sought a stay of the transaction, pending the
appeals. A provision of the Bankruptcy Code will per-
mit the Company to close the transaction, despite pend-
ing appeals, unless a stay is granted. If a stay is
granted, the Company would anticipate that the appeal
process would be expedited. Upon the closing of the
transaction, TWA will be integrated into American’s
operations with a continued hub operation in St. Louis.
Secondly, the Company announced that it has
agreed to acquire from United Airlines, Inc. (United)
certain key strategic assets (slots, gates and aircraft) of
US Airways, Inc. (US Airways) upon the consummation
of the previously announced merger between United
and US Airways. In addition to the acquisition of these
assets, American will lease a number of slots and gates
from United so that American may operate half of the
northeast Shuttle (New York/Washington DC/Boston).
United will operate the other half of the Shuttle. For
these assets, American will pay approximately $1.2 bil-
lion in cash to United and assume approximately $300
million in aircraft operating leases. The consummation
of these transactions is contingent upon the closing of
the proposed United/US Airways merger. Also, the
acquisition of aircraft is generally dependent upon a
certain number of US Airways’ Boeing 757 cockpit crew
members transferring to American’s payroll.
Finally, American has agreed to acquire a 49 per-
cent stake in, and to enter into an exclusive marketing
agreement with, DC Air LLC (DC Air). American has
agreed to pay $82 million in cash for its ownership
stake. American will have a right of first refusal on the
acquisition of the remaining 51 percent stake in DC Air.
American will also lease to DC Air a certain number of
Fokker 100 aircraft with necessary crews (known in the
industry as a “wet lease”). These wet leased aircraft will
be used by DC Air in its operations. DC Air is the first
significant new entrant at Ronald Reagan Washington
National Airport (DCA) in over a decade. DC Air will
acquire the assets needed to begin its DCA operations
from United/US Airways upon the consummation of the
merger between the two carriers. American’s investment
in DC Air and the other arrangements described above
are contingent upon the consummation of the merger
between United and US Airways.
As a result of the above transactions, and for sev-
eral other reasons, American and American Eagle have
initiated an impairment review of certain fleet types in
accordance with Statement of Financial Accounting
Standards No. 121, “Accounting for the Impairment of
Long-Lived Assets and for Long-Lived Assets to Be Dis-
posed Of.” This review could result in an impairment
charge to be taken by the Company in 2001. The size
of any resulting 2001 charge is not presently known,
but may be significant.

34
TH E BO A R D O F DI R E C T O R S A N D ST O C K H O L D E R S
AMR CO R P O R AT I O N
We have audited the accompanying consolidated bal-
ance sheets of AMR Corporation as of December 31,
2000 and 1999, and the related consolidated state-
ments of operations, stockholders’ equity, and cash
flows for each of the three years in the period ended
December 31, 2000. These financial statements are
the responsibility of the Company’s management.
Our responsibility is to express an opinion on these
financial statements based on our audits.
We conducted our audits in accordance with
auditing standards generally accepted in the United
States. Those standards require that we plan and
perform the audit to obtain reasonable assurance
about whether the financial statements are free of
material misstatement. An audit includes examining,
on a test basis, evidence supporting the amounts and
disclosures in the financial statements. An audit also
includes assessing the accounting principles used and
significant estimates made by management, as well as
evaluating the overall financial statement presentation.
We believe that our audits provide a reasonable basis
for our opinion.
In our opinion, the financial statements referred to
above present fairly, in all material respects, the consol-
idated financial position of AMR Corporation at
December 31, 2000 and 1999, and the consolidated
results of its operations and its cash flows for each of
the three years in the period ended December 31, 2000,
in conformity with accounting principles generally
accepted in the United States.
2121 San Jacinto
Dallas, Texas 75201
January 16, 2001, except for
Note 15, for which the
date is March 19, 2001.
RE P O RT O F IN D E P E N D E N T AU D I T O R S

35
The management of AMR Corporation is responsible for
the integrity and objectivity of the Company’s financial
statements and related information. The financial state-
ments have been prepared in conformity with account-
ing principles generally accepted in the United States
and reflect certain estimates and judgments of manage-
ment as to matters set forth therein.
AMR maintains a system of internal controls
designed to provide reasonable assurance, at reasonable
cost, that its financial records can be relied upon in the
preparation of financial statements and that its assets
are safeguarded against loss or unauthorized use. An
important element of the Company’s control systems
is the ongoing program to promote control conscious-
ness throughout the organization. Management’s com-
mitment to the program is evidenced by organizational
arrangements that provide for divisions of responsibility,
effective communication of policies and procedures,
selection of competent financial managers and develop-
ment and maintenance of financial planning and report-
ing systems.
Management continually monitors the system for
compliance. AMR maintains a strong internal auditing
program that independently assesses the effectiveness
of the internal controls and recommends possible
improvements. Ernst & Young, independent auditors, is
engaged to audit the Company’s financial statements.
Ernst & Young obtains and maintains an understanding
of the internal control structure and conducts such tests
and other auditing procedures considered necessary in
the circumstances to render the opinion on the financial
statements contained in their report.
The Audit Committee of the Board of Directors,
composed entirely of independent directors, meets reg-
ularly with the independent auditors, management and
internal auditors to review their work and confirm that
they are properly discharging their responsibilities. In
addition, the independent auditors and the internal
auditors meet periodically with the Audit Committee,
without the presence of management, to discuss the
results of their work and other relevant matters.
Donald J. Carty
Chairman, President and
Chief Executive Officer
Thomas W. Horton
Senior Vice President and
Chief Financial Officer
RE P O RT O F MA N A G E M E N T

36
EL E V E N YE A R CO M PA R AT I V E SU M M A RY
(in millions, except share and per share amounts) 2000 1999 1998*
Total operating revenues $ 19,703 17,730 17,516
Total operating expenses $ 18,322 16,574 15,528
Operating income (loss) $ 1,381 1,156 1,988
Earnings (loss) from continuing operations before
extraordinary loss and cumulative effect of accounting changes $ 779 656 1,114
Net earnings (loss) $ 813 985 1,314
Earnings (loss) per common share from continuing operations
before extraordinary loss and cumulative effect of accounting changes:2
Basic $ 5.20 4.30 6.60
Diluted $ 4.81 4.17 6.38
Net earnings (loss) per common share:2
Basic $ 5.43 6.46 7.78
Diluted $ 5.03 6.26 7.52
Total assets $ 26,213 24,374 21,455
Long-term debt, less current maturities $ 4,151 4,078 2,436
Obligations under capital leases, less current obligations $ 1,323 1,611 1,764
Convertible preferred stock, common stock and other stockholders’ equity1 $ 7,176 6,858 6,698
Common shares outstanding at year-end (in thousands)2 152,100 148,250 161,300
Book value per common share2 $ 47.18 46.26 41.53
Preferred shares outstanding at year-end:
Convertible preferred stock – – –
* The results for 1998 and 1997 have been restated for discontinued operations.
1 No dividends have been paid on common stock for any period presented.2 All share and earnings per share amounts prior to 1998 have been restated to give effect to the stock split on June 9, 1998.

37
1997* 1996 1995 1994 1993 1992 1991 1990
16,957 17,364 16,910 16,137 15,816 14,396 12,887 11,720
15,362 15,557 15,895 15,131 15,126 14,421 12,882 11,596
1,595 1,807 1,015 1,006 690 (25) 5 124
809 1,083 191 228 (96) (475) (240) (40)
985 1,016 162 228 (110) (935) (240) (40)
4.54 6.29 1.25 2.26 (1.02) (3.17) (1.77) (0.32)
4.43 5.95 1.24 2.25 (1.02) (3.17) (1.77) (0.32)
5.52 5.90 1.06 2.26 (1.12) (6.24) (1.77) (0.32)
5.39 5.59 1.05 2.25 (1.12) (6.24) (1.77) (0.32)
20,287 20,451 19,556 19,486 19,326 18,706 16,208 13,354
2,248 2,737 4,983 5,603 5,431 5,643 3,951 1,674
1,629 1,790 2,069 2,275 2,123 2,195 1,928 1,598
6,216 5,668 3,720 3,380 4,276 3,349 3,794 3,727
173,200 182,000 152,800 151,800 151,536 150,812 136,726 124,622
35.89 31.14 23.83 21.75 21.08 22.20 27.75 29.91
– – 159,000 159,000 2,200,000 – – –

38
BO A R D O F DI R E C T O R S
David L. BorenPresidentUniversity of Oklahoma(Educational Institution)Norman, OklahomaElected in 1994
Edward A. BrennanRetired Chairman, President and Chief Executive OfficerSears, Roebuck and Co. (Merchandising)Chicago, IllinoisElected in 1987
Donald J. CartyChairman, President and Chief Executive OfficerAMR Corporation/American Airlines, Inc.(Air Transportation)Fort Worth, Texas Elected in 1998
Armando M. CodinaChairman and Chief Executive OfficerCodina Group, Inc.(Real Estate Investments, Development and Construction, Property Management and Brokerage Services)Coral Gables, FloridaElected in 1995
Earl G. GravesChairman and Chief Executive OfficerEarl G. Graves, Limited(Communications and Publishing)Publisher and Chief Executive OfficerBlack Enterprise MagazineGeneral Partner BlackEnterprise/Greenwich Street Corporate Growth Partners, L.P.New York, New YorkElected in 1995
Ann McLaughlin KorologosChairman EmeritusThe Aspen Institute(Educational and Public Policy Organization)Aspen, ColoradoElected in 1990
Michael A. MilesSpecial Limited PartnerForstmann Little & Co.(Investment Banking)Lake Forest, IllinoisElected in 2000
Charles H. Pistor, Jr.Retired Vice ChairSouthern Methodist University(Educational Institution)Dallas, TexasElected in 1982
Philip J. PurcellChairman and Chief Executive OfficerMorgan Stanley Dean Witter & Co.(Financial Services)New York, New YorkElected in 2000
Joe M. RodgersChairmanThe JMR Group(Investment Company)Nashville, TennesseeElected in 1989
Judith RodinPresidentUniversity of Pennsylvania(Educational Institution)Philadelphia, PennsylvaniaElected in 1997
BO A R D CO M M I T T E E S
EXECUTIVE COMMITTEE
Donald J. Carty, ChairmanDavid L. BorenEarl G. GravesMichael A. MilesPhilip J. Purcell
AUDIT COMMITTEE
Ann McLaughlin Korologos, ChairmanArmando M. CodinaCharles H. Pistor, Jr.Joe M. RodgersJudith Rodin
COMPENSATION/NOMINATING COMMITTEE
Edward A. Brennan, ChairmanArmando M. CodinaMichael A. MilesCharles H. Pistor, Jr.Joe M. RodgersJudith Rodin
GOVERNANCE COMMITTEE
Edward A. Brennan, ChairmanDavid L. BorenEarl G. GravesAnn McLaughlin KorologosPhilip J. Purcell
There is an Executive Committee of American
Airlines Board of Directors which is identical to
the AMR Executive Committee.
BO A R D O F DI R E C T O R S

39
AM E R I C A N AI R L I N E S , IN C .
Donald J. Carty*Chairman, President and Chief Executive Officer
Robert W. Baker*Vice Chairman
Gerard J. Arpey*Executive Vice President –Operations
Daniel P. Garton*Executive Vice President –Customer Service
Michael W. Gunn*Executive Vice President –Marketing and Planning
Peter J. DolaraSenior Vice President –Miami, Caribbean and Latin America
Monte E. FordSenior Vice President –Information Technology and Chief Information Officer
Thomas W. Horton*Senior Vice President –Finance and Chief Financial Officer
Dan P. HuffmanSenior Vice President –Maintenance and Engineering
Henry C. JoynerSenior Vice President –Planning
Anne H. McNamara*Senior Vice President and General Counsel
Susan M. OliverSenior Vice President –Human Resources
William K. Ris, Jr.Senior Vice President –Government Affairs
Timothy J. AhernVice President –Safety, Security and Environmental
Jane G. AllenVice President –Flight Service
A. Jaynne AllisonVice President –Human Resources
Walter J. AueVice President –Capacity Planning
James A. BeerVice President –Corporate Development and Treasurer
David R. BrooksPresident –American Airlines Cargo Division
Jeffrey J. BrundageVice President –Employee Relations
David L. CampbellVice President –Alliance Base Maintenance
Jeffrey C. CampbellVice President –Europe
John A. CarpenterVice President –Corporate Affairs
William CulhaneVice President –Maintenance and Engineering Negotiations
Lauri L. CurtisVice President –Reservations/Travel Centers/Ticket Delivery Service
C. David CushVice President –International Planning and Alliances
Thomas R. Del ValleVice President –Customer Service
Bernard J. DeSenaVice President –Chicago
Timothy J. DokeVice President –Corporate Communications
Bella D. GorenVice President –Customer Service Planning
William T. GreeneVice President –Finance and Planning for Maintenance and Engineering
Gregory F. HallVice President –Line Maintenance
Douglas G. HerringVice President and Controller
Gary F. KennedyVice President –Corporate Real Estate
Craig S. KreegerVice President and General Sales Manager
Robert P. KudwaVice President –Flight
Dennis LeBrightVice President –Miami
John R. MacLeanVice President –Purchasing
Charles D. MarLett*Corporate Secretary
Scott D. NasonVice President –Research and Analysis
Robert E. OlsonVice President –Revenue Management
Randy H. PhillipsVice President –Engineering and QualityAssurance
Ralph L. RichardiVice President –Operations Planning and Performance
Carmine J. RomanoVice President –Tulsa Base Maintenance
John R. SamuelVice President –e-Business
Peggy E. SterlingVice President –Dallas/Fort Worth
Arthur J. TornoVice President –Caribbean and Latin America Operations
AMERICAN EAGLE AIRLINES, INC.
Peter M. BowlerPresident
Thomas F. BaconSenior Vice President –Marketing and Planning
Robert W. RedingChief Operations Officer
Carolyn E. WrightSenior Vice President –Customer Service
AADVANTAGE MARKETING
PROGRAMS DIVISION
Bruce T. ChemelPresident
AMR INVESTMENT
SERVICES, INC.
William F. QuinnPresident
MA N A G E M E N T – DI V I S I O N S A N D SU B I S D I A R I E S
* Also AMR Corporation Officers

40
ST O C K EX C H A N G E S
The AMR Corporation Trading Symbol is AMR. The common stock of AMR Corporation is listed for trading on the New York Stock Exchange. The common stock is also traded unlisted on the Pacific Stock Exchange.
FO R M 10-K
A copy of the AMR Corporation Annual Report to the Securities and Exchange Commission for 2000 (Form 10-K) will be furnished without charge upon written request to:
Corporate SecretaryAMR CorporationMail Drop 5675P.O. Box 619616Dallas/Fort Worth Airport, TX 75261-9616
CO M M O N ST O C K
Transfer Agent & RegistrarFirst Chicago Trust Co., A Division of EquiserveP.O. Box 2500Jersey City, NJ 07303-2500(201) 324-1225
ME D I U M TE R M NO T E S
TrusteesThe Bank of New York101 Barclay StreetNew York, NY 10286
Citibank, N.A.111 Wall StreetNew York, NY 10043
Paying AgentsChase Manhattan BankCorporate Trust Securities WindowRoom 234 – North Building55 Water StreetNew York, NY 10041
Citibank, N.A.111 Wall StreetNew York, NY 10043
9%, 9.88% A N D 10.20% DE B E N T U R E S
Trustee & Paying AgentThe Bank of New York101 Barclay StreetNew York, NY 10286
9 1⁄2% NO T E S A N D 9 3⁄4%, 9 .8% A N D
10% DE B E N T U R E S A N D 7.875% PU B L I C IN C O M E NO TES
Trustee & Paying AgentCitibank, N.A.111 Wall StreetNew York, NY 10043
9% DE B E N T U R E S
Trustee & Paying AgentU.S. Bank Trust, N.A.100 Wall Street, Suite 1600New York, NY 10005
PR I N C I PA L OF F I C E S
AMR CorporationMail Drop 5675P.O. Box 619616Dallas/Fort Worth Airport, TX 75261-9616(817) 963-1234
CO R P O R AT E IN F O R M AT I O N

Common Stock*High Low
2000**
1st Quarter $ 67 3⁄8 $ 30
2nd Quarter 37 7⁄8 26 7⁄16
3rd Quarter 34 11⁄16 26 1⁄8
4th Quarter 39 3⁄16 27 15⁄16
1999
1st Quarter $ 71 7⁄16 $ 53 3⁄16
2nd Quarter 74 5⁄16 60 9⁄16
3rd Quarter 72 3⁄4 52 13⁄16
4th Quarter 68 1⁄2 53 9⁄16
* No dividends were paid during the periods.
** Effective after the close of business on March 15, 2000, AMR distributed 0.722652 shares of Sabre Holdings Corporation (Sabre) Class A common stock for each share of AMR stock owned by AMR’s shareholders. As a result ofthe dividend, AMR’s stock price was adjusted from $60 9⁄16 to $25 9⁄16 by the New York Stock Exchange after the marketclose on March 15, 2000 to exclude the value of Sabre. The pre-March 15, 2000 stock prices in the above table havenot been adjusted to give effect to this distribution.
Shareholders can also visit AMR’s Internet site on the World Wide Web at www.amrcorp.com to
receive financial and other company information, or to request a printed copy of financial materials.
Additionally, shareholders in the United States, Canada and most of the Caribbean can call
(800) AMR-6177 to hear the most recent quarterly results or request a printed copy of financial
materials. Shareholders residing in other areas should call (402) 573-9855.
2001 quarterly results will be released on the following dates with the shareholder information line
and Web site updated shortly thereafter:
First Quarter: April 18, 2001
Second Quarter: July 18, 2001
Third Quarter: October 17, 2001
Fourth Quarter: January 16, 2002
MA R K E T PR I C E A N D DI V I D E N D S

AMR CORPORATION
P.O. BO X 619616, DA L L A S /FO RT WO RT H, TE X A S 75261-9616
TH E AM E R I C A N AI R L I N E S IN T E R N E T A D D R E S S I S W W W.A A.C O M
TH E AMR IN T E R N E T A D D R E S S I S W W W.A M R C O R P.C O M