aa - south florida water management district
TRANSCRIPT
2012 LEC Water Supply Plan Update | 1
AA DDeemmaanndd
PPrroojjeeccttiioonnss
The South Florida Water Management District (SFWMD)
completes the complex process of water demand
projection in coordination with staff from local
governments, utilities, other agencies and stakeholder
groups. This appendix provides the methods and detailed
water demand projections developed for this plan update.
This appendix presents water demand assessments for the
following six water use categories:
Public Water Supply (PWS)
Domestic Self-Supply (DSS)
Agricultural (AGR) Self-Supply
Industrial/Commercial/Institutional (ICI) Self-Supply
Recreational/Landscape (REC) Self-Supply
Power Generation (PWR) Self-Supply
The PWS category encompasses potable water supplied by water treatment facilities with
average production rates greater than 0.1 million gallons per day (MGD). Within the Lower
East Coast (LEC) Planning Area, there are 52 PWS utilities. The PWS systems, both public
and private, supply potable water to all types of customers for all types of land uses. Within
the PWS category, net demand refers to finished water demand and is measured by the
amount of water leaving a treatment facility.
The remaining five water use categories are self-supplied. DSS includes utilities whose
average flow is less than 0.1 MGD and households whose source of potable water is a single
private well. AGR Self-Supply includes water demand for crop irrigation. ICI Self-Supply
refers to self-supplied business operations and institutional operations such as schools and
hospitals. REC Self-Supply includes irrigation demand for large landscaped areas such as
community and homeowner association common grounds, ball fields, parks, cemeteries,
and golf courses. The PWR Self-Supply category is water used at power plants primarily for
cooling purposes.
N O T E
Perceived discrepancies in table totals are due to rounding.

2 | Appendix A: Demand Projections
Demand for each water use category in this update is calculated in two ways: gross and net
demand. Gross water demand, also known as raw water demand, is the volume of water
withdrawn from the natural system that has been allocated in a CUP. Gross demand
includes the water needed for all consumptive uses as well as the water lost to treatment
transmission and system inefficiencies. Net water demand, commonly referred to as
finished water demand, is the volume of water needed to meet the actual consumption
demand of end users.
REMAINING DATA SOURCES AND METHODS
In general, the preparation of water demand estimates and projections are highly
dependent on population and land use activities information. For example, estimates of
irrigated acreages are fundamental to projecting water supply demand for the AGR Self-
Supply category, while information about existing and future projections of population are
key to estimating reasonable PWS water demand.
In order to meet the planning goal, the water supply needs of existing and future
reasonable-beneficial uses are based on meeting those needs in a 1-in-10 year drought
event (Paragraph 373.709(2)(a)1, Florida Statutes [F.S.]). Water demand base year
estimates for 2010 and projections through 2030 in five-year increments for average
rainfall conditions and 1-in-10 year drought conditions are provided in this appendix. Data
sources for each category may include the Florida 2010 Census of Population and Housing
(U.S. Census Bureau 2010), municipal planning documents, PWS utility information,
Consumptive Use Permitting files, and federal and state agency reports. Specific data set
sources, analysis methods, and applications for projections are provided within this
appendix by use category.
PUBLIC WATER SUPPLY AND DOMESTIC SELF-SUPPLY
The following sections describe the methodology used to estimate and project population,
PWS and DSS water use categories’ raw and finished water demands for Palm Beach,
Broward, Miami-Dade, Monroe, and Hendry counties. Monroe County’s water supply needs
are met solely by PWS, while the water needs of the portion of Hendry County within the
LEC Planning Area are met solely by DSS.
Population Projection Methodology
Population projections form the initial and key step in developing demand projections,
especially for the PWS and DSS water use categories.

2012 LEC Water Supply Plan Update | 3
2010 Population Estimates
An important element of water supply planning is to use the best available data to estimate
future populations. The projections used in this plan update are believed to represent a
reasonable balance of long- and short-term factors affecting the development of the LEC
Planning Area. However, there is always uncertainty in 20-year population projections as
growth patterns within the area could change significantly. Factors such as global and local
economic trends, housing demand, migration and immigration patterns, and cultural shifts
all have an effect on populations within a county and state.
The base year for this update is 2010. The 2010 Census count of total population as
reported by the United States Census Bureau is the basis for the 2010 population estimates
as reported by the University of Florida’s Bureau of Economic and Business Research
(BEBR). The 2010 BEBR estimates for permanent resident population (BEBR 2011) are the
basis for estimating 2030 populations for each county in the LEC Planning Area. Table A-1
provides BEBR population projections for the low, medium, and high ranges for 2015–2040
for the LEC Planning Area. The 2010 population estimates for each of the LEC Planning Area
counties are as follows:
Palm Beach County: 1,340,134 residents
Broward County: 1,748,066 residents
Miami-Dade County: 2,496,435 residents
Monroe County: 73,090 residents
Only a portion of Hendry County is included in the LEC Planning Area. Therefore the BEBR
projections for the entire county are not applicable. The 2010 population for Hendry County
relies upon the estimate in the 2005–2006 Lower East Coast Water Supply Plan Update
(2005–2006 LEC Plan; SFWMD 2006), which was 1,279 people.
Table A-1. BEBR population projections for the LEC Planning Area for 2010–2040.
Projections
2015 2020 2025 2030 2035 2040
Palm Beach County
Low 1,342,600 1,367,700 1,383,900 1,389,700 1,384,900 1,370,900
Medium 1,394,300 1,482,900 1,568,500 1,648,000 1,720,000 1,786,000
High 1,454,500 1,605,600 1,761,400 1,919,200 2,077,300 2,236,700
Broward County
Low 1,736,800 1,726,300 1,710,600 1,689,000 1,661,600 1,632,900
Medium 1,788,200 1,834,500 1,877,700 1,916,200 1,949,700 1,982,500
High 1,844,200 1,946,700 2,048,900 2,149,600 2,248,100 2,349,700
Miami-Dade County
Low 2,528,700 2,564,400 2,590,900 2,606,400 2,610,300 2,604,100
Medium 2,600,900 2,722,900 2,841,400 2,952,800 3,055,100 3,150,200
High 2,685,100 2,891,800 3,103,400 3,317,200 3,531,500 3,747,400
Monroe County
Medium 72,200 71,200 70,200 69,300 68,500 67,700

4 | Appendix A: Demand Projections
2010 Public Water Supply Utility Service Areas
After county populations were established, maps of areas served by each PWS utility were
developed using data from the SFWMD Water Use Regulatory Database, water supply
facility work plans, the 2005–2006 LEC Plan Update, and maps from the counties and PWS
utilities. These maps show the areas currently served by the utilities. Service area maps
were then verified by the PWS utilities during follow-up meetings and correspondences
with planning, operations, and geographic information system (GIS) staff. Information
supplied by the PWS utilities was especially important to identify current and future areas
served. In many instances, there are differences between areas actually served and
franchised or legislated service areas. The focus on areas served by PWS utilities improves
the accuracy of distributing county base populations into PWS and DSS populations. Maps of
these service areas are provided in Appendix F. Expanded future service areas were
addressed in the population projections.
The populations residing outside of areas served by PWS utilities were included in DSS
population estimates, because United States Census data no longer include the sources of
water for households including those using individual wells. For this plan update, it was
assumed that all populations outside PWS service areas had self-supplied potable water.
A few utilities, most notably the Town of Jupiter and Village of Tequesta in Palm Beach
County, serve a small portion of Martin County’s population, which is in the Upper East
Coast Planning Area. To provide the best population served estimates, these populations are
included in the populations served by utilities in Palm Beach County in this plan update. In
addition, some residents in far western Palm Beach County and the portion of Hendry
County within the LEC Planning Area are served by Clewiston Public Utilities (formerly
served by U.S. Sugar) and are included in the 2012 Lower West Coast Water Supply Plan
Update (SFWMD 2012b). Lastly, the remaining population in eastern Hendry County in the
LEC Planning Area not served by the Clewiston Public Utility is self-supplied, therefore no
demand for PWS will be reported for Hendry County in this plan.
Distribution of Census Block Data across 2010 PWS Utility Service Areas
The 2010 population reported by the United States Census Bureau (2010) was distributed
into each PWS utility service area (Table A-2) by using census block data, which captures
population in relatively small geographic areas (bounded by streets and prominent physical
features) as the basic unit for analysis. Seasonal residents, prison inmates, migrant workers,
and tourists were not included in permanent population estimates provided by the 2010
Census count.

2012 LEC Water Supply Plan Update | 5
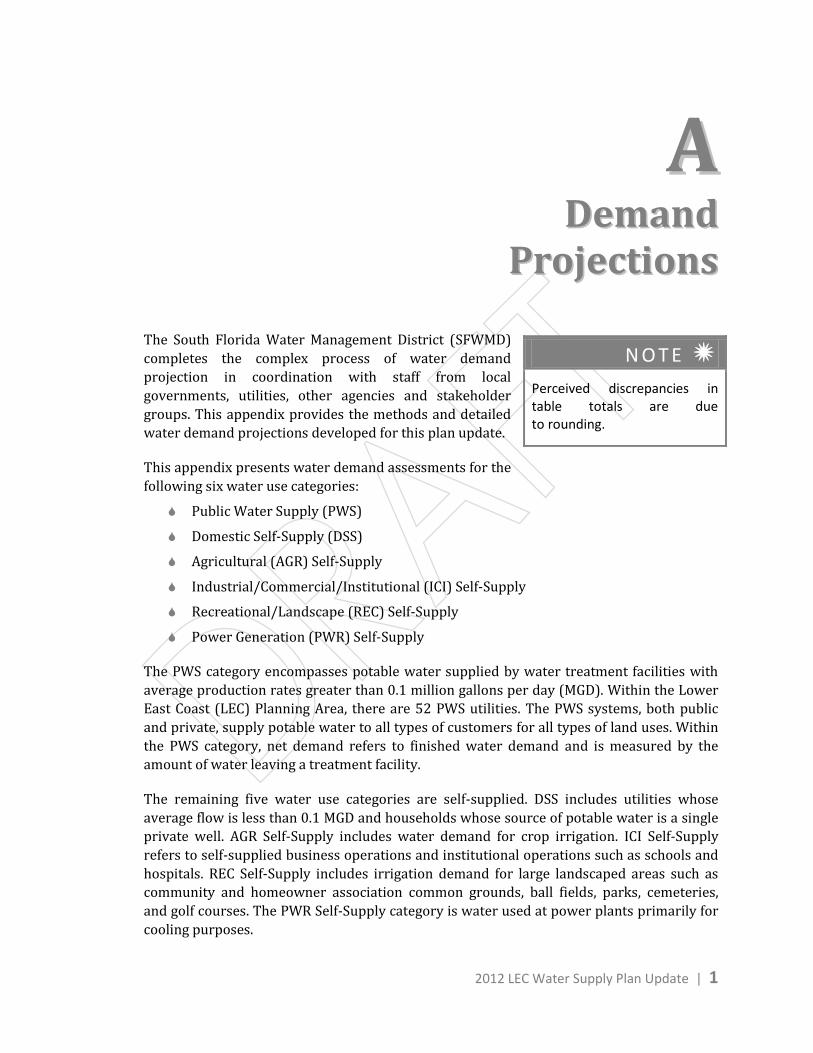
Table A-2. 2010 LEC Planning Area permanent resident population estimates.
County PWS Utility or DSS 2010 Population
Palm Beach
Palm Beach County PWS Utilities
A.G. Holley State Hospital 32
Boca Raton, City of 107,224
Boynton Beach, City of 102,512
Delray Beach Water and Sewer Department, City of 63,341
Glades Utility Authority 25,051
Golf, Village of 2,755
Highland Beach, Town of 3,631
Jupiter, Town of 70,840
Lake Worth Utilities, City of 45,137
Lantana, Town of 10,348
Manalapan, Town of 2,421
Mangonia Park, Town of 1,888
Maralago Cay 1,008
Palm Beach County Water Utilities Department 468,417
Palm Springs, Village of 45,204
Riviera Beach, City of 37,757
Seacoast Utility Authority 87,686
Tequesta, Village of 11,581
Wellington Public Utilities Department 55,408
West Palm Beach Public Utilities, City of 109,301
Palm Beach County PWS Total 1,251,542
Palm Beach County DSS Total 68,592
Palm Beach County Total 1,320,134
Broward
Broward County PWS Utilities
Broward County Water & Wastewater Services 182,334
Cooper City Utility Department, City of 28,543
Coral Springs, City of 58,029
Coral Springs Improvement District 36,969
Dania Beach, City of 14,840
Davie, Town of 27,548
Deerfield Beach, City of 51,842
Fort Lauderdale, City of 212,945
Hallandale Beach, City of 37,113
Hillsboro Beach, Town of 1,875
Hollywood, City of 186,798
Lauderhill, City of 58,114
6 | Appendix A: Demand Projections
Table A-2. Continued.
County PWS Utility or DSS 2010 Population
Broward
(continued)
Margate, City of 58,314
Miramar, City of 116,715
North Lauderdale, City of 32,994
North Springs Improvement District 34,895
Parkland Utilities, Inc. 2,161
Pembroke Pines, City of 152,002
Plantation, City of 91,812
Pompano Beach, City of 79,917
Royal Utility Company 3,234
Seminole Tribe of Florida Utility 1,368
Sunrise, City of 211,403
Tamarac, City of 56,064
Tindall Hammock Irrigation and Soil Conservation District 2,639
Broward County PWS Total 1,740,468
Broward County DSS 7,598
Broward County Total 1,748,066
Miami-Dade
Miami-Dade County PWS Utilities
Americana Village 1,582
Florida City Water and Sewer Department 11,230
Homestead, City of 65,679
Miami-Dade Water & Sewer Department 2,141,885
North Miami, City of 90,397
North Miami Beach, City of 161,968
Miami-Dade County PWS Total 2,472,741
Miami-Dade County DSS Total 23,694
Miami-Dade County Total 2,496,435
Monroe
Monroe County PWS Utility
Florida Keys Aqueduct Authority 73,090
Monroe County PWS Total 73,090
Monroe County DSS Total N/A
Monroe County Total 73,090
Hendry
Hendry County PWS N/A
Hendry County DSS 1,279
Hendry County Total 1,279
LEC Planning Area Total 5,639,004
2012 LEC Water Supply Plan Update | 7
To determine the census blocks within the area served by each PWS utility, the geographic
areas represented by census blocks and PWS utility service areas were input as polygon
layers into the SFWMD GIS and overlaid. The imagery or latest available one-foot natural
color aerial photography was used as a background and assisted the geographer in
allocating census blocks to appropriate PWS service areas. The latest photography available
was from 2009 for Palm Beach, Broward, and Miami-Dade counties. 2011 imagery was
available for portions of rural Palm Beach County. When more current photography was not
available, the one-meter natural color aerial photography from the United States Geological
Survey (USGS) 2004–2005 digital ortho quarter quads was used. After allocating census
blocks, population was then calculated for each PWS area served and for DSS users.
2030 County Populations
To prepare population projections, 2030 populations needed to be developed for each
county within the LEC Planning Area. Paragraph 373.709(2)(a)1, F.S., prescribes the use of
population projections in determining needs in regional water supply plans:
Population projections used for determining public water supply needs must be based upon the best available data. In determining best available data, the district shall consider the University of Florida’s Bureau of Economic and Business Research (BEBR) medium population projections and any population projection data and analysis submitted by a local government pursuant to the public workshop described in subsection (1) if the data and analysis support the local government’s comprehensive plan. Any adjustment of or deviation from the BEBR projections must be fully described, and the original BEBR data must be presented along with the adjusted data.
To project population for 2030, the BEBR population medium growth forecasts reported for
2010 (BEBR 2011) for each county were used (Table A-1). Additional sources of population
information from LEC county governments or PWS utilities not accounted for in the BEBR
medium projections were identified. Where population projection data captured higher
population counts for 2030 than medium BEBR, projections were adjusted upwards, if
appropriate and consistent with local water supply planning programs.
2030 PWS Utility Service Areas
The 2010 PWS utility service areas were updated to include proposed changes from 2010 to
2030. Sources of information included CUPs and modifications, and discussions and
correspondence with PWS utility staff. Very few utility service area boundaries are expected
to change over the next 20 years.
Distribution of Census Block Data across 2030 PWS Utility Service Area
To determine the 2030 permanent resident population estimates, the PWS utility service
area portion (percentage) of the total county 2010 Census population estimate was

8 | Appendix A: Demand Projections
multiplied by the 2030 medium population projection. Planned changes to utility service
areas were compared to census blocks and adjusted as needed.
Five-Year Incremental Projections
For the required five-year incremental projections within the 20-year planning horizon of
this plan update, census block data from the 2010 Census count (U.S. Census Bureau 2010)
were used as the principal means of distributing 2030 county control populations to the
various PWS future service areas within the LEC Planning Area counties. Five-year
incremental population projections for each PWS utility are based upon a linear
interpolation of the change in population from the 2010 estimates to 2030
adjusted projections.
For example, a PWS service area with a 2010 population estimate of 10,000 people and a
projected growth rate of 25 percent would have a 2030 population projection of 12,500
people (Table A-3). Linear interpolation of the change in population is calculated as 25
percent divided by four five-year intervals or a 6.25 percent increase every five years.
Table A-3. Example of five-year incremental projections applied to a PWS service area.
Year 2010 2015 2020 2025 2030
Population 10,000 10,625 11,250 11,875 12,500
The medium BEBR growth rate was selected as the most appropriate means to distribute
population growth to the required five-year periods for each PWS utility. For the complete
five-year incremental population numbers, see Table A-7 below.
Water Demand Projection Methodology
Historical PWS Utility Raw Water Withdrawal and Finished Treated Water Data
Both raw water withdrawn for PWS and finished treated water produced for PWS are
calculated. This approach captures situations when gross and net demands differ, and
independently verifies efficiency. For example, urban demand for finished treated water
may be met with brackish water sources found in the Floridan aquifer. Because of losses
incurred during treatment processes, raw water withdrawals from brackish water sources
are typically 20–25 percent greater compared to the same volume of finished water from
freshwater sources.
To determine historical withdrawals by all PWS utilities in the LEC Planning Area, raw
water withdrawal data were obtained from the SFWMD Water Use Regulatory Database for
2010. This includes raw water withdrawn from the Surficial Aquifer System (SAS), including
the Biscayne aquifer and Floridan aquifer. Surface water withdrawal data from Clear Lake

2012 LEC Water Supply Plan Update | 9
by the City of West Palm Beach were also gathered and incorporated into the historical
withdrawal information.
To gather the finished treated water produced by PWS, data was extracted from the 2010
Florida Department of Environmental Protection (FDEP) monthly operating reports
available from the FDEP compliance reports website, which is at
http://www.dep.state.fl.us/water/drinkingwater/flow.htm. Five years of data were
analyzed to understand trends in water use. Factors reflected in this data include the
economic downturn, water shortages, empty housing stock, and implementation of year-
round irrigation rules. Analysis concluded that 2010 most fairly represents the historical
use trend that will continue into the future.
As with the draft PWS service area maps and populations, each utility and local government
within the LEC Planning Area was provided with the 2010 estimates and projections for the
PWS and DSS categories produced by the methods described below. In several cases, the
utilities were able to provide input on their respective demands and projections that
resulted in adjustments to the estimated demand. Many of these data exchanges took place
during follow-up meetings, telephone conferences, and email correspondences. Revisions
resulting from this coordination comprise the final projections published in this update.
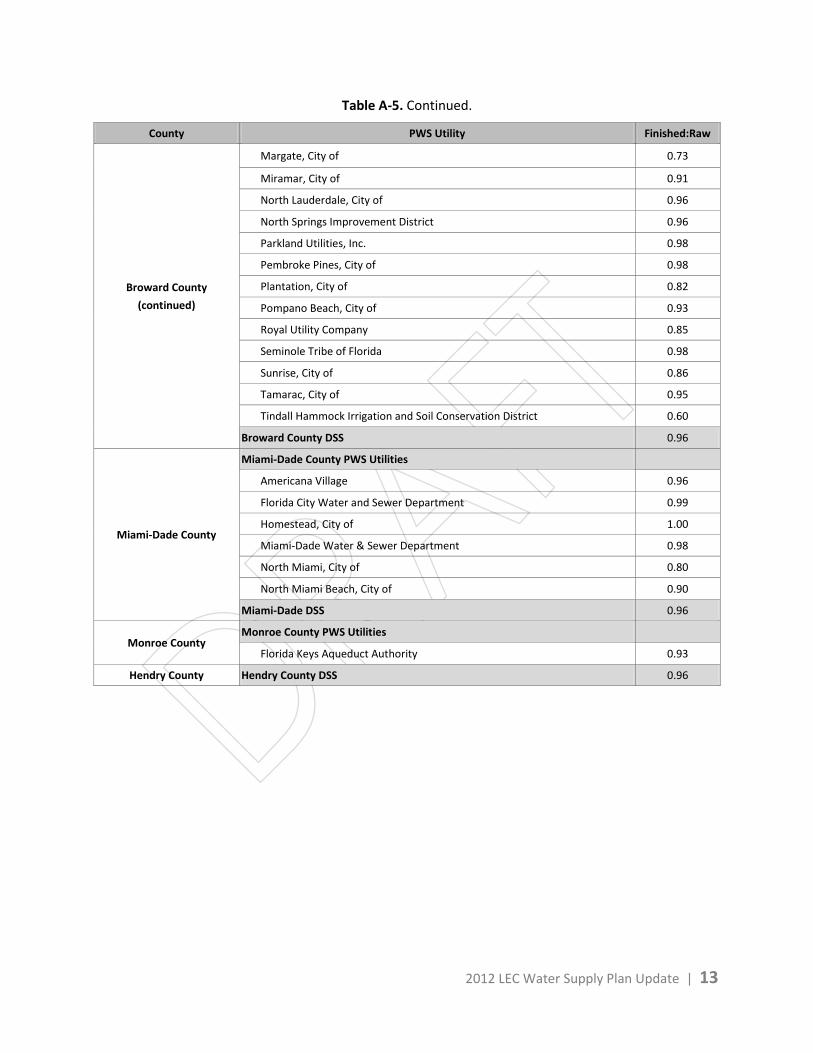
Finished and Raw Water Demand Projections
For each PWS utility, 2010 raw water withdrawals were compared to the 2010 FDEP data
(http://www.dep.state.fl.us/water/drinkingwater/flow.htm) for finished water production
to calculate the raw to finished water ratio for each LEC PWS utility (Table A-4). These
factors give a basis to compare and contrast PWS and can be applied for other types of
analyses to convert from finished water production to raw water withdrawals. However, a
more useful statistic is finished to raw, which describes the efficiency of the various
treatment trains employed by the PWS (Table A-5). For DSS, the finished to raw ratio is
assumed to be 0.96.
Per Capita Use Rate
The planning PCUR expresses the total annual finished water used in 2010 divided by the
permanent population in 2010. This method incorporates the finished water supplied by
the PWS utility and consumed by seasonal residents and tourists, PWS utility supplied for
industrial, commercial, and institutional use, and the losses incurred in water delivery.
Irrigation demand for PWS-served households that do not use PWS for irrigation was not
assessed due to the lack of available data. The planning PCURs for DSS within each county
were assumed to be the same as for the countywide PWS utility average. Table A-6
provides PCURs for 2010.
Each utility may have specific demographics, seasonality, and distribution characteristics
that may be analyzed in detail to better quantify PCURs of specific user categories.
A more localized, in-depth analysis of use may be used to focus water conservation efforts

10 | Appendix A: Demand Projections
and assist in determining water use permit allocations. Therefore, the PCURs were part of
the information provided to utilities for review.
Table A-4. Raw to finished water ratio for each PWS utility.
County PWS Utility/DSS Raw:Finished
Palm Beach County
Palm Beach County PWS Utilities
A.G. Holley State Hospital 1.17
Boca Raton, City of 1.23
Boynton Beach, City of 1.06
Delray Beach Water and Sewer Department, City of 1.04
Glades Utility Authority 1.35
Golf, Village of 1.28
Highland Beach, Town of 1.52
Jupiter, Town of 1.25
Lake Worth Utilities, City of 1.07
Lantana, Town of 1.00
Manalapan, Town of 1.25
Mangonia Park, Town of 1.00
Maralago Cay 1.04
Palm Beach County Water Utilities Department 1.14
Palm Springs, Village of 1.05
Riviera Beach, City of 1.01
Seacoast Utility Authority 1.03
Tequesta, Village of 1.23
Wellington Public Utilities Department 1.16
West Palm Beach Public Utilities, City of 1.00
Palm Beach County DSS 1.04
Broward County
Broward County PWS Utilities
Broward County Water & Wastewater Services 1.09
Cooper City Utility Department, City of 1.27
Coral Springs, City of 1.05
Coral Springs Improvement District 1.14
Dania Beach, City of 1.06
Davie, Town of 1.02
Deerfield Beach, City of 1.02
Fort Lauderdale, City of 1.11
Hallandale Beach, City of 1.02
Hillsboro Beach, Town of 1.16
Hillsboro Beach, Town of 1.16
Hollywood, City of 1.16
Lauderhill, City of 1.04

2012 LEC Water Supply Plan Update | 11
Table A-4. Continued.
County PWS Utility Raw:Finished
Broward County
(continued)
Margate, City of 1.37
Miramar, City of 1.10
North Lauderdale, City of 1.04
North Springs Improvement District 1.04
Parkland Utilities, Inc. 1.02
Pembroke Pines, City of 1.02
Plantation, City of 1.21
Pompano Beach, City of 1.07
Royal Utility Company 1.18
Seminole Tribe of Florida 1.02
Sunrise, City of 1.16
Tamarac, City of 1.05
Tindall Hammock Irrigation and Soil Conservation District 1.66
Broward County DSS 1.04
Miami-Dade County
Miami-Dade County PWS Utilities
Americana Village 1.04
Florida City Water and Sewer Department 1.01
Homestead, City of 1.00
Miami-Dade Water & Sewer Department 1.02
North Miami, City of 1.26
North Miami Beach, City of 1.12
Miami-Dade DSS 1.04
Monroe County Monroe County PWS Utilities
Florida Keys Aqueduct Authority 1.07
Hendry County Hendry County DSS 1.04

12 | Appendix A: Demand Projections
Table A-5. Finished to raw water ratio for each PWS utility.
County PWS Utility Finished:Raw
Palm Beach County
Palm Beach County PWS Utilities
A.G. Holley State Hospital 0.85
Boca Raton, City of 0.81
Boynton Beach, City of 0.94
Delray Beach Water and Sewer Department, City of 0.96
Glades Utility Authority 0.74
Golf, Village of 0.78
Highland Beach, Town of 0.66
Jupiter, Town of 0.80
Lake Worth Utilities, City of 0.93
Lantana, Town of 1.00
Manalapan, Town of 0.80
Mangonia Park, Town of 1.00
Maralago Cay 0.97
Palm Beach County Water Utilities Department 0.88
Palm Springs, Village of 0.95
Riviera Beach, City of 0.99
Seacoast Utility Authority 0.97
Tequesta, Village of 0.81
Wellington Public Utilities Department 0.86
West Palm Beach Public Utilities, City of 1.00
Palm Beach County DSS 0.96
Broward County
Broward County PWS Utilities
Broward County Water & Wastewater Services 0.92
Cooper City Utility Department, City of 0.78
Coral Springs, City of 0.95
Coral Springs Improvement District 0.88
Dania Beach, City of 0.95
Davie, Town of 0.98
Deerfield Beach, City of 0.98
Fort Lauderdale, City of 0.90
Hallandale Beach, City of 0.98
Hillsboro Beach, Town of 0.87
Hollywood, City of 0.86
Lauderhill, City of 0.96
2012 LEC Water Supply Plan Update | 13
Table A-5. Continued.
County PWS Utility Finished:Raw
Broward County
(continued)
Margate, City of 0.73
Miramar, City of 0.91
North Lauderdale, City of 0.96
North Springs Improvement District 0.96
Parkland Utilities, Inc. 0.98
Pembroke Pines, City of 0.98
Plantation, City of 0.82
Pompano Beach, City of 0.93
Royal Utility Company 0.85
Seminole Tribe of Florida 0.98
Sunrise, City of 0.86
Tamarac, City of 0.95
Tindall Hammock Irrigation and Soil Conservation District 0.60
Broward County DSS 0.96
Miami-Dade County
Miami-Dade County PWS Utilities
Americana Village 0.96
Florida City Water and Sewer Department 0.99
Homestead, City of 1.00
Miami-Dade Water & Sewer Department 0.98
North Miami, City of 0.80
North Miami Beach, City of 0.90
Miami-Dade DSS 0.96
Monroe County Monroe County PWS Utilities
Florida Keys Aqueduct Authority 0.93
Hendry County Hendry County DSS 0.96

14 | Appendix A: Demand Projections
Table A-6. Per capita use rate for 2010.
County PWS Utility 2010 PCUR
Palm Beach County
Palm Beach County PWS Utilities
A.G. Holley State Hospital
Boca Raton, City of 320
Boynton Beach, City of 131
Delray Beach Water and Sewer Department, City of 232
Glades Utility Authority 195
Golf, Village of 145
Highland Beach, Town of 372
Jupiter, Town of 188
Lake Worth Utilities, City of 98
Lantana, Town of 171
Manalapan, Town of 440
Mangonia Park, Town of 168
Maralago Cay 182
Palm Beach County Water Utilities Department 111
Palm Springs, Village of 84
Riviera Beach, City of 173
Seacoast Utility Authority 201
Tequesta, Village of 235
Wellington Public Utilities Department 105
West Palm Beach Public Utilities, City of 255
Palm Beach County PWS Average 165
Palm Beach County DSS 156
Palm Beach County Average 165
Broward County
Broward County PWS Utilities
Broward County Water & Wastewater Services 106
Cooper City Utility Department, City of 95
Coral Springs, City of 114
Coral Springs Improvement District 103
Dania Beach, City of 154
Davie, Town of 146
Deerfield Beach, City of 191
Fort Lauderdale, City of 190
Hallandale Beach, City of 146
Hillsboro Beach, Town of 351
Hollywood, City of 111
Lauderhill, City of 95

2012 LEC Water Supply Plan Update | 15
Table A-6. Continued.
County PWS Utility 2010 PCUR
Broward County
(continued)
Margate, City of 98
Miramar, City of 97
North Lauderdale, City of 76
North Springs Improvement District 124
Parkland Utilities, Inc. 113
Pembroke Pines, City of 78
Plantation, City of 127
Pompano Beach, City of 170
Royal Utility Company 98
Seminole Tribe of Florida 810
Sunrise, City of 116
Tamarac, City of 105
Tindall Hammock Irrigation and Soil Conservation District 158
Broward County PWS Average 123
Broward County DSS 123
Broward County Average 123
Miami-Dade County
Miami-Dade County PWS Utilities
Americana Village 138
Florida City Water and Sewer Department 156
Homestead, City of 157
Miami-Dade Water & Sewer Department 141
North Miami, City of 117
North Miami Beach, City of 125
Miami-Dade PWS Average 140
Miami-Dade DSS 138
Miami-Dade County Average 140
Monroe County
Monroe County PWS Utilities
Florida Keys Aqueduct Authority 225
PWS Average 225
Monroe County Average 225
Hendry County Hendry County DSS 1,094
Hendry County Average 1,094
LEC Planning Area PWS Average 104

16 | Appendix A: Demand Projections
2030 Projected Raw and Finished Demand
For each PWS utility, 2030 finished (net) water demand was calculated by multiplying the
2030 permanent population for each PWS utility by the PCUR for 2010. This conservative
assumption reflects the expectation that PCUR will remain constant over the next 20 years.
Several utilities do expect declines in PCUR based on implementation of conservation and
reuse projects replacing demand for treated finished water and requested lower future
PCURs. To determine raw water demand for average conditions for each PWS utility,
finished water projections were multiplied by the raw to finished percent in Table A-4 to
calculate raw (gross) water demand.
Average Rainfall and 1–and–10 year Drought Conditions
Finally, average rainfall conditions for net and gross water projections were modified to
calculate 1-in-10 year drought condition demand. A 1-in-10 year drought is defined by
diminished rain and increased evapotranspiration (ET) relative to the historical record for a
particular location from Tables V-2-1, V-2-3, V-2-5, and V-2-7 in the Districtwide Water
Supply Assessment (SFWMD 1998). The effect of 1-in-10 year drought conditions is expected
to increase demand in each county as follows:
Palm Beach County: 1.109
Broward County: 1.101
Miami-Dade County: 1.087
Monroe County: 1.031
Hendry County: 1.049
Projection Results
Table A-7 provides PWS utility and DSS five-year incremental population projections for
the LEC Planning Area. Table A-8 presents finished (net) water demand under average
rainfall conditions, while Table A-9 provides the finished water needs under 1-in-10 year
drought conditions. In the same manner, Table A-10 presents estimated gross (raw) water
withdrawals under average rainfall conditions, while Table A-11 provides gross water
withdrawals under 1-in-10 year drought conditions.

2012 LEC Water Supply Plan Update | 17
Table A-7. PWS and DSS population projections for the LEC Planning Area.
County PWS Utility or DSS
Population Projections
2010 2015 2020 2025 2030
Palm Beach
Palm Beach County PWS Utilities
A.G. Holley State Hospital 32 34 36 38 40
Boca Raton, City of 107,224 113,881 120,539 127,196 133,854
Boynton Beach, City of 102,512 108,877 115,242 121,607 127,972
Delray Beach Water and Sewer Department, City of
63,341 67,274 71,207 75,139 79,072
Glades Utility Authority 25,051 26,607 28,164 29,720 31,276
Golf, Village of 2,755 2,926 3,097 3,268 3,439
Highland Beach, Town of 3,631 3,856 4,082 4,307 4,533
Jupiter, Town of 70,840 78,532 86,224 93,916 101,608
Lake Worth Utilities, City of 45,137 47,940 50,742 53,545 56,347
Lantana, Town of 10,348 10,991 11,633 12,276 12,918
Manalapan, Town of 2,421 2,571 2,722 2,872 3,022
Mangonia Park, Town of 1,888 2,005 2,122 2,240 2,357
Maralago Cay 1,008 1,071 1,133 1,196 1,258
Palm Beach County Water Utilities Department
468,417 497,518 526,618 555,719 584,819
Palm Springs, Village of 45,204 48,011 50,817 53,624 56,431
Riviera Beach, City of 37,757 40,101 42,446 44,790 47,134
Seacoast Utility Authority 87,686 93,130 98,575 104,019 109,464
Tequesta, Village of 11,581 12,463 13,345 14,226 15,108
Wellington Public Utilities Department 55,408 58,848 62,289 65,729 69,169
West Palm Beach Public Utilities, City of 109,301 116,087 122,874 129,660 136,447
Palm Beach County PWS Total 1,251,542 1,332,723 1,413,907 1,495,087 1,576,268
Palm Beach County DSS Total 68,592 69,264 70,087 70,909 71,732
Palm Beach County Total 1,320,134 1,401,987 1,483,994 1,565,996 1,648,000
Broward
Broward County PWS Utilities
Broward County Water & Wastewater Services
182,334 187,250 192,166 197,082 201,997
Cooper City Utility Department, City of 28,543 29,229 29,916 30,602 31,288
Coral Springs, City of 58,029 59,424 60,820 62,215 63,610
Coral Springs Improvement District 36,969 37,858 38,747 39,636 40,525
Dania Beach, City of 14,840 15,197 15,554 15,911 16,267
Davie, Town of 27,548 43,434 59,320 75,205 91,091
Deerfield Beach, City of 51,842 53,089 54,335 55,582 56,828
Fort Lauderdale, City of 212,945 217,995 223,045 228,095 233,145
Hallandale Beach, City of 37,113 38,005 38,898 39,790 40,683
Hillsboro Beach, Town of 1,875 1,920 1,965 2,010 2,055
Hollywood, City of 186,798 192,679 198,559 204,440 210,320
Lauderhill, City of 58,114 59,511 60,909 62,306 63,704

18 | Appendix A: Demand Projections
Table A-7. Continued.
County PWS Utility or DSS
Population Projections
2010 2015 2020 2025 2030
Broward (cont.)
Margate, City of 58,314 59,716 61,118 62,521 63,923
Miramar, City of 116,715 120,970 125,225 129,479 133,734
North Lauderdale, City of 32,994 33,787 34,581 35,374 36,167
North Springs Improvement District 34,895 35,734 36,573 37,412 38,251
Parkland Utilities, Inc. 2,161 2,213 2,265 2,317 2,369
Pembroke Pines, City of 152,002 155,657 159,312 162,967 166,622
Plantation, City of 91,812 94,703 97,595 100,486 103,377
Pompano Beach, City of 79,917 81,841 83,765 85,689 87,613
Royal Utility Company 3,234 3,312 3,390 3,467 3,545
Seminole Tribe of Florida Utility 1,368 1,401 1,434 1,467 1,500
Sunrise, City of 211,403 216,486 221,570 226,653 231,736
Tamarac, City of 56,064 57,412 58,760 60,108 61,456
Tindall Hammock Irrigation and Soil Conservation District
2,639 2,702 2,766 2,829 2,893
Broward County PWS Total 1,740,468 1,801,525 1,862,588 1,923,643 1,984,701
Broward County DSS Total 7,598 7,781 7,963 8,146 8,329
Broward County Total 1,748,066 1,809,306 1,870,551 1,931,789 1,993,030
Miami-Dade
Miami-Dade County PWS Utilities
Americana Village 1,582 1,654 1,727 1,799 1,871
Florida City Water and Sewer Department 11,230 11,743 12,256 12,770 13,283
Homestead, City of 65,679 68,681 71,682 74,684 77,686
Miami-Dade Water & Sewer Department 2,141,885 2,239,773 2,337,660 2,435,548 2,533,436
North Miami, City of 90,397 94,528 98,660 102,791 106,922
North Miami Beach, City of 161,968 169,370 176,772 184,175 191,577
Miami-Dade County PWS Total 2,472,741 2,585,749 2,698,757 2,811,767 2,924,775
Miami-Dade County DSS Total 23,694 24,777 25,860 26,943 28,025
Miami-Dade County Total 2,496,435 2,610,526 2,724,617 2,838,710 2,952,800
Monroe
Monroe County PWS Utility
Florida Keys Aqueduct Authority 73,090 72,143 71,195 70,248 69,300
Monroe County PWS Total 73,090 72,143 71,195 70,248 69,300
Monroe County DSS Total 0 0 0 0 0
Monroe County Total 73,090 72,143 71,195 70,248 69,300
Hendry County PWS Total 0 0 0 0 0
Hendry Hendry County DSS Total 1,279 1,320 1,360 1,401 1,441
Hendry County Total 1,279 1,320 1,360 1,401 1,441
LEC Planning Area PWS Total 5,537,841 5,792,140 6,046,447 6,300,745 6,555,042
LEC Planning Area DSS Total 101,163 103,142 105,270 107,399 109,527
LEC Planning Area Total 5,639,004 5,895,282 6,151,717 6,408,144 6,664,571

2012 LEC Water Supply Plan Update | 19
Table A-8. Finished (net) water demand projections for PWS and DSS under average rainfall
conditions in the LEC Planning Area.
County PWS Utility or DSS
Finished (Net) Water Demand Projections –
Average Rainfall Conditions (MGD)
2010 2015 2020 2025 2030
Palm Beach
Palm Beach County PWS Utilities
A.G. Holley State Hospital 0.07 0.08 0.08 0.09 0.09
Boca Raton, City of 34.31 36.44 38.57 40.70 42.83
Boynton Beach, City of 13.43 14.26 15.10 15.93 16.76
Delray Beach Water and Sewer Department, City of
14.70 15.61 16.52 17.43 18.34
Glades Utility Authority 4.88 5.19 5.49 5.80 6.10
Golf, Village of 0.40 0.42 0.45 0.47 0.50
Highland Beach, Town of 1.35 1.43 1.52 1.60 1.69
Jupiter, Town of 13.32 14.76 16.21 17.66 19.10
Lake Worth Utilities, City of 4.42 4.70 4.97 5.25 5.52
Lantana, Town of 1.77 1.88 1.99 2.10 2.21
Manalapan, Town of 1.07 1.13 1.20 1.26 1.33
Mangonia Park, Town of 0.32 0.34 0.36 0.38 0.40
Maralago Cay 0.18 0.19 0.21 0.22 0.23
Palm Beach County Water Utilities Department 51.99 55.22 58.45 61.68 64.91
Palm Springs, Village of 3.80 4.03 4.27 4.50 4.74
Riviera Beach, City of 6.53 6.94 7.34 7.75 8.15
Seacoast Utility Authority 17.62 18.72 19.81 20.91 22.00
Tequesta, Village of 2.72 2.93 3.14 3.34 3.55
Wellington Public Utilities Department 5.82 6.18 6.54 6.90 7.26
West Palm Beach Public Utilities, City of 27.87 29.60 31.33 33.06 34.79
Palm Beach County PWS Total 206.57 220.05 233.55 247.03 260.50
Palm Beach County DSS Total 10.71 10.84 10.97 11.10 11.23
Palm Beach County Total 217.28 230.89 244.52 258.13 271.73
Broward
Broward County PWS Utilities
Broward County Water & Wastewater Services 19.25 19.86 20.47 21.09 21.70
Cooper City Utility Department, City of 2.71 2.78 2.84 2.91 2.97
Coral Springs, City of 6.62 6.77 6.93 7.09 7.25
Coral Springs Improvement District 3.81 3.90 3.99 4.08 4.17
Dania Beach, City of 2.29 2.34 2.40 2.45 2.51
Davie, Town of 4.02 6.34 8.66 10.98 13.30
Deerfield Beach, City of 9.90 10.14 10.38 10.62 10.85
Fort Lauderdale, City of 40.46 41.42 42.38 43.34 44.30
Hallandale Beach, City of 5.42 5.55 5.68 5.81 5.94
Hillsboro Beach, Town of 0.66 0.67 0.69 0.71 0.72
Hollywood, City of 20.73 21.39 22.04 22.69 23.35
Lauderhill, City of 5.52 5.65 5.79 5.92 6.05

20 | Appendix A: Demand Projections
Table A-8. Continued.
County PWS Utility or DSS
Finished (Net) Water Demand Projections –
Average Rainfall Conditions (MGD)
2010 2015 2020 2025 2030
Broward (cont.)
Margate, City of 5.71 5.85 5.99 6.13 6.26
Miramar, City of 11.32 11.73 12.15 12.56 12.97
North Lauderdale, City of 2.51 2.57 2.63 2.69 2.75
North Springs Improvement District 4.33 4.43 4.54 4.64 4.74
Parkland Utilities, Inc. 0.24 0.25 0.26 0.26 0.27
Pembroke Pines, City of 11.86 12.14 12.43 12.71 13.00
Plantation, City of 11.66 12.03 12.39 12.76 13.13
Pompano Beach, City of 13.59 13.91 14.24 14.57 14.89
Royal Utility Company 0.32 0.32 0.33 0.34 0.35
Seminole Tribe of Florida Utility 1.11 1.13 1.16 1.19 1.21
Sunrise, City of 24.52 25.11 25.70 26.29 26.88
Tamarac, City of 5.89 6.03 6.17 6.31 6.45
Tindall Hammock Irrigation and Soil Conservation District
0.42 0.43 0.44 0.45 0.46
Broward County PWS Total 214.87 222.74 230.68 238.59 246.47
Broward County DSS Total 0.55 0.67 0.79 0.91 1.03
Broward County Total 215.42 223.41 231.47 239.5 247.5
Miami-Dade
Miami-Dade County PWS Utilities
Americana Village 0.22 0.23 0.24 0.25 0.26
Florida City Water and Sewer Department 1.75 1.83 1.91 1.99 2.07
Homestead, City of 10.31 10.78 11.25 11.73 12.20
Miami-Dade Water & Sewer Department 302.43 316.26 330.08 343.90 357.72
North Miami, City of 10.58 11.06 11.54 12.03 12.51
North Miami Beach, City of 20.25 21.36 22.48 22.80 24.72
Miami-Dade County PWS Total 345.54 361.52 377.5 392.69 409.48
Miami-Dade County DSS Total 3.28 3.43 3.58 3.73 3.88
Miami-Dade County Total 348.82 364.95 381.08 396.43 413.36
Monroe
Monroe County PWS Utility
Florida Keys Aqueduct Authority 16.45 16.23 16.02 15.81 15.59
Monroe County PWS Total 16.45 16.23 16.02 15.81 15.59
Monroe County DSS Total 0.00 0.00 0.00 0.00 0.00
Monroe County Total 16.45 16.23 16.02 15.81 15.59
Hendry
Hendry County PWS Total 0.00 0.00 0.00 0.00 0.00
Hendry County DSS Total 1.40 1.44 1.49 1.53 1.58
Hendry County Total 1.40 1.44 1.49 1.53 1.58
LEC Planning Area PWS Total 783.43 820.54 857.75 894.13 932.04 LEC Planning Area DSS Total 15.94 16.38 16.83 17.27 17.72
LEC Planning Area Total 799.37 836.92 874.58 911.4 949.76

2012 LEC Water Supply Plan Update | 21
Table A-9. Finished (net) water demand projections for PWS and DSS under 1-in-10 year drought
conditions in the LEC Planning Area.
County PWS Utility or DSS
Finished (Net) Water Demand Projections –
1-in-10 Year Drought Conditions (MGD)
2010 2015 2020 2025 2030
Palm Beach
Palm Beach County PWS Utilities
A.G. Holley State Hospital 0.08 0.08 0.09 0.09 0.10
Boca Raton, City of 38.05 40.41 42.78 45.14 47.50
Boynton Beach, City of 14.89 15.82 16.74 17.67 18.59
Delray Beach Water and Sewer Department, City of
16.30 17.31 18.32 19.33 20.34
Glades Utility Authority 5.42 5.75 6.09 6.43 6.76
Golf, Village of 0.44 0.47 0.50 0.53 0.55
Highland Beach, Town of 1.50 1.59 1.68 1.78 1.87
Jupiter, Town of 14.77 16.37 17.98 19.58 21.18
Lake Worth Utilities, City of 4.91 5.21 5.51 5.82 6.12
Lantana, Town of 1.96 2.08 2.21 2.33 2.45
Manalapan, Town of 1.18 1.25 1.33 1.40 1.47
Mangonia Park, Town of 0.35 0.37 0.40 0.42 0.44
Maralago Cay 0.20 0.22 0.23 0.24 0.25
Palm Beach County Water Utilities Department 57.66 61.24 64.83 68.41 71.99
Palm Springs, Village of 4.21 4.47 4.73 5.00 5.26
Riviera Beach, City of 7.24 7.69 8.14 8.59 9.04
Seacoast Utility Authority 19.55 20.76 21.97 23.19 24.40
Tequesta, Village of 3.02 3.25 3.48 3.71 3.94
Wellington Public Utilities Department 6.45 6.85 7.25 7.65 8.05
West Palm Beach Public Utilities, City of 30.91 32.83 34.75 36.67 38.59
Palm Beach County PWS Total 229.09 244.02 259.01 273.98 288.89
Palm Beach County DSS Total 11.88 12.02 12.16 12.31 12.45
Palm Beach County Total 240.97 256.04 271.17 286.29 301.34
Broward
Broward County PWS Utilities
Broward County Water & Wastewater Services 21.19 21.87 22.54 23.22 23.89
Cooper City Utility Department, City of 2.99 3.06 3.13 3.20 3.27
Coral Springs, City of 7.28 7.46 7.63 7.81 7.98
Coral Springs Improvement District 4.19 4.29 4.39 4.49 4.60
Dania Beach, City of 2.52 2.58 2.64 2.70 2.76
Davie, Town of 4.43 6.98 9.54 12.09 14.64
Deerfield Beach, City of 10.90 11.16 11.43 11.69 11.95
Fort Lauderdale, City of 44.55 45.60 46.66 47.72 48.77
Hallandale Beach, City of 5.97 6.11 6.25 6.40 6.54
Hillsboro Beach, Town of 0.72 0.74 0.76 0.78 0.79
Hollywood, City of 22.83 23.55 24.27 24.98 25.70
Lauderhill, City of 6.08 6.22 6.37 6.52 6.66

22 | Appendix A: Demand Projections
Table A-9. Continued.
County PWS Utility or DSS
Finished (Net) Water Demand Projections –
1-in-10 Year Drought Conditions (MGD)
2010 2015 2020 2025 2030
Broward (cont.)
Margate, City of 6.29 6.44 6.59 6.75 6.90
Miramar, City of 12.46 12.92 13.37 13.83 14.28
North Lauderdale, City of 2.76 2.83 2.89 2.96 3.03
North Springs Improvement District 4.76 4.88 4.99 5.11 5.22
Parkland Utilities, Inc. 0.27 0.28 0.28 0.29 0.29
Pembroke Pines, City of 13.05 13.37 13.68 14.00 14.31
Plantation, City of 12.84 13.24 13.65 14.05 14.45
Pompano Beach, City of 14.96 15.32 15.68 16.04 16.40
Royal Utility Company 0.35 0.36 0.37 0.37 0.38
Seminole Tribe of Florida Utility 1.22 1.25 1.28 1.31 1.34
Sunrise, City of 27.00 27.65 28.30 28.95 29.60
Tamarac, City of 6.48 6.64 6.79 6.95 7.10
Tindall Hammock Irrigation and Soil Conservation District
0.46 0.47 0.48 0.49 0.50
Broward County PWS Total 236.55 245.27 253.96 262.7 271.35
Broward County DSS Total 0.61 0.74 0.87 1.00 1.14
Broward County Total 237.16 246.01 254.83 263.70 272.49
Miami-Dade
Miami-Dade County PWS Utilities
Americana Village 0.24 0.25 0.26 0.27 0.28
Florida City Water and Sewer Department 1.90 1.99 2.08 2.17 2.25
Homestead, City of 11.21 11.72 12.23 12.75 13.26
Miami-Dade Water & Sewer Department 328.75 343.77 358.79 373.82 388.84
North Miami, City of 11.50 12.02 12.55 13.07 13.60
North Miami Beach, City of 22.01 23.22 24.44 24.78 26.87
Miami-Dade County PWS Total 375.61 392.97 410.35 426.86 445.10
Miami-Dade County DSS Total 3.56 3.73 3.89 4.05 4.22
Miami-Dade County Total 379.17 396.70 414.24 430.91 449.32
Monroe
Monroe County PWS Utility
Florida Keys Aqueduct Authority 16.96 16.74 16.52 16.30 16.08
Monroe County PWS Total 16.96 16.74 16.52 16.30 16.08
Monroe County DSS Total 0.00 0.00 0.00 0.00 0.00
Monroe County Total 16.96 16.74 16.52 16.30 16.08
Hendry
Hendry County PWS Total 0.00 0.00 0.00 0.00 0.00
Hendry County DSS Total 1.47 1.51 1.56 1.61 1.65
Hendry County Total 1.47 1.51 1.56 1.61 1.65
LEC Planning Area PWS Total 858.21 899 939.84 979.84 1021.42
LEC Planning Area DSS Total 17.52 18 18.48 18.97 19.46
LEC Planning Area Total 875.73 917 958.32 998.81 1,040.88

2012 LEC Water Supply Plan Update | 23
Table A-10. Gross (raw) water demand projections for PWS and DSS under average rainfall conditions
in the LEC Planning Area.
County PWS Utility or DSS
Gross (Raw) Water Demand Projections –
Average Rainfall Conditions (MGD)
2010 2015 2020 2025 2030
Palm Beach
Palm Beach County PWS Utilities
A.G. Holley State Hospital 0.08 0.09 0.09 0.10 0.10
Boca Raton, City of 42.19 44.81 47.43 50.05 52.67
Boynton Beach, City of 14.23 15.11 15.99 16.88 17.76
Delray Beach Water and Sewer Department, City of
15.27 16.46 17.66 18.86 20.06
Glades Utility Authority 6.61 7.02 7.43 7.84 8.26
Golf, Village of 0.51 0.54 0.57 0.60 0.64
Highland Beach, Town of 2.05 2.18 2.30 2.43 2.55
Jupiter, Town of 16.60 17.77 18.94 20.11 21.27
Lake Worth Utilities, City of 4.75 5.04 5.34 5.63 5.93
Lantana, Town of 1.77 1.88 1.99 2.10 2.21
Manalapan, Town of 1.34 1.42 1.50 1.58 1.67
Mangonia Park, Town of 0.32 0.34 0.36 0.38 0.40
Maralago Cay 0.19 0.20 0.21 0.23 0.24
Palm Beach County Water Utilities Department 59.03 62.70 66.37 70.03 73.70
Palm Springs, Village of 4.00 4.25 4.50 4.75 4.99
Riviera Beach, City of 6.60 7.01 7.42 7.83 8.24
Seacoast Utility Authority 18.10 19.22 20.35 21.47 22.60
Tequesta, Village of 3.34 3.59 3.85 4.10 4.35
Wellington Public Utilities Department 6.73 7.15 7.57 7.99 8.41
West Palm Beach Public Utilities, City of 27.94 29.67 31.41 33.14 34.88
Palm Beach County PWS Total 231.65 246.45 261.28 276.10 290.93
Palm Beach County DSS Total 11.16 11.29 11.43 11.56 11.69
Palm Beach County Total 242.81 257.74 272.71 287.66 302.62
Broward
Broward County PWS Utilities
Broward County Water & Wastewater Services 20.98 21.55 22.11 22.67 23.23
Cooper City Utility Department, City of 3.46 3.54 3.62 3.71 3.79
Coral Springs, City of 6.96 7.13 7.29 7.46 7.63
Coral Springs Improvement District 4.33 4.44 4.54 4.65 4.75
Dania Beach, City of 2.42 2.48 2.53 2.59 2.65
Davie, Town of 4.10 6.46 8.83 11.19 13.56
Deerfield Beach, City of 10.10 10.34 10.59 10.83 11.07
Fort Lauderdale, City of 44.95 46.02 47.08 48.15 49.21
Hallandale Beach, City of 5.55 5.68 5.81 5.95 6.08
Hillsboro Beach, Town of 0.76 0.78 0.80 0.82 0.83
Hollywood, City of 24.00 24.75 25.51 26.26 27.02
Lauderhill, City of 5.76 5.90 6.03 6.17 6.31

24 | Appendix A: Demand Projections
Table A-10. Continued.
County PWS Utility or DSS
Gross (Raw) Water Demand Projections –
Average Rainfall Conditions (MGD)
2010 2015 2020 2025 2030
Broward (cont.)
Margate, City of 7.83 8.02 8.21 8.39 8.58
Miramar, City of 12.46 12.92 13.37 13.83 14.28
North Lauderdale, City of 2.60 2.66 2.73 2.79 2.85
North Springs Improvement District 4.50 4.61 4.72 4.82 4.93
Parkland Utilities, Inc. 0.25 0.26 0.26 0.27 0.27
Pembroke Pines, City of 12.13 12.43 12.72 13.01 13.30
Plantation, City of 14.14 14.59 15.03 15.48 15.92
Pompano Beach, City of 14.55 14.90 15.25 15.60 15.95
Royal Utility Company 0.37 0.38 0.39 0.40 0.41
Seminole Tribe of Florida Utility 1.13 1.16 1.18 1.21 1.24
Sunrise, City of 28.39 29.58 30.77 31.96 33.15
Tamarac, City of 6.20 6.35 6.50 6.65 6.80
Tindall Hammock Irrigation and Soil Conservation District
0.69 0.71 0.73 0.74 0.76
Broward County PWS Total 238.63 247.62 256.61 265.60 274.57
Broward County DSS Total 0.57 0.70 0.82 0.95 1.08
Broward County Total 239.18 248.34 257.42 266.55 275.65
Miami-Dade
Miami-Dade County PWS Utilities
Americana Village 0.23 0.24 0.25 0.26 0.27
Florida City Water and Sewer Department 1.78 1.86 1.94 2.02 2.10
Homestead, City of 10.33 10.80 11.27 11.74 12.21
Miami-Dade Water & Sewer Department 309.10 323.23 337.35 351.48 365.61
North Miami, City of 13.28 13.89 14.50 15.10 15.71
North Miami Beach, City of 22.60 23.85 25.10 25.45 27.59
Miami-Dade County PWS Total 357.32 373.87 390.41 406.05 423.49
Miami-Dade County DSS Total 3.42 3.57 3.73 3.88 4.04
Miami-Dade County Total 360.74 377.44 394.14 409.93 427.53
Monroe
Monroe County PWS Utility
Florida Keys Aqueduct Authority 17.67 17.47 17.26 17.06 16.86
Monroe County PWS Total 17.67 17.47 17.26 17.06 16.86
Monroe County DSS Total 0.00 0.00 0.00 0.00 0.00
Monroe County Total 17.67 17.47 17.26 17.06 16.86
Hendry
Hendry County PWS Total 0.00 0.00 0.00 0.00 0.00
Hendry County DSS Total 1.46 1.50 1.55 1.60 1.64
Hendry County Total 1.46 1.50 1.55 1.60 1.64
LEC Planning Area PWS Total 845.25 885.43 925.55 964.81 1,005.85
LEC Planning Area DSS Total 16.61 17.06 17.53 17.99 18.45
LEC Planning Area Total 861.86 902.49 943.08 982.8 1,024.3

2012 LEC Water Supply Plan Update | 25
Table A-11. Gross water demand projections for PWS and DSS under 1-in-10 year drought conditions
in the LEC Planning Area.
County PWS Utility or DSS
Gross (Raw) Water Demand Projections –
1-in-10 Year Drought Conditions (MGD)
2010 2015 2020 2025 2030
Palm Beach
Palm Beach County PWS Utilities
A.G. Holley State Hospital 0.09 0.10 0.10 0.11 0.11
Boca Raton, City of 46.79 49.70 52.60 55.51 58.41
Boynton Beach, City of 15.78 16.76 17.74 18.72 19.70
Delray Beach Water and Sewer Department, City of
16.93 18.26 19.59 20.91 22.24
Glades Utility Authority 7.33 7.79 8.24 8.70 9.16
Golf, Village of 0.57 0.60 0.64 0.67 0.71
Highland Beach, Town of 2.27 2.41 2.55 2.69 2.83
Jupiter, Town of 18.41 19.71 21.00 22.30 23.59
Lake Worth Utilities, City of 5.27 5.59 5.92 6.25 6.57
Lantana, Town of 1.96 2.08 2.21 2.33 2.45
Manalapan, Town of 1.48 1.57 1.67 1.76 1.85
Mangonia Park, Town of 0.35 0.37 0.40 0.42 0.44
Maralago Cay 0.21 0.22 0.24 0.25 0.26
Palm Beach County Water Utilities Department 65.47 69.53 73.60 77.67 81.73
Palm Springs, Village of 4.44 4.71 4.99 5.26 5.54
Riviera Beach, City of 7.32 7.78 8.23 8.69 9.14
Seacoast Utility Authority 20.07 21.32 22.57 23.81 25.06
Tequesta, Village of 3.70 3.98 4.27 4.55 4.83
Wellington Public Utilities Department 7.47 7.93 8.39 8.86 9.32
West Palm Beach Public Utilities, City of 30.99 32.91 34.83 36.76 38.68
Palm Beach County PWS Total 256.90 273.32 289.78 306.22 322.62
Palm Beach County DSS Total 12.37 12.52 12.67 12.82 12.97
Palm Beach County Total 269.27 285.84 302.45 319.04 335.59
Broward
Broward County PWS Utilities
Broward County Water & Wastewater Services 23.10 23.72 24.34 24.96 25.58
Cooper City Utility Department, City of 3.81 3.90 3.99 4.08 4.17
Coral Springs, City of 7.66 7.85 8.03 8.22 8.40
Coral Springs Improvement District 4.77 4.89 5.00 5.12 5.23
Dania Beach, City of 2.66 2.73 2.79 2.85 2.92
Davie, Town of 4.51 7.12 9.72 12.32 14.93
Deerfield Beach, City of 11.12 11.39 11.65 11.92 12.19
Fort Lauderdale, City of 49.49 50.66 51.84 53.01 54.18
Hallandale Beach, City of 6.11 6.25 6.40 6.55 6.69
Hillsboro Beach, Town of 0.84 0.86 0.88 0.90 0.92
Hollywood, City of 26.42 27.25 28.08 28.92 29.75
Lauderhill, City of 6.34 6.49 6.64 6.80 6.95

26 | Appendix A: Demand Projections
Table A-11. Continued.
County PWS Utility or DSS
Gross (Raw) Water Demand Projections –
1-in-10 Year Drought Conditions (MGD)
2010 2015 2020 2025 2030
Broward (cont.)
Margate, City of 8.62 8.83 9.04 9.24 9.45
Miramar, City of 13.72 14.22 14.72 15.22 15.72
North Lauderdale, City of 2.86 2.93 3.00 3.07 3.14
North Springs Improvement District 4.95 5.07 5.19 5.31 5.43
Parkland Utilities, Inc. 0.28 0.28 0.29 0.30 0.30
Pembroke Pines, City of 13.36 13.68 14.00 14.32 14.64
Plantation, City of 15.57 16.06 16.55 17.04 17.53
Pompano Beach, City of 16.02 16.40 16.79 17.17 17.56
Royal Utility Company 0.41 0.42 0.43 0.44 0.45
Seminole Tribe of Florida Utility 1.24 1.27 1.30 1.33 1.36
Sunrise, City of 31.26 32.57 33.88 35.19 36.50
Tamarac, City of 6.83 7.00 7.16 7.32 7.49
Tindall Hammock Irrigation and Soil Conservation District
0.76 0.78 0.80 0.82 0.84
Broward County PWS Total 262.71 272.62 282.51 292.42 302.32
Broward County DSS Total 0.63 0.77 0.91 1.05 1.18
Broward County Total 263.34 273.439 283.42 293.47 303.50
Miami-Dade
Miami-Dade County PWS Utilities
Americana Village 0.25 0.26 0.27 0.28 0.29
Florida City Water and Sewer Department 1.93 2.02 2.11 2.20 2.28
Homestead, City of 11.23 11.74 12.25 12.76 13.28
Miami-Dade Water & Sewer Department 335.99 351.35 366.70 382.06 397.41
North Miami, City of 14.44 15.10 15.76 16.42 17.08
North Miami Beach, City of 24.57 25.92 27.28 27.66 29.99
Miami-Dade County PWS Total 388.41 406.39 424.37 441.38 460.33
Miami-Dade County DSS Total 3.71 3.88 4.05 4.22 4.39
Miami-Dade County Total 392.12 410.27 428.42 445.6 464.72
Monroe
Monroe County PWS Utility
Florida Keys Aqueduct Authority 18.22 18.01 17.80 17.59 17.38
Monroe County PWS Total 18.22 18.01 17.80 17.59 17.38
Monroe County DSS Total 0.00 0.00 0.00 0.00 0.00
Monroe County Total 18.22 18.01 17.80 17.59 17.38
Hendry
Hendry County PWS Total 0.00 0.00 0.00 0.00 0.00
Hendry County DSS Total 1.53 1.58 1.63 1.67 1.72
Hendry County Total 1.53 1.58 1.63 1.67 1.72
LEC Planning Area PWS Total 926.24 970.34 1,014.46 1,057.61 1,102.65
LEC Planning Area DSS Total 18.24 18.75 19.26 19.76 20.26
LEC Planning Area Total 944.48 989.09 1,033.72 1,077.37 1,122.91

2012 LEC Water Supply Plan Update | 27
AGRICULTURAL SELF-SUPPLY
Agriculture holds a unique place of importance to the in the LEC Planning Area, the state of
Florida, and the United States’ economy. It hosts the nation’s “Winter Bread Basket” and
“Salad Bowl” to the nation. In addition, the region’s nursery/ornamental industry is the
largest in the state and second largest in the country (DCFB 2012).
Modest expansion in overall agricultural acreage, along with a slight rise in water use, is
expected in the LEC Planning Area between 2010 and 2030. However, some areas will likely
show a decline in agricultural acreage by 2030. Agriculture acreage declines in Broward
County and Palm Beach County’s Coastal subbasin are expected primarily due to
urbanization, while acreage under management increases in the Everglades Agricultural
Area (EAA) are expected due to market forces and the slower pace of implementation for
changes in land use for water management and restoration projects over the planning
horizon. Little change in agricultural acreage and water use is expected in Miami-Dade
County, while acreage and water use is expected to rise in Hendry County’s western basins
area, partially compensating for lands lost to urban development in the eastern portion of
the LEC Planning Area since the 2005–2006 LEC Plan Update. Since the 2005–2006 LEC
Plan Update, the agricultural area in the LEC Planning Area has experienced impacts from
rapid urban development and housing price appreciation, a financial crisis and housing
bubble burst, a recession (2008–2009) followed by a slow recovery, and construction
activity remaining at low levels. Given the slowdown in the pace of urban development
coupled with favorable relative prices for agricultural land, the projections assume a
modest expansion in irrigated acres over the 2010 to 2030 period.
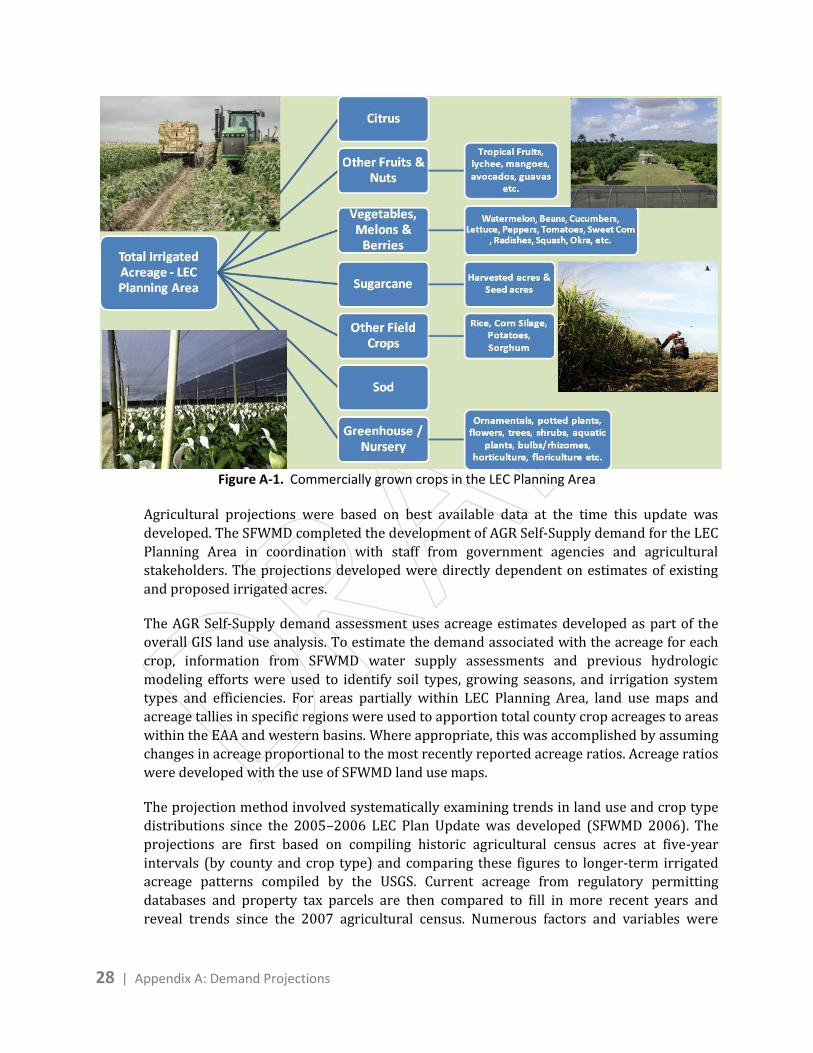
Agricultural water use includes water for irrigated, commercially grown crop categories,
including 1) citrus, 2) other fruits and nuts, 3) vegetables, melons, and berries, 4) field crops
– sugarcane, 5) sod, 6) greenhouse/nursery, 7) pasture and 8) miscellaneous. Figure A-1
shows these categories with some examples of the major crop types. Due to the complexity
of developing agricultural projections and uncertainty over the future recovery of citrus,
two scenario ranges of acreage and water demand were used to estimate the agricultural
projections for this update.
Projection Methodology
The land use information used to develop the demand estimates includes irrigated
agricultural acreage by crop type and by county or subcounty area. The projections assume
option lands originally purchased and contemplated for Everglades restoration projects
will, where applicable, continue to be used for agricultural purposes in the absence of
detailed project restoration plans and schedules.
28 | Appendix A: Demand Projections
Figure A-1. Commercially grown crops in the LEC Planning Area
Agricultural projections were based on best available data at the time this update was
developed. The SFWMD completed the development of AGR Self-Supply demand for the LEC
Planning Area in coordination with staff from government agencies and agricultural
stakeholders. The projections developed were directly dependent on estimates of existing
and proposed irrigated acres.
The AGR Self-Supply demand assessment uses acreage estimates developed as part of the
overall GIS land use analysis. To estimate the demand associated with the acreage for each
crop, information from SFWMD water supply assessments and previous hydrologic
modeling efforts were used to identify soil types, growing seasons, and irrigation system
types and efficiencies. For areas partially within LEC Planning Area, land use maps and
acreage tallies in specific regions were used to apportion total county crop acreages to areas
within the EAA and western basins. Where appropriate, this was accomplished by assuming
changes in acreage proportional to the most recently reported acreage ratios. Acreage ratios
were developed with the use of SFWMD land use maps.
The projection method involved systematically examining trends in land use and crop type
distributions since the 2005–2006 LEC Plan Update was developed (SFWMD 2006). The
projections are first based on compiling historic agricultural census acres at five-year
intervals (by county and crop type) and comparing these figures to longer-term irrigated
acreage patterns compiled by the USGS. Current acreage from regulatory permitting
databases and property tax parcels are then compared to fill in more recent years and
reveal trends since the 2007 agricultural census. Numerous factors and variables were

2012 LEC Water Supply Plan Update | 29
considered that could potentially affect the future acreage projections. Among these factors
were the following:
County land use plans and future land use targets including comprehensive master development plans, official maps, stakeholder plans, and special area plans
Regional specialization (i.e., subtropical climate and fruit orchards)
Macro and micro economic conditions
Supply, demand, and commodity price trends
Consumption trends (tastes and preferences) and production patterns (yields per acre and imports)
Crop special studies and future scenario outlooks from the University of Florida’s Institute of Food and Agricultural Sciences (IFAS), including their Citrus Research and Education Center; United States Department of Agriculture (USDA); Florida Department of Agriculture and Consumer Services (FDACS); etc.
Inputs from growers, cooperatives, and participants on market conditions and trends
SFWMD land management and permitting including acquisitions and projects completed since the last plan update, areas targeted for land acquisition and current leasing arrangements, permitted acreage, and permit expirations
Comparisons of comprehensive development plan acreage to projected acres
The agricultural demand assessment developed acreage estimates from the following data
sets, information, and sources:
USGS time series of irrigated acres by county by crop type
County-level data and yearly commercial citrus inventories from the 2007 Census of Agriculture for Florida was used or considered when available (USDA-NASS 2007)
2005–2006 LEC Plan Update (SFWMD 2006)
The SFWMD Water Use Regulatory Database and permit expiration dates
County land use appraiser/assessment files
USDA Economic Research Service information, including market outlooks for select crops, agricultural projections to 2020, select yearbooks with historic information (i.e., vegetables and melons yearbook), and inputs and feedback from agricultural economists
Local agricultural extension offices
University of Florida’s IFAS
FDACS
County agricultural economic development coordinators
Florida Farm Bureau and other agricultural stakeholders

30 | Appendix A: Demand Projections
Other special reports produced by research groups (i.e., Florida Citrus Commission, Florida Department of Corrections) and topical reports on agricultural land use and market trends.
Commodity pride reports and trends (i.e., World Bank pink sheets)
The SFWMD acreage estimates developed as part of GIS agricultural land use/crop type analysis (1999 and 2004)
A hierarchy of data preference was used for developing agricultural water use projections,
starting with the 2007 Census of Agriculture for Florida county-level data (USDA-NASS
2007). Census data at five-year intervals going back to 1997 reveals important trends by
crop type for each county. Longer-term irrigated acreage data from the USGS, going back to
1985, was also referenced. Where census data was not consistently available for each crop
in each county for every year, the 2007 census data was supplemented by other above
named sources to fill in and provide informative links to post-census years and more recent
trends. Comparisons to SFWMD permitted acreage and permit dates of expiration were also
useful to compare acreage distributions for more recent years leading up to 2010. Recent
year permit renewals by crop type were also useful to signal market preferences and
growers’ future expectations. Land use acreage data obtained from county appraiser and
assessment files was also referenced for post-census years. The data and reports were also
supplemented by field research where possible. For example, the LEC Planning Area
agricultural projections subteam toured the Redland area of south Miami-Dade County and
noted operations that did not survive the 2008–2009 recession, but would have been
included in the 2007 census.
When data from the listed sources were insufficient for indicating trends and no empirical
knowledge of future changes in a crop’s acreage was available, the acreage for that crop
category was projected to remain at its most recently reported. For citrus, a range of
acreage projections was used because of the uncertainty over how fast recovery from
disease losses will occur over the projection horizon.
AGR Self-Supply demand calculations for this update applied results from Agricultural Field
Scale Irrigation Requirements Simulation (AFSIRS), which uses data from the 1965–2000
timeframe. These same model results were also used in the 2005–2006 LEC Plan Update
(SFWMD 2006).
AFSIRS calculates the net irrigation requirements for each crop category and irrigation
system. As described in the Recreational/Landscape Self-Supply section of this appendix, the
net irrigation requirement reflects an estimate of the amount of water, expressed in inches
per year, that should be delivered to a plant’s root zone to sustain yield. The gross irrigation
requirement is the amount of water that must be withdrawn from the source in order to be
delivered to the plant’s root zone. It includes both the net irrigation requirement and the
losses incurred irrigating the plant’s root zone. Irrigation efficiency as a modeled factor
refers to the average percent of total water applied that is delivered to the plant’s root zone.
This relationship is expressed as follows:
Gross Irrigation Requirement = Net Irrigation Requirement/Irrigation Efficiency

2012 LEC Water Supply Plan Update | 31
AFSIRS calculates irrigation requirements for an average rainfall year and
an 1-in-10 year drought conditions. Historical weather data from rainfall stations that most
accurately represent the average rainfall and 1-in-10 year drought conditions for each crop
and county combination are used to calculate the irrigation requirements.
Projections of gross irrigation demand are based on an assumed or estimated irrigation
system type. The effect of the corresponding irrigation efficiency is based on the
interpretation of current ratios and trends. There are three basic types of irrigation systems
currently used in south Florida crop production: 1) seepage crown flood, 2) sprinklers, and
3) low volume microirrigation. A weighted irrigation efficiency is calculated for each crop
type category based on percent use by acres of the three different irrigation systems, as
reported in the SFWMD Water Use Regulatory Database (Table A-12).
Table A-12. Estimated irrigation efficiency for each type of irrigation system.
Irrigation Category Irrigation Efficiency
Low volume microirrigation 0.85
Seepage crown flood 0.50
Sprinkler 0.75
Available water capacity and depth of soil directly affect the effectiveness of rainfall
infiltration, which is considered by AFSIRS. Another factor AFSIRS considers explicitly is
different types of farm irrigation management strategies, which is combined with soil
properties by region and crop type for this analysis. The default AFSIRS soil database
includes a generic sandy soil. While the soils vary across the region, sandy soil parameters
are used as a simplifying and conservative assumption, and are considered reasonable for
planning purposes. The assumption is conservative because it results in higher estimated
irrigation requirements in comparison with other soil types, which generally can hold
more water.
Example of Water Demand Calculations
A detailed example of water demand calculation procedures is presented in this section.
First, the acreage of each crop in each county within the LEC Planning Area was determined.
Next, the area-weighted irrigation efficiency for the crop type in a particular county was
calculated from irrigation system information contained in the SFWMD Water Use
Regulatory Database. Table A-12 above lists the estimated irrigation efficiency for each of
the three categories of irrigation system.
Water use permit data categorized as citrus in a given county show that 23 percent of
permittees use low volume irrigation systems, 67 percent use sprinkler systems, and
9 percent use seepage systems. Using the permit data, the area-weighted irrigation
efficiency is as follows:
IRR_EFF = (0.23 x 0.85) + (0.67 x 0.75) + (0.09 x 0.50) / (0.23 + 0.67 + 0.09) = 75 percent

32 | Appendix A: Demand Projections
Of the water withdrawn (gross demand) for citrus irrigation in the given county, 75 percent is available to the crop. Losses occur due to evaporation, drainage, and line system leakage.
Assuming 90 percent use low volume irrigation systems and 10 percent use seepage systems, the area‐weighted irrigation efficiency based on this data is as follows:
IRR_EFF = (0.9 x 0.85) + (0.1 x 0.5) = 81.5 percent
Based on this data, 81.5 percent of the water withdrawn (gross demand) from a surface water or groundwater source is available to the crop.
AFSIRS runs were completed for both the 2005–2006 LEC Plan Update (SFWMD 2006) and this plan update. The AFSIRS output is given as the net irrigation requirement in inches per year, which is the amount of water the crop needs in addition to rainfall. The input to the model is daily rainfall and ET rates in inches. The model results for the 2005–2006 LEC Plan Update used input data for the period from 1965 through 2000. Based on the rainfall and ET data and calculated irrigation requirements, the AFSIRS outputs include irrigation requirements for an average rainfall and 1‐in‐10 year drought conditions. Fifty percent of the calculated yearly irrigation requirement rates are lower than the average irrigation requirement. Ninety percent of the calculated yearly irrigation requirements are lower than the 1‐in‐10 year drought conditions irrigation requirement.
Continuing with the county citrus crop example, the average rainfall and 1‐in‐10 year drought conditions net irrigation requirements calculated by AFSIRS are 10.82 inches per year and 16.01 inches per year, respectively. The AFSIRS average irrigation requirement and 40,000 acres are used to estimate the gross irrigation demand for an average rainfall year for citrus in the county as follows:
Gross Irrigation Requirement (MGD) = Net Irrigation Requirement (MGD)/ Irrigation Efficiency
. ,
, .
. ≈ 40 MGD1
Projection Results
Citrus
In the LEC Planning Area, most of the citrus acreage is located in Palm Beach County’s Coastal subbasin and Hendry County’s western basins. Citrus acreage data were gathered from the 2007 Census of Agriculture for Florida (USDA‐NASS 2007). These data focus on citrus production and not on young groves not yet in production, inactive groves, or abandoned groves. Table A13 presents the acreage projections for the high growth scenario (adopted in this plan under conservative water supply planning principles), the
1 Key for equation: ft/in – feet per inch; ft2/acre – square feet per acre; gal/ft3 – gallons per cubic foot; in/yr – inches per year; yr – year

2012 LEC Water Supply Plan Update | 33
projected net irrigation demand under average rainfall and 1-in-10 year drought conditions,
and the projected gross irrigation demand (water withdrawal demand) under average
rainfall and 1-in-10 year drought conditions. Because of the uncertainty of citrus recovery
from greening and canker, two projection scenarios (high and low growth rates) were
developed (Figure A-2). The scenarios were based on research communicated at a citrus
industry research symposium.2 The high acreage projections assume that over the short
term, the trend in productive acreage losses will continue. However, restoration of active
bearing and nonbearing productive acreage is assumed to occur between 2015 and 2020
and rise throughout the projection period. Acreage in Palm Beach County’s Coastal subbasin
is expected to decline significantly, primarily due to competition from urban land uses. No
significant increase or decrease in acreage is projected for the other subbasins. Water use in
the planning area will decline along with the change in acreage.
Figure A-2. Citrus acreage within the LEC Planning Area using low and high projection scenarios as well
as citrus acreage projected in the 2005–2006 LEC Plan Update.
2 Future of the Global Orange Juice Industry – Citrus Research and Education Center, Lake Afred, Florida, April 8, 2010.

34 | Appendix A: Demand Projections
Table A-13. Gross irrigation requirements for citrus crop acreage in the LEC Planning Area.
Rainfall Year
Water to Sustain Crops (Net Irrigation Requirement;
annual inches based on rainfall)
Gross Demand (MGD) (total volume needed for withdrawal including net irrigation demand as well as accounting for system losses and inefficiencies)
2010 2015 2020 2025 2030
Palm Beach County – Coastal
Irrigated Acreage 2,464 acres 2,058 acres 2,193 acres 2,485 acres 2,704 acres
Net Demand Gross Demand (MGD)
Average 9.9 inches 3.00 2.10 1.90 1.80 2.00
1-in-10 year drought 15.4 inches 4.47 3.28 3.03 3.02 3.29
Palm Beach County – EAA
Irrigated Acreage 10 acres 8 acres 9 acres 10 acres 11 acres
Net Demand Gross Demand (MGD)
Average 8.9 inches 0.01 0.01 0.01 0.01 0.01
1-in-10 year drought 16.3 inches 0.02 0.02 0.02 0.02 0.03
Miami-Dade County
Irrigated Acreage 717 acres 599 acres 639 acres 724 acres 788 acres
Net Demand Gross Demand (MGD)
Average 11.7 inches 0.79 0.64 0.66 0.72 0.79
1-in-10 year drought 17.9 inches 1.21 0.98 1.02 1.12 1.21
Hendry County – Western Basins
Irrigated Acreage 28,437 acres 23,745 acres 25,312 acres 28,678 acres 31,202 acres
Net Demand Gross Demand (MGD)
Average 15.5 inches 43.70 35.10 35.60 38.90 42.30
1-in-10 year drought 20.8 inches 64.60 53.90 57.50 65.20 70.90
LEC Planning Area Totals
Total Irrigated Acreage 31,628 acres 26,410 acres 28,153 acres 31,897 acres 34,705 acres
Gross Demand (MGD)
Total average rainfall year 47.5 37.9 38.2 41.4 45.1
Total 1-in-10 year drought 70.3 58.2 61.6 69.4 75.4

2012 LEC Water Supply Plan Update | 35
Other Fruits and Nuts
The major crops in this category are avocados, guavas, mangos, and lychee. Total acreage of
other fruits and nuts in the LEC Planning Area is concentrated in Miami-Dade County. A
large variety of tropical and exotic fruits are grown in the Redland area of south Miami-
Dade County. The humid subtropical climate allows for the growing of exotic tropical and
subtropical fruits such as mangos, carambola, longans, mamey sapote, sapodilla, jackfruit,
and passion fruit. In fact, Miami-Dade County leads the state in the production of avocados.
These crops are expected to be sustained near current levels given strong consumer
demand and favorable farm economics and relative prices. Only a slight decline in acreage is
expected, and this will be mostly due to urbanization pressures over the medium term.
Given the popularity of these crops particularly among South Florida’s diverse group of
residents and tourists, and favorable trends in unit consumption demand, the projections
assume that total acreage will only decline marginally from 2010 levels by 2030. Consumer
demand continues to be strong for avocados, although imports are rising to meet national
demand. Basically, these crops are expected to be sustained near current levels given strong
consumer demand and favorable farm economics and relative prices. Only a slight decline in
acreage is expected, and this will be mostly due to urbanization pressures over the medium
term. Water use is also expected to decline only slightly from 2010 levels given the
importance of these unique crops to the economy over the planning horizon. Table A-14
presents the acreage projections, the projected net irrigation demand under average rainfall
and 1-in-10 year drought conditions, and the projected gross irrigation demand (water
withdrawal demand) under average rainfall and 1-in-10 year drought conditions.

36 | Appendix A: Demand Projections
Table A-14. Gross irrigation requirements for other fruits and nuts acreage in the LEC Planning Area.
Rainfall Year
Water to Sustain Crops
(Net Irrigation Requirement; annual inches based on rainfall)
Gross Demand (MGD) (total volume needed for withdrawal including net irrigation demand as well as accounting for system losses and inefficiencies)
2010 2015 2020 2025 2030
Palm Beach County – Coastal
Irrigated Acreage 102 acres 130 acres 128 acres 126 acres 124 acres
Net Demand Gross Demand (MGD)
Average 9.4 inches 0.09 0.12 0.12 0.12 0.11
1-in-10 year drought 15.0 inches 0.15 0.19 0.19 0.18 0.18
Palm Beach County – EAA
Irrigated Acreage 91 acres 117 acres 115 acres 114 acres 111 acres
Net Demand Gross Demand (MGD)
Average 8.9 inches 0.12 0.15 0.15 0.15 0.15
1-in-10 year drought 16.3 inches 0.22 0.28 0.28 0.28 0.27
Broward County
Irrigated Acreage 80 acres 80 acres 80 acres 80 acres 80 acres
Net Demand Gross Demand (MGD)
Average 9.8 inches 0.06 0.06 0.06 0.06 0.06
1-in-10 year drought 16.6 inches 0.10 0.10 0.10 0.10 0.10
Miami-Dade County
Irrigated Acreage 8,000 acres 7,965 acres 7,930 acres 7,895 acres 7,850 acres
Net Demand Gross Demand (MGD)
Average 12.2 inches 9.68 9.64 9.60 9.55 9.50
1-in-10 year drought 18.3 inches 14.52 14.46 14.39 14.33 14.25
Hendry County – Western Basins
Irrigated Acreage 29 acres 29 acres 29 acres 29 acres 29 acres
Net Demand Gross Demand (MGD)
Average 15.5 inches 0.04 0.04 0.04 0.04 0.04
1-in-10 year drought 20.8 inches 0.06 0.06 0.05 0.05 0.05
LEC Planning Area Totals
Total Irrigated Acreage 8,302 acres 8,321 acres 8,282 acres 8,244 acres 8,194 acres
Gross Demand (MGD)
Total average rainfall year 9.99 10.01 9.97 9.92 9.86
Total 1-in-10 year drought 15.05 15.09 15.01 14.94 14.85
2012 LEC Water Supply Plan Update | 37
Vegetables, Melons, and Berries
The agricultural regions comprising the LEC Planning Area are some of the most important
winter producers of vegetables in the country. The favorable micro climate allows for
multiple and varied crop rotational harvests on prime lands in close proximity to urban
markets enabling producers to supply consumers throughout the year. It is estimated that
over 90 percent of Miami-Dade County’s vegetables are exported out of Florida. In addition,
south Florida hospitality and restaurant industries are heavily dependent on vegetable
crops produced in the LEC Planning Area.
The chief crops in this category include snap beans, tomatoes, cucumbers, lettuce, peppers,
squash, radishes, sweet corn, and tropical vegetables. Vegetable acreage in the LEC Planning
Area is concentrated in Palm Beach County, south Miami-Dade County (Redland area), and
Hendry County’s western basins. Given favorable market conditions and future market
outlooks, vegetable acreage throughout the projection period is expected to be sustained at
near current levels in Palm Beach and Miami-Dade counties and to increase in Hendry
County. Despite the competitive pressure from imports, the lack of urbanization pressure
over the near term is favorable to producers seeking to increase production and take
advantage of market windows of opportunity. In southern Miami Dade County, SFWMD
operational management of the water table facilitates the ability of producers to sow fields
at key times to get crops planted enabling harvests to meet seasonal demand. Changes in
water use parallel the changes in acreage.
Vegetable acreage projections were requested from agricultural stakeholders and agencies,
including University of Florida’s IFAS, the FDACS, and the Florida Farm Bureau. Gathered
information indicated that vegetable acreage could be negatively impacted due to potential
volatility and by competition from imports.
In Palm Beach County, flood irrigation is the primary irrigation type used for small
vegetables. Based on the estimated usage of each type of irrigation system shown in water
use permits, the irrigation efficiency was assumed to be 50 percent for these kinds of crops.
In Miami-Dade County, vegetables are often irrigated with volume or traveling/overhead
guns and sprinklers, and drip systems are also used. These systems have higher application
efficiencies compared to flood or seepage methods and were represented by a weighted
average efficiency factor of 73 percent in the demand projections.
Table A-15 presents the acreage projections, the projected net irrigation demand under
average rainfall and 1-in-10 year drought conditions, and the projected gross irrigation
demand (water withdrawal demand) under average rainfall and 1-in-10 year
drought conditions.

38 | Appendix A: Demand Projections
Table A-15. Gross irrigation requirements for vegetables, melons, and berries acreage
in the LEC Planning Area.
Rainfall Year
Water to Sustain Crops
(Net Irrigation Requirement; annual inches based on rainfall)
Gross Demand (MGD) (total volume needed for withdrawal including net
irrigation demand as well as accounting for system losses and inefficiencies)
2010 2015 2020 2025 2030
Palm Beach County – Coastal
Irrigated Acreage 41,580 acres 41,333 acres 41,085 acres 40,838 acres 40,590 acres
Net Demand Gross Demand (MGD)
Average 8.9 inches 36.7 36.5 36.3 36.0 35.8
1-in-10 year drought 13.1 inches 54.0 53.7 53.4 53.1 52.7
Palm Beach County – EAA
Irrigated Acreage 420 acres 417 acres 415 acres 412 acres 410 acres
Net Demand Gross Demand (MGD)
Average 12.0 inches 0.7 0.7 0.7 0.7 0.7
1-in-10 year drought 16.9 inches 1.1 1.0 1.0 1.0 1.0
Broward County
Irrigated Acreage 819 acres 811 acres 801 acres 801 acres 801 acres
Net Demand Gross Demand (MGD)
Average 9.3 inches 0.8 0.7 0.7 0.7 0.7
1-in-10 year drought 13.6 inches 1.1 1.1 1.1 1.1 1.1
Miami-Dade County
Irrigated Acreage 28,000 acres 27,750 acres 27,500 acres 27,250 acres 27,000 acres
Net Demand Gross Demand (MGD)
Average 11.3 inches 32.2 32.0 31.7 31.4 31.1
1-in-10 year drought 15.2 inches 43.4 43.0 42.6 42.2 41.8
Hendry County – EAA
Irrigated Acreage 7,542 acres 7,768 acres 7,995 acres 8,221 acres 8,447 acres
Net Demand Gross Demand (MGD)
Average 16.1 inches 18.1 18.6 19.1 19.7 20.2
1-in-10 year drought 20.3 inches 22.8 23.5 24.1 24.8 25.5
Hendry County – Western Basins
Irrigated Acreage 4,169 acres 4,294 acres 4,419 acres 4,544 acres 4,670 acres
Net Demand Gross Demand (MGD)
Average 16.1 inches 10.0 10.3 10.6 10.9 11.2
1-in-10 year drought 20.3 inches 12.6 13.0 13.3 13.7 14.1
LEC Planning Area Totals
Total Irrigated Acreage 82,530 acres 82,373 acres 82,215 acres 82,066 acres 81,918 acres
Gross Demand (MGD)
Total average rainfall year 98.5 98.8 99.1 99.4 99.7
Total 1-in-10 year drought 135.0 135.3 135.5 135.9 136.2

2012 LEC Water Supply Plan Update | 39
Field Crops – Sugarcane
Sugarcane is the principal field crop grown within the LEC Planning Area. Because of its
dominance in terms of acreage, sugarcane is discussed separately from “other field crops.”
For background perspective, Figure A-3 shows the percentage distribution of agricultural
acres by crop type category within the LEC Planning Area.
Figure A-3. Percentage distribution of agricultural acres by crop type within the LEC Planning Area.
In the 2005–2006 LEC Plan Update, historical sugarcane acreage data were gathered from
annual volumes of the Florida Agricultural Statistics Service Field Crops Summary. For this
update, a historical time series of irrigated sugarcane acreage by county was obtained from
the USGS from 1985 to 2005. This time series was then compared to a time series of United
States Department of Agriculture - National Agriculture Statistic Service (USDA-NASS)
sugarcane harvested acres from 1985 to 2009. These two data sources were then compared
to the most recent acres (2011) obtained from the SFWMD Water Use Regulatory Database
and acreage coverage from current county land use maps. The projections assume that
SFWMD option lands will continue to be leased for cultivation over the 20-year planning
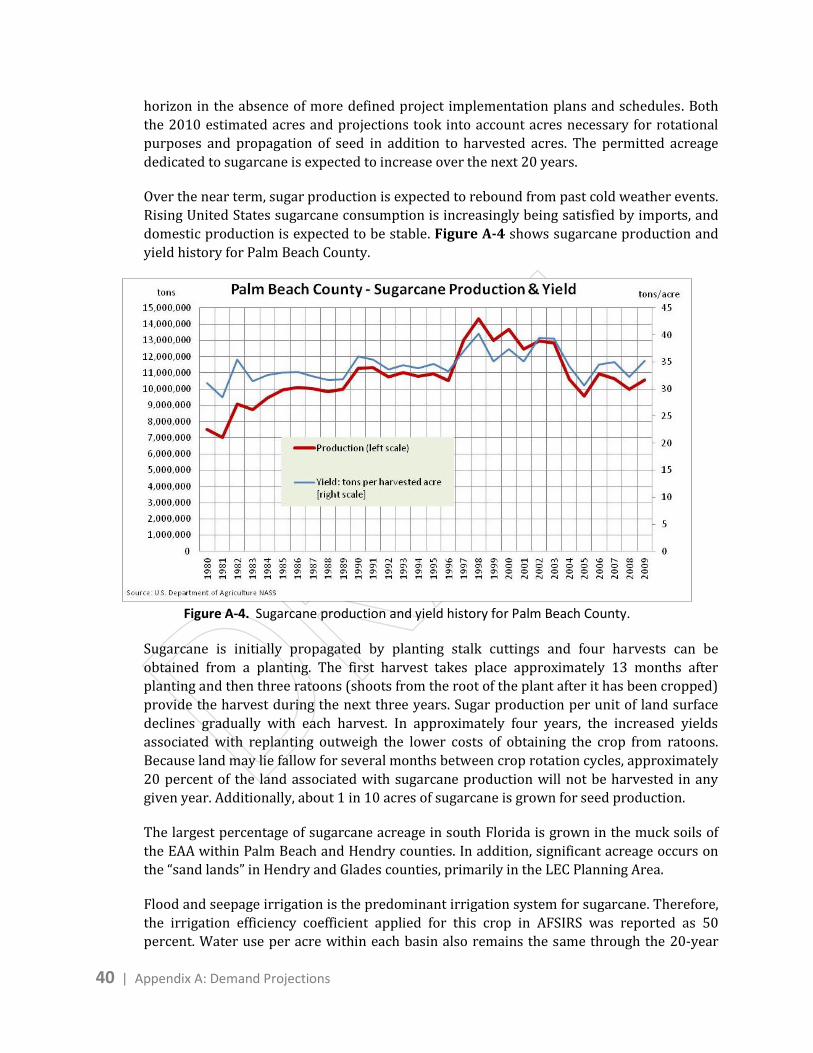
40 | Appendix A: Demand Projections
horizon in the absence of more defined project implementation plans and schedules. Both
the 2010 estimated acres and projections took into account acres necessary for rotational
purposes and propagation of seed in addition to harvested acres. The permitted acreage
dedicated to sugarcane is expected to increase over the next 20 years.
Over the near term, sugar production is expected to rebound from past cold weather events.
Rising United States sugarcane consumption is increasingly being satisfied by imports, and
domestic production is expected to be stable. Figure A-4 shows sugarcane production and
yield history for Palm Beach County.
Figure A-4. Sugarcane production and yield history for Palm Beach County.
Sugarcane is initially propagated by planting stalk cuttings and four harvests can be
obtained from a planting. The first harvest takes place approximately 13 months after
planting and then three ratoons (shoots from the root of the plant after it has been cropped)
provide the harvest during the next three years. Sugar production per unit of land surface
declines gradually with each harvest. In approximately four years, the increased yields
associated with replanting outweigh the lower costs of obtaining the crop from ratoons.
Because land may lie fallow for several months between crop rotation cycles, approximately
20 percent of the land associated with sugarcane production will not be harvested in any
given year. Additionally, about 1 in 10 acres of sugarcane is grown for seed production.
The largest percentage of sugarcane acreage in south Florida is grown in the muck soils of
the EAA within Palm Beach and Hendry counties. In addition, significant acreage occurs on
the “sand lands” in Hendry and Glades counties, primarily in the LEC Planning Area.
Flood and seepage irrigation is the predominant irrigation system for sugarcane. Therefore,
the irrigation efficiency coefficient applied for this crop in AFSIRS was reported as 50
percent. Water use per acre within each basin also remains the same through the 20-year

2012 LEC Water Supply Plan Update | 41
planning horizon; therefore, water use parallels the change in acreage. Table A-16 presents
the acreage projections, projected net irrigation demand under average rainfall and 1-in-10
year drought conditions, and projected gross irrigation demand (water withdrawal
demand) under average rainfall and 1-in-10 year drought conditions.
Table A-16. Gross irrigation requirements for sugarcane acreage in the LEC Planning Area.
Rainfall Year
Water to Sustain Crops (Net Irrigation Requirement;
annual inches based on
rainfall)
Gross Demand (MGD) (total volume needed for withdrawal including net
irrigation demand as well as accounting for system losses and inefficiencies)
2010 2015 2020 2025 2030
Palm Beach County – Coastal
Irrigated Acreage 4,140 acres 3,000 acres 2,500 acres 1,900 acres 1,900 acres
Net Demand Gross Demand (MGD)
Average 6.0 inches 1.8 1.3 1.1 0.8 0.8
1-in-10 year drought 15.4 inches 4.7 3.4 2.9 2.2 2.2
Palm Beach County – EAA
Irrigated Acreage 340,860 acres 352,000 acres 362,500 acres 373,100 acres 383,100 acres
Net Demand Gross Demand (MGD)
Average 6.0 inches 304.3 314.2 323.6 333.0 342.0
1-in-10 year drought 15.4 inches 780.9 806.4 830.5 854.8 877.7
Hendry County – EAA
Irrigated Acreage 20,813 acres 22,263 acres 23,714 acres 25,164 acres 26,615 acres
Net Demand Gross Demand (MGD)
Average 6.0 inches 18.6 19.9 21.2 22.5 23.8
1-in-10 year drought 15.4 inches 47.7 51.0 54.3 57.7 61.0
Hendry County – Western Basins
Irrigated Acreage 18,287 acres 19,562 acres 20,836 acres 22,111 acres 23,385 acres
Net Demand Gross Demand (MGD)
Average 16.2 inches 44.1 47.1 50.2 53.3 56.4
1-in-10 year drought 21.9 inches 59.6 63.7 67.9 72.0 76.2
LEC Planning Area Totals
Total Irrigated Acreage 384,100 acres 396,825 acres 409,550 acres 422,275 acres 435,000 acres
Gross Demand (MGD)
Total average rainfall year 368.8 382.5 396.1 409.6 423.0
Total 1-in-10 year drought 892.9 924.5 955.6 986.7 1,017.1

42 | Appendix A: Demand Projections
Field Crops – Other
Other field crops in the LEC Planning Area include primarily rice, potatoes, and tropical field
crops. Acreage and water use are projected to rise slightly through 2030. Table A-17
presents the acreage projections, the projected net irrigation demand under average rainfall
and 1-in-10 year drought conditions, and the projected gross irrigation demand (water
withdrawal demand) under average rainfall and 1-in-10 year drought conditions.
Table A-17. Gross irrigation requirements for other field crop acreage in the LEC Planning Area.
Rainfall Year
Water to Sustain Crops (Net Irrigation Requirement;
annual inches based on rainfall)
Gross Demand (MGD) (total volume needed for withdrawal including net irrigation demand as well as accounting for system losses and inefficiencies)
2010 2015 2020 2025 2030
Palm Beach County – EAA
Irrigated Acreage 13,000 acres 14,000 acres 15,000 acres 16,000 acres 17,000 acres
Net Demand Gross Demand (MGD)
Average 13.6 inches 26.3 28.3 30.3 32.4 34.4
1-in-10 year drought 19.5 inches 37.7 40.6 43.5 46.4 49.3
Broward County
Irrigated Acreage 40 acres 40 acres 40 acres 40 acres 40 acres
Net Demand Gross Demand (MGD)
Average 7.0 inches 0.0 0.0 0.0 0.0 0.0
1-in-10 year drought 12.4 inches 0.0 0.0 0.0 0.0 0.0
Miami-Dade County
Irrigated Acreage 1,974 acres 2,142 acres 2,196 acres 2,196 acres 2,196 acres
Net Demand Gross Demand (MGD)
Average 8.8 inches 1.7 1.9 1.9 1.9 1.9
1-in-10 year drought 14.0 inches 2.7 3.0 3.0 3.0 3.0
Hendry County – Western Basins
Irrigated Acreage 65 acres 71 acres 73 acres 73 acres 73 acres
Net Demand Gross Demand (MGD)
Average 18.4 inches 0.2 0.2 0.2 0.2 0.2
1-in-10 year drought 23.3 inches 0.2 0.2 0.3 0.2 0.3
LEC Planning Area Totals
Total Irrigated Acreage 15,079 acres 16,253 acres 17,309 acres 18,309 acres 19,309 acres
Gross Demand (MGD)
Total average rainfall year 28.2 30.4 32.4 34.5 36.5
Total 1-in-10 year drought 40.6 43.8 46.8 49.6 52.6

2012 LEC Water Supply Plan Update | 43
Sod Production
Sod projections presented in this appendix refer to irrigated sod. Some sod may be
harvested from pastureland, which is not irrigated. Pasture supporting cow-calf operations
is typically not irrigated because it is not economical. Some pasture in the coastal areas may
include horse farms, ranchettes, etc., which may be irrigated and may have been included
with sod production.
For this update, 2005 and 2010 sod acreages were estimated based on data contained in the
SFWMD Water Use Regulatory Database and historic acreage trends obtained from the
USGS were also compared to building permit time series. Reports from growers indicate
that sod production was hit hard by the 2008–2009 recession. Current acreage is down
considerably from prerecession levels, and the demand from golf courses and urban
landscaping remains depressed. Lead times necessary to prepare land for sod production in
response to customer demand have increased. The projections assume that sod acreage will
continue to fall over the near-term planning period (through 2015), but eventually recover
as the economy grows and urban development resumes a more rapid pace (between 2015
and 2020).
Because the population in the LEC Planning Area is expected to grow, sod demand is
expected to rebound from low levels as community development resumes. Sod irrigation is
provided by several methods, including low volume, sprinkler, and flood irrigation. Based
on the irrigation systems indicated in water use permits, the average irrigation efficiency
for sod was calculated to be 50 percent in the EAA within Palm Beach County, 75 percent in
Broward County, and 50 percent in Hendry County’s western basins.
Growth in sod production and associated water use is expected to decline in coastal
Broward County and remain fairly constant in the EAA and Hendry County’s western basins,
which are the other basins with significant sod production. Irrigation requirements are
similar to those for REC Self-Supply uses and, on a per acre basis, do not change over the
projection period. Table A-18 presents the acreage projections, the projected net irrigation
demand under average rainfall and 1-in-10 year drought conditions, and the projected gross
irrigation demand (water withdrawal demand) under average rainfall and 1-in-10 year
drought conditions.

44 | Appendix A: Demand Projections
Table A-18. Gross irrigation requirements for sod acreage in the LEC Planning Area.
Rainfall Year
Water to Sustain Crops (Net Irrigation Requirement;
annual inches based on rainfall)
Gross Demand (MGD) (total volume needed for withdrawal including net irrigation demand as well as accounting for system losses and inefficiencies)
2010 2015 2020 2025 2030
Palm Beach County – Coastal
Irrigated Acreage 1,953 acres 1,841 acres 2,158 acres 2,474 acres 2,790 acres
Net Demand Gross Demand (MGD)
Average 17.2 inches 2.5 2.4 2.8 3.2 3.6
1-in-10 year drought 21.8 inches 3.2 3.0 3.5 4.0 4.5
Palm Beach County – EAA
Irrigated Acreage 5,047 acres 4,759 acres 5,576 acres 6,393 acres 7,210 acres
Net Demand Gross Demand (MGD)
Average 10.5 inches 7.9 7.4 8.7 10.0 11.3
1-in-10 year drought 18.1 inches 13.6 12.8 15.0 17.2 19.4
Broward County
Irrigated Acreage 9 acres 9 acres 9 acres 9 acres 9 acres
Net Demand Gross Demand (MGD)
Average 17.7 inches 0.02 0.02 0.02 0.02 0.02
1-in-10 year drought 23.1 inches 0.02 0.02 0.02 0.02 0.02
Miami-Dade County
Irrigated Acreage 114 acres 91 acres 110 acres 115 acres 120 acres
Net Demand Gross Demand (MGD)
Average 20.2 inches 0.2 0.1 0.2 0.2 0.2
1-in-10 year drought 24.5 inches 0.2 0.2 0.2 0.2 0.2
Hendry County – Western Basins
Irrigated Acreage 652 acres 652 acres 652 acres 652 acres 652 acres
Net Demand Gross Demand (MGD)
Average 20.5 inches 2.0 2.0 2.0 2.0 2.0
1-in-10 year drought 26.4 inches 2.6 2.6 2.6 2.6 2.6
LEC Planning Area Totals
Total Irrigated Acreage 7,775 acres 7,352 acres 8,505 acres 9,643 acres 10,781 acres
Gross Demand (MGD)
Total average rainfall year 12.6 11.9 13.7 15.4 17.1
Total 1-in-10 year drought 19.6 18.6 21.3 24.0 26.7
2012 LEC Water Supply Plan Update | 45
Greenhouse / Nursery
This category includes a wide variety of nursery, ornamental, and horticulture/floriculture
operations. Crops in this category include palm trees and shrubs grown in the ground,
container nurseries producing woody and herbaceous ornamentals in open fields, and
greenhouse and shade house nurseries producing foliage plants, orchids, bromeliads, and
woody ornamentals for interior spaces. Crops grown in greenhouses may also include
vegetables, herbs, fruits, berries, garden plants for sale, cut flowers, and caladium
bulbs/rhizomes. The same crops may be grown in the open in a nursery setting where the
plants are the product for sale. Sales of these products also fluctuate with economic cycles
and conditions tied to the housing market (community development) and urban landscapes,
both within and outside of south Florida.
For this update, information from the SFWMD Water Use Regulatory Database, the 2007
Census of Agriculture for Florida county data (USDA–NASS 2007), USGS historic acreage, and
county assessor’s office land use data was used to estimate 2010 greenhouse/nursery
acreage and project future acreage. The historic data was also compared to economic
indicators to assess how the recession impacted greenhouse/nursery acres. The recession
took a severe toll on this market segment. Producers in the LEC Planning Area region have
adapted to market conditions by carefully controlling costs and by offering value added
products and amenities to consumers.
Over the near-term period, the projections are based on assuming a bottoming out in
irrigated acres followed by an expansion as the economy recovers over the medium-term
horizon. The “U” pattern of projected acres is based on assuming an eventual recovery in
the housing market and community developments boosting demand for landscaping and
greenhouse/nursery products. Based on the data received, the projected 2010 acreage was
assumed to fluctuate with economic cycles throughout the 20-year planning horizon.
Greenhouse/nursery irrigation is generally provided by low volume methods. The average
irrigation efficiency for this crop category was calculated to be 72 percent in Miami-Dade
County, 50 percent in Palm Beach County, 40 percent in Broward County, and 34 percent in
Hendry County’s western basins.
Estimated greenhouse/nursery acreage and irrigation requirements in the LEC Planning
Area are expected to initially decline until the expansion gains more momentum, and then
to recover to higher levels later in the projection period (between 2015 and 2020).
especially in Palm Beach and Broward counties and remain fairly constant in Miami-Dade
County. Table A-19 presents the acreage projections, the projected net irrigation demand
under average rainfall and 1-in-10 year drought conditions, and the projected gross
irrigation demand (water withdrawal demand) under average rainfall and 1-in-10 year
drought conditions.

46 | Appendix A: Demand Projections
Table A-19. Gross irrigation requirements for greenhouse/nursery acreage in the LEC Planning Area.
Rainfall Year
Water to Sustain Crops (Net Irrigation Requirement;
annual inches based on rainfall)
Gross Demand (MGD) (total volume needed for withdrawal including net irrigation demand as well as accounting for system losses and inefficiencies)
2010 2015 2020 2025 2030
Palm Beach County – Coastal
Irrigated Acreage 3,798 acres 3,545 acres 3,911 acres 4,277 acres 4,642 acres
Net Demand Gross Demand (MGD)
Average 21.2 inches 12.0 11.2 12.3 13.5 14.6
1-in-10 year drought 25.1 inches 14.2 13.3 14.6 16.0 14.6
Palm Beach County – EAA
Irrigated Acreage 702 acres 655 acres 723 acres 790 acres 858 acres
Net Demand Gross Demand (MGD)
Average 10.5 inches 1.1 1.0 1.1 1.2 1.3
1-in-10 year drought 18.1 inches 1.9 1.8 1.9 2.1 2.3
Broward County
Irrigated Acreage 250 acres 172 acres 231 acres 291 acres 350 acres
Net Demand Gross Demand (MGD)
Average 22.7 inches 1.1 0.7 1.0 1.2 1.5
1-in-10 year drought 26.4 inches 1.2 0.8 1.1 1.4 1.7
Miami-Dade County
Irrigated Acreage 9,000 acres 8,063 acres 8,375 acres 8,688 acres 9,000 acres
Net Demand Gross Demand (MGD)
Average 23.3 inches 21.6 19.4 20.1 20.9 21.6
1-in-10 year drought 26.4 inches 24.5 22.0 22.8 23.7 24.5
Hendry County – Western Basins
Irrigated Acreage 500 acres 400 acres 600 acres 700 acres 800 acres
Net Demand Gross Demand (MGD)
Average 22.7 inches 2.48 1.99 2.98 3.48 3.97
1-in-10 year drought 27.3 inches 3.0 2.4 3.6 4.2 4.8
Monroe County
Irrigated Acreage 20 acres 20 acres 20 acres 20 acres 20 acres
Net Demand Gross Demand (MGD)
Average 23.3 inches 0.1 0.1 0.1 0.1 0.1
1-in-10 year drought 26.4 inches 0.1 0.1 0.1 0.1 0.1
LEC Planning Area Totals
Total Irrigated Acreage 14,270 acres 12,855 acres 13,860 acres 14,766 acres 15,670 acres
Gross Demand (MGD)
Total average rainfall year 38.4 34.4 37.6 40.4 43.1
Total 1-in-10 year drought 44.9 40.4 44.1 47.5 48.0
2012 LEC Water Supply Plan Update | 47
Improved Pasture
The SFWMD definition of improved pasture is any pasture with existing or proposed
facilities to deliver supplemental irrigation. Information from agricultural stakeholders
indicates irrigation of improved pasture usually occurs during dry periods to keep grass
alive for the nourishment of cattle because the economic returns associated with cattle
production generally do not justify the expense of year-round pasture irrigation.
The 2005–2006 LEC Plan Update stated that irrigation demand was not estimated for
improved pasture within the LEC Planning Area because they would only relate to some of
the acres some of the time (SFWMD 2006). The SFWMD does not project water demand for
improved pasture because of the intermittent demand and the lack of data and information
required to properly evaluate this issue. However, interagency and stakeholder agricultural
demand subgroups are currently addressing methods for determining intensity of water
use in this area as well as procedures for evaluating potential conversion of pasture lands to
other agricultural crop categories.
Other Agricultural Uses
For both the 2005–2006 LEC Plan Update and this current update, cattle numbers were
obtained from the most current Florida Agricultural Statistics Service Livestock Summary
(USDA 2011). This update does not present estimates for cattle watering because the
volume is insignificant. Aquaculture demand is also not presented because most of the use
represents localized flow through in which the water returns to the source from which it
was taken.
Summary of Agricultural Results
Although estimates and projections for the agricultural subsections have been discussed in
terms of crop use categories, it is also important to summarize the results in terms of total
acreage and use by subbasin. On balance, agricultural acreage and water use are expected to
rise modestly in the LEC Planning Area by 2030. Some small declines expected in coastal
areas will likely be offset by increases in Hendry County and the EAA. The expectation for
the loss of additional agricultural acres due to urbanization has been deferred to much later
periods over the 20-year planning horizon due to a restrained housing market and a slow
economic recovery in south Florida. Competition for agricultural land from developers is
simply not as strong compared to the 2005–2006 LEC Plan Update (SFWMD 2006)
evaluation environment. More generally, the rapid loss of arable land over the last 10 years
throughout the United States has raised the relative value of existing agricultural lands and
placed a renewed emphasis on sustainable land management. Declines in Broward County
and Palm Beach County’s Coastal subbasin are expected primarily due to urbanization.
Little change in agricultural acreage and water use is expected in Miami-Dade County and
Hendry County’s western basins.

48 | Appendix A: Demand Projections
The acreages presented in the tables for this update do not include acreages that are
historically part of the Lake Okeechobee Service Area (LOSA) that lie in the Lower West
Coast, Upper East Coast, and Kissimmee Basin planning areas. In the Lower West Coast
Planning Area, and particularly in the East and West Caloosahatchee subbasins, growth is
expected in the irrigated acreage in the areas that historically have accessed and used
surface water, including water from Lake Okeechobee. In those areas, irrigated crop acreage
is projected to increase from 131,900 acres in 2000 to 145,100 in 2025, an increase of
slightly over 13,000 acres.
Total irrigated agricultural crop categories and acreage are listed in Table A-20. Acreage,
total agricultural net irrigation demand, and gross irrigation demand (water withdrawal
demand) by subbasin are presented in Table A-21.
Table A-20. Crop category and irrigated acreage in the LEC Planning Area.
Crop Category 2010 2015 2020 2025 2030
Citrus 31,628 26,410 28,153 31,897 34,705
Sugarcane 384,100 396,825 409,550 422,275 435,000
Vegetables, melons, and berries 82,530 82,373 82,215 82,066 81,918
Sod 7,775 7,352 8,505 9,643 10,781
Greenhouse/nursery 14,270 12,855 13,860 14,766 15,670
Other fruits & nuts 8,302 8,321 8,282 8,244 8,194
Other field crops 15,079 16,253 17,309 18,309 19,309
LEC Planning Area Total Irrigated Acres 543,684 550,389 567,874 587,200 605,577
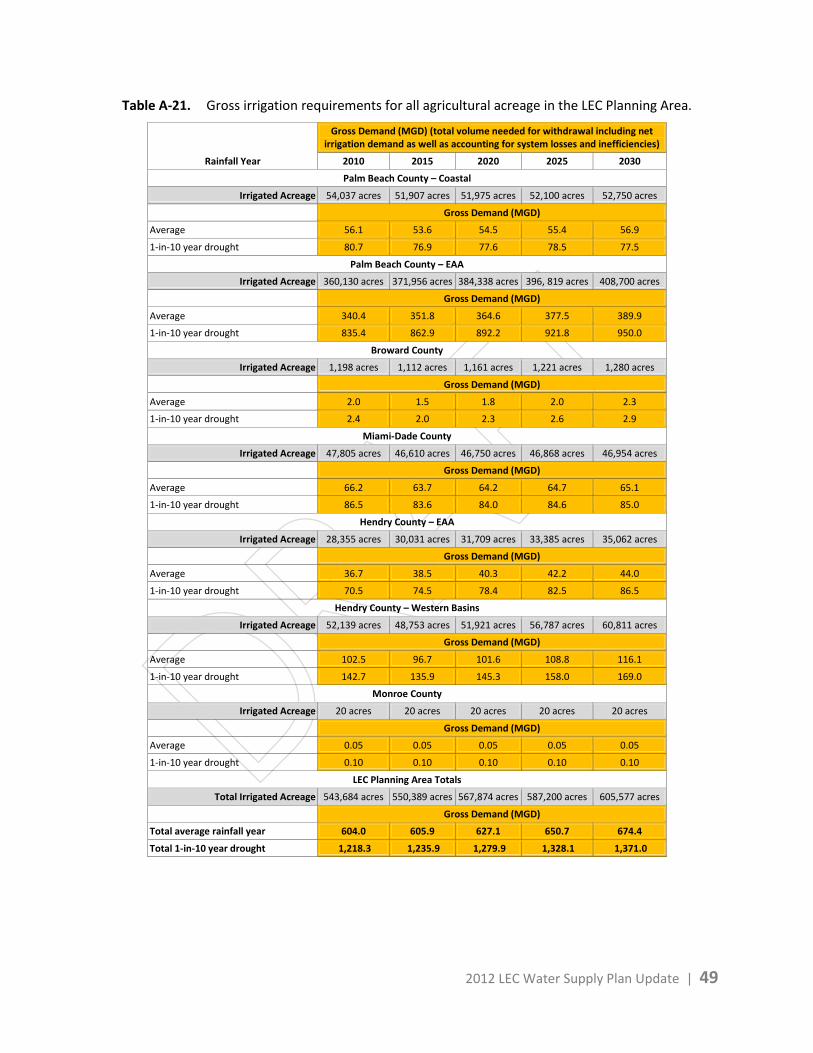
2012 LEC Water Supply Plan Update | 49
Table A-21. Gross irrigation requirements for all agricultural acreage in the LEC Planning Area.
Rainfall Year
Gross Demand (MGD) (total volume needed for withdrawal including net irrigation demand as well as accounting for system losses and inefficiencies)
2010 2015 2020 2025 2030
Palm Beach County – Coastal
Irrigated Acreage 54,037 acres 51,907 acres 51,975 acres 52,100 acres 52,750 acres
Gross Demand (MGD)
Average 56.1 53.6 54.5 55.4 56.9
1-in-10 year drought 80.7 76.9 77.6 78.5 77.5
Palm Beach County – EAA
Irrigated Acreage 360,130 acres 371,956 acres 384,338 acres 396, 819 acres 408,700 acres
Gross Demand (MGD)
Average 340.4 351.8 364.6 377.5 389.9
1-in-10 year drought 835.4 862.9 892.2 921.8 950.0
Broward County
Irrigated Acreage 1,198 acres 1,112 acres 1,161 acres 1,221 acres 1,280 acres
Gross Demand (MGD)
Average 2.0 1.5 1.8 2.0 2.3
1-in-10 year drought 2.4 2.0 2.3 2.6 2.9
Miami-Dade County
Irrigated Acreage 47,805 acres 46,610 acres 46,750 acres 46,868 acres 46,954 acres
Gross Demand (MGD)
Average 66.2 63.7 64.2 64.7 65.1
1-in-10 year drought 86.5 83.6 84.0 84.6 85.0
Hendry County – EAA
Irrigated Acreage 28,355 acres 30,031 acres 31,709 acres 33,385 acres 35,062 acres
Gross Demand (MGD)
Average 36.7 38.5 40.3 42.2 44.0
1-in-10 year drought 70.5 74.5 78.4 82.5 86.5
Hendry County – Western Basins
Irrigated Acreage 52,139 acres 48,753 acres 51,921 acres 56,787 acres 60,811 acres
Gross Demand (MGD)
Average 102.5 96.7 101.6 108.8 116.1
1-in-10 year drought 142.7 135.9 145.3 158.0 169.0
Monroe County
Irrigated Acreage 20 acres 20 acres 20 acres 20 acres 20 acres
Gross Demand (MGD)
Average 0.05 0.05 0.05 0.05 0.05
1-in-10 year drought 0.10 0.10 0.10 0.10 0.10
LEC Planning Area Totals
Total Irrigated Acreage 543,684 acres 550,389 acres 567,874 acres 587,200 acres 605,577 acres
Gross Demand (MGD)
Total average rainfall year 604.0 605.9 627.1 650.7 674.4
Total 1-in-10 year drought 1,218.3 1,235.9 1,279.9 1,328.1 1,371.0

50 | Appendix A: Demand Projections
INDUSTRIAL/COMMERCIAL/INSTITUTIONAL SELF-SUPPLY
This category includes industrial, commercial, and institutional demands not supported by a
public utility. Water used for industrial, commercial, and institutional purposes supplied by
utilities is included with PWS demand.
Projection Methodology
In the LEC Planning Area, the water use projection for ICI Self-Supply assumes that growth
in self-supply for this region is proportional to the underlying economic activity that
generates water demand in population in the area. This ICI Self-Supply use category is
comprised of large facilities for production processing with the largest uses being mining
(i.e., aggregates industry) and food processing (dominated by the sugar industry). Because
of the importance of these large users within the LEC Planning Area, the projection
methodology is based on isolating and assessing the relationship between water
consumption and expected future growth for these sectors.
Permitted water use in this category was used to determine the current ICI Self-Supply
demand. SFWMD historic pumpage data was assessed for each county within the LEC
Planning Area. For Palm Beach County, the analysis was based on separating historic
pumpage between the sugar industry and “other” ICI Self-Supply users since the sugar
industry accounts for a large share of total ICI Self-Supply water use (approximately 50
percent of the county total in 2010). The pumpage reports related to the Palm Beach County
sugar industry permittees were isolated and summed. Water use was then plotted against
trends in annual sugar production (in tons) and evaluated. The trend showed that the sugar
industry’s unit water consumption has fallen per ton of sugar produced since 2000 because
of improvements in process efficiencies.
Over the projected forecast horizon, the trend in more efficient water use was extrapolated
forward such that ICI Self-Supply for Palm Beach County is expected to fall from 5.4 MGD to
3.5 MGD by 2020 and remain at that rate. Nonsugar ICI Self-Supply users are also expected
to use less water per unit of output given the adoption of more sustainable practices. The
amount of the use was assumed to continue until the permit expiration date for each ICI
Self-Supply permit in the SFWMD Water Use Regulatory Database. After that time, the
growth in this sector is projected to increase at the rate of population growth.
For Miami-Dade County, the ICI Self-Supply demand analysis was based on first segregating
the historic water pumpage for the aggregates industry (i.e., mining, quarrying, and rock
washing) and “other” uses. The total water use was dominated by the aggregates industry,
which accounted for 94 percent of the county total in 2011. The projection method was
based on comparing the aggregates industry production to the aggregates industry historic
water pumpage inputs. The Federal Reserve Index of Industrial Production-Nonmetallic

2012 LEC Water Supply Plan Update | 51
Mineral Mining and Quarrying was used for this purpose (FRS 2012). Figure A-5 shows the
historic relationship between these two measures.
Figure A-5. Industrial production and water pumpage in nonmetallic mineral mining and quarrying for
the Miami-Dade County aggregates industry.
Figure A-5 shows that water pumpage for the aggregates ICI Self-Supply segment was
correlated with industrial production and the business cycle. To project the future water
demand for the ICI Self-Supply segment, an annual water demand equation, based on a
fitted statistical function relating water demand to industrial production was applied.
Future annual industrial production for the aggregates industry was projected using official
forecasts of United States economic growth (gross domestic product) and evaluating the
growth rate relationship between mineral mining industrial production and the gross
domestic product. The projections assume that projected water demand will follow
recurring boom and bust patterns of economic growth out to 2030. For Broward County,
the projections assume continued stable water demand for ICI Self-Supply over the 20-year
planning horizon. Pumpage reports for Broward County showed demand coming from the
Deerfield Park Racing Facility and Casino and from the Deerfield Beach Middle School Park.
Current and future demand calculations include information from the SFWMD Water Use
Regulatory Database along with population growth rates for each county. All population
numbers are based on the projections for each individual county shown earlier in this
appendix. ICI Self-Supply projections assume demand between average rainfall and 1-in-10
year drought conditions remains the same, and that withdrawal demand is equal to user
demand so that no distinction is made between net (finished) and gross (raw) water
amounts. It should be noted that, depending on the type of ICI Self-Supply user, a large
share of water demanded is quickly returned to the system for reuse (i.e., rock washing in
the aggregates industry) within the ICI Self-Supply group.

52 | Appendix A: Demand Projections
Projection Results
Table A-22 summarizes the ICI Self-Supply demand estimates and projections in the LEC
Planning Area in five-year increments during the 20-year planning horizon.
Table A-22. ICI Self-Supply demand projections for 2010–2030.
County
Demand Projections (MGD)
2010 2015 2020 2025 2030 Palm Beach 5.4 4.8 3.5 3.5 3.5
Broward 1.59 1.12 1.23 1.32 1.32
Miami-Dade 37.3 34.6 54.0 51.8 51.8
Eastern Hendry 0.0 0.0 0.0 0.0 0.0
Monroe 0.0 0.0 0.0 0.0 0.0
LEC Planning Area Total 44.3 40.5 58.8 56.6 56.6
RECREATIONAL / LANDSCAPE SELF-SUPPLY
The REC Self-Supply category includes self-supplied irrigation demand for large landscaped
recreational areas and golf courses. Landscape irrigation includes water demand for all
parks (small to large), communities and homeowner associations with large common areas
or a master irrigation system, and areas with large green space such as ball fields, stadiums,
and cemeteries. These REC Self-Supply uses are identified through CUPs. With the exception
of individual private home landscape irrigation provided by permitted homeowner
associations, private home landscape irrigation is not included in this water use category.
A significant portion (approximately 30 percent) of REC Self-Supply water demand will be
met by the use of reclaimed water throughout the planning horizon. Not only will this
reduce withdrawal demand on the water resources, it may provide additional recharge to
the SAS.
Projection Methodology
Landscape and golf course acres were identified using the SFWMD Water Use Regulatory
Database. Time series trends of irrigated golf course acreage within the LEC Planning Area
by county were reviewed from 1985 through the present and compared to macro economic
historic indicators for the region. Macro or development history was depicted by a time
series of annual, new, privately owned residential building permits within each LEC
Planning Area county. For example, Palm Beach County’s building permit activity showed a
steady increase from 1990 up until 2003, when they peaked. Permits fell rapidly after this
period and bottomed out during the 2008–2009 recession at 10 percent of their peak 2003
level and 18 percent of the 1990 level. Given the recession and housing crisis, followed by a
weak economic recovery that has been restrained by a structurally troubled and weak
housing market, the demand for new golf courses and existing course expansion has been
stagnant. These recent trends are confirmed by reductions in golf rounds played within the

2012 LEC Water Supply Plan Update | 53
service area (Figure A-6). In light of the slowdown in community development that could
sustain new courses or course expansions, and the pace of economic recovery over the
near- to medium-term period, golf course acreage projection is based on a U-shaped
economic recovery pattern that anticipates continued weakness or lack of development
capable of supporting golf patronage followed by a slow recovery.
Figure A-6. Percentage difference in number of golf rounds played.
Future demand projections also considered county population growth rates, information
provided by local planning officials, and golf course publications. Golf course demand by
county are projected separately and added to the other landscape and recreation demands.
A slower growth rate was assumed for golf courses than the population growth rate based
on industry and local planning estimates of new courses during the 20-year
planning horizon.
Historic patterns of growth in acreage for non-golf course landscaping and recreational
water use were also evaluated since the 2005–2006 LEC Plan Update (SFWMD 2006).
Between 2000 and 2011, these intervening years witnessed a rapid community
development expansion that increased the landscape acreage requiring irrigation. This
trend was visible in homeowners’ association permit applications to irrigate common areas.
This period also corresponded to the housing asset price bubble and a development phase
characterized by unprecedented urban sprawl with community expansion moving
westward within the LEC Planning Area. As a consequence, the SFWMD Water Use
Regulatory Database expanded significantly for the REC Self-Supply water use category.
Once this acreage was committed to communities, it requires future irrigation and this
explains the large increase in water demand since the last plan update for the landscape
component of the REC Self-Supply water use category. With the housing correction and
bubble burst, the projections assume some marginal declines in the landscape irrigated

54 | Appendix A: Demand Projections
acreage category followed by a slight recovery to a plateau over the remainder of the
planning horizon. Non-golf course landscaping and recreational water use was assumed to
increase at the same rate as the county population, with 2010 used as the base year
estimate for the projections, and the 2005 projection from the previous plan update
included for comparison.
REC Self-Supply gross and net irrigation demand calculations for this update applied results
from the AFSIRS, which uses data from the 1965–2000 time frame (Smajstrla 1990). These
model results were used in the 2005–2006 LEC Plan Update (SFWMD 2006) and are used to
calculate AGR Self-Supply irrigation demand. The AFSIRS calculates both gross and net
irrigation requirements.
Gross Irrigation Requirement = Net Irrigation Requirement / Irrigation Efficiency
Demand was calculated using 36 years of rainfall and potential ET climatic data from
appropriate meteorological stations. The analyses also consider soil types, irrigation
methods, and strategies. The irrigation system assumed for REC Self-Supply is sprinkler
irrigation with 75 percent efficiency, and rainfall and potential ET data for the respective
region. The model uses assumed crop coefficients of sod to represent turf and landscape
plants, and calculates demand for average rainfall and 1-in-10 year drought conditions for
each county.
Projection Results
REC Self-Supply acreage projections are shown in Table A-23. The projected net irrigation
(user) demand for each area under average rainfall conditions are shown in Table A-24,
while Table A-25 shows net irrigation demand under 1-in-10 year drought conditions.
Gross irrigation demand (withdrawal demand) under average rainfall conditions is shown
in Table A-26, while Table A-27 presents gross demand under 1-in-10 year drought
conditions. During the 20-year planning horizon, REC Self-Supply demand will increasingly
be met by use of reclaimed water. This will not only reduce withdrawal demand on the
water resources but provide additional recharge of the SAS. It is estimated that for 2010,
total golf course acreage consists of 25,253 acres in the LEC Planning Area, approximately
30 percent of this total acreage was irrigated in part using reclaimed water (per. comm.
with R. Nevulis, SFWMD).

2012 LEC Water Supply Plan Update | 55
Table A-23. Acreage for REC Self-Supply in the LEC Planning Area.
Area
Acreage (acres)
2010 2015 2020 2025 2030
Palm Beach County – Coastal 45,924 44,924 45,731 46,616 47,500
Palm Beach County – EAA 0 0 0 0 0
Broward County 27,700 28,100 28,100 28,100 28,100
Miami-Dade County 8,325 8,375 8,418 8,471 8,525
Hendry County – EAA 0 0 0 0 0
Hendry County – Western Basins 0 0 0 0 0
Monroe County 427.8 428 428 428 428
LEC Planning Area Total 82,377 81,827 82,677 83,615 84,553
Table A-24. Net irrigation demand under average rainfall conditions for REC Self-Supply
in the LEC Planning Area.
Area
Net Irrigation Demand – Average Rainfall Conditions (MGD)
2010 2015 2020 2025 2030
Palm Beach County – Coastal 60.5 59.1 60.2 61.4 62.5
Palm Beach County – EAA 0.0 0.0 0.0 0.0 0.0
Broward County 37.7 38.3 38.3 38.3 38.3
Miami-Dade County 12.8 12.9 13.0 13.0 13.1
Hendry County – EAA 0 0 0 0 0
Hendry County – Western Basins 0 0 0 0 0
Monroe County 0.7 0.7 0.7 0.7 0.7
LEC Planning Area Total 111.6 111.0 112.1 113.3 114.6
Table A-25. Net irrigation demand under 1-in-10 year drought conditions for REC Self-Supply
in the LEC Planning Area.
Area
Net Irrigation Demand – 1-in-10 Year Drought Conditions (MGD)
2010 2015 2020 2025 2030
Palm Beach County – Coastal 74.8 73.2 74.5 75.9 77.4
Palm Beach County – EAA 0.0 0.0 0.0 0.0 0.0
Broward County 47.2 47.9 47.9 47.9 47.9
Miami-Dade County 15.3 15.4 15.5 15.6 15.7
Hendry County – EAA 0 0 0 0 0
Hendry County – Western Basins 0 0 0 0 0
Monroe County 0.8 0.8 0.8 0.8 0.8
LEC Planning Area Total 138.1 137.2 138.6 140.2 141.7
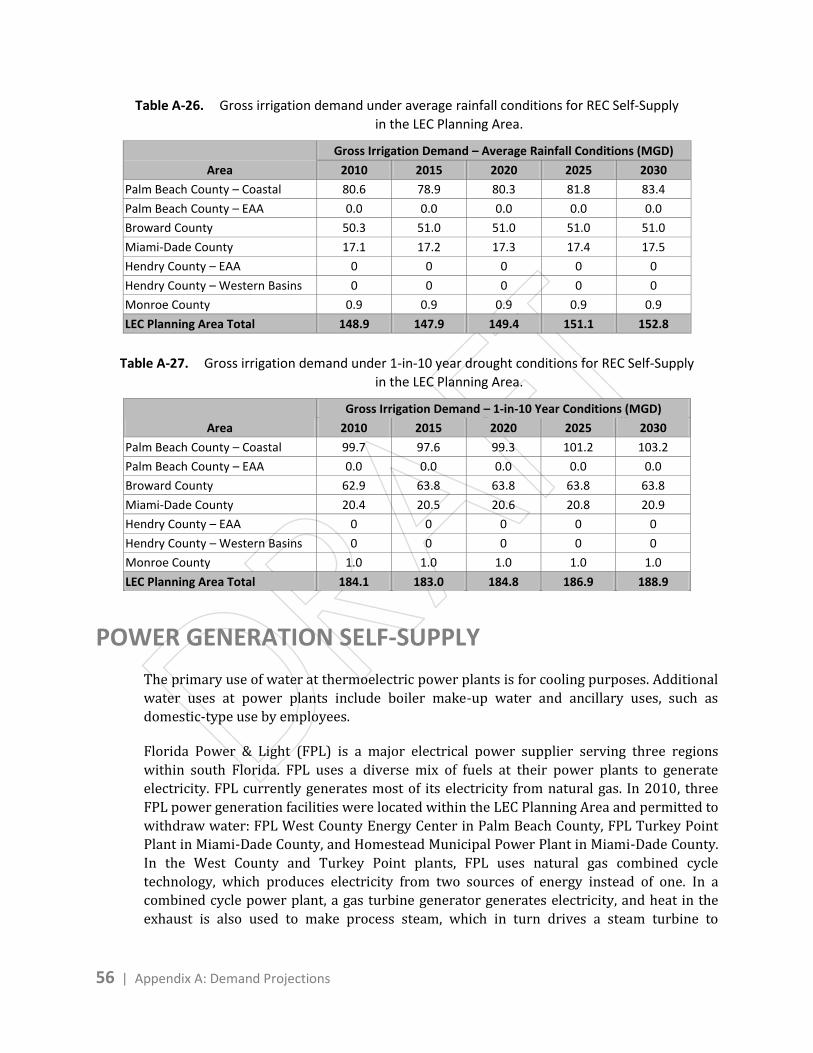
56 | Appendix A: Demand Projections
Table A-26. Gross irrigation demand under average rainfall conditions for REC Self-Supply
in the LEC Planning Area.
Area
Gross Irrigation Demand – Average Rainfall Conditions (MGD)
2010 2015 2020 2025 2030
Palm Beach County – Coastal 80.6 78.9 80.3 81.8 83.4
Palm Beach County – EAA 0.0 0.0 0.0 0.0 0.0
Broward County 50.3 51.0 51.0 51.0 51.0
Miami-Dade County 17.1 17.2 17.3 17.4 17.5
Hendry County – EAA 0 0 0 0 0
Hendry County – Western Basins 0 0 0 0 0
Monroe County 0.9 0.9 0.9 0.9 0.9
LEC Planning Area Total 148.9 147.9 149.4 151.1 152.8
Table A-27. Gross irrigation demand under 1-in-10 year drought conditions for REC Self-Supply
in the LEC Planning Area.
Area
Gross Irrigation Demand – 1-in-10 Year Conditions (MGD)
2010 2015 2020 2025 2030
Palm Beach County – Coastal 99.7 97.6 99.3 101.2 103.2
Palm Beach County – EAA 0.0 0.0 0.0 0.0 0.0
Broward County 62.9 63.8 63.8 63.8 63.8
Miami-Dade County 20.4 20.5 20.6 20.8 20.9
Hendry County – EAA 0 0 0 0 0
Hendry County – Western Basins 0 0 0 0 0
Monroe County 1.0 1.0 1.0 1.0 1.0
LEC Planning Area Total 184.1 183.0 184.8 186.9 188.9
POWER GENERATION SELF-SUPPLY
The primary use of water at thermoelectric power plants is for cooling purposes. Additional
water uses at power plants include boiler make-up water and ancillary uses, such as
domestic-type use by employees.
Florida Power & Light (FPL) is a major electrical power supplier serving three regions
within south Florida. FPL uses a diverse mix of fuels at their power plants to generate
electricity. FPL currently generates most of its electricity from natural gas. In 2010, three
FPL power generation facilities were located within the LEC Planning Area and permitted to
withdraw water: FPL West County Energy Center in Palm Beach County, FPL Turkey Point
Plant in Miami-Dade County, and Homestead Municipal Power Plant in Miami-Dade County.
In the West County and Turkey Point plants, FPL uses natural gas combined cycle
technology, which produces electricity from two sources of energy instead of one. In a
combined cycle power plant, a gas turbine generator generates electricity, and heat in the
exhaust is also used to make process steam, which in turn drives a steam turbine to

2012 LEC Water Supply Plan Update | 57
generate additional electricity. This technology is about 30 percent more efficient than a
traditional steam plant.
The FPL West County Energy Center started serving customers in 2009. After the initial
startup period, brackish water and surface water were utilized for the cooling system;
however, in 2010, Palm Beach County began providing reclaimed water (approximately 22
to 29 MGD contracted) to this facility for cooling purposes.
FPL increased its power generation capacity at the existing Turkey Point Plant by adding
combined cycle generating technology to respond to significant population growth in south
Florida. This combined-cycle unit uses groundwater drawn from the Floridan aquifer while
the other four units use water from the closed cycle recirculation canal system.
The Homestead Municipal Power Plant is a peaking plant. A peaking plant generally runs
only when there is a high demand for electricity. The plant utilizes a once through cooling
system and water is withdrawn from the Biscayne aquifer via 10 existing facilities on an as
needed basis depending on which diesel generating unit is online. The cooling water
discharge point is approximately three miles upstream of the SFMWD salinity control
structure S-179 and therefore, the effluent is generally returned to the aquifer locally and
not discharged to tide.
In the LEC Planning Area, and in most of south Florida, PWR Self-Supply demand has been
met by flow-through cooling using tidal water — not fresh water or brackish groundwater.
However, this pattern is changing as new generation or expansion of existing facilities is
being evaluated. These plants may utilize different cooling technologies based on
environmental, economical, and technically feasible components most appropriate to site-
specific conditions. The different process and cooling technologies may require and utilize
traditional and alternative water supply sources.
The Cutler, Lauderdale, and Port Everglades FPL plants use seawater, which is not
addressed in water supply plans. FPL has removed the 1960s era units at the Riviera Plant
and will replace them with new, state-of-the-art high efficiency units. The plant will begin
serving customers again in 2014 when it will return to service as a Next Generation Clean
Energy Center. The Riviera Plant will use Intracoastal water for once-through cooling water.
FPL has submitted an application with plans to remove the existing Port Everglades Plant
and repower it. Once completed, the rebuilt facility will be known as the Port Everglades
Energy Center. The Port Everglades Plant may use water from the Intracoastal Waterway
for once-through cooling purposes as it does currently; however, reclaimed water is also
an option.
Projection Methodology
Water demand projections were made in conjunction with FPL to reflect expectations for
power demand growth; strategies for obtaining the electricity to meet demand, which leads
to estimation of power plant construction; capacity, types, and locations of power plants;
types of cooling facilities; and ability to achieve efficiencies in water use. Most of these

58 | Appendix A: Demand Projections
factors are subject to considerable uncertainty. The efficacy of meeting demand from
freshwater and saltwater sources needs further consideration, as does the cost-
effectiveness of design and operational strategies that could significantly reduce water use.
The estimates presented in Table A-28 include only the generating capacity expected to be
located in the LEC Planning Area. Additional capacity has been proposed for areas within
the LOSA. This demand was included in the 2011 Upper East Coast Water Supply Plan Update
(SFWMD 2011), Draft Kissimmee Basin Water Supply Plan Update (SFWMD 2012a), and
Draft 2012 Lower West Coast Water Supply Plan Update (SFWMD 2012b). PWR Self-Supply
demand is estimated to be the same for average rainfall and 1-in-10 year
drought conditions.
Projection Results
Projected PWR Self-Supply water demand is presented in Table A-28. These projections are
based on current usage and are assumed to remain the same between average rainfall and
1-in-10 year drought conditions. Because no distinction is needed between net (finished)
and gross (raw) water in this use category, withdrawal demand is the same.
Table A-28. PWR Self-Supply water demand projections.
County Water Demand Projections (MGD)
2010 2015 2020 2025 2030
FPL West County (existing)a
5.2 0 0 0 0
FPL Turkey Point (existing)b
5.0 6.0 7.0 8.0 9.0
FPL Proposedc
0 0 7.6 15.2 22.8
Homestead Municipal (existing) 1.5 1.5 1.5 1.5 1.5 LEC Planning Area Total 11.7 7.5 16.1 24.7 33.3 a. This plant started receiving reclaimed water from Palm Beach County in 2010. b. This is the Turkey Point Plant Unit 5. c. These projections were estimated using conservative two cycles of concentration and not the five cycles of concentration.
The projections account for potential new generation growth and proposed expansion,
which may utilize different cooling technologies based on environmental, economical, and
technically feasible evaluations appropriate to site-specific conditions. The different process
and cooling technologies may require, and utilize, traditional and alternative water supply
sources including captured excess storm water, groundwater from the Floridan aquifer, and
reclaimed water when available.
In the 2005–2006 LEC Plan Update, the estimated PWR Self-Supply freshwater demand for
2005 was only 4.5 MGD, but was expected to grow to 102.9 MGD by 2025 to support
proposed new power generating facilities (SFWMD 2006). However, FPL’s use of seawater,
modernization of plants, and the use of reclaimed water when available, has contributed to
the decrease in PWR Self-Supply water demand. Saltwater withdrawals at the FPL power
plants are not included because the saltwater source does not require a SFWMD permit.

2012 LEC Water Supply Plan Update | 59
TOTAL PLANNING AREA DEMAND AND PLAN COMPARISONS
Total Planning Area Demand
This section summarizes both the total net (user/customer, finished) demand and total
gross (withdrawal, raw) demand in the LEC Planning Area. The projects identified in this
update within Chapter 6 of the Planning Document and Appendix C are designed to meet
net water demand. Table A-29 shows net demand and Table A-30 presents estimated
gross water demand from 2005 to 2030 for the LEC Planning Area under average rainfall
and 1-in-10 year drought conditions.
Table A-29. Finished (net) water demand by water use category in the LEC Planning Area.
Water Use Category
Finished (Net) Water Demand (MGD)
2010 2015 2020 2025 2030
Average Conditions
Public Water Supply 783.4 820.6 857.7 894.1 932.1
Domestic Self-Supply 15.9 16.4 16.8 17.3 17.7
Agricultural Self-Supply 339.8 339.0 351.4 365.1 378.7
Industrial/Commercial/Institutional Self-Supply 44.3 40.5 58.8 56.6 56.6
Recreational/Landscape Self-Supply 111.6 111.0 112.1 113.3 114.6
Power Generation Self-Supply 11.7 7.5 16.1 24.7 33.3
LEC Planning Area Total 1,306.7 1,335.0 1,412.9 1,471.1 1,533.0
1-in-10 Year Drought Conditions
Public Water Supply 858.2 899.0 939.8 979.8 1,021.5
Domestic Self-Supply 17.5 18.0 18.5 19.0 19.5
Agricultural Self-Supply 658.7 663.9 686.7 711.9 736.1
Industrial/Commercial/Institutional Self-Supply 44.3 40.5 58.8 56.6 56.6
Recreational/Landscape Self-Supply 138.1 137.2 138.6 140.2 141.7
Power Generation Self-Supply 11.7 7.5 16.1 24.7 33.3
LEC Planning Area Total 1,728.5 1,766.1 1,858.5 1,932.2 2,008.7

60 | Appendix A: Demand Projections
Table A‐30. Gross water demand by water use category in the LEC Planning Area.
Water Use Category
Gross Water Demand (MGD)
2010 2015 2020 2025 2030
Average Conditions
Public Water Supply 845.3 885.2 925.3 964.6 1,005.9
Domestic Self‐Supply 16.6 17.1 17.5 18.0 18.5
Agricultural Self‐Supply 604.0 605.9 627.1 650.7 674.4
Industrial/Commercial/Institutional Self‐Supply 44.3 40.5 58.8 56.6 56.6
Recreational/Landscape Self‐Supply 148.9 147.9 149.4 151.1 152.8
Power Generation Self‐Supply 11.7 7.5 16.1 24.7 33.3
LEC Planning Area Total 1,670.8 1,704.1 1,794.2 1,865.7 1,941.5
1‐in‐10 Year Drought Conditions
Public Water Supply 926.0 970.1 1,014.2 1,057.3 1,102.4
Domestic Self‐Supply 18.2 18.8 19.3 19.8 20.3
Agricultural Self‐Supply 1,218.3 1,235.9 1,279.9 1,328.1 1,371.0
Industrial/Commercial/Institutional Self‐Supply 44.3 40.5 58.8 56.6 56.6
Recreational/Landscape Self‐Supply 184.1 183 184.8 186.9 188.9
Power Generation Self‐Supply 11.7 7.5 16.1 24.7 33.3
LEC Planning Area Total 2,402.6 2,445.8 2,573.1 2,673.4 2,772.5
Comparison of 2005–2006 LEC Plan Update Amendment and Current Update Projected Water Demands
The top part of Table A31 compares the projected average rainfall condition gross water demand estimated in the 2005–2006 LEC Plan Update (SFWMD 2006) with those estimated for this update. the bottom half of Table A31 does the same for the projected 1‐in‐10 year drought conditions water demand. The most significant differences between the demand estimates in the 2005–2006 LEC Plan Update and this update relate to the following developments:
The rise in the total REC Self‐Supply total demand is attributable to the landscape component, not golf courses. The landscape component grew rapidly in response to community development and common areas requiring self‐supply irrigation between the two plan evaluation periods.
The small increase in PWR Self‐Supply relates to the continued increase in use of alternative sources such as reclaimed water, seawater, and coastal brackish water for thermo‐cooling purposes and improvements in process efficiencies (less water demanded per kilowatt hour of energy produced).

2012 LEC Water Supply Plan Update | 61
Table A-31. End point projections of gross water demand under average rainfall and 1-in-10 year
drought conditions in the 2005–2006 LEC Plan Update and this update.
Water Use Category
2005–2006 LEC Plan Update Demand for 2025
(MGD)
2012 LEC Plan Update Demand for 2030
(MGD)
Average Conditions
Public Water Supply 1,286.5 1,005.9
Domestic Self-Supply 48.9 18.5
Agricultural Self-Supply 689.1 674.4
Industrial/Commercial/Institutional Self-Supply 61.3 56.6
Recreational/Landscape Self-Supply 84.8 152.8
Power Generation Self-Supply 102.6 33.3
LEC Planning Area Total 2,273.2 1,941.5
1-in-10 Year Drought Conditions
Public Water Supply 1,363.7 1,102.4
Domestic Self-Supply 51.8 20.3
Agricultural Self-Supply 1,396.4 1,371.0
Industrial/Commercial/Institutional Self-Supply 61.3 56.6
Recreational/Landscape Self-Supply 104.4 188.9
Power Generation Self-Supply 102.6 33.3
LEC Planning Area Total 3,080.2 2,772.5
REFERENCES
BEBR. 2011. Projections of Florida population by county 2010–2040. Bureau of Economic and Business Research, University of Florida, Gainesville, FL. Florida Population Studies. Volume 44, Bulletin 159 (Authors: S.K. Smith and S. Rayer).
DCFB. 2012. Agriculture: The Lifeblood of South Dade. Dade County Farm Bureau, available online at http://www.dade-agriculture.org/
FRS. 2012. Nonmetallic Mineral Mining and Quarrying. Federal Reserve System Board of Governors, Washington, DC. NAICS 2123.
Smajstrla, A.G. 1990. Agricultural Field Scale Irrigation Requirements Simulation (AFSIRS) Model, Version 5.5. Agricultural Engineering Department, University of Florida, Gainesville, FL.
SFWMD. 1998. Districtwide Water Supply Assessment. South Florida Water Management District, West Palm Beach, FL.
SFWMD. 2006. 2005–2006 Lower East Coast Water Supply Plan Update. South Florida Water Management District, West Palm Beach, FL.

62 | Appendix A: Demand Projections
SFWMD. 2011. 2011 Upper East Coast Water Supply Plan Update. South Florida Water Management District, West Palm Beach, FL.
SFWMD. 2012a. Draft 2012 Kissimmee Basin Water Supply Plan Update. South Florida Water Management District, West Palm Beach, FL.
SFWMD. 2012b. Draft 2012 Lower West Coast Water Supply Plan Update. South Florida Water Management District, West Palm Beach, FL.
U.S. Census Bureau. 2010. Florida 2010 Census of Population and Housing. United States Census Bureau, United States Department of Commerce, Washington, D.C. Available online at http://2010.census.gov/2010census/.
USDA–NASS. 2007. 2007 Census of Agriculture for Florida. United States Department of Agriculture – National Agricultural Statistics Service, Washington, DC. Available online at www.nass.usda.gov/fl/.
USDA. 2011. Florida Livestock, Dairy, and Poultry Summary 2010. Florida Agricultural Statistics Service, United States Department of Agriculture, Maitland, FL. June 2011. http://www.nass.usda.gov/Statistics_by_State/Florida/Publications/Livestock_and_Poultry/ldpsum10/ldps10p.pdf