aacl bioflux · aacl bioflux, 2015, ... and sea-ranching, ... fertilized standalone hydroponic...
TRANSCRIPT

AACL Bioflux, 2015, Volume 8, Issue 1. http://www.bioflux.com.ro/aacl 89
AACL BIOFLUX Aquaculture, Aquarium, Conservation & Legislation International Journal of the Bioflux Society Significant factors affecting the economic sustainability of closed aquaponic systems. Part III: plant units Harry W. Palm, Madeline Nievel, Ulrich Knaus
University of Rostock, Faculty of Agricultural and Environmental Sciences, Aquaculture
and Sea-Ranching, Justus-von-Liebig-Weg 6, 18059 Rostock, Germany. Corresponding author: H. W. Palm, [email protected]
Abstract. The hydroponic unit of two identical closed ebb-flow substrate aquaponic systems for warm-water fish were tested for water parameter differences of dissolved oxygen (DO) [mg L-1], temperature [°C], pH and phosphorus [mg L-1] under Nile tilapia (Oreochromis niloticus) cultivation. Each system contained 3.7 m3 water, and the relationship of the water volume in the aquaculture tank to the settling basin (sedimenter, clarifier), the biofilter and the hydroponic units was 2.25:1:0.075:0.6 (fish tank:hydroponic unit = 3.75). The hydroponics were built as gravel bed aggregate systems with a single nutrient enriched water inlet for each of four plant units, and a horizontal sub-irrigation towards the outlet. Related to an increasing feed input into the fish tanks, DO levels in the hydroponic units were lowest inside the system (1-4.7 mg L-1). This is a favourable place for oxygen level monitoring to indicate a stable performance. Declining DO trends were observed in both cycles, with significant differences (p < 0.05) within cycle I and II on 4 consecutive days. Oxygen means of cycle I and II were significant only on day I. Inside the 2 m2 plant boxes, slightly decreasing trends in DO distribution towards the outlet were observed. Time series of all four experimental days (ANOVA, p < 0.05) showed varying values of phosphorus with highest levels on sampling day III in both cycles. Following an increase in feed input, a sluggish phosphorus accumulation inside the plant boxes was observed. Parallel arrangement of the 4 plant boxes in each cycle had no influence onto water parameters within each plant box. Within each cycle no trend was observed, total parameter values differed only slightly, influenced by the system design of the hydroponic units. Plant growth was different in cycle I and II. Best growth was recorded close to the nutrient enriched water inlet into the plant boxes, assessing the chosen central nutrient water irrigation system as sub-optimal for plant growth. Cucumber and zucchini showed better biomass gain (sum 7.60 kg) in plant box II of cycle II than in other plant boxes, suggesting variable conditions inside the plant boxes of the tested aquaponic system. Key Words: aquaponics, hydroponics, sub-irrigation, system design, ebb and flow system, fish and plant combination, Tilapia.
Zusammenfassung. Die Hydroponikeinheit zweier identischer Ebbe-und Flut Substrat-Aquaponiksysteme, mit Haltung von Nil Tilapien (Oreochromis niloticus), wurden hinsichtlich der physikalisch-chemischen Wasserparameter Sauerstoff [mg L-1], Temperatur [°C], pH und Phosphor [mg L-1] verglichen. Die Aquaponiksysteme wurden im geschlossen Süßwasserkreislauf betrieben. Jedes System besaß ein Wasservolumen von 3,7 m³, mit einem Verhältnis des Aquakulturbehälters zum Sedimenter, dem Biofilter und der Hydroponikeinheit von 2,25:1:0,075:0,6 (Fischbehälter:Hydroponik Einheit = 3,75). Die Hydroponikeinheit des Aquaponiksystems bestand aus Kiessubstrat mit einem zentralen Einlauf der Nährstofflösung am Anfang jeder Pflanzenkiste und einer horizontal linearen Wasserverteilung über dem Substrat zum Auslauf hin. In Abhängigkeit eines kontinuierlich erhöhten Futtermitteleintrages in den Fischbehältern zeigte der Sauerstoffgehalt in der Hydroponik die geringsten Werte (1-4,7 mg L-1). An dieser Stelle lässt sich der Sauerstoffgehalt zur Überprüfung der Systemstabilität am besten beobachten. Abnehmende Sauerstoffverhältnisse wurden in beiden Kreisläufen beobachtet, mit signifikanten Unterschieden (p < 0,05) innerhalb Kreislauf I und II an allen 4 Datenaufnahmetagen. Die Mittelwerte von Sauerstoff zwischen Kreislauf I und II waren nur an Tag I signifikant im Vergleich zu den anderen Tagen. Innerhalb der 2 m² Pflanzenkisten wurden teilweise gering abnehmende Sauerstoffverteilungen vom Einlauf zum Ablauf beobachtet. Der Phosphorgehalt aller vier Tage (ANOVA, p < 0,05) zeigte variierende Werte mit höchsten Anteilen an Tag III in beiden Kreisläufen. Durch erhöhte Futtermittelvergaben kam es zu einer zeitlich versetzten Akkumulation von Phosphor in den Pflanzenkisten (Trägheitseffekt). Die parallele Anordnung der Pflanzenkisten zeigte keinen Einfluss auf die Wasserparameter. Innerhalb eines Kreislaufes wurden keine Trends beobachtet, die Werte zeigten nur geringe Differenzen, beeinflusst durch den Aufbau der Hydroponikeinheiten. Das Pflanzenwachstum war zwischen Kreislauf I und II verschieden. Das beste Pflanzenwachstum wurde nahe dem Einlauf am Anfang der Pflanzenkisten beobachtet, wodurch ein zentraler Nährstoffeinfluss als

AACL Bioflux, 2015, Volume 8, Issue 1. http://www.bioflux.com.ro/aacl 90
suboptimal für das Pflanzenwachstum bewertet werden kann. Gurken und Zucchini zeigten besseres Wachstum (Summe 7,60 kg) in Pflanzenkiste II von Kreislauf II als in den anderen Pflanzenkisten. Schlüsselworte: Aquaponik, Hydroponik, Bewässerung, System Design, Ebbe- und Flut System, Fisch und Pflanze Kombination, Tilapia.
Introduction. Economic sustainability of aquaponics, the combination of aquaculture and hydroponics, depends on a variety of factors, including system and feed design, animal welfare or parasite and pathogen control (Palm et al 2014a). Rakocy et al (2006) described the essential components of aquaponic systems as the fish rearing tanks, components for settable and suspended solids removal, biofilter, sump and hydroponic units for plant production. However, size, arrangement and the management of fish and plant production determine their functionality. Palm et al (2014a) referred to the component ratios (fish-to-plant-units, water volume, clarifier volume or biofilter volume), water exchange rates, aeration, waste removal and different cultivation methodologies such as batch, staggered, intercropping or polyculture. Successful aquaponic production must consider both optimal fish and plant species selection (Palm et al 2014b) as well as the best suitable cultivation technologies.
Soilless cultivation in a nutrient solution (hydroponics, Raviv & Lieth 2008) includes the use of different aggregates (organic or inorganic substrates) and techniques for the nutrient supply such as floating raft aquaponics (Rakocy 1989; Rakocy et al 2004; Al-Hafedh et al 2008), nutrient film technique (NFT, Kloas et al 2011), deep-flow technique (DFT) or aeroponics. In the latter, the plant roots are sprayed directly with a nutrient enriched solution with the help of water nozzles (Farran & Mingo-Castel 2006). Most common are aggregate systems using inert substrates like stone wool or gravel for plant root fixation and water preservation (Raviv & Lieth 2008). Rakocy et al (2006) suggested economical savings with the use of substrates for biofiltration in hydroponics at the same time. The oxidation of ammonia to nitrite and nitrate by bacteria (e.g. Nitrosomonas, Nitrobacter) settling on a substrate can replace additional biofilters commonly used in recirculation aquaculture and closed non-aggregate aquaponic systems.
Sand as a substrate was studied by McMurtry et al (1997) in a system with hybrid tilapia (Oreochromis mossambicus X Oreochromis niloticus) and tomatoes (Solanum lycopersicum). Graber & Junge (2009) tested a light-expanded clay aggregate (LECATM) as a substrate for the cultivation of aubergine (Solanum melongena), tomato and cucumber (Cucumis sativus) with Nile tilapia (O. niloticus) and Eurasian perch (Perca fluviatilis), resulting in highest nutrient removal rates under tomato culture. Lewis et al (1978) examined in outdoor hydroponic tanks with gravel the production of three varieties of tomatoes and channel catfish (Ictalurus punctatus), revealing excellent water quality parameters. Also Palm et al (2014b) studied the effect of a gravel based aquaponic system (ebb-and flow) on Nile tilapia, African catfish (Clarias gariepinus) and different plants (lettuce - Lactuca sativa, tomato, cucumber and basil - Ocimum basilicum), demonstrating a significantly better plant growth with the Nile tilapia. The substrate selection has direct consequences for biofilter activity and nutrient availability for the cultivated plants within the tested system.
Graber & Junge (2009) compared the LECATM system (aquaponics), a stand alone fertilized hydroponics and a soil cultivation under irrigation with fish tank water. The LECATM substrate functioned as a biofilter with positive effects on nitrification and micro- and macronutrient uptake by the plants. Fish growth of Nile tilapia and Eurasian perch was identical to traditional aquaculture production, and tomatoes showed highest nutrient recycling capability, followed by aubergine and cucumber. Comparison of the optimal fertilized standalone hydroponic system with aquaponics demonstrated less nitrogen (factor 3) and phosphorus (factor 10) in the aquaponic system, with equal yields of tomatoes in aquaponics, hydroponics, and soil cultivation. However, the fish tank water showed a 45 times lower concentration of potassium in comparison to the hydroponic system, negatively affecting the tomato fruit quality from aquaponic production. The experiment demonstrated an adequate use of the LECATM trickling filter system for plant

AACL Bioflux, 2015, Volume 8, Issue 1. http://www.bioflux.com.ro/aacl 91
production, an almost identical tomato yield in both systems (hydroponic, aquaponic) and no fishy taste of the fruits.
The aquaponic system in the present study was built as a low-tech warmwater closed recirculating gravel ebb-and flow system for the production of Nile tilapia in freshwater (Palm et al 2014a). Different plants were cultivated with a single central nutrient water inflow at one side of each of 4 plant boxes in each cycle, followed by water irrigation towards a single plant box outlet. We herewith report the physical and chemical water parameters inside each plant box during 4 experimental days with different feed input. Possible effects of the water distribution within the plant boxes onto oxygen and phosphorus levels, with relevance for the observed plant growth, are discussed.
Material and Method
Experimental design and data collection. Two closed aquaponic recirculation units (cycle I, cycle II) were built for freshwater and warmwater fish and plant cultivation (Palm et al 2014a, b). The water volume was 3.7 m3 in each recirculation system, with a relationship of the water volume in the aquaculture unit (1,800 L), the sedimenter (800 L), the biofilter (60 L volume biocarrier), and the hydroponic unit (480 L) of 2.25:1:0.075:0.6 (fish tank:hydroponic unit = 3.75). The plant boxes (1.00 x 2.00 x 0.30 m) were laid out with polyethylene foil (3 mm) and filled with gravel (2,000 kg each cycle) as a substrate, with a maximum water level of 20 cm (120.00 L). The plant boxes were equipped with a water siphon (bell pipe) that allowed one maximum water level per hour (ebb and flow system, 24 times per day). The filtered amount of water through the plant boxes was set for 11,520 L per day, passing through the hydroponic unit 3.1 times in 24 hours.
Each plant box in both units was equipped with 9 polyvinyl chloride (pvc) test tubes, with a height of 15 cm and 1.2 cm in diameter, and an arrangement of three tubes in one row (Figure 1).
Figure 1. Schematic overview of one 2 m2 plant box with inflow, plant cultivation area, test tubes, gravel substrate, water flow, outflow and sump.
The nutrient water inflow was set at the centre of one side of each box, with the water flowing towards the outlet. Physical water parameters of temperature [°C], oxygen [mg L-1] and pH were taken from the test tubes using a HQ40D multimeter (Hach Lange GmbH, Germany). Additional probes were filtered with a Whatman GF6 glass filter, and the phosphorus [mg L-1] content was analysed by using a spectral photometer DR-3900 (Hach Lange GmbH, Germany). Samples were taken on four days (09.07.2012 (day I), 16.07.2012 (day II), 23.07.2012 (day III) 30.07.2012 (day IV)) under daily feed input

AACL Bioflux, 2015, Volume 8, Issue 1. http://www.bioflux.com.ro/aacl 92
levels of 243.00 g, 327.5 g, 175.00 g, and 215.00 g respectively, during the steady phase of sub-experiment III (SE III) as described by Palm et al (2014a). Fish and plant species. The aquaculture units of cycle I and II were stocked on the 21.03.2012 with 398 Nile tilapia postlarvae of 0.50 g (Palm et al 2014a). The total experimental time of 160 days was divided into three sub-experiments (SE I, SE II and SE III), with the present sampling describing the water parameters in the plant boxes of four sampling days (duration) within SE III, recorded as day I (equals day 111 of Palm et al 2014a), day II (day 118), day III (day 125) and day IV (day 132). Fish weight on day 112 in cycle I was 25.94 g (±9.73) and 22.64 g (±9.17) in cycle II, whereas fish weight on day 132 in cycle I was 46.83 g (±23.10) and in cycle II 41.55 g (±16.04). Fish were fed with E-2P Stella (Skretting) with 47% crude protein, 14% crude lipid, 2.60% crude fibre and 6.50% crude ash, one time daily by hand.
Plant cultivation in each cycle was different. Seeds originated from N. L. Chrestensen Erfurter Samen- und Pflanzenzucht GmbH (Erfurt, Germany). Cycle I was planted with 60 tomato type Moneymaker, 11 butterhead lettuce type Mona, 11 lettuce type Lollo rosso, and 11 spinach (Spinacia oleracea) type Matador. Plant box I was planted with tomato (n = 15) and lettuce (n = 8), plant box II with tomato (n = 15) and spinach (n = 8), plant box III with tomato (n = 15) and lettuce (Lollo rosso, n = 8) and plant box IV with tomato (n = 15), lettuce (n = 3), spinach (n = 3) and lettuce (Lollo rosso, n = 3).
A wider range of plant species was cultivated in cycle II: 5 tomato type Moneymaker, 10 paprika (Capsicum annum) type Yolo Wonder, 5 broccoli (Brassica oleracea var. italica) type Calabrese natalino, 8 butterhead lettuce type Mona, 8 zucchini (Cucurbita pepo) type Diamant F1 hybrid, 7 cucumber type Montea, 8 spinach type Matador, 5 aubergine type Early Long Purple 3, 8 lettuce type Lollo rosso, 3 peppermint (hybrid Mentha × piperita), 3 basil, 3 chives (Allium schoenoprasum) type Polyvit and 3 rosemary (Rosmarinus officinalis). Plant box I was planted with tomato (n = 5), broccoli (n = 5), paprika (n = 5) and lettuce (n = 8). Plant box II was planted with zucchini (n = 8), cucumber (n = 7) and spinach (n = 8). In plant box III was grafted paprika (n = 5), aubergine (n = 5) and lettuce (Lollo rosso, n = 8). Plant box IV was planted with rosemary (n = 3), peppermint (n = 3), chives (n = 3) and basil (n = 3).
Statistical analyses. Tests were performed in order to identify possible differences of physical and chemical water parameters inside the plant boxes, caused by the plant box system design (water inflow, ebb-and flow interval) and different plant species cultivation, as compared between cycle I and cycle II and inside the boxes of each cycle. Within the hydroponic unit two groups (means, comparison between cycle I and II and between each box of cycle I and cycle II) were compared and tested using the Shapiro-Wilk test, followed by the t-test and Levene statistics, in the case of normal distribution. Otherwise, the Mann-and-Whitney test was performed in order to determine significant differences at the p < 0.05 level. Analyse of variance (ANOVA, p < 0.05) was used to determine significant differences between more than two groups of water parameters with Levene test and post hoc Tukey-HSD test at variance homogeneity. Otherwise, the Dunnett-T3 test for variance inhomogeneity was used. All data were analysed by Microsoft Excel (2010) and the SPSS 20.0 statistical software package (IBM).
Results. Dissolved oxygen (DO) [mg L-1] values as determined from the 9 test tubes in each plant box decreased for cycle I and II from day I until IV (Figure 2, Table 1). Insignificant differences were found in cycle I on day II and III, and in cycle II on day III and IV. In cycle I the linear regression was y = -1.1245x+5.0598 (R² = 0.7735), and the absolute DO levels of cycle II were nearly the same, with the regression curve y = -1.0338x+4.8139 (R² = 0.7734). Temperature decreased significantly in both cycles, from 25.39°C (±0.52, day I) to 22.29°C (±0.14, day IV) in cycle I and from 25.68°C (±0.60, day I) to 22.49°C (±0.23, day IV) in cycle II (Table 1). The observed pH values differed only slightly during the experiment, with values around 7.6. Cycle I showed two homogenous groups of pH with 7.64 (day I, day IV) and 7.62 (day II, day III, Table 1) whereas the pH values of

AACL Bioflux, 2015, Volume 8, Issue 1. http://www.bioflux.com.ro/aacl 93
cycle II were not significant on day I (7.65 ±0.04), day II (7.63 ±0.02) and day III (7.66 ±0.08) but differed on day II (7.63 ±0.02) and day IV (7.65 ±0.03). Levels of phosphorus were highest in cycle I and day III with 2.14 mg L-1 (±0.62), followed by day IV with 1.72 mg L-1 (±0.27), day I with 1.19 mg L-1 (±0.34) and day II with the lowest value of 0.94 mg L-1 (±0.09). The same trend was observed in cycle II, with highest phosphorus values on day III with 1.47 mg L-1 (±0.40), followed by day IV with 1.34 mg L-1 (±0.27), and non-significant values of day I with 0.96 mg L-1 (±0.25) and day II with 0.89 mg L-1 (±0.06, Table 1).
Figure 2. Oxygen [mg L-1] gradient on sampling days I, II, III, IV and in cycles I & II. Lowercase showing significant groups (p < 0.05, t-test) of cycle I & II on the same experimental day, capital letter showing significant groups (p < 0.05, ANOVA) of the same cycle (cycle I = bold, cycle II =
light) on all days (time series).
Plant growth differed between cycle I and II. In cycle II, growth of cucumber and zucchini (plant box II) showed better biomass weight gain (sum 7.60 kg) than all other plant species. In general, a better biomass weight gain of the plants was observed close to the nutrient water inflow in each of sampled plant boxes (Figure 3).
The comparison of water parameters between each plant box of cycle I & II showed no trends due to the parallel arrangement. Means of water parameters of plant boxes were combined and tested independently in cycle I and II on the different sampling days (Tables 2, 3). In cycle I, oxygen [mg L-1] was the solidest parameter. Non-significant differences were found in groups of oxygen [mg L-1], temperature [°C] and pH on day II (Table 2) and day III (Table 3). In general, more significant differences of tested parameters were found than non-significant (p < 0.05). In contrast, cycle II showed the same amount of significant and non-significant differences between means of water parameters. Also, oxygen [mg L-1] was the most stable parameter in cycle II. DO levels, temperature and pH were non-significant. Phosphorus [mg L-1] showed significant differences between plant boxes of both cycles with moderate variations on all experimental days and partly higher levels on the fourth day.
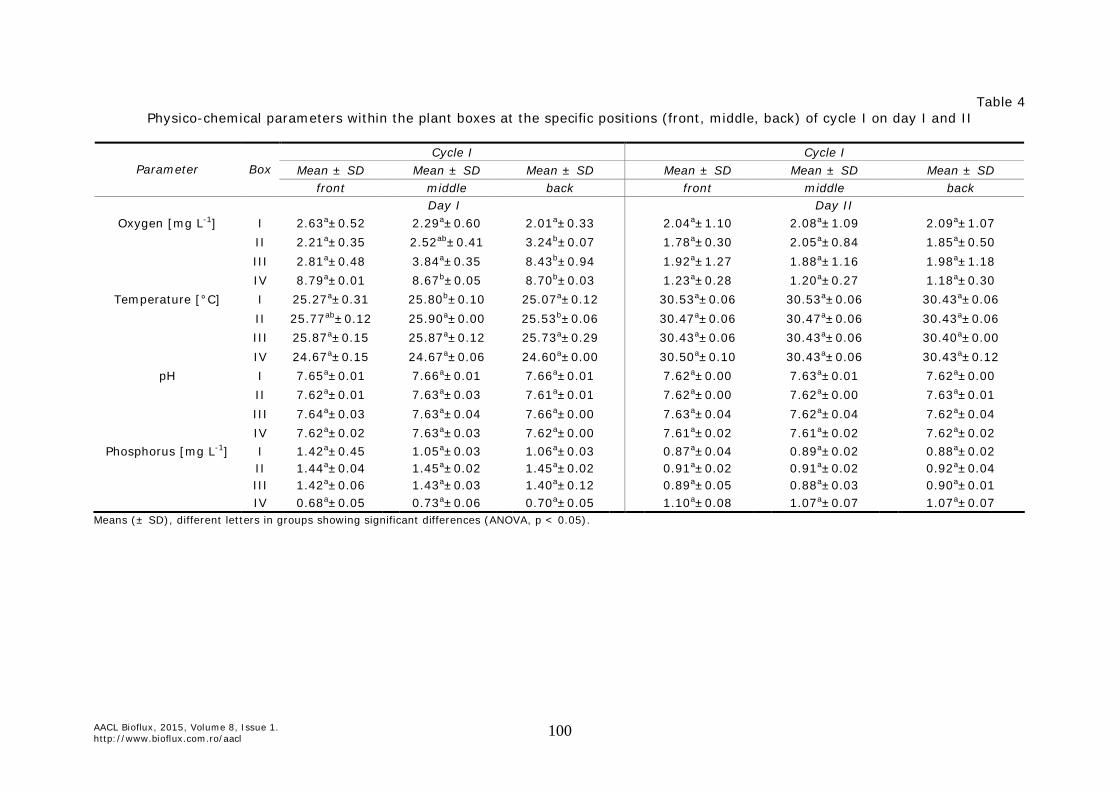
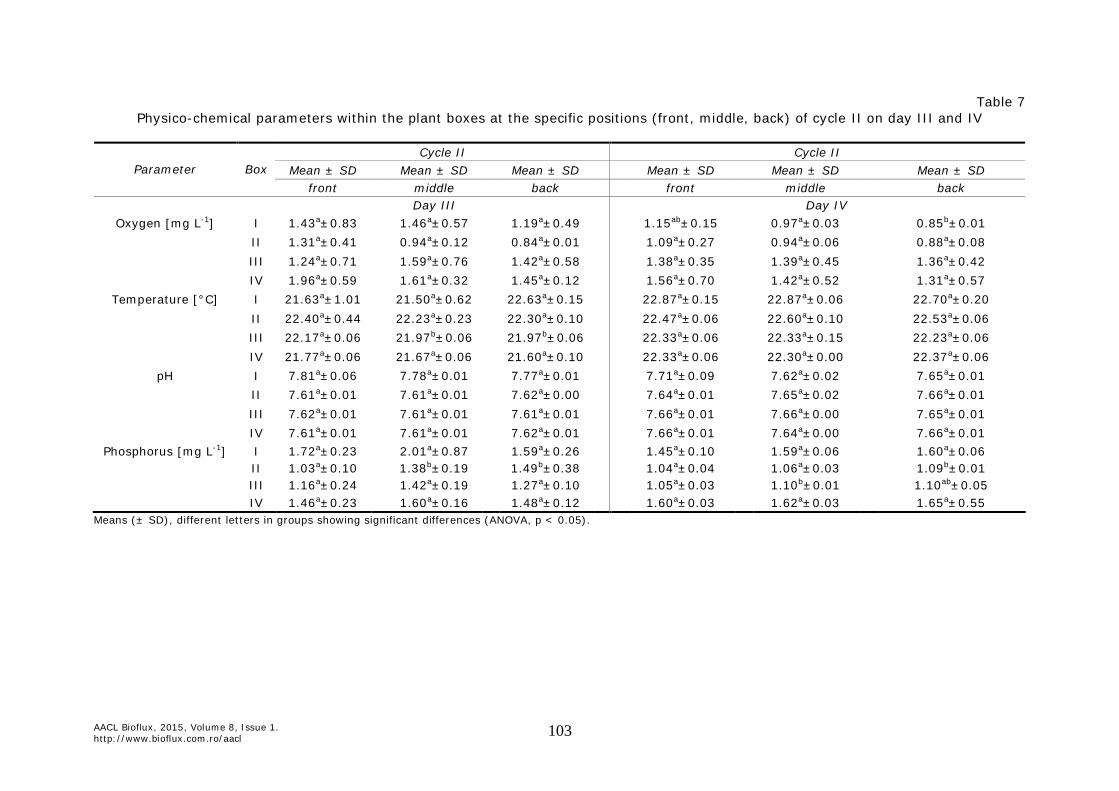
The comparison of water parameters at the different positions inside each box showed partly decreasing trends. Each plant box (n = 4) in cycle I and cycle II was tested for water parameter significance (ANOVA, p < 0.05) on the respective sampling day. Three groups of test tubes (n = 9) were named as “front” (near the nutrient water inflow), “middle” and “back” (near the outflow, Tables 4, 5, 6, 7). In both cycles, pH was the most stable parameter with no significant differences on all days and positions,

AACL Bioflux, 2015, Volume 8, Issue 1. http://www.bioflux.com.ro/aacl 94
followed by oxygen levels with 5 significant groups in total. Slightly decreasing trends of oxygen were observed on day III in cycle I box II (1.60 mg L-1 front tubes, 1.52 mg L-1 middle position, 1.16 mg L-1 back position) and cycle II on day IV in box I with 1.15 mg L-1 (front), 0.97 mg L-1 (middle) and 0.85 mg L-1 (back position). Day II showed best results with no significant differences of all parameters in both cycles and positions.
Figure 3. Better growth of cucumber and lettuce near the centred plant box inflow at the top of the box.
Discussion. The present study describes the water parameters within two identical ebb- and flow gravel bed hydroponic units under closed recirculating aquaponic conditions. Palm et al (2014a, b) identified an optimal feed input level of 200 g per day for the tested Nile tilapia aquaponics, reaching a steady state phase where DO levels and conductivity in the fish tank appeared relatively stable though working under very low water removal rates of 1.37 %. The sedimenter, a separate biofilter and the gravel bed system, beside the cultivated fish, were the most oxygen consuming units. We herewith describe the chemo-physical characteristics within the plant boxes during the end of sub-experiment II of Palm et al (2014a), with a feed input above the carrying capacity of 243.00 g (day 111 in Palm et al 2014a) and 327.5 g (day 118) as well as under subsequently reduced feed input during the steady phase of 175.00 g (day 125) and 215.00 g (day 132).
The observed DO levels inside the plant boxes were low, following a negative linear regression, and reaching its lowest level of nearly 1 mg L-1 at the final day of sampling. This result is corresponding to Lennard & Leonard (2004), comparing closed constant flow and reciprocating (flood and drain) aquaponic systems under production of Murray cod (Maccullochella peelii peelii) and Green oak lettuce (Lactuca sativa) in a gravel bed hydroponics. Decreasing oxygen conditions were found in both aquaponic systems (more in the flood and drain system design) at an incrementally feeding rate of 1.0 and 1.5% d-1. The daily feed ratio of 2.5% d-1 in the present study was much higher, consequently negatively affecting the DO levels. While the DO level on day I with nearly 5 mg L-1 was still relatively high, caused by the constantly increasing feed input during subexperiment III (see Palm et al 2014a), this values dropped significantly to between 1.01 and 1.19 mg L-1 (cycle I & II) within the next three weeks, demonstrating overfeeding of the aquaponic system. During these three samplings, the hydroponic units had lower oxygen values in comparison to the global mean of both systems in DO (data from Palm et al 2014a). The values differed on day II (difference of -1.7 mg L-1 in cycle I and -1.57 mg L-1 in cycle II inside the hydroponics compared with the global cycle mean of DO with 3.47 mg L-1) day III (-3.43 mg L-1 in cycle I and -3.59 mg L-1 in cycle II

AACL Bioflux, 2015, Volume 8, Issue 1. http://www.bioflux.com.ro/aacl 95
compared with 4.96 mg L-1) and day IV (-2.74 mg L-1 in cycle I and -2.56 mg L-1 in cycle II compared with 3.75 mg L-1). Palm et al (2014a) suggested the oxygen level as an adequate indicator for system stability during aquaponic fish cultivation. However, under application of substrate hydroponics, the oxygen levels inside the plant boxes indicated the overfeeding of the system more rapid compared with other parts of the system, owed to the fact that overfeeding results in an accumulation of oxygen demanding faeces and feed reside inside the different filters, especially the plant box substrate.
Temperature of the hydroponic units showed direct seasonal influences with the plant cultivation in summer (July). A change of natural light illumination, influenced by cloud intensity, resulted in different water temperatures with highest values on day II near 30°C and lowest on the latter two sampling days close to 22°C (Table 1). For plant growth, Rakocy et al (2006) recommended temperatures close to 24°C (75°F), but some common garden and winter crops could growth at temperatures at 18.3°C (65°F). For cucumber water temperatures were partly in its optimal range with 23-25°C (Göhler et al 2002). Other cultivated plants like herbs might have had more problems with suboptimal water temperatures at late summer conditions. The most stable water parameter inside the plant boxes of each cycle (front, middle and back position) was pH with insignificant values from 7.61-7.81 on all sample days (Tables 4, 5, 6, 7). Optimum pH range for nitrification is found to be between 7.0 and 9.0, whereas nutrient solubility is best for plant growth from 5.5-6.5 for hydroponic systems (Rakocy et al 2006). The gravel substrate hydroponic unit of the present system was more optimized for nitrification processes of root bacteria with possible suboptimal effects on plant growth. Generally, a compromise of nutrient solubility and nitrification in aquaponics is found by pH close to 7.0 (Rakocy et al 2006). Otherwise cultivated plants can affect pH depending on the species. Marschner et al (1995) cited in Raviv & Lieth (2008) described acidification of the root surroundings by chickpea (Cicer arietinum) and an increase of pH by corn (Zea mays). In our study the selection of different plants like vegetables and herbs could have influenced the root environment in case of pH, reflecting the mixture of plants that were cultivated inside the boxes (pH = 7.61-7.81). Also, insignificant pH values were found on the sampling days between cycle I and II (Table 1) except on day IV with very small differences. This indicates a homogenous water pH relation in the two gravel hydroponic units (cycle I and II) with the same plant growing conditions. Some plants like cucumber and zucchini showed better weight gain with possible better adaptation to higher pH levels and an indication for the importance of plant species selection for the present aquaponic system.
The sampled hydroponic units were planned with a single water inflow at the top of the plant boxes, sub-irrigation, and a central drain close to the end of the plant boxes. This caused consequences for the oxygen distribution and consequently plant growth. We observed a better plant growth close to the central water inlet as illustrated in Figures 1 & 3. Similarly, the oxygen level was slightly decreasing on day III in cycle I box II and on day IV in cycle II box I from the inlet towards the outlet. This result corresponds to a marked oxygen depletion reported by Gislerød & Kempton (1983) in nutrient film technique (NFT) hydroponics, from the inlet (5-7 mg L-1) to the lower end of gullies (1-5 mg L-1) under cultivation of cucumber. Cucumber plants close to the inlet showed a better height (15 cm) than plants close to the outlet. For a uniform plant growth in a gravel substrate hydroponic unit and by using longer than wide plant systems a non-central irrigation system (e.g. overhead or drip) should be recommended. The oxygen level inside the plant boxes has direct effects onto plant growth. According to Gislerød & Kempton (1983), cucumber plants could be stressed if the oxygen levels fall below 3 mg L-1. In our study, the plant growth in all boxes was moderate because of generally lower oxygen values below 3 mg L-1 during the third sub-experiment (except on day I in cycle II all boxes).
The phosphorus levels (P) inside the hydroponic units appeared low with a sigmoid curve expression (Figure 4). In aquaponic systems phosphorus is originating directly from the fish feed input and, according to fish species, digestion. Sigmoid phosphorus curves reflect an accumulation of the fish feed overload the days before. Highest feed input was observed on sampling day II with 327.50 g d-1, resulting in higher P quantities on day III

AACL Bioflux, 2015, Volume 8, Issue 1. http://www.bioflux.com.ro/aacl 96
and IV (Figure 4). This demonstrates a general sluggish phosphorus accumulation in gravel plant box systems. We can characterize our present low tech aquaponics as a phosphorus undersaturated system under the given feed input level between 175 g (day III) and 327.5 g (day II). Maximum observed P values were 2.68 mg L-1 (±0.39 box IV cycle I day III), and do not meet the requirements e.g. of cucumber with 40 mg L-1 in rock wool substrate hydroponics or 25 mg L-1 in NFT hydroponic systems (Göhler et al 2002). In closed aquaponic systems Lennard & Leonard (2004) reported also insignificantly low P levels of 3.87-4.04 mg L-1 (constant flow vs. flood and drain, Mann–Whitney-test). Palm et al (2014b) reported better growth of different plants (lettuce, tomato, cucumber and basil) with a higher phosphorus load close to 5 mg L-1 and the cultivation of Nile tilapia. Even lower levels of phosphorus were recorded by Danaher et al (2013) with insignificant values of 0.7-1.1 mg L-1 in the aquaculture water in comparison with an ordinary clarifier and swirl separator (t-test). For the cultivation of water spinach (Ipomoea aquatica), the authors suggested P concentrations of 0.8 % (overall) in plant tissue with no signs of nutrient deficiencies at a daily feeding rate of 103 g m-2 of hydroponic plant growing area d-1, much lower than in the present study.
Figure 4. Phosphorus [mg L-1] gradient on sampling days I, II, III, IV between cycle I & II and on all days of cycle I & II (time series). Lowercase showing significant groups (p < 0.05, t-test) of cycle I & II on the same experimental day, capital letter showing significant groups (p < 0.05,
ANOVA) of the same cycle (cycle I = bold, cycle II = light) on all days (time series).

AACL Bioflux, 2015, Volume 8, Issue 1. http://www.bioflux.com.ro/aacl 97
Table 1 Daily feed input [g] and duration [day] (Palm et al 2014a) and physico-chemical parameters of cycle I and II (O. niloticus)
between day I, II, III, IV and in comparison of cycle I and II on the specific day
Day I Day II Day III Day IV Parameter Mean ± SD Mean ± SD Mean ± SD Mean ± SD
Feed input [g]1 243.00 327.50 175.00 215.00 Duration [day]1 111 118 125 132
Cycle I Oxygen [mg L-1] 4.68a, m±2.91 1.77b, m±0.80 1.53b, m±0.45 1.01c, m±0.20 Temperature [°C] 25.39a, m±0.52 30.46b, m±0.07 22.00c, m±0.15 22.29d, m±0.14
pH 7.64a, m±0.02 7.62b, m±0.02 7.62b, m±0.12 7.64a, m±0.02 Phosphorus [mg L-1] 1.19a, m±0.34 0.94b, m±0.09 2.14c, m±0.62 1.72d, m±0.27
Cycle II Oxygen [mg L-1] 4.46a, z±0.89 1.90b, m±0.66 1.37c, m±0.52 1.19c, m±0.39 Temperature [°C] 25.68a, z±0.60 30.41b, m±0.12 21.99c, m±0.47 22.49d, z±0.23
pH 7.65ab, m±0.04 7.63a, m±0.02 7.66ab, m±0.08 7.65b, z±0.03 Phosphorus [mg L-1] 0.96a, z±0.25 0.89a, z±0.06 1.47b, z±0.40 1.34c, z±0.27
Means (± SD), different letters in groups (a, b, c, d) showing significant differences (ANOVA, p < 0.05) between values of one independent cycle (time series, along all days); different letters (m, z) showing significant differences (t-test, p < 0.05) in comparison of cycle I and II on the specific experimental day (I, II, III, IV). 1Feed input [g] and duration [day] data adopted from Palm et al (2014a).

AACL Bioflux, 2015, Volume 8, Issue 1. http://www.bioflux.com.ro/aacl 98
Table 2 Physico-chemical parameters between plant boxes (I, II, III, IV) within cycle I and cycle II on day I and day II
Box I Box II Box III Box IV
Parameter Cycles Mean ± SD Mean ± SD Mean ± SD Mean ± SD
Day I Oxygen [mg L-1] Cycle I 2.31a±0.51 2.66a±0.53 5.02a±2.65 8.72b±0.06
Cycle II 4.42a±0.34 4.56a±1.65 4.15a±0.55 4.71a±0.33 T [°C] Cycle I 25.38a±0.37 25.73ab±0.17 25.82b±0.19 24.64c±0.09
Cycle II 25.69a±0.67 26.10a±0.39 25.54a±0.56 25.39a±0.57 pH Cycle I 7.66a±0.01 7.62b±0.02 7.65ac±0.03 7.62bc±0.02 Cycle II 7.67a±0.08 7.62a±0.02 7.65a±0.01 7.64a±0.02
Phosphorus [mg L-1] Cycle I 1.18a±0.30 1.45b±0.03 1.42b±0.74 0.70c±0.06 Cycle II 0.97ab±0.14 0.93ab±0.14 0.86b±0.42 1.07a±0.11
Day II Oxygen [mg L-1] Cycle I 2.07a±0.94 1.89a±0.52 1.93a±1.04 1.20a±0.25
Cycle II 1.43a±0.35 2.00a±0.64 1.98a±0.18 2.19a±1.00 T [°C] Cycle I 30.50a±0.07 30.46a±0.05 30.42a±0.04 30.46a±0.09
Cycle II 30.32a±0.18 30.41a±0.09 30.48a±0.07 30.44a±0.05 pH Cycle I 7.62a±0.00 7.62a±0.00 7.63a±0.03 7.61a±0.02 Cycle II 7.64a±0.02 7.62b±0.01 7.62ab±0.00 7.62ab±0.01
Phosphorus [mg L-1] Cycle I 0.88a±0.03 0.91b±0.03 0.89ab±0.03 1.08c±0.07 Cycle II 0.85a±0.03 0.95b±0.05 0.92b±0.07 0.86a±0.03
Means (± SD), different letters in groups showing significant differences (ANOVA, p < 0.05).

AACL Bioflux, 2015, Volume 8, Issue 1. http://www.bioflux.com.ro/aacl 99
Table 3 Physico-chemical parameters between plant boxes (box I, II, III, IV) within cycle I and cycle II on day III and day IV
Box I Box II Box III Box IV
Parameter Cycles Mean ± SD Mean ± SD Mean ± SD Mean ± SD
Day III Oxygen [mg L-1] Cycle I 1.41a±0.49 1.43a±0.25 1.73a±0.48 1.56a±0.51
Cycle II 1.36a±0.58 1.03a±0.30 1.42a±0.61 1.67a±0.41 T [°C] Cycle I 21.97a±0.17 21.96a±0.12 22.03a±0.12 22.04a±0.18
Cycle II 21.92a±0.80 22.31b±0.26 22.03b±0.11 21.68b±0.10 pH Cycle I 7.62a±0.01 7.62a±0.01 7.62a±0.01 7.62a±0.02 Cycle II 7.78a±0.03 7.61b±0.01 7.62b±0.01 7.62b±0.01
Phosphorus [mg L-1] Cycle I 1.24a±0.12 2.19b±0.14 2.44c±0.38 2.68c±0.39 Cycle II 1.77a±0.55 1.30b±0.32 1.28b±0.21 1.51a±0.18 Day IV
Oxygen [mg L-1] Cycle I 1.07a±0.16 1.01a±0.18 0.98a±0.19 0.98a±0.27 Cycle II 0.99a±0.15 0.97a±0.17 1.38a±0.35 1.43a±0.53
T [°C] Cycle I 22.32ab±0.11 22.34a±0.10 22.18b±0.16 22.30ab±0.13 Cycle II 22.81a±0.15 22.53b±0.09 22.30c±0.10 22.33c±0.05
pH Cycle I 7.62a±0.01 7.65b±0.02 7.65bc±0.01 7.66c±0.01 Cycle II 7.66a±0.06 7.65a±0.01 7.66a±0.01 7.65a±0.01
Phosphorus [mg L-1] Cycle I 1.32a±0.03 1.73b±0.12 1.92c±0.19 1.91c±0.05 Cycle II 1.57a±0.08 1.06b±0.03 1.08b±0.04 1.62c±0.04
Means (± SD), different letters in groups showing significant differences (ANOVA, p < 0.05).
AACL Bioflux, 2015, Volume 8, Issue 1. http://www.bioflux.com.ro/aacl 100
Table 4 Physico-chemical parameters within the plant boxes at the specific positions (front, middle, back) of cycle I on day I and II
Cycle I Cycle I
Mean ± SD Mean ± SD Mean ± SD Mean ± SD Mean ± SD Mean ± SD Parameter Box
front middle back front middle back Day I Day II
Oxygen [mg L-1] I 2.63a±0.52 2.29a±0.60 2.01a±0.33 2.04a±1.10 2.08a±1.09 2.09a±1.07
II 2.21a±0.35 2.52ab±0.41 3.24b±0.07 1.78a±0.30 2.05a±0.84 1.85a±0.50
III 2.81a±0.48 3.84a±0.35 8.43b±0.94 1.92a±1.27 1.88a±1.16 1.98a±1.18
IV 8.79a±0.01 8.67b±0.05 8.70b±0.03 1.23a±0.28 1.20a±0.27 1.18a±0.30
Temperature [°C] I 25.27a±0.31 25.80b±0.10 25.07a±0.12 30.53a±0.06 30.53a±0.06 30.43a±0.06
II 25.77ab±0.12 25.90a±0.00 25.53b±0.06 30.47a±0.06 30.47a±0.06 30.43a±0.06
III 25.87a±0.15 25.87a±0.12 25.73a±0.29 30.43a±0.06 30.43a±0.06 30.40a±0.00
IV 24.67a±0.15 24.67a±0.06 24.60a±0.00 30.50a±0.10 30.43a±0.06 30.43a±0.12
pH I 7.65a±0.01 7.66a±0.01 7.66a±0.01 7.62a±0.00 7.63a±0.01 7.62a±0.00
II 7.62a±0.01 7.63a±0.03 7.61a±0.01 7.62a±0.00 7.62a±0.00 7.63a±0.01
III 7.64a±0.03 7.63a±0.04 7.66a±0.00 7.63a±0.04 7.62a±0.04 7.62a±0.04
IV 7.62a±0.02 7.63a±0.03 7.62a±0.00 7.61a±0.02 7.61a±0.02 7.62a±0.02
Phosphorus [mg L-1] I 1.42a±0.45 1.05a±0.03 1.06a±0.03 0.87a±0.04 0.89a±0.02 0.88a±0.02 II 1.44a±0.04 1.45a±0.02 1.45a±0.02 0.91a±0.02 0.91a±0.02 0.92a±0.04 III 1.42a±0.06 1.43a±0.03 1.40a±0.12 0.89a±0.05 0.88a±0.03 0.90a±0.01 IV 0.68a±0.05 0.73a±0.06 0.70a±0.05 1.10a±0.08 1.07a±0.07 1.07a±0.07
Means (± SD), different letters in groups showing significant differences (ANOVA, p < 0.05).

AACL Bioflux, 2015, Volume 8, Issue 1. http://www.bioflux.com.ro/aacl 101
Table 5 Physico-chemical parameters within the plant boxes at the specific positions (front, middle, back) of cycle I on day III and IV
Cycle I Cycle I
Mean ± SD Mean ± SD Mean ± SD Mean ± SD Mean ± SD Mean ± SD Parameter Box
front middle back front middle back Day III Day IV
Oxygen [mg L-1] I 1.77a±0.64 1.44a±0.34 1.02a±0.03 1.09a±0.13 1.05a±0.14 1.08a±0.25
II 1.60a±0.25 1.52ab±0.15 1.16b±0.04 1.03a±0.26 1.01a±0.15 1.00a±0.21
III 1.96a±0.67 1.68a±0.41 1.54a±0.42 0.95a±0.17 1.01a±0.26 0.97a±0.20
IV 1.65a±0.59 1.44a±0.52 1.59a±0.63 0.99a±0.29 0.99a±0.33 0.95a±0.33
Temperature [°C] I 21.77a±0.12 22.03b±0.06 22.10b±0.10 22.30ab±0.10 22.43a±0.06 22.23b±0.06
II 22.03a±0.12 21.83a±0.06 22.00a±0.10 22.37a±0.12 22.27a±0.06 22.40a±0.10
III 22.03ab±0.06 22.17a±0.06 21.90b±0.00 22.00a±0.17 22.23a±0.06 22.30a±0.00
IV 22.07a±0.06 22.23b±0.06 21.83c±0.06 22.43a±0.12 22.30a±0.00 22.17a±0.06
pH I 7.63a±0.01 7.62a±0.00 7.61a±0.01 7.62a±0.01 7.62a±0.00 7.63a±0.01
II 7.61a±0.01 7.62a±0.01 7.62a±0.01 7.64a±0.02 7.64a±0.02 7.65a±0.01
III 7.62a±0.01 7.61a±0.01 7.62a±0.01 7.65a±0.01 7.64a±0.02 7.66a±0.01
IV 7.62a±0.01 7.63a±0.03 7.61a±0.02 7.66a±0.01 7.66a±0.01 7.66a±0.01
Phosphorus [mg L-1] I 1.24a±0.08 1.21a±0.16 1.26a±0.13 1.30a±0.02 1.34b±0.02 1.32ab±0.02 II 2.18a±0.16 2.15a±0.15 2.23a±0.11 1.70a±0.05 1.72a±0.03 1.76a±0.20 III 2.76a±0.13 2.34b±0.38 2.22b±0.35 1.83a±0.13 1.88ab±0.19 2.05b±0.19 IV 2.77a±0.22 2.79a±0.43 2.48a±0.44 1.90a±0.03 1.92a±0.06 1.92a±0.05
Means (± SD), different letters in groups showing significant differences (ANOVA, p < 0.05).

AACL Bioflux, 2015, Volume 8, Issue 1. http://www.bioflux.com.ro/aacl 102
Table 6 Physico-chemical parameters within the plant boxes at the specific positions (front, middle, back) of cycle II on day I and II
Cycle II Cycle II
Mean ± SD Mean ± SD Mean ± SD Mean ± SD Mean ± SD Mean ± SD Parameter Box
front middle back front middle back Day I Day II
Oxygen [mg L-1] I 4.26a±0.30 4.30a±0.14 4.71a±0.40 1.26a±0.16 1.39a±0.32 1.63a±0.51
II 5.38a±2.94 3.97a±0.48 4.33a±0.63 1.84a±0.81 2.09a±0.68 2.06a±0.69
III 4.36a±0.37 3.81a±0.57 4.29a±0.70 2.01a±0.20 1.97a±0.19 1.95a±0.23
IV 4.92a±0.41 4.76a±0.11 4.45a±0.30 2.15a±1.10 2.19a1.20 2.22a±1.16
Temperature [°C] I 26.00a±0.10 26.23a±0.31 24.83b±0.12 30.17a±0.21 30.37a±0.06 30.43a±0.15
II 26.07ab±0.15 26.50a±0.20 25.73b±0.32 30.47a±0.12 30.40a±0.10 30.37a±0.06
III 25.97a±0.15 25.83a±0.21 24.83b±0.15 30.47a±0.06 30.53a±0.06 30.43a±0.06
IV 25.87a±0.15 25.53ab±0.55 24.77b±0.15 30.47a±0.06 30.40a±0.00 30.47a±0.06
pH I 7.67a±0.09 7.67a±0.09 7.67a±0.09 7.65a±0.03 7.64a±0.03 7.64a±0.03
II 7.61a±0.02 7.62a±0.02 7.62a±0.02 7.61a±0.01 7.62a±0.01 7.62a±0.00
III 7.65a±0.01 7.65a±0.01 7.66a±0.00 7.62a±0.00 7.62a±0.01 7.62a±0.01
IV 7.64a±0.02 7.64a±0.02 7.63a±0.02 7.62a±0.01 7.62a±0.01 7.62a±0.01
Phosphorus [mg L-1] I 0.90a±0.03 1.14b±0.06 0.89a±0.13 0.86a±0.02 0.86a±0.04 0.84a±0.03 II 0.97a±0.13 0.89a±0.14 0.92a±0.15 0.93a±0.05 0.96a±0.49 0.95a±0.04 III 1.04a±0.69 0.70a±0.15 0.85a±0.06 0.95a±0.07 0.90a±0.06 0.91a±0.07 IV 1.03a±0.16 1.13a±0.07 1.07a±0.06 0.85a±0.02 0.87a±0.01 0.86a±0.04
Means (± SD), different letters in groups showing significant differences (ANOVA, p < 0.05).
AACL Bioflux, 2015, Volume 8, Issue 1. http://www.bioflux.com.ro/aacl 103
Table 7 Physico-chemical parameters within the plant boxes at the specific positions (front, middle, back) of cycle II on day III and IV
Cycle II Cycle II
Mean ± SD Mean ± SD Mean ± SD Mean ± SD Mean ± SD Mean ± SD Parameter Box
front middle back front middle back Day III Day IV
Oxygen [mg L-1] I 1.43a±0.83 1.46a±0.57 1.19a±0.49 1.15ab±0.15 0.97a±0.03 0.85b±0.01
II 1.31a±0.41 0.94a±0.12 0.84a±0.01 1.09a±0.27 0.94a±0.06 0.88a±0.08
III 1.24a±0.71 1.59a±0.76 1.42a±0.58 1.38a±0.35 1.39a±0.45 1.36a±0.42
IV 1.96a±0.59 1.61a±0.32 1.45a±0.12 1.56a±0.70 1.42a±0.52 1.31a±0.57
Temperature [°C] I 21.63a±1.01 21.50a±0.62 22.63a±0.15 22.87a±0.15 22.87a±0.06 22.70a±0.20
II 22.40a±0.44 22.23a±0.23 22.30a±0.10 22.47a±0.06 22.60a±0.10 22.53a±0.06
III 22.17a±0.06 21.97b±0.06 21.97b±0.06 22.33a±0.06 22.33a±0.15 22.23a±0.06
IV 21.77a±0.06 21.67a±0.06 21.60a±0.10 22.33a±0.06 22.30a±0.00 22.37a±0.06
pH I 7.81a±0.06 7.78a±0.01 7.77a±0.01 7.71a±0.09 7.62a±0.02 7.65a±0.01
II 7.61a±0.01 7.61a±0.01 7.62a±0.00 7.64a±0.01 7.65a±0.02 7.66a±0.01
III 7.62a±0.01 7.61a±0.01 7.61a±0.01 7.66a±0.01 7.66a±0.00 7.65a±0.01
IV 7.61a±0.01 7.61a±0.01 7.62a±0.01 7.66a±0.01 7.64a±0.00 7.66a±0.01
Phosphorus [mg L-1] I 1.72a±0.23 2.01a±0.87 1.59a±0.26 1.45a±0.10 1.59a±0.06 1.60a±0.06 II 1.03a±0.10 1.38b±0.19 1.49b±0.38 1.04a±0.04 1.06a±0.03 1.09b±0.01 III 1.16a±0.24 1.42a±0.19 1.27a±0.10 1.05a±0.03 1.10b±0.01 1.10ab±0.05 IV 1.46a±0.23 1.60a±0.16 1.48a±0.12 1.60a±0.03 1.62a±0.03 1.65a±0.55
Means (± SD), different letters in groups showing significant differences (ANOVA, p < 0.05).

AACL Bioflux, 2015, Volume 8, Issue 1. http://www.bioflux.com.ro/aacl 104
Different phosphorus levels were found inside the hydroponic units in comparison to the whole (or global) system values on a specific day (see Palm et al 2014a). Highest P values were observed on day III with 138.06 % of P in cycle I and 94.84 % P in cycle II (Table 1) in comparison of 1.55 mg L-1 P (±0.16 = 100 %) as mean of both systems. All other values [mg L-1 or %] of P inside the plant boxes were lower compared with the mean of both cycles, on day I with 83.80 % in cycle I and 67.60 % in cycle II (100 %= 1.42 mg L-1 ±0.08), day II with 37.00 % in cycle I and 35.04 % in cycle II (100 %= 2.54 mg L-1 ±0.05) and on day IV with 67.45 % in cycle I and 52.55 % in cycle II (100 %= 2.55 mg L-1 ±0.00). Phosphorus levels below 100 % (as difference from global P mean) inside the plant boxes demonstrate either plant growth or P accumulation inside the gravel substrate. In soil, the most important form of phosphorus is orthophosphate (PO4
3, Röber & Schacht 2008), which is highly reactive. Raviv & Lieth (2008) described the decline of P concentration inside nutrient solutions following a fertilizer application being a widespread phenomenon of two mechanisms. The first very fast decrease is based on electrostatic reactions and a high affinity of the ion to charged surfaces within seconds or minutes. This is followed by a slow formation (hours, days) of new solid metal-P-compounds. The latter is found under acidic pH’s with AL, Fe and Mn or neutral or basic pH’s with Ca and Mg. Also the characteristics of the gravel substrate surface might have had a direct influence on the phosphorus accumulation. Göhler et al (2002) could demonstrate the best results of phosphate accumulation (Ca[H2PO4]2) in the laboratory with expanded clay “Lecaton” (grain size 8-16 mm) after 4 h in contrast to smaller grain sizes. The amount of phosphorus aggregation was decreasing after 8, 24 and partly 48 hours. The applied gravel substrate in the present study had a given grain size between 16-32 mm (coarse gravel, pebble), with a good ability of particle and phosphorus accumulation as well as root bacteria development. Consequently, the applied gravel combined with the surface affinity and formation of compounds might have influenced the measured phosphorus levels inside the plant boxes, combined with the different feed input levels (Figure 4) as also reported by Raviv & Lieth (2008). Nevertheless, our system had a low phosphorus level, not favourable for the cultivation of all plant species.
We could not observe any distinct pattern in the tested water parameters inside the plant boxes, though some variability occurred. The parallel arrangement of the gravel filled plant boxes had no adverse effects onto the water parameter distribution inside each cycle (Tables 2, 3). Each plant box was connected to the nutrient enriched water with a distance of 1.5 m to the next plant box inlet. No clear trend was observed, differences between the four tested plant boxes of each cycle were small. However, on each sampling day, varying means of significant groups were observed between the plant boxes of one cycle, partly changing on another day and plant box. Most insignificant parameters were found on day II (in total five groups), followed by day III (four groups in total, Tables 2, 3). This result demonstrates that the tested system design in general enables similar conditions for the cultivated plant species in each box. However, still some variability inside the different plant boxes occurred, and the phosphorus values were generally different between the boxes of the identically built cycles I and II, most probably resulting from different needs and nutrient uptake of the cultivated plants. This makes predictions of water parameters and growth factors inside the hydroponic units difficult, challenging future system up-scaling of plant box numbers in order to increase the yield of plant cultivation. Conclusions. The present study describes the water parameter differences of dissolved oxygen (DO), temperature, pH and phosphorus inside a gravel hydroponic unit of a warmwater ebb- and flow aquaponic system. In both cycles, linear decreasing oxygen levels on the four experimental days were strongly influenced by the daily feed input and the system functioning, suggesting that oxygen measurements inside the gravel bed might be a more sensible earlier indicator for system functioning of a closed substrate aquaponics. The observed pH is a result of the selected fish and plant species combination, with compromising effects of acidifying and non-acidifying root effects. Phosphorus distribution was sigmoid between the four days and showed sluggish
AACL Bioflux, 2015, Volume 8, Issue 1. http://www.bioflux.com.ro/aacl 105
accumulation as a consequence of higher feed inputs the days before. In general, phosphorus accumulation was low, characterising the present system as unsaturated in phosphorus. Water parameter of the hydroponic unit itself had lower values in comparison to the combined system parameters. Comparison of each plant box (I, II, III, IV) inside each cycle showed no trends of water parameters in means. Therefore, the parallel plant box installation had no adverse effect onto water parameters, enabling an easy system up-scaling of more than four plant boxes. Inside some plant boxes, a slightly decreasing trend of oxygen was found as a result of suboptimal subsurface irrigation from the central inflow towards the outlet. Better plant growth was observed closer to the central inlets. A de-central irrigation system in gravel substrate hydroponic units can be recommended in order to enhance oxygen levels, nutrient supply and subsequent plant growth in order to achieve economical sustainability. Acknowledgements. We thank the Ministry of Agriculture, Environment and Consumer Protection of Mecklenburg Western Pomerania for supporting research in aquaponic fish and plant production. This project was partially funded through the pilot project “FishGlassHouse: Innovationsinitiative zur ressourceneffizienten Nahrungsmittel-produktion in MV” (European Fisheries Found-EFF) and INNOLIFE (Institut für Innovationsdesign), Wezlar, Germany, for material support. References Al-Hafedh Y. S., Alam A., Beltagi M. S., 2008 Food production and water conservation in
a recirculating aquaponic system in Saudi Arabia at different ratios of fish feed to plants. Journal of the World Aquaculture Society 39:510-520.
Danaher J. J., Shultz R. C., Rakocy J. E., Bailey D. S., 2013 Alternative solids removal for warm water recirculating raft aquaponic systems. Journal of the World Aquaculture Society 44(3):374-383.
Farran I., Mingo-Castel A. M., 2006 Potato minituber production using aeroponics: effect of plant density and harvesting intervals. American Journal of Potato Research 83(1):47-53.
Gislerød H. R., Kempton R. J., 1983 The oxygen content of flowing nutrient solutions used for cucumber and tomato culture. Scientia Horticulturae 20:23-33.
Göhler F., Molitor H. D., Roth K., Wohanka W., 2002 [Soilless culture in horticulture]. Eugen Ulmer GmbH & Co. Stuttgart, 268 pp. [in German].
Graber A., Junge R., 2009 Aquaponic systems: nutrient recycling from fish wastewater by vegetable production. Desalination 246:147-156.
Kloas W., Rennert B., Van Ballegooy C., Drews M., 2011 Aquaponic system for vegetable and fish production. United States Patent Application Publication. Pub. No.: US 2011/0131880 A1, 7 pp.
Lennard W. A., Leonard B. V., 2004 A comparison of reciprocating flow versus constant flow in an integrated, gravel bed, aquaponic test system. Aquaculture International 12(6):539-553.
Lewis W. M., Yopp J. H., Schramm H. L. Jr., Brandeburg A. M., 1978 Use of hydroponics to maintain quality of recirculated water in a fish culture system. Transactions of the American Fisheries Society 107(1):92-99.
Marschner H., 1995 Mineral nutrition of higher plants. 2nd edition. London: Academic Press, 889 pp.
McMurtry M. R., Sanders D. C., Cure J. D., Hodson R. G., Haning B. C., Amand E. C. S., 1997 Efficiency of water use of an integrated fish/vegetable co-culture system. Journal of the World Aquaculture Society 28(4):420-428.
Palm H. W., Seidemann R., Wehofsky S., Knaus U., 2014a Significant factors influencing the economic sustainability of closed aquaponic systems. Part I: system design, chemo-physical parameters and general aspects. AACL Bioflux 7(1):20-32.
Palm H. W., Bissa K., Knaus U., 2014b Significant factors affecting the economic sustainability of closed aquaponic systems. Part II: fish and plant growth. AACL Bioflux 7(3):162-175.

AACL Bioflux, 2015, Volume 8, Issue 1. http://www.bioflux.com.ro/aacl 106
Rakocy J., 1989 Hydroponic lettuce production in a recirculating fish culture system. In: Island perspectives. Vol. 3. Agricultural Experiment Station, University of the Virgin Islands, pp. 5-10.
Rakocy J., Masser M., Losordo T., 2006 Recirculating aquaculture tank production systems: aquaponics - integrating fish and plant culture. Southern Regional Aquaculture Center (SRAC), Publication No. 454, 16 pp.
Rakocy J. E., Bailey D. S., Shultz R. C., Thoman E. S., 2004 Update on tilapia and vegetable production in the UVI aquaponic system. Proceedings of the Sixth International Symposium on Tilapia in Aquaculture, Manila, Philippines. Bolivar R. B., Mair G. C., Fitzsimmons K. (eds), pp. 676-690.
Raviv M., Lieth J. H., 2008 Soilless culture: theory and practice. Elsevier, 608 pp. Röber R., Schacht H., 2008 [Plant nutrition in horticulture]. E. Ulmer, 444 pp. [in
German]. *** Microsoft, 2010 Microsoft Excel [computer software]. Redmond, Washington:
Microsoft. *** SPSS Inc., 2013 Statistic Software Package, Chicago, IL, USA. Received: 05 January 2015. Accepted: 22 February 2015. Published online: 27 February 2015. Authors: H. W. Palm, University of Rostock, Faculty of Agricultural and Environmental Sciences, Aquaculture and Sea- Ranching, Justus-von-Liebig-Weg 6, D-18059 Rostock, Germany, e-mail: [email protected] Madeline Nievel, University of Rostock, Faculty of Agricultural and Environmental Sciences, Aquaculture and Sea-Ranching, Justus-von-Liebig-Weg 6, D-18059 Rostock, Germany, e-mail: [email protected] Ulrich Knaus, University of Rostock, Faculty of Agricultural and Environmental Sciences, Aquaculture and Sea- Ranching, Justus-von-Liebig-Weg 6, D-18059 Rostock, Germany, e-mail: [email protected] This is an open-access article distributed under the terms of the Creative Commons Attribution License, which permits unrestricted use, distribution and reproduction in any medium, provided the original author and source are credited. How to cite this article: Palm H. W., Nievel M., Knaus U., 2015 Significant factors affecting the economic sustainability of closed aquaponic systems. Part III: plant units. AACL Bioflux 8(1):89-106.