aadt 048 kinggeorge 2009 - virginia department of ... ·...
TRANSCRIPT

Virginia Department of Transportation
Jurisdiction Report
Daily Traffic Volume EstimatesIncluding Vehicle Classification Estimates
where available
King George County
2009
Prepared ByVirginia Department of Transportation
Traffic Engineering Division
In Cooperation WithU.S. Department of TransportationFederal Highway Administration
48

Virginia Department of TransportationTraffic Engineering DivisionTraffic Monitoring Section
The Virginia Department of Transportation (VDOT) conducts a program where trafficcount data are gathered from sensors in or along streets and highways and other sources.From these data, estimates of the average number of vehicles that traveled each segmentof road are calculated. VDOT periodically publishes booklets listing these estimates.
One of these booklets, titled “Average Daily Traffic Volumes with Vehicle ClassificationData, on Interstate, Arterial and Primary Routes”includes a list of each Interstate andPrimary highway segment with the estimated Annual Average Daily Traffic (AADT) forthat segment. AADT is the total annual traffic estimate divided by the number of days inthe year. This booklet also includes information such as estimates of the percentage ofthe AADT made up by 6 different vehicle types, ranging from cars to double trailertrucks; estimated Annual Average Weekday Traffic (AAWDT), which is the number ofvehicles estimated to have traveled the segment of highway during a 24 hour weekdayaveraged over the year; as well as Peak Hour and Peak Direction factors used by plannersto formulate design criteria.
In addition to the Primary and Interstate publication, one hundred books are publishedperiodically, one for each of 100 areas across the state defined by VDOT for recordkeeping purposes. These books include traffic volume estimates for roads within thecounty, cities, and towns within the area. These books are titled “Daily Traffic VolumesIncluding Vehicle Classification Estimates, where available; Jurisdiction Report numbers00 through 99”.
Also available are a number of reports summarizing the average Vehicle Miles Traveled(VMT) in selected jurisdictions and other categories of highways. There are manydifferent ways to present traffic volume summary information. Because the userdetermines the value of each presentation, the reports have been redesigned based on userrequests and feedback. The people of the VDOT Traffic Engineering Division TrafficMonitoring Section who produce these books welcome requests for other helpful ways ofpresenting the summary information.
A compact disc (CD) is available that includes files in the Adobe® Portable DocumentFormat (PDF) that can be displayed, searched, and printed using common desktopcomputer equipment. The CD includes the publications described above as well as anumber of other reports, including specialized VMT summaries and smaller AADTreports for each city and town separately.

Publication Notes
Parallel Roads
For road inventory and management purposes, some roadways are counted separately bydirection and have separately published traffic estimates for each direction of travel.Examples of such roadways are the interstate system and routes with separated facilitiesand (usually) oneway traffic facilities in urban areas. In these publications, they arereferred to as parallel roads. As a convenience for the users of the publication, the listingfor segments of roads with parallel segments are published with both the traffic estimatesfor their own direction of travel (e.g. I95 Northbound) as well as the estimate of the totalof all traffic on the same route including parallel roadways (all directions of I95). Thepublication will have a “Combined Traffic Estimates for Parallel Roadways on thisRoute” or “Combined Traffic” identifiers for the combined direction of travel estimates.
Roadways such as I395 with a North segment, a South segment and a separateReversible lane segment will have the estimate for more than two parallel roadwaysincluded in the entire combined traffic estimate.
Some routes have very complicated paths through cities and towns. These parallel pathsmay be too complex to allow a relationship between nearby sections of the oppositedirection on the same route. In this case, to indicate that the traffic estimates for such aroad segment may not include all directions of traffic on that route, the line that wouldlist the combined values will indicate “NA” for not available.
VDOT’s traffic monitoring program includes more than 100,000 segments of roads andhighways ranging from several mile sections of Interstate highways to very short sectionsof city streets. Due to problems experienced obtaining some traffic count data, and thelevel of quality necessary to maintain confidence in the data, no estimate is currentlyavailable for some segments of roadway. These segments are included in thepublications indicating “NA” for not available. It is the intention of the VDOT TrafficEngineering Division Traffic Monitoring group to obtain the data necessary and to reporttraffic volume estimates on all road segments included in these publications.
Many of the road segments in this program are local secondary roads. The amount anddetail of data collected on these roads are not as great as the data collected on highervolume roads. The vehicle classification, average weekday traffic volumes, and thetheoretical design hour traffic volumes are not calculated for these roads. Thepublications indicate “NA” for the information that is not available.
This publication is based on a traffic monitoring program initiated in 1997. Because thedata collection techniques and statistical evaluation processes are different than thoseused in previous years, comparison with previous publications may be misleading.

Glossary of Terms:
Route: The Route Number assigned to this segment of roadway with the masterinventory route number if this is an overlapping route, with official street or highwayname if available.
Length: Length of the traffic segment in miles.
AADT: Annual Average Daily Traffic. The estimate of typical daily traffic on a roadsegment for all days of the week, Sunday through Saturday, over the period of one year.
QA: Quality of AADT:A Average of Complete Continuous Count DataB Average of Selected Continuous Count DataF Factored Short Term Traffic Count DataG Factored Short Term Traffic Count Data with Growth ElementH Historical EstimateM Manual Uncounted EstimateN AADT of Similar Neighboring Traffic LinkO Provided By External SourceR Raw Traffic Count, Unfactored
4Tire: Percentage of the traffic volume made up of motorcycles, passenger cars, vans andpickup trucks.
Bus: Percentage of the traffic volume made up of busses.
2Axle Truck: Percentage of the traffic volume made up of 2 axle single unit trucks (notincluding pickups and vans).
3+Axle Truck: Percentage of the traffic volume made up of single unit trucks with threeor more axles.
1Trail Truck: Percentage of the traffic volume made up of units with a single trailer.
2Trail Truck: Percentage of the traffic volume made up of units with more than onetrailer.
QC: Quality of Classification Data:A Average of Complete Continuous Count DataB Average of Selected Continuous Count DataC Short Term Classified Traffic Count DataF Factored Short Term Traffic Count DataH Historical EstimateM Mass Collective AverageN Classification Estimates of Similar Neighboring Traffic Link

K Factor: The estimate of the portion of the traffic volume traveling during the peak houror design hour.
QK: Quality of the K Factor estimate:A Factor based on 30th Highest Hour Observed During at least 250 days of
Continuous Traffic DataB Factor based on other Hour Observed During Less than 250 days of
Continuous Traffic DataF Factor based on Highest Hour Collected at in a 48 Hour Weekday PeriodM Factor based on Manual Estimate of design hourN Design Hour Factor (K Factor) of Similar Neighboring Traffic LinkO Provided by External Source
Dir Factor: The estimate of the portion of the traffic volume traveling in the peakdirection during the peak hour..
AAWDT: Average Annual Weekday Traffic. The estimate of typical traffic over theperiod of one year for the days between Monday through Thursday inclusive.
QW: Quality of AAWDT:A Average of Complete Continuous Count DataB Average of Selected Continuous Count DataF Factored Short Term Traffic Count DataG Factored Short Term Traffic Count Data with Growth ElementM Manual Uncounted EstimateN AAWDT of Similar Neighboring Traffic LinkO Provided by External Source
Year: Year for which the published values are appropriate. If the Quality of AADT(QA) is “R”, the year is the year that the raw traffic count was collected, and if available,

Bus
29
600
7
29
North
81
154600
Interstate Route
US Route
Virginia State Route
ALT Alternate Route
Bus Business RouteBypas Bypass RouteTruck Truck Route
Wye Wye Route connector
Secondary Route
The VDOT Maintainenance Jurisdiction number is displayed below the Secondary RouteNumber if the Maintenance Jurisdiction is different than the jurisdiction in the title of the report.
P Parallel Route; Southbound or Westbound direction lanes of a numbered route wherethey are on a different road facility than the other direction.
ALT
220
11P
Traffic volume data for Interstate Routes and some other routes arereported separately by direction, as well as combined.
Route Shield Legend
Route Systems
Special Routes
Frontage Road (F precedes frontage route number)F241

Virginia Department of TransportationTraffic Engineering Division
2009Annual Average Daily Traffic Volume Estimates By Section of Route
King George Maintenance Area
Route Jurisdiction AADT1Trail 2Trail
4TireK
QA2Axle 3+Axle
QC QKBusLengthTruck
FactorAAWDT QW
DirFactor
19000 1% 2% 0.092 21000G F1% 2% F GStafford County Line
48605 Bloomsbury Rd; LaGrange Lane
95%
From:To:
From:
King George County 3.68 0%3 Kings Hwy 0.502
17000 1% 2% 0.089 19000G F1% 2% C G
SR 206 Arnolds Corner
95%
From:To:
King George County 4.79 0%3 Kings Hwy 0.512
15000 1% 2% 0.089 16000G F1% 2% F G
SR 205 Purkins Corner
95%
From:To:
King George County 2.58 0%3 Kings Hwy 0.523
7100 1% 2% 0.082 7200G F1% 2% F G
US 301 Office Hall
95%
From:To:
King George County 1.56 0%3 Kings Hwy 0.665
5100 1% 2% 0.089 5600G F1% 4% C GWestmoreland County Line
91%To:
King George County 7.18 0%3 Kings Hwy 0.654
7900 1% 2% 0.095 8500G F1% 1% F GSR 3 Purkins Corner
US 301 Edge Hill
96%
From:To:
From:
King George County 1.26 0%205 Ridge Rd 0.501
4200 1% 2% 0.09 4600G F1% 1% F G
48617 Carruthers Corner
96%
From:To:
King George County 2.81 0%205 Ridge Rd 0.638
3800 1% 2% 0.085 4100G F1% 1% C GWestmoreland County Line
96%To:
King George County 3.36 0%205 Ridge Rd 0.682
8800 1% 1% 0.102 9500G F0% 1% F GSR 3 Arnolds Corner
48610 Indiantown Rd
97%
From:To:
From:
King George County 2.18 0%206 Dalgren Rd 0.641
7800 1% 1% 0.103 8400G F0% 1% C G
SR 218 Berthaville
97%
From:To:
King George County 4.26 0%206 Dahlgren Rd 0.703
10000 1% 1% 0.107 11000G F0% 1% F G
SR 218 Owens
97%
From:To:
King George County218 2.19 0%206 Dahlgren Rd 0.807
9900 1% 1% 0.104 11000G F0% 1% F G
US 301 East of Owens
97%
From:To:
King George County 0.62 0%206 Dahlgren Rd 0.830
10000 1% 1% 0.097 11000G F0% 1% F G48604 Twelfth St
97%To:
King George County 1.79 0%206 Dahlgren Rd 0.835
3100 1% 1% 0.116 3300G F0% 1% F GStafford County Line
48696 Fairview Dr
97%
From:To:
From:
King George County 5.93 0%218 Caledon Rd 0.563
2700 1% 1% 0.114 2900G F0% 1% C G
48609 Cash Corner
97%
From:To:
King George County 1.05 0%218 Caledon Rd 0.724
2400 1% 1% 0.13 2600G F0% 1% F G
SR 206 Berthaville
97%
From:To:
King George County 6.81 0%218 Caledon Rd 0.771
10000 1% 1% 0.107 11000G F0% 1% F GSR 206 Owens
97%To:
King George County206 2.19 0%218 Dahlgren Rd 0.807
78/4/2010

Virginia Department of TransportationTraffic Engineering Division
2009Annual Average Daily Traffic Volume Estimates By Section of Route
King George Maintenance Area
Route Jurisdiction AADT1Trail 2Trail
4TireK
QA2Axle 3+Axle
QC QKBusLengthTruck
FactorAAWDT QW
DirFactor
1100 0% 1% 0.105 1200G F0% 1% F GSR 206 Owens
US 301 South of Owens
98%
From:To:
From:
King George County 0.28 0%218 Windsor Dr 0.536
4600 0% 1% 0.097 5000G F0% 1% C GSR 205 East of Tetotum
98%To:
King George County 6.02 0%218 Windsor Dr 0.758
12000 1% 1% 0.09 12000G F1% 6% F GCaroline County Line
48623 Jersey Rd
91%
From:To:
From:
King George County 3.05 0%301 James Madison Pkwy 0.562
12000 1% 1% 0.091 11000G F1% 6% F G
SR 3 Kings Hwy
91%
From:To:
King George County 2.05 0%301 James Madison Pkwy 0.584
13000 1% 1% 0.089 12000G F1% 6% F G
SR 205 Ridge Rd
91%
From:To:
King George County 1.91 0%301 James Madison Pkwy 0.607
15000 1% 1% 0.127 14000A A1% 6% C A
SR 218 Windsor Dr
91%
From:To:
King George County 5.91 0%301 James Madison Pkwy 0.685
20000 1% 1% 0.092 19000G F1% 6% F G
SR 206 Dahlgren Rd
91%
From:To:
King George County 0.56 0%301 James Madison Pkwy 0.701
19000 1% 1% 0.088 18000G F1% 6% F GMaryland State Line
91%To:
King George County 3.58 0%301 James Madison Pkwy 0.579
88/4/2010

Virginia Department of TransportationTraffic Engineering Division
2009Annual Average Daily Traffic Volume Estimates By Section of Route
King George Maintenance Area
Route AADT1Trail 2Trail
4TireK
QA2Axle 3+Axle
QC QKBusLengthTruck
FactorAAWDT QW Year
DirFactor
NA NA NADead End
US 301 James Madison PkwyTo:
From:
0.09
King George County
F970
440 NA NARSR 218 Caledon Rd
48658 Cedar Ridge LaneFrom:To:
From:
1.68 12/08/2009600 Passapatanzy Dr
400 NA NARStafford County LineTo:
1.04 12/08/2009600 Passapatanzy Dr
260 NA NAR48631 Millbank Rd
48686 Mt Rose DrTo:
From:
1.30 12/10/2009601 Gera Rd
250 NA NARStafford County Line
48603 Y Intersection LegTo:
From:
0.80 12/08/2009602 Chapel Green Rd
1700 NA NARSR 3 Kings Hwy
48602 Chapel Green RdFrom:To:
From:
1.16 12/08/2009603 Fletchers Chapel Rd
1300 NA NAR
481021 Forest Ridge DrFrom:To:
1.27 12/08/2009603 Fletchers Chapel Rd
360 NA NARSR 218 W, Caledon Rd
From:
To:
0.63 03/14/2001603 Fletchers Chapel Rd
SR 218 WEST3700 NA NAR
SR 218 E, Caledon RdFrom:To:
0.04 12/16/2008603 Y Intersection Leg
90 NA NAR
48605 Chapel WayFrom:To:
0.15 03/14/2001603 Fletchers Chapel Rd
90 NA NAR
0.79 MN 48605 Chapel WayFrom:To:
0.79 03/14/2001603 Fletchers Chapel Rd
120 NA NARDead EndTo:
0.80 09/14/2004603 Dogwood Lane
340 2% 1% 0.127 360G F0% 0% C G48614 Potomac Dr
SR 206 Dahlgren Rd97%
To:
From:
0.23 0% 2009604 Twelfth St 0.717
30 NA NARDead End
SR 3 Kings HwyFrom:To:
From:
0.75 12/08/2009605 LaGrange Lane
1100 NA NAR
48665 Birchwood Creek LaneFrom:To:
1.20 12/08/2009605 Bloomsbury Rd
730 NA NAR
SR 218 Caledon RdFrom:To:
2.20 12/08/2009605 Bloomsbury Rd
80 NA NAR48603 Y Intersection LegTo:
0.20 12/08/2009605 Chapel Way
60 NA NARDead End
0.50 ME Dead EndFrom:To:
From:
0.50 10/12/2004606 Rokeby Lane
80 NA NARSR 3; 48677To:
0.11 05/02/2001606 Rokeby Lane
960 2% 2% 0.098 1000G F2% 9% F GUS 301; 48625
48631 Millbank Rd
85%
From:To:
From:
0.90 0% 2009607 Port Conway Rd 0.5
850 2% 2% 0.118 920G F2% 9% C G
48610 Powhatan Rd
85%
From:To:
3.04 0% 2009607 Port Conway Rd 0.726
1300 3% 2% 0.09 1400G F5% 11% C GSR 3 Kings Hwy
79%To:
2.75 0% 2009607 Port Conway Rd 0.544
98/4/2010

Virginia Department of TransportationTraffic Engineering Division
2009Annual Average Daily Traffic Volume Estimates By Section of Route
King George Maintenance Area
Route AADT1Trail 2Trail
4TireK
QA2Axle 3+Axle
QC QKBusLengthTruck
FactorAAWDT QW Year
DirFactor
240 NA NAR48694 Lambs Creek Church Rd
48609 N, Comorn RdFrom:
To:
From:
2.38
King George County
05/02/2001608 Muscoe Pl
48609 S, Comorn Rd70 NA NAR
Dead EndTo:
0.79 05/02/2001608 Igo Rd
2500 1% 1% 0.092 2700G F1% 0% C GSR 3 Kings Hwy
48677 Stanley Rd
96%
From:To:
From:
0.32 0% 2009609 Comorn Rd 0.569
3300 1% 1% 0.095 3500G F1% 0% F G
48608 S, Igo Rd
96%
From:To:
0.53 0% 2009609 Comorn Rd 0.599
1600 1% 1% 0.099 1700G F1% 0% F G
48649 Marmion Lane
96%
From:To:
1.31 0% 2009609 Comorn Rd 0.52
1500 1% 1% 0.101 1600G F1% 0% F GSR 218 Caledon Rd
96%To:
0.53 0% 2009609 Comorn Rd 0.542
350 NA NAR48607 Port Conway Rd
48631 Millbank RdFrom:To:
From:
1.63 04/02/2001610 Powhatan Rd
630 2% 1% 0.13 680G F0% 0% F G
48678 St Anthonys
97%
From:To:
1.30 0% 2009610 Millbank Rd 0.597
1400 2% 1% 0.133 1500G F0% 0% F GSR 3 W, Kings Hwy
97%
From:
To:
0.08 0% 2009610 Millbank Rd
SR 3 E, Kings Hwy
0.538
1200 2% 1% 0.103 1300G F0% 0% C G
SR 206 Dahlgren Rd; Dalgren Rd
97%
From:To:
1.80 0% 2009610 Indiantown Rd 0.510
1500 NA NAR
481210 Michael DrFrom:To:
0.50 12/09/2009610 Indiantown Rd
440 NA NARSR 218 Caledon RdTo:
2.21 12/09/2009610 Indiantown Rd
600 1% 1% 0.120 650G F1% 0% F GSR 205 Ridge Rd
US 301 James Madison Pkwy
97%
From:To:
From:
0.47 0% 2009611 Hanover Church Rd 0.678
1000 1% 1% 0.114 1100G F1% 0% C GSR 206 Dahlgren Rd
97%To:
2.24 0% 2009611 Eden Dr 0.54
90 NA NAR48610 Indiantown Rd
Dead EndTo:
From:
0.20 10/12/2004612 Locust Dale Lane
60 NA NARSR 218 Windsor Dr
0.05 ME SR 218 Windsor DrFrom:To:
From:
0.05 04/30/2001613 Little Ferry Rd
40 NA NARDead EndTo:
0.80 09/20/2004613 Little Ferry Rd
580 1% 0% 0.101 620G F0% 0% F GDead End
SR 206 Dahlgren Rd
98%
From:To:
From:
0.93 0% 2009614 Potomac Dr 0.659
2600 1% 0% 0.094 2900G F0% 0% C G
US 301 James Madison Pkwy
98%
From:To:
1.16 0% 2009614 Potomac Dr 0.526
2400 1% 0% 0.100 2600G F0% 0% F G
48635 Gambo Creek Rd
98%
From:To:
0.55 0% 2009614 Owens Dr 0.709
1000 1% 0% 0.113 1100G F0% 0% F G48624 Mathias Point Rd
98%To:
0.85 0% 2009614 Owens Dr 0.699
8 NA NARSR 218 Windsor Dr
Dead EndTo:
From:
1.50 09/20/2004615 Berry Wharf Rd
108/4/2010

Virginia Department of TransportationTraffic Engineering Division
2009Annual Average Daily Traffic Volume Estimates By Section of Route
King George Maintenance Area
Route AADT1Trail 2Trail
4TireK
QA2Axle 3+Axle
QC QKBusLengthTruck
FactorAAWDT QW Year
DirFactor
240 NA NARUS 301 James Madison Pkwy
SR 218 S, Windsor DrFrom:
To:
From:
1.86
King George County
12/10/2009616 Washington Mill Rd
SR 218 N, Windsor Dr150 NA NAR
Dead EndTo:
0.80 04/04/2001616 Brickhouse Rd
140 NA NARSR 205 Ridge Rd
US 301 James Madison PkwyTo:
From:
3.35 04/04/2001617 Poplar Neck Rd
120 NA NARSR 218 Windsor Dr
Dead EndTo:
From:
0.62 04/04/2001618 Pumpkin Neck Rd
460 NA NARSR 205 Ridge Rd
SR 218 S, Windsor DrFrom:
To:
From:
0.60 04/04/2001619 Good Hope Rd
SR 218 N, Windsor Dr250 NA NAR
Dead EndTo:
2.00 04/04/2001619 Stoney Point Rd
60 NA NAR48629 Round Hill Rd
SR 205 Ridge RdTo:
From:
2.15 09/22/2004620 Alden Rd
370 NA NAR48629 Round Hill Rd
SR 205 Ridge RdTo:
From:
1.60 04/04/2001621 Pine Hill Rd
120 NA NAR48679 Canterbury Loop
SR 205 Ridge RdTo:
From:
2.00 12/10/2009622 Ashland Mill Rd
880 0% 1% 0.088 980G F1% 3% C GUS 301 James Madison Pkwy
48650 Welcome Lane
95%
From:To:
From:
1.00 0% 2009623 Jersey Rd 0.726
700 0% 1% 0.113 760G F1% 3% F G48647 Shiloh Loop
95%To:
1.70 0% 2009623 Jersey Rd 0.708
1300 1% 1% 0.098 1400G F0% 0% C GSR 206; SR 218
48711 Dixon Lane
97%
From:To:
From:
0.33 0% 2009624 Owens Dr 0.531
1100 1% 1% 0.101 1200G F0% 0% F G
48614 Owens Dr
97%
From:To:
1.47 0% 2009624 Owens Dr 0.806
870 NA NAR
48685 Schoolhouse RdFrom:To:
1.10 03/12/2001624 Mathias Point Rd
790 NA NAR
48639 Osprey RdFrom:To:
1.20 03/12/2001624 Mathias Point Rd
180 NA NARDead EndTo:
1.00 03/12/2001624 Mathias Point Rd
270 0% 1% 0.119 300G F1% 0% F GUS 301; 48607
48650 Welcome Lane
98%
From:To:
From:
2.67 0% 2009625 Salem Church Rd 0.507
220 0% 1% 0.135 250G F1% 0% C G
SR 3 Kings Hwy
98%
From:To:
3.40 0% 2009625 Salem Church Rd 0.667
70 NA NAR48628 E, Stoney Knoll Rd
From:
To:
1.43 03/22/2001625 Dickensons Corner Rd
48628 W, Stoney Knoll Rd30 NA NAR
48647 Big Timber RdFrom:To:
1.35 09/22/2004625 Prim Rd
60 NA NAR48629 Round Hill RdTo:
1.60 09/22/2004625 Prim Rd
118/4/2010

Virginia Department of TransportationTraffic Engineering Division
2009Annual Average Daily Traffic Volume Estimates By Section of Route
King George Maintenance Area
Route AADT1Trail 2Trail
4TireK
QA2Axle 3+Axle
QC QKBusLengthTruck
FactorAAWDT QW Year
DirFactor
40 NA NARDead End
48627 Wilmont RdTo:
From:
0.50
King George County
09/14/2004626 Green Law Way
40 NA NARDead End
1.39 MN Dead EndFrom:To:
From:
1.39 09/14/2004627 Wilmont Rd
60 NA NAR
48626 Green Law WayFrom:To:
0.15 09/14/2004627 Wilmont Rd
110 NA NAR
48681 Rollens Fork RdFrom:To:
0.90 03/22/2001627 Wilmont Rd
60 NA NAR
SR 3 Kings HwyFrom:To:
0.25 03/22/2001627 Wilmont Rd
130 NA NAR48628 Stoney Knoll RdTo:
2.67 09/22/2004627 Kings Mill Rd
400 1% 1% NA 410G 1% 1% F GSR 3 Kings Hwy
48625 E, Dickensons Corner Rd
96%
From:To:
From:
1.21 0% 2009628 Stoney Knoll Rd
480 1% 1% 0.105 520G F1% 1% C GWestmoreland County Line
96%To:
1.30 0% 2009628 Stoney Knoll Rd 0.661
1200 2% 1% 0.114 1300G F1% 0% F GSR 3 Kings Hwy
48710 Poplar Lane
95%
From:To:
From:
0.22 0% 2009629 Round Hill Rd 0.640
810 2% 1% 0.109 880G F1% 0% C G
48666 W, Gulvey Loop
95%
From:To:
1.69 0% 2009629 Round Hill Rd 0.626
500 2% 1% 0.112 540G F1% 0% F G
48620 Alden Rd
95%
From:To:
0.66 0% 2009629 Round Hill Rd 0.597
440 4% 0% 0.114 470G F1% 0% C G
48625 Prim Rd
94%
From:To:
0.70 0% 2009629 Round Hill Rd 0.537
410 4% 0% 0.101 440G F1% 0% F GWestmoreland County Line
94%To:
1.31 0% 2009629 Round Hill Rd 0.533
70 NA NARDead End
48616 Brickhouse RdTo:
From:
0.25 04/04/2001630 Kitchen Point Rd
20 NA NARDead End
48607 Port Conway RdFrom:To:
From:
1.00 09/14/2004631 Millbank Rd
230 3% 1% 0.129 240G F0% 1% F G
48669 Woodland Way
94%
From:To:
1.48 0% 2009631 Millbank Rd 0.543
310 3% 1% 0.106 330G F0% 1% C G
48601 Gera Rd
94%
From:To:
0.66 0% 2009631 Millbank Rd 0.649
320 3% 1% 0.119 350G F0% 1% F G48610 Millbank Rd; Powhatan Rd
94%To:
1.38 0% 2009631 Millbank Rd 0.629
280 NA NARSR 206; SR 218
SR 206 Dahlgren RdTo:
From:
0.90 12/10/2009632 Berthaville Rd
60 NA NARUS 301 James Madison Pkwy
48617 Poplar Neck RdFrom:To:
From:
0.55 12/10/2009633 Will Loop
60 NA NARDead EndTo:
0.14 12/10/2009633 Will Loop
150 NA NARDead End
US 301 James Madison PkwyTo:
From:
0.32 12/10/2009634 Hillcrest Dr
128/4/2010

Virginia Department of TransportationTraffic Engineering Division
2009Annual Average Daily Traffic Volume Estimates By Section of Route
King George Maintenance Area
Route AADT1Trail 2Trail
4TireK
QA2Axle 3+Axle
QC QKBusLengthTruck
FactorAAWDT QW Year
DirFactor
120 NA NAR48614 Owens Dr
0.37 ME 48614 Owens DrFrom:To:
From:
0.37
King George County
03/12/2001635 Gambo Creek Rd
20 NA NARDead EndTo:
0.08 03/12/2001635 Gambo Creek Rd
60 NA NAR481134
48640 Eleventh StFrom:To:
From:
0.12 09/20/2004636 Rosedale Dr
110 NA NAR
48604 Twelfth StFrom:To:
0.09 09/20/2004636 Rosedale Dr
220 NA NARSR 206; 48668To:
0.17 04/04/2001636 Rosedale Dr
30 NA NARDead End
SR 3 Kings HwyTo:
From:
0.64 10/12/2004637 Ridgeway Dr
130 NA NARSR 3 Kings Hwy
Dead EndTo:
From:
0.20 04/09/2001638 Hudson Rd
380 NA NAR48624 Mathias Point Rd
Dead EndTo:
From:
0.90 03/12/2001639 Osprey Rd
70 NA NAR48614 Potomac Dr
48636 Rosedale DrTo:
From:
0.10 09/20/2004640 Eleventh St
180 NA NARSR 218 Caledon Rd
Dead EndTo:
From:
0.80 09/14/2004641 Chatterton Lane
170 NA NARSR 218 Caledon Rd
48682 Eagles Nest LaneFrom:To:
From:
0.70 09/14/2004642 Fitzhugh Lane
30 NA NARDead EndTo:
0.10 09/27/2004642 Fitzhugh Lane
20 NA NARDead End
48625 Salem Church RdTo:
From:
1.80 09/27/2004643 Bald Eagle Dr
230 NA NARSR 206 Dahlgren Rd
481206 Allen AveFrom:To:
From:
0.30 09/27/2004644 Potts Lane
130 NA NAR
0.10 ME 481206 Allen AveFrom:To:
0.10 09/27/2004644 Potts Lane
40 NA NARDead EndTo:
0.30 09/27/2004644 Potts Lane
120 NA NARDead End
48647 Shiloh LoopFrom:To:
From:
1.05 04/02/2001645 Springfield Rd
570 3% 1% 0.097 620G F2% 1% C GSR 3 Kings Hwy
93%To:
0.03 0% 2009645 Springfield Rd 0.576
80 NA NARDead End
48670 Fifteenth StTo:
From:
0.40 09/20/2004646 Payne Dr
520 0% 2% 0.096 570G F0% 4% C G48645 Springfield Rd
48623 Jersey Rd
94%
From:To:
From:
0.12 0% 2009647 Shiloh Loop 0.639
330 NA NARSR 3 Kings HwyTo:
0.30 04/02/2001647 Shiloh Loop
138/4/2010

Virginia Department of TransportationTraffic Engineering Division
2009Annual Average Daily Traffic Volume Estimates By Section of Route
King George Maintenance Area
Route AADT1Trail 2Trail
4TireK
QA2Axle 3+Axle
QC QKBusLengthTruck
FactorAAWDT QW Year
DirFactor
130 NA NARSR 3 Kings Hwy
1.61 ME SR 3 Kings HwyFrom:To:
From:
1.61
King George County
04/09/2001647 Big Timber Rd
60 NA NAR48625 Prim RdTo:
0.97 09/22/2004647 Big Timber Rd
110 NA NARDead End
0.60 MN Dead EndFrom:To:
From:
0.60 10/12/2004648 Winston Place
350 NA NAR48609 Comorn RdTo:
0.61 05/02/2001648 Winston Place
40 NA NAR48609 Comorn Rd
Dead EndTo:
From:
0.75 10/12/2004649 Marmion Lane
460 NA NAR48625 Salem Church Rd
48623 Jersey RdTo:
From:
1.10 04/02/2001650 Welcome Lane
30 NA NARSR 218 W, Caledon Rd
SR 218 E, Caledon RdTo:
From:
0.72 12/08/2009651 Valley Hill Loop
120 NA NARUS 301 James Madison Pkwy
Dead EndTo:
From:
0.58 03/12/2001652 Roseland Rd
80 NA NARDead End
48686 Mt Rose DrTo:
From:
1.00 04/02/2001653 Midway Rd
240 NA NAR48600 Passapatanzy Dr
Dead EndTo:
From:
1.65 03/12/2001654 Belvedere Dr
60 NA NAR48632 Berthaville Rd
0.63 ME 48632 Berthaville RdFrom:To:
From:
0.63 03/14/2001655 St Pauls Rd
20 NA NARDead EndTo:
0.57 03/14/2001655 St Pauls Rd
180 NA NARSR 218 Windsor Dr
Dead EndTo:
From:
0.32 04/30/2001656 Rosiers Creek Lane
160 NA NARDead End
SR 3 Kings HwyTo:
From:
0.75 09/14/2004657 Chastine Dr
80 NA NAR48600 Passapatanzy Dr
0.07 ME 48600 Passapatanzy DrFrom:To:
From:
0.07 10/14/2004658 Cedar Ridge Lane
60 NA NARDead EndTo:
0.46 03/12/2001658 Cedar Ridge Lane
160 NA NARSR 206 Dahlgren Rd
Dead EndTo:
From:
0.65 09/27/2004659 Hobson Lane
60 NA NARDead End
48607 Port Conway RdTo:
From:
0.25 09/14/2004660 Canning Way
70 NA NARSR 3 Kings Hwy
48629 Round Hill RdTo:
From:
0.20 10/07/2004661 Peerless Rd
160 NA NAR48706 Pullen Loop
Dead EndTo:
From:
0.60 04/09/2001662 Oaktree Dr
148/4/2010
Virginia Department of TransportationTraffic Engineering Division
2009Annual Average Daily Traffic Volume Estimates By Section of Route
King George Maintenance Area
Route AADT1Trail 2Trail
4TireK
QA2Axle 3+Axle
QC QKBusLengthTruck
FactorAAWDT QW Year
DirFactor
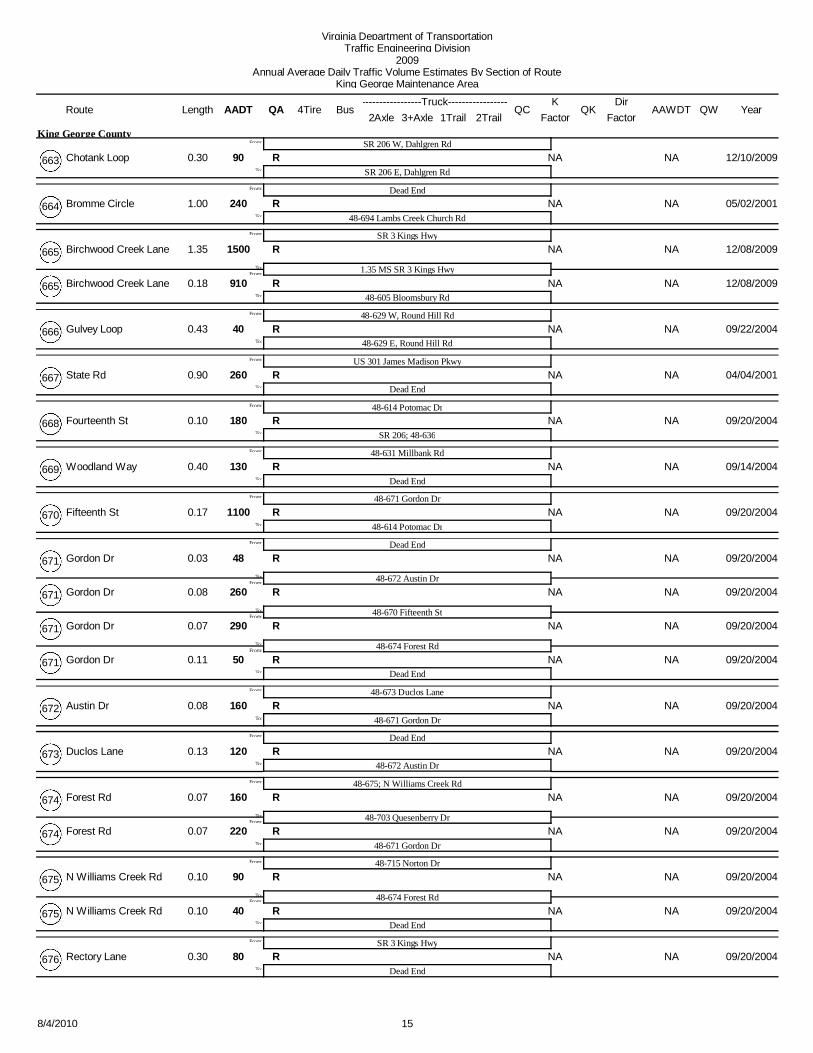
90 NA NARSR 206 W, Dahlgren Rd
SR 206 E, Dahlgren RdTo:
From:
0.30
King George County
12/10/2009663 Chotank Loop
240 NA NARDead End
48694 Lambs Creek Church RdTo:
From:
1.00 05/02/2001664 Bromme Circle
1500 NA NARSR 3 Kings Hwy
1.35 MS SR 3 Kings HwyFrom:To:
From:
1.35 12/08/2009665 Birchwood Creek Lane
910 NA NAR48605 Bloomsbury RdTo:
0.18 12/08/2009665 Birchwood Creek Lane
40 NA NAR48629 W, Round Hill Rd
48629 E, Round Hill RdTo:
From:
0.43 09/22/2004666 Gulvey Loop
260 NA NARUS 301 James Madison Pkwy
Dead EndTo:
From:
0.90 04/04/2001667 State Rd
180 NA NAR48614 Potomac Dr
SR 206; 48636To:
From:
0.10 09/20/2004668 Fourteenth St
130 NA NAR48631 Millbank Rd
Dead EndTo:
From:
0.40 09/14/2004669 Woodland Way
1100 NA NAR48671 Gordon Dr
48614 Potomac DrTo:
From:
0.17 09/20/2004670 Fifteenth St
48 NA NARDead End
48672 Austin DrFrom:To:
From:
0.03 09/20/2004671 Gordon Dr
260 NA NAR
48670 Fifteenth StFrom:To:
0.08 09/20/2004671 Gordon Dr
290 NA NAR
48674 Forest RdFrom:To:
0.07 09/20/2004671 Gordon Dr
50 NA NARDead EndTo:
0.11 09/20/2004671 Gordon Dr
160 NA NAR48673 Duclos Lane
48671 Gordon DrTo:
From:
0.08 09/20/2004672 Austin Dr
120 NA NARDead End
48672 Austin DrTo:
From:
0.13 09/20/2004673 Duclos Lane
160 NA NAR48675; N Williams Creek Rd
48703 Quesenberry DrFrom:To:
From:
0.07 09/20/2004674 Forest Rd
220 NA NAR48671 Gordon DrTo:
0.07 09/20/2004674 Forest Rd
90 NA NAR48715 Norton Dr
48674 Forest RdFrom:To:
From:
0.10 09/20/2004675 N Williams Creek Rd
40 NA NARDead EndTo:
0.10 09/20/2004675 N Williams Creek Rd
80 NA NARSR 3 Kings Hwy
Dead EndTo:
From:
0.30 09/20/2004676 Rectory Lane
158/4/2010

Virginia Department of TransportationTraffic Engineering Division
2009Annual Average Daily Traffic Volume Estimates By Section of Route
King George Maintenance Area
Route AADT1Trail 2Trail
4TireK
QA2Axle 3+Axle
QC QKBusLengthTruck
FactorAAWDT QW Year
DirFactor
620 NA NARSR 3; 48606
48609 Comorn RdTo:
From:
0.29
King George County
05/02/2001677 Stanley Rd
410 NA NARSR 3 Kings Hwy
48610 St Anthonys Rd; Millbank RdTo:
From:
0.51 05/09/2001678 St Anthonys
460 NA NARSR 3 W, Kings Hwy
SR 3 E, Kings HwyTo:
From:
0.85 12/10/2009679 Canterbury Loop
30 NA NAR48625 Salem Church Rd
SR 3 Kings HwyTo:
From:
0.32 09/14/2004680 Index Lane
130 NA NARSR 3 Kings Hwy
48627 Wilmont RdTo:
From:
0.30 03/22/2001681 Rollens Fork Rd
90 NA NAR48642 Fitzhugh Lane
Dead EndTo:
From:
1.00 09/14/2004682 Eagles Nest Lane
210 NA NAR48614 Potomac Dr
48691 Rosedale DrFrom:To:
From:
0.17 09/20/2004683 Ferry Dock Rd
110 NA NAR48693 Townsend DrTo:
0.03 09/20/2004683 Ferry Dock Rd
10 NA NARSR 205 W, Ridge Rd
SR 205 E, Ridge RdTo:
From:
0.35 09/20/2004684 Garnets Loop
30 NA NAR48624 Mathias Point Rd
Dead EndTo:
From:
0.13 09/20/2004685 Schoolhouse Rd
290 NA NARSR 3 S, Kings Hwy
SR 3 N, Kings HwyTo:
From:
1.21 12/10/2009686 Mt Rose Dr
180 NA NAR48624 Mathias Point Rd
Dead EndTo:
From:
1.66 03/12/2001687 Woodstock Rd
70 NA NAR48610 Indiantown Rd
Dead EndTo:
From:
0.20 10/12/2004688 Hickory Lane
46 NA NARDead End
48614 Potomac DrTo:
From:
0.13 09/20/2004689 Tenth St
220 NA NARSR 3 Kings Hwy
Dead EndTo:
From:
0.16 10/12/2004690 Luther Lane
46 NA NAR48683 Ferry Dock Rd
Dead EndTo:
From:
0.18 09/20/2004691 Rosedale Dr
1100 NA NARDead End
48607 Port Conway RdTo:
From:
2.60 04/02/2001692 Cleve Rd
45 NA NAR48683 Ferry Dock Rd
Dead EndTo:
From:
0.11 09/20/2004693 Townsend Dr
940 1% 1% 0.106 1000G F4% 1% C GSR 3 Kings Hwy
48664 Bromme Circle93%
To:
From:
1.39 0% 2009694 Lambs Creek Church R 0.693
168/4/2010
Virginia Department of TransportationTraffic Engineering Division
2009Annual Average Daily Traffic Volume Estimates By Section of Route
King George Maintenance Area
Route AADT1Trail 2Trail
4TireK
QA2Axle 3+Axle
QC QKBusLengthTruck
FactorAAWDT QW Year
DirFactor
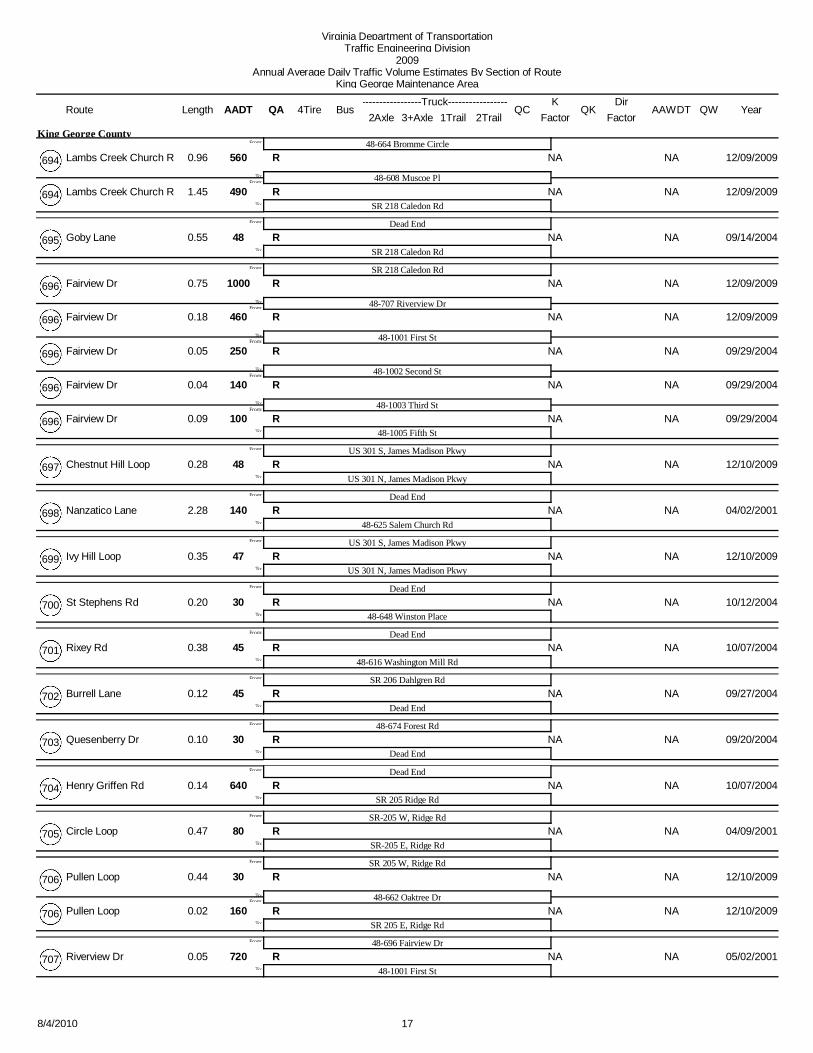
560 NA NAR48664 Bromme Circle
48608 Muscoe PlFrom:To:
From:
0.96
King George County
12/09/2009694 Lambs Creek Church R
490 NA NARSR 218 Caledon RdTo:
1.45 12/09/2009694 Lambs Creek Church R
48 NA NARDead End
SR 218 Caledon RdTo:
From:
0.55 09/14/2004695 Goby Lane
1000 NA NARSR 218 Caledon Rd
48707 Riverview DrFrom:To:
From:
0.75 12/09/2009696 Fairview Dr
460 NA NAR
481001 First StFrom:To:
0.18 12/09/2009696 Fairview Dr
250 NA NAR
481002 Second StFrom:To:
0.05 09/29/2004696 Fairview Dr
140 NA NAR
481003 Third StFrom:To:
0.04 09/29/2004696 Fairview Dr
100 NA NAR481005 Fifth StTo:
0.09 09/29/2004696 Fairview Dr
48 NA NARUS 301 S, James Madison Pkwy
US 301 N, James Madison PkwyTo:
From:
0.28 12/10/2009697 Chestnut Hill Loop
140 NA NARDead End
48625 Salem Church RdTo:
From:
2.28 04/02/2001698 Nanzatico Lane
47 NA NARUS 301 S, James Madison Pkwy
US 301 N, James Madison PkwyTo:
From:
0.35 12/10/2009699 Ivy Hill Loop
30 NA NARDead End
48648 Winston PlaceTo:
From:
0.20 10/12/2004700 St Stephens Rd
45 NA NARDead End
48616 Washington Mill RdTo:
From:
0.38 10/07/2004701 Rixey Rd
45 NA NARSR 206 Dahlgren Rd
Dead EndTo:
From:
0.12 09/27/2004702 Burrell Lane
30 NA NAR48674 Forest Rd
Dead EndTo:
From:
0.10 09/20/2004703 Quesenberry Dr
640 NA NARDead End
SR 205 Ridge RdTo:
From:
0.14 10/07/2004704 Henry Griffen Rd
80 NA NARSR205 W, Ridge Rd
SR205 E, Ridge RdTo:
From:
0.47 04/09/2001705 Circle Loop
30 NA NARSR 205 W, Ridge Rd
48662 Oaktree DrFrom:To:
From:
0.44 12/10/2009706 Pullen Loop
160 NA NARSR 205 E, Ridge RdTo:
0.02 12/10/2009706 Pullen Loop
720 NA NAR48696 Fairview Dr
481001 First StTo:
From:
0.05 05/02/2001707 Riverview Dr
178/4/2010

Virginia Department of TransportationTraffic Engineering Division
2009Annual Average Daily Traffic Volume Estimates By Section of Route
King George Maintenance Area
Route AADT1Trail 2Trail
4TireK
QA2Axle 3+Axle
QC QKBusLengthTruck
FactorAAWDT QW Year
DirFactor
760 NA NAR481001 First St
481002 Second StFrom:To:
From:
0.05
King George County
09/29/2004707 Riverview Dr
720 NA NAR
481003 Third StFrom:To:
0.05 09/29/2004707 Riverview Dr
690 NA NAR
481004 Fourth StFrom:To:
0.05 09/29/2004707 Riverview Dr
660 NA NAR
481005 Fifth StFrom:To:
0.05 09/29/2004707 Riverview Dr
500 NA NAR
481007 Seventh StFrom:To:
0.12 12/09/2009707 Riverview Dr
410 NA NAR
481008 Eighth StFrom:To:
0.04 09/29/2004707 Riverview Dr
320 NA NAR
481009 Ninth StFrom:To:
0.06 09/29/2004707 Riverview Dr
300 NA NAR
481010 Tenth StFrom:To:
0.05 09/29/2004707 Riverview Dr
200 NA NAR481011 Eleventh StTo:
0.05 12/09/2009707 Riverview Dr
48 NA NAR481007 Seventh St
481008 Eighth StFrom:To:
From:
0.04 10/04/2004708 Potomac Ave
49 NA NAR
481009 Ninth StFrom:To:
0.05 10/04/2004708 Potomac Ave
47 NA NAR
481010 Tenth StFrom:To:
0.05 10/04/2004708 Potomac Ave
45 NA NAR
481011 Eleventh StFrom:To:
0.05 10/04/2004708 Potomac Ave
40 NA NAR481012 Twelfth StTo:
0.04 12/09/2009708 Potomac Ave
120 NA NARSR 3 Kings Hwy
48710 Poplar LaneTo:
From:
0.34 10/07/2004709 Bradley Lane
40 NA NAR48709 Bradley Lane
48629 Round Hill RdTo:
From:
0.08 10/07/2004710 Poplar Lane
40 NA NARDead End
48624 Mathias Point RdTo:
From:
0.20 09/20/2004711 Dixon Lane
80 NA NAR48614 S, Potomac Dr
48614 N, Potomac DrTo:
From:
0.32 09/20/2004712 Fence Dr
50 NA NARCuldeSac
48600 Passapatanzy DrTo:
From:
0.14 03/12/2001713 Jones Ct
40 NA NAR48663 Chotank Loop
Dead EndTo:
From:
0.13 03/14/2001714 Bumbrey Lane
40 NA NAR48675 N Williams Creek Rd
Dead EndTo:
From:
0.05 04/04/2001715 Norton Dr
49 NA NAR48719 Misty Lane
SR 205 Ridge RdTo:
From:
0.25 04/04/2001717 Green Meadow Dr
188/4/2010

Virginia Department of TransportationTraffic Engineering Division
2009Annual Average Daily Traffic Volume Estimates By Section of Route
King George Maintenance Area
Route AADT1Trail 2Trail
4TireK
QA2Axle 3+Axle
QC QKBusLengthTruck
FactorAAWDT QW Year
DirFactor
70 NA NAR48719 Misty Lane
SR 205 Ridge RdTo:
From:
0.39
King George County
04/04/2001718 Shiloh Dr
40 NA NAR48717 Green Meadow Dr
CuldeSacTo:
From:
0.27 04/04/2001719 Misty Lane
200 NA NAR48629 Round Hill Rd
48725 Thunder RdTo:
From:
0.18 10/07/2004724 Beaver Dr
90 NA NARDead End
48724 Beaver DrTo:
From:
0.30 10/07/2004725 Thunder Rd
NA NA NA48628 Stoney Knoll Rd
CuldeSacTo:
From:
0.14726
70 NA NARUS 301 James Madison Pkwy
Dead EndTo:
From:
0.39 03/12/20011000 Barnes Field
50 NA NAR48707 Riverview Dr
48696 Fairview DrTo:
From:
0.15 12/09/20091001 First St
49 NA NAR48707 Riverview Dr
48696 Fairview DrTo:
From:
0.15 12/09/20091002 Second St
20 NA NAR48707 Riverview Dr
48696 Fairview DrTo:
From:
0.15 12/09/20091003 Third St
40 NA NAR48707 Riverview Dr
48696 Fairview DrTo:
From:
0.15 12/09/20091004 Fourth St
80 NA NAR48707 Riverview Dr
48696 Fairview DrTo:
From:
0.15 12/09/20091005 Fifth St
90 NA NAR48707 Riverview Dr
48708 Potomac AveTo:
From:
0.11 12/09/20091007 Seventh St
50 NA NAR48707 Riverview Dr
48708 Potomac AveTo:
From:
0.11 12/09/20091008 Eighth St
30 NA NAR48707 Riverview Dr
48708 Potomac AveTo:
From:
0.11 12/09/20091009 Ninth St
20 NA NAR48707 Riverview Dr
48708 Potomac AveTo:
From:
0.11 12/09/20091010 Tenth St
80 NA NARDead End
48708 Potomac AveTo:
From:
0.15 12/09/20091011 Eleventh St
30 NA NARDead End
48708 Potomac AveTo:
From:
0.04 09/29/20041012 Twelfth St
40 NA NARCuldeSac
SR 218 Caledon RdTo:
From:
0.19 09/29/20041013 Mapel Ridge Ct
60 NA NARCuldeSac
SR 218 Caledon RdTo:
From:
0.42 09/29/20041014 Summer Beam Dr
198/4/2010

Virginia Department of TransportationTraffic Engineering Division
2009Annual Average Daily Traffic Volume Estimates By Section of Route
King George Maintenance Area
Route AADT1Trail 2Trail
4TireK
QA2Axle 3+Axle
QC QKBusLengthTruck
FactorAAWDT QW Year
DirFactor
30 NA NAR48603 Y Intersection Leg
Dead EndTo:
From:
0.10
King George County
03/14/20011015 Lewis Lane
330 NA NAR481032 Claydael Blvd
CuldeSacTo:
From:
0.73 11/05/20091018 Ormond Way
NA NA NA481018
CuldeSacTo:
From:
0.101019
270 NA NAR481027 French Ct
481023 Covington StFrom:To:
From:
0.34 12/08/20091020 Oakland Dr
450 NA NAR
0.12 ME 481023 Covington StFrom:To:
0.12 12/08/20091020 Oakland Dr
560 NA NAR48603 Y Intersection LegTo:
0.22 12/08/20091020 Oakland Dr
230 NA NAR48603 Y Intersection Leg
481022 Flora CtFrom:To:
From:
0.14 10/14/20041021 Forest Ridge Dr
270 NA NARDead EndTo:
0.23 10/14/20041021 Forest Ridge Dr
40 NA NARCuldeSac
481021 Forest Ridge DrTo:
From:
0.05 10/14/20041022 Flora Ct
100 NA NAR481024 Garner Dr
481020 Oakland DrTo:
From:
0.12 12/08/20091023 Covington St
90 NA NARCuldeSac
481023 Covington StFrom:To:
From:
0.15 05/03/20011024 Garner Dr
80 NA NARCuldeSacTo:
0.19 12/08/20091024 Garner Dr
490 NA NAR481024 Garner Dr
SR 218 Caledon RdTo:
From:
0.74 12/08/20091025 Passapatanzy Rd
50 NA NAR481024 Garner Dr
481020 Oakland DrTo:
From:
0.18 10/14/20041026 Bush St
120 NA NARCuldeSac
481020 Oakland DrFrom:To:
From:
0.14 05/03/20011027 French Ct
NA NA NACuldeSacTo:
0.141027 French Ct
NA NA NACuldeSac
481018To:
From:
0.101028
NA NA NA481037
CuldeSacTo:
From:
0.421029
200 NA NARSR 206 Dahlgren Rd
CuldeSacTo:
From:
0.29 04/09/20011030 Ward Rd
110 NA NAR481030 Ward Rd
481032 Claydael BlvdTo:
From:
0.29 04/09/20011031 Stuart Rd
208/4/2010

Virginia Department of TransportationTraffic Engineering Division
2009Annual Average Daily Traffic Volume Estimates By Section of Route
King George Maintenance Area
Route AADT1Trail 2Trail
4TireK
QA2Axle 3+Axle
QC QKBusLengthTruck
FactorAAWDT QW Year
DirFactor
680 NA NARSR 206 Dahlgren Rd
481033 Peppermill RdFrom:To:
From:
0.18
King George County
04/09/20011032 Claydael Blvd
650 NA NAR
481039 Meadow WayFrom:To:
0.38 12/10/20091032 Claydael Blvd
590 NA NAR
481038 Aidan WayFrom:To:
0.16 12/16/20081032 Claydael Blvd
440 NA NARDead EndTo:
0.16 12/10/20091032 Claydael Blvd
350 NA NAR481032 Claydael Blvd
CuldeSacTo:
From:
0.57 04/09/20011033 Peppermill Rd
40 NA NAR481033 Peppermill Rd
Dead EndTo:
From:
0.16 04/09/20011034 Calvert Ct
150 NA NAR481033 Peppermill Rd
CuldeSacTo:
From:
0.33 04/09/20011035 Richards Ride
40 NA NARCuldeSac
481033 Peppermill RdTo:
From:
0.08 04/09/20011036 Julia Place
100 NA NAR481032 Claydael Blvd
CuldeSacTo:
From:
0.14 12/10/20091037 Culpeper Ct
NA NA NA481032 Claydael Blvd
CuldeSacTo:
From:
0.221038 Aidan Way
70 NA NAR481032 Claydael Blvd
CuldeSacTo:
From:
0.28 04/09/20011039 Meadow Way
70 NA NARSR 218 Caledon Rd
481041 E, Potomac Landing DrTo:
From:
1.51 09/29/20041040 Potomac Landing Dr
150 NA NAR481040 W, Potomac Landing Dr
CuldeSacTo:
From:
0.37 05/02/20011041 Potomac Landing Dr
20 NA NAR481041 Potomac Landing Dr
481040 Potomac Landing DrTo:
From:
0.18 05/02/20011042 Tides Rd
100 NA NARSR 206 Dahlgren Rd
481044 North Stuart StTo:
From:
0.04 04/23/20091043 Lucas Lane
90 NA NAR481031 Stuart Rd
481043 Lucas LaneFrom:To:
From:
0.22 12/16/20081044 North Stuart St
NA NA NACuldeSacTo:
0.341044 North Stuart St
NA NA NA481044
CuldeSacTo:
From:
0.051045
170 NA NARDead End
48694 Lambs Creek Church RdTo:
From:
0.50 05/02/20011050 Turkey Acres Rd
300 NA NARDead End
48614 Potomac DrTo:
From:
0.24 04/04/20011051 Combs Rd
218/4/2010

Virginia Department of TransportationTraffic Engineering Division
2009Annual Average Daily Traffic Volume Estimates By Section of Route
King George Maintenance Area
Route AADT1Trail 2Trail
4TireK
QA2Axle 3+Axle
QC QKBusLengthTruck
FactorAAWDT QW Year
DirFactor
170 NA NAR48629 Round Hill Rd
CuldeSacTo:
From:
0.40
King George County
09/22/20041060 Round Hill Estates Dr
40 NA NARCuldeSac
481060 Round Hill Estates DrTo:
From:
0.09 09/22/20041061 Deerfield Ct
10 NA NARCuldeSac
481060 Round Hill Estates DrTo:
From:
0.12 09/22/20041062 Forest Lane
NA NA NACuldeSac
48614 Owens DrTo:
From:
0.191085
NA NA NA481085
CuldeSacTo:
From:
0.231086
NA NA NACuldeSac
481088To:
From:
0.101087
100 NA NAR481085
481086To:
From:
0.25 04/23/20091088
NA NA NASR 3 Kings Hwy
Dead EndTo:
From:
0.211097
30 NA NAR481105 Fleming St
481108 Delaware DrTo:
From:
0.16 03/14/20011100 Savanah St
1900 NA NARUS 301 James Madison Pkwy
481102 Baltic PlaceFrom:To:
From:
0.16 09/22/20041101 Danube Dr
1300 NA NAR
481103 Williams PlaceFrom:To:
0.11 09/22/20041101 Danube Dr
1100 NA NAR
481105 Fleming StFrom:To:
0.12 09/22/20041101 Danube Dr
390 NA NAR481108 Delaware DrTo:
0.15 03/14/20011101 Danube Dr
130 NA NAR481104 Willow Tree Lane
481101 Danube DrFrom:To:
From:
0.06 09/22/20041102 Baltic Place
70 NA NARDead EndTo:
0.07 09/22/20041102 Baltic Place
110 NA NAR481101 Danube Dr
Dead EndTo:
From:
0.15 09/22/20041103 Williams Place
60 NA NARDead End
481102 Baltic PlaceFrom:To:
From:
0.06 09/22/20041104 Willow Tree Lane
40 NA NARDead EndTo:
0.06 09/22/20041104 Willow Tree Lane
70 NA NARCuldeSac
481109 Pamlico DrFrom:To:
From:
0.08 03/14/20011105 Fleming St
170 NA NAR481100 Savanah StTo:
0.07 03/14/20011105 Fleming St
228/4/2010

Virginia Department of TransportationTraffic Engineering Division
2009Annual Average Daily Traffic Volume Estimates By Section of Route
King George Maintenance Area
Route AADT1Trail 2Trail
4TireK
QA2Axle 3+Axle
QC QKBusLengthTruck
FactorAAWDT QW Year
DirFactor
260 NA NAR481100 Savanah St
481107 Albemarle CtFrom:To:
From:
0.08
King George County
03/14/20011105 Fleming St
450 NA NAR
481106 Chesapeake PlaceFrom:To:
0.15 09/22/20041105 Fleming St
630 NA NAR481101 Danube DrTo:
0.07 09/22/20041105 Fleming St
90 NA NARCuldeSac
481108 Delaware DrTo:
From:
0.24 09/22/20041106 Chesapeake Place
70 NA NAR481105 Fleming St
CuldeSacTo:
From:
0.12 09/22/20041107 Albemarle Ct
190 NA NARCuldeSac
481101 Danube DrFrom:To:
From:
0.40 03/14/20011108 Delaware Dr
50 NA NARCuldeSacTo:
0.06 03/14/20011108 Delaware Dr
40 NA NAR481105 Fleming St
481108 Delaware DrTo:
From:
0.13 03/14/20011109 Pamlico Dr
100 NA NARSR 218 Windsor Dr
481111 Price CtFrom:To:
From:
0.05 09/20/20041110 Machodoc Dr
70 NA NARDead EndTo:
0.36 09/20/20041110 Machodoc Dr
20 NA NARDead End
481110 Machodoc DrTo:
From:
0.07 09/20/20041111 Price Ct
80 NA NAR481101 Danube Dr
CuldeSacTo:
From:
0.09 09/22/20041112 Cape Fear Lane
90 NA NARCuldeSac
SR 206 Dahlgren RdTo:
From:
0.20 10/04/20041115 Strawberry Lane
490 NA NAR48679 Canterbury Loop
Dead EndTo:
From:
0.62 12/10/20091120 Kent Rd
30 NA NAR481120 Kent Rd
CuldeSacTo:
From:
0.10 04/09/20011121 Ascot Close Dr
60 NA NAR481120 Kent Rd
CuldeSacTo:
From:
0.09 04/09/20011122 Ripon Ct
210 NA NAR481120 Kent Rd
CuldeSacTo:
From:
0.42 12/10/20091123 Canerbury Ct
30 NA NARCuldeSac
481120 Kent RdTo:
From:
0.13 10/07/20041124 Chester Ct
330 NA NAR481131 River Dr
48639 Osprey RdTo:
From:
0.77 03/12/20011130 Green Blvd
110 NA NARCuldeSac
481130 Green BlvdTo:
From:
0.55 03/12/20011131 River Dr
238/4/2010
Virginia Department of TransportationTraffic Engineering Division
2009Annual Average Daily Traffic Volume Estimates By Section of Route
King George Maintenance Area
Route AADT1Trail 2Trail
4TireK
QA2Axle 3+Axle
QC QKBusLengthTruck
FactorAAWDT QW Year
DirFactor
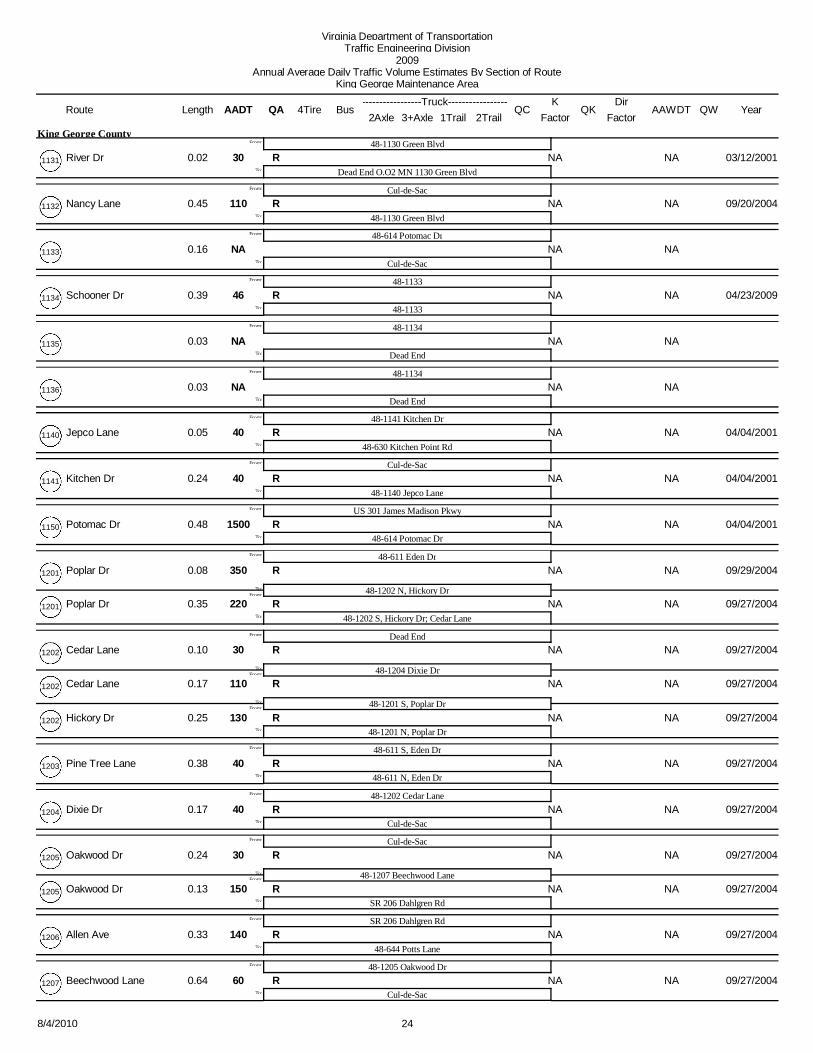
30 NA NAR481130 Green Blvd
Dead End O.O2 MN 1130 Green BlvdTo:
From:
0.02
King George County
03/12/20011131 River Dr
110 NA NARCuldeSac
481130 Green BlvdTo:
From:
0.45 09/20/20041132 Nancy Lane
NA NA NA48614 Potomac Dr
CuldeSacTo:
From:
0.161133
46 NA NAR481133
481133To:
From:
0.39 04/23/20091134 Schooner Dr
NA NA NA481134
Dead EndTo:
From:
0.031135
NA NA NA481134
Dead EndTo:
From:
0.031136
40 NA NAR481141 Kitchen Dr
48630 Kitchen Point RdTo:
From:
0.05 04/04/20011140 Jepco Lane
40 NA NARCuldeSac
481140 Jepco LaneTo:
From:
0.24 04/04/20011141 Kitchen Dr
1500 NA NARUS 301 James Madison Pkwy
48614 Potomac DrTo:
From:
0.48 04/04/20011150 Potomac Dr
350 NA NAR48611 Eden Dr
481202 N, Hickory DrFrom:To:
From:
0.08 09/29/20041201 Poplar Dr
220 NA NAR481202 S, Hickory Dr; Cedar LaneTo:
0.35 09/27/20041201 Poplar Dr
30 NA NARDead End
481204 Dixie DrFrom:To:
From:
0.10 09/27/20041202 Cedar Lane
110 NA NAR
481201 S, Poplar DrFrom:To:
0.17 09/27/20041202 Cedar Lane
130 NA NAR481201 N, Poplar DrTo:
0.25 09/27/20041202 Hickory Dr
40 NA NAR48611 S, Eden Dr
48611 N, Eden DrTo:
From:
0.38 09/27/20041203 Pine Tree Lane
40 NA NAR481202 Cedar Lane
CuldeSacTo:
From:
0.17 09/27/20041204 Dixie Dr
30 NA NARCuldeSac
481207 Beechwood LaneFrom:To:
From:
0.24 09/27/20041205 Oakwood Dr
150 NA NARSR 206 Dahlgren RdTo:
0.13 09/27/20041205 Oakwood Dr
140 NA NARSR 206 Dahlgren Rd
48644 Potts LaneTo:
From:
0.33 09/27/20041206 Allen Ave
60 NA NAR481205 Oakwood Dr
CuldeSacTo:
From:
0.64 09/27/20041207 Beechwood Lane
248/4/2010

Virginia Department of TransportationTraffic Engineering Division
2009Annual Average Daily Traffic Volume Estimates By Section of Route
King George Maintenance Area
Route AADT1Trail 2Trail
4TireK
QA2Axle 3+Axle
QC QKBusLengthTruck
FactorAAWDT QW Year
DirFactor
50 NA NARCuldeSac
SR 206 Dahlgren RdTo:
From:
0.19
King George County
04/09/20011209 Fulmont Dr
110 NA NARCuldeSac
481211 Todd StFrom:To:
From:
0.15 04/30/20011210 Michael Dr
540 NA NAR48610 Indiantown RdTo:
0.08 04/30/20011210 Michael Dr
100 NA NARDead End
481210 Michael DrFrom:To:
From:
0.20 09/27/20041211 Todd St
60 NA NARDead EndTo:
0.08 09/27/20041211 Todd St
90 NA NARCuldeSac
481210 Michael DrTo:
From:
0.10 04/30/20011212 Linda Lane
460 NA NARSR 3 Kings Hwy
481215 Pamela Ct; 481216 Karen CtFrom:To:
From:
0.10 10/07/20041214 Hudson Lane
300 NA NAR481217 Walkers LaneTo:
0.13 10/07/20041214 Hudson Lane
90 NA NARCuldeSac
481214 Hudson LaneTo:
From:
0.08 10/07/20041215 Pamela Ct
40 NA NAR481214 Hudson Lane
CuldeSacTo:
From:
0.09 10/07/20041216 Karen Ct
110 NA NARDead End
481214 Hudson LaneFrom:To:
From:
0.09 10/07/20041217 Walkers Lane
100 NA NARDead EndTo:
0.09 10/07/20041217 Walkers Lane
230 NA NARCuldeSac
48611 Eden DrTo:
From:
0.48 04/09/20011220 Lee St
140 NA NARCuldeSac
481220 Lee StreetTo:
From:
0.25 04/09/20011223 Clare St
40 NA NAR481223 Clare St
CuldeSacTo:
From:
0.10 04/09/20011224 Pratt Place
300 NA NARDead End
48610 Indiantown RdTo:
From:
0.78 11/05/20091225 Mohawk Dr
280 NA NAR481228
48610 Indiantown RdTo:
From:
0.51 12/16/20081226 Pamunkey Dr
40 NA NAR481225
481226 Pamunkey DrTo:
From:
0.08 12/16/20081227 Monacan Way
140 NA NAR481226 Pamunkey Dr
Dead EndTo:
From:
0.32 11/05/20091228 Mattapani Lane
150 NA NAR48610 Indiantown Rd
CuldeSacTo:
From:
0.39 04/30/20011230 Sherwood Forest Dr
258/4/2010

Virginia Department of TransportationTraffic Engineering Division
2009Annual Average Daily Traffic Volume Estimates By Section of Route
King George Maintenance Area
Route AADT1Trail 2Trail
4TireK
QA2Axle 3+Axle
QC QKBusLengthTruck
FactorAAWDT QW Year
DirFactor
20 NA NARCuldeSac
481230 Sherwood Forest DrTo:
From:
0.08
King George County
04/20/20011231 Little John Ct
40 NA NAR481230 Sherwood Forest Dr
CuldeSacTo:
From:
0.08 04/30/20011232 Robin Hood Ct
49 NA NARCuldeSac
SR 206 Dahlgren RdTo:
From:
0.54 11/05/20091238 Earnest Ellis Lane
NA NA NA481238
CuldeSacTo:
From:
0.131239
590 NA NARSR 206 Dalgren Rd
481241To:
From:
0.65 04/23/20091240 Ernest Ellis Lane
600 NA NARCuldeSac
481240 Ernest Ellis LaneTo:
From:
0.58 11/05/20091241 Earnest Ellis Lane
390 NA NAR481241
481244To:
From:
0.29 04/23/20091242 Saddle Dr
NA NA NA481242
CuldeSacTo:
From:
0.321243
130 NA NAR481242 Saddle Dr
481242 Saddle DrTo:
From:
0.24 04/23/20091244 Zepp Dr
NA NA NA481244
CuldeSacTo:
From:
0.311245
NA NA NACuldeSac
481241To:
From:
0.181246
NA NA NACuldeSac
481244To:
From:
0.181247
330 NA NAR48610 Millbank Rd
48610 Millbank RdTo:
From:
0.14 10/12/20049209 King George School Bo
120 NA NARUS 301 James Madison Pkwy
US 301 James Madison PkwyTo:
From:
0.06 10/07/20049210 King George School Mai
520 NA NARSR 206 Dalgren Rd
SR 206 Dalgren RdTo:
From:
0.15 10/07/20049213 King George Middle Sch
90 NA NAR48670 Fifteenth St
48614 Potomac DrTo:
From:
0.07 09/20/20049578 Potomac Elementary Sc
340 NA NARSR 206 Dalgren Rd
SR 206 Dalgren RdTo:
From:
0.31 10/07/20049951 King George High Scho
268/4/2010