aaii journal march 2015 damodaran sent june 2015 · stock strategies march 2015 19 buybacks became...
TRANSCRIPT

I N D I V I D U A LN
A M E R I C A NASSOCIATIO
I N V E S T O R S
OF
®
©2014 Reprinted with permission from
The American Association of Individual Investors625 N. Michigan Ave., Chicago, IL 60611
800-428-2244www.aaii.com
The American Association of Individual Investors is a nonprofi t group whose sole purpose is to assist its 150,000+ members with their investment information and education needs. For over 30 years, AAII has been providing guidance and tools to both the beginner and advanced investor. AAII helps members build their invest-ment wealth through guides, model portfolios, a monthly Journal and a compre-hensive website.
WORTH READING
New to AAII? Here’s a sample of the quality education we provide to individual investors. We hope you fi nd it useful. It touches on one aspect of the broad subjects we cover for anyone who has an interest in handling their own investments. AAII teaches you what you need to know about fi nancial plan-ning, comparing mutual funds, investing for income, screening for and analyzing stocks, asset allocation strategies, handling taxes, saving for and investing in retirement, and more.
We appreciate your interest! For more information and to sign up for AAII
membership, please visit our website at AAII.com.
For speedier service, call AAII toll-free
at 1-800-428-2244.

Stock Strategies
19March 2015
buybacks became clear in the 1990s, and the aggregate amount in buybacks
exceeded the aggregate dividends paid from 2005 to 2007. In 2007, the aggregate amount
in buybacks was 32% higher than the dividends paid in that year. The market crisis of 2008 did
result in a sharp pullback in buybacks in 2009, and while dividends also fell, they did not fall by as much.
The practice of buybacks has also now spread far and wide across the corporate spectrum, with small and large companies as well those in different sectors partaking in the phenomenon.
Buybacks Are a Return of Cash to Shareholders
To understand buybacks, it is best to start simple. Pub-licly traded companies that generate excess cash often want to return that cash to shareholders, and shareholders want them to do that. There are only two ways a company can return cash to shareholders. One is to pay dividends, either on a regular basis (quarterly, semiannually or yearly) or as special dividends. The other is to buy back stock. From the company’s perspective, the aggregate effect is exactly the same, as cash leaves the company and goes to shareholders. There are four differences, though, between the two modes.
1. Dividends are sticky, buybacks are not. With regular dividends, there is a tradition of maintaining or increasing dividends, a phenomenon referred to as sticky dividends.
After a brief pause in 2009, companies returned to buy-ing back stock with a vengeance, with more than $500 billion in stock buybacks in 2014.
As stock prices rise and anxiety about bubbles and real economic growth also comes to the surface as I write this, it is not surprising that some are trying to make a connec-tion, rightly or wrongly, to the buyout numbers. In my view, much that is written about buybacks reflects a fundamental misunderstanding of what stock buybacks are and what they can do for companies.
Trends and History
For much of the last century, companies were not allowed to buy back stock, except in exceptional circumstances. In the United States, the pace of buybacks did not really start picking up until the early 1980s, which some attribute to a Securities and Exchange Commission rule (10b-18) passed in 1982, providing safe harbor (protection from certain lawsuits) for companies doing repurchases. Figure 1 shows aggregate stock buybacks and dividends at U.S. companies going back to 1980.
While dividends represented the preponderance of cash returned to investors in the early 1980s, the move toward
Stock Buybacks: Misunderstood, Misanalyzed and MisdiagnosedBy Aswath Damodaran
Article Highlights•Both stock buybacks and dividends return cash to shareholders, but there are four key differences between the two.•Stock buybacks can have no impact on a company’s value, increase it or decrease it.•Share prices may be affected if the stock is mispriced, if investors perceive the buyback announcement as a signal about the
company’s prospects or if the buyback is large relative to the number of shares outstanding.
Reprinted with permission from the American Association of Individual Investors, 625 N. Michigan Ave., Chicago, IL 60611; 800-428-2244; www.aaii.com. ©2015.

20 AAII Journal
Thus, if a company initiates or increases dividends, it is expected to continue to pay those dividends over time or face a market backlash. Stock buybacks don’t carry this
legacy: Companies can go from buy-ing back billions of dollars’ worth of stock in one year to not buying back stock the next without facing the same market reaction.
2. Buybacks affect share count, dividends do not. When a com-pany pays dividends, the share count is unaffected, but when it buys back shares, the share count decreases by the number of shares bought back. Consequently, share buybacks alter the ownership structure of the firm, leaving investors who do not sell their shares back with a larger share in a smaller company.
3. Dividends return cash to all shareholders, buybacks only to the self-selected. When companies pay dividends, all shareholders get paid those dividends, whether they need or want the cash. Thus, it is a return of cash that all shareholders partake in, in proportion to their stockholding. In a stock buyback, only those shareholders who tender their shares back to the company get cash. The remaining shareholders get a larger proportional stake in the remaining firm.
4. Dividends and buybacks create different tax consequences. The tax laws may treat dividends and capital gains differently at the indi-vidual investor level. Since dividends are paid out to all shareholders, they will be treated as income in the year in which they are paid out and taxed accordingly. For instance, the U.S. tax code treated dividends as ordinary income for much of the last century, though qualified divi-dends have been taxed at the same rate as capital gains since 2003. A stock buyback has more subtle tax effects, since investors who tender their shares back generally have to pay capital gains taxes on the transaction, but only if the buyback price exceeds the price they paid to acquire the shares in a taxable ac-count. If the remaining shares go up in price, shareholders who did not tender their shares can defer their capital gains taxes until they do sell the shares.
The Value Effect
Buybacks can have no effect, a
$0
$200,000
$400,000
$600,000
$800,000
$1,000,000
$1,200,000
1980
1981
1982
1983
1984
1985
1986
1987
1988
1989
1990
1991
1992
1993
1994
1995
1996
1997
1998
1999
2000
2001
2002
2003
2004
2005
2006
2007
2008
2009
2010
2011
2012
2013
Cash
Ret
urne
d (in
mill
ions
of U
S $)
Dividends
Buybacks
Assets
Inve
stm
ent E
�ec
t
Debt
E�ect
Liabilities
Debt will create a tax bene�t but also increase the probability of default
(and bankruptcy costs). The net e�ect, positive or negative, will a�ect the value of the operating assets.
By using cash or debt capacity to buy back stock, the company may invest less in its operating businesses, thus a�ecting their value a. negatively (if the investments rejected > cost of capital) or b. not at all (if the investments earn the cost of capital) or c. positively (if investments expected to earn less than the cost of capital)
Cash
E�e
ct • Debt• Equity
• Cash• Operating Assets
If investors don’t trust the company with its cash, and
discount it, returning cash will remove discount.
If the buyback is funded partly or fully with debt, debt will increase as will
the net debt ratio.
If the buyback is funded with cash on hand, cash
will decrease.
Figure 1. Aggregate Dividends and Stock Buybacks for U.S. Firms
Figure 2. Financial Balance Sheet: The Value Effects of a Buyback

Stock Strategies
21March 2015
the return on capital is greater than the cost of capital) and uses it to buy back stocks. This requires that the company also face a capital constraint, imposed either internally (because the company does not like to raise new financing) or externally (because the company is prevented from raising new financing).
The Pricing Effect
If buybacks have no effect on value, can they still affect stock prices? Sure, and there are three possible factors that may cause the effect.
The first is if there is a market mis-take at play, where the stock is priced above or below its intrinsic value and the buyback occurs at a price that is not equal to the value. The second is that markets extrapolate from corporate actions and may view the buyback as a signal about what managers of the company think about its fair value. The third is that a buyback, especially if large and/or on a lightly traded stock, can have liquidity effects, tilting the demand side of the pricing equation. All of the effects are captured in Figure 3.
Market MispricingIf the stock is mispriced before
the buyback, the buyback can create a value transfer between those who tender their shares back and those who remain as shareholders, with the direction of the transfer depending on whether the
Value IncreasingThere are three pathways through
with which a buyback can have a posi-tive effect on value.
The first is when the market does not trust the management of a company with a large cash balance and is discount-ing that cash on the assumption that the company will do something stupid with the cash. Paying the cash out eliminates the discount.
The second is when an under-levered firm borrows money to do a buyback, effectively raising its value by the net benefit of the added debt, calculated as the difference between the tax benefits from the debt and the increase in bankruptcy costs.
The third is when a company that is in a bad business stops investing in that business and redirects the cash to shareholders.
Value DestructiveThere are two ways in which a buy-
back can have a negative effect on value.The first is if the firm is over-levered
and chooses to finance the buyback with even more debt, since that would push the cost of capital higher after the buyback (as the expected bankruptcy costs overwhelm the tax benefits of borrowing).
The second way a negative effect on value could result is if the firm takes cash that would have been directed to su-perior investment opportunities (where
positive effect or a negative effect on equity value per share, depending on where the cash from the buyback is com-ing from and how it affects the firm’s investment decisions. To illustrate the effects, let’s start with a simple financial balance sheet (not an accounting one), where we estimate the intrinsic values of operating assets and equity and illustrate the effects of a stock buyback on the balance sheet (see Figure 2).
Note that the buyback can be funded entirely with cash, partly with cash and partly with new debt, or even entirely with debt. (I am going to leave out the perverse, but not uncommon, scenario of a company that funds a buyback with a new stock issue, since the only party that is enriched by that transaction is the investment banker who manages both the issuance and the buyback).
The value of the operating assets can change, if the net debt ratio of the company changes after the buyback (thus affecting the cost of capital) or if the buyback reduces the amount that the company was planning to invest in its operating assets (thus changing the cash flows, growth and risk in these assets).
This framework is a useful vehicle to look at the conditions under which buybacks have no effect, a positive effect and a negative effect on value.
Value NeutralFor buybacks to have no effect on
value, they should have no effect on the value of the operating assets. That must effectively mean that the buyback is entirely funded with cash off the bal-ance sheet or that even if funded with debt, there is no net value effect (tax benefits cancel out with default cost) and that the buyback has no effect on how much the company invests back into its operating assets. As an example, consider the $13.2 billion in stock buybacks made by Exxon Mobil (XOM) in 2013. The company funded the buybacks entirely with cash surpluses; not only did it have more than enough cash to cover reinvestment needs, it also continued to generate billions of dollars in excess cash (over and above its reinvestment needs).
YESYYESESYES NONNONNONODoes the market view the buyback as a signal that
the stock is undervalued?
Stock price will go up on buyback announcement. If market is right,
will stay up. If wrong, will give back gains in medium term.
Is the buyback large enough to create a
liquidity e�ect?
Stock price will go up during actual buyback,
but will give back gains quickly.
Value transfer, from those who tender in
buyback to those who do not.
Value transfer, to those who tender in buyback from those
who do not.
Undervalued, i.e., price < value
Overvalued, i.e., price > value
IS THE STOCK CORRECTLY PRICED PRIOR TO BUYBACK, I.E., IS PRICE = VALUE?IS THE STOCK CORRECTLY PRICED PRIOR TO BUYBACK, I.E., IS PRICE = VALUE?
Figure 3. Is the Stock Correctly Priced Prior to Buyback?

22 AAII Journal
shares were over- or undervalued to begin with.
If the price is less than the value (i.e., the stock is underpriced), a buyback at the prevailing price will benefit the remaining shareholders, by letting them capture the difference but at the expense of the shareholders who chose to sell their shares back at the “low price.”
If the price is greater than the value (i.e., the stock is overpriced), a buyback will benefit those who sell their shares back, at the expense of those who hold on to their shares.
In either case, there is no value creation, but rather only a value trans-fer, from one group of shareholders in the company to another, and each stockholder gets to decide which group to join.
SignalingFor better or worse, markets read
messages into actions and then translate them into price effects. Thus, when companies buy back stock, investors may consider this to be a signal that these companies view their stock to be
undervalued. If there is a signaling ef-fect, the stock price should be expected to jump on the announcement of the buyback and not at the time of the actual execution.
The problem with this signaling story is that it attributes information and valuation skills to the company’s executives that they do not possess. The fact that buybacks peak when markets are booming and lag in bear markets suggests that managers are not great market timers.
Liquidity EffectsA stock buyback, especially if it is a
large percentage of outstanding shares, does create a liquidity effect, with the buy orders from the company pushing up the stock price. For this to occur, though, the shares bought back have to be a high percentage of the shares traded (not the shares outstanding).
If there is a liquidity effect, the stock price should be expected to rise around the actual buyback (and not the announcement) with the price effect fading in the weeks after.
The Sum of the Effects
In summary, buybacks can increase value if they lower the cost of capital and create a tax benefit that exceeds expected bankruptcy costs, and they can increase share prices for non-tendering shareholders if the stock is undervalued. Buybacks can destroy value if they put a company’s survival at risk by either eliminating a cash buffer or pushing debt to dangerously high levels. They can also result in wealth transfer to the shareholders who sell back over those who remain in the firm if the buyback price exceeds the value per share.
What about the share count effect? This is the red herring of buyback analysis: a number that looks profoundly meaningful at first sight, but on deeper analysis is useless in assessing the effect of a buyback. A stock buyback will always reduce share count, and the as-sessment of whether a buyback is good news often boils down to estimating how much earnings per share goes up after it happens. In a world where price-earnings (P/E) ratios stay constant, come out of sector averages, or are just made up, this will translate into a higher price per share. The problem is that a buyback alters the risk profile of a firm and should also change its price-earnings ratio (usually to a lower number).
To assess the effect of a buyback, consider the full picture. Look at how a company is financed (and the effect it has on the debt ratio and cost of capital) and how the stock price relates to its fair value (underpriced, correctly priced or overpriced) to make a judgment on whether shareholders will benefit or be hurt by the stock buyback.
Back to the Market
There are some critics who argue that stock buybacks are the most de-structive trend in corporate America. Looking at the value destruction path-ways described in the last section, this group believes that the stock buybacks at U.S. companies are increasing lever-age to dangerously high levels and/or reducing investment in good projects.
0.0
0.5
1.0
1.5
2.0
2.5
3.0
3.5
4.0
4.5
0%
10%
20%
30%
40%
50%
60%
1980
1981
1982
1983
1984
1985
1986
1987
1988
1989
1990
1991
1992
1993
1994
1995
1996
1997
1998
1999
2000
2001
2002
2003
2004
2005
2006
2007
2008
2009
2010
2011
2012
2013
Debt
/EBI
TDA
Debt
/Cap
ital
(%)
Debt/EBITDA
Debt/Cap (Market)
Debt/Cap (Book)
Figure 4. Debt at U.S. Companies as a Percentage of Capital and Multiple of EBITDA
Stock Strategies
23March 2015
But are these contentions true?
The Leverage StoryThe notion that U.S. companies are
dangerously over-levered seems to be built on two arguments: the aggregate debt levels of businesses as reported in the U.S. national accounts, and anecdotal evidence. To examine this argument, I have estimated debt levels at U.S. com-panies from 1980 to 2013 in Figure 4, both as a percentage of capital (book and market) and as a multiple of EBITDA (earnings before interest, taxes, deprecia-tion and amortization).
It is true that overall financial
l e v e r a g e , at least as m e a s u r e d relative to book value and EBIT-DA, has in-creased over time, though it has re-mained rel-
atively stable as a percent of market value. While this increase can be par-tially explained by decreasing interest rates over the period, it is worth asking whether buybacks were the driving force in the increased leverage. To answer this question, I compared the debt ratios of companies that bought back stock in 2013 to those that did not. There is nothing in the data that suggests that companies that do buybacks are fund-ing them disproportionately with debt or becoming dangerously over-levered, as Table 1 shows.
Companies that bought back stock had debt ratios that were roughly similar
to those that didn’t buy back stock and much less debt, scaled to cash flows (EBITDA), and these debt ratios/mul-tiples were computed after the buybacks.
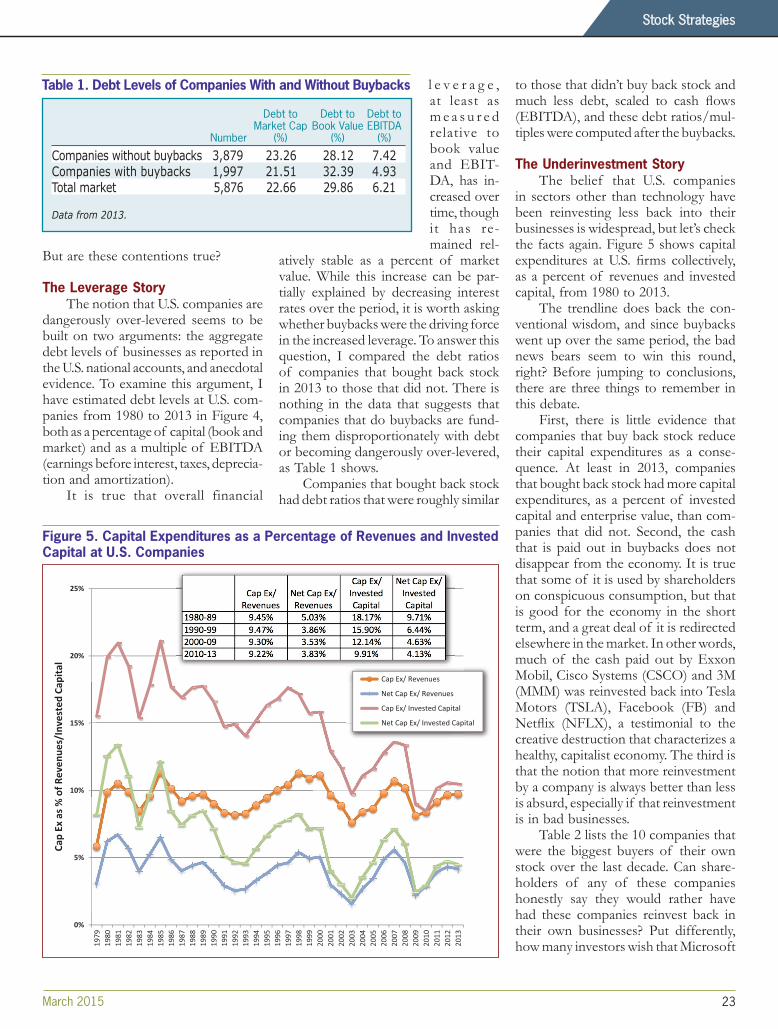
The Underinvestment StoryThe belief that U.S. companies
in sectors other than technology have been reinvesting less back into their businesses is widespread, but let’s check the facts again. Figure 5 shows capital expenditures at U.S. firms collectively, as a percent of revenues and invested capital, from 1980 to 2013.
The trendline does back the con-ventional wisdom, and since buybacks went up over the same period, the bad news bears seem to win this round, right? Before jumping to conclusions, there are three things to remember in this debate.
First, there is little evidence that companies that buy back stock reduce their capital expenditures as a conse-quence. At least in 2013, companies that bought back stock had more capital expenditures, as a percent of invested capital and enterprise value, than com-panies that did not. Second, the cash that is paid out in buybacks does not disappear from the economy. It is true that some of it is used by shareholders on conspicuous consumption, but that is good for the economy in the short term, and a great deal of it is redirected elsewhere in the market. In other words, much of the cash paid out by Exxon Mobil, Cisco Systems (CSCO) and 3M (MMM) was reinvested back into Tesla Motors (TSLA), Facebook (FB) and Netflix (NFLX), a testimonial to the creative destruction that characterizes a healthy, capitalist economy. The third is that the notion that more reinvestment by a company is always better than less is absurd, especially if that reinvestment is in bad businesses.
Table 2 lists the 10 companies that were the biggest buyers of their own stock over the last decade. Can share-holders of any of these companies honestly say they would rather have had these companies reinvest back in their own businesses? Put differently, how many investors wish that Microsoft
Table 1. Debt Levels of Companies With and Without Buybacks
0%
5%
10%
15%
20%
25%
1979
1980
1981
1982
1983
1984
1985
1986
1987
1988
1989
1990
1991
1992
1993
1994
1995
1996
1997
1998
1999
2000
2001
2002
2003
2004
2005
2006
2007
2008
2009
2010
2011
2012
2013
Cap
Ex a
s % o
f Rev
enue
s/In
vest
ed C
apita
l
Cap Ex/ Revenues
Net Cap Ex/ Revenues
Cap Ex/ Invested Capital
Net Cap Ex/ Invested Capital
Figure 5. Capital Expenditures as a Percentage of Revenues and Invested Capital at U.S. Companies
Debt to Debt to Debt to Market Cap Book Value EBITDA Number (%) (%) (%)
Companies without buybacks 3,879 23.26 28.12 7.42Companies with buybacks 1,997 21.51 32.39 4.93Total market 5,876 22.66 29.86 6.21
Data from 2013.

24 AAII Journal
Aswath Damodaran holds the Kerschner Family Chair in Finance Education and is professor of finance at New York University Stern School of Business. Find out more about the author at www.aaii.com/authors/aswath-damodaran.
(MSFT) had not bought back $100 bil-lion worth of shares over the last decade and instead pumped that money into more Zune music players and Surface tablets? Or prefer Hewlett-Packard (HPQ) bought three more companies like Autonomy (and written them off soon after) instead of paying out $60 billion to shareholders?
If, as some argue, these companies are cannibals for buying back their own stock, investors in these companies wish they had more voracious appetites and had eaten themselves faster.
Other IssuesThere are two other issues brought
up by critics of stock buybacks.
One is that firms may buy back stock ahead of positive infor-mation announcements, and those investors who tender their shares in the buyback will lose out to those who do not.
The other is that there is a tie to manage-ment compensation, where managers who are compensated with options may find it in their best interests to
buy back stock rather than pay dividends; the former pushes up stock prices while the latter lowers them. Note that doing a buyback ahead of material informa-tion releases is already illegal, and any firm that does it is breaking the law. As for management compensation, I agree that there is a problem, but buybacks are again a symptom and not a cause of the problem. In my view, it is poor corporate governance practice on the part of boards of directors to grant huge option packages to managers and then vote for buybacks designed to make managers even better off. Again, fixing buybacks does nothing to solve the underlying problem.
Don’t Make Too Much of Buybacks
I think that both ends of the spectrum on buybacks are making too much of a simple cash-return phenom-enon. To the boosters of buybacks as value creators, it is time for a reality check. Barring the one scenario where companies that buy back stock stop making value-destructive investments, almost every other positive story about buybacks is one about value transfers: from taxpayers to equity investors (when debt is used by an under-levered firm to finance buybacks) and from one set of shareholders to another (when a company buys back undervalued or overvalued stock).
To those who argue that buybacks are destroying the U.S. economy, I would suggest that such claims are a vehicle for real concerns about the evolution of the U.S. economy. Those who are worried about insider trading, executive compensation, tax-motivated transactions and/or under-investment by the manufacturing sector may have well-placed fears.
Stock buybacks did not cause these problems, however, and banning or regulating buybacks by companies falls squarely in the feel-good but do-bad economic policy realm.
Table 2. Corporate Cannibals (The Economist): Large Buyers of Their Own Stock
As a % of Buybacks Cash FlowsCompany ($ Billion) From Operations
Exxon Mobil (XOM) 220 45Microsoft (MSFT) 115 50IBM (IBM) 110 64Procter & Gamble (PG) 72 54Cisco Systems (CSCO) 68 69Hewlett-Packard (HPQ) 65 59Wal-Mart Stores (WMT) 60 29Goldman Sachs Group (GS) 58 naPfizer (PFE) 57 38Intel (INTC) 55 39