aal e - ior.va report_2017.pdf · vatican city state and ior to adhere to sepa has started: by...
TRANSCRIPT

AnnuAl
RepoRt
2017

Istituto per le Opere di ReligioneCortile Sisto V00120 Vatican City StateVatican City State
Registered under No 1 in the Register of Legal Personsheld at “Governatorato” of Vatican City State
Authorization n. 1 of 10/07/2015 issued by AIF,to carrying out in professional way financial activities at Vatican City State
digital copy on site www.ior.va

Money must servenot rule
His HolinessPope Francis,Evangelii Gaudium, 2013

ANNUALREPORT 20174 |
IOR
AT THE SERVICE OF THE CATHOLIC

ANNUALREPORT 20175 |
112reached countries
14,945clients
102employees
net profit devolvedto the Holy Father
SINGLE LOCATIONVatican CityState
CHURCH ALL OVER THE WORLD
m Eur


TABLE OF CONTENTS
President of the Commission of Cardinals’ message 9
Prelate’s message 10
Management Report 11ChAPteR 1. StRAteGIC INFORMAtION 13
1. President of the Board of Superintendence’s message 132. Mission, Customers and Services 173. Corporate governance 184. IOR Organization chart 215. Control functions 216. Regulatory Framework and tax Requirements 217. Proposal of distribution of the net profit for the year 22
ChAPteR 2. OPeRAtIONAL INFORMAtION 231. 2017 Business Review 232. Prevalence of Catholic principles and values in the management of proprietary and
customers’ financial assets 283. Charitable and social activities 294. Forecast for 2018 30
Financial Statements 31Balance Sheet 33Income Statement 34Statement of Comprehensive Income 35Statement of Changes in equity 35Cash Flow Statement 36explanatory Notes 38
Part 1. Accounting policies 38Part 2. Information on the Balance Sheet 55Part 3. Information on the Income Statement 76Part 4. Information on comprehensive income 86Part 5. Information on risks and hedging policies 88Part 6. Information concerning equity 111Part 7. Related party transactions 115
Report of the Revisori 117
Report of the external Auditors 123
The present Annual Report has been translated from the original one which is prepared in Italian
ANNUALREPORT 20177 |


President of the Commission of Cardinals’ message
the time has come for the Institute to present - for the sixth consecutiveyear - the annual financial statements for the 2017 fiscal year, which closedwith a net profit of €31.9 million.
this is undoubtedly a remarkable result in light of both the strict ethicalparameters within which the IOR operates, in line with its Statutes, as well asthe complex geo-political and financial scenarios that characterized the globaleconomy in 2017.
Leaving the task of analysing the genesis of said profit and its consistencywith the challenging global economic environment of 2017 to the Institute’s“technical experts”, as President of the IOR’s Supervisory Commission ofCardinals, I consider it, instead, a priority to emphasize the consistency ofthis result with the Institute’s commitment to never subordinate the ethics ofits choices to profit, in compliance with the clear directives received from theholy Father in this regard, even when this may lead to reduced profits.
Once again, in 2017, the Institute renewed its commitment to affirm theimportance of ethics over profit through key “ethical” decisions that haveaffected, inter alia, sensitive areas of activity such as investments, taxtransparency and the legal strategy followed to protect its reputation.
In this regard, I wish to mention the Institute’s choice to continue to selectfor itself and for its customers only investments in line with Catholicprinciples and its decision to fully implement the tax agreements signed inrecent years with the United States of America and the Italian Republic inorder to make the accounts of the Institute and those of its customers fiscallytransparent, despite being aware of a possible reduction in the number ofcustomers as a result of such rigorous choices.
Likewise, I would like to remind you of the Institute’s choice to refer to thedecisions of the competent courts in ascertaining the responsibilities ofindividuals who, in the past, while holding different positions (directors,managers, investors and/or consultants of the time), betrayed its trust andcaused serious harm, in spite of the substantial settlement agreementsproposed by some of the parties involved to repair the damage caused to theInstitute by their conduct. Being aware of the importance of affirming, evenin this case, the centrality of ethics beyond the strictly financial dimension,the Institute refused to negotiate with the people who had brought discreditupon it, instead subordinating any compensation for reputational andeconomic damages to the establishment of responsibilities by the competentauthorities and to their decisions.
Among the relevant facts of the year, the overall positive opinionexpressed in Moneyval’s December 2017 report on the appropriateness of thelegislative instruments and good practices already adopted by the IOR toeffectively combat money laundering and terrorism is worthy of mention.Recognition by this prestigious european body of the progress the Institutehas made in such a sensitive sector has been a valuable incentive for the latterto continue with renewed determination in the improvement of the existinglegislative instruments and practices that is already underway.
Lastly, the process of reform of the Statutes is reaching its conclusion andit is to be expected that the reformed Statutes and the Institute’s newregulation will be adopted in the near future, in compliance with the holyFather’s request to provide the Institute with transparent, effective andmodern instruments of governance.
ANNUALREPORT 20179 |
Cardinal Santos Abril yCastellóPresident of the Commission of Cardinals

Prelate’s message
this year, as in the past, I would like to take advantage of the publicationof the Financial Statements to convey a few words, simply, without claimingto have any technical competence, to all those who work conscientiously andwith professionalism, and have enabled the Institute for the Works of Religionto continue along the road towards a change of mindset in working andrecovering a more precise understanding of the aims of the Institute.
Change of mindset: one should not work at the Institute and think it’s likeworking at any one place. In the past, this led us to take approaches that werea bit too breezy and not always careful about ethics, in the absence of which,an excessive independence had been reached, which threatened to make uslose sight of the meaning of the real need of the Institute, and therefore itsusefulness for the holy See. the wise guidance of the President and theDirector and everyone’s willingness to question themselves has alreadyproduced fruits that are there for all to see.
A more precise understanding of the goals: the results of the financialstatements show that the logic of making money for the sake of it has gone by,and money is to be used to meet the needs for which the Institute wasfounded, i.e. help the activities of the Catholic Church. It is often believedthat if one has so much, one can do a lot. It’s better to own little and do well,do necessary things, and redesign priorities. the Scripture warns: “Better is alittle to the just, than the great riches of the wicked.” Psalm 36:16, and again:“he who loves money will not be satisfied with money, nor he who lovesabundance with its income. this too is vanity.” ecclesiastes 5:9. In addition tothe Bible, even the way we all think makes us believe that if we had twice themoney and twice the possibilities, we would complain that they are notenough, while reality shows us every day that with half of what we have, wedo the same things.
I am sure that we will continue along this pathway and wish everyone tocontinue giving the best that everyone can give with enthusiasm.
ANNUALREPORT 201710 |
Msgr. Battista Mario SalvatoreRiccaPrelate

MAnAgeMent
RepoRt


ChAPteR 1Strategic information
1. PRESIDENT OF THE BOARD OF SUPERINTENDENCE’SMESSAGE
Since its appointment in July 2014, the Board of Superintendence hasworked on the necessary transformation of the IOR to serve with prudencethe holy Father in fulfilling his mission as Universal Pastor. the appointmentof three new Members in 2016, enriched the expertise, experience, anddiversity of the Board.
In 2017, in a complex financial environment, much was accomplished andthe Board continued to dedicate itself to the nature and the quality of theservices offered to clients and to the Church. It has also furthered its efforts toconsolidate its governance, reinforce internal controls, and guaranteeunceasing respect for the laws and applicable regulations.
OverviewI believe there are four principal sectors that best evidence this progress:
First, controls were reinforced in the risk management and compliancefunction, in the legal function and in the internal audit function and variousinitiatives were taken on to improve procedures and surveillance. Newpolicies were adopted in accordance with AIF regulations relating to differentaspects of the everyday operations of the Institute. the hiring of new senior-level executives represented an important step; they have greatly contributedto making the IOR a stronger financial institution as illustrated in the recentMoneyval Report. In addition, with the objective of consolidating all theactivities done in past years, at the initiative of the Audit and Risk Committee,the AML (Anti-money laundering) and KYC (Know your customer)procedures were reviewed by an external consultant to ensure that the IORmeets the highest international standards. Likewise, a review of the treasuryoperations was conducted to ensure that best practices are established andadhered to in a critical area of the Institute. When it comes to past abuses thataffected IOR, a new momentum has been set with legal actions initiated inMalta related to financial products in which IOR invested in between 2011-2013, and in the Vatican, against some of former IOR managers and Boardmembers. these developments must not be underestimated: based on fouryears of thorough investigative work, these are further examples of theprogress completed in the reform of the Institute.
Second, the Directorate has focused its efforts to improve the quality ofthe products and services offered by IOR. this is the case for AssetManagement solutions, where a rationalization effort has taken place to focuson major investment strategies to best serve IOR clients, improve efficiencyand reduce relevant operational risks. In addition, further developments weremade with regard to Catholic ethical investment principles. In 2018, theBoard approved a Faith Based approach to apply to all its financialinvestment. Moreover, in 2018, one should start to see the fruits of the workstarted by the Business transformation Strategy committee of the Board toidentify further structural steps that need to be taken as to generate furthergrowth in the Asset Management sector. In addition, the process for the
ANNUALREPORT 201713 |
Jean-Baptiste Douvillede Franssu President of the Board ofSuperintendence

Vatican City State and IOR to adhere to SePA has started: by joining SePA,the IOR will have access to the european payment system. this will bringmore efficient and reliable procedures and be a source of savings for IORclients. It is also appropriate to mention all the efforts that took place on thetax side over the last three years, which reached a point of finalimplementation in 2017. this work comes as a result of the agreementssigned by the holy See with Italy and the United States of America. Itguarantees the level of transparency and stability required to build long termrelationships with IOR clients and its counterparts.
Third, many aspects of the human Resources policies were reviewed andadjusted where necessary. Among the objectives of such an exercise, onecould mention the need of IOR to attract external talent as well as tocontribute to the development of a new “culture” inside the Institute. thislatest aspect has also been supported by the initial efforts with regard totraining, very much encouraged by the hR and Remuneration committee ofthe Board, with the purpose of offering more opportunities to IOR staff togrow and gain further experience. Again, this is a very important step as thewellbeing and motivation of the personnel are very significant aspectsconsidered and valued by the Board.
Finally, 2017 has continued to benefit from a favorable interest rateenvironment and this contributed to the delivery of a good set of results forthe Institute. It is also worth mentioning, the efforts undertaken tosuccessfully open relationships with new correspondent banks. As aconsequence notably of the impact of recent Sovereign tax agreements andwithdrawals to fulfil IOR’s customers’ charitable and missionary works,clients’ assets have decreased. however, many of the previously describedinitiatives that will enhance the quality and reliability of IOR services willcontribute to attracting new deposits.
the IOR and its personnel have made great strides over the last 12months. however, in order that the Institute complete this ambitious taskwith success, the management staff must continue to be reinforced and all theefforts of the Director General of the last twelve months must be able tocontinue.
In all these initiatives, the Board supports the Directorate of the Institute.It will continue to provide its guidance and expertise when and whererequired, especially thanks to a Corporate Governance that continues toimprove. Although such periods of change and transformation are never easyand bring challenges, it is fair to say that resulting from the work completedin previous years, important milestones were reached, as demonstratedclearly by the Institute’s reputation significantly improving.
Approval of the 2017 accountsAfter meeting with the Revisori and the independent audit firm, the
financial statements of the Institute and the management report wereapproved. the proposed distribution of profits to be made to the holy See for2017 were discussed and approved. As per the Statute, this information wasprovided to the Commission of Cardinals to enable them to decide on theallocation of profits. the financial statements, prepared in accordance withIAS-IFRS, as adopted by the Circular issued by the AIF, were audited byDeloitte & touche S.p.A.
the net result for 2017 is euro 31.9 million. this result reflects thecontinuous downward trend of interest rates in europe and the conservative
ANNUALREPORT 201714 |
FINANCIALS 2017
5.3Total client assets
103,000Payment transactions
bn Eur
659.1Net equity
68.26%Core equity TIER 1
m Eur

approach that the Institute has adopted since 2014 in managing its assets(mainly fixed income investments). As described in the Management Report,Section 2, Part 1 - 2017 Business Review, this was achieved in a year ofcomplex financial and political developments. this net result is in line with2016 result and above the 2017 budget. the cost control approach adopted bythe Institute had a positive contribution and IOR is now running on anannual cost base of around euro 19 million versus euro 20 million in 2016and euro 24 million in 2015 (note that 2015 operating expenses includedvarious one-off costs).
Corporate GovernanceAs per the Statutes, the Board, composed of seven Members since
December 2016, followed and supervised the work carried out by theDirectorate in the management of the Institute.
the Board met on four occasions and various informal meetings anddiscussions took place. Resolutions were passed on various business matters,for which its consent was mandatory, subject to reviews and consultations inclose coordination with the Directorate, as well as the Commission ofCardinals, when necessary. Once approved, the Minutes of every Boardmeeting were shared with the Revisori, the Directorate and the Prelate whowere always in attendance. the Commission of Cardinals always receivecopies of these acts.
the Commission of Cardinals was kept informed on every initiative andconsulted as necessary on issues relating to potential changes in governance,in the IOR operating model or leadership. For example, the Board presented aproposal to the Commission of Cardinals in order to adjust the IOR Statuteand to draft the first Internal Regulation.
Regular update meetings were held with the Prelate and the non-votingsecretary of the Board to guarantee, among other things, an adequate flow ofinformation.
Finally, in the first quarter of 2018, the Board asked for a review of IORcorporate governance standard to be done in line with best internationalpracticises by a professional firm with a view to assess the Board functioningand seek possible improvements.
Board CommitteesIn 2015, the Board created committees to strengthen and support the
governance of the Institute and the Board’s work, although such committeesare not provided for by the current Statute. First of all, there was the creationof the Audit and Risk Committee and the human Resources andRemuneration Committee. In 2016, the Board created a Past AbusesCommittee intended to help and support the Board in its work ofunderstanding legacy issues and allowing for the truth to come forth. theCommittee has completed its work at the end of January 2017. In 2017 aBusiness transformation Strategy Committee was created to help lead thenecessary changes required in terms of products and services offered to IORclients (the composition of these committees is described below).
the meetings of the Board and the informal committees of the Board ofSuperintendence were held in an environment of an open exchange ofinformation. these meetings benefitted from each member’s specificexpertise in various subject matters to find the appropriate resolutions tomeet the needs of this unique institution. Agenda items for the meetings andmaterials on specific subjects important to members of the committees andthe Board were distributed in advance and minutes were drafted for each
ANNUALREPORT 201715 |

meeting. At each Board meeting, a specific report was presented by therespective presidents of the committees and an annual report at year-end.
a) Members of the Human Resources and Remuneration CommitteeMary Ann Glendon – Chair (until February 2018) Mauricio Larrain – Chair (from February 2018) Jean-Baptiste Douville de Franssu (ex officio)Scott C. Malpass (from April 2017)
b) Members of the Audit and Risk CommitteeSir Michael hintze – ChairJean-Baptiste Douville de Franssu (ex officio)Georg Freiherr von Boeselager (from April 2017)Javier Marin Romano (from April 2017)
c) Members of the Business Transformation Strategy CommitteeScott. C. Malpass – ChairJean-Baptiste Douville de Franssu (ex officio)Javier Marin Romano Mauricio Larrain
Gian Franco Mammì, IOR Director General is always invited toparticipate at the committee meetings.
“Organismo di Vigilanza”In order to comply with the provisions of Article 46 of Law VIII of the
Vatican City State which provides for the creation of an “Organismo diVigilanza”, the Board of Superintendence decided to set up such a bodyhaving undertaken a thorough process to identify appropriate candidatespresented by the Director General. the Body, characterized by independentdecision making powers and control, has the task of supervising theoperation and guaranteeing compliance with the Institute’s organizational,management and control models, ensuring that they are updated and/orappropriately modified.
Acknowledgements I would like to thank all the Board members for their support,
contribution and dedication. Many of them have devoted a considerableamount of their time to help guide IOR through this transition. In early 2018,Mary Ann Glendon resigned from her position and the Board thanked herfor her contribution.
In 2017, the Board has continued to work closely with the Commission ofCardinals. I wish to extend my gratitude to its President and Cardinalmembers for their availability and support.
I also wish to express my appreciation for the work of the Prelate, Msgr.Battista Ricca, of the Director General, Gian Franco Mammì, and to allemployees of the IOR.
My gratitude, of course, also goes toward the work performed by theRevisori and the independent audit firm that was important for the progressachieved by IOR. Whilst the mandate of the members of the Revisori iscoming to an end, the Board wishes to express its particular thanks for theirsupport over the last three years.
ANNUALREPORT 201716 |

2.MISSION, CUSTOMERS AND SERVICES
the Istituto per le Opere di Religione (the “Institute” or “IOR”) is aninstitution of the holy See, founded on 27 June 1942 by Chirograph of hisholiness Pius XII. Its origins date back to the “Commissione ad Pias Causas”established by Pope Leo XIII in 1887.
the Insistute is a public legal entity according to the Canon Law (Can. 114and 116) and carries out financial activities.
the mission of the IOR, established by its Statute, with reference to theChirograph dated 1 March 1990 of his holiness John Paul II, is “to providefor the custody and administration of goods transferred or entrusted to theInstitute by natural or legal persons, designated for religious works or charity.the Institute can accept deposits of assets from entities or persons of the holySee and of the Vatican City State”.
the IOR strives to serve the global mission of the Catholic Churchthrough the administration of the entrusted assets and providing paymentservices to the holy See and related entities, religious orders, other Catholicinstitutions, clergy, employees of the holy See and the accredited diplomaticbodies.
the IOR is exclusively located on the sovereign territory of the VaticanCity State and subject to the regulations and legislation applicable therein.the IOR is supervised and regulated by the “Autorità di InformazioneFinanziaria” (AIF).
Customers of the IORCustomers served by the Institute include:a) Institutional counterparties (Sovereign Institutions of the holy See and
Vatican City State and related entities, nunciatures and apostolicdelegations, embassies and diplomats accredited to the holy See);
b) Non-institutional counterparties (Institutes of Consecrated Life andSocieties of Apostolic Life, Dioceses and other Vatican legal canonicalor civil entities as legal persons; clerics and members of Institutes ofConsecrated Life and Societies of Apostolic Life, employees and retireesof the Vatican as natural persons).
Most of the IOR’s clients are active in missions or perform charitableworks at institutions such as schools, hospitals or refugee camps.
the Catholic Church, through its institutions involved in missionaryactivities and charitable works, is present throughout the world, even incountries with very basic infrastructure and underdeveloped banking andpayment systems.
In such cases, the IOR’s services are particularly valuable. For customerslocated in these areas, the IOR is a bedrock, affirming itself as a trustedinstitution able to provide on-site services otherwise lacking or absent. this iseven more evident in those geographic areas with high political financialinstability.
ANNUALREPORT 201717 |

Nature of the Institute’s services On behalf of its clients, the Institute carries out financial activities
authorized by the AIF, and offers the following services: acceptance ofdeposits, asset management, certain custodial functions, internationalpayment transfers through correspondent banks, and holding salary andpension accounts of employees of the holy See and the Vatican City State.
the Institute protects its clients’ assets by primarily investing in financialinstruments characterized as very low risk (e.g. government bonds, bondsissued by institutions and international organizations, as well as deposits inthe interbank market).
Credit activity is residual and strictly subject to constraints of the internalpolicies as established by the Board of Superintendence.
No funding activities are carried out on the interbank market and IORdoes not issue, underwrite or place debt securities.
Accounts opened at the IOR by authorized customers meet therequirements of the legislation on preventing and combating money-laundering and the financing of terrorism in force in the Vatican City State.
Customers are provided with services in IOR offices located in the VaticanCity State. the IOR has no other locations.
3. CORPORATE GOVERNANCE
the IOR’s governance structure is defined in its current Statutes. Itconsists of five bodies: Commission of Cardinals, Prelate, Board ofSuperintendence, Directorate and the Revisori.
the Commission of Cardinals oversees the Institute’s adherence to itsStatute. It appoints and removes members of the Board of Superintendence.
Furthermore:– It deliberates, after considering the financial statements and taking into
account IOR’s own financing needs, the distribution of profits;– It proposes to the high Authority changes to the Statutes;– It deliberates the compensation due to members of the Board of
Superintendence;– It approves the appointment and removal of the Director General and of
the Vice-Director made by the Board of Superintendence;– Resolution of any issues concerning the members of the Board of
Superintendence and the Directorate.
Members of the Commission of Cardinals are appointed for a five yearterm, and can be reappointed.
the current members are:– Cardinal Santos Abril y Castelló, Archpriest emerito of the Papal Basilica
of St. Mary Major, President of the Commission of Cardinals– Cardinal Josip Bozanic, Archbishop of Zagreb– Cardinal thomas Christopher Collins, Archbishop of toronto– Cardinal Pietro Parolin, Secretary of State – Cardinal Christoph Schönborn, Archbishop of Wien
ANNUALREPORT 201718 |
COMMISSION OF CARDINALSCURRENT MEMBERS ARE:
Card. Santos Abril y CastellóArchpriest emerito of the PapalBasilica of St. Mary Major,President of the Commission ofCardinals
Cardinal Josip BozanicArchbishop of Zagreb
Cardinal Thomas Christopher CollinsArchbishop of Toronto
Cardinal Pietro ParolinSecretary of State

– Cardinal Jean-Louis tauran, President of the Pontifical Council forInterreligious Dialogue.
the Prelate is appointed by the Commission of Cardinals. the Prelate:– Oversees the activities of the Institute and may have access to its acts
and documents;– Participates, as Secretary, in meetings of the Commission of Cardinals,
drafting the minutes of the meeting;– Attends the meetings of the Board of Superintendence;– Submits his comments to the Commission of Cardinals, notifying the
Board of Superintendence.
Msgr. Battista Mario Salvatore Ricca was appointed as the Prelate of theInstitute in June 2013.
the Board of Superintendence is responsible for the administration andmanagement of the Institute, as well as the oversight and supervision of itsfinancial, economic and operational activities. In particular, the Board has thetask of:
– Formulating general policy guidelines and basic strategies for theactivities of the Institute in line with its mission;
– Defining the criteria for the implementation of annual programs andobjectives of the Directorate, and approving its proposals;
– Verifying the economic-financial activities of the Institute;– Monitoring compliance with established programs and objectives, with
regard to investments and other activities;– Defining the most appropriate financial structure for the Institute,
proposing the ways to improve it, and in general, the best means toincrease its assets and activities in the context of correct adherence toeconomic-financial rules and in full compliance with the overall missionof the Institute;
– Proposing to the Commission of Cardinals changes to the Statutes aslong as they are unanimously approved by the Board ofSuperintendence;
– Arranging for the issuance of the Institute’s Regulations, which arerequired to provide a detailed description of the powers andcompetencies of the Board and of the Directorate;
– Delegating signing power in the name of the Institute to the DirectorGeneral and, at their request, the Vice-Director, Managers and Officers,in the manner prescribed in the Regulations;
– Approving the Financial Statements prepared by the Directorate.
the members of the Board of Superintendence are nominated by theCommission of Cardinals and serve for a five year term, and can bereappointed.
In 2017 Board of Superintendence comprised:– Jean-Baptiste Douville de Franssu, President– Mary Ann Glendon (Until February 2018) – Michael hintze– Mauricio Larraín– Scott C. Malpass– Javier Marín Romano– Georg Freiherr von Boeselager
ANNUALREPORT 201719 |
Cardinal Christoph SchönbornArchbishop of Wien
Cardinal Jean-Louis TauranPresident of the PontificalCouncil for InterreligiousDialogue
Msgr. Battista Mario SalvatoreRicca
PRELATE

Until February 2018, the Board was comprised also of Prof. Mary AnnGlendon, who resigned. the Board wishes to express its gratitude to MaryAnn Glendon for all the help and counsel she provided to the IOR during hertenure.
the Directorate is responsible for all operational activities of the Instituteand is accountable to the Board of Superintendence.
the Directorate is appointed by the Board of Superintendence andapproved by the Commission of Cardinals and in 2017 consisted of:
– Gian Franco Mammì, Director General– Giulio Mattietti “Aggiunto al Direttore” with delegated functions (Until
November 2017)
the Revisori must:– Verify at least quarterly, the administrative and accounting review of the
Institute’s books and records;– May conduct internal audits or other inspections, if requested by the
Board of Superintendence;– Review the financial statements including the report of the Directorate
and supporting documents, provide written comments to the Board ofSuperintendence and present their observations to the attention of theDirectorate and the Prelate.
the Revisori are three, appointed by the Board of Superintendence for amaximum period of three years. they can be reappointed.
In 2017 members were: – Mario M. Busso, President of the Revisori– Giovanni Barbara (until March 2018)– Luca Del Pico
ANNUALREPORT 201720 |
IN 2017 BOARD OFSUPERINTENDENCE COMPRISED:
Jean-Baptiste Douville de Franssu, President
Mary Ann Glendon(Until February 2018)
Michael Hintze
Mauricio Larraín
Scott C. Malpass

4. IOR ORGANIZATION CHART
5. CONTROL FUNCTIONS
Since 2015 a focus was made on the development of appropriate controlfunctions, reinforcing their independence and ensuring that activities andcontrols were properly carried out. today, they are comprised of:
– Internal Audit– Risk management and ComplianceIn accordance with law no. XVIII/2013 (see art. 27 et seq.) and best
international practices, the Internal Audit function reports to the Board witha dotted line to the Directorate.
In terms of second-level controls, Risk management and Compliancedepartment is directly responsible, among other things, for the AML/CFt(Anti Money Laundering/Combating the Financing of terrorism) activities.
6. REGULATORY FRAMEWORK AND TAX REQUIREMENTS
Regulatory framework the Institute is subject to the laws and regulations of the holy See and
Vatican City State.the Vatican legal framework recognizes the Canon Law as the primary
source of legislation and the primary criterion for its interpretation.Furthermore, there are six organic laws and other ordinary laws specific tothe Vatican City State. For matters not covered by Vatican laws, laws andother regulations issued by the Italian Republic are observed assupplementary, subject to prior approval by the competent Vatican authority.they are adopted on the condition that they do not conflict with the doctrineof divine law, the general principles of Canon Law or the provisions of theLateran Pact and subsequent Agreements, and provided that they areapplicable to the state of affairs existing in Vatican City State (See law NoLXXI on the source of law, promulgated by Pope Benedict XVI on 1 October2008).
According to article 1.4 of Law no. LXXI on the sources of law, the legalframework must also conform to the general norms of international law, andto those arising from treaties and other agreements to which the holy See ispart of.
ANNUALREPORT 201721 |
THE DIRECTORATE IN 2017CONSISTED OF:
Javier Marín Romano
Georg Freiherr von Boeselager
Gian Franco MammìDirector General
Giulio Mattietti“Aggiunto al Direttore” withdelegated functions(Until November 2017)
COMMISSIONE CARDINALIZIA
PRELATO
RISK MANAGEMENT E COMPLIANCE INTERNAL AUDIT
RISK MANAGEMENT
COMPLIANCE ED ANTIRICICLAGGIO
CONSIGLIO DI SOVRINTENDENZA
DIREZIONE
SEGRETERIA AMMINISTRATIVA
LEGALE, ORGANIZZAZIONE E RISORSE UMANE
DIPENDENZA FUNZIONALE DIPENDENZA GERARCHICA DIPENDENZA AMMINISTRATIVA
SEGRETERIA DI STAFF
DIPARTIMENTOBILANCIO
DIPARTIMENTOIT E SICUREZZA
DIPARTIMENTOOPERATIONS
DIPARTIMENTOFINANZA
DIPARTIMENTOGESTIONI
PATRIMONIALI
DIPARTIMENTORAPPORTI CON LA CLIENTELA

the Institute is subject to Law no. XVIII of 8 October 2013 that coversnorms of transparency, supervision, and financial intelligence and, as anentity that carries out financial activities on a professional basis in VaticanCity State, it is also subject to Regulation No. 1 “Prudential Supervision ofentities carrying out financial activities on a professional basis” issued by AIFand enacted on 13 January 2015.
the Regulation No. 1, establishing a clear system of authorization,stipulates the criteria for the organization and management of entities andmechanisms of internal control.
On 15 December 2016, the AIF promulgated the “Circular relating to thepreparation of the annual financial statements and the consolidated financialstatements of entities carrying out financial activities on a professional basis”.these financial statements have been prepared in accordance with theaforementioned Circular.
Tax requirementsOn 15 October 2016 the “Agreement between the Government of the
Italian Republic and the holy See in tax matters” became effective. In force ofthe Agreement, the clients resident in Italy for tax purposes fulfill their taxdebts, arising from the financial assets held with entities carrying outfinancial activities on a professional basis in Vatican City State, through aFiscal Representative chosen by the Institute. the IOR provides thecalculations and withholds taxes to customers which are paid to the ItalianGovernment via an Italian tax Representative.
effective 2015, the IOR is subject also to the Foreign Account taxCompliance Act (FAtCA), a United States federal law that requires U.S.persons, including individuals who live outside the United States, to reporttheir financial accounts held outside of the United States to the U.S. InternalRevenue Service (IRS).
FAtCA also requires foreign financial institutions to report to the IRS theaccounts of their U.S. clients. In this context, the holy See has reached anIntergovernmental agreement (IGA) with the United States signed in June2015. the IOR has been assigned an identification code (GIIN) by the IRS.the IOR fully complies with the terms of the IGA.
7. PROPOSAL OF DISTRIBUTION OF THE NET PROFIT FOR THEYEAR
For the net profit for the year ended 31 December 2017 amounting toeUR 31.9m, the Board of Superintendence intends to propose to theCommission of Cardinals, that the profits be distributed in full withoutmaking any provision to the Reserves, also considering the adequacy ofcapital (for further details see Part 6 - paragraph 6.2.2 “Capital adequacy”).
ANNUALREPORT 201722 |

ChAPteR 2Operational information
1. 2017 BUSINESS REVIEW
Macroeconomic environment 2017 was characterized by a synchronized recovery of all the major
economies. According to estimates by the International Monetary Fund, atthe end of 2017, global GDP will be around 3.6%. For the United States it wasthe eighth consecutive year of expansion, supported by low interest rates, alabor market that has almost reached full employment and a high degree ofconfidence of companies and households. the positive economic situationtook effect especially in the second half of 2017 and other positive results areexpected from investments in infrastructures and the tax reform requested byPresident Donald trump. Growth in the eurozone also improved slightly,progressively extending more evenly to peripheral areas. In this area too, insupport of this growth, other factors such as the upturn in international trade,with the growth in consumption, have had a weight, in addition to lowinterest rates, with the effect of favoring exports and consolidating theinvestment cycle. Among the emerging countries, Russia and Brazil returnedto growth, India is recovering, and higher than expected results wererecorded in China.
this general path of development has not slowed down even withpotentially destabilizing political events such as tensions between theinternational community and North Korea, the uncertain outcome of theGerman parliamentary elections with the consequent difficult governability,as well as the revived separatist tensions in Catalonia. the Asian politicalsituation was instead rather stable, thanks to the victory in Japan of PrimeMinister Abe in the October elections, with a consequent extension of thegovernment mandate until 2021 and in China, thanks to the re-confirmationof Xi Jinping at the helm of the Communist Party and of the country’sgovernment for a further five years.
2017 marked the beginning of the trend reversal in monetary policy. theset of extraordinary stimuli that allowed the main economies to come out ofthe crisis after 2008, begins to be gradually reduced, always trying not tocompromise growth. the Federal Reserve (FeD) has started moderately thepath of rising interest rates with three increases during the year, the last inDecember that brought rates to 1.5%. Starting in October, the FeD has alsostarted a program to reduce the reinvestment of maturing debt securities withthe aim of gradually reducing its balance sheet. 2017 was also the year of theappointment of Jerome Powell, chosen by trump to take the helm of theAmerican Central Bank in place of Janet Yellen.
In europe, the eCB continued to maintain an expansionary monetarypolicy during the year, given that inflation remained limited and far from themedium-term targets, but nevertheless triggered the start of the program toreduce purchases of securities that will continue gradually also in 2018, inlight of an improvement in the macroeconomic scenario. In the UnitedKingdom, against an acceleration of inflation, the BOe also began a gradualincrease in rates. On the contrary, the Bank of Japan continued to pursue avery accommodative economic policy due to inflation very close to zero.
In 2017, volatility was particularly low on the financial markets, which
ANNUALREPORT 201723 |
Gian Franco MammìDirector General
reacted to economic and political uncertainties in a lower tone than whatwould have been expected by looking at the past experience.
the asset class that performed best in 2017 is undoubtedly equities whichreached historical highs in many financial centers. the price lists continuedto mark records and the positive results of companies have boosted this trend.
In the United States, during 2017, the acceleration of share prices occurredmainly in the second half of the year and was also supported by the approvalof the tax cuts plan by the trump administration with benefits mainly forcompanies that, thanks to lower taxation, can benefit from positive effects ontheir financial statements. the performance of the equity markets was alsogenerally positive in europe. the increase in prices was supported by goodbusiness fundamentals and a high rate of job creation.
however, much lower results are recorded for government bonds. In theUS, the rate of return on 10-year Government Bonds was characterized by aninitial phase of reduction due to disregarded expectations on tax reforms andbelow-expected inflation data. In the second half of the year, with theannouncement from the FeD of a reduction in securities held in the balancesheet as well as continued strong growth, yields rose again, closing the year at2.42%. On the other hand, yields on the short-term bonds continued togradually rise, driven directly by monetary policy actions.
the market of european government bonds recorded returns that weresubstantially stable or slightly up (both on the short and long part of thecurve). During the year, the yield on 10-year German Government Bondsrose from 0.21% to 0.43%, and in the same period the yield of ItalianGovernment Bonds with the same maturity rose from 1.81% to 2.02%. theyear was nevertheless characterized by low volatility, mainly linked to themonetary policy, with the announcement of the reduction in purchases ofsecurities that produced a strong upward trend in yields in the first part ofJuly, then partially subsided.
On the foreign exchange market, 2017 closed with the euro significantlyincreasing in value against the US Dollar. the eUR-USD exchange rate rosefrom 1.05 to 1.20. the euro also increased against the Yen, the Swiss Francand to a lesser extent the Pound. the emerging currencies ended the yearwith a positive sign, thanks mainly to the weakness that characterized the USDollar and the improvement of the economic outlook.
2017 was a volatile year for the price of gold, which had to face eventssuch as the trump settlement, political tensions with North Korea, and thegradual changes in central bank strategies. Coinciding with the recovery ofthe Dollar in the second half of the year, we witnessed the weakening of goldfrom the September highs over $ 1,350 to the lows around $ 1,240 at the endof December.
Prospects have improved significantly for oil. the price trend seems to bedirected strongly to the upside. the global consumption of crude was solidthanks to the contribution of China and the supply is still destined to contractfollowing the agreements reached by the producing countries. thegeopolitical tensions have not strongly influenced the trend.
Composition of the Client baseAt the end of 2017, the IOR clients amounted to 14,945 (2016: 14,960)
and, measured by assets entrusted, comprised religious orders (52%), RomanCuria departments, holy See Offices and nunciatures (11%), episcopalconferences, dioceses and parishes (9%) entities of Canon Law (8%),cardinals, bishops and clergy (8%), vatican employees and pensioners (8%),
ANNUALREPORT 201724 |
FINANCIALS 2017
51.3Intermediation margin
19.1Operating costs
m Eur
m Eur
m Eur31.9Profit for the year

others, included Canon Law foundations (4%).the IOR’s customers have a common characteristic, which is that they are
part of and serve the Catholic Church (see client definition in Chapter 1). to its clients IOR offers the services of acceptance of deposits, asset
management, securities custody. As of 31 December 2017, the net value of assets held in managed
portfolios was eUR 3.0bn (2016: eUR 3.1bn), the net value of assets held innon-managed portfolios was eUR 474.6m (2016: eUR 554.8m) and the valueof customer deposits was eUR 1.8bn (2016: eUR 2.0bn), resulting in eUR5.3bn in total client assets (2016: eUR 5.7bn).
Assets under Custody mainly include client-owned securities held at theIOR for custodial purposes, in accordance with the mission of the Institute.For the purpose of the table above, securities, gold and precious metals undercustody are stated at market values.
Assets under Management consist mainly of client-owned securities heldat the IOR for management purposes, on the basis of portfolio managementmandates, compliant with the mission of the Institute. For the purpose of thetable above, securities under management are stated at market values.
Income Statement In 2017, IOR’s Net profit was eUR 31.9m (2016: eUR 36.0 m). the
overview of the items that contributed to determine this result shows animprovement of the ordinary activity result of the Institute.
In fact, 2017 accounts were characterized by an increase in tradingactivities and a reduction in administrative expenses which are partially offsetby a reduction in interest income due to the low rates offered by the market.the intermediation margin grew by 16.3% compared to 2016, reaching eUR51.3m (2016: eUR 44.1m).
Furthermore, in 2017 there is not the extraordinary item thatcharacterized the 2016 financial statements, the release of 13 million of theprovision related to tax exposure towards other countries.
A brief overview of the main components of the Income Statement ispresented below.
the most significant source of revenues is the profit derived fromtreasury activities on proprietary portfolios. the most important componentwas derived from bond yeld which contributed for eUR 32.0m (interest ofeUR 30.5m and trading income eUR 1.5m).
Interest Margin amounting to eUR 29.0m decreased by 21% (2016: eUR
ANNUALREPORT 201725 |
(in thousand Euro)
2017 2016
In Balance Off Balance In Balance Off BalanceSheet Sheet Total Sheet Sheet Total
Customer deposits (including Legates) 1,839,536 1,839,536 2,028,973 2,028,973
Assets under Custody 474,594 474,594 554,763 554,763
Assets under Management 332,696* 2,624,957 2,957,652 410,563 * 2,700,366 3,110,929
Total 2,172,232 3,099,550 5,271,782 2,439,536 3,255,129 5,694,665
*Deposits of Assets under Management are net of commissions collected in the first days of the subsequent year.

36.7m). this was affected by the decline in the yield on investments insecurities and bank deposits, although the average amounts of capitalinvested remained unchanged at eUR 2.9bn (2016: eUR 2.9bn). the averagerate on customer deposits remained unchanged at 0.14% (2016: 0.14%), whilethe average yield on investments in securities and bank deposits declined to1.09% (2016: 1.35%). Accordingly, the spread between the average ratereceived on assets and the average rate paid on liabilities decreased from1.22% to 0.95%. this was mainly due to the expiration of securities in 2017purchased in previous years with a nominal interest rate higher than thosecurrently available on market.
Net Income for trading activities recognised a net gain of eUR 7.5m(2016: eUR -9.0m affected by the decrease in UCI unit investment to eUR -12.8m). In 2017 UCI unit investment lost eUR -700,000.
the improvement in the results was also due to the positive performanceof the equities held in the proprietary portfolio compared to 2016.
Stable was the contribution to the result from debt securities. theyrecognised a positive total net profit, including gains and losses from tradingand gains and losses from valuation, amounting to eUR 1.5m in 2017 (2016:eUR 1.6m). In the actual market scenario such stability was not assured andit is a positive consequence of the positive reaction of proprietary portfolio tomarket trends during the year.
Finally, Forex activity accounted for income of eUR 3.2m (2016: eUR2.0m).
Dividends decreased by 47.6% to eUR 1.1m (2016: eUR 2.1m).Net Fee and Commission income decreased 3.9% to eUR 12.3m in 2017
(2016: eUR 12.8m). Fee and Commission Income increased by 0.6%, to eUR15.9m in 2017 from eUR 15.8m in 2016. In fact, the reason of the decrease inthe margin is the increase of Commission expense from eUR 3.0m in 2016 toeUR 3.6m in 2017 (+20%).
the most important element of the Fee and Commission Income wascommissions from Asset Management services, which reached eUR 12.5m,the same result as 2016. the slight growth in Commission Income is due tocommissions on trading in financial instruments, increased in 2017 to eUR711,000 (2016: eUR 654,000) due to the increase in customer transactions.
the increase in Fee and Commission expense was mainly due to the feespaid for bank deposits which increased to eUR 1.4m in 2017 (2016: eUR571,000), recording +145% as increase.
Administrative Expenses were eUR 18.7m in 2017 (2016: eUR 19.1m).this includes Staff expenses of eUR 11.4m in 2017, increased from the prioryear amount (2016: eUR 10.2m, or +11.8%).
Administrative expenses also include expenses for professional services,which decreased in 2017 reaching eUR 2.7m (2016: eUR 4.0m). this was dueto lower extraordinary costs incurred during the year from the completion ofcertain projects.
Other administrative expenses decreased by 6.1% to eUR 4.6m in 2017(2016: eUR 4.9m) due to the review of outstanding contracts.
Other Operating Income (Expense) recognised income of eUR 164,000(2016: income of eUR 7,000).
Balance Sheet As of 31 December 2017, total assets on the IOR’s balance sheet were eUR
3.0bn (2016: eUR 3.3bn), with equity of eUR 659.1m (2016: eUR 672.6m). On the Liabilities side, Due to customers is the most significant line item,
ANNUALREPORT 201726 |

representing 71.1% of total liabilities. the balance decreased from the prioryear, amounting to eUR 2.1bn (-12.5%). Customer deposits decreased byeUR 189.4m and asset management liquidity decreased by eUR 78.1m. thiswas due to Forex effect on US Dollars deposits and to tax payments onfinancial instruments made through the Institute.
As previously reported in Chapter 1, credit activity is residual and strictlysubject to constraints of the internal policies as established by the Board ofSuperintendence.
the Asset side of the Balance Sheet mainly reflects bank deposits andsecurities, and less than 3% of total assets is held in UCI units and equities.
Bank Deposits totaled eUR 473.4m at the end of 2017 (2016: eUR643.2m). these mainly consisted of eUR 362.1m in deposits on demand(2016: eUR 457.6m), and eUR 54.2m in term deposits in the interbanklending market (2016: eUR 108.5m). the remaining part, eUR 57.1m (2016:eUR 77.1), concerned term deposits with APSA.
the value of IOR Securities (debt securities, equity securities andinvestment funds) was eUR 2.4bn in 2017 (2016: eUR 2.5bn).
Bonds, at eUR 2.3bn, were the most significant investments, representing97.2% of the securities held as of 31 December 2017, while equities accountedfor 1.4%, and investment funds for 1.4%. As previously explained, the volumeof the securities in the portfolio slightly decreased compared to 2016, whilethe portfolio composition remained unchanged. the decrease was mainlyrecorded in the “financial assets held to maturity” portfolio due to theexpiration of some securities and in the absence of purchases made in 2017 inthe same portfolio.
Profitability ratios the table below highlights the main economical, financial and
productivity ratios:
While ROA was in line with the previous year, ROe recorded a slightdecrease compared with the previous year due to the decrease in Net profit.
the profitability, explained from the ratio “interest margin / total assets”,amounted in 2017 to 1.0% against 1.1% recorded in 2016, due to thereduction of interest margin; instead, the other profitability index, calculatedas the ratio between the intermediation margin and total assets, recorded arelevant increase thanks to lower write-downs of UCI units in portfolio andthe higher contribution of the equity shares (1.7% in 2017 compared to 1.3%in 2016).
these two ratios showed that the Institute ability to create income
ANNUALREPORT 201727 |
Profitability ratios (%) 2017 2016
ROE (Return on Equity) 5.1% 5.7%
ROA (Return on Assets) 1.1% 1.1%
Operating costs / Intermediation margin 37.3% 15.5%
Interest margin / Intermediation margin 56.4% 83.1%
Net fee and commission income / Intermediation margin 24.0% 29.0%
Interest margin / Total Assets 1.0% 1.1%
Intermediation margin / Total Assets 1.7% 1.3%
Core Equity TIER 1 68.3% 64.5%

increased. the increase in the operating costs / intermediation margin ratio isnot a real increase because the index in 2016 was affected by the reestimationof tax provision for exposure in foreing countries (eUR 13m).
Other aspects the IOR does not issue securities or underwrite or place securities; it
protects its client assets by primarily investing in financial instrumentscharacterized as very low risk (e.g. government bonds, bonds issued byinstitutions and international organizations, as well as deposits in theinterbank market).
the IOR has no branches and provides services only at the IOR officelocated in the Vatican City State.
the Institute is the single shareholder of the real estate company Societàper Gestione di Immobili Roma (S.G.I.R. S.r.l.), which is governed by Italianlaw and takes the legal form of a limited liability company, with its registeredoffice in Rome, which it was specifically set up to more easily andtransparently manage the owned real estate located in Italy.
2. PREVALENCE OF CATHOLIC PRINCIPLES AND VALUES IN THE MANAGEMENT OF PROPRIETARY AND CUSTOMERS’ FINANCIAL ASSETS
Undertaking the commitment to remain faithful and give concreteness tothe words pronounced by the holy Father Francis during his speech to themembers of the Board of Superintendence in November 2015: “the maingoal of the IOR cannot be to have the maximum possible gain, but should begoals that are compatible with the norms of morality, consistent efficiencyand practices respecting the specificity of its nature and exemplarity in itsmode of operation”, in 2017, the IOR continued to responsibly manage itsfinancial resources, and those entrusted to it, in accordance with the Catholicprinciples and values that inspire it.
Catholic principles and values are non-negotiable and cannot be based onthe logic of expected return.
therefore, also in 2017, while seeking to pursue a return on itsinvestments that is, to the extent possible, in line with that of the referencedmarket, the Institute continued to favour the consistency of these investmentswith the Catholic principles and values by which it is guided in its work.
Ethical investmentsthe glorification of human life, creation and human dignity are some of
the inalienable values that guided the Institute in the selection of theinvestments made in 2017.
Indeed, the Institute expressed its commitment to contribute to the “careof the common home”, invoked by Pope Francis in the encyclical LetterLaudato si’, and selected its investments also on the basis of two fundamentalthemes recalled by the holy Father:
a) corporate social responsibility; and b) the role of companies in creating a sustainable future.
In 2017, the Institute continued to rule out investments in companies thatviolate or do not fully respect the globally recognized principles of humanrights, labour standards, the fight against corruption and the fight against
ANNUALREPORT 201728 |

environmental crime. the Institute also expressed its willingness to give upinvestments already under way if compliance with these principles by theselected companies ceased to exist due to force majeure, subsequentlyoccurred in the geo-political context of reference.
the Institute continued also to invest in projects to promoting thedevelopment of poorer countries with choices consistent with the realizationof a sustainable future for future generations.
3. CHARITABLE AND SOCIAL ACTIVITIES
In addition to the transfer of the annual profit of the 2016 financialstatements, which has been placed in full availability of the holy Father, in2017, the Institute for Works of Religion has contributed to the realization ofnumerous charitable and social activities through:
a. donations intended to respond to requests for aid or contributionsreceived by the Institute. In the year under review, the most commonones were the direct disbursement of contributions to student priests forthe completion of university studies, financial aid for destitute personsor families (reported by Parishes or by individual priests), long-distanceadoptions, specific help for missionary and charity work, aid to familiesthat have lost everything as a result of natural disasters, etc., and
b. the granting of properties owned by the Institute - located within theItalian territory - for rent with subsidized rent or on loan for free use tosupport institutions with a social purpose.
the decisions concerning the recipients and the amount of donationsreferred to in point a) above are always collegial and have been adopted bythe Charity Committee - chaired by the Prelate and composed of managersand employees of the Institute - or directly by the Commission of Cardinals.
On the other hand, with regard to the granting of properties referred to inpoint b), the Institute relies on S.G.I.R. S.r.l., a limited liability company underItalian law, of which the Institute is sole shareholder, specifically established,as already disclosed, to manage its own properties in a transparent and moreeffective manner, which have been received in the course of its history in theform of donations or legacies by institutions and individuals, located in theItalian territory.
Alongside the typical activities of a real estate company, the forms ofmanagement used by S.G.I.R. S.r.l. also include the granting of properties:
1. For rent with subsidized leases, to help associations or other Catholicinstitutions that, due to their fragile budgets, could not afford to rent tomarket;
2. On loan for free use, in favour of structures that offer hospitality andsupport to people in conditions of particular fragility or risk, such asyoung single mothers or victims of violence, refugees, the sick and theneedy.
ANNUALREPORT 201729 |

4. FORECAST FOR 2018
In the first months of 2018, the Institute’s activity was in line with theStrategic Plan approved by the Board of Superintendence in January 2017.the main objective is to improve the quality of services offered to clients andthe inflows of customer deposits. By the end of 2018, the results of this workshould be fully apparent.
the IOR will continue to operate in accordance with its Mission that is toserve the holy Father with prudence, in his mission as the Universal Pastor,through the provision of dedicated financial advisory, in completecompliance with Vatican and international laws in force.
ANNUALREPORT 201730 |

Financial
Statement


BALANCE SHEET
ANNUALREPORT 201733 |
(in Euro)ASSETS 2017 2016
10 Cash and cash equivalents 71,233,924 50,850,340
20 Financial assets held for trading 2,116,770,781 1,918,104,346
40 Financial assets available for sale 4,571,559 6,664,406
50 Financial assets held to maturity 246,167,943 558,955,610
60 Due from banks 473,386,281 643,229,012
70 Due from customers 25,422,935 29,152,785
100 Investment in subsidiaries 15,834,950 15,834,950
110 Tangible assets 3,246,863 3,095,565
120 Intangible assets 870,593 1,043,850
150 Other assets 41,502,287 41,958,806
Total Assets 2,999,008,116 3,268,889,670
(in Euro)LIABILITIES AND EQUITY 2017 2016
10 Due to banks 4,096,356 -
20 Due to customers 2,131,421,457 2,398,924,457
100 Legates 47,035,020 47,074,644
110 Other liabilities 15,611,737 18,709,825
120 Staff severance fund 7,177,320 6,992,585
130 Provision for risks and charges 134,547,342 124,588,179
(a) Provisions for pensions and similar obligations 133,335,156 121,088,179
(b) Other provisions 1,212,186 3,500,000
140 Valuation reserves (54,948,816) (45,534,851)
160 Reserves 382,134,172 382,134,172
(a) Unavailable reserves 100,000,000 100,000,000
(b) Available reserves 282,134,172 282,134,172
170 Capital 300,000,000 300,000,000
180 Net profit for the year 31,933,528 36,000,659
Total Liabilities and Equity 2,999,008,116 3,268,889,670

INCOME STATEMENT
ANNUALREPORT 201734 |
(in Euro)INCOME STATEMENT 2017 2016
10 Interest and similar income 32,162,670 39,831,730
20 Interest and similar expense (3,200,984) (3,168,836)
30 Interest margin 28,961,686 36,662,894
40 Fee and commission income 15,927,102 15,836,850
50 Fee and commission expense (3,622,674) (3,029,222)
60 Net fee and commission income 12,304,428 12,807,628
70 Dividends and similar income 1,145,494 2,107,013
80 Net income for trading activities 7,526,946 (8,982,924)
100 Profit (loss) on disposal or repurchase of: 1,386,221 1,499,109
(b) Financial assets available for sale 1,386,221 1,499,109
120 Intermediation margin 51,324,775 44,093,720
130 Net losses/reversal on impairment: (392,122) (1,331,864)
(a) Receivables (392,122) (1,045,306)
(b) Financial assets available for sale (148,314)
(d) Other financial operations (138,244)
140 Net income from financial operations 50,932,653 42,761,856
150 Administrative expenses: (18,727,173) (19,085,562)
(a) Staff expenses (11,441,178) (10,244,959)
(b) Professional services expenses (2,655,023) (3,961,573)
(c) Other administrative expenses (4,630,972) (4,879,030)
160 Net provisions to risks and charges 13,000,000
170 Net value adjustments to/recoveries on tangible assets (68,818) (82,789)
180 Net value adjustments to/recoveries on intangible assets (488,981) (682,777)
190 Other operating income (expense) 163,724 7,287
200 Operating costs (19,121,248) (6,843,841)
220 Net result of fair value valuation of tangible and intangible assets 122,123 82,644
250 Profit (loss) from current operations before taxes 31,933,528 36,000,659
270 Profit (loss) from current operations after taxes 31,933,528 36,000,659
290 Profit (loss) for the year 31,933,528 36,000,659

STATEMENT OF COMPREHENSIVE INCOME
STATEMENT OF CHANGES IN EQUITY
ANNUALREPORT 201735 |
(in Euro)2017 2016
10. Profit (loss) for the year 31,933,528 36,000,659
Items that will not be reclassified to Income Statement
40. Defined benefit plans (11,076,131) (13,275,014)
Items that are or may be reclassified to Income Statement
100. Financial assets available for sale 1,662,166 (4,278,583)
130. Total other income items (9,413,965) (17,553,597)
Comprehensive income (item 10 + item 130) 22,519,563 18,447,062
(in Euro)2017 Allocation of previous Changes during the year
year profitTotal net equity Changes Total net equity Reserves Dividends Changes in Extra Comprehensive Net Equity at 31,12,2016 in opening at 01,01,2017 and other reserves dividend income at
balances allocations distribution 2017 31,12,2017
Capital 300,000,000 300,000,000 300,000,000Reserves(a) unavailable 100,000,000 100,000,000 100,000,000(b) available 282,134,172 282,134,172 282,134,172(c) otherValuationreserves (45,534,851) (45,534,851) (9,413,965) (54,948,816)Net profit (loss)for the year 36,000,659 36,000,659 (36,000,659) 31,933,528 31,933,528Net Equity 672,599,980 672,599,980 (36,000,659) 22,519,563 659,118,884
2016 Allocation of previous Changes during the yearyear profit
Total net equity Changes Total net equity Reserves Dividends Changes in Extra Comprehensive Net Equity at 31,12,2015 in opening at 01,01,2016 and other reserves dividend income at
balances allocations distribution 2016 31,12,2016
Capital 300,000,000 300,000,000 300,000,000Reserves(a) unavailable 100,000,000 100,000,000 100,000,000(b) available 282,134,172 282,134,172 282,134,172(c) otherValuationreserves (27,981,254) (27,981,254) (17,553,597) (45,534,851)Net profit (loss)for the year 16,126,935 16,126,935 (16,126,935) 36,000,659 36,000,659Net Equity 670,279,853 670,279,853 (16,126,935) 18,447,062 672,599,980

CASH FLOW STATEMENT
ANNUALREPORT 201736 |
(in Euro)DIRECT METHOD 2017 2016
A. Operating activities
1. Management 39,121,105 42,833,712
Interest income 38,153,573 48,639,880
Interest expense (3,153,835) (3,168,341)
Dividends and similar income 1,145,494 2,107,013
Net commissions 12,304,428 12,807,628
Realised profit (loss) from trading activities 7,879,311 2,024,715
Staff expenses (10,085,597) (10,566,173)
Other administrative expenses (7,285,995) (8,840,603)
Other income (expense) (163,726) (170,407)
2. Cash generated by/(used in) financial assets (21,108,946) (206,618,819)
Financial assets held for trading (199,939,285) (266,429,528)
Financial assets available for sale 5,141,233 5,575,219
Due from banks: on demand 95,500,207 (192,197,353)
Due from banks: other receivables 74,301,718 192,249,112
Due from customers 3,430,661 54,408,236
Other assets 456,519 (224,505)
3. Cash generated by/(used in) financial liabilities (268,879,319) 62,216,802
Due to banks: on demand 4,096,356 (10,591,428)
Due to banks: other payables
Due from customers (267,550,149) 75,515,176
Outstanding securities
Legates (39,624) (1,191,659)
Financial liabilities held for trading
Financial liabilities carried at fair value
Other liabilities (5,385,902) (1,515,287)
Cash generated by/(used in) operating activities (250,867,160) (101,568,305)
B. Investing activities
1. Cash generated by: 308,161,037 53,250,000
Disposals of investments in subsidiaries
Dividends received on investments in subsidiaries
Disposal/reimbursement of financial assets held to maturity 308,161,037 53,250,000
Disposals of tangible assets
Disposals of intangible assets
2. Cash used in: (413,717) (965,804)
Purchases of investments in subsidiaries
Purchases of financial assets held to maturity
Purchases of tangible assets (97,993) (113,986)
Purchases of intangible assets (315,724) (851,818)
Cash generated by/(used in) investing activities 307,747,320 52,284,196
C. Financing activities
Issues/purchases of capital instrument
Dividend distribution and other purposes (36,000,659) (16,126,935)
Cash generated by/(used in) financing activities (36,000,659) (16,126,935)
Cash generated/(used) during the year 20,879,501 (65,411,044)

ANNUALREPORT 201737 |
Items 2017 2016
Cash and cash equivalents at beginning of the period 50,850,340 114,737,182
Cash generated/(used) during the year 20,879,501 (65,411,044)
Cash and cash equivalents: forex effect (495,916) 1,524,202
Cash and cash equivalents at end of the period 71,233,925 50,850,340

Explanatory Notes
PART 1. Accounting policies
1.1 General information
1.1.1 Statement of compliance with accounting standards
The 2017 financial statement have been prepared inaccordance with the Circular concerning the annual finan-cial statements and the consolidated financial statements ofentities carrying out financial activities on a professionalbasis, issued by Authority of Financial Information on 15December 2016.
As stated in the Circular, the financial statements mustbe prepared in accordance with the “International Account-ing Standards – IAS”, the “International Financial ReportingStandards – IFRS” and related Interpretations (“Interpreta-tions SIC / IFRIC”), as adopted by the Vatican in a specialarrangement to the Monetary Convention between theEuropean Union and the State of the Vatican City on 17December 2009.
1.1.2 Accounting policies
The financial statements consist of the Balance Sheet,the Income Statement, the Statement of ComprehensiveIncome, the Cash Flow Statement, the Statement of Changesin Equity and the Explanatory Notes.
Disclosures under IFRS 7 “Financial Instruments, dis-closures” about the nature and extent of risks have beenincluded in Part V “Information on Risks and Hedging Poli-cies”.
The accounting principles and valuation methodsapplied in the preparation of these financial statements,detailed below, are consistent with those of the previousfinancial year, except for new standards, new interpreta-tions, or amendments of standards.
The financial statements of the Institute are prepared inEuro, while the explanatory notes are expressed in thousandEuro.
For the various items, the 2017 figures and correspon-ding values for the previous year are provided.
Where necessary, the comparative figures have beenadjusted to conform to changes in presentations in the cur-rent year.
The financial statements are prepared in Italian.The financial statements of the IOR were prepared on a
going concern basis in accordance with IAS 1 “Presentationof Financial Statements”. As of the date of the approval of the
financial statements, there were no material uncertaintiesand therefore no significant doubt regarding the Institute’sability to continue as a going concern in the foreseeablefuture.
The financial statements fairly present the financial posi-tion, financial performance and cash flows of the Institute.
The preparation of the financial statements requires theDirectorate to make certain estimates and assumptionsabout the future where actual results may differ. Estimatesand assumptions affect the reported amounts of certainassets, liabilities, revenues and expenses in the financialstatements. In addition, changes in assumptions may have asignificant impact on the financial statements in the year inwhich the assumptions change.
The preparation of the financial statements also requiresthe Directorate to exercise judgements in applying the IOR’saccounting policies to estimate the carrying value of assetsand liabilities not readily obtainable from other sources.
The Directorate believes that the underlying assump-tions are appropriate and that the IOR’s financial statementsfairly present its financial positions and results. All estimatesare based on historical experience and/or expectations withregard to future events that seem reasonable on the basis ofinformation known at the time of the estimate. They are alsoreassessed on a regular basis and the effects of any variationare immediately reflected in the financial statements.
Those areas involving a higher degree of judgement orcomplexity, or areas where assumptions and estimates aresignificant to the financial statements, are disclosed in Sec-tion 1.1.4 “Critical accounting estimates and judgements”.
The financial statements do not reflect a provision fortaxes because there is no corporate income tax in the Vati-can City State.
For the year ended 31 December 2017, the Institute,given the immaterial value of its subsidiary, did not prepareconsolidated financial statements in accordance with theprovisions of the Conceptual Framework (QC6 – QC11) ofIAS/IFRS, since the additional information coming from theconsolidated financial statements would be of little rele-vance for the users of the financial statements.
The Institute provides the additional informationrequired by IFRS 12 “Disclosure of interests in other enti-ties” in Part 5, Section 5.2.6 “Disclosure of unconsolidatedstructured entities for accounting purposes”.
The financial statements of the Institute are prepared bythe Directorate and approved by the Board of Superinten-dence, which will be submitted to the Commission of Car-dinals.
The Commission of Cardinals acknowledges the finan-cial statements and decides on the distribution of profits,after taking into account the IOR’s own financing needs.
ANNUALREPORT 201738 |

1.1.3 Subsequent events
According the provisions of IAS 10, all events that tookplace subsequent to 31 December 2017 have been evaluatedin the preparation of the 2017 Financial Statements.
1.1.4 Critical accounting estimates and judgements
Critical judgements in applying the Institute accountingpolicies
In the process of applying the accounting policiesadopted by IOR, which are described in Section II, theremay be circumstances that lead the Directorate to makejudgements that have a significant impact on the amountsrecognized in the financial statements.
Such circumstances and related judgements may be partof the valuation process used for financial instruments. TheDirectorate makes critical judgements when deciding theasset category for classification, determining whether a mar-ket is active or not, whether the asset is liquid or illiquid,market inputs and parameters to be used, when they mustbe reviewed, and assessing circumstances where internalparameters are more reliable than market-based ones.
Retirement benefits and other post-employment liabili-ties are estimated trough an actuarial valuation performedby an independent expert. Such an evaluation is based oncritical judgements because estimates are made about thelikelihood of future events and the actual results could differfrom those estimates.
Estimates that contain elements of uncertainty The process of applying the IOR’s accounting policies
may require the use of key assumptions affecting the future,and/or other sources of estimation uncertainty as of the bal-ance sheet date, with a significant risk of causing materialadjustments to the carrying amount of assets and liabilitiesin the next financial year.
Key assumptions and judgments made in the 2017Financial Statements relate to the assessment of illiquid debtsecurities held for trading and external investment fundsincluded within the portfolio held for trading, as disclosedin the section 1.4 “Fair value information”.
Illiquid securities are not quoted in active markets andtheir fair value is not readily available in the market. Thesesecurities subject to estimation uncertainties (Level 3 of fairvalue hierarchy) amounted to EUR 22.3m as of 31 Decem-ber 2017 (2016: EUR 23.3m). These were exclusively com-prised of externally managed investment funds.
With reference to the contingent liabilities related tocommitments linked to externally managed investmentfunds, they are valued taking into account all available infor-mation at the date of preparation of these financial state-ments. The dispute in progress is currently at an early stage
so there are no significant information to be highlighted inthe financial statements.
This assessment is made on the basis of assumptions andthe process of estimation is characterized by elements ofuncertainty. By their nature, the estimates and assumptionsused may vary from one period to another and, therefore, itcan not be excluded that in subsequent periods the amountsof such liabilities may differ materially from those currentlyestimated as a result of new information and charges in theevaluations made.
In past years, the IOR has worked to review and confirmits tax position and that of its clients in countries whereinvestment relationships exist. This review has identifiedprobable contingencies related to prior years as a result ofdifferent interpretations regarding the legal nature of theInstitute and the related applicable tax treatments.
During 2017, the IOR has almost reached the final esti-mate of the outstanding liability and has made the expectedtax payments. Pending the formal and definitive conclusionof this issue, IOR has maintained on its books a residualprovision of EUR 1.2m, included in the Balance Sheet, itemliability of 130 “Provision for risks and charges” line b“Other provisions”. As this represents an estimate based oncritical assumptions, upon the conclusion of future events,actual results may differ from what is expected.
1.1.5 Impact of New Accounting Pronouncements
Accounting standards, amendments and interpretationsIFRS effective 1 January 2017
The following accounting standards, amendments andinterpretations IFRS were adopted for the first time by theIOR effective 1 January 2017:
• Amendments to IAS 7 “Disclosure Initiative” (pub-lished on 29 January 2016). The document aims to pro-vide some clarification to improve disclosures aboutfinancial liabilities. In particular, the amendmentsrequired to provide disclosures that enable users offinancial statements to evaluate changes in liabilitiesarising from financing activities. The adoption of theamendments had no impact on the disclosures or theamounts recognized in the Institute’s financial state-ments.
• Amendments to IAS 12 “Recognition of DeferredTax Assets for Unrealised Losses” (published on 19January 2016). The amendment aims to provide someclarifications on the recognition of deferred tax assetson unrealized losses in the valuation of financial assetsof the “afs” category upon the occurrence of certain cir-cumstances and on the estimate of taxable income forfuture years. The adoption of the amendments had noimpact on the disclosures or the amounts recognizedin the Institute’s financial statements.
ANNUALREPORT 201739 |

Accounting standards, amendments and interpretationsIFRS and IFRIC approved by the European Union, notyet mandatorily applicable and not early adopted by theInstitute at 31 December 2017
• Standard IFRS 15 – Revenue from Contracts withCustomers (published on 28 May 2014 and amendedon 12th April 2016) will replace the following standardsand interpretations: IAS 18 – Revenue IAS 11 – Con-struction Contracts, IFRIC 13 – Customer Loyalty Pro-grammes, IFRIC 15 – Agreements for the Constructionof Real Estate, IFRIC 18 – Transfers of Assets from Cus-tomersSIC 31 – Revenues-Barter Transactions InvolvingAdvertising Services. The standard establishes a newrevenue recognition model, which will apply to all con-tracts with customers except those that fall within thescope of other IAS / IFRS standards such as leasing, theinsurance contracts and financial instruments. Thiscore principle is delivered in a five-step model frame-work: • Identify the contract(s) with a customer;• Identify the performance obligations in the contract;• Determine the transaction price;• Allocate the transaction price to the performance
obligations in the contract;• Recognize revenue when (or as) the entity satisfies a
performance obligation.The standard is effective for annual reporting peri-
ods beginning on or after 1 January 2018. Earlier appli-cation is permitted. However, the amendments to IFRS15, Clarifications to IFRS 15 - Revenue from Contractswith Customers, published by the IASB on 12 April2016, have not yet been endorsed by the EuropeanUnion. The adoption of the statement has no importantimpact on the disclosure or on the amounts recognizedin the Institute’s financial statements.
• Final version of IFRS 9 - Financial Instruments (pub-lished on 24 July 2014). The document recognized theresults of the IASB project to replace IAS 39: • Introducing new criteria for the classification and
measurement of financial assets and liabilities;• With reference to the impairment model, the new
standard requires that the estimate of credit losses iscarried out on the basis of the expected losses model(and not on the incurred losses model used by IAS39) using reasonable and supportable informationabout past events, current conditions and reasonableand supportable forecasts of future economic condi-tions;
• Introducing a new hedge accounting model (types oftransactions eligible for hedge accounting, changes inthe method of accounting for forward contracts andoptions when included in a hedge relationship,
changes in the effectiveness test).The new standard is effective for financial state-
ments beginning on 1 January 2018 or later.Below is a brief description of the main decisions,
choices and activities carried out by the Instituteregarding the provisions of the new standard. Regard-ing the business models identified by the Institute,loans and securities Held to Maturity are classified inaccordance with the Held To Collect business model,while the other financial portfolios are classified inaccordance with the Held to Collect and Sell or Other(fair value through profit and loss) business models. On1 January 2018, one of the securities held in the portfo-lio classified as Available for Sale was reclassified to theportfolio Other (fair value through profit and loss).
The main impacts expected from the adoption ofthe new standard are attributable to the application ofthe new impairment model and, in particular, to theestimate of the “lifetime” expected loss on the creditexposures allocated in stage 2 as well as the collectiverecognition of impairment of loans to banks. Based onthe analysis carried out and the implementations cur-rently in progress, upon adoption, the effects on Com-mon Equity are, under no circumstances, critical inrelation to the Institute’s solvency profile. Conversely,we note a slight positive impact on Tier 1 capital of0.1%.
• Standard IFRS 16 – Leases (published on 13 January2016), will replace the following standards and inter-pretations: IAS 17 – Leases, IFRIC 4 Determiningwhether an Arrangement contains a Lease, SIC-15Operating Leases—Incentives, SIC-27 Evaluating theSubstance of Transactions Involving the Legal Form of aLease.
The standard is effective for annual reporting peri-ods beginning on or after 1 January 2019.
IFRS 16 establishes principles for the recognition,measurement, presentation and disclosure of leases,with the objective of ensuring that lessees and lessorsprovide relevant information that faithfully representsthose transactions. This new standard brings mostleases on-balance sheet for lessees under a singlemodel, eliminating the distinction between operatingand finance leases. Lessor accounting, however,remains largely unchanged and the distinction betweenoperating and finance leases is retained. The Institutedoes not expect a significant impact in the financialstatements from the application of this standard.
• Document “Applying IFRS 9 Financial Instrumentswith IFRS 4 Insurance Contracts” (published on 12September 2016). For entities whose predominantactivity is issuing contracts within the scope of IFRS 4,
ANNUALREPORT 201740 |

the document is intended to clarify the concerns aris-ing from the application of the new IFRS 9, startingfrom January 1 2018, to financial assets. No impact inthe financial statements from the application of thisdocument.
Accounting standards, IFRS amendments and interpreta-tions not yet endorsed by the European Union.
At the date of these financial statements, the relevantEuropean Union bodies have not yet completed theapproval process necessary for the adoption of amendmentsand the principles described below.
• Standard IFRS 17 – Insurance Contracts (publishedon 18 May 2017), will replace IFRS 4 - Insurance Con-tracts. The aim of new standard is to ensure that anentity provides relevant information that faithfully rep-resents the rights and obligations arising from theinsurance contracts issued. The IASB has developedthe standard to eliminate inconsistencies and weak-nesses in existing accounting policies by providing asingle principle-based framework regarding all types ofinsurance contracts, including reinsurance contractsthat an insurer holds.The new standard also provides the disclosure require-ments to improve comparability between entitiesbelonging to this sector.The new standard measures an insurance contractbased on a General Model or a simplified version ofthis, called the Premium Allocation Approach (“PAA”).The main features of the General Model are:• the estimates and assumptions of future cash flows
are always the current ones;• the measurement reflects the time value of money;• estimates provide for an extensive use of information
observable on the market;• there is a current and explicit measurement of the
risk;• the expected profit is deferred and aggregated in
groups of insurance contracts at the time of initialrecognition; and,
• the expected profit is recorded in the contractual cov-erage period taking into account the adjustmentsderiving from changes in the assumptions related tothe cash flows relating to each group of contracts.
The PAA approach measures the liability for theresidual coverage of a group of insurance contracts pro-vided that, upon initial recognition, the entity antici-pates that such liability is reasonably an approximationof the General Model. Contracts with a coverage periodof one year or less are automatically eligible for the PAAapproach. The simplifications deriving from the appli-
cation of the PAA method do not apply to the assess-ment of liabilities for existing claims, which are meas-ured with the General Model. However, it is not neces-sary to discount those cash flows if it is expected thatthe balance to be paid or collected will take place withinone year from the date on which the claim occurred.
The entity must apply the new standard to insur-ance contracts issued, including reinsurance contractsissued, to reinsurance contracts held and also to invest-ment contracts with a discretionary participation fea-ture (DPF). The standard is effective from 1 January2021. Earlier adoption is permitted only for entities thatapply IFRS 9 - Financial Instruments and IFRS 15 -Revenue from Contracts with Customers. No impact inthe financial statements from the application of thisdocument.
• Amendments to IFRS 2 “Classification and measure-ment of share-based payment transactions” (pub-lished on 20 June 2016). These amendments clarify therecognition of the effects of vesting conditions in thepresence of cash-settled share-based payments, theclassification of share-based payments with net settle-ment characteristics and the booking of changes to theterms and conditions of a share-based payment thatmodify the classification from cash-settled to equity-settled. The amendments are effective from 1 January2019, earlier adoption is permitted. No impact in thefinancial statements from the application of this docu-ment.
• Amendments to IFRS 9 “Prepayment Features withNegative Compensation” (published on 12 October2017). These amendments specify that a debt instru-ment with an early redemption option could complywith the characteristics of the contractual cash flows(“SPPI” test) and, consequently, could be measuredusing the amortized cost method or the fair valuethrough other comprehensive income even if the “rea-sonable additional compensation” expected in case ofearly repayment is a “negative compensation” for thelender. The amendments are effective from 1 January2019, however earlier adoption is permitted. The adop-tion of the IFRS 9 could have an impact on the SPPITest on certain securities. No impact in the financialstatements from the application of this document.
• Document “Annual Improvements to IFRSs: 2014-2016 Cycle”, published on 8 December 2016, providespartial integration on existing standards, that include:
• IFRS 1 First-Time Adoption of International FinancialReporting Standards - Deletion of short-term exem-ptions for first-time adopters;
• IAS 28 Investments in Associates and Joint Ventures –
ANNUALREPORT 201741 |

Measuring investees at fair value through profit or loss:an investment-by-investment choice or a consistentpolicy choice;
• IFRS 12 Disclosure of Interests in Other Entities – Cla-rification of the scope of the Standard.
e adoption of the above improvement would notaffect significantly the Financial Statements.
• Document “Annual Improvements to IFRSs: 2015-2017 Cycle”, published on 12 December 2017, providespartial integration on existing standards, that include: • IFRS 3 Business Combinations and IFRS 11 JointArrangements: the amendment clarifies that when anentity obtains control of a business that represents ajoint operation, it must remeasure the interest previ-ously held in that business. However, this process isnot envisaged if joint control is obtained,
• IAS 12 Income taxes: the amendment clarifies that allthe fiscal effects related to dividends (including pay-ments on financial instruments classified withinshareholders’ equity) should be accounted for in amanner consistent with the transaction that gener-ated these profits (income statement, OCI or equity),
• IAS 23 Borrowing costs: the amendment clarifies thatin the case of loans that remain in place even after thereference qualifying asset is ready for use or for sale,these become part of the totality of the loans used tocalculate the financing costs.
The amendments is effective from 1 January 2019,but early application is permitted. No impact in thefinancial statements from the application of this docu-ment.
• Interpretation IFRIC 22 “Foreign Currency Transac-tions and Advance Consideration” (published on 8December 2016). The interpretation clarifies theaccounting for transactions that include the receipt orpayment of advance consideration in a foreign cur-rency. This document provides guidance on how anentity should determine the date of a transaction, andconsequently, the exchange rate to use in circum-stances in which consideration is received or paid inadvance of the recognition of the related asset, expenseor income. IFRIC 22 is effective from 1 January 2018.Earlier adoption is permitted. No impact in the finan-cial statements from the application of this interpreta-tion.
• Interpretation IFRIC 23 “Uncertainty over IncomeTax Treatments” (published on 7 June 2017). Theinterpretation states that the financial statement has toreflect the uncertainties in determining liabilities orassets for taxes only when it is probable that the entitywill pay or recover the amount in question. Further-
more, the document does not contain any new disclo-sure obligation. The interpretation underlines that theentity will have to establish whether it will be necessaryto provide information on the comments made bymanagement related to the uncertainty of taxesaccounting, in accordance with IAS 1. The new inter-pretation is effective from 1 January 2019, but earlyapplication is permitted. No impact in the financialstatements from the application of this interpretation.
• Amendments to IAS 28 “Long-term Interests in Asso-ciates and Joint Ventures” (published on 12 October2017). These amendments clarify the need to applyIFRS 9, including the requirements related to impair-ment, to other long-term interests in associates andjoint ventures for which the equity method is notapplied. The amendments are effective from January 1,2019, but early application is permitted. No impact inthe financial statements from the application of thisdocument.
• Amendments to IAS 40 “Transfers of InvestmentProperty” (published on 8 December 2016). Theseamendments clarify the transfer of a property to, orfrom, investment property. In particular, an entity shallreclassify a property to, or from, investment propertyonly when there is evidence that there has been achange in use of the property. Such a change must beattributed to a specific event; a change of management’sintentions for the use of a property by itself does notconstitute evidence of a change in use. The amend-ments are effective from 1 January 2018. Earlier adop-tion is permitted. The Institute considers that the appli-cation of the above amendments would not affect sig-nificantly the Financial Statements.
• Amendments to IFRS 10 and IAS 28 “Sales or Contri-bution of Assets between an Investor and its Associateor Joint Venture” (published on 11 September 2014).The amendments address a conflict between therequirements of IAS 28 ‘Investments in Associates andJoint Ventures’ and IFRS 10 ‘Consolidated FinancialStatements’ and clarify that in a transaction involvingan associate or joint venture the extent of gain or lossrecognition depends on whether the assets sold or con-tributed constitute a business. At this stage, the IASBsuspended the application of these amendments.
ANNUALREPORT 201742 |

1.2 Information on the main financialstatement items
1.2.1 Financial assets held for trading
A financial asset is classified under this category ifacquired principally for the purpose of trading.
Purchases of financial assets held for trading are recog-nized at the transaction date, which is the date on which theIOR commits to purchasing the asset.
On initial recognition, financial assets held for tradingare recognized at fair value, which generally corresponds tothe initial cash consideration paid, excluding direct transac-tion costs or revenues directly attributable to the instru-ment, which are recognized in the Income Statement.
Subsequent to initial recognition, the financial assets aremeasured at fair value, with any gains or losses arising fromthe change in fair value recognized in the Income Statement.
For the fair value measurement please refer to Section1.4, Fair value information.
Disposals are recognized on the trade date which is thedate on which the Institute commits to dispose the assets.
Gains and losses arising from disposal or redemptionand unrealised gains and losses arising from changes in thefair value are recognized in the Income Statement, item 80“Net trading result”.
Interest income and expense arising from the financialassets held for trading are recognized in the Income State-ment on an accrual basis and recognized “pro rata” based onthe contractual interest rate. These are recognized in theIncome Statement, item 10 “Interest and similar income”.
Dividends on financial assets held for trading are recog-nized in the Income Statement, item 70 “Dividend income”when the entity’s right to receive payment is established.
All financial assets held for trading are derecognizedwhen the rights to receive cash flows from the financialassets have expired or when the IOR has substantially trans-ferred all risks and rewards of ownership.
1.2.2 Financial assets available for sale
Financial Assets classified as Available for sale are thoseintended to be held for an indefinite period of time, andthose that are subject to agreements that restrict the sale fora specified period.
In addition, financial assets classified available for saleinclude non-derivative financial assets that are not classifiedas held for trading or loans and receivables or held to matu-rity investments.
Financial assets available for sale are recognized on thetrade date, which is the date on which the IOR commits topurchasing the asset.
Financial assets available for sale are initially recognizedat fair value plus any direct transaction costs directly attrib-
utable to the instrument.Financial assets available for sale are subsequently meas-
ured at fair value, and any changes in the fair value are rec-ognized in Other Comprehensive Income and thereforedirectly in an equity reserve.
For the fair value measurement please refer to Section1.4 “Fair value information”.
Disposals are recognized on the trade date which is thedate on which the Institute commits to dispose the assets.
At the time that the financial assets are derecognized orimpaired, accumulated gain or loss from changes in the fairvalue of financial assets available for sale previously recog-nized in Other Comprehensive Income are reclassified andrecognized in the Income Statement.
When the financial assets available for sale are sold, anyunrealised gains or losses previously recognized in OtherComprehensive Income, are reclassified into the IncomeStatement, item 100 “Profit (loss) on disposal or repurchase”line b “Financial assets available for sale”.
In case of impairment losses, gains or losses previouslyrecognized in Other Comprehensive Income are transferredto the Income Statement item 130 “Net losses/reversal onimpairment” line b “Financial assets available for sale”.
At each balance sheet date, the IOR assesses whetherthere is objective evidence of impairment on financial assetavailable for sale. A significant or prolonged decline in thefair value of the financial asset below its cost is considered asobjective evidence of a reduction in value. If there is suchevidence, the cumulative loss, measured as the differencebetween the acquisition cost and the current fair value, lesspreviously recognized impairment loss, is transferred fromequity and recognized in the Income Statement in item 130“Net losses/reversal on impairment” line b. If, in a subse-quent period, the amount of the impairment loss decreases,impairment losses recognized in the Income Statement onequity instruments are not reversed through the IncomeStatement, but through the Fair Value Reserves, a compo-nent of equity. For debt instruments classified as availablefor sale, if the fair value increases in a subsequent period andthe increase can be objectively related to an event occurringafter the impairment loss was recognized in profit or loss,the impairment loss is reversed through the Income State-ment.
The impairment policy adopted by IOR is that all equitysecurities classified as available for sale must be impairedwhen their market prices are below their carrying prices andthe price decline is more than 20%, or when the decline tobelow the acquisition cost has persisted for more than 36months.
Interest income and expense arising from the financialassets available for sale are recognized in the Income State-ment on an accrual basis and recognized “pro rata” based onthe effective interest rate method. These are recognized inthe Income Statement, item 10 “Interest and similar
ANNUALREPORT 201743 |

income”.Dividends on financial assets available for sale are recog-
nized in the Income Statement, item 70 “Dividend income”when the entity’s right to receive payment is established.
All financial assets available for sale are derecognizedwhen the rights to receive cash flows from the financialassets have expired or when the IOR has substantially trans-ferred all risks and rewards of ownership.
1.2.3 Financial assets held to maturity
Financial assets held to maturity are quoted non-deriva-tive financial assets with fixed or determinable paymentsand with fixed maturities which the IOR has the intentionand ability to hold to maturity. If the IOR sells financialassets held to maturity, the entire category must be reclassi-fied as available for sale and for two subsequent years, nofinancial asset can be classified in this category.
Financial assets held to maturity are recognized at thetrade date, which is the date on which the IOR commits topurchasing the asset, and are recognized at fair value plusany direct transaction costs.
The financial assets held to maturity are subsequentlymeasured at amortised cost using the effective interest ratemethod, and adjusted to take into account the effects of anyimpairment losses, when applicable the circumstancesdescribed below.
Gains and losses on financial assets held to maturity arerecognized in the Income Statement through the financialamortisation process (item 10 “Interest and similarincome”) or when the assets are derecognized (item 100“Profit (loss) on disposal or repurchase” line c “Financialassets held to maturity”) or when impairment losses are rec-ognized in the Income Statement (item 130 “Netlosses/reversal on impairment” line c “Financial assets heldto maturity”).
As of each balance sheet date, the IOR assesses whetherthere is objective evidence of impairment on financial assetheld to maturity. A financial asset is impaired and impair-ment losses are recognized when one or more loss eventsoccurred after the initial recognition of the asset and thatloss event has an impact on the estimated future cash flowsof the financial asset. The amount of the loss is measured asthe difference between the asset’s carrying amount and thepresent value of estimated future cash flows discounted atthe financial asset’s original effective interest rate. The carry-ing amount of the asset is directly reduced and the extent ofthe loss is recognized in the Income Statement item 130“Net losses/reversal on impairment” line c “Financial assetsheld to maturity”.
Interest income and expense arising from the financialassets held to maturity are recognized in the Income State-ment on an accrual basis and recognized “pro rata” based onthe effective interest rate method. These are recognized in
the Income Statement, item 10 “Interest and similarincome”.
The effective interest method is a method calculatingamortized cost of an asset or a financial liability and of allo-cating interest. The effective interest rate is the rate thatmakes the present value of expected cash flows until matu-rity of the financial instrument (or, if more reliable for ashorter period) exactly equal to the current book value. Thecalculation not only includes all fees and premiums or dis-counts received or paid to the counterparty, which are anintegral part of the effective interest rate, but also the trans-action costs and all other premiums or discounts.
All financial assets held to maturity are derecognisedwhen the rights to receive cash flows from the financialassets have expired or when the IOR has substantially trans-ferred all risks and rewards of ownership.
1.2.4 Credits
This item includes loans to customers and banks, withfixed or determinable payments, provided directly, notquoted in an active market and not initially classified asfinancial assets held for trading, available for sale or at fairvalue.
This item includes:1. deposits on demand and time deposits with banks;2. authorized financing agreements where the Institute
provides money directly to the customers without theintention of subsequent re-negotiation;
3. Loans and Receivables debt securities offered throughprivate placements, which the Institute does not desig-nate as financial assets at fair value through profit orloss or available for sale.
These financial assets are subject to the risk of deteriora-tion of the creditworthiness of the counterparty.
Deposits with banks and financing agreements are rec-ognized when the amount is advanced to the borrower.They are initially recognized at fair value, which is the valueof the loan, plus any direct transaction costs. Financingagreements are subsequently measured at amortised costusing the effective interest rate method.
Securities are initially recognized on the trade date,which is the date on which IOR commits to purchasing theasset at fair value plus any direct transaction costs orincome. Securities are subsequently measured at amortisedcost using the effective interest rate method, and are subjectto impaired test and impairment losses are recognized whenone or more loss events occurred after the initial recognitionof the asset and that loss event has an impact on the esti-mated future cash flows of the financial asset.
The amortized cost method is not used for short-termloans for which the effect of the application of the discount-ing logic is negligible. A similar valuation criterion isadopted for loans without a defined or revocation term.
ANNUALREPORT 201744 |

Interest income and expense arising from loans andadvances to customers are recognized in the Income State-ment on an accrual basis and recognized “pro rata” usingthe effective interest rate method. These are recognized inthe Income Statement, item 10 “Interest and similarincome”.
At each balance sheet date, the IOR assesses whetherthere is objective evidence of impairment. A financial assetis impaired and impairment losses are recognized when oneor more loss events occurred after the initial recognition ofthe asset and that loss event has an impact on the estimatedfuture cash flows of the financial asset.
The amount of the loss is measured as the differencebetween the asset’s carrying amount and the present value ofestimated future cash flows discounted at the financialasset’s original effective interest rate. The carrying amountof the asset is reduced directly for securities or bankdeposits, while for financing agreements through the use ofa provision account. The extent of the loss is recognized inthe Income Statement item 130 “Net losses/reversal onimpairment” line a “Receivables”.
Loans which are not individually impaired are subject tovaluation on a portfolio basis based on historical data. Theloss is recognized in the Income Statement item 130 “Netlosses/reversal on impairment” line a “Receivables”.
If, in a subsequent period, the impairment loss decreasesand the decrease can be objectively attributed to an eventoccurring after the impairment was recognized (such as animprovement in the debtor’s credit rating), the previouslyrecognized impairment loss is reversed by adjusting theallowance account for the financing agreements or byadjusting the carrying amount of the asset for securities andbank deposits. The amount of the reversal is recognized inthe Income Statement, Statement item 130 “Netlosses/reversal on impairment” line a “Receivables”. In anycase, the reversal can not exceed the cost that the financialinstrument prior to the recognition of any impairment loss.
Credits are derecognized when the rights to receive cashflows from the financial assets have expired or when theIOR has substantially transferred all risks and rewards ofownership.
When a loan becomes uncollectible, it is written offagainst the related provision for loan impairment. Suchexposures are written off after all the necessary procedureshave been performed and the extent of the loss has beendetermined. Subsequent recoveries of amounts previouslywritten off are recognized in the Income Statement item 130“Net losses/reversal on impairment” line a “Receivables”.
Regarding loans to customers, at the end of each month,the Advances Department analyses all exposures and sub-mits to the Directorate a proposal on how to manage agedloans at risk for non-collection. Particularly, when the bal-ance is deemed to be collectible within a short period, animpairment loss is not realized, but the trend is monitored;
when the balance is deemed to be collectible in a mid/longterm period, an impairment loss is recognized; when thepositions are past due and uncollectible, the departmentproposes a write-off the amount as a loss on loans to theDirectorate.
It is to be mentioned that the Institute is not authorizedby the Autorità di Informazione Finanziaria to carry out theactivity of “lending” (cfr. art. l (l) (b) of the Law n.XVIII andart. 3 (24) (b) of the Regulation No. l), as credit activities onits own. However, it is authorized to make “advances” that isto disburse funds to its clients and to a limited extent follow-ing guarantee of future income (such as, for example, in thecase of the advance of salary or pension paid by the Holy Seeor the Governatorato of Vatican City) or guaranteed byfinancial assets of the same amount deposited by the clientsat the Institute.
1.2.5 Derivative financial instruments and hedge accounting
Derivatives are initially recognized at fair value on thedate in which a derivative contract is entered into.
The initial fair value generally corresponds to the initialcash consideration, and subsequently remeasured at fairvalue with changes recognized through profit or loss.
The fair value of derivatives quoted in active markets isbased on current bid prices. If the market for a financialderivative is not active, the IOR obtains fair value from thirdparties or establishes fair value by using valuation modelsthat are primarily based on objective financial inputs, as wellas considering prices utilised in recent transactions andprices of similar financial instruments. All derivatives arerecognized as assets when the fair value is positive and asliabilities when fair value is negative.
Derivative financial instruments may include embeddedderivatives in a hybrid financial instrument.
IAS 39 requires that an embedded derivative be sepa-rated from its host contract and accounted for as a derivativewhen:
1. The economic risks and characteristics of the embed-ded derivative are not closely related to those of thehost contract;
2. A separate instrument with the same terms as theembedded derivative would meet the definition of aderivative;
3. The hybrid (combined) instrument is not measured atfair value with changes in fair value recognizedthrough Income Statement.
The Institute does not enter into Fair value hedges, Cashflow hedges or Net investment hedges for foreign currencytransactions/positions.
As of 31 December 2017 and 2016, the Institute did nothold derivatives.
ANNUALREPORT 201745 |

1.2.6 Investment in subsidiaries
Investment in subsidiaries consists of the stake in thewholly-owned real estate company S.G.I.R. S.r.l., based inRome, Via della Conciliazione. The principal assets of thiscompany are real estate properties.
Investment in subsidiaries is carried at cost, less impair-ment.
Real estate owned by the subsidiary is depreciated on astraight-line basis over its estimated useful life which man-agement considers as between 30 and 50 years. Land is notdepreciated.
1.2.7 Tangible assets
1.2.7.1 Tangible assets for investment - Investment properties
Investment properties are properties directly owned bythe IOR. These are buildings not owner-occupied. Theywere inherited and held to generate rental income, capitalappreciation or both.
Investment properties are initially measured at cost(which is zero in case of inheritances) and subsequently atfair value with any change recognized in the Income State-ment, item 220 “Net result of fair value valuation of tangibleand intangible assets”.
Improvements to buildings increase their carryingamounts.
1.2.7.2 Tangible assets for business activities –Equipment, furniture and vehicles
All equipment, furniture and vehicles are stated at his-torical cost, minus accumulated depreciation. Historicalcost is generally based on the fair value of the sum paid inexchange for assets and includes expenditure that is directlyattributable to the acquisition of the items.
Subsequent costs are included in the asset’s carryingamount or are recognized as a separate asset, as appropriate,only when it is probable that the IOR will recognise futureeconomic benefits associated with the item.
All repairs and maintenance costs are charged to theIncome Statement in the year they are incurred.
Equipment, furniture and vehicles are amortised on astraight-line basis over their expected useful lives, usuallymeasured in four years.
The asset’s residual values and useful lives are reviewed,and adjusted if appropriate, on each balance sheet date.These assets are reviewed for impairment whenever eventsor changes in circumstances indicate that the carryingamount may not be recoverable. An asset’s carrying amountis written down immediately to its recoverable amount if
the asset’s carrying amount is greater than its estimatedrecoverable amount. The recoverable amount is the higherof the asset’s fair value less costs to sell and its value in use.
The result of the impairment test and the depreciationsare recognized in the Income Statement item 170 “Net valueadjustments to/recoveries on tangible assets”.
Gains and losses on disposals are determined as the dif-ference between the sale proceeds and the carrying amountof the assets. They are recognized in the Income Statement,under item 190 “Other operating income (expense)”.
1.2.8 Intangible assets
Intangible assets correspond to computer softwarelicenses and to expenses related to their implementation.Acquired computer software licenses are recognized atacquisition costs, including costs incurred to bring the spe-cific software into use. These costs are amortised on astraight-line basis over their expected useful lives, usuallymeasured in four years.
These assets are reviewed for impairment wheneverevents or changes in circumstances indicate that the carry-ing amount may not be recoverable. An asset’s carryingamount is written down immediately to its recoverableamount if the asset’s carrying amount is greater than its esti-mated recoverable amount. The recoverable amount is thehigher of the asset’s fair value less costs to sell it and its valuein use.
The results of the impairment test and depreciation arerecognized in the Income Statement item 180 “Net valueadjustments to/recoveries on intangible assets”.
Costs associated with maintenance of computer soft-ware programmes are recognized as an expense in theIncome Statement when they are incurred.
1.2.9 Due to banks and to customers
Due to banks comprises interim current accounts over-drafts, as the Institute does not carry out funding activiteson the interbank market.
Due to customers are composed of financial instru-ments (different from trading liabilities) that assumed thetypical forms of funds, realised by IOR with customers.
The mentioned financial liabilities are recorded in thefinancial statements at the trade date, which is the datewhen IOR receives the amounts. They are initially recog-nized at the current value, which normally corresponds tothe amount collected. The initial recognition value includespossible expenses and incomes from anticipated transac-tion and directly attributable to each liability; not includedin the initial carrying amount are all charges which are paidback by the credit counterparty or that are attributable tointernal administrative expenses.
ANNUALREPORT 201746 |

After the initial recognition, due to banks and to cus-tomers are measured at amortized cost using the effectiveinterest rate method. The short-term liabilities remainrecorded at the amount received.
Interest expense related to due to banks and to cus-tomers are recognized in the income statement, item 20“Interest and similar expense”.
Due to banks and to customers are derecognized whenthey expired or extinguished.
1.2.10 Legates
According to the Canon Law (Can. 1303), the term“Legati – non autonomous pious foundation” comprises:“temporal goods given in any way to a public juridical per-son and carrying with them a long-term obligation, such aperiod to be determined by particular law. The obligation isfor the juridical person, from the annual income, to cele-brate Masses, or to perform other determined ecclesiasticalfunctions, or in some other way to fulfil the purposes men-tioned in Can. 114, par. 2”.
Based on such definition, this is understood to be anarrangement whereby capital is donated or willed to theIOR for religious or charitable purposes, based on theunderstanding that the transferred capital is invested on along term basis and the annual income earned from theinvestment is devoted to the fulfilment of the purpose pre-scribed by the donor. Under these provisions, the IOR willadminister the capital in accordance with the purpose pre-scribed by the donor (e.g., for Holy Mass Intention or schol-arships).
Legates are recognised in the financial statement at thetrade date. Legates are initially recognised at the currentvalue, which normally corresponds to the amount received.The initial recognition value includes also expenses andincomes for anticipated transaction and directly attributableto each liability; not included in the initial carrying valueare all charges which are paid back by the credit counter-party or that are attributable to internal administrativeexpenses.
After the initial recognition, Legates are measured atamortized cost using the effective interest rate method.
The interest expense related to the Legates are recog-nized in the income statement, item 20 “Interest and similarexpense”.
Legates are derecognised when they expired or extin-guished.
1.2.11 Staff severance fund
Staff severance fund is a post-employment benefit thatcorresponds to indemnities paid to personnel when theyleave the IOR. The amount due is based on years of serviceand salary paid in the last year of employment. These bene-fits are financed by contributions from employees and theIOR.
The liability is measured with utilizing certain actuarialassumptions, as the present value of the estimated futurecash outflows according to the projected unit credit methodrequired by IAS 19. Remeasurements arising from thedefined benefit plan comprise actuarial gains and losses,recognized in Other Comprehensive Income. All otherexpenses related to the defined benefit plan in the IncomeStatement, item 150 “Administrative Expenses”, line a “Staffexpenses”.
1.2.12 Provisions for risks and charges – Pension fundand similar obligations
For the pensions of its employees, the IOR operates adefined benefit plan, which is financed by contributionsfrom employees and the IOR.
The IOR’s net liabilities related to the defined benefitplan for pensions is calculated by estimating the amount offuture benefit that employees will earn in return for theirservice in the current and prior periods; that benefit is dis-counted to determine its present value.
The IOR determines the interest expense on the definedbenefit liability for the year by applying the discount rateused to measure the same liability at the beginning of theyear.
The discount rate is the yield on the reporting date fromhigh quality corporate bonds that have maturity datesapproximating the terms of the IOR’s liabilities and that aredenominated in the currency in which the benefits areexpected to be paid.
The calculation is performed annually by a qualifiedactuary, who assesses the fairness of the liability, using theprojected unit credit method. Remeasurements arisingfrom the defined benefit plan comprise actuarial gains andlosses. The IOR recognizes them immediately in OtherComprehensive Income and all other expenses related tothe defined benefit plan in the Income Statement, item 150“Administrative expenses”, line a “Staff expenses”.
When the benefits of the plan are changed, the portionof the changed benefit related to past service by employeesis recognized immediately in the Income Statement.
On 1 January 2005, all IOR personnel also joined thegeneral Vatican City State pension plan. This system isfinanced by contributions made by the Institute and employ-ees. Contributions to the Vatican plan made by the IOR are
ANNUALREPORT 201747 |

recognized in the Income Statement, item 150 “Administra-tive expenses”, line a “Staff expenses” when they occur.
Consequently, the IOR’s defined benefit plan for pen-sions covers the entire amount to be paid by the Institute toemployees for their service up to 31 December 2004. Forthe employees’ services from 1 January 2005, the obligationis limited to the part not covered by the Vatican City StatePension Plan taking into account the difference in theretirement age of the two pension systems.
1.2.13 Foreign Currency Transactions
Functional and presentation currencyThe functional currency is the currency in which the
items included in the financial statements must be meas-ured. According to IAS 21 “The effects of changes in foreignexchange rates” the functional currency is the currency ofthe primary economic environment in which the entityoperates. This is the currency that determines the pricing oftransactions, but it is not necessarily the currency in whichtransactions are denominated.
The reporting currency is the currency in which thefinancial statements are prepared. IAS 21 allows an entity toprepare its financial statements in any currency.
The IOR’s functional and presentational currency is theEuro, which is the currency of the primary economic envi-ronment in which the Institute operates.
Transactions and balancesForeign currency transactions, if they impact profit or
loss accounts, are converted into the functional currencyusing the exchange rates applicable at the date of the trans-action.
Monetary assets and liabilities denominated in foreigncurrencies are converted into the functional currency usingthe spot exchange rate at the reporting date (closing rate).
Non-monetary assets and liabilities denominated in for-eign currencies are translated using the rate at the date theiramount (cost or fair value) was determined: non-monetaryitems carried at cost are converted at the exchange rate atthe date of initial recognition in the financial statements,while non-monetary items carried at fair value are trans-lated using the rate at the date of the determination of theirfair value.
Foreign exchange gains and losses resulting from thesettlement of foreign currency transactions and from theconversion at year-end exchange rates of monetary assetsand liabilities denominated in foreign currencies are recog-nized in the Income Statement, item 80 “Net income fortrading activities”.
Foreign exchange gains and losses resulting from theconversion at year-end exchange rates of non-monetaryassets and liabilities are:
• recognized in the Income Statement as part of the fairvalue gain or loss if the non-monetary assets and liabil-ities are carried at fair value through profit and loss;
• included in the fair value reserves in the equity if thenon-monetary assets and liabilities are carried at fairvalue in the equity.
1.2.14 Offsetting financial instruments
Financial assets and liabilities are offset and the netamount is reported on the Balance Sheet only when there isa legally enforceable right to offset the recognized amountsand there is an intention to settle on a net basis. Otherwise,the financial assets and liabilities are separately reported onthe balance sheet.
1.3 Transfers between Portfolios
The amendments to IAS 39 and to IFRS 7 allow for thereclassification of certain financial assets after their initialrecognition, out of the held for trading (HFT) and availablefor sale (AFS) portfolios.
In particular, those HFT or AFS financial assets thatwould have met the definition specified by internationalaccounting standards for the loan portfolio (if such assetswere not classified as HFT or AFS respectively on initialrecognition) may be reclassified if the entity intends, and isable, to hold them for the foreseeable future or until matu-rity.
The Institute did not have any transfers between portfo-lios in 2017 and in previous years.
1.4 Fair Value Information
Qualitative fair value informationFor the measurement of fair value, the amendments to
IFRS 7 and subsequent changes introduced by IFRS 13defines a fair value hierarchy based on level of observableinputs used for measurement. The financial assets are clas-sified according to the following hierarchy that consists ofthree levels.
Level 1In Level 1, the fair value is measured using the quoted
prices in active markets for the financial assets and liabilitiesto be evaluated.
A financial instrument is considered quoted in an activemarket when its price is:
• readily and regularly available on stock exchanges,from information providers or intermediaries;
• significant, meaning that it represents effective market
ANNUALREPORT 201748 |

transactions regularly occurring in normal transac-tions.
To be considered Level 1, the price should not beadjusted through an adjustment factors (valuation adjust-ment). If it is adjusted, the measurement at fair value offinancial instrument will be Level 2 or Level 3.
Level 2A financial instrument is included in Level 2 when the
inputs utilised to measure fair value are directly or indi-rectly observable in the market.
The parameters of Level 2 are as follows:• prices quoted on active markets for similar assets or
liabilities;• price quoted on non-active markets for similar or
identical assets and liabilities;• market observable inputs other than the quoted price
for the asset or liability (interest rates, yield curve,credit spreads, volatility);
• parameters that derive mainly (or are corroborated bycorrelation or other techniques) from observable mar-ket data (market-corroborated inputs).
An input is observable when it reflects the assumptionsthat market participants would use in pricing an asset or lia-bility based on market data provided by sources independ-ent of the reporting entity.
Valuation techniques used to determine fair value thatshould be used when the market price is not available or isnot significant, must meet three conditions. They must:
1. be methodologically consolidated and widelyaccepted;
2. utilise market inputs disclosed above; 3. be periodically reviewed.
Valuation techniques used for fair value measurementshould be periodically assessed using inputs observable inthe markets to ensure that outputs reflect actual data andcomparative market prices and to identify any weaknesses.
If the fair value measurement utilise observable inputsthat require a significant adjustment based on unobservableinputs, the financial instrument should be considered inLevel 3.
Level 3 Included in Level 3 are financial instruments valued
using unobservable market data (unobservable inputs). Tobe included in Level 3, at least one of the inputs must beunobservable on the market.
Level 3 financial instruments are valued using inputsthat are not derived from independent sources, rather theyare based on the reporting entity’s own assumptions based
on assumptions that market participants would use, basedon observable inputs.
IFRS 13 specifies a hierarchy of fair value measurementsbased on whether the inputs are observable or unobserv-able. Observable inputs reflect the assumptions that marketparticipants would use in pricing the asset or liability basedon market data obtained from sources independent of thereporting entity. The market price is the most observableand objective input (Level 1). Where no active marketsexists or where quoted prices are not available, the entitydetermines the fair values by using valuation techniques.Valuation techniques can utilise inputs observable on themarket (Level 2) or non-observable inputs (Level 3).
The above mentioned valuation approaches should beapplied in a hierarchical order.
When there is availability of quoted market prices inactive markets, an entity must measure fair value usingLevel 1 inputs. Furthermore, the valuation techniques usedshould prioritise the utilization of inputs observable on themarket and should rely as little as possible on the reportingentity’s own data, internal valuations or unobservableinputs.
Fair value Level 2 and 3: valuation techniques and inputused
The criteria used by the IOR to determine the fair valueof financial instruments are as follows.
The fair values of investments held by the IOR quoted inactive markets are usually based on current bid prices.
A financial instrument is considered as quoted in activemarkets if the prices are readily and regularly available in anexchange or regulatory agency and those prices representactual market transactions that occur regularly on an arm’slength basis.
In the absence of an active market, or in the event themarket at the time of the valuation is not considered active,for example, in case of illiquid markets, the valuation tech-niques adopted by IOR are based on the use of recent arm’slength transactions in the market, even on a non-activemarket, relative to identical financial instrument or finan-cial instruments with similar characteristics. The valuationtechniques include the discounted cash flow analysis andother valuation techniques commonly used by market par-ticipants.
If recent transactions of the same or similar instrumentsare not available, the IOR uses valuation techniques basedon market parameters or other parameters.
When using valuation techniques, the IOR tries to useobservable market data, reducing its reliance on internaldata.
Valuation techniques are periodically reviewed forapplicability, assessing the quantity and the quality of infor-
ANNUALREPORT 201749 |

mation available as of the balance sheet date, in order tocorrectly reflect any changes in the market. For the samereason, adjustments to market inputs, utilised in a certainmodel, can change from time to time.
Consequently IOR models ensure that outputs reflectactual data and comparative market prices.
In Level 1, the IOR has classified all financial instru-ments quoted in active markets.
Under Level 2, the IOR has classified all illiquid finan-cial instruments, include those that are structured orunstructured, as well as listed external investment fundsthat are not immediately payable and unlisted investmentfunds with investments in listed instruments. The basis forthe valuation of illiquid securities follow prices provided bythe securities issuer. These prices are internally verified andtested utilising internal models and observable marketparameters and, in case of discrepancies, adjusted consider-ing the result of the above-mentioned analysis. They arealso adjusted on the basis of valuations from independentsources.
Under Level 3, the IOR has classified equity securitiesthat are not quoted or other financial instruments for whichfair values are determined using a model based on internalparameters.
To the extent that this is practical, the models use onlyobservable data. However, areas such as default rates,volatilities and correlations require the Directorate to makeestimates.
In this category the Institute has also classified otherassets:
• for which the IOR did not receive independent valua-tions;
• for which the IOR does not have access to financialinformation;
• for which, despite having financial information, theInstitute believes that the valuation of underlyingassets, due to the nature of the investment, is based onvaluation parameters that are not immediately observ-able in the market;
• for which the IOR has received independent expertvaluations (i.e. for investment properties).
The NAV of investment funds, defined as the differencebetween the current value of the assets and liabilities of thefund, a Fair Value Adjustment was calculated to includeother risk factors.
The Fair Value Adjustment (FVA) is defined as theamount to be added to the mid-price observed in markets,rather than the price determined by the model, with theaim of obtaining the fair value of the position. The FVAincludes the uncertainty inherent in the valuation of afinancial instrument with the goal of reducing the risk ofincorrect valuations in the financial statements and ensur-
ing that fair value reflects the realised price of a markettransaction that is actually possible; and incorporating pos-sible future costs.
The Institute adjusts the value of financial instrumentsmeasured at fair value on a recurring basis classified asLevel 2 and Level 3 based on credit risk (Credit ValuationAdjustment), liquidity risk related to the disinvestment,close-out costs and available informations about the out-standing assets.
With regard to the Credit Valuation Adjustment, theInstitute considered the impact of fair value on credit risk ofthe counterparty and the country using the followinginputs:
• PD (Probability of Default) linked to the rating ofcounterparty (if not available the PD corresponding toan investment with an S&P rating of BBB was used);
• LGD (Loss Given Default) based on the estimated levelof expected recovery in case of counterparty defaultand defined through market benchmark and based onexperience. The percentage used was 60%.
Regarding the close-out cost, an adjustment is appliedon the NAV of external investment funds if close-out penal-ties are stipulated.
Sensitivity AnalysisFor fair value measurements where significant unob-
servable inputs are used (Level 3), a sensitivity analysis isperformed in order to obtain the range of reasonable alter-native valuations. The Institute takes into account that theimpact of unobservable inputs on the measurement of fairvalue of Level 3 depends on the correlation between the dif-ferent inputs used in the valuation process.
A sensitivity analysis was performed using a stress teston the PD and LGD by +/-5% and it did not have a signifi-cant impact to the value of the investments classified asLevel 3.
Fair value hierarchy (transfers between portfolios) With reference to financial assets and liabilities meas-
ured at fair value on a recurring basis, transfers between thefair value hierarchy were based on the following guidelines.
For debt securities, transfers from Level 3 to Level 2occur when the relevant parameters used as inputs to thevaluation technique are observable on the market. Transfersfrom Level 3 to Level 1 occur when the presence of an activemarket has been verified, as defined by IFRS 13. Transfersfrom Level 2 to Level 3 occur when some of the relevantparameters for determination of fair value are no longerdirectly observable on the market.
For equity instruments classified as available- for- sale,transfers between the fair value hierarchy occur:
• during the period, when market observable inputsbecome available (e.g. prices are determined in com-
ANNUALREPORT 201750 |

parable transactions on the same instrument betweenindependent and knowledgeable counterparties), theInstitute proceeds with the reclassification from Level3 to Level 2;
• when inputs that are directly or indirectly observablein the market used as the basis for the valuation nolonger exist, or no longer updated (e.g. No recent com-parable transactions or market multiples are no longerapplicable) and no other inputs are available, the Insti-tute uses valuation techniques that use unobservableinputs, proceeding with the reclassification from Level2 to Level 3.
Information on assets measured at fair value on a recurring basis
We provide below the IFRS 13 disclosure requirementsabout assets measured at fair value on a recurring basis. Bydefinition, the carrying value of these items corresponds tothe fair value.
Fair value is defined as the price that would be receivedin selling an asset or paid when transferring a liability in anordinary transaction between market participants at themeasurement date (i.e. an exit price).
Financial assets held for trading These consist of:• Debt securities: the Institute has investments in debt
securities valued at market price (mark-to-market)and regularly traded in active, liquid markets. Conse-quently, these instruments are classified as Level 1 inthe fair value hierarchy, except for some bonds whoseprices are determined internally on the basis of similarinstruments quoted on active markets and are classi-fied as Level 2; these amounted to EUR 26.9m.
• Equity securities: the Institute has investments inequity securities valued at market price (mark-to-market) and regularly traded in active, liquid markets.Consequently, these instruments classified as Level 1in the fair value hierarchy.
• Investments funds: the Institute has external invest-ment funds amounting to EUR 32.6m. With theexception of a fund of EUR 10.3m as Level 2 (liquidwith monthly NAV), investment funds are classified asLevel 3. Consequently, at 31 December 2017, a total ofEUR 10.3m was classified as Level 2, while the remain-ing amount for EUR 22.3m was Level 3.
Financial assets available for sale These are mainly classified as Level 1, comprise of
shares quoted in active, liquid markets, except for twounlisted equity securities, one classified as Level 2 and theother classified as Level 3.
Tangible assets for investmentThis item is comprised of properties directly owned by
the Institute.The fair value of the properties is assessed by a qualified,
independent expert.The appraisal is based on the real estate market data col-
lected through surveys carried out by major industry play-ers. The parameters used also reflect expert assumptionsbased on available information. For these reasons, theinvestment properties are classified as Level 3 on the fairvalue hierarchy.
Assets not measured at fair value on a recurring basisFor assets and liabilities not measured at fair value on a
recurring basis, the following information is required byIFRS 13.
Financial assets held to maturityThe fair value of financial assets held to maturity corre-
sponds to the market value at the balance sheet date. Thesecurities are classified as Level 1 in the fair value hierarchysince they are regularly traded on active, liquid markets.
Due from banks This item is comprised of deposits on demand and time
deposits with banks in addition to financial “Loans andReceivables” securities issued by banks.
Assuming that time deposits do not exceed ninety days,the carrying value of bank deposits, at the balance sheetdate, approximates fair value and they are recorded in Level1 of the fair value hierarchy.
For “Loans and Receivables” securities, the fair valuerepresents the market value at the closing date of the finan-cial statements.
By definition, “Loans and Receivables” securities are notquoted in active, liquid markets, but the valuation is sentweekly by the counterparty and is verified through an inter-nal model.
For these reasons, “Loans and Receivables” securities areclassified in Level 2 of the fair value hierarchy.
Due from customersThis item is comprised of receivables due from credits
granted as advances to clients in addition to “Loans andreceivables” securities issued from entities other than banks.
For Doubtful loans considered to be non-collectible, theInstitute proceeded in the calculation of a specific impair-ment loss, and the carrying value represents fair value.
With regards to other receivables, the fair value was cal-culated as follows:
• Loans and credit lines: calculated by discountingfuture cash flows using a discount rate representative
ANNUALREPORT 201751 |

rate for the Institute;• temporary Overdrafts: given their nature, the value of
overdrafts approximates fair value.For “Loans and Receivables” securities the fair value
represents the market value at the closing date of the finan-cial statements.
By definition, “Loans and Receivables” securities are notquoted in active, liquid markets, but the valuation is sentweekly by the counterparty and is controlled through aninternal model.
For these reasons, “Loans and Receivables” securities areclassified in Level 2 of the fair value hierarchy.
Liabilities not measured at fair value on a recurringbasis
Due to banks
The carrying value of this item approximates fair value,considering their short maturity.
Due to customers This item is comprised of client deposits on demand
and time deposits, liquid accounts and term deposits relatedto Asset Management positions. Their carrying valueapproximates fair value, considering the short maturity orindefinite maturity.As the fair value calculation is based on parameters notobservable on markets, not even indirectly, these are clas-sified as Level 3 in the fair value hierarchy.
ANNUALREPORT 201752 |

ANNUALREPORT 201753 |
Financial assets Financial assets Tangibleheld for trading available for sale assets
1. Opening balance 23,277 8 2,980
2. Additions
2.1.Purchases
2.2.Profit recognized in:
2.2.1.Income Statement 392 136
- of which Gains 258 136
2.2.2 Net Equity
2.3.Transfers from other levels
2.4 Other variations in addition
3. Disposals
3.1 Sales
3.2 Reimbursement (400)
3.3 Losses recognized in:
3.3.1 Income Statement (1,015) (14)
- of which Losses (1,015) (14)
3.3.2 Net Equity
3.4. Transfers to other levels
3.5 Other variations in reduction
4. Closing balance 22,254 8 3,102
1.4.2 Quantitative fair value information
1.4.2.1 Fair value hierarchy
(a) Assets and liabilities measured at fair value on a recurring basis: detail by fair value level
(b) Annual changes of assets measured at fair value on a recurring basis (Level 3)
The following table provides information about the assets measured at fair value on a recurring basis and categorizedas Level 3 in the fair value hierarchy at the beginning of the year, disposals and/or additions during the year, and theirfinal values at the balance sheet date.
Assets and liabilities measured at fair value 2017 2016
L1 L2 L3 L1 L2 L3
1. Financial assets held for trading 2,057,336 37,181 22,254 1,802,904 91,923 23,277
2. Financial assets carried at fair value
3. Financial assets available for sale 3,879 684 8 6,157 499 8
4. Hedging derivatives
5. Tangible assets 3,102 2,980
6. Intangible assets
Total 2,061,215 37,864 25,364 1,809,061 92,422 26,265
1. Financial liabilities held for trading
2. Financial liabilities carried at fair value
3. Hedging derivatives
Total
Key: L1 = Level 1 L2 = Level 2 L3 = Level 3

((c) Annual changes of liabilities measured at fair value on a recurring basis (Level 3)The Institute did not hold liabilities measured at fair value on a recurring basis.
d) Assets and liabilities not measured at fair value or measured at fair value on a non-recurring basis: detail by fair valuelevel
1.5 Information on “day one profit/loss”
The Institute did not earn day one profit/loss from financial instruments pursuant to paragraph 28 of IFRS 7 and otherrelated IAS/IFRS.
ANNUALREPORT 201754 |
2017 2016
BV L1 L2 L3 BV L1 L2 L3
1. Financial assets held to maturity 246,168 259,547 558,956 583,392
2. Due from banks 473,386 473,386 643,229 643,229
3. Due from customers 25,423 26,242 29,153 30,418
Total 744,977 732,933 26,242 1,231,338 1,226,621 30,418
1. Due to banks 4,096 4,096
2. Due to customers 2,131,421 2,131,421 2,398,924 2,398,924
Total 2,135,517 4,096 2,131,421 2,398,924 2,398,924
Key: BV = Book Value L1 = Level 1 L2 = Level 2 L3 = Level 3

PART 2. informAtion on the BAlAnce sheet
ASSETS
item 10 - cAsh And cAsh equivAlents
Detail
The balance included in (b) represent free deposits with Public Authorities of the Holy See and Vatican City State withthe statutory purpose of administering the assets owned by the Holy See (at present APSA).
item 20 Assets - finAnciAl Assets held for trAding
2.1 Detail by asset type
ANNUALREPORT 201755 |
2017 2016
(a) Cash 15,247 15,216
(b) Free deposits ex art. 9 (b) 55,987 35,634
(c) Free deposits ex art. 9 (c)
(d) Other free deposits
Total 71,234 50,850
2017 2016
L1 L2 L3 L1 L2 L3
A. Cash assets
1. Debt securities
1.1. Structured securities
1.2. Other debt securities 2,027,677 26,855 1,750,174 81,519
2. Equity securities 29,659 52,730
3. UCI units 10,326 22,254 10,404 23,277
4. Loans
4.1. Outstanding repos
4.2. Other
Total A 2,057,336 37,181 22,254 1,802,904 91,923 23,277
B. Derivatives
1. Financial derivatives
1.1. Held for trading
1.2. Related to the fair value option
1.3. Other
2. Credit derivatives
2.1. Held for trading
2.2. Related to the fair value option
2.3. Other
Total B
Total (A+B) 2,057,336 37,181 22,254 1,802,904 91,923 23,277

The table shows all financial assets, by type, allocated to the trading portfolio and classified in the fair value hierarchy(L1, L2 or L3) according to their nature.
UCI units in the financial assets held for trading refers exclusively to investment funds managed by third parties com-posed by equity securities. Regarding the composition of the funds, refer to the table included in section 5.2.6 “Informationon unconsolidated structured entities” of Part 5 “Information on risks and hedging policies”.
Financial assets held for trading is primarily comprised of debt securities classified as Level 1 in the fair value hierarchy;the only financial assets classified as Level 3 are shares of UCI units.
As of 31 December 2017, similar to the prior year, the Institute did not have any derivative financial instruments in thetrading portfolio.
ANNUALREPORT 201756 |
2.2 Detail by borrowers/issuers
No borrowers/issuers are residents of the Vatican City State. Line (a) “Public entities” of the item A.1 Debt securities is exclusively comprised of securities issued by Foreign Central
Public Administrations.In the portfolio of financial assets held for trading, there are no equity securities classified as in default or at the risk of
default.
2017 2016
A. Cash assets
1. Debt securities
(a) Public entities 1,198,653 912,466
(b) Financial companies 675,554 703,239
(c) Insurance companies 5,115 9,286
(d) Non financial companies 175,211 206,702
(e) Other subjects
2. Equity securities
(a) Banks
(b) Other issuers:
- insurance companies 4,125 2,759
- financial companies 10,748 36,529
- non financial companies 14,786 13,442
- other
3. UCI units 32,580 33,681
4. Loans
(a) Public entities
(b) Financial companies
(c) Insurance companies
(d) Non financial companies
(e) Other subjects
Total A 2,116,771 1,918,104
B. Derivatives
(a) Banks
(b) Customers
Total B
Total (A+B) 2,116,771 1,918,104

item 40 Assets - finAnciAl Assets AvAilABle for sAle
4.1 Detail by asset type
4.2 Detail by borrowers/issuers
No borrowers/issuers are resident in the Vatican City State. In the portfolio of financial assets available for sale, there are no equity securities classified in default or at the risk of
default.
ANNUALREPORT 201757 |
2017 2016
L1 L2 L3 L1 L2 L3
1. Debt securities
1.1. Structured securities
1.2. Other debt securities
2. Equity securities
2.1. Carried at fair value 3,879 684 6,157 499
2.2. Carried at cost 8 8
3. UCI units
4. Loans
Total 3,879 684 8 6,157 499 8
2017 2016
A. Cash assets
1. Debt securities
(a) Public entities
(b) Financial companies
(c) Insurance companies
(d) Non financial companies
(e) Other subjects
2. Equity securities
(a) Banks
(b) Other issuers:
- insurance companies 3,880 6,157
- financial companies 684 499
- non financial companies 8 8
- other
3. UCI units
4. Loans
(a) Public entities
(b) Financial companies
(c) Insurance companies
(d) Non financial companies
(e) Other subjects
Total A 4,572 6,664

4.3 Financial assets available for sale with specific hedges
The Institute did not hold financial assets available for sale with specific hedges.
item 50 Assets - finAnciAl Assets held to mAturity
5.1 Detail by asset type
Financial assets held to maturity is mainly comprised of government bonds issued by European countries and bondsissued by international financial entities.
As of 31 December 2017, securities with maturity less than 1 year (31 December 2018) had a balance sheet valueamounting to EUR 94.7m.
5.2 Detail by borrowers/issuers
No borrowers/issuers are residents of the Vatican City State. Line (a) Public entities of the item A.1 Debt securities is exclusively comprised of securities issued by Foreign Central
Public Administrations.
5.3 Financial assets held to maturity with specific hedges
The Institute did not hold financial assets held to maturity with specific hedges.
ANNUALREPORT 201758 |
2017 2016
FV FVVB
L1 L2 L3VB
L1 L2 L3
1. Debt securities
- structured
- other 246,168 259,547 558,956 583,392
2. Loans
Total 246,168 259,547 558,956 583,392
Key: BV = book value, FV = fair value
2017 2016
1. Debt securities
(a) Public entities 160,670 441,580
(b) Financial companies 67,338 88,033
(c) Insurance companies
(d) Non financial companies 18,160 29,343
(e) Other subjects
2. Loans
(a) Public entities
(b) Financial companies
(c) Insurance companies
(d) Non financial companies
(e) Other subjects
Total 246,168 558,956

item 60 Assets – due from BAnks
6.1 Detail by type
No asset impairment was recorded.Line A. Credits ex art. 14 (c) is comprised of different deposits from free deposits held with the Public Authorities of the
Holy See and Vatican City State with the statutory purpose of administering the assets owned by the Holy See (at present,APSA).
6.2 Credits with specific hedges
The Institute did not hold credits with specific hedges and it has no outstanding finance leases.
ANNUALREPORT 201759 |
2017 2016
FV FVVB
L1 L2 L3VB
L1 L2 L3
A. Credits ex art. 14 (c)
1. Fixed-term deposits 57,058 57,058 77,104 77,104
2. Outstanding repos
3. Others
B. Credits ex art. 14 (d)
1. Fixed-term deposits
2. Outstanding repos
3. Others
C. Due from banks
1. Loans
1.1. Current accounts and demand deposits 362,123 362,123 457,624 457,624
1.2. Outstanding repos 54,205 54,205 108,501 108,501
1.3. Other loans:
(a) Outstanding repos
(b) Finance lease
(c) Other
2. Debt securities
2.1. Structured securities
2.2 Other debt securities
Total 473,386 473,386 643,229 643,229
Key: BV = book value, FV = fair value

item 70 Assets – due from customers
7.1 Detail by type
Additional supporting information is provided in Part 5 “Information on risks and related hedging policies” of this doc-ument.
It is to be mentioned that the Institute is not authorized by the Autorità di Informazione Finanziaria to carry out theactivity of “lending” (cfr. art. l (l) (b) of the Law n.XVIII and art. 3 (24) (b) of the Regulation No. l), as credit activities on itsown. However, it is authorized to make “advances” that is to disburse funds to its clients and to a limited extent followingguarantee of future income (such as, for example, in the case of the advance of salary or pension paid by the Holy See or theGovernatorato of Vatican City) or guaranteed by financial assets of the same amount deposited by the clients at the Institute.
7.2 Detail by borrowers
ANNUALREPORT 201760 |
2017 2016
Book value Fair value Book value Fair value
Impaired ImpairedNon Purch- Other L1 L2 L3
NonPurch- Other L1 L2 L3impaired
asedimpaired
ased
A. Loans
1. Current accounts 11,253 11,253 8,424 27 8,451
2. Outstanding repos
3. Mortgages
4. Credit cards, personal loansand loans on salary
5. Finance leases
6. Factoring
7. Other loans 7,200 6,969 14,989 12,495 8,207 21,967
B. Debt securities
1. Structured securities
2. Other debt securities
Total 18,453 6,969 26,242 20,919 8,234 30,418
2017 2016
Non Impaired Non Impairedimpaired Purchased Other Impaired Purchased Other
1. Debt securities
(a) Public Entities
(b) Financial companies
(c) Insurance companies
(d) Non financial companies
(e) Other subjects
2. Loans to:
(a) Public Entities 11,238 8,290
(b) Financial companies
(c) Insurance companies
(d) Non financial companies 2,908 3,315
(e) Other subjects 4,307 6,969 9,314 8,234
Total 18,453 6,969 20,919 8,234

7.3 Credits with specific hedges
The Institute did not hold credits with specific hedges.
item 100 Assets – investment in suBsidiAries
10.1 Information on investment in subsidiaries
The Institute holds a financial investment in a real estate company, S.G.I.R. S.r.l., which is based in Italy and is 100%owned by the IOR.
10.2 Material investments in subsidiaries: book value, fair value and dividends received
The value of the investment in the real estate company S.G.I.R. S.r.l. was EUR 15.8 m.There was no change in the value of the investment during 2017 and no dividends were paid.The equity of S.G.I.R. S.r.l. as of 31 December 2017 was EUR 23.2m (2016: EUR 22.6m), including EUR 12.4m (2016:
EUR 12.4m) for a Fiscal Revaluation Reserve. As the investment is in an unlisted company, IOR has not carried out the measurement of the fair value. In 2016, S.G.I.R. S.r.l. presented the “Social Report” to highlight the social benefits produced by the management of real
estate assets that are not exclusively focused on profit. In fact, S.G.I.R. S.r.l. grants some properties for rent with subsidizedrent or on loan for free use to support institutions with a social purpose, as notably discoled in the Chapter 2. OperationalInformation in the Management Report.
10.3 Material investment in subsidiaries: financial information
ANNUALREPORT 201761 |
A. Subsidiariesentities
S.G.I.R. S.r.l. 179 690 25,802 3,428 46 1,843 -19 1,032 630 630 630
B. Entitiessubject to joint control
C. Entities subject to significant influence
Compre-hensive income (3) = (1) +
(2)
Other incomeitems
after taxes(2)
Profit (loss)
for the year(1)
Profit (loss)
from groupsof assetsbeing
disposedafter taxes
Profit (loss) from currentoperationsafter taxes
Profit(loss) from current
operationsbeforetaxes
Value adjustments
and write-backs
on tangible and
intangibleassets
Financial assets
Nonfinancialassets
Financial liabilities
Non financialliabilities
Total income
Interestmargin
Cash andcash
equivalents

item 110 Assets –tAngiBle Assets
11.1 Tangible assets in-use: detail of the assets measured at cost
11.4 Tangible assets held for investment: detail of the assets measured at fair value
ANNUALREPORT 201762 |
2017 2016
1. Owned assets
(a) land
(b) buildings
(c) furniture 1 1
(d) electronic equipment 144 115
(e) other
2. Assets acquired under finance lease
(a) land
(b) buildings
(c) furniture
(d) electronic equipment
(e) other
Total 145 116
2017 2016
FV FVVB
L1 L2 L3VB
L1 L2 L3
1. Owned assets
(a) land
(b) buildings 3,102 3,102 2,980 2,980
2. Assets acquired under finance lease
(a) land
(b) buildings
Total 3,102 3,102 2,980 2,980
Key: BV = book value, FV = fair value

11.5 Tangible assets in- use: annual changes
All tangible assets in-use were measured at cost.
ANNUALREPORT 201763 |
Land Buildings Furniture Electronic Other Totalequipment
A. Opening balance 2,629 4,448 32 7,109
A.1 Net total adjustments (2,628) (4,333) (32) (6,993)
A.2 Net opening balance 1 115 116
B. Increases:
B.1 Purchases 98 98
B.2 Capitalised improvement costs
B.3 Write-backs
B.4 Positive fair value differences recognized in
a) Net Equity
b) Income Statement
B.5 Positive foreign exchange differences
B.6 Transfer from investment property
B.7 Other changes
C. Decreases:
C.1 Sales
C.2 Depreciation (69) (69)
C.3 Impairment losses recognized in:
a) Net Equity
b) Income Statement
C.4 Negative fair value differences recognized in
a) Net Equity
b) Income Statement
C.5 Negative foreign exchange differences
C.6 Transfer to:
a) investment property
b) assets being disposed
C.7 Other changes
D. Net closing balance 2,629 4,546 32 7,207
D.1 Total net adjustments (2,628) (4,402) (32) (7,062)
D.2 Gross closing balance 1 144 145

11.6 Tangible assets held for investment: annual changes
All the tangible assets held for investment are measured at fair value.The item includes 5 investment properties received in the past through donations, totaling EUR 3.1m. The item in-
creased from 31 December 2016 due to an increase in fair values.The Institute has surveys performed by a qualified independent expert.As of 31 December 2017, the properties did not generate any rental income, because the Institute signed a lease
agreement with its subsidiary S.G.I.R. S.r.l. for the use of properties for free. During 2017, S.G.I.R. S.r.l. earns EUR 57,000as rental income on these properties.
item 120 Assets – intAngiBle Assets
12.1. Detail by asset
Intangible assets consist of software programs and costs incurred to implement them.
ANNUALREPORT 201764 |
Total
Land Buildings
A. Opening balance 2,980
B. Increases:
B.1 Purchases
B.2 Capitalised improvement costs
B.3 Positive fair value differences 136
B.4 Write-backs
B.5 Positive foreign exchange differences
B.6 Transfer from tangible assets for functional use
B.7 Other changes
C. Decreases
C.1 Sales
C.2 Depreciation
C.3 Negative fair value differences (14)
C.4 Impairment losses
C.5 Negative foreign exchange differences
C.6 Transfer to other assets
a) tangible assets for functional use
b) current assets being disposed
C.7 Other changes
D. Closing balance 3,102
2017 2016
Definite life Indefinite life Definite life Indefinite life
A.1. Goodwill
A.2. Other intangible assets
A.2.1 Assets carried at cost:
(a) intangible assets generated internally
(b) other assets 871 1,044
A.2.2 Assets carried at fair value
(a) intangible assets generated internally
(b) other assets
Total 871 1,044

12.2 Annual changes
Intangible assets are carried at cost.The IOR does not have internally generated intangible assets.
ANNUALREPORT 201765 |
Other intangible assets Other intangible assets:generated internally other
Goodwill DEF INDEF DEF INDEF Total
A. Opening balance 7,081 7,081
A.1 Total net adjustments (6,037) (6,037)
A.2 Net opening balance 1,044 1,044
B. Increases
B.1 Purchases 316 316
B.2 Increases of intangible assets generated internally
B.3 Write-backs
B.4 Positive fair value differences recognized in
- Net Equity
- Income Statement
B.5 Positive foreign exchange differences
B.6 Other changes
C. Decreases
C.1 Sales
C.2 Impairment losses
- Depreciation (489) (489)
- Write downs recognized in
+ Net Equity
+ Income Statement
C.3 Negative fair value differences recognized in
- Net Equity
- Income Statement
C.4 Transfer to non-current assets being disposed
C.5 Negative foreign exchange differences
C.6 Other changes
D. Net closing balance 7,397 7,397
D.1 Total net adjustments (6,526) (6,526)
E. Gross closing balance 871 871

item 150 Assets - other Assets
15. Other Assets
Gold is mainly deposited with the U.S. Federal Reserve, while medals and precious coins are kept in the IOR vaults. Gold is carried at the lower of cost or net estimated recoverable amount. Medals and precious coins are appraised on the basis of their weight and the quality of gold and silver they contain,
carried at the lower of cost or net estimated recoverable amount.Gains and losses arising from disposal of gold, medals and precious coins are recognized in the Income Statement,
item 80 “Net trading result”. Losses arising from evaluation at the lower of cost or net estimated recoverable amount, aswell as reversals of the previously recognized loss are recognized in the Income Statement, item 190 “Other operatingincome (expense)”.
Also included in Other Assets are commission from asset management services not yet received at the closing dateof the financial statements for EUR 6.2m. These commissions, pertaining to the second half of 2017, were collected atthe beginning of 2018.
ANNUALREPORT 201766 |
2017 2016
1.Gold 22,392 22,394
2. Medals and precious coins 10,536 10,490
3. Securities sold not settled 92
4. Commission from asset management services not yet received 6,225 6,463
5. Client Tax advances 610
6. Deposit for guarantees for credit cards transactions 702 799
7. Sundry debtors 451 833
8. Prepayments 494 980
Total 41,502 41,959

LIABILITIES
item 10 liABilities - due to BAnks
1.1 Detail by product
Due to banks include amounts due to the Holy See and Vatican City State Public Authorities, the statutory purposeof which is to administer the Holy See’s proprietary assets (at present APSA).
Amounts due as of 31 December 2017 was EUR 4.1m comprised payment orders to be paid in 2 days.
1.2 Subordinated liabilities
There are no subordinated liabilities recognized in this item.
ANNUALREPORT 201767 |
2017 2016
1. Due to Public Authorities
of which:
- Public Authorities ex art. 24 (c)
2. Due to foreign Public Authorities
of which:
- Public Authorities ex art. 24 (d)
3. Due to banks
3.1. Current accounts and demand deposits 4,096
3.2. Fixed-term deposits
3.3. Loans
3.3.1. Reverse repos
3.3.2. Other
3.4. Amounts due under repurchase agreements of own equity instruments
3.5. Other liabilities
Total 4,096
Fair value - level 1 4,096
Fair value - level 2
Fair value - level 3
Total fair value 4,096
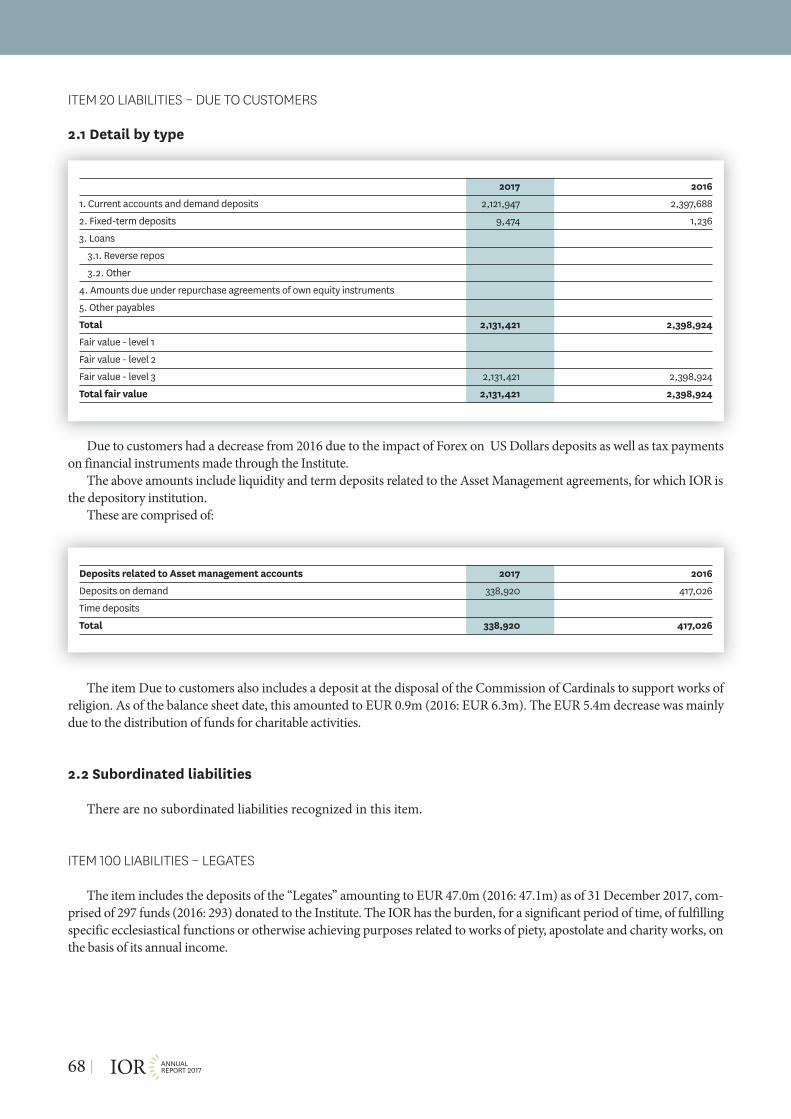
item 20 liABilities – due to customers
2.1 Detail by type
Due to customers had a decrease from 2016 due to the impact of Forex on US Dollars deposits as well as tax paymentson financial instruments made through the Institute.
The above amounts include liquidity and term deposits related to the Asset Management agreements, for which IOR isthe depository institution.
These are comprised of:
The item Due to customers also includes a deposit at the disposal of the Commission of Cardinals to support works ofreligion. As of the balance sheet date, this amounted to EUR 0.9m (2016: EUR 6.3m). The EUR 5.4m decrease was mainlydue to the distribution of funds for charitable activities.
2.2 Subordinated liabilities
There are no subordinated liabilities recognized in this item.
item 100 liABilities – legAtes
The item includes the deposits of the “Legates” amounting to EUR 47.0m (2016: 47.1m) as of 31 December 2017, com-prised of 297 funds (2016: 293) donated to the Institute. The IOR has the burden, for a significant period of time, of fulfillingspecific ecclesiastical functions or otherwise achieving purposes related to works of piety, apostolate and charity works, onthe basis of its annual income.
ANNUALREPORT 201768 |
2017 2016
1. Current accounts and demand deposits 2,121,947 2,397,688
2. Fixed-term deposits 9,474 1,236
3. Loans
3.1. Reverse repos
3.2. Other
4. Amounts due under repurchase agreements of own equity instruments
5. Other payables
Total 2,131,421 2,398,924
Fair value - level 1
Fair value - level 2
Fair value - level 3 2,131,421 2,398,924
Total fair value 2,131,421 2,398,924
Deposits related to Asset management accounts 2017 2016
Deposits on demand 338,920 417,026
Time deposits
Total 338,920 417,026

item 110 liABilities – other liABilities
The item “Inheritances to be settled” represents the property values of deceased donors pending resolution of inheritanceissues.
The amount of EUR 1.7m (2016: EUR 1.7m) reported under“ Liabilities for guarantees issued and commitmentstowards third parties” is due to guarantees in addition to the commitments to third parties to disburse funds whose cash outis uncertain (see paragraph 13.1 Guarantees and commitments).
Funds for charitable contributions are comprised of the Fund for Holy Masses and Fund for Missionary Activities.
Fund for Missionary Activities
The Fund for Missionary Activities is used to distribute contributions to congregations and institutions that operate mis-sionary and charitable activities. The most common activities are the direct disbursement of contributions to student priestsfor the completion of university studies, financial aid for destitute persons or families (reported by Parishes or by individualpriests), long-distance adoptions, specific help for missionary and charity work or aid to families that have lost everything asa result of natural disasters. It is mainly funded by small donations with a commitment to execute Missionary activities.Donations and distributions are recorded directly into the Fund’s account. Distributions to the beneficiaries are approved bya Committee comprised of the Prelate, the Client Relationship Manager, and the Head of Operation, who took the place ofthe “Aggiunto al Direttore” in January 2018.
Fund for Holy Masses
The Fund for Holy Masses is used to distribute contributions to priests for Holy Masses. It is financed through smalldonations with a commitment to the Holy Masses. Donations and distributions are directly recorded into the Fund’saccount. Distributions to the priests are approved by a Committee comprised of the Prelate, the Client Relationship Man-ager, and the Head of Operation, who took the place of the “Aggiunto al Direttore” in January 2018.
The detail of Funds for charitable contributions is as follows:
ANNUALREPORT 201769 |
Other liabilities 2017 2016
Inheritances to be settled 4,023 6,384
Invoices to be received 4,748 4,515
Outstanding checks 659 1,070
Remunerations to be paid 1,055 914
Other sundry creditors 75 908
Funds for charitable contributions 3,353 3,220
Liabilities for guarantees issued and commitments towards third parties 1,699 1,699
Securities purchased not settled
Total 15,612 18,710
Funds for charitable 2017 2016
A. Fund for Missionary Activities 21 156
1. Balance at 1 January 156 239
2. Donations received 97 86
3. Distributions for Missionary Activities (232) (169)
B. Fund for Holy Masses 3,332 3,064
1. Balance at 1 January 3,064 3,064
2. Donations received 445 83
3, Distributions for Holy Masses (177) (83)
Total 3,353 3,220
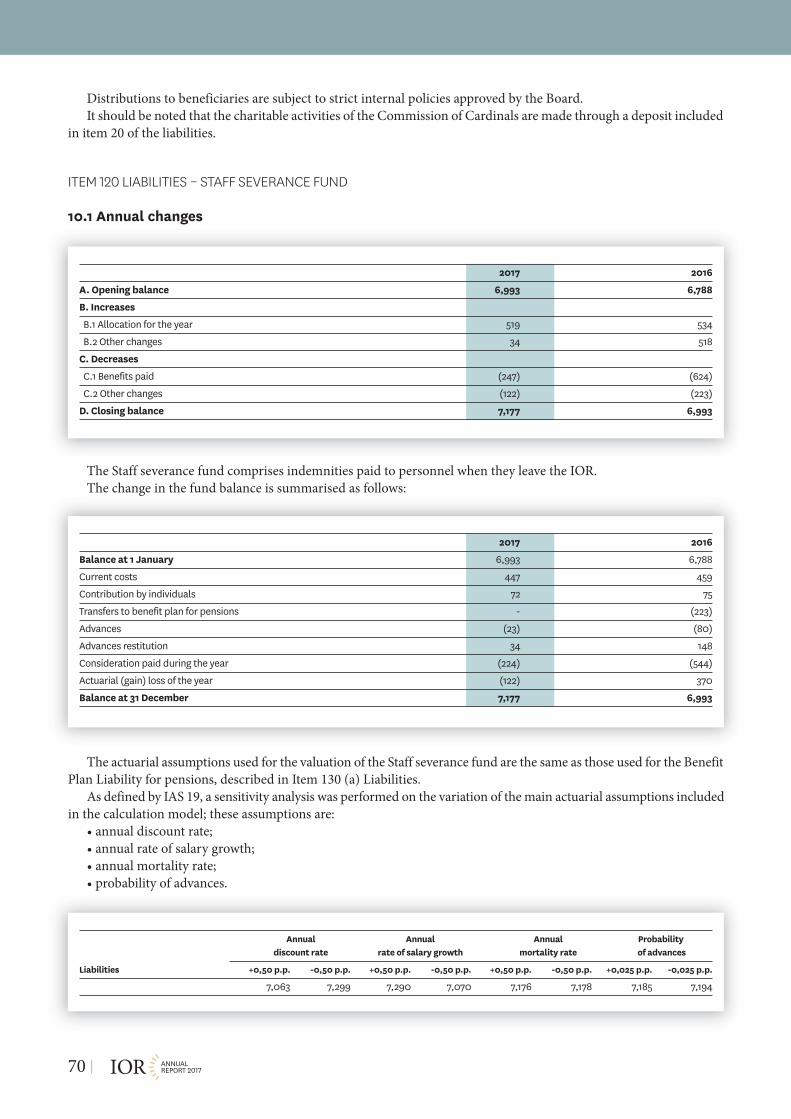
Distributions to beneficiaries are subject to strict internal policies approved by the Board.It should be noted that the charitable activities of the Commission of Cardinals are made through a deposit included
in item 20 of the liabilities.
item 120 liABilities – stAff severAnce fund
10.1 Annual changes
The Staff severance fund comprises indemnities paid to personnel when they leave the IOR.The change in the fund balance is summarised as follows:
The actuarial assumptions used for the valuation of the Staff severance fund are the same as those used for the BenefitPlan Liability for pensions, described in Item 130 (a) Liabilities.
As defined by IAS 19, a sensitivity analysis was performed on the variation of the main actuarial assumptions includedin the calculation model; these assumptions are:
• annual discount rate; • annual rate of salary growth; • annual mortality rate; • probability of advances.
ANNUALREPORT 201770 |
2017 2016
A. Opening balance 6,993 6,788
B. Increases
B.1 Allocation for the year 519 534
B.2 Other changes 34 518
C. Decreases
C.1 Benefits paid (247) (624)
C.2 Other changes (122) (223)
D. Closing balance 7,177 6,993
2017 2016
Balance at 1 January 6,993 6,788
Current costs 447 459
Contribution by individuals 72 75
Transfers to benefit plan for pensions - (223)
Advances (23) (80)
Advances restitution 34 148
Consideration paid during the year (224) (544)
Actuarial (gain) loss of the year (122) 370
Balance at 31 December 7,177 6,993
Annual Annual Annual Probabilitydiscount rate rate of salary growth mortality rate of advances
Liabilities +0,50 p.p. -0,50 p.p. +0,50 p.p. -0,50 p.p. +0,50 p.p. -0,50 p.p. +0,025 p.p. -0,025 p.p.
7,063 7,299 7,290 7,070 7,176 7,178 7,185 7,194

10.2 Other information
Please refer to the paragraphs regarding the accounting policies for more information on the calculation of employeetermination indemnities.
The portion of employee gross salaries retained by the Institute is 1.5%.No payments were made to the Vatican Pension Plan.Funds were managed by the IOR Treasury department.
item 130 liABilities – AllowAnces for risks And chArges
11.1 Detail by type
11.2 Annual changes
ANNUALREPORT 201771 |
2017 2016
1. Post employment benefits for pensions 133,335 121,088
2. Other allowances for risks and charges
2.1 legal disputes
2.2 staff expenses
2.3 other 1,212 3,500
Total 134,547 124,588
Provision for pension and similar obligations Other provisions Total
A. Opening balance 121,088 3,500 124,588
B. Increases
B.1 Provision for the year 4,133 4,133
B.2 Time value changes
B.3 Changes due to discount rate variations 11,198 11,198
B.4 Other changes
C. Decreases
C.1 Utilization in the year (3,084) (2,288) (5,372)
C.2 Changes due to discount rate variations
C.3 Other changes
D. Closing balance 133,335 1,212 134,547

11.3 Pension plan liabilities defined benefit obligations
The Provision for pension and similar obligations fund comprises the Pension plan of the IOR employees.More in detail, the changes in the Plan concern the following items:
The actuarial valuation of the defined benefit plan liability was performed using the following assumptions:
The Current Service Cost is the actuarial present value of benefits due to employees for services rendered during theperiod.
The Interest Cost is the increase in the present value of the obligation from the passage of time and it is proportional tothe discount rate used in the assessment of the previous year’s liabilities.
The Actuarial gain/loss is the change in the liability in the present year arising from:• the effect of the differences between the previous actuarial assumptions and what has actually occurred;• the effect of the changes in actuarial assumptions.The results are recognized directly to Equity in a specific reserve named “Valuation reserves” “Post-employment benefit
actuarial gain (loss) reserves” and the actuarial gain or loss is recorded in Other Comprehensive Income.For Staff severance fund and Provisions for pensions and similar obligations, in 2017, the Institute recognized an actuar-
ial loss of EUR 11.2m (2016: loss of EUR 13.3m) in Other Comprehensive Income. Consequently, change in the “Valuationreserves” (item 140 Equity) was a loss of EUR 57.1m (2016: EUR -46m); the increased loss compared to the prior year is dueto the decrease in the discount rate to 1.19% in 2017 from 1.43% in 2016.
A total of 102 employees are active and contribute to the Pension plan (2016:102). A total of 74 former employees are inretirement and benefit from the plan (2016: 74).
As defined by IAS 19, a sensitivity analysis was performed on the variation of the main actuarial assumptions included inthe calculation model; these assumptions are:
• annual discount rate;• annual rate of salary growth;• annual inflation rate;• annual mortality rate.
ANNUALREPORT 201772 |
2017 2016
Opening balance 121,088 108,338
Current Service cost 703 607
Interest cost 1,685 2,031
New subscribers cost 1,649
Contribution by individuals 96 93
Transfer from staff severance fund 223
Pensions paid during the year (3,084) (3,109)
Transfer out
Actuarial (gain) loss of the year 11,198 12,905
Closing balance 133,335 121,088
2017 2016
Annual inflation rate 2.00% 2.00%
Annual discount rate 1.19% 1.43%
Annual rate for revaluation of pension 2.00% 2.00%
Annual rate of real increase salary 2.01% 2.35%

11.4 Other information
Please refer to the paragraphs regarding the accounting policies for more information on the calculation of the pensionfund.
The portion of employee gross salaries retained by the Institute is 6%.No payments were made to the Vatican Pension Plan.Funds were managed by the IOR Treasury department.
11.5 Other provisions
As of 31 December 2017 the Institute, based on the analysis carried out until now with the help of legal advisors, hasalmost reached the final estimate of the outstanding liability for which it has already recorded the cash outflow. Pending theformal and definitive conclusion of this issue, IOR has maintained on its books a residual provision of EUR 1.2m, includedin item 130 b “Provisions for risks and charges” on line b “Other Funds” of the Balance Sheet. As this represents an estimatebased on critical assumptions, upon the conclusion of future events, actual results may differ from what is expected.
The relative content of the item was explained in the paragraph 1.1.4 Other aspects - Critical accounting estimates andjudgements, Part 1 Accounting policies.
item 160 170 equity – reserves
12.1 Capital
Capital, as a separate component of Equity, represents a permanent endowment that cannot be reduced or distributed,except in case of cessation or liquidation of the entity.
During 2017, no changes were recorded in Capital balance, amounting to EUR 300m.Securities and liquid funds made up the Capital; in detail, deposits to APSA, other liquid assets, supranational bonds and
governative bonds with high quality credit rating.
12.2 Reserves
The equity balance is comprised of two different reserves, Available and Unavailable reserves.Unavailable Reserves are earning reserves designed to further strengthen the Institute’s Equity and long-term stability.Available Reserves are earning reserves representing earnings that could potentially fulfill a “stabilization” function, sub-
ject to a resolution of the Commission of Cardinals.During 2017, no changes were recognized in Unavailable Reserves, amounting to EUR 100m, and Available Reserves,
amounting to EUR 282m.Unavailable reserves are comprised of securities, properties and precious metals. In detail, these reserves are comprised
of gold bars, medals and coins, investment in subsidiary (S.G.I.R. S.r.l.), real estate properties and liquid financial instru-ments traded on regulated markets.
The Available Reserve is comprised of securities, representing liquid financial instruments traded on regulated markets.
ANNUALREPORT 201773 |
Annual Annual Annual Mortalitydiscount rate rate of salary growth inflation rate rate
Liabilities +0,50 p.p. -0,50 p.p. +0,50 p.p. -0,50 p.p. +0,50 p.p. -0,50 p.p. +0,025 p.p. -0,025 p.p.
120,280 145,756 132,813 131,391 145,704 120,211 131,717 132,471

13 Additional information
13.1 Guarantees and commitments
At the balance sheet date, the Institute has a commitment of EUR 4m of uncertain use issued in favor of third par-ties.
As at 31 December 2017, the IOR has one guarantee issued before the year 2000 and covered by assets held in cus-tody.
No new guarantees were issued in 2017.The guarantees were initially recognized at their nominal value, which is their fair value. In subsequent periods, the
guarantees are reported at the amount determined in accordance with IAS 37 “Provisions, Contingent Liabilities andContingent Assets”.
ANNUALREPORT 201774 |
2017 2016
1) Financial guarantees given to
a) Banks
b) Customers 27 42
2) Commercial guarantees given to
a) Banks
b) Customers
3) Irrevocable commitments to disburse funds to
a) Banks
b) Customers
i) cash out certain
ii) cash out uncertain 4,000 4,000
4) Underlying commitments on credit derivatives: sales of protection
5) Assets pledged as collateral for third-party commitments
6) Other commitments
Total 4,027 4,042

13.4 Asset Management and Brokerage on behalf of third parties
Assets under Management consist mainly of client-owned securities held at the IOR for management purposes. Invest-ment decisions are made by the IOR on the basis of portfolio management mandates signed with its clients.
Assets under Management agreements are valued using the mark-to-market method. They include the total value ofportfolios as well as, liquid and term deposits. Accruals are also included, both on securities and on liquid and term deposits.The IOR is the depository of liquid and term deposits, amounting to EUR 338.9m (2016: EUR 417.2m), as disclosed in item20 Liabilities “Due to customers”.
Assets under Custody mainly include client-owned securities held at the IOR for custodial purposes. The clients make allinvestment decisions and the IOR has no discretionary power to manage these assets, provided that such decisions are inaccordance with the role and mission of the Institute.
Assets under custody agreements are also valued based on current bid prices, using the mark-to-market method. Theyalso include accruals on interest to be received on debt securities.
ANNUALREPORT 201775 |
2017 2016
1. Trading on behalf of customers
(a) purchases
(i) settled 122,935 129,087
(ii) to be settled
(b) sales
(i) settled 93,901 84,530
(ii) to be settled
2. Portfolio management (assets management)
(a) individual 2,957,652 3,110,929
(b) collective
3. Custody and administration of securities
(a) third party security held in deposit: related to depositary bank activities (excluding portfolio management)
(i) security issued by the entity that prepare the financial statement
(ii) other securities
(b) third party securities held in deposit: other (excluding portfolio management)
(i) security issued by the entity that prepare the financial statement
(ii) other securities
(c) third party securities deposited with third parties 474,594 554,763
(d) proprietary portfolio securities deposited with third parties 2,380,889 2,508,160
4. Other operations
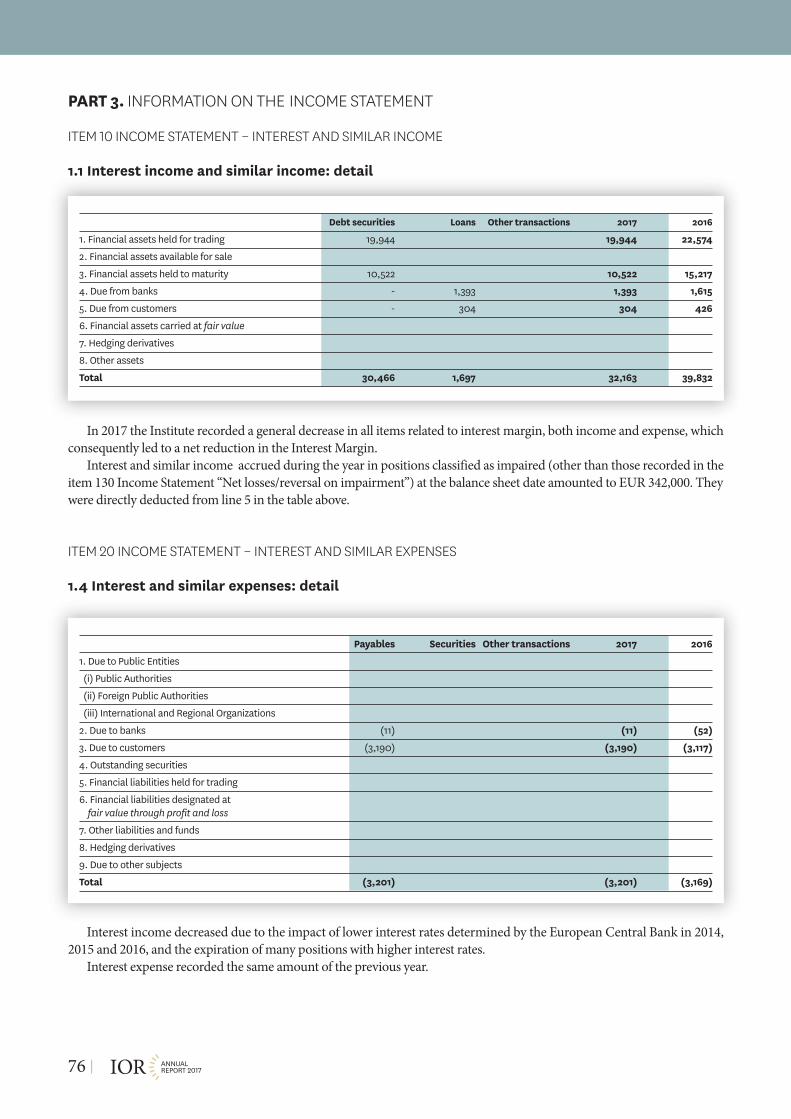
PART 3. informAtion on the income stAtement
item 10 income stAtement – interest And similAr income
1.1 Interest income and similar income: detail
In 2017 the Institute recorded a general decrease in all items related to interest margin, both income and expense, whichconsequently led to a net reduction in the Interest Margin.
Interest and similar income accrued during the year in positions classified as impaired (other than those recorded in theitem 130 Income Statement “Net losses/reversal on impairment”) at the balance sheet date amounted to EUR 342,000. Theywere directly deducted from line 5 in the table above.
item 20 income stAtement – interest And similAr expenses
1.4 Interest and similar expenses: detail
Interest income decreased due to the impact of lower interest rates determined by the European Central Bank in 2014,2015 and 2016, and the expiration of many positions with higher interest rates.
Interest expense recorded the same amount of the previous year.
ANNUALREPORT 201776 |
Debt securities Loans Other transactions 2017 2016
1. Financial assets held for trading 19,944 19,944 22,574
2. Financial assets available for sale
3. Financial assets held to maturity 10,522 10,522 15,217
4. Due from banks - 1,393 1,393 1,615
5. Due from customers - 304 304 426
6. Financial assets carried at fair value
7. Hedging derivatives
8. Other assets
Total 30,466 1,697 32,163 39,832
Payables Securities Other transactions 2017 2016
1. Due to Public Entities
(i) Public Authorities
(ii) Foreign Public Authorities
(iii) International and Regional Organizations
2. Due to banks (11) (11) (52)
3. Due to customers (3,190) (3,190) (3,117)
4. Outstanding securities
5. Financial liabilities held for trading
6. Financial liabilities designated at fair value through profit and loss
7. Other liabilities and funds
8. Hedging derivatives
9. Due to other subjects
Total (3,201) (3,201) (3,169)

item 40 income stAtement – fee And commission income
2.1 Fee and commission income: detail
The Fee and Commission income recorded the same amount of the previous year.
2.2 Fee and commission income: distribution channels of products and services
All the IOR products and services are offered at IOR locations in Vatican City State.
ANNUALREPORT 201777 |
2017 2016
a) Guarantees given/received 1 1
b) Credit derivatives
c) Administration, brokerage and consultancy services:
1. trading in financial instruments 711 654
2. trading in currencies
3. portfolio management
3.1 individual 12,540 12,483
3.2 collective
4. Custody and administration of securities 93 113
5. Custodian bank
6. Securities placement
7. Receipt and transmission of orders activity
8. Consulting
8.1 investments
8.2 financial structure
9. Distribution of third-party services
9.1 portfolio management
9.1.1 individual
9.1.2 collective
9.2 insurance products
9.3 other products
d) collection and payment services 2,226 2,196
e) servicing of securitization operations
f) factoring services
g) rate and tax collection office services
h) multilateral trading systems management
i) current account keeping and management 340 369
j) other services 16 21
Total 15,927 15,837

item 50 income stAtement – fee And commission expense
2.3 Fee and commission expense: detail
The increase in Fee and commission expense was mainly due to the fee and commissions charged by correspondentbanks on current accounts of the Institute as charges for the management of liquidity (+145%); while the custody andadministration fees for securities slightly decrease.
item 70 income stAtement – dividends And similAr income
3 Dividends and similar income: detail
Dividends received in 2017 for financial assets held for trading were EUR 0.9m (2016: EUR 1.7m), recording a strongdecrease, in line with the reduction of equites held in the category.
Of this, income from UCI units, which relates to dividends distributed by investment funds, decreased by 50%.In 2017, the Institute received dividends of EUR 237,000 from investment securities recorded as financial assets available
for sale (2016: EUR 435,000).
ANNUALREPORT 201778 |
2017 2016
a) Guarantees given/received
b) Credit derivatives
c) Administration, brokerage and consultancy services:
1. trading in financial instruments (114) (83)
2. trading in currencies
3. portfolio management
3.1 own portfolio
3.2 third-party portfolio
4. Custody and administration of securities (1,434) (1,613)
5. Placement of financial instruments
6. Sales of financial instrument, products and services through other outlets
d) Collection and payment services (648) (761)
e) Administration and management of current accounts (1,427) (571)
f) Other services (1) (1)
Total (3,623) (3,029)
2017 2016
Dividends Income Dividends Incomefrom UCI from UCI
A. Financial assets held for trading 508 400 860 812
B. Financial assets available for sale 237 435
C. Financial assets carried at fair value through profit and loss
D. Investment in subsidiaries
Total 745 400 1,295 812

item 80 income stAtement – net income from trAding Activities
4. Net income from trading activities: detail
ANNUALREPORT 201779 |
2017
Gains Profit from Losses Losses from Nettrading trading activities income
(A) activities (B) (C) (D) [(A+B) - (C+D)]
1. Financial assets held for trading
1.1 Debt securities 7,886 2,267 8,673 1,480
1.2 Equity securities 2,045 1,749 281 3,513
1.3 UCI units 258 134 1,092 (700)
1.4 Loans
1.5 Other 3 3
2. Financial liabilities held for trading
2.1 Debt securities
2.2 Payables
2.3 Other
3. Financial assets and liabilities: exchange differences 86 3,727 582 3,231
4. Derivatives
4.1 Financial derivatives
- On debt securities and interest rates
- On equity securities and stock indices
- On currencies and gold
- Other
4.2 Credit derivatives
Total 10,275 7,880 10,628 7,527
2016
Gains Profit from Losses Losses from Nettrading trading activities income
(A) activities (B) (C) (D) [(A+B) - (C+D)]
1. Financial assets held for trading
1.1 Debt securities 6,167 1,429 6,041 1,555
1.2 Equity securities 1,603 1,509 94
1.3 UCI units 1,693 14,445 (12,752)
1.4 Loans
1.5 Other 126 126
2. Financial liabilities held for trading
2.1 Debt securities
2.2 Payables
2.3 Other
3. Financial assets and liabilities: exchange differences 1,529 470 5 1,994
4. Derivatives
4.1 Financial derivatives
- On debt securities and interest rates
- On equity securities and stock indices
- On currencies and gold
- Other
4.2 Credit derivatives
Total 10,992 2,025 22,000 (8,983)

Below is a summary of the net trading results in 2017 compared to 2016.In 2017, debt securities recognized a gain of EUR 1.5m compared to a gain of EUR 1.6m in 2016. Realized gain from
trading activity was EUR 2.3m compared to a gain of EUR 1.4m in 2016, and the unrealized loss was EUR 787,000 com-pared to a gain of EUR 126,000 in 2016.
In 2017, equity securities recognized a gain of EUR 3.5m compared to a gain of EUR 94,000 in 2016. A realized profit of1.7m was recognized compared to no realized profit (loss) in 2016, while unrealized gain was EUR 1.8m, compared to EUR94,000 in 2016.
In 2017, UCI units recognized a loss of EUR 700,000 compared to a gain in 2016 of EUR 12.8m. A realized profit of134,000 was recorded in 2017 compared to no realized gain in 2016, while unrealized loss was EUR 834,000 compared to anunrealized gain of EUR 12.8m in 2016.
Line 1.5 “Financial assets held for trading: other” includes gains (losses) from currency trade, gold and other preciousmetals, recognizing a gain of EUR 3,000 in 2017 compared to EUR 126,000 in 2016 (realized).
“Financial assets and liabilities: exchange differences” recognized a gain of EUR 3.2m compared to a profit of EUR 2m in2016, comprised of EUR 3.7m realized profit in 2017 compared to EUR 470,000 in 2016 and unrealized loss of EUR 496,000in 2017 compared to profit of EUR 1.5m in 2016.
item 100 income stAtement - profit (loss) on disposAl or repurchAse
6. Profit (loss) on disposal or repurchase: detail
ANNUALREPORT 201780 |
2017 2016
Profit Losses Net income Profit Losses Net income
Financial assets
1. Due from banks
2. Due from customers
3. Financial assets available for sale
3.1 Debt securities
3.2 Equity securities 1,386 1,386 1,518 (19) 1,499
3.3 UCI units
3.4 Loans
4. Financial assets held to maturity
Total assets 1,386 1,386 1,518 (19) 1,499
Financial liabilities
1. Due to banks
2. Due to customers
3. Outstanding securities
Total liabilities

item 130 income stAtement – net losses/reversAl on impAirment
8.1 Net impairment losses on loans: detail
8.2 Net impairment losses on financial assets available for sale: detail
8.4 Net impairment losses on other financial assets: detail
ANNUALREPORT 201781 |
Value adjustments (1) Write-backs (2)
Specific Specific PortfolioPort-2017 2016
Derecognition Otherfolio
A B A B (1)+(2) (1)+(2)
1. Due from banks
- Loans
- Debt securities
2. Due from customers
Purchased impaired loans
- Loans
- Debt securities
Other receivables
- Loans (45) (725) 259 119 (392) 353
- Debt securities
Total (45) (725) 259 119 (392) 353
Value adjustments (1) Write-backs (2)
Specific Specific
2017 2016Derecognition Other A B (1)+(2) (1)+(2)
1. Debt securities
2. Equity securities (148)
3. UCI units
4. Loans to banks
5. Loans to customers
Total (148)
Value adjustments (1) Write-backs (2)
Specific Specific PortfolioPort-2017 2016
Derecognition Otherfolio
A B A B (1)+(2) (1)+(2)
1. Guarantees given (138)
2. Credit derivatives
3. Commitments to lend funds
4. Other operations
Total (138)

item 150 income stAtement – AdministrAtive expenses
9.1 Personnel expenses: detail
9.2 Average number of employees by categories
Reimbursement of expenses for employees of the institutions and organizations of the Holy See and the Vatican CityState placed at the Institute.
ANNUALREPORT 201782 |
2017 2016
A. Staff
1. Wages and salaries (5,022) (5,078)
2. Social security charges
3. Termination indemnities
4. Supplementary benefits (630) (630)
5. Provisions for termination indemnities (447) (459)
6. Provisions for post employment benefits
(a) defined contribution plans
(b) defined benefit plans (4,037) (2,638)
7. Payments to external pension plans
(a) defined contribution plans
(b) defined benefit plans
8. Other benefits in favor of employees (241) (546)
B. Current Personnel with contracts pursuant to ex art. 10 (1)
1. letter (b)
2. letter (c)
3. letter (d)
C. Fees and charges for:
1. Board of Superintendence (668) (504)
2. Directorate (308) (299)
3. Revisori (88) (91)
D. Early retirement cost
E. Recovery of expenses for employees seconded to other entities
F. Reimbursement of expenses for employees of the institutions and organizations of the Holy See and the Vatican City State placed at the Institute.
Total (11,441) (10,245)
Type Total Managers Officials Staff
Average number 102 4 5 93

9.3 Post employment defined benefit plans: costs and revenues
9.5 Professional service expenses: detail
9.6 Other administrative expenses: detail
item 160 income stAtement – net provision for risks And chArges
Detailed information is provided in Item 130 (b) Liabilities.
ANNUALREPORT 201783 |
Post employment defined benefit plans: costs 2017 2016
Current Service cost of internal Pension Plan (703) (607)
Interest cost of internal Pension Plan (1,685) (2,031)
New positions cost (1,649)
Post employment costs: contribution to Vatican Pension Plan (630) (630)
Total Costs (4,667) (3,268)
Post employment defined benefit plans: revenues
Total (4,667) (3,268)
2017 2016
A. Professional services expenses
1. Legal services (1,940) (2,437)
2. Directional consultants (149) (718)
3. Technical consultants (200) (288)
4. Operational consultants (196) (342)
5. Translational services (49) (56)
B. Expenses related to works contract
1. ex art. 10 (1) (a)
2. ex art. 11 (1)
C. Expenses related to outsourcing contracts
D. Expenses related to independent auditors (121) (121)
Total (2,655) (3,962)
2017 2016
1. Software maintenances (1,688) (1,441)
2. Other maintenances (440) (800)
3. Information providers (376) (379)
4. AIF contribution (200) (346)
5. Other expenses (1,927) (1,913)
Total (4,631) (4,879)

item 170 income stAtement – net vAlue Adjustments to/recoveries on tAngiBle Assets
11. Net value adjustments to/recoveries on tangible assets: detail
item 180 income stAtement – net vAlue Adjustments to/recoveries on intAngiBle Assets
12. Net value adjustments to/recoveries on intangible assets: detail
item 190 income stAtement – other operAting income (expense)
13.1 Other operating income (expense): detail
ANNUALREPORT 201784 |
2017 2016
Depre- Impairment Recoveries Net Depre- Impairment Recoveries Netciation losses income ciation losses income
(a) (b) (c) (a+b-c) (a) (b) (c) (a+b-c)
A. Tangible assets
A.1 Owned assets
- Functional use (69) (69) (83) (83)
- For investment
A.2 Acquired under finance lease
- Functional use
- For investment
Total (69) (69) (83) (83)
2017 2016
Depre- Impairment Recoveries Net Depre- Impairment Recoveries Netciation losses income ciation losses income
(a) (b) (c) (a+b-c) (a) (b) (c) (a+b-c)
A. Intangible assets
A.1 Owned assets
- Generated internallyby the Institute
- Other (489) (489) (683) (683)
A.2 Acquired underfinance lease
Total (489) (489) (683) (683)
2017 2016
A. Income 459 736
Extraordinary income 459 558
Recovery of amounts for gold and precious metals 178
Closure of past years issue
B. Expenses (295) (729)
1. Operating losses (278) (715)
2. Extraordinary expenses (5) (14)
3. Impairment of amounts for gold and precious metals (12)
Total 164 7

item 220 income stAtement – net result of fAir vAlue vAluAtion of tAngiBle And intAngiBle Assets
15. Net result of fair value valuation of tangible and intangible assets: detail
ANNUALREPORT 201785 |
Exchange differences
2016 Revaluations Impairment Positive Negative Netincome
(a) (b) (c) (d) (a-b+c-d)
A. Tangible assets
A.1 Owned assets
- Functional use
- Held for investment 136 53 83
A.2 Acquired under finance lease
- Functional use
- Held for investment
B. Intangible assets
B.1 Owned assets
B.1.1 Generated internally by the Institute
B.1.2 Other
B.2 Acquired under finance lease
Total 136 53 83
Exchange differences
2017 Revaluations Impairment Positive Negative Netincome
(a) (b) (c) (d) (a-b+c-d)
A. Tangible assets
A.1 Owned assets
- Functional use
- Held for investment 136 14 122
A.2 Acquired under finance lease
- Functional use
- Held for investment
B. Intangible assets
B.1 Owned assets
B.1.1 Generated internally by the Institute
B.1.2 Other
B.2 Acquired under finance lease
Total 136 14 122

PART 4. informAtion on comprehensive income
ANNUALREPORT 201786 |
2017 2016
Gross Income Net Gross Income Net amount tax amount amount tax amount
10. Profit (loss) for the year 31,934 31,934 36,001 36,001
Other comprehensive income that may not be reclassified to the income statement
20. Tangible assets
30. Intangible assets
40. Defined benefit plans (11,076) (11,076) (13,275) (13,275)
50. Non current assets held for sale
60. Share of valuation reserves connected with investments carried at equity
Other comprehensive income that may be reclassified to the income statement
70. Hedges of foreign investment
(a) fair value changes
(b) reclassification to the income statement
(c) other changes
80. Foreign exchange differences
(a) fair value changes
(b) reclassification to the income statement
(c) other changes
90. Cash flow hedges
(a) fair value changes
(b) reclassification to the income statement
(c) other changes
100. Financial assets available for sale
(a) fair value changes 1,662 1,662 (1,838) (1,838)
(b) reclassification to the income statement
- impairment losses 148 148
- gains (losses) from disposals (2,589) (2,589)
(c) other changes
110. Non current assets held for sale
(a) fair value changes
(b) reclassification to the income statement
(c) other changes
120. Share of valuation reserves connected with investments carried at equity:
(a) fair value changes
(b) reclassification to the income statement
- impairment losses
- gains (losses) from disposals
(c) other changes
130. Total other comprehensive income (9,414) (9,414) (17,554) (17,554)
Total Comprehensive Income (item 10 + item 130) 22,520 22,520 18,447 18,447

AttAchments
A.1 Disclosure concerning the fees of the independent auditors and services other than auditing
During 2017, the IOR did not pay fees to the companies belonging to the network of the audit firm Deloitte & ToucheS.p.A. with the exception of those related to the audit of the annual accounts amounting to EUR 121,000.
The fees due are those contractually agreed, inclusive of any indexation and reimbursement of expenses calculated as aforfeit. Fees do not include out-of-pocket expenses or taxes.
A.2 Exchange rates as of the balance sheet date
The balances at year-end, denominated in foreign currencies, are measured at the exchange rates observed by the Euro-pean Central Bank on the last working day of the year (in 2017: 29 December).
For the other currencies, the rates used are those provided by infoproviders on the same date.For the 2017 financial statements, the rates were determined as follows:
A.3 Date of authorisation for issue
The financial statements were presented and authorised for issuance by the Directorate on 23 March 2018 and approvedby the Board of Superintendence on 24 April 2018.
ANNUALREPORT 201787 |
Currency 2017 2016
U.S. Dollars USD 1.1993 1.0926
Swiss Francs CHF 1.1702 1.0814
Canadian Dollars CAD 1.5039 1.5171
English Pounds GBP 0.8872 0.7380
Australian Dollars AUD 1.5346 1.4990
Japanese Yen JPY 135.01 131.66
Czech Crowns CZK 25.535 27.029
Danish Crowns DKK 7.4449 7.4625
Hungarian Forints HUF 310.33 313.15
Norwegian Crowns NOK 9.6723 9.6160
Polish Zloty PLZ 4.1770 4.2400
Swedish Crowns SEK 9.8438 9.1878
Brazilian Reais BRE 3.9729 4.2590
South African Rand ZAR 14.8054 16.8847
Hong Kong Dollars HKD 9.3720 8.4685
South Korean Won KRW 1.224.94 1.284.79
Singapore Dollars SGD 1.6024 1.5449
New Zealand Dollars NZD 1.6850 1.5959

PART 5. informAtion on risks And hedging policies
5.1 Introduction
The Institute’s policies and procedures for the management and monitoring of risks arising from investments decisions,are summarized in the following paragraphs, with a focus on the parties involved and their responsibilities. The Instituteconsiders it appropriate:
a) to assign risk measurement functions and risk integrated control to a specific department, headed by the Risk Man-agement department;
b) to assign the functions dedicated to the definition of operating limits, the authorization of possible overruns or pay-ment requests within assigned limits, to the appropriate Risk Committee.
Other bodies of the Institute are involved and assigned with different tasks in risk management and monitoring, such asthe Board of Superintendence, Directorate, Internal Audit department, Treasury department, Compliance.
This structure is based on the Vatican laws and rules and requirements provided by the Financial Information Authority(AIF) for a compliant internal audit system, as defined by Regulation No.1/2015 on “Prudential Supervision of Entities Car-rying out financial activities on a professional basis (“Regolamento n.1”), implementing Title III of the Law introducingnorms of “Transparency, Supervision and Financial Intelligence” no. XVIII issued on 8 October 2013 (“Law no. XVIII”).
The Risk Management function is an independent structure from the risk-taking functions, reporting directly to theDirectorate and with functional reporting also to the Board of Superintendence. The following paragraphs set out the rulesof the different organizational structures and the governing bodies involved in the monitoring and managingement of risks.
5.1.1 Duties and responsibilities of bodies involved
The Institute bodies involved in various capacities in the management and monitoring of risk relating to investmentdecisions are the following:
• Board of Superintendence;• Directorate;• Risk Committee;• Risk Management Department;• Compliance Department;• Internal Audit Department;• Head of Treasury Department;
5.1.1.1 Board of Superintendence
The Board of Superintendence is responsible for defining the strategic guidelines, the Risk Appetite and general policiesfor risk management. The Board of Superintendence can request the Directorate to update the guidelines for the measure-ment and assessment of risks and periodically monitors the performance of risks and compliance with the limits establishedon the basis of the information produced by the Risk Management function and the Risk Committee.
5.1.1.2 Directorate
The Directorate establishes the overall strategies, general policies and guidelines set forth by the Board of Superinten-dence and any amendments thereto, the risk management and monitoring methodologies and their implementation andintegration proposed by the Risk Committee, and the general structure of market and credit operational limits (counterpartyrisk and issuer risk), consistently with the overall Risk Appetite.
The Directorate also establishes periodically, based on the proposal of the Risk Committee, the limits granted to newtrading partners.
The Directorate monitors the risk exposure on a daily basis, through reports produced by the Risk Management depart-ment, and is informed promptly by the department when operational limits have been exceeded and can request an emer-gency meeting of the Risk Committee.
When operational limits are exceeded, based on a proposal from the Risk Committee, the Directorate determines theway in which the overrun may be managed:
ANNUALREPORT 201788 |

• the Directorate can authorize the overrun specifying the period for which the authorization is granted;• the Directorate can ask the head of the operating area involved for a recovery plan to be established. The Directorate
then authorizes the plan, or can ask for recovery in different ways and/or in different periods than the recovery periodproposed.
5.1.1.3 Risk Committee
A Risk Committee has been established by the Directorate and chaired by Head of Risk Management department withthe aim:
• to propose a Risk Appetite Framework and management and control methodologies and all subsequent amendmentsthereof, in compliance with the general limits set up by RAF;
• to propose to the Directorate the general structure of market and credit operational limits (counterparty risk and issuerrisk);
• to propose periodically to the Directorate credit limits granted to the new trading partners, in compliance with the gen-eral limits defined in the RAF;
• to periodically review the Institute’s risk trend, with specific focus on the most relevant events or those with the greatestimpact;
• in case of an emergency meeting, where operational limits have been exceeded, to express an opinion to the Directorateon the authorization for exceeding limits, or on the recovery plan arrangements.
The organizational aspects of the Risk Committee are disclosed in an appropriate regulation.
5.1.1.4 Risk Management Department
The Institute’s Risk Management department:• presents to the Risk Committee issues related to the Institute’s exposure to market, credit, liquidity, operational and rep-
utational risks, proposing methodologies, instruments and processes for the management of those risks;• is responsible for the implementation, validation and maintenance of an adequate risk exposure control system and its
performance;• on a daily basis, observes the market, credit and liquidity risks and trading activity performance, preparing specific
reports for the Board, the Directorate and the head of Treasury Department;• monitors the compliance with the risk indicators outlined in the Risk Appetite Framework (RAF) approved by the
Board of Superintendence, preparing specific reports;• monitors the adherence to operational limits in the Institute’s trading activity, promptly informing the Directorate and
the head of Treasury Department of any overruns. When limits are exceeded, it can request an emergency meeting ofthe Risk Committee;
• calculates capital requirements in compliance with legal requirements.
5.1.1.5 Compliance Department
The IOR Compliance Department, in accordance with AIF Regulation No. 1, oversees, using a risk-based approach,management of the risk of non-compliance in corporate activity, ensuring that internal procedures are suitable to preventsuch risk.
In particular, it is responsible for managing the risk of non-compliance with the most important regulations, such asthose relating to financial activity and brokerage, anti-money laundering, and management of conflicts of interest, ensuringthat the internal procedures are suitable to mitigate these risks.
As regulated by Article 29 of Regulation No. 1, in order to achieve its mission, the Compliance Department:• remains current on the rules applicable to the Institute and its activities and measures/assesses the impact of any
changes on existing processes and internal procedures;• verifies compliance with external regulatory requirements and self-regulation;• proposes organizational and procedural changes that ensure adequate supervision of the risk of non-compliance with
identified rules;• monitors effectiveness of the suggested organizational changes for prevention of the risk of non-compliance;• prepares direct information flows for the Institute’s governance bodies and for the other concerned functions/struc-
tures;
ANNUALREPORT 201789 |

• provides advice and assistance to the Institute’s governance bodies for all matters in which the non-compliance risk isrelevant as well as collaboration in training personnel on the provisions applicable to their activities.
5.1.1.6 Internal Audit Department
The Institute’s Internal Audit department verifies through the audit plan:• the adherence to risk management procedures as established by the Board of Superintendence and by the Directorate,
based on a proposal from the Risk Committee;• the adequacy of the risk monitoring tools and procedures related to the Institute’s investment decisions.
5.1.1.7 Head of Treasury Department
• Defines the operating investment decisions to be made on financial markets, ensuring consistency with the strategicgoals and predetermined limits.
• Requests revisions to the assigned operational limits, or the authorization to engage with new counterparties, subject tothe review of the Risk Committee.
• Defines, within the limits of the authority granted, the necessary corrective actions to restore the defined risk/returnprofile.
5.1.2 Risk culture and further developments
The Institute is involved in a complete overview of its current financial, credit, liquidity, reputational and operationalrisks management programs. This involves the strengthening of the second level control functions (Risk Management andCompliance), through the review of risk measurement and assessment systems and the adaptation to the most commonmarket practices, which includes preparation for the introduction of the new accounting standard IFRS9 for the classifica-tion and measurement of financial instruments.
The approval of a Risk Appetite Framework integrated in the activities of daily risk management allows for the develop-ment and dissemination of a risk culture, while the consolidation of the role of the Risk Committee has contributed to main-taining a high level of attention from the management.
An ad-hoc e-learning platform for trainings was delivered by the Institute to capture the specificities of the Institute andthe current regulatory framework, in particular, in the anti-money laundering and combating the financing of terrorism.External training activities are planned for specific areas, in particular, in the case of regulatory changes or in order to pro-vide new skills.
5.2 Credit risk
Format and content of information on credit risk and related hedging policies
5.2.1 General aspects
Credit risk rises from the possibility that counterparties may not honour their commitments. Depending on the natureof those commitments, the Institute’s credit risk may be divided in two categories:
a) credit risk arising from the Institute’s investment and trading activity for their own account and on behalf of its clients.Credit risk represents the risk that a counterparty may not fulfill its contractual obligations related to a transactionconcerning financial instruments. This risk may be classified into three categories:1) cash risk (e.g. deposits);2) issuer risk (e.g. bond purchases);3) counterparty risk, mainly generated by the operations in Delivery versus Payment (e.g. term operations, repos).
b) credit risk arising from loans to customers, classified in the financial statements as “Due from customers”; within thisrisk category, the Institute considers it appropriate not to measure this risk because:
• the item is not material when compared to total assets;• the exposure is limited to Catholic congregations and Vatican employees, both of which have low risk categories by
their nature;
ANNUALREPORT 201790 |

• credits are usually accompanied by guarantees: securities, asset management or, for the Institute employees, postemployment benefits.
It is to be mentioned that the Institute is not authorized by the Autorità di Informazione Finanziaria to carry out theactivity of “lending” (cfr. art. l (l) (b) of the Law n. XVIII and art. 3 (24) (b) of the Regulation No. l), as credit activities on itsown. However, it is authorized to make “advances” that is to disburse funds to its clients and to a limited extent followingguarantee of future income (such as, for example, in the case of the advance of salary or pension paid by the Holy See or theGovernatorato of Vatican City) or guaranteed by financial assets of the same amount deposited by the clients at the Institute.
In general, the main sources of credit risk derive from the investment in bonds, mainly issued by government, financialand corporate “Investment Grade” rating agencies and by deposits with banks. In consideration of the general level of inter-est rates and yields offered, the strategy in 2017 was to focus more on issuers of good credit standing, favoring both issueswith medium-short maturity and variable-rate or inflation-linked securities.
At the end of 2017, the bond securities portfolio amounted to EUR 2.3bn with an average duration of 1.372 years andhigh credit standing (99.6% investment grade). The portfolio is composed of governament bonds issued by major Europeancountries (core and peripheral), as well as financial and corporate bonds.
Additional details on the bond portfolio composition are provided in the next paragraphs.
5.2.2 Credit risk management policies
5.2.2.1 Organizational aspects
The Treasury Department is responsible for the management and monitoring of credit risks over trading activity andcollections of amounts due from clients. The Treasury Department is qualified to assume credit risk in compliance withoperational limits. Particularly, the process of risk assumption involves the following:
• the Director General delegates the assumption of credit risks to the Treasury Department, within a predeterminedamount, type and counterparty;
• the Treasury Department assumes credit risk in its operations in compliance with its defined limits. The assumption ofcredit risk for amounts greater than the predetermined limit assigned to the department requires the authorisation ofthe Director General;
• the Risk Committee supports the Director General in establishing a system of credit risk management and monitoring,defining operational limits, analyzing any overruns and in evaluating authorisations of limits exceeded;
• the Risk Management Department, on a daily basis, monitors compliance with operational limits, promptly reportingto the Directorate any unauthorized overruns.
5.2.2.2 Management, measurement and control systems
Credit risk monitoring activity is delegated to the Risk Management Department, applying the Institute’s specific-methodology, validated by the Risk Committee and approved by the Director General.
This methodology provides, in particular, for the definition of:• a set of determined counterparties with which the Treasury department is allowed to engage with. For each counter-
party, the type of risk that the Institute can assume and the maximum amount of exposure are defined;• credit risk quantification criteria for each financial instrument, distinguishing between counterpart risk, issuer risk and
cash risk;• add-on quantification criteria to be applied to all contracts with future settlement, diversified by maturity and margin-
ing practices.Concerning the maximum amount of exposure to each counterparty, the methodology provides for the use of an inter-
nal rating, defined by the characteristics of the counterparty, the rating from International Rating Agencies (Moody’s, S&P,Fitch) and credit spread level quoted in the market (spread on Credit Default Swaps). The use of the credit default swapsspread enables prompt updating of the internal rating and their credit maximum exposure when the market shows signs ofdifficulties with a determined issuer before these difficulties can lead to a change of the counterparty’s rating.
In addition to the limits defined above, the Board of Superintendence defined other limits at trading portfolio level basedon a sensitivity spread, distinguishing between government and corporate issuer. The impact of this stress test at the closingdate of this financial statements amount respectively to EUR 20.4m and EUR 16.1m.
5.2.2.3 Credit risk mitigation techniques
ANNUALREPORT 201791 |

Currently, the Institute has no offsetting agreements in place with financial counterparties and does not operate in thecredit derivatives market.
5.2.2.4 Non-performing financial assets
For amounts due from clients, an internal monitoring system assists the Directorate in determining if there is objectiveevidence of the impairment of loans, based on the following criteria established by the Institute:
• default in contractual payments of both capital and interest;• delays in payments due to liquidity problems of customers;• deterioration in the value of the guarantees provided.The IOR has also issued guarantees requested by customers covered by assets held in custody, which are disclosed on
paragraph 13.1 Part 3.
5.2.3 Credit quality
As disclosed in AIF Circular, the use of the term “exposures” includes equity securities and UCI units while the use of theterm “credit exposures” excludes equity securities and UCI units.
1 Performing and non-performing credit exposures: amounts, adjustments, changes, economic andgeographical detail
1.1 Detail of credit exposures by portfolio classification and credit quality (book values)
At the closing date of these financial statements there were not performing past due exposures. Based on the analysis ofdebtors, there was no objective evidence of potential insolvency of the customer and no impairment loss was recognized.
Bad loans are totally impaired.
ANNUALREPORT 201792 |
Bad loans Unlikely Non performing Performing Other Totalto pay past due past due performing
exposures exposures exposures
1.Financial assets available for sale
2.Financial assets held to maturity 246,168 246,168
3.Due from banks 473,386 473,386
4.Due from customers 6,969 18,453 25,423
5.Financial assets carried at fair value
6.Financial assets being disposed
Total 2017 6,969 738,007 744,977
Total 2016 7,469 764 71 1,223,033 1,231,337
Note: There are no forborne exposures.
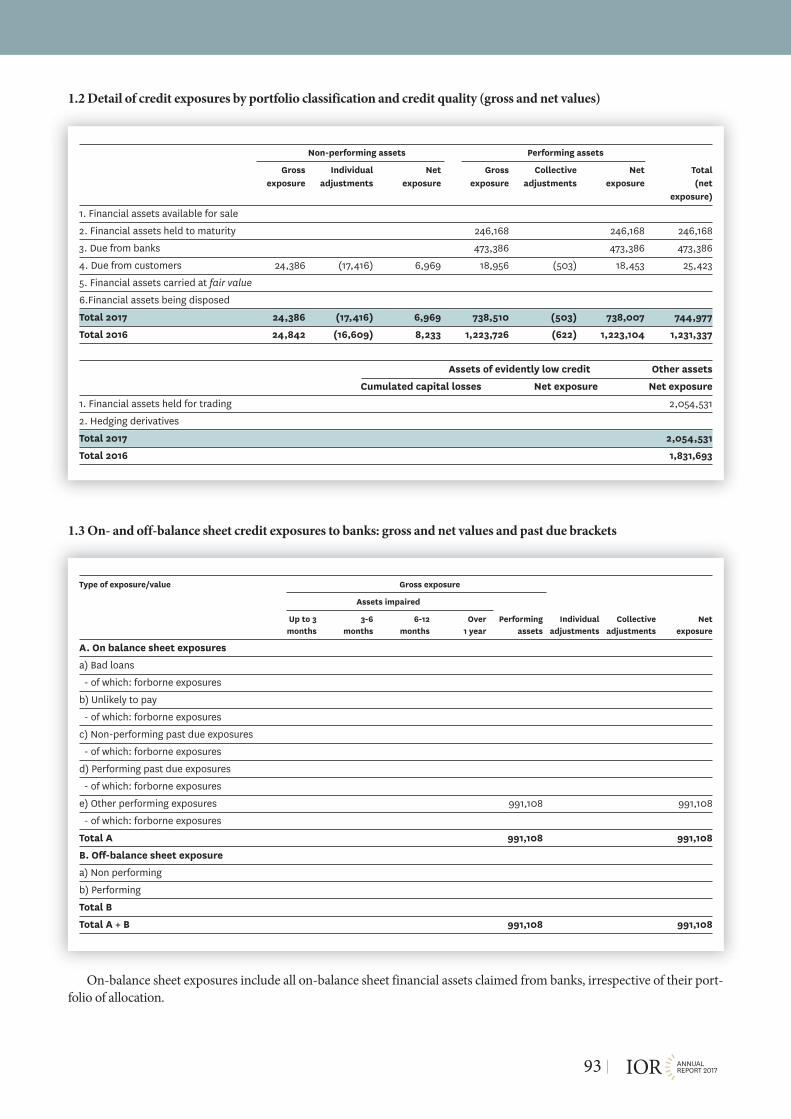
1.2 Detail of credit exposures by portfolio classification and credit quality (gross and net values)
1.3 On- and off-balance sheet credit exposures to banks: gross and net values and past due brackets
On-balance sheet exposures include all on-balance sheet financial assets claimed from banks, irrespective of their port-folio of allocation.
ANNUALREPORT 201793 |
Non-performing assets Performing assets
Gross Individual Net Gross Collective Net Totalexposure adjustments exposure exposure adjustments exposure (net
exposure)
1. Financial assets available for sale
2. Financial assets held to maturity 246,168 246,168 246,168
3. Due from banks 473,386 473,386 473,386
4. Due from customers 24,386 (17,416) 6,969 18,956 (503) 18,453 25,423
5. Financial assets carried at fair value
6.Financial assets being disposed
Total 2017 24,386 (17,416) 6,969 738,510 (503) 738,007 744,977
Total 2016 24,842 (16,609) 8,233 1,223,726 (622) 1,223,104 1,231,337
Assets of evidently low credit Other assets
Cumulated capital losses Net exposure Net exposure
1. Financial assets held for trading 2,054,531
2. Hedging derivatives
Total 2017 2,054,531
Total 2016 1,831,693
Type of exposure/value Gross exposure
Assets impaired
Up to 3 3-6 6-12 Over Performing Individual Collective Netmonths months months 1 year assets adjustments adjustments exposure
A. On balance sheet exposures
a) Bad loans
- of which: forborne exposures
b) Unlikely to pay
- of which: forborne exposures
c) Non-performing past due exposures
- of which: forborne exposures
d) Performing past due exposures
- of which: forborne exposures
e) Other performing exposures 991,108 991,108
- of which: forborne exposures
Total A 991,108 991,108
B. Off-balance sheet exposure
a) Non performing
b) Performing
Total B
Total A + B 991,108 991,108

ANNUALREPORT 201794 |
1.7 On- and off-balance sheet credit exposures to customers: gross and net values and aging
On-balance sheet exposures include all on-balance sheet financial assets claimed from customers, irrespective of theirportfolio of allocation.
Type of exposure/value Gross exposure
Non-performing assets
Up to 3 3-6 6-12 Over Performing Individual Collective Netmonths months months 1 year assets adjustments adjustments exposure
A. On balance sheet exposures
a) Bad loans 12,787 (12,787) -
- of which: forborne exposures
b) Unlikely to pay 11,599 - (4,629) 6,969
- of which: forborne exposures
c) Non-performing past due exposures
- of which: forborne exposures
d) Performing past due exposures
- of which: forborne exposures
e) Other performing exposures 1,801,932 (503) 1,801,430
- of which: forborne exposures
Total A 24,386 1,801,932 (17,416) (503) 1,808,399
B. Off balance sheet exposure
a) Non performing
b) Other 27 27
Total B 27 27
Total A + B 24,386 1,801,959 (17,416) (503) 1,808,426
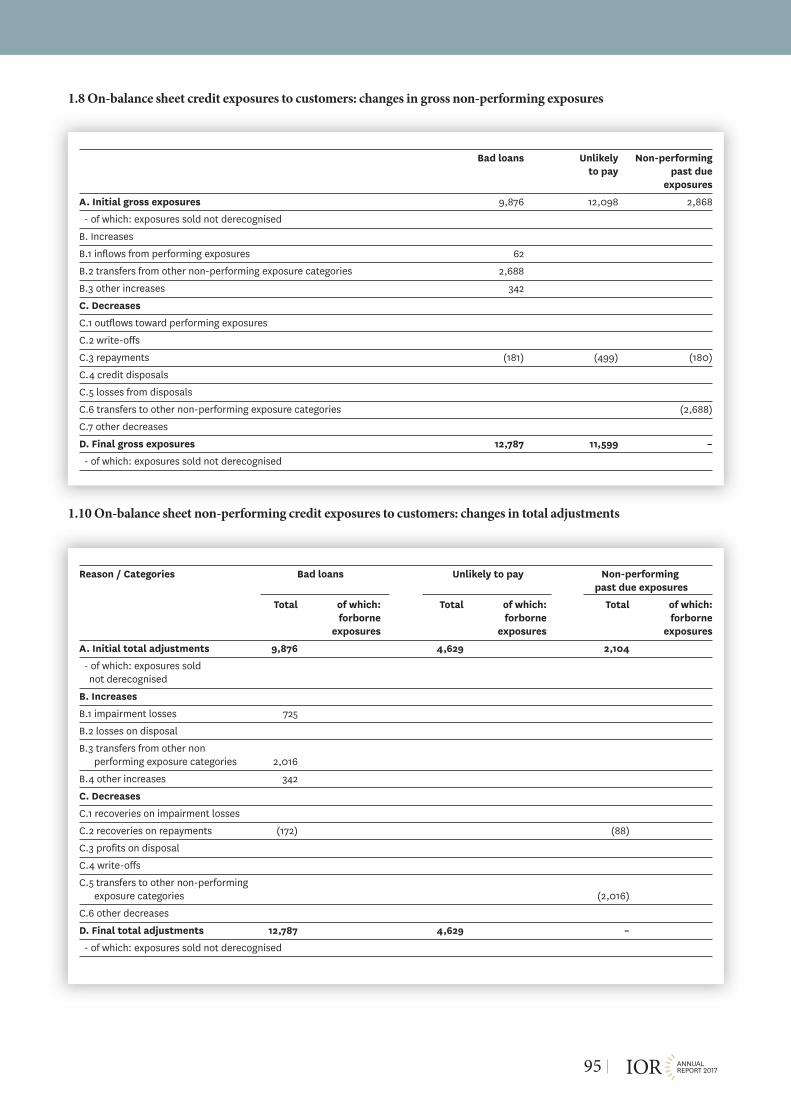
1.8 On-balance sheet credit exposures to customers: changes in gross non-performing exposures
1.10 On-balance sheet non-performing credit exposures to customers: changes in total adjustments
ANNUALREPORT 201795 |
Bad loans Unlikely Non-performingto pay past due
exposures
A. Initial gross exposures 9,876 12,098 2,868
- of which: exposures sold not derecognised
B. Increases
B.1 inflows from performing exposures 62
B.2 transfers from other non-performing exposure categories 2,688
B.3 other increases 342
C. Decreases
C.1 outflows toward performing exposures
C.2 write-offs
C.3 repayments (181) (499) (180)
C.4 credit disposals
C.5 losses from disposals
C.6 transfers to other non-performing exposure categories (2,688)
C.7 other decreases
D. Final gross exposures 12,787 11,599 –
- of which: exposures sold not derecognised
Reason / Categories Bad loans Unlikely to pay Non-performingpast due exposures
Total of which: Total of which: Total of which:forborne forborne forborneexposures exposures exposures
A. Initial total adjustments 9,876 4,629 2,104
- of which: exposures sold not derecognised
B. Increases
B.1 impairment losses 725
B.2 losses on disposal
B.3 transfers from other non performing exposure categories 2,016
B.4 other increases 342
C. Decreases
C.1 recoveries on impairment losses
C.2 recoveries on repayments (172) (88)
C.3 profits on disposal
C.4 write-offs
C.5 transfers to other non-performingexposure categories (2,016)
C.6 other decreases
D. Final total adjustments 12,787 4,629 –
- of which: exposures sold not derecognised

2 Classification of exposures based on external and internal ratings
2.1 Detail off and on-balance sheet credit exposures by external rating class
For the analysis of the credit risk of the borrowers / guarantors, the Institute uses S&P ratings; when S&P ratings are notavailable, the Institute utilizes the equivalent value from the Moody’s rating agency.
In the preparation of the above table, S&P ratings have been used.Below is a reconciliation between risk classes and the S&P ratings:Class 1 – from AAA to AA-Class 2 – from A+ to A-Class 3 – from BBB+ to BBB-Class 4 – from BB+ to BB-Class 5 – from B+ to B-Class 6 – Others
ANNUALREPORT 201796 |
Exposures External rating classes
Class 1 Class 2 Class 3 Class 4 Class 5 Class 6 Unrated Total
A. On balance sheet exposures 694,255 587,064 1,408,133 10,159 735 73,739 2,774,085
B. Derivatives
B.1 Financial derivatives
B.2 Credit derivatives
C. Guarantees given 27 27
D. Commitments to lend funds
E. Other
Total 694,255 587,064 1,408,133 10,159 735 73,766 2,774,112

3 Detail of guaranteed credit exposures by type of guarantee
3.2 Guaranteed credit exposures to customers
ANNUALREPORT 201797 |
Total (1)+(2)
Other entities
Banks
Other Public Entities
Governments and
Central Banks
Other entities
Banks
Other Public Entities
Governments and
Central Banks
Credit Linked Notes
Other real guarantees
Securities
Real estate assets – financial lease
Real estate assets - mortgages
Net exposure
Real collateral (1) Guarantees (2)
Credit derivatives
Other derivativesCredit commitments
1. Guaranteed on balancesheet credit exposures
1.1 totally guaranteed 435 435 435
- of which non performing
1.2 Partly guaranteed
- of which non performing
2. Guaranteed off-balance sheet credit exposures
2.1 Totally guaranteed
- of which non performing
2.2 Partly guaranteed
- of which non performing

5.2.4 Distribution and concentration of credit exposures
1. Detail by sector of on-balance and off-balance sheet credit exposures to customers (bookvalue)
ANNUALREPORT 201798 |
Net exposure
Individual adjustments
Portfolio adjustments
Net exposure
Individual adjustments
Portfolio adjustments
Net exposure
Individual adjustments
Portfolio adjustments
Net exposure
Individual adjustments
Portfolio adjustments
Net exposure
Individual adjustments
Portfolio adjustments
Net exposure
Individual adjustments
Portfolio adjustments
Net exposure
Individual adjustments
Portfolio adjustments
Net exposure
Individual adjustments
Portfolio adjustments
Net exposure
Individual adjustments
Portfolio adjustments
Public Authorities
Domestic Foreign Public Sector Foreign Private Sector
Foreign PublicAuthorities
Regional – LocalPublic Authorities
International Public Authorities
Other Public Entities
Financial companies
Insurance companies
Non-financial companies
Other companies
A. On-balance sheet exposures
A.1 Bad loans 12,787
- of which forborne exposures
A.2 Unlikely to pay 6,969 4,629
- of which forborneexposures
A.3 Non-performing pastdue exposures
- of which forborne exposures
A.4 Performing exposures 11,238 1,359,322 225,168 5,115 196,279 4,310 502
- of which forborne exposures
TOTAL A 11,238 1,359,322 225,168 5,115 196,279 11,279 17,416 502
B. Off-balance sheet exposures
B.1 Bad loans
B.2 Unlikely to pay
B.3 Other non-performing assets
B.4 Other exposures 27
TOTAL B 27
TOTAL (A+B) 2017 11,238 1,359,322 225,168 5,115 196,279 11,306 17,416 502
TOTAL (A+B) 2016 8,290 1,354,046 237,021 9,286 239,360 17,590 16,609 622

2. Detail by geographical area of on- and off-balance sheet credit exposures to customers (bookvalue)
3. Detail by geographical area of on- and off-balance sheet credit exposures to banks (bookvalue)
ANNUALREPORT 201799 |
Exposures / Geographical areas Domestic European Countries America Asia Rest of the world
Net Total Net Total Net Total Net Total Net Totalexposure adjust- exposure adjust- exposure adjust- exposure adjust- exposure adjust-
ments ments ments ments ments
A. On-balance sheet exposures
A.1 Bad loans (12,787)
A.2 Unlikely to pay 6,969 (4,629)
A.3 Non-performing past due exposures
A.4 Performing exposures 11,261 (3) 1,481,647 (485) 250,423 49,046 (13) 9,053 (1)
Total A 11,261 (3) 1,488,616 (17,901) 250,423 49,046 (13) 9,053 (1)
B. Off balance sheet exposures
B.1 Bad loans
B.2 Unlikely to pay
B.3 Other non-performing assets
A.4 Performing exposures 27
Total B 27
Total A+B 2017 11,261 (3) 1,488,643 (17,901) 250,423 49,046 (13) 9,053 (1)
Total A+B 2016 8,326 (2) 1,601,032 (17,224) 217,127 50,415 5,923 (2)
Exposures / Geographical areas Domestic European Countries America Asia Rest of the world
Net Total Net Total Net Total Net Total Net Totalexposure adjust- exposure adjust- exposure adjust- exposure adjust- exposure adjust-
ments ments ments ments ments
A. On-balance sheet exposures
A.1 Bad loans
A.2 Unlikely to pay
A.3 Non-performing past due exposures
A.4 Performing exposures 57,058 682,621 182,485 1,623 67,321
Total A 57,058 682,621 182,485 1,623 67,321
B. Off-balance sheet exposures
B.1 Bad loans
B.2 Unlikely to pay
B.3 Other non-performing assets
A.4 Performing exposures
Total B
Total A+B 2017 57,058 682,621 182,485 1,623 67,321
Total A+B 2016 976,812 148,537 1,396 70,736

4. Large exposures
IOR has no large exposures as defined by art. 46 of AIF Regulation No. 1.
5.2.5 Securitisation
No securitisation transactions were made by the IOR.
5.2.6 Information on unconsolidated structured entities
For unconsolidated structured entities, the Institute considers the shares held in externally managed investment funds.For some external funds, the Institute is the owner of a significant number of shares, however, it does not control these
funds because, it does not participate in investment decisions, either directly or indirectly, and it does not hold the ability toaffect the returns of the above-mentioned funds.
The information required by IFRS 12 on the unconsolidated structured entities is below.As of the balance sheet date, the Institute holds external funds in its trading portfolio for EUR 32.6m. Dividends col-
lected in 2017 on such funds amount to EUR 400,000 (EUR 812,000 in 2016).68% of the funds in the portfolio are closed-ended funds, and can be subscribed to only at given times by specific parties,
who, as mentioned, have no control, and the remaining 32% of funds are related to funds that can be subscribed to by differ-ent entities at any time and for any amount (open-ended funds).
Conversely, with regard to their asset classes, funds held by the Institute invest in equity securities (27%), debt securities(32%) and the real estate market (41%). Regarding geographical distribution, the criteria used in the above mentioned tablewas used to separate funds based on their legally registered domicile.
According to those criterion, all of the funds are located within the European Union.
ANNUALREPORT 2017100 |
Investment Fund type 2017 2016
Balance sheet exposure Balance sheet exposureNominal Value Carrying Nominal Value Carrying
(quantity) amount (quantity) amountOpen-end fund 75,160 10,326 75,160 10,404
Closed-end fund 19,770,677 13,322 20,170,677 13,333
Hedge fund
Exchange traded fund
Unit Investment Trust
Fund of fund 2,300 8,932 2,300 9,944
Seed Fund
Total 19,848,137 32,580 20,248,137 33,681
Underlying asset class focusEquity 2,300 8,932 2,300 9,944
Debt 75,160 10,326 75,160 10,404
Asset Allocation
Money Market
Real Estate 19,770,000 13,302 20,170,000 13,311
Commodity
Alternative Investments 677 20 677 22
Total 19,848,137 32,580 20,248,137 33,681
Geographical AreaUE 19,848,137 32,580 20,248,137 33,681
USA
Total 19,848,137 32,580 20,248,137 33,681

At the balance sheet date, the IOR did not provide any guidance to unconsolidated structured entities on their invest-ment policies. The Institute has not sponsored any unconsolidated structured entities.
At the balance sheet date, the Institute had a standing commitment to one of these funds to third parties of EUR 4m.S.G.I.R. S.r.l. is 100% owned by IOR. The Institute does not prepare consolidated financial statements because the result-
ing information would not be relevant to the readers of the financial statements. The total balance sheet assets of the sub-sidiary are insignificant when compared with those of the Institute and, accordingly, the consolidated financial statementswould not differ significantly from these financial statements.
5.2.7 Models for the measurement of credit risk
For the credit risk measurement, the Institute adopted the standard methodology defined by AIF Regulation No. 1, arti-cles 63-89. No individual and portfolio internal models are used.
5.3 Market risks
Format and content of information on market risk and relative hedging policies
5.3.1 Interest rate risk and trading portfolio price risk
5.3.1.1 General aspects
Interest rate risk related to the trading portfolio is derived from the Institute’s trading activity in financial instruments,both simple and complex, exchanged on organized markets and over-the-counter markets, put in place by the Treasurydepartment. This risk pertains to positions in bonds, particularly those based on a fixed rate, the value of which is closelylinked to the trend in interest rates. In line with the objectives of the Treasury Department in liquidity management and cap-ital, and in line with the Institute’s threshold for risk, the level of risk in the trading portfolio is rather low, as indicated by theshort holding period (1.31 years). In anticipation of an increase in interest rates, the Institute has further reduced the overallholding period in order to mitigate any negative impact on the value of the portfolio.
Price risk comes from the exposure on equity securities, ETF and funds. The Institute reduced the threshold for such riskand exposures come mainly from the need to obtain a diversified return on own equity, in a period characterized by lowinterest rates.
5.3.1.2 Operating procedures and methods for measuring interest rate risk and price risk
Interest rate risk and price risk are measured and managed as part of the overall management and monitoring of risk.Market risk is the risk of change in portfolio value from adverse fluctuations in market parameters, such as interest or
currency rates, equity prices or prices of commodities underlying derivative contracts.The Institute’s trading portfolio is comprised mainly of bond securities, and the main associated risks are interest rate and
LIBOR spread variation risk, as further described in the next paragraphs.The power to assume market risk lies with the Directorate, which plays an active role in risk management and monitor-
ing, according to the guidelines issued by the Board of Superintendence. Specifically, the Director General delegates theassumption of market risk and management to the Treasury department that operates autonomously in accordance with thelimits assigned to the department.
Market risk assumption and management is separate from the confirmation, settlement, matching and execution (BackOffice) and of the Risk Management department.
At 31 December 2017, the Institute did not hold quoted derivatives. A project analysing future interest rates is being per-formed, with the goal of providing an instrument for hedging the interest rate risk of the bond portfolio.
The system of measurement of financial risks and the establishment of operational limits of the Institute are based on theuse of statistic calculation tools. Specifically, the three measures of potential loss are: Value at Risk, Expected Shortfall andStress Test. These measures are defined as follows:
Value at Risk (VaR) is defined as the maximum loss that the Institute could withstand, with probability equal to predeter-mined confidence levels, in the case of adverse market trends to the position taken;
Expected Shortfall is defined as the average loss that the Institute could withstand in case of a VaR overrun;
ANNUALREPORT 2017101 |

Stress Test is defined as the loss that the Institute could withstand in case of negative events impacting main risk indica-tors (equity prices and indexes, interest rates, currency rates, credit spread) analyzed independently and as established by theRAF.
In addition to the aforementioned measures, the Institute utilises an indicator of realized losses on a 10-day time horizon,defined as the sum of the negative results realized on closed positions and unrealized losses on open positions, valued atmarket prices.
The VaR and the Expected Shortfall are calculated using the historic method (at least one year of data and quarterlyupdate of the scenarios), with a daily timeline and confidence level at 99%.
The Stress Tests are calculated by simulating extreme scenarios of the main risk factors, starting from the worst move-ments recorded in the history of the world’s financial markets, as further described in the following paragraphs. In particu-lar:
• for interest rate risk, the variations in interest rates that make up the market curve, the rate volatility risk and correlationrisk. On a daily basis, stress test analyses are conducted on the rates curve, assuming substantial shifts of the curve (-40% / +50% with a floor equal to 50 basis points);
• for LIBOR spread variation risk, the stress scenarios consider increases depending on the absolute spread level: moreprecisely, these are set equal to -20/+40 bps for securities with a spread lower than Libor, -40/+80 bps for securities witha spread between 0 and 100 bps and -40%/+80% of the spread for securities with a spread above 100 bps;
• for price risk, different categories of instruments are adequately presented: equities securities, equities indexes, fundsand ETF. A stress test analysis is then conducted, applying the defined scenarios to spot prices (from -30% to +30%).
Monitoring compliance with limits on a daily basis is performed by the Risk Management department, which providesdaily updates to the Directorate on the level of risk assumed and compliance with operational limits.
When operational limits have been exceeded, the Risk Management department promptly informs the Directorate of theoverrun and the Director General decides on the appropriate action.
In establishing a system of market risk measurement, definition of operational limits, and the monitoring of compliancewith the limits, the Director General is supported by the Risk Committee, who serves as an advisor on the following matters:
• assignment and review limits for of VaR, Expected Shortfall, Stress Test and WCL to the Treasury department;• assignment of additional limits, determined based on nominal sensitivity factor (portfolio sensitivity to the single risk
factors), etc;• periodical trend analysis of the Institute’s risk position and identification of the root causes of the unusual trends;• monitoring risks assumed and compliance with the pre-established limits;• total or partial disruption of the activities in certain sensitive financial instruments to risk factors;• analysis of the ordinary and extraordinary events, following particular market turbulences and macroeconomic scenar-
ios.
During 2017, the Institute maintained a prudential approach in the management of financial risks. Specifically, duringthe year, the held for trading portfolio had a daily average VaR of EUR 3.18m, a daily maximum VaR of EUR 3.55m and adaily minimum VaR of EUR 2.51m; the operational limits calculated on 10 working days, determined as EUR 25m underRAF, was never exceeded. At the end of 2017, the VaR amounted to EUR 7.5m. The portfolio only contained highly liquidproducts.
The Risk Management department, to verify the adequacy of the VaR calculation, periodically conducts retrospectivereviews, comparing the actual trading results achieved, with the VaR measures previously calculated. During 2017, the Insti-tute did not identify events where actual daily losses exceeded the risk measures expressed in terms of VaR on a daily basis.
The potential impact of a shock of +/- 100 basis point on the portfolio held for trading could have an impact of EUR26.9m, representing 52.4%, 84.2% and 0.9% of interest margin, profit for the year and equity, respectively.
Stress test data at the end of 2017 shows, for interest rate risk, an exposure equal to EUR 14.0m for a variation of +50% ofinterest rates, with a minimum variation of 50 basis points; the exposure is focused on the EUR rate risk for 76% and onUSD rate risk for the 23%.
The management and monitoring of risk is continuously improving. At the beginning of 2017, the implementation of thenew system for the Treasury department has been completed; the system allows:
• monitoring of positions, profits and risks real time (automatic feed of main risk parameters and continuous revaluationof the position, calculation of the VaR position at any time of the day);
ANNUALREPORT 2017102 |

• possibility of monitoring P&L trend and risks in different aggregation levels, from the single instrument, to the entireposition of the Treasury department.
2.1 Trading portfolio: detail by maturity date (re-pricing date) of financial assets and liabilities on balance sheet andfinancial derivatives
ANNUALREPORT 2017103 |
Type / Expiration date On demand Up to 3 3 - 6 6-12 1 - 5 5-10 Over 10 Undefinedmonths moths months years years years
A. Cash assets
1.1 Debt securities
- with early redemption option 121,138 15
- other 735,738 285,538 29,173 833,879 43,199 448
1.2 Other assets
2. Cash liabilities
2.1 Repurchase agreements
2.2 Other liabilities
3. Financial derivatives
3.1 With underlying security
- Options
+ Long positions
+ Short positions
- Other derivatives
+ Long positions
+ Short positions
3.2 Without underlying security
- Options
+ Long positions
+ Short positions
- Other derivatives
+ Long positions
+ Short positions

ANNUALREPORT 2017104 |
2.2 Trading portfolio: detail of equity securities and index exposures for the main countries quoted markets
The application of a 30% shock on the value of equity securities would have an impact of EUR 8.90 million, correspon-ding respectively to 17.3%, 27.9% and 0.3% of the intermediation margin, operating result and equity.
With reference to price risk of other financial instruments classified as held for trading, at the end of 2017, the Institute’sportfolio had the following exposure:
• Closed-end funds EUR 22.3m;• Open-end funds EUR 10.3m.
Type / Quotation index Quoted
Italian Other NotStock Exchange NYSE Arca Xetra New York NASDAQ GS quoted
A. Equity securities
- long positions 5,065 4,969 4,732 3,741 3,398 7,754
- short positions
B. Transactions not yet settled on equity securities
- long positions
- short positions
C. Other derivatives on equity securities
- long positions
- short positions
D. Derivatives on equity index
- long positions
- short positions

5.3.2 Interest rate risk and price risk of other financial instruments in portfolio
2.1 Other financial instruments in portfolio: detail by expiration date (re-pricing date) of financial assets and liabilities
ANNUALREPORT 2017105 |
Type / Expiration date On demand Up to 3 3 - 6 6 - 12 1 - 5 5 - 10 Over Unde-months months months years years 10 years fined
1. Cash assets
1.1 Debt securities
- with early redemption option 10,018
- other 31,387 20,029 44,967 90,895 48,872
1.2 Loans to banks 362,123 54,205 25,052 32,007
1.3 Loans to customers
- current accounts 11,254
- other loans
- with early redemption option 7,969
- other 6,200
2. Cash liabilities
2.1 Due to customers
- current accounts 2,121,948
- other liabilities
- with early redemption option
- other 2,339 4,752 2,383
2.2 Due to banks
- current accounts 4,096
- other liabilities
2.3 Debt securities
- with early redemption option
- other
2.4 Other liabilities
- with early redemption option
- other
3. Financial derivatives
3.1 With underlying security
- Options
+ Long positions
+ Short positions
- Other derivatives
+ Long positions
+ Short positions
3.2 Without underlying security
- Options
+ Long positions
+ Short positions
- Other derivatives
+ Long positions
+ Short positions
4. Other off balance sheet transactions
+ Long positions
+ Short positions

Regarding interest rate risk for financial instruments other than those classified as trading, the Institute’s exposure refersmainly to the assets classified as held to maturity and to interbank deposits, already listed in the paragraph related to creditrisk.
The application of a variation of interest rates of +/- 100 basis points to the portfolio, including other financial instru-ments (EUR 246.17m) shows a potential impact of EUR 0.79m, in terms of variation of the coupon flow representing 2.7%,2.5% and 0.03% of interest margin, profit for the year and equity, respectively.
The application of a variation of interest rates of +/- 100 basis points to the portfolio, including other financial instru-ments (EUR 246.17m) shows a potential impact of EUR 4.94m, in terms of changes in economic value representing 9.6%,15.5% and 0.2% of interest margin, profit for the year and equity, respectively.
With reference to price risk of financial instruments not classified as trading, at the end of 2017, the Institute’s portfoliohad the following exposure:
• Financial assets available for sale EUR 4.6m;• Investment in subsidiaries S.G.I.R. S.r.l. EUR 15.8m.
Regarding the limits, the Board of Superintendence established limits for the investment in financial assets held to matu-rity in relation to equity. For this portfolio, a measure of VaR is also calculated (respectively EUR 0.37m, 0.53m and 0.75m ofminimum, medium and maximum daily value), but not associated with limits.
At the end of the year, the 10-day VaR was equal to EUR 1.22m.
5.3.3 Currency risk
General aspects, operating procedures and methods for measuring currency risk
Currency risk is the risk that the Institute can incur losses due to the adverse variation of currency rates. As mentionedabove, the management of currency risk is based on the system in place for the management of financial risks.
For the currency rate, as it was for interest rates, the following pre-defined Stress Test scenarios were used for each cur-rency providing shock higher for minor currencies and for those not related to Euro. The potential impact of these shockscould result in a loss of approximately EUR 1m.
ANNUALREPORT 2017106 |

2.1 Detail by currency of financial assets, liabilities and derivatives
The exchange rate risk exposure resulting from the application of the abovementioned stress tests of 100 basis points at31 December 2017 resulted in an amount equal to EUR 0.07m, representing 0.1%, 0.2% and 0% of interest margin, profit forthe year and equity, respectively.
2.2 Internal models and other methods for sensitivity analysis
For the capital requirement calculation related to currency risk, the IOR adopted the standard methodology provided byAIF Regulation No. 1.
5.3.4 Derivative instruments
In 2017 IOR did not hold derivative financial instruments.
5.4 Liquidity risk
Format and content of information on liquidity risk and relative hedging policies
5.4.1 General aspects, operating procedures and methods for measuring liquidity risk
Liquidity risk is the risk that the Institute will encounter difficulties in meeting payment obligations by cash or byexpected or unexpected delivery, compromising the daily operations or the financial situation.
Regarding liquidity risk, during 2017, the IOR did not encounter any notable problems; at year-end 2017, the liquidity
ANNUALREPORT 2017107 |
Items Currencies
USD GBP CAD AUD CHF Other currencies
A. Financial assets
A.1 Debt securities 475,658 5,000 192 2,418 3,427 173
A.2 Equity securities 9,949 1,220 6
A.3 Loans to banks 94,513 6,049 5,821 4,661 4,168 6,536
A.4 Loans to customers 107 - 23 -
A.5 Other financial assets 7,461 136 1,105 439 1,211 1,318
B. Other assets
C. Financial liabilities
C.1 Due to banks 304
C.2 Due to customers 560,908 9,733 7,735 5,036 9,131 2,359
C.3 Debt securities
C.4 Other financial liabilities 21,965 40 458 1,136 4
D. Other liabilities
E. Financial derivatives
- Options
+ Long positions
+ Short positions
- Other derivatives
+ Long positions
+ Short positions
Total Assets 587,688 12,405 7,118 7,518 8,829 8,033
Total Liabilities 583,177 9,773 8,193 6,172 9,135 2,359
Difference (+/-) 4,511 2,632 (1,075) 1,346 (306) 5,674

risk indicator (LCR), calculated over a period of 30 days, resulted in a value equal to 642%, well above the regulatory limit of200% established by RAF. It is important to note that Institute liabilities are represented, other than equity, by deposits fromcustomers, mainly on demand. Moreover, the Institute does not carry out funding transactions on the interbank market oron the capital market.
From an organizational standpoint, the Institute’s liquidity risk is managed by the Treasury Department, which monitorsthe expected and realized flows in currencies and maintains an adequate portfolio of liquid assets to meet any unexpectedpayments.
Monitoring of liquidity and adherence to liquidity operating limits are performed daily by the Risk Management Depart-ment.
The following tables show the Institute’s assets and liabilities with current values, divided by contractual maturities of thefinancial liabilities and the expected maturities of the financial assets. The first table includes only financial assets and liabil-ities in Euro, while the second table comprises only financial assets and liabilities in other currency than Euro.
1.1 Detail by contractual residual maturity of financial assets and liabilities in Euro
ANNUALREPORT 2017108 |
Type / Residual maturity On demand 1 - 7 7 - 15 15 - 30 1 - 3 3 - 6 6 -12 1 - 5 Over 5 Unde-days days days months months months years years fined
Cash assets
B.1 Government bonds 675 5,313 52,850 14,203 153,691 954,500 160,098
B.2 Other debt securities 7 6 38,974 11,398 28,383 19,991 27,013 292,772 53,094
B.3 UCI units 32,580
B.4 Loans
- Banks 294,581 25,052 32,007
- Customers 11,229 89 1 6 159 3,277 10,546
Cash liabilities
B.5 Deposits and current accounts
- Banks 3,792
- Customers 1,557,879
B.6 Debt securities
B.7 Other liabilities
Off balance sheet transactions
B.8 Financial derivatives with exchange of capital
- long positions
- short positions
B.9 Financial derivatives without
exchange of capital
- long positions
- short positions
B.10 Deposits and loans to be settled
- long positions
- short positions
B.11 Irrevocable commitments to
lend funds
- long positions
- short positions
B.12 Financial guarantees given
B.13 Financial guarantees received
B.14 Credit derivatives with exchange of capital
- long positions
- short positions
B.15 Credit derivatives without exchange of capital
- long positions
- short positions

1.2 Detail by contractual residual maturity of financial assets and liabilities in other currency than Euro
ANNUALREPORT 2017109 |
Type / Residual maturity On demand 1 - 7 7 - 15 15 - 30 1 - 3 3 - 6 6 -12 1 - 5 Over 5 Unde-days days days months months months years years fined
Cash assets
B.1 Government bonds 2,804 26 5 16,137 2,279 5,238 82,343 468
B.2 Other debt securities 96 6,674 342 15,808 16,127 20,599 312,624 6,162
B.3 UCI units
B.4 Loans
- Banks 67,542 54,205
- Customers 25 91
Cash liabilities
B.5 Deposits and current accounts
- Banks 304
- Customers 564,068 167 2,172 4,752 2,383
B.6 Debt securities
B.7 Other liabilities
Off balance sheet transactions
B.8 Financial derivatives with exchange of capital
- long positions
- short positions
B.9 Financial derivatives without exchange of capital
- long positions
- short positions
B.10 Deposits and loans to be settled
- long positions
- short positions
B.11 Irrevocable commitments to
lend funds
- long positions
- short positions
B.12 Financial guarantees given
B.13 Financial guarantees received
B.14 Credit derivatives with exchange of capital
- long positions
- short positions
B.15 Credit derivatives without exchange of capital
- long positions
- short positions
5.5 Operational risk
Format and content of information on operational risk and relative hedging policies
5.5.1 General aspects, operating procedures and methods for measuring operational risk
Operational risks represent the risk of loss caused by inadequate and failure of processes, human resources and internalsystem, or caused by external events.
Operational risk does not include strategic and reputational risks, but includes legal risk, which is the risk of loss fromviolations of laws and regulations, contractual or non-contractual liability, or other disputes.
Operational risks include, among other things, administrative risk (for example, absence or inadequacy of line controls),human resources risk (for example, a lack of professional training for staff), and IT risk (for example, inadequacy of thecomputer system that could cause loss of data or interruption of operations).
The Institute is defining a framework for operational risk management, establishing the organizational processes formeasurement, management and control of that risk. More specifically, the risk assessment framework for the Institute’s activ-ities provides an assessment of the operational risk of each process (unmitigated risk), a verification of the tools for monitor-ing and mitigation of this risk and an assessment of the residual risks (mitigated risk).
Extraordinary losses and operating losses have been recorded during 2017 for a total amount of EUR 222,500 in consid-eration of the lower recovery compared to the returns expected by customers following unauthorized external transactionsin 2016 related to external transactions not authorized (credit cards and payment services). However, it should be noted thatthe provision for allowances for risk and charges, allocated for EUR 3.5m as at 31 December 2016, was used for payment ofprevious tax issued with other countries for EUR 2.3m. The remainder, equal to EUR 1.2m, has been kept pending the for-mal conclusion on this issue.
For more information on contingent liabilities related to an investment fund held in a proprietary portfolio, refer to para-graph “Estimates that contain elements of uncertainty” in part 1.
ANNUALREPORT 2017110 |

PART 6. informAtion concerning equity
6.1 Shareholders’ Equity
6.1.1 Qualitative information
The Institute’s equity represents capital funding provided by the owner or generated by the business to create value.In managing capital (a broader concept than “equity” presented in the balance sheet and consistent with regulatory cap-
ital, which is not comprised solely of equity in the strict sense), the Institute’s objectives are:• to safeguard the Institute’s ability to continue as a going concern, so that it can continue to provide benefits for all stake-
holders;• to maintain a strong capital base to support business growth.The Institute pursues its objectives of capital management during the planning processes, through the analysis of risks
associated with planned activities, and during the monitoring processes through the analysis and monitoring compliancewith limits.
In managing capital, the Institute observes regulatory capital requirements established by the regulatory frameworkrelated to prudential supervision.
6.1.2 Quantitative information
1 Detail
ANNUALREPORT 2017111 |
2017 2016
1.Capital 300,000 300,000
2.Reserves
a) Earning reserves
(i) Unavailable 100,000 100,000
(ii) Available 282,134 282,134
(iii) Other
b) Other
3.Equity instruments
4.Valuation reserves
a) Available for sale assets 2,161 499
b) Tangible assets
c) Intangible assets
d) Hedging of foreign investments
e) Cash flows hedging
f) Exchange differences
g) Non current assets held for sale
h) Actuarial gains (losses) on defined benefit plans (57,110) (46,034)
i) Share of valuation reserves connected with investments carried at equity
5.Profit (loss) for the year 31,934 36,001
Total 659,119 672,600

Capital, clearly identified as a component of Equity, represents a permanent endowment that cannot be reduced or dis-tributed, except in case of cessation or liquidation of the entity.
Unavailable Reserves are profit reserves designed to further strengthen the Institute’s Equity and long-term stability.Available or “distributable” Reserves are earnings available for distribution, subject to a resolution of the Commission of
Cardinals.Fair Value Reserves for available for sale securities represent the net fair value gain/loss recognized on investment securi-
ties classified as available for sale.Post-employment benefit actuarial gain (loss) Reserves represent the actuarial unrealised gain or loss related to the post-
employment benefit plans.
2 Fair value reserve of financial assets available for sale: detail
3 Fair value reserve of financial assets available for sale: annual changes
ANNUALREPORT 2017112 |
2017 2016
Positive Negative Positive NegativeReserve Reserve Reserve Reserve
1.Debt securities
2.Equity securities 2,161 499
3.UCI units
4.Loans
Total 2,161 499
Debt Equity UCIsecurities securities units Loans
1.Opening balance 499
2.Positive changes
2.1 Fair value increases 1,662
2.2 Reclassification from negative reserves to the Income statement:
From Impairment
From disposal
2.3 Other changes
3.Negative changes
3.1 Fair value decreases
3.2 Impairment
3.3 Reclassification from positive reserves to the Income statement:
From disposal
3.4 Other changes
4.Closing balance 2,161

4 Valuation reserves related to defined benefit plans: annual changes
6.2 Own equity and prudential supervision ratios
1 Own equity
Capital is defined by AIF Regulation No.1 art. 3 (8) as the initial funding or subsequent integration of capital by the HolySee or the Vatican City State.
a) it is paid pursuant to the legislation of the Holy See and the Vatican City State;b) it is clearly and distinctly identified in the financial statements;c) it cannot be reduced or distributed, except in the case of cessation or liquidation of the entity, ensuring that it is distrib-
uted proportionality to legitimate creditors, according to the legislation of the Holy See and the Vatican City State andacquired by the Apostolic See.
For regulatory purposes, the term “Capital” shall be considered as equivalent to “core capital”.The Supplemental Capital is defined under AIF Regulation No. 1 art. 3 (68) as the sum of retained earnings, accumulated
as other comprehensive income and other reserves.The Common Equity is defined under Regulation No. 1, art. 3 (12) as:• the sum of the following positive components:
a. the Capital;b. the supplemental capital;
ANNUALREPORT 2017113 |
Defined Pension Staff severancebenefit plan plan liabilities fund
1.Opening balance (46,034) (44,292) (1,742)
2.Positive changes
2.1 Post-employment benefit actuarial gain of the year 122 122
3.Negative changes
3.1 Post-employment benefit actuarial loss of the year (11,198) (11,198)
4.Closing balance (57,110) (55,490) (1,620)
2017 2016
A.Positive components
1. Capital 300,000 300,000
2. Supplemental Capital
a) Retained earnings
(i) Unavailable 100,000 100,000
(ii) Available 282,134 282,134
(iii) Others
b) Provisions
c) Reserves (54,948) (45,535)
3. Positive prudential filter IAS/IFRS
B.Negative components
1. Goodwill
2. Intangible assets (871) (1,044)
3. Impairments on loans
4. Losses recognized in previous years and in current year
5. Regulatory downs of assets carried at fair value
6.Negative prudential filter IAS/IFRS (1,081) (250)
Common Equity 625,234 635,305

• deducting the following components (if negative):a. goodwill;b. intangible assets;c. adjustments to the value of receivables;d. losses recognized in previous financial periods and in the current period;e. adjustments to the regulatory value of assets valued at their “fair value”.
For regulatory purposes, “common equity” shall be considered as equivalent to “common equity tier 1”.Regulatory capital consists of common equity and is calculated by the Institute on a monthly basis, although only
required to be calculated by the Supervisory Authority quarterly.As required, the amount of annual and half-yearly earnings, excluding the amounts that can potentially be allocated to
dividends, contributes to the calculation of regulatory capital for the months of December and June.The Common Equity at the end of 2017 amounted to EUR 625.2m (2016: EUR 635.3m).Considering the items comprising the Institute’s equity, the sole prudential filter in common equity at 31 December 2017
is associated with the positive fair value reserve relating to the investment securities held in the Available for Sale portfolio.This reserve is computed using a negative prudential filter, for an amount equal to 50%.
In the calculation of the Regulatory Capital 2017, the Net profit for the year not included, as it is considered fully distrib-uted.
6.2.2 Capital adequacy
The monitoring of key ratios is performed daily by the Risk Management Department, in order to continuously monitorcompliance with regulatory requirements. The table below shows the data relating to capital requirements at the end of 2017and at the end of 2016 for comparison.
ANNUALREPORT 2017114 |
Unweighted amounts Weighted amounts/Capital requirements
2017 2016 2017 2016
A. Risk asset
A.1 Credit and counterparty risk
1. Standardised approach 861,541 1.333,514 306,678 360,173
2. Approach based on internal ratings
2.1 Based
2.2 Advanced
3. Securitizations
B. Capital requirements
B.1 Credit and counterparty risk 24,534 28,814
B.2 Credit valuation adjustment risk
B.3 Settlement risk
B.4 Market risk
1. Standardised approach 41,700 40,245
2. Internal model
3. Concentration risk
B.5 Operational risk
1. Basic indicator approach 7,043 9,699
2. Standardised approach
3. Advanced approach
B.6 Other calculation elements
B.7 Total capital requirements 73,278 78,758
C. Risk weighted assets and capital ratios
C.1 Risk-weighted assets 915,971 984,472
C.2 Capital/ Risk-weighted assets 32.75% 30.47%
C.3 Common equity/Risk-weighted assets 68.26% 64.53%

ANNUALREPORT 2017115 |
PART 7. relAted pArty trAnsActions
Related parties of the Institute include key management personnel (Directorate and Board of Superintendence), theCommission of Cardinals and the Revisori.
Transactions with these related parties relate to salaries and remuneration
Details of key management compensation
Compensation due to related parties was EUR 731,200 in 2017, of which EUR 323,200 was not yet paid as of 31 Decem-ber 2017. Specifically, these expenses relate to:
• EUR 340,000 for the Board of Superintendence of which EUR 240,000 has not yet been paid;• EUR 308,000 for the Directorate;• EUR 83,200 for the Revisori, completely to be paid.These amounts are recognized in the Income Statement as Operating Expenses.
Related-party transactions
During 2017, no transactions with key management were entered into, except for the management of the depositaccounts opened with the Institute and salaries and remuneration discussed above.
As of the balance sheet date, the balance of deposits by the members of the Commission of Cardinals was EUR 3.02m.Key management personnel and Revisori had deposits totaling EUR 33,000.The Institute has a long-term zero-interest loan to its subsidiary S.G.I.R. S.r.l., amounting to EUR 2.8m. Furthermore the
Institute signed the loan for the use of 5 real estate properties at no cost with its subsidiary, S.G.I.R. S.r.l. During 2017,S.G.I.R. S.r.l. earned rental income for EUR 57,000 on these properties.


RepoRt
oF the
ReviSoRi


ANNUALREPORT 2017119 |
To the Board of Superintendence of the Istitute
In this report, drawn up in accordance with Article 28 of the Statute, the Board of Auditors of the Institute
(the “Institute” or the “IOR”) remarks on the annual financial statements, the report and the supporting
documents, as prepared by the Directorate for the financial year 2017.
As in previous years, once again in the course of this year in performing its tasks the Board of Auditors has
been constantly focused on proving its full loyalty and compliance with the Will of the Holy Father, who
demands respect for the Statutory provisions and impartiality and independence in our role.
During the financial year, the Board of Statutory Auditors convened periodically to perform its duties and
attended, upon invitation, all the meetings of the Board of Superintendence.
The meetings of the Board of Auditors were characterized by intense work sessions and benefited from the
members’ diverse skills as well as the solid support of the President, the Directorate and, where necessary,
the Institute’s Administration and Control Functions.
The Board also noted that in 2017, through the provision of dedicated services, the Institute confirmed its
commitment to serving the Holy Father in the fulfilment of his mission as universal pastor.
Activities carried out in compliance with the Statute’s provisions
The Board reports that, in accordance with Article 27 of the Statute, during 2017 it carried out the audits of
treasury assets falling within its jurisdiction, as well as the administrative and accounting review of the
books and accounts, also by obtaining information from the heads of the internal control functions, and has
no remarks to make in this respect.

ANNUALREPORT 2017120 |
2017 financial statements
Pursuant to Article 28 of the current Statute, the Board of Auditors of the Institute examined the 2017
financial statements (“Financial Statements”) and the Management Report.
The Financial Statements were drawn up in accordance with the Circular on the Preparation of the Annual
Financial Statements and Consolidated Financial Statements of Entities carrying out Financial Activities
on a Professional Basis, issued by the Financial Information Authority on 15 December 2016; the compar-
ison with the previous year’s data is consistent given that the financial statements at 31.12.2016 had
already been drawn up in accordance with the provisions laid down in the previously mentioned Circular
Letter
The Financial Statements are made up of the following:
• Balance Sheet
• Profit and Loss Statement
• Comprehensive Profit and Loss Statement
• Statement of Changes in Equity
• Statement of Cash Flows
The Annual Report includes the above documents as well as a description of the Institute’s activities, a
summary of the accounting policies as well as the risks and uncertainties linked to the use of estimates, the
explanatory notes to the Financial Statements, and financial risk information prepared in accordance with
the Vatican rules on prudential supervision.
The Financial Statements may be summarised as follows:
EUR000
BALANCE SHEET
Total assets 2,999,008
Total liabilities 2,339,889
Net assets 659,119
PROFIT AND LOSS ACCOUNT
Net result from financial activities 50,933
Net operating profit 31,934

ANNUALREPORT 2017121 |
The Financial Statements have been audited by Deloitte & Touche S.p.A., which expressed a clean and
unqualified opinion on 20 April 2018.
Based on the audits that have been performed, and taking into account the conclusions drawn by the inter-
nal control functions and the audit firm’s unqualified opinion, this Board of Auditors:
– is in favour of the approval of the 2017 financial statements (Financial Statements) included in the
Annual Report, as prepared by the Directorate;
– agrees with the proposed allocation of the net operating profit.
The approval of the 2017 Annual Balance Sheet (Financial Statements) has also coincided with the end of
the current Board of Auditors’ mandate. We wish to thank the Commission of Cardinals and the Board of
Superintendence for the confidence they have placed in us and also the Institute’s governing bodies for
their constant and effective cooperation that has enabled us to provide our professional assistance, serving
the Holy Church and the Holy Father.
Vatican City State, 20 April 2018
President of the Board of Statutory Auditors
This report has been translated into the English language solely for convenience of international readers.


RepoRt
oF the
exteRnal
auditoRS


ANNUALREPORT 2017125 |

ANNUALREPORT 2017126 |

ANNUALREPORT 2017127 |

PressIger & Partners S.r.l.
Rome - Italy
Rome, 22 May 2018