aalborg universitet tensile strength of glass fibres lund...
TRANSCRIPT

Aalborg Universitet
Tensile strength of Glass Fibres
Lund, Majbritt
Publication date:2010
Document VersionEarly version, also known as pre-print
Link to publication from Aalborg University
Citation for published version (APA):Lund, M. (2010). Tensile strength of Glass Fibres. (1. ed.) Uniprint, Aalborg Universitet: Aalborg Universitet.
General rightsCopyright and moral rights for the publications made accessible in the public portal are retained by the authors and/or other copyright ownersand it is a condition of accessing publications that users recognise and abide by the legal requirements associated with these rights.
? Users may download and print one copy of any publication from the public portal for the purpose of private study or research. ? You may not further distribute the material or use it for any profit-making activity or commercial gain ? You may freely distribute the URL identifying the publication in the public portal ?
Take down policyIf you believe that this document breaches copyright please contact us at [email protected] providing details, and we will remove access tothe work immediately and investigate your claim.
Downloaded from vbn.aau.dk on: June 16, 2019

TENSILE STRENGTH OF GLASS FIBRES MAJBRITT D. LUND
Section of Chemistry Aalborg University
Ph.D. Dissertation, 2010

PHD Dissertation
Tensile strength of glass fibres
by
Majbritt D. Lund
Section of Chemistry Department of Biotechnology, Chemistry and
Environmental Engineering Aalborg University
Date of defence
18.02.2010
Assessment committee
THORKILD HVITVED-JACOBSEN Professor emeritus
Department of Biotechnology, Chemistry and Environmental
Engineering Aalborg University
JOHN MAURO Senior Research Scientist
Science and Technology Division Corning Incorporated
Corning, NY 14831, USA
JOACHIM DEUBENER Prof. Dr.-Ing. habil.
Institute of Nonmetallic Materials Clausthal University of Technology
38678 Clausthal-Zellerfeld, Germany
Supervisor
YUANZHENG YUE Professor
Department of Biotechnology, Chemistry and Environmental
Engineering Aalborg University

Printed in Denmark by UNIPRINT, Aalborg University, December 2010 ISBN 978-87-90033-74-3

Preface This dissertation is submitted to the Faculty of Engineering, Science and Medicine in partial fulfilment of the requirement for obtaining the Ph.D. degree. The work is presented as a plurality, including an introduction which discusses central issues of the work that are not presented in details in the following articles. The main results and discussion of these are found in the 5 articles which follow the introduction. The Ph.D. study was carried out at the Section of Chemistry in the Department of Biotechnology, Chemistry and Environmental Engineering at Aalborg University from 2004 to 2009. This project is a part of an industrial agreement between Aalborg University and Rockwool International A/S in which the main interest was to establish further knowledge about the mechanical brittleness of stone wool fibres as formulated in the Myrddin project. I would like to thank my supervisor Yuanzheng Yue for his help and guidance throughout this project. I am grateful for the many giving and encouraging discussions I have had throughout the project with the project leaders from Rockwool International A/S, Søren Primdahl and Dorthe Lybye. A kind acknowledgement also goes to the Laboratory at Rockwool, where I spend some very good days in their friendly and helpful environment. Special attention and thanks are given to Pia Nielsen for her large and tedious work made at the tensile testing rig, and Winni Krøs for her kind guidance and assistance. Noemi Rozlosnik at Danish Polymer Centre, Risø is kindly thanked for providing access to AFM facilities and help and introduction to the applied methods. Members of the inorganic materials group at AAU are thanked for many hours of great fun and scientific discussions, Lasse Hornbøll and Nadja Lonnroth deserve special mentioning. My fellow PhD colleagues and technicians at Section of Chemistry need huge recognition for always providing nice and good working and lunch conditions both in and out of normal working hours. It is a real pleasure to have so good colleagues. In both scientific and non-scientific issues it has been a great pleasure to share the office with Anne Louise Nielsen, who has had to turn her ears to many of my frustrations along the way. Finally I would like to thank my family for all their extreme patience and support.
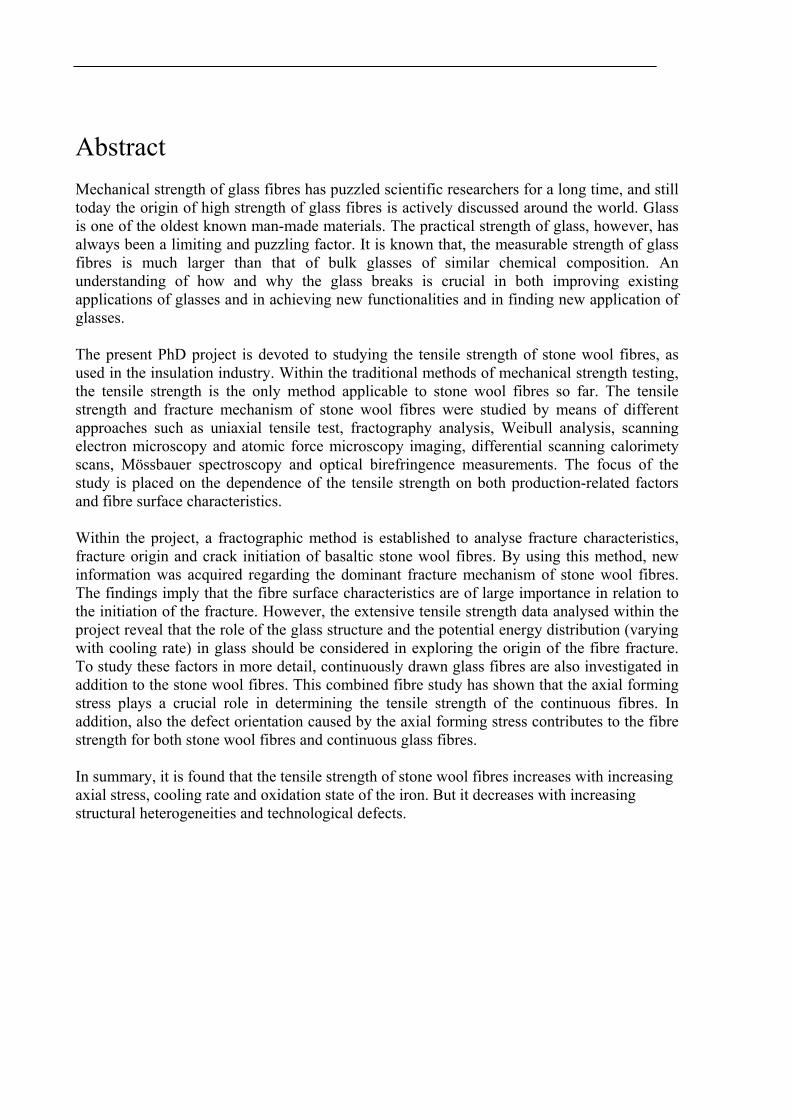
Abstract Mechanical strength of glass fibres has puzzled scientific researchers for a long time, and still today the origin of high strength of glass fibres is actively discussed around the world. Glass is one of the oldest known man-made materials. The practical strength of glass, however, has always been a limiting and puzzling factor. It is known that, the measurable strength of glass fibres is much larger than that of bulk glasses of similar chemical composition. An understanding of how and why the glass breaks is crucial in both improving existing applications of glasses and in achieving new functionalities and in finding new application of glasses. The present PhD project is devoted to studying the tensile strength of stone wool fibres, as used in the insulation industry. Within the traditional methods of mechanical strength testing, the tensile strength is the only method applicable to stone wool fibres so far. The tensile strength and fracture mechanism of stone wool fibres were studied by means of different approaches such as uniaxial tensile test, fractography analysis, Weibull analysis, scanning electron microscopy and atomic force microscopy imaging, differential scanning calorimety scans, Mössbauer spectroscopy and optical birefringence measurements. The focus of the study is placed on the dependence of the tensile strength on both production-related factors and fibre surface characteristics. Within the project, a fractographic method is established to analyse fracture characteristics, fracture origin and crack initiation of basaltic stone wool fibres. By using this method, new information was acquired regarding the dominant fracture mechanism of stone wool fibres. The findings imply that the fibre surface characteristics are of large importance in relation to the initiation of the fracture. However, the extensive tensile strength data analysed within the project reveal that the role of the glass structure and the potential energy distribution (varying with cooling rate) in glass should be considered in exploring the origin of the fibre fracture. To study these factors in more detail, continuously drawn glass fibres are also investigated in addition to the stone wool fibres. This combined fibre study has shown that the axial forming stress plays a crucial role in determining the tensile strength of the continuous fibres. In addition, also the defect orientation caused by the axial forming stress contributes to the fibre strength for both stone wool fibres and continuous glass fibres. In summary, it is found that the tensile strength of stone wool fibres increases with increasing axial stress, cooling rate and oxidation state of the iron. But it decreases with increasing structural heterogeneities and technological defects.
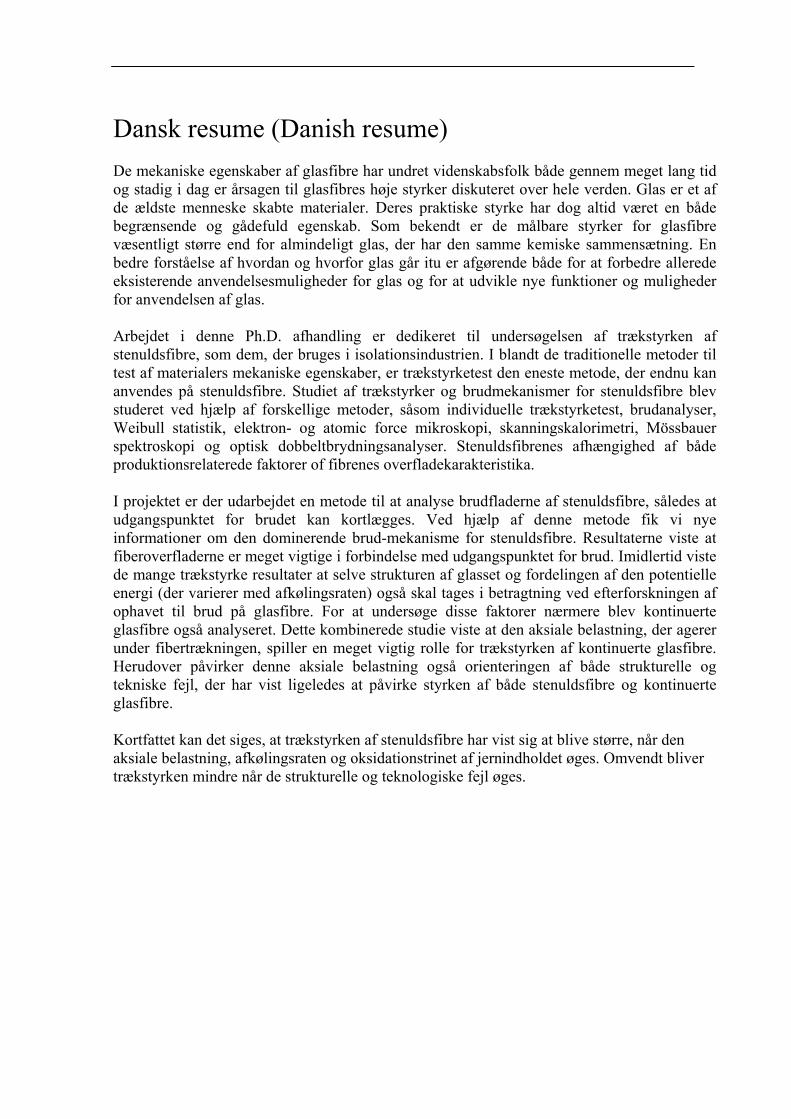
Dansk resume (Danish resume) De mekaniske egenskaber af glasfibre har undret videnskabsfolk både gennem meget lang tid og stadig i dag er årsagen til glasfibres høje styrker diskuteret over hele verden. Glas er et af de ældste menneske skabte materialer. Deres praktiske styrke har dog altid været en både begrænsende og gådefuld egenskab. Som bekendt er de målbare styrker for glasfibre væsentligt større end for almindeligt glas, der har den samme kemiske sammensætning. En bedre forståelse af hvordan og hvorfor glas går itu er afgørende både for at forbedre allerede eksisterende anvendelsesmuligheder for glas og for at udvikle nye funktioner og muligheder for anvendelsen af glas. Arbejdet i denne Ph.D. afhandling er dedikeret til undersøgelsen af trækstyrken af stenuldsfibre, som dem, der bruges i isolationsindustrien. I blandt de traditionelle metoder til test af materialers mekaniske egenskaber, er trækstyrketest den eneste metode, der endnu kan anvendes på stenuldsfibre. Studiet af trækstyrker og brudmekanismer for stenuldsfibre blev studeret ved hjælp af forskellige metoder, såsom individuelle trækstyrketest, brudanalyser, Weibull statistik, elektron- og atomic force mikroskopi, skanningskalorimetri, Mössbauer spektroskopi og optisk dobbeltbrydningsanalyser. Stenuldsfibrenes afhængighed af både produktionsrelaterede faktorer of fibrenes overfladekarakteristika. I projektet er der udarbejdet en metode til at analyse brudfladerne af stenuldsfibre, således at udgangspunktet for brudet kan kortlægges. Ved hjælp af denne metode fik vi nye informationer om den dominerende brud-mekanisme for stenuldsfibre. Resultaterne viste at fiberoverfladerne er meget vigtige i forbindelse med udgangspunktet for brud. Imidlertid viste de mange trækstyrke resultater at selve strukturen af glasset og fordelingen af den potentielle energi (der varierer med afkølingsraten) også skal tages i betragtning ved efterforskningen af ophavet til brud på glasfibre. For at undersøge disse faktorer nærmere blev kontinuerte glasfibre også analyseret. Dette kombinerede studie viste at den aksiale belastning, der agerer under fibertrækningen, spiller en meget vigtig rolle for trækstyrken af kontinuerte glasfibre. Herudover påvirker denne aksiale belastning også orienteringen af både strukturelle og tekniske fejl, der har vist ligeledes at påvirke styrken af både stenuldsfibre og kontinuerte glasfibre. Kortfattet kan det siges, at trækstyrken af stenuldsfibre har vist sig at blive større, når den aksiale belastning, afkølingsraten og oksidationstrinet af jernindholdet øges. Omvendt bliver trækstyrken mindre når de strukturelle og teknologiske fejl øges.

Table of contents 1. Introduction ........................................................................................................................1
1.1. Motivation ..................................................................................................................1 1.2. Scope ..........................................................................................................................3 1.3. Outline of the thesis....................................................................................................4 1.4. Examined samples ......................................................................................................4
2. Glass fibre strength.............................................................................................................5 2.1 Background.................................................................................................................5 2.2. Thermal and mechanical history ................................................................................6 2.2.1 Thermal history ......................................................................................................7
Memory effect of the melt ..................................................................................................7 Melt homogeneity of basaltic glass melts ..........................................................................7 Cooling rate ........................................................................................................................7
2.2.2. Mechanical history .................................................................................................8 3. Tensile test method...........................................................................................................11
3.1. Method of tensile strength tests ................................................................................11 3.2. Bias due to early failure of very weak fibres............................................................12 3.3. Bias due to fibre diameter variation .........................................................................12 3.4. Further issues about tensile testing...........................................................................13 3.4.1. Testing speed ........................................................................................................13 3.4.2. Testing gauge length.............................................................................................14 3.4.3. Testing atmosphere...............................................................................................14 3.5. Future experiments to support the present results ....................................................14 3.5.1. Two point bending................................................................................................14 3.6. Summary...................................................................................................................15
4. Fractography.................................................................................................................16 4.1. Fractography of fracture surfaces of stone wool fibres ............................................16 4.2. Summary...................................................................................................................20
5. Statistical analysis of strength data...................................................................................21 5.1. Weibull distribution..................................................................................................22 5.2. Weakest link theory..................................................................................................23 5.3. Weibull distribution and tested fibre volume ...........................................................24 5.3.1 Sensitivity of the tensile strength to diameter or length .......................................25 5.4. The role of multiple flaw distributions .....................................................................26 5.5. Summary...................................................................................................................28
6. Size effect .........................................................................................................................29 6.1. Size effect for stone wool fibres ...............................................................................29 6.2. Summary...................................................................................................................32
7. Homogenisation effect..................................................................................................33 7.1. Case study – homogenisation of the basaltic glass melt...........................................33 7.2. Summary...................................................................................................................34
8. Impact of heat treatments .................................................................................................35 8.1. AFM study of surface responses to sub-Tg heat treatments .....................................35 8.2. Strength development upon sub-Tg heat treatments .................................................41 8.3. Case study – brake pallets reinforced by stone wool fibres .....................................45

9. Impact of humidity treatment.............................................................................. 46
9.1. Humidity treatment of stone wool fibres ................................................................. 46 9.3. Summary .................................................................................................................. 52
10. Summary ............................................................................................................. 53 Bibliography............................................................................................................................. 55 List of papers............................................................................................................................ 63 Paper 1:
Influences of chemical aging on the surface morphology and crystallization behavior of basaltic glass fibers. Journal of Non-Crystalline Solids 354 (2008) 1151-1154. Authors: Majbritt D. Lund and Yuanzheng Yue
Paper 2:
Fractography and strength of glass wool fibres. Journal of the Ceramic Society of Japan 116 (2008) 841-845.
Authors: Majbritt D. Lund and Yuanzheng Yue Paper 3: Impact of Drawing Stress on the Tensile Strength of Oxide Glass Fibers. Journal
of The American Ceramic Society, 93 [10] (2010) 3236-3243. Authors: Majbritt D. Lund and Yuanzheng Yue Paper 4: Impact of the oxidation state of iron on the tensile strength of stone wool fibres.
Glass Technology: European Journal of Glass Science and Technology Part A, 51 (3), (June 2010), 97-102.
Authors: Majbritt D. Lund, Yuanzheng Yue and Dorthe Lybye
1
1. Introduction
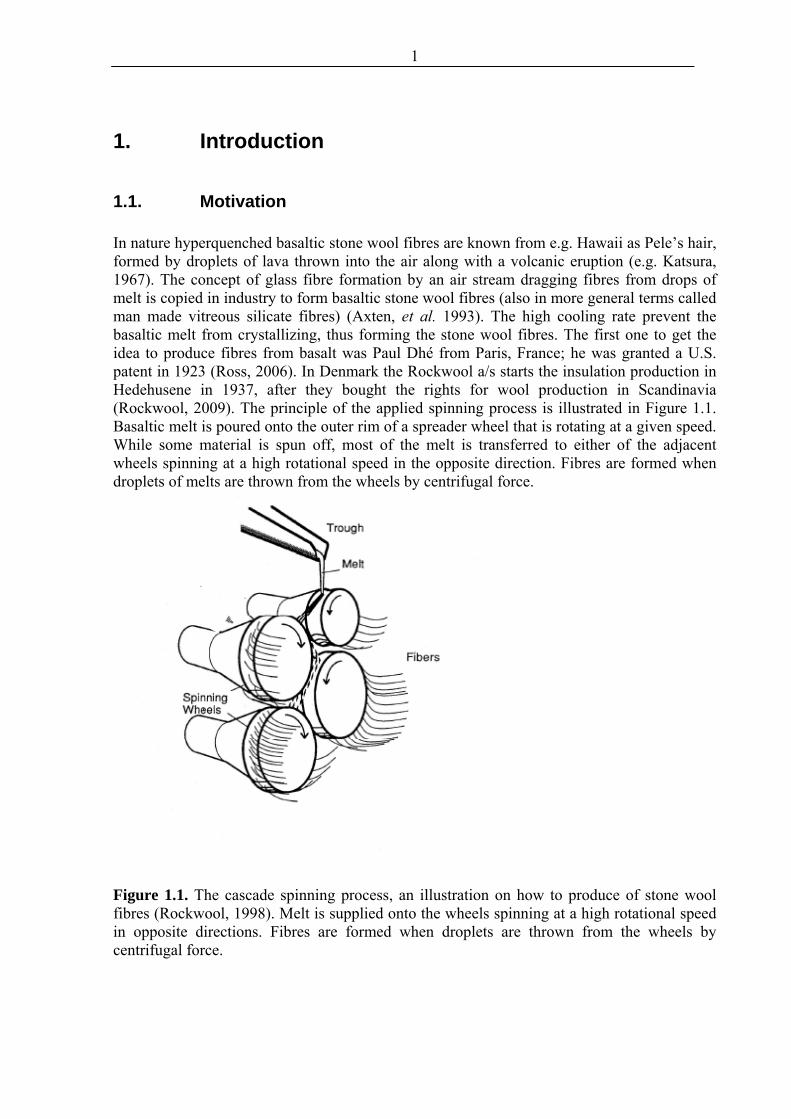
1.1. Motivation In nature hyperquenched basaltic stone wool fibres are known from e.g. Hawaii as Pele’s hair, formed by droplets of lava thrown into the air along with a volcanic eruption (e.g. Katsura, 1967). The concept of glass fibre formation by an air stream dragging fibres from drops of melt is copied in industry to form basaltic stone wool fibres (also in more general terms called man made vitreous silicate fibres) (Axten, et al. 1993). The high cooling rate prevent the basaltic melt from crystallizing, thus forming the stone wool fibres. The first one to get the idea to produce fibres from basalt was Paul Dhé from Paris, France; he was granted a U.S. patent in 1923 (Ross, 2006). In Denmark the Rockwool a/s starts the insulation production in Hedehusene in 1937, after they bought the rights for wool production in Scandinavia (Rockwool, 2009). The principle of the applied spinning process is illustrated in Figure 1.1. Basaltic melt is poured onto the outer rim of a spreader wheel that is rotating at a given speed. While some material is spun off, most of the melt is transferred to either of the adjacent wheels spinning at a high rotational speed in the opposite direction. Fibres are formed when droplets of melts are thrown from the wheels by centrifugal force.
Figure 1.1. The cascade spinning process, an illustration on how to produce of stone wool fibres (Rockwool, 1998). Melt is supplied onto the wheels spinning at a high rotational speed in opposite directions. Fibres are formed when droplets are thrown from the wheels by centrifugal force.
2
The produced fibres are discontinuous vitreous fibres with diameters of 3-15 μm and lengths three orders of magnitude larger than the diameter. Wool fibre are mainly applied for heat and acoustic insulation, since the individual fibres form an intertwined network that traps and fix the air. Two main types of insulation wool fibres are produced; these are glass wool fibres and stone wool fibres, both of which are vitreous silicate fibres. Glass wool fibres consist principally of sodium, calcium and magnesium silicates, but may contain smaller amounts of other elements, including boron. The boron contents originate from the use of borates in the glass melting process as a glass former and a flux agent. Typically the raw materials are melted in gas or electrical furnaces and spun by use of a spinning cup method (Axten, et al. 1993). Stone wool fibres consist principally of alumina, calcium and magnesium silicates, which are typically produced from basalt or basalt-like raw materials. Typically the raw materials are melted in a Cupola furnace. The cascade spinning process illustrated in Figure 1.1 is commonly used for the fibre spinning process. Due to their good chemical durability and higher thermal stability stone wool fibres are more favourable than glass wool in chemical aggressive environments and as fire safe products. Beside this, basalt is a low cost and widely available raw material all over the world. In addition to insulation applications, basaltic fibres have recently been applied as reinforcement fibres in a variety of materials; e.g. in the fields of cement industry, automobile- and wind turbine production and even in strengthening of snow boards (Ross, 2006). As reinforcement materials, the advantage of basaltic fibres is again their chemical durability combined with especially the stiffness and strength. The mechanical properties as well as the surface properties (the ability to bind into the different materials which are to be strengthened) are main areas of interest from the reinforcement industry. This project is a part of an industrial project based on the collaboration agreement (called the Myrddin project) between Aalborg University and Rockwool International A/S. The main purpose of the Myrddin project is to establish further knowledge about the mechanical brittleness of basaltic stone wool fibres as produced by Rockwool International A/S. The research within the project is therefore mainly performed for basaltic and basalt-like stone wool fibres. Glass fibres of different chemical compositions and production methods have been included to a limited extend, in order to relate the new data to general issues in the glass technology research area. The mechanical brittleness is a complex quantity even for the case of glass in general (bulk glass). The term brittleness of a solid is not well defined, but brittleness is related to the tendency of the material to fracture upon stress, strain or impact. From the notion of indentation Lawn and Marshall have proposed the general concept that all material experiences deformation at low loads and fracture at high loads ((Lawn and Marshall, 1979)). Fracture toughness (Kic) was long used as a measure of glass brittleness; however, Kic values for glass are all in a narrow range and may therefore not be indicative of brittleness. A classification based on Vickers Indentations in which the brittleness is calculated as the ratio between the hardness (H) and fracture toughness (Kic)(Lawn and Marshall, 1979; Quinn and Quinn, 1997; Sehgal, et al. 1995) is presently used in the glass society. In the case of stone wool fibres (and glass fibres in general) this classification cannot be used, since typical measurements of indentations are difficult to perform due to the small dimensions of the fibres. No appropriate alternative measurement methods have been established in the field. Hence to initiate research in the field of mechanical brittleness of stone wool fibres we focus

3
on the measurable quantity of mechanical strengths, more specifically the tensile strength. This approach is supported by the work of Sehgal (Sehgal and Ito, 1999). His results indicate a strong relation between the crack initiation and the brittleness. These results can be used in relation to glass fibres and stone wool fibres since the brittle fracture in general is a result of crack initiation and crack growth, which is directly reflected in the strength of the brittle material. The strength of brittle material will reflect the intrinsic fracture toughness and a distribution of flaws (size, orientation and position) present in the material. The flaws will act as origin of the crack; hence they are directly related to the crack initiation. The subsequent crack growth can be seen as a result of the resistance of the material to fracture (hence the intrinsic fracture toughness). Therefore a detailed study of the tensile strength of stone wool fibres is expected to provide insight in the crack initiation and thereby help in deciphering the high strength and brittleness of stone wool fibres. Additionally much scientific research is focused on the high tensile strength of glass fibres compared to bulk glass. Over the years both fibre diameters, fibre surfaces and glass structure have diligently been analysed and discussed as main impact factors both limiting and causing the observed high tensile strength of glass fibres. The aim of the analyses included in the present project is to contribute to this basic discussion.
1.2. Scope The scope of this project is to study the dependence of the tensile strength of stone wool fibres on various factors and to understand the fracture characteristics. These factors are:
a) Production-related factors:
i. hyperquenching, ii. melting atmosphere
iii. fibre diameter variations and iv. applied axial tension during forming
b) Fibre surfaces characteristics: i. surface homogeneity,
ii. surface roughness and iii. surface reactivity
These factors are of course highly correlated. This correlation will be discussed both in the short overview part of the thesis and in the four articles belonging to this thesis. The mechanical performances of both continuous and discontinuous fibres will be studied by measuring their tensile strength as functions of the production parameters. Annealing experiments are performed on all types of fibres. Additional analysing methods such as differential scanning calorimetry (DSC) and Mössbauer analyses are important in clarifying the thermal, chemical and mechanical histories of the fibres. The fibre surfaces are studied by use of scanning electron microscopy (SEM), atomic force microscopy (AFM) and transmission electron microscopy (TEM).

4
1.3. Outline of the thesis The thesis will be presented as a plurality including an introductory overview followed by papers written for publication (two published and two submitted). The main goal of the overview is to give some background and a description of the strength discussions, measurements and analyses which are included in the papers. The papers are based on the results of the research made in the present project.
1.4. Examined samples Stone wool fibres of basaltic composition are the main objects of the present study. Therefore if nothing else is noted, the samples are wool fibres produced by the cascade spinning process. Throughout the project, a pure basaltic stone melt of basalt raw materials from Obersheld in Germany was used. Samples of this melt are labelled Ob2. The chemical composition of the pure basalt wool is slightly different to the industrial production. The reason why this composition was used was to ensure that fibre production of both continuous and wool fibres was possible. The industrial basalt-like composition does not allow fibre drawing of continuous fibres. Basalt-like compositions similar to those of the Rockwool insulation materials are used in part of the work (e.g. Paper 1 and 4). Here samples represent those obtained from both industrial productions (labelled with a capital I in the thesis) and laboratorial scale productions. At the laboratorial scale, the industrial composition was obtained by mixing either basaltic and limestone raw materials (these samples are labelled with a capital B) or pure chemicals (labelled with capital C). Continuous fibres were also used in this study. These were produced by a continuous drawing process with a crucible including a single orifice. The crucible has a dimension of 40×70 mm (diameter×height). In the middle of the bottom of the crucible, there is a die with the dimension of 2.0×3.0 mm (diameter×height). The crucible filled with glass was placed in an electrically heated cylinder furnace (SCANDIA type STTF 115/400-1550ºC, Allerød, Denmark), from which the fibres were continuously drawn at speeds between 1 and 50 m/s, and collected at a metallic drum. Continuous basaltic fibres produced from Obersheld basalt melt are labelled with a capital B followed by the drawing speed of the fibre production, i.e. B21. In addition to the basaltic and basalt-like compositions, both wool and continuous fibres of E-glass composition were produced and used in the study (e.g. Paper 2 and Paper 3). The wool fibres of E-glass composition are simply named E wool, and the continuous glass fibres of E-glass composition are labelled with a capital E followed by the drawing speed of the fibre production, i.e. E20.
5
2. Glass fibre strength Glass is one of the oldest known man-made materials; the practical strength of glass, however, has always been a limiting and puzzling factor. Still today the mechanical properties of glass fibres are twofold a) a special quality is the high strength b) the brittle fracture is limiting its application. An understanding of the structure of glass in relation to how and why it breaks is crucial in both improving existing applications of glasses and in new functionalities and application of all kinds of glasses, not only fibre glass.
2.1 Background Strength of a material is basically the resistance to break. When glass breaks it happens catastrophically – in brittle failure. There are two phenomena that dominate brittle failure; it is fast fracture and fatigue degradation. The failure mechanism is believed to be identical, but the time to failure is different. As mentioned in the previous section in glass the resistance to break is controlled by the possibility of a fracture to initiate and to grow; hence the origin and the intrinsic fracture toughness. Primary focus of the present study is the fast fracture. The theoretical strength is directly related to the stress it requires to break the chemical bonds between two adjacent atoms in the glass structure. This means that the inter-atomic spacing is proportional to the inverse of the theoretical strength. During fracturing two new surfaces are produced as the chemical bonds are broken (increasing the surface area). Orowan approximated the theoretical strength as the work per surface area supplied to produce fracture. The Orowan equation of theoretical strength, σ: (Mencik, 1992)
aE
sγσ = (2.1)
where γs = surface energy (fracture energy per surface unit), E = elastic modulus, a = intra-atomic distance. Hence the strength depends on the elastic modulus, the surface energy and the glass structure. In measuring the strength the actual experimental values of strength are only around 1/100 to 1/1000 of the theoretical strength. In the search of an explanation to why measured strength of glass is considerable lower than calculation of the strength required to break the chemical bonds, much research has already in the early days focused on the material surfaces. The earliest quantitative work on strength in glasses was performed in 1920 by Griffith, who used glass as a model material to investigate the influence of surfaces on material strength from an engineering point of view (Griffith, 1921). Based on the stress concentration analysis (developed by Inglis, 1913) Griffith hypothesized that the existence of cracks on the glass surfaces will lower the apparent strength of the material because stress concentration is experienced at the cracks as an external load is applied. The Griffith fracture theory is based on the statistical princip of minimum potential energy. In the case of crack growth the only contribution to energy changes result from the new fracture surfaces and converts strain energy of the material into fracture energy. Hence, the fracture will grow when it is energetically favourable. By his equation Griffith related the external load to the length of a pre-existing crack within the

6
glass. The Griffith equation is given in E.q. 2.2 where E is the elastic modulus and γ is the surface energy and c the length of the pre-existing crack (also called the Griffith flaw) (Griffith, 1921):
½2⎟⎠⎞
⎜⎝⎛=
cE
f πγσ (2.2)
In supposing this new fracture theory Griffith assumed the material to be homogenous, linearly elastic and isotropic and the applied stress to be constant. Furthermore he assumed the pre-existing crack to be a very narrow elliptical internal crack (in accordance to the calculations of Inglis (Inglis, 1913). The Griffith theory was the first to explain the large discrepancy between measured strength of glasses and theoretical strengths and has become basis of contemporary fracture mechanics. In the study of Griffith(Griffith, 1921) a number of glass rods and glass fibres are shown to exhibit a strong diameter related strength (σf ~1/d). Hence Griffith considered strength to be size dependant because larger pre-existing cracks statistically could exist in larger samples. The issues of size effect and the origin of the strength of glass (especially the origin of the observable high strength of glass fibres compared to other pieces of glass of similar chemical composition) have gained large interest throughout the last century in glass research. Back in 1955 Otto showed that by careful and constant fibre production conditions the relationship between fibre diameter and tensile strength disappeared (Otto, 1955). Several other researchers hereafter confirmed that a simple diameter-strength relationship did not exist. (Mould, 1958; Thomas, 1960; Cameron, 1966) These findings stress the need to understand more basically how and why glass breaks and especially to understand the origin of high tensile strength of thin glass fibres. The potential orientation of the surface molecules due to surface energies got a special position in the explanation of the size versus strength discussion. Citation from Griffith 1921: “The process of drawing, too, might predispose the molecules to take up positions with their maxima of attraction parallel to the surface.”(Griffith, 1921) Hence Griffith postulated a direct relation between and the high fibre tensile strength, glass structure and the fibre drawing process, but at that time he had no techniques available to test this hypothesis. The theory of orientations of surface molecules has been supported by several researchers as the mechanism causing the strength dependence on fibre diameter(Smekal, 1936; Bartenev, 1968; Prebus and Michener, 1954). Other researchers argue against structural orientation within glass fibres (Thomas, 1960; Thomas, 1971; Otto and Preston, 1950) and others stress the importance of production parameters such as thermal and mechanical history of the glass (Otto, 1955; Cameron, 1966; Stockhorst and Bruckner, 1982).
2.2. Thermal and mechanical history Within the present study the hypothesis that the thermal and mechanical history of the glass is the primary factors influencing the high strength of glass fibres is tested. In this section issues of these factors are briefly mentioned with reference to literature and further discussed throughout the thesis and the papers that are included.

7
2.2.1 Thermal history
Memory effect of the melt Upon melting the raw materials turns into a liquid. Normally the liquidus temperature, Tliq, is defined as the temperature at which the last crystal is dissolved and all the ions have free mobility. It is generally believed that when T exceeds the Tliq, the structure of a multi-component oxide liquid becomes fully disordered and the ions become randomly distributed. However, several studies have shown structural order to exist within glass melts above Tliq(Martin, et al. 2002; Mysen, 1983). Recent studies have even shown that in iron bearing silicate liquids such as basalt, a certain degree of structural order exist in a range of temperatures above Tliq (Yue, 2004; Lonnroth and Yue, 2005). The fact that this memory effect of the melt might directly influence the mechanical properties of the produced glasses was noted in the studies of Cameron (Cameron, 1966) and in some more recent studies of Brow and co-workers (Brow, et al. 2005; Brow, et al. 2009). The work of Brow shows that two point bending tests exert direct relation between melt history close to Tliq and the glass quality. The results of their study suggest that the heterogeneities in the glass structure that develop in the melt around the liquidus temperature are reflected in the result of the two point bending tests. Hence, in order to overcome the memory of the melt, the melting temperature and the time interval at this temperature is important for tests of mechanical properties. The influence of the drawing temperature on tensile strength of glass fibres is discussed in several studies (Otto, 1955; Cameron, 1966; Stockhorst and Bruckner, 1982; Loewenstein and Dowd, 1968).
Melt homogeneity of basaltic glass melts In the case of basaltic glass melt a viscosity study has shown that the holding time in an air atmosphere influences both the homogeneity and the oxidation state of iron, the later again influencing the viscosity of the melt(Solvang, et al. 2002). A recent study of basaltic melts (Jensen, et al. 2010) clearly indicates how the inhomogeneity in the glass melts strongly depends on the melting atmosphere/ melting conditions. Melts are analysed from three different melting environment; Cupola furnace, electrical furnace and test furnace and these all show inclusion of gas bubbles with a range in sizes and chemical and physical striae*. The presences of melt heterogeneities like bubbles and striae have not found much interest in the literature in relation to the mechanical properties of the produced glass fibres. Anderegg specified that bubbles elongated into thin air-lines when glasses are drawn to fibres would not act as strength weakness as round bubbles in bulk glass do (Anderegg, 1939). Special comments on this issue are made in Chapter 7 and in the discussion part of Paper 3.
Cooling rate If the temperature of the supercooled liquid is decreased so the relaxation times of the system exceed the time scale of the experiment, the system will fall out of equilibrium and undergo a glass transition (provided that it does not crystallize). The resulting glass is a nonequilibrium structure and its properties will in general depend on its history of production such as the cooling rate. The cooling rate will determine the temperature interval over which potential thermally and/or mechanically induced stresses are developed in the glasses. Liquids quenched with different cooling rates experience different thermal histories, and they provide glasses with different structures and properties as shown by e.g. Tool and Eichlin (Tool and * Striae refers to the stripe-like domains that chemically differ from their surroundings.

8
Eichlin, 1931). During glass fibre production (that is both continuous glass fibres and wool fibres) glass melt is cooled by very high cooling rates due to the enormous surface increase in the process from melt into fibres. The high cooling rates of glass fibres causes freezing-in of the liquid structure of the melt at a temperature that might be considerable higher than the glass transition temperature (Tool, 1946). This temperature is called the fictive temperature, Tf, and it depends on the cooling rate (Moynihan, et al. 1976; Yue, 2004). Differences in both compositional and structure related properties are observed between bulk glasses and glass fibres. Several studies report that the high cooling rates, and hence high fictive temperatures of glass fibres result in lower values of i.e. density, hardness, and Young’s modulus for glass fibres than for bulk glasses (for glasses classified as normal glasses). I.e. Density about 2% lower(Otto, 1961); hardness (Lonnroth, et al. 2008); Refractive index 0.15-0.40% lower; Young’s Modulus 7-25% lower(Loewenstein, 1961). The lower density reflects a more open network structure in glasses including high fictive temperatures. In the study of Rawson(Rawson, 1953) less heterogeneity in the glass structure of high Tf glass due to the fast cooling of more isotropic melt is argued to introduce higher strength of high Tf glasses. Smekal(Smekal, 1936) argued that the high cooling rates of fibres would produce internal stresses that would contribute positively to the high strength of glass fibres. However, Anderson has shown that no internal stresses exist in fibres of ~10 μm in diameter due to a different cooling rate at the skin and interior of the glass fibres(Andersson, 1958). Molecular dynamic study shows that the higher the Tf the less polymerized the glass network of typical commercial window glass (Ito and Taniguchi, 2004). Further the sample of high Tf exhibits easier flow and densification, which result in easier deformation and faster stress relaxation compared to sample of lower Tf (Ito and Taniguchi, 2004). A recent experimental study on subcritical crack growth rates in soda-lime-silicate glass (Koike and Tomozawa, 2006) shows slower crack growth rate in glasses of higher Tf. These experimental results confirm the molecular dynamic study of Ito and Taniguchi (Ito and Taniguchi, 2004). Hence, according to slower subcritical crack growth, the higher cooling rates (higher Tf) are expected to result in higher mechanical strength when tested in ambient air. In the case of stone wool fibres, the cascade spinning process produces cooling rates around 105-106 K/s(Yue, et al. 2004; Hornbøll and Yue, 2008a). The fictive temperature of these glasses can be determined from differential scanning calorimetry by the method suggested by Yue et al. (Yue, et al. 2002a). Stone wool fibres of the present study all exhibit fictive temperatures between 1.2Tg and 1.3Tg. Hence the stone wool fibres are hyperquenched and thus the above mentioned properties caused by high cooling rates are valid also for stone wool fibres.
2.2.2. Mechanical history In addition to thermal quenching the fibre drawing process imposes a large mechanical stress onto the fibres as they are cooled trough the glass transition. In a study of the influence of mechanical and thermal prehistory on the structure of glass fibres the three most dominating parameters are highlighted to be (Brüchkner and Stockhorst, 1985): the cooling rate, the nozzle temperature and the drawing stress. The study clearly shows that the continuous fibre drawing process imposes structure orientation along the length axis of the glass fibres, expressed by anisotropy of the fibres (Brüchkner and Stockhorst, 1985). The axial stresses exerted by the drawing process, is mainly controlled by the drawing stress (the spinning rate) and the drawing temperature (related to the melt viscosity)(Thomas, 1960; Pähler and Brückner, 1982; Pahler and Brückner, 1985; von der Ohe, 2003). In a recent study of E-glass fibres the imposed anisotropy is directly related to a local structural ordering observed as

9
birefringence which upon annealing relaxes faster than the enthalpy relaxation (Ya, et al. 2008; Deubener, et al. 2008). Discussions of this issue with respect to stone wool fibres are presented in Paper 3. Kurkjian and Prindle 2006(Kurkjian and Prindle, 2006) presents a re-plot of the strength data obtained by Cameron (Cameron, 1966), which shows that the apparent relationship between size and strength is caused by a (at least) bimodal behaviour of the strength distribution. The development in the strength distribution is so that the high strength mode is reproducible in all samples regardless of the melting temperature. The low strength regions on the other hand show progressing lower strength, involving larger low strength tail of the strength distribution as the melting temperature is lowered (Kurkjian and Prindle, 2006). The origin of that development in strength distribution is not clear. The complex influences of the above mentioned thermal and mechanical issues are seen in both present and past experimental results. Figure 2.1 shows a fish bone diagram of different factors influencing the practical strength of stone wool fibres. The composition is an obvious parameter. As the present study is limited mainly to basalt like compositions, no general discussion will be given in this chapter. Recently Lonnroth and Yue published a systematic study on physical properties of basaltic glasses (Lonnroth and Yue, 2009). The influence from composition and raw materials will briefly be mentioned in Paper 1 and 4. Different parameters associated with the melt treatment and spinning parameters will be mentioned in some detail in Paper 3 and 4 and Chapter 9? and specific testing parameters and discussion of this issue is given in Chapter 3.

10
Figure 2.1. Fish bone diagram in which different factors influencing the practical strength of stone wool fibres. As is obvious from the above brief introduction the strength of stone wool fibres depend in a complex manner upon several extrinsic as well as intrinsic factors. The intrinsic strength of glasses is related to the underlying atomic structure and the chemical bonding in the glasses, reduction in intrinsic strength stem from intrinsic defects i.e. caused by thermal fluctuations(Kurkjian, et al. 2003). Perfect intrinsic strength of a glass therefore can be varied by altering the chemical composition, and hence, the structure and bonding at atomic level. Thermal history can also vary the intrinsic strength because of the thermal fluctuations. However, in practice, the intrinsic strength is difficult to measure. In the present study, there has been no attempt to measure the intrinsic strength of stone wool fibres. However, the results will show that several extrinsic parameters can be directly related to the intrinsic strength of the glass. Pure intrinsic defects cannot account for the high strength observed for stone wool fibres (and continuous glass fibres). The present results suggest that orientation of structural clustering and pre-existing defects such as bubbles may be responsible for the increased strength of stone wool fibres.

11
3. Tensile test method The procedure of tensile testing of individual stone wool fibres is straight forward but tedious. Special caution and carefulness are required both in performing and evaluation of the data of the single fibre tensile tests.
3.1. Method of tensile strength tests The tensile strength tests (uniaxial tension test) of individual fibers were performed in a Raith FTM testing rig for a single glass fiber operating at a constant speed of 10-5 m/s (Figure 3.1). The applied force, F, was calculated from the controlled speed and the distance moved by the flexible end of the testing rig. The gauge length of the tested fibers was between 20 and 30 mm. All tensile tests were made at room temperature under ambient conditions. All the tensile tests of the present study clearly follow Hook’s law up to failure in the tensile testing rig. Figure 3.2 is an example of brittle failure of a stone wool fibre, represented by the raw data of displacement and applied load. Fibres not fulfilling Hooks Law are discarded since observations reveal that the discrepancy typically is associated with the clamping of the fibre and not a property of the glass fibre itself.
Figure 3.1: Illustration of the Raith FTM testing rig.
-10
0
10
20
30
40
50
60
70
0 10 20 30displacement [a.u.]
load
[a.u
.]
Figure 3.2: Displacement and load data as obtained from the tensile testing rig. The linear increase of load versus displacement proves a relation being in accordance with Hook’s law.
12
3.2. Bias due to early failure of very weak fibres In the procedure of selecting the individual fibres for tensile testing, the wool sample is separated into four to six samples; individual fibres are withdrawn from each of these in order to reflect heterogeneity present in stone wool samples. Upon fibre selection the weakest fibres will break before or upon withdrawal from the wool sample. This may create a bias in relation to the real distribution of the tensile strength of all fibres in the stone wool sample. Stone wool samples from both industrial scale production and the laboratorial scale production have shown individual fracture strengths (σf) as low as 200 MPa upon tensile strength tests, and annealed wool samples have shown tensile strengths down to 100 MPa. This indicates that fibres which exhibit tensile strength below 100 MPa are not included in the present tensile strength evaluation due to failure during handling procedure. Typical minimum fracture strength values (σfmin) of as-produced samples are around 500 MPa; hence the bias produced by failure of the weakest fibres during the selection process is estimated to be very small. In the case that the selection process largely would impact of the strength distribution, it should be assumed that the resulting strength distribution had no low strength tail. All tensile strength data of the present project show some kind of low strength tail. Exposure of the stone wool fibres to heat treatments at temperatures below 0.8Tg leads to average σfmin ~ 500 MPa, hence equal to as-produced fibres. When the stone wool fibres are exposed to heat treatment above 0.8Tg the average σfmin is reduced to ~280 MPa and by exposure to humidity ageing for four weeks the average σfmin is found to be ~325 MPa. Hence potential bias in tensile strength results related to the failure of the weakest fibres during the selection procedure is highly increased as fibres are exposed to relative high annealing temperatures or longer time humidity exposure. Post processing heat treatments and humidity exposure is discussed in more details in Chapter 8.
3.3. Bias due to fibre diameter variation Due to the large variation in fibre diameter in the wool samples the selection of individual fibres from the wool samples also involves possible bias between the fibre diameter of the selected fibres and the fibre diameter determined by an automated SEM procedure including 600-1800 fibres. In Table 3.1 fibre diameters of a number of stone wool samples can be seen. The table shows that bias in fibre diameters between the entire wool sample and the tested stone wool fibres can be quite extensive. For example in the samples B-30, C-82, C-64 and C-31 which all have d50 between 3.5 and 4.5 μm the average fibre diameter of fibres tested in tensile strength tests falls between 6.7 and 8.0 μm. Hence, for the samples in question only fibres representing the largest fibre diameters of the sample have been tested in the tensile tests. With reference to the discussion in chapter 4 (Weibull statistic and tested volumes) this bias results in lower tensile strength results than if the entire fibre diameter variation was tested. For some stone wool samples less bias between the automated fibre diameters and the diameters of fibres tested in tensile tests is observed. At present no systematic relationship is found in the bias between diameters of the fibres tested in tensile tests and the entire wool samples.

13
Table 3.1 Fibre diameters of stone wool samples, all sample-names are used in accordance to Paper 4. From the fibres tested in tensile tests the average fibre diameter <dσ> and its standard deviation (stdev) are given. The diameter distribution found by an automated SEM procedure resulting in fibre diameters representing less than 16vol%, 50vol% and 84vol% respectively, d16, d50, d84.
Table 3.2 Fibre diameters of annealed stone wool sample Ob2. From the fibres tested in tensile tests the average fibre diameter <dσ> and its standard deviation (stdev) are given.
<dσ> [µm] Stdev d16
[µm] d50 [µm]
d84 [µm]
Laboratorial scale: B-41 6.5 1.7 2.1 5.3 10.8 B-17 6.9 2.1 3.1 6.4 11.4 B-30 6.7 2.6 1.4 3.5 6.7 B-5 8.0 2.6 2.9 6.2 12.0 B-0 6.9 1.8 4.7 10.5 17.5 C-82 8.0 2.1 1.5 4.1 7.8 C-64 7.8 2.4 1.9 4.1 8.8 C-31 6.8 2.5 1.8 4.4 9.7 Industrial scale: I-3a 5.8 2.1 2.0 5.0 9.2 I-3d 6.1 1.8 2.0 4.9 8.4
Ambient air N2 Ta [oC] ta 3h
<dσ> [µm] Std
<dσ> [µm] Stdev
Ob2 (B-17) 25 6.9 2.1 200 6.7 1.9 250 7.2 2.8 300 6.8 3.1 7.6 2.0 350 7.6 1.9 400 7.9 2.0 7.8 1.9 450 6.4 2.9 7.5 2.7 500 7.7 2.6 550 8.1 2.4 7.3 1.9 600 8.2 2.0 653 8.6 2.6
Sample Ob2 (called B-17 in Table 3.1 and Paper 4) was exposed to annealing experiments below Tg in air and N2 atmosphere. The results of the tensile tests of these fibres have shown an increase in <dσ> from 6.9 μm as-produced to 8.6 μm for 3 hours annealing in air at Tg. The standard deviation of the tested diameters is similar for all samples. Annealing experiments performed in N2 atmosphere show similar fibre diameters of all tested fibres. This might indicate that handling of annealed stone wool fibres for tensile tests is more delicate when the annealing was performed in ambient air than in N2 atmosphere. Especially handling of stone wool fibres annealed above approximately 0.8Tg has shown more delicate to deal with. In the work of Wojnárovits(Wojnárovits, 1988) stone wool fibres of similar chemical composition were not possible to test in uniaxial tension after exposure to heat treatment above 400 oC, which correspond to ~0.7 Tg. Bias of both selection procedure and fibre diameter variation is much larger for discontinuous fibres than for continuous fibres.
3.4. Further issues about tensile testing
3.4.1. Testing speed In the present study all tensile strength tests are made at constant speed. By changing the speed the evolvement of strength and delay of fracture can be performed. This is not the scope of the present study.

14
3.4.2. Testing gauge length The present tensile strength tests are performed with gauge lengths between 20 and 30 mm, hence the gauge length was not fixed. By fixing the testing length, the variation of the fibre diameter can be found directly from the results. The range of gauge length is chosen so that no discontinuous fibres should be rejected due to their length. Systematic study of the influence of variation of gauge length is often performed for continuous fibres. This allows a discussion on the reliability of the extension of tensile strength measurements from small to larger gauge lengths and to the scale of application (Andersons, et al. 2002). In the case of stone wool fibres some variations in the fibre length exist although the reliability of extension of the measured tensile strength to larger length is not discussed in the present study. For basaltic stone wool fibres gauge length variation from 20 mm to 30 mm shows no systematic relation between gauge length and strength.
3.4.3. Testing atmosphere Obviously, controlled testing atmosphere would improve the arguments especially in relation to intrinsic strength and the relation between glass structure and strength of inorganic glass fibres (Paper 3). In further research in this field it will be crucial to control the testing atmosphere in order to subtract the humidity attack at fibre surfaces from the measured fibre strength – stress corrosion, surface relaxation and fatigue issues in the discussion of strength and structure (Proctor, et al. 1967; Wiederhorn and Boltz, 1970).
3.5. Future experiments to support the present results
3.5.1. Two point bending Failure characteristics of continuous fibres can be conveniently measured by the two point bending test (Brow, et al. 2005; Duncan, et al. 1985; Matthewson, et al. 1986). The method is based on U-shape bending of the fibres, where the outer portion of the fibre is in tension and the inner part in compression. It is the bending strain and failure strain that are recorded in the two point bending tests. The tests can be performed under controlled atmosphere and temperatures, e.g. in liquid nitrogen and interesting results are published both in relation to intrinsic strength (Kurkjian, et al. 2003; Lower, et al. 2004) and recently also in relation to melt history and the importance of thermal history on strength of glass (Brow, et al. 2009). Since it is the failure strain that is measured by two point bending tests, the elastic modulus at fibre failure most be known in order to convert bending strain to strength. The elastic modulus can be measured by acoustic pulse technique, to obtain a zero strain modulus, as the elastic modulus typically depends on applied strain. This elastic modulus will overestimate the strength of the fibres compared to the strength measured directly by tensile strength test. Another issue that may cause lower measurable tensile strength than bending strain converted strength is related to the amount of fibre volume involved in the failure. The distribution of cracks and crack sizes along a fibre may cause the measurable tensile fracture strength to be lower than the measurable bending strength. The bending test focus the load on a very small volume of fibre compared to the tensile strength tests. Bending tests of stone wool fibres would be highly interesting both with respect to the relation between glass structure and strength (scientific interest) and the more practical aspects. At present only fibres of much larger length has been tested in two point bending

15
testes. A bending test set up need to be designed for the short lengths of stone wool fibres. For insulation products exposure to bending stress is directly related to handling of both light products in relation to transportation and in relation to quality parameter of heavy products, e.g. point loading.
3.6. Summary Handling and testing procedure are of huge importance in tensile strength measurements. In order to fully analyse the mentioned aspects of different testing parameters a systematic study need to be performed and discussed. Such systematic study was not a priority in the present study, but would have been a great support in the conclusive discussions on the strength of stone wool fibres. The analysed and discussed results are the very best results we can produce taking a reasonable testing and analysing time into consideration.

16
4. Fractography Fractography is the study of fracture surfaces of brittle materials in order to locate and characterize an origin of the fracture. In brittle materials as glass the fracture commences from a single location (irregularity or defect of some kind) which is termed the fracture origin. In the present study the fractographic study was performed at a number of stone wool samples after tensile testing. The fractured fibre ends were mounted so that the fracture surface faced the electron beam within the scanning electron microscope (SEM Philips XL30) as described in Paper 2. The obtained fracture surface images were analysed in accordance with the methodology described within this chapter and in Paper 2.
4.1. Fractography of fracture surfaces of stone wool fibres By propagation of the fracture a crack front run through the material creating a fracture surface. The fracture surface of brittle materials as glass includes characteristic fracture features related to the crack propagation. Initially the crack propagation leaves a smooth surface called the mirror region. As the crack accelerates it becomes more unstable whereby the mist region is produced, which is seen as a dimple surface. The acceleration of the crack propagation may cause the crack to branch out of the fracture plane leaving a rough fracture surface including elongated marks in the direction of the crack propagation; this region is called the hackle. These regions are illustrated schematically in Figure 4.1.
Figure 4.1. The three typical regions developed by brittle fracture of stone wool fibres. Fracture initiated by a single defect, the dotted grey lines in B indicates how the rough hackle region point to the position of the fracture origin. Black arrows in B indicate mirror width (rw) and mirror depth (rd) used for determining the mirror size. The sizes of the mirror region have been used since 1953 in relation to estimation of the specimen failure stress σf (Tarao, 1953). The classic relationship between mirror size and failure stress in both glass and ceramic is given by:
Origin Mirror Mist Hackle
A
B
17
rA
f =σ ; 4.1
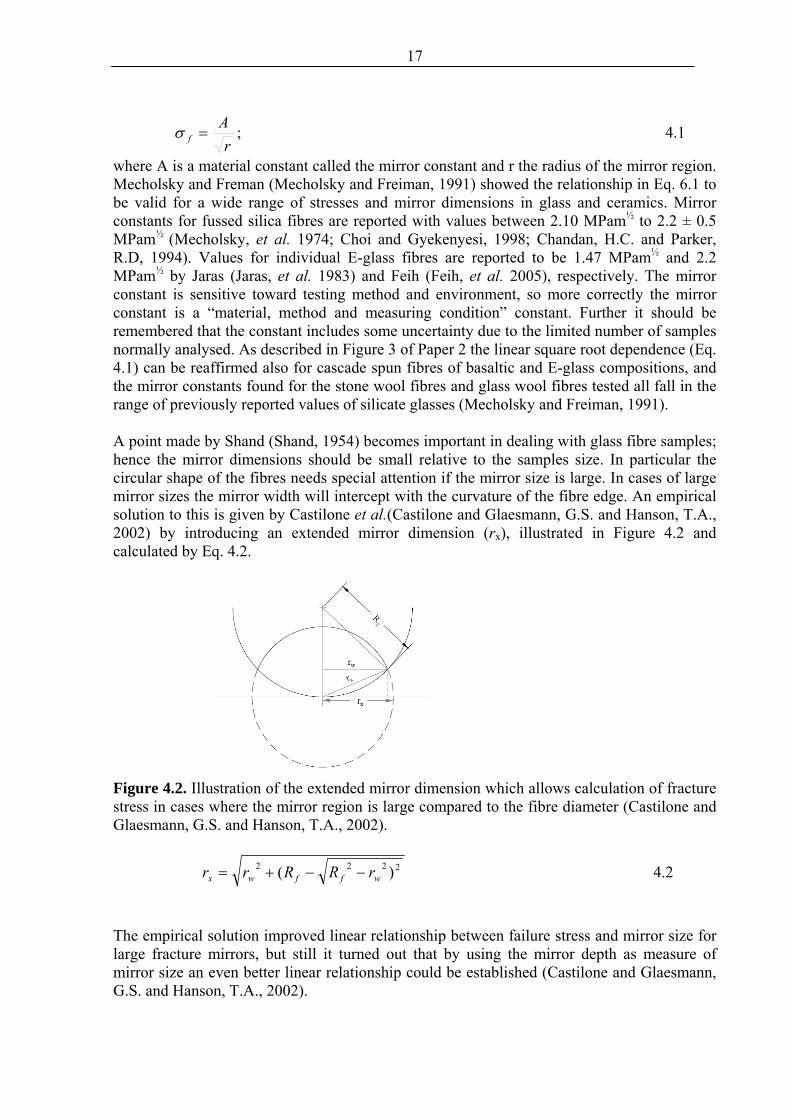
where A is a material constant called the mirror constant and r the radius of the mirror region. Mecholsky and Freman (Mecholsky and Freiman, 1991) showed the relationship in Eq. 6.1 to be valid for a wide range of stresses and mirror dimensions in glass and ceramics. Mirror constants for fussed silica fibres are reported with values between 2.10 MPam½ to 2.2 ± 0.5 MPam½ (Mecholsky, et al. 1974; Choi and Gyekenyesi, 1998; Chandan, H.C. and Parker, R.D, 1994). Values for individual E-glass fibres are reported to be 1.47 MPam½ and 2.2 MPam½ by Jaras (Jaras, et al. 1983) and Feih (Feih, et al. 2005), respectively. The mirror constant is sensitive toward testing method and environment, so more correctly the mirror constant is a “material, method and measuring condition” constant. Further it should be remembered that the constant includes some uncertainty due to the limited number of samples normally analysed. As described in Figure 3 of Paper 2 the linear square root dependence (Eq. 4.1) can be reaffirmed also for cascade spun fibres of basaltic and E-glass compositions, and the mirror constants found for the stone wool fibres and glass wool fibres tested all fall in the range of previously reported values of silicate glasses (Mecholsky and Freiman, 1991). A point made by Shand (Shand, 1954) becomes important in dealing with glass fibre samples; hence the mirror dimensions should be small relative to the samples size. In particular the circular shape of the fibres needs special attention if the mirror size is large. In cases of large mirror sizes the mirror width will intercept with the curvature of the fibre edge. An empirical solution to this is given by Castilone et al.(Castilone and Glaesmann, G.S. and Hanson, T.A., 2002) by introducing an extended mirror dimension (rx), illustrated in Figure 4.2 and calculated by Eq. 4.2.
Figure 4.2. Illustration of the extended mirror dimension which allows calculation of fracture stress in cases where the mirror region is large compared to the fibre diameter (Castilone and Glaesmann, G.S. and Hanson, T.A., 2002).
2222 )( wffwx rRRrr −−+= 4.2
The empirical solution improved linear relationship between failure stress and mirror size for large fracture mirrors, but still it turned out that by using the mirror depth as measure of mirror size an even better linear relationship could be established (Castilone and Glaesmann, G.S. and Hanson, T.A., 2002).
18
A = 2.3 R2 = 0.81
A = 2.2 R2 = 0.55
A = 2.1 R2 = 0.49
A = 2.1 R2 = 0.440
500
1000
1500
2000
2500
3000
250 750 1250 1750r-½ [m]
Tens
ile s
tren
gth
(MPa
)
Ob2 mirror depth
Ob2 mirror width
E wool mirror depth
E wool mirror width
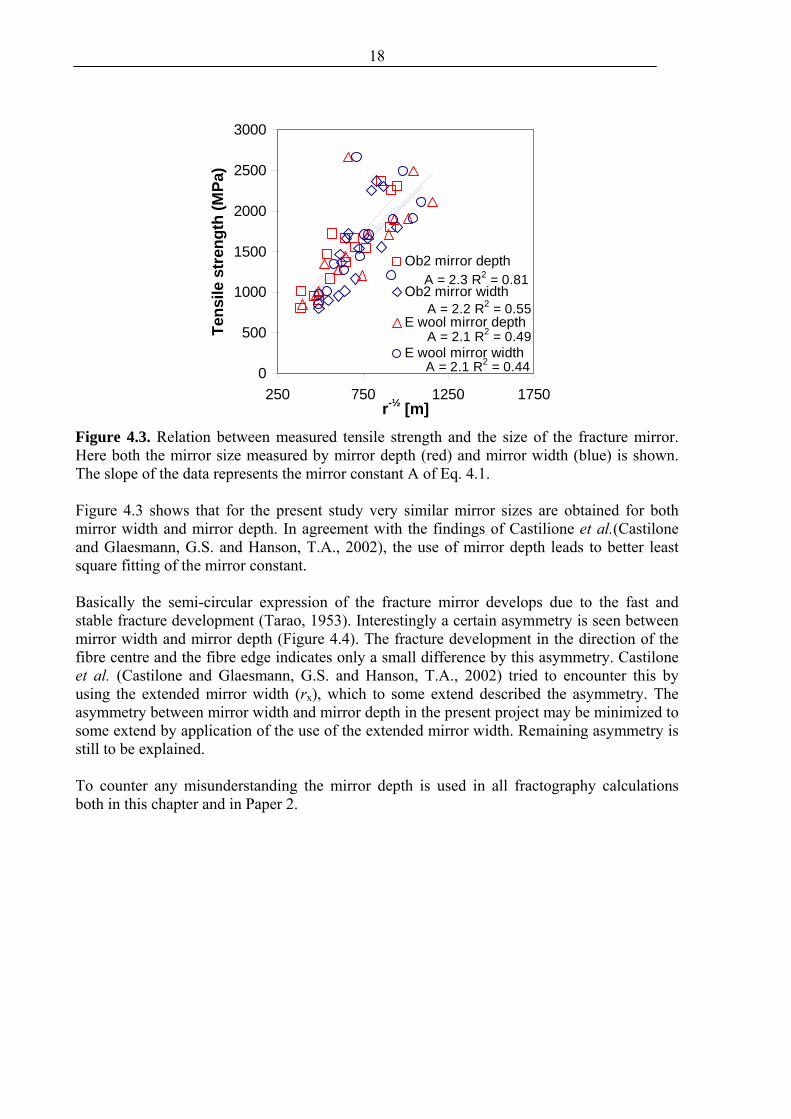
Figure 4.3. Relation between measured tensile strength and the size of the fracture mirror. Here both the mirror size measured by mirror depth (red) and mirror width (blue) is shown. The slope of the data represents the mirror constant A of Eq. 4.1. Figure 4.3 shows that for the present study very similar mirror sizes are obtained for both mirror width and mirror depth. In agreement with the findings of Castilione et al.(Castilone and Glaesmann, G.S. and Hanson, T.A., 2002), the use of mirror depth leads to better least square fitting of the mirror constant. Basically the semi-circular expression of the fracture mirror develops due to the fast and stable fracture development (Tarao, 1953). Interestingly a certain asymmetry is seen between mirror width and mirror depth (Figure 4.4). The fracture development in the direction of the fibre centre and the fibre edge indicates only a small difference by this asymmetry. Castilone et al. (Castilone and Glaesmann, G.S. and Hanson, T.A., 2002) tried to encounter this by using the extended mirror width (rx), which to some extend described the asymmetry. The asymmetry between mirror width and mirror depth in the present project may be minimized to some extend by application of the use of the extended mirror width. Remaining asymmetry is still to be explained. To counter any misunderstanding the mirror depth is used in all fractography calculations both in this chapter and in Paper 2.

19
y = 1.59x - 0.86R2 = 0.93
y = 0.91x - 0.99R2 = 0.66
0
2
4
6
8
10
12
0 2 4 6 8 10r w (μm)
r d ( μ
m)
E woolOb2
y = 1.21x - 0.28R2 = 0.92
y = 1.35x - 0.3748R2 = 0.52
0
2
4
6
8
10
12
0 2 4 6 8 10r x (μm)
r d ( μ
m)
E woolOb2
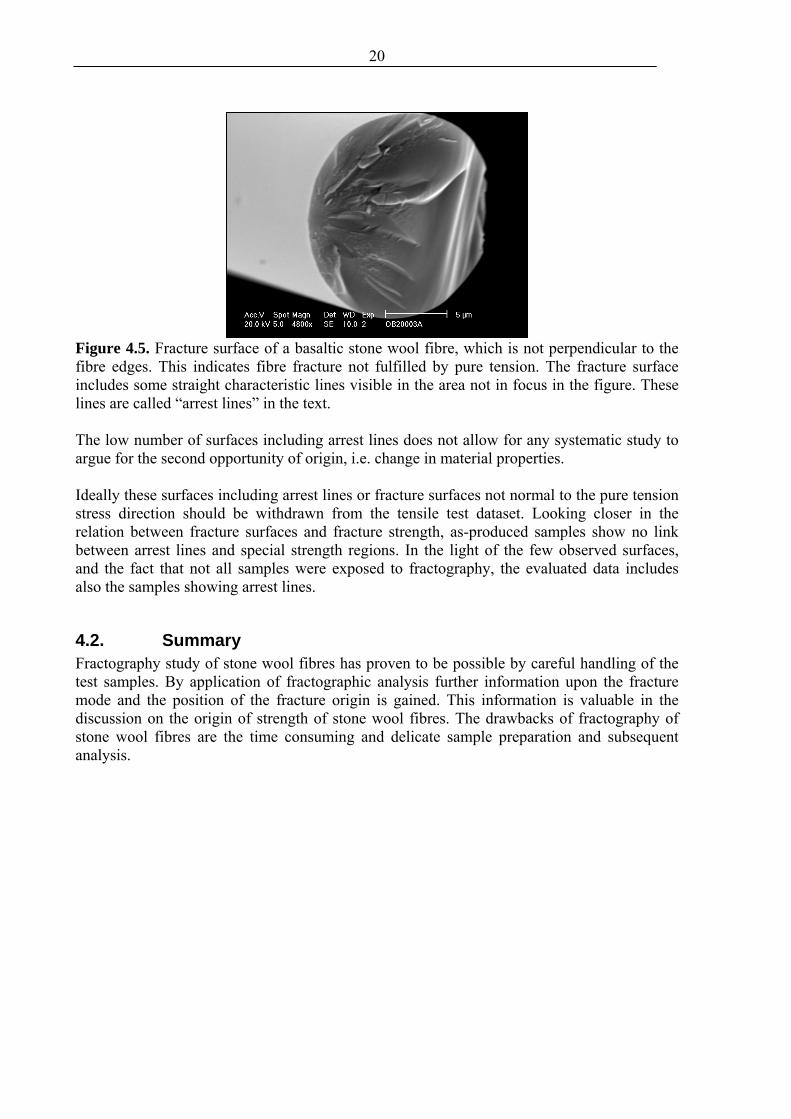
Figure 4.4. Fracture mirror dimensions of two types of cascade spun wool fibres, E wool has E-glass composition and Ob2 is basaltic stone wool. A) Fracture mirror depth (rd) and fracture mirror width (rw) show some asymmetry. B) Recalculation of the mirror width to extended mirror width (rx) following the suggestion of Castilione et al. (Castilone and Glaesmann, G.S. and Hanson, T.A., 2002), reduces this asymmetry slightly but does not eliminate it. Fracture surfaces as result of fibre bending during tensile strength tests are observed in all samples, although in low numbers. Figure 4.5 illustrates a fracture surface, which is not perpendicular to the fibre edge and includes “arrest lines” in addition to the mirror-mist and hackle described above. Arrest lines are attributed to a shift in direction of the applied stress during testing (Michalske, 1994; Chen, et al. 2003). As a crack always propagates in a plan perpendicular to the applied tensile stress field, changes in this stress field will alter the direction of the crack propagation. Hence fracture surfaces displaying fracture surfaces including arrest lines and or surfaces which are not normal to the fibre edges can be assumed to stem from
o fracture tests not performed in pure tension, i.e. fracture by bending o fractures which have encountered change in material properties (i.e. porosity,
inclusions, chemical or structural composition) The most obvious origin of the few surfaces including arrest lines will be related to practical fibre handling and mounting of the fibre prior to tensile tests. If the fibre is not fully aligned the strength test cannot be performed in pure tension. This is discussed in Chapter 3 and will further be relevant in the discussion of handling heat treated fibre samples in Chapter 9.
20
Figure 4.5. Fracture surface of a basaltic stone wool fibre, which is not perpendicular to the fibre edges. This indicates fibre fracture not fulfilled by pure tension. The fracture surface includes some straight characteristic lines visible in the area not in focus in the figure. These lines are called “arrest lines” in the text. The low number of surfaces including arrest lines does not allow for any systematic study to argue for the second opportunity of origin, i.e. change in material properties. Ideally these surfaces including arrest lines or fracture surfaces not normal to the pure tension stress direction should be withdrawn from the tensile test dataset. Looking closer in the relation between fracture surfaces and fracture strength, as-produced samples show no link between arrest lines and special strength regions. In the light of the few observed surfaces, and the fact that not all samples were exposed to fractography, the evaluated data includes also the samples showing arrest lines.
4.2. Summary Fractography study of stone wool fibres has proven to be possible by careful handling of the test samples. By application of fractographic analysis further information upon the fracture mode and the position of the fracture origin is gained. This information is valuable in the discussion on the origin of strength of stone wool fibres. The drawbacks of fractography of stone wool fibres are the time consuming and delicate sample preparation and subsequent analysis.

21
5. Statistical analysis of strength data The mode of fracture in a homogenous brittle material depends on the stress necessary to propagate an existing critical flaw or defect in the material. Flaws and defects can have variable sizes, shapes and orientations and are considered to be distributed in a random manner; these are assumed to cause the scatter in failure strengths. To describe the material strength a finite number of specimens are tested under the same conditions and the test result will show some distribution; hence, this calls for statistical treatment to model the material. An example of distribution in strength of basalt stone wool fibres (Ob2 and F33) and E-glass wool fibres are shown in Figure 5.1. The asymmetrical distribution of fracture strength of brittle materials is commonly described by Weibull distribution (Weibull, 1939).
ΣN=40
0
2
4
6
8
10
12
14
<500 75
010
0012
5015
0017
5020
0022
5025
00>2
500
Tensile Strength [MPa]
N
Ob2 E wool B-5
Figure 5.1. Tensile strength data is shown in a histogram with 10 classes of 250 MPa each. The number of tested fibres is 40 and the distribution of the strength data is not symmetrical, and hence calls for an alternative statistical evaluation to the normal distribution. The Weibull distribution is found to describe results of tensile strength of a brittle material under uniform loading both in theory (Jayatilaka and Trustrum, 1977; Trustrum and Jayatilaka, 1983) and in practice (Andersons, et al. 2002). Numerous studies exist in the literature on modifications of the Weibull distribution used for brittle material (Paramonov and Andersons, 2007; Fischer, et al. 2002). Especially this is a delicate discussion when working with reliability and life time of glass and ceramic products. In the context of the present study a basic presentation of the Weibull distribution statistics applied is presented. In relation to these strength analyses two major points will be discussed, i.e. the influence of size of samples and the role of multiple flaw distributions.

22
5.1. Weibull distribution The Weibull distribution function has the general form of Eq. (5.1)(Weibull, 1939):
])(exp[10
muffP
σσσ −
−−= (5.1)
Here the fracture probability is Pf, σf is the fracture strength and σu is called the “threshold strength” below which fracture cannot occur. σo is a scale parameter and m is the so called Weibull modulus. The scale parameter σo is often called the characteristic strength, corresponding to the fracture stress with a failure probability of 63.2%. The Weibull modulus m is also called the shape parameter since it represents the scatter in the fracture strength. Both the Weibull modulus and the characteristic strength have to be positive values. The parameters have no physical meaning but they determine the estimated degree of scatter and the average fibre strength of the distribution. The distribution function in Eq. (5.1) is called the 3-parametrical Weibull distribution. Main shortcoming of this distribution is the complexity of determining the distribution parameters from actual measured values. So a simpler two-parameter distribution where σu = 0 is often used. As also pointed out by Weibull this simplification will be acceptable in the case of tensile strength measurements of fibres since fibres with strength values close to zero will break prior to testing (Weibull, 1939; Weibull, 1951). The simplification in this way is not determined by a material threshold strength but by the lower limit of the testing method. The general form of the reduced Weibull distribution function is Eq. (5.2):
])(exp[10
mffP
σσ
−−= (5.2)
Basic problem in establishing the threshold strength of glass fibres and for simplicity of the mathematical fitting the two parameter Weibull distribution is used in the present study. This also follows the standard practice for advanced ceramic reported by ASTM (ASTM, 2007). By Eq. (5.2) the parameters σo and m may be estimated directly from the measured strength values by use of a Weibull diagram. The Weibull diagrams are produced by taking the logarithms of Eq. (5.2) twice and rearrange the result in form of Eq. (5.3):
0lnln)))1/(1ln(ln( σσ mmP ff −=− (5.3) Hereby it follows that the slope of the Weibull diagram (where y = ln(ln(1/(1-P))) and x = ln(σf)) gives the Weibull modulus, and the characteristic strength value, σo, can be deduced from the intercept term of Eq. (5.3). By estimation of the Weibull parameters in these terms a number of decisions are made in preparing the Weibull diagram to gain the least biased parameters. Individual test results obtained during a single test can be ranked by increasing order of their strength. To calculate the cumulative failure probability of the ith measured strength several estimators have been proposed and evaluated in the literature (Jayatilaka and Trustrum, 1977; Khalili and Kromp, 1991; Wu, et al. 2006; Bergman, 1986). For sample sizes (N) up to 50 the estimator in Eq. 5.4 can be used (Bergman, 1984):
NiPi
5.0−= (5.4)
From this the value of m can be estimated. Again several different methods are used in the

23
literature (Jayatilaka and Trustrum, 1977; Khalili and Kromp, 1991; Wu, et al. 2006). For convenience the method of least square is used here in estimating the Weibull modulus of the linear data visualised by Eq. (5.3). The reliability of the estimated Weibull parameters depends on the number of tested specimens. In general it is agreed that a minimum number of 30 specimens are required for a good characterization of the strength of a brittle material (Faucher and Tyson, 1988). Tensile test of stone wool and continuous glass fibres are performed on sample sizes between 25 and 40.
5.2. Weakest link theory The Weibull distribution function is based on the “weakest link hypothesis” and is therefore cumulative, since it is the weakest-link that initiates the fracture. Whenever the fracture has occurred the smaller flaws cannot initiate it. Other mathematical distributions are also based on the weakest link theory, i.e. the three extreme value distribution(Faucher and Tyson, 1988) and flaw density distribution (Evans and Jones, 1978; Matthews, et al. 1976). The Weibull distribution has become most widely applied, probably due to its mathematical simplicity and good agreement in application. The function is established by the following physical assumptions:
i) The material is homogeneous, ii) the material includes only a single flaw population,
iii) the individual flaws do not interact, iv) the potential compressive stresses do not contribute to fracture, v) strength is independent of time.
In this sense glass and glass fibres are to be considered homogeneous materials in an overall sense. Paper 3 includes the discussion whether stone wool fibres are isotropic or not. Partial crystallization will strongly affect the material properties and should be avoided in relation to application of the weakest link theory. For the stone wool fibres of the present study assumption i) is fulfilled. Annealing of basaltic stone wool fibres around and above Tg are known to produce nanoscale surface crystallisation of MgO (Kaasgaard, et al. 2004). In these cases the homogeneity needs to be discussed in relation to application of the Weibull statistics. The assumption of single flaw population needs careful consideration, and discussions in relation to the stone wool fibres are presented in later section of this chapter and in Chapter 6. In general, if more than one flaw population is present within the samples, each of the populations should be taken into account, if possible, by assigning separate values of m and σo. Fractography can be used to designate differences in fracture mechanisms by determining the fracture origin (Chapter 4). Hence the fracture origin should then qualitatively be assigned to a specific flaw population and fracture mechanism (See Paper 2). Without the knowledge from fractography the strength data plotted in a Weibull diagram may indicate multiple flaw distributions. The diagram will show linearity of the data if a single flaw distribution is included. Deviations from linearity might indicate the presence of multiple flaw distributions. However, in light of the delicate work of producing the tensile strength data, observations of approximately linear behaviour can not be assigned to cover only single flaw distribution without additional information to support this conclusion (e.g. from fractography study). Actually all the tested fibres in the present study show deviation from

24
linear behaviour, and hence suggest multiple flaw population. Therefore this issue will be discussed further in section 5.4. It is a fundamental requirement of the weakest link hypothesis that the individual flaws are sparsely distributed with no interactions. Observation of fibres and fracture surfaces does not give raise to question that this requirement is not fulfilled for the tested glass fibres (see Chapter 4). It can be assumed that assumption iii) is fulfilled in the present study. According to the hyperquenching of the glass fibres no compressive stresses are included in the tested fibres (Andersson, 1958) Hence assumption iv) is fulfilled for all the tested fibres. Fatigue is the cause why many ceramics and glasses exhibit quasi-brittle behaviour. The question about fatigue is not considered in the present study. The existence of delayed failure and humidity determined fibre failure are areas of research on their own and are not include in the present study.
5.3. Weibull distribution and tested fibre volume In tensile testing of stone wool fibres the samples include a large fibre diameter variation within each fibre sample (Tab 3.1 and Paper 4). Furthermore the gauge lengths of the testing rig was not fixed during the tensile test measurements as discussed in Chapter 3, hence the fibre volume tested in each tensile test includes some variability. The diameter dependence on strength is subject of a literature history on its own, generally originated by the experimental work of Griffith, showing strong increase of strength by decreasing fibre diameter in glass fibres (Griffith, 1921). In this section the volume/ fibre diameter variation will be considered and in Chapter 6, the size effect of stone wool fibres (and continuous glass fibres) is discussed in relation to tensile strength. In the Weibull model the strength-size relation is usually described by Eq.(5.5):
m
VV
1
2
1
2
1⎟⎟⎠
⎞⎜⎜⎝
⎛=
σσ (5.5)
Here σ1 and σ2 are the characteristic strength of samples of volumes V1 and V2 respectively. As pointed out by Jayatilaka and Trustrum (Jayatilaka and Trustrum, 1977) assuming single flaw size distribution, the variability in flaw size in a given volume is greater for smaller values of the Weibull modulus m. From this it follows that in a material with a small value of m, a large flaw is more likely to be present and the strength for a given volume is lower. In general ceramic materials exhibit low values of m due to the large scatter in strength. Eq. (5.5) reflects the point made by Jayatilaka and Trustrum. In order to take the difference in tested volume into account among the samples, a volume scaling can be made by rewriting Eq. 5.2 to include the tested volume:
])(exp[100 V
VP mff σ
σ−−= (5.6)
Here V represents the volume. Rewriting Eq.(5.6) in line with Eq.(5.2), the strength data may be plotted following Eq.(5.7):
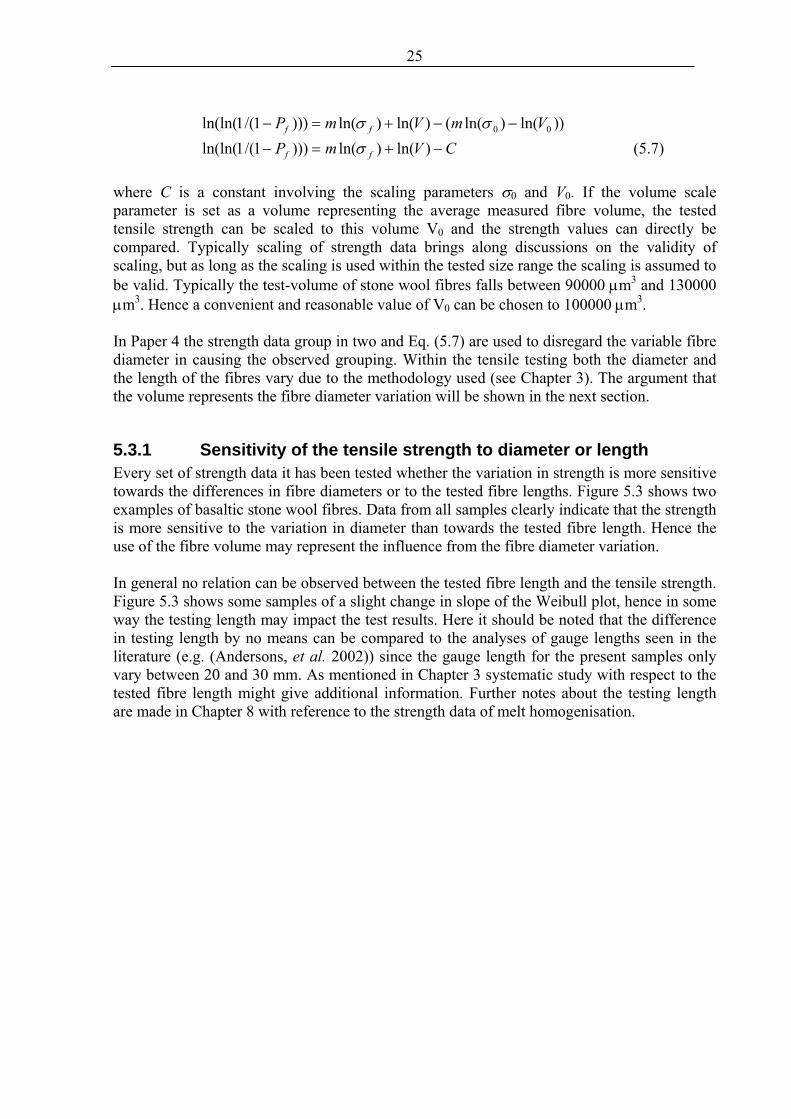
25
))ln()ln(()ln()ln()))1/(1ln(ln( 00 VmVmP ff −−+=− σσ CVmP ff −+=− )ln()ln()))1/(1ln(ln( σ (5.7)
where C is a constant involving the scaling parameters σ0 and V0. If the volume scale parameter is set as a volume representing the average measured fibre volume, the tested tensile strength can be scaled to this volume V0 and the strength values can directly be compared. Typically scaling of strength data brings along discussions on the validity of scaling, but as long as the scaling is used within the tested size range the scaling is assumed to be valid. Typically the test-volume of stone wool fibres falls between 90000 μm3 and 130000 μm3. Hence a convenient and reasonable value of V0 can be chosen to 100000 μm3. In Paper 4 the strength data group in two and Eq. (5.7) are used to disregard the variable fibre diameter in causing the observed grouping. Within the tensile testing both the diameter and the length of the fibres vary due to the methodology used (see Chapter 3). The argument that the volume represents the fibre diameter variation will be shown in the next section.
5.3.1 Sensitivity of the tensile strength to diameter or length Every set of strength data it has been tested whether the variation in strength is more sensitive towards the differences in fibre diameters or to the tested fibre lengths. Figure 5.3 shows two examples of basaltic stone wool fibres. Data from all samples clearly indicate that the strength is more sensitive to the variation in diameter than towards the tested fibre length. Hence the use of the fibre volume may represent the influence from the fibre diameter variation. In general no relation can be observed between the tested fibre length and the tensile strength. Figure 5.3 shows some samples of a slight change in slope of the Weibull plot, hence in some way the testing length may impact the test results. Here it should be noted that the difference in testing length by no means can be compared to the analyses of gauge lengths seen in the literature (e.g. (Andersons, et al. 2002)) since the gauge length for the present samples only vary between 20 and 30 mm. As mentioned in Chapter 3 systematic study with respect to the tested fibre length might give additional information. Further notes about the testing length are made in Chapter 8 with reference to the strength data of melt homogenisation.

26
dm> 6.83μ mm = 3.38R2 = 0.87
dm< 6.83μ mm = 3.62R2 = 0.97
-4
-3.5
-3
-2.5
-2
-1.5
-1
-0.5
0
0.5
1
1.5
2
6 6.5 7 7.5 8
ln(σ f [MPa])
ln(ln
(1/(1
- Pf))
)
C-31 dm>6.83 C-31 dm<6.83conf90>6.83 conf90<6.83
P=16%
P=50%
P=84%
P=99%
P= 5%
A
l >2315 mmm = 2.86R2 = 0.91
l <2315 mmm = 3.96R2 = 0.95
-4
-3.5
-3
-2.5
-2
-1.5
-1
-0.5
0
0.5
1
1.5
2
6 6.5 7 7.5 8
ln(σ f [MPa])
ln(ln
(1/(1
-Pf))
)
C-31 length>2315mmC-31 length<2315mmconf90>2315mm
f90<2315
P=16%
P=50%
P=84%
P=99%
P= 5%
B
Figure 5.3. The sensitivity towards fibre diameter and tested fibre length is illustrated in a Weibull diagram. A) Weibull diagram showing strength data of basaltic stone wool fibres (Sample C-31, Paper 4) grouped in two around the average fibre diameter of 6.83 μm. B) Weibull diagram showing tensile strength data as in A, here the data are grouped with respect to the average testing length of 2315 mm.
5.4. The role of multiple flaw distributions Tensile strength distribution having more than one mode of failure implies the existence of several distinct types of strength limiting defects. Each type of defect (= flaw population) is assumed to posses its own intrinsic distributional properties, and the strength distribution is said to contain multiple flaw populations. Multiple flaw populations seriously complicate the interpretation of test results and may be seen as a non-linearity in the probability distribution. This cannot sufficiently be described by one single Weibull distribution. Unfortunately, existence of multiple flaw populations has shown to be very common in brittle glass and ceramics (Quinn and Morrell, 1991). Existence of multiple flaw distribution can be grouped in two:
a) Concurrent flaw populations, which occur in all samples simultaneously. Here multiple flaw populations are present concurrently in all samples where they act as competing flaw distributions.
b) Non-concurrent flaw populations, which appear only in part of the specimens within a sample. An example for this is where all samples contain one flaw

27
distribution but some of the specimens in the sample also include a second independent flaw distribution.
One additional point also needs to be noted; a single flaw population might exhibit variation in effectiveness related to the position of the individual flaw, i.e. with respect to the fibre surface. Flaws of the same size should cause failure at lower stress when they are located on the surface rather than within the volume. Within the present tensile strength data it is most likely that multiple concurrent flaw populations exist in all samples. The fractography (See Paper 2 and Chapter 4) shows the existence of different flaw sizes and positions, although almost all of the fracture origins were related to the fibre surface. The fact that the fibres exhibiting visible size origin or non-visible size origin group primarily in the low strength region and the higher strength region, respectively, indicates two concurrent flaw populations. Statistically this should be treated by deconvoluting the data in two distinct Weibull distributions. These may hereafter be described by the multiplicative bimodal Weibull model (e.g. (ASTM, 2007; Lissart and Lamon, 1997)). For this distribution, the cumulative probability of failure is the product of the individual probabilities of failure (Pf1 and Pf2): Pf = Pf1 Pf2 (5.8) The multiplicative Weibull distribution differs from the unimodal one only if one distribution has a higher scale parameter σo and a lower modulus m, and the parameters are close enough together (i.e. (Peterlik, 2001)) For the data presented in Paper 2 it is estimated that the multiplicative Weibull distribution does not bring further information than the simple graphical technique shown in the paper. The difficulties in rigorously separating the concurrent flaw distributions and their graphical or statistical treatments are also discussed in the literature (e.g. (Easler, et al. 1981; Watson and Smith, 1985)). As discussed in details by i.e. Jakus (Jakus, et al. 1981) and Beetz (Beetz, 1982) if a single fracture mode can be designated to around or more than 90% of the analysed samples, improvements by multimodal statistical treatments are minimal. The graphical method used in Paper 2 illustrates the concept of competing concurrent subpopulations quite well. In further handling of the data more concise handling is suggested. Fractography (See Paper 2 and Chapter 4) also clearly shows the existence of some non-concurrent flaws in stone wool fibres. These are seen in fracture surfaces including internal pores as the fracture origin. These pores most likely stem from the melting and homogenisation process of the stone melt (Solvang, et al. 2002; Jensen, et al. 2010), and do not necessarily exist in all tested stone wool fibres. The fact that fracture surfaces including internal pores as fracture origins are found in all tested fibre samples, may allow this flaw population to be considered only partly non-concurrent. To distinguish between concurrent and non-concurrent flaws, numerical differentiation of test results has been proposed (Peterlik, 2001). This requires a significantly large number of tests, which it has never been the aim of this project to fulfil. In particular the very low number of fracture origins from internal pores does not allow for any statistical treatment based on the present data set.
28
5.5. Summary The two-parametrical Weibull distribution is used in statistical evaluation of the tensile strength data of stone wool fibres. The mathematical distribution is based on the weakest link hypothesis and prerequisites of this hypothesis are discussed with respect to stone wool fibres. It is concluded that use of the statistical evaluation is valid for the tensile strength data of stone wool fibres.

29
6. Size effect Regarding brittle fracture the size effect is a part of any discussion and the physical phenomena of brittle fracture. Hence, the issue needs also to be considered and discussed with reference to stone wool fibres. The classical size effect discussion follows this: “The load applied in order to lead the specimen to fracture increases as the volume of the test specimen decreases.” In relation to stone wool fibres the size effect will be analysed in the light of the large fibre diameter variation present both within a single sample and among samples of different chemistry and thermal history.
6.1. Size effect for stone wool fibres Within a single stone wool fibre sample there is a large variation in fibre diameters (see Table 3.1) and in the first part of this chapter this diameter variation will be analysed in relation to the fracture strength obtained for a single stone wool sample. The subsequent part of the chapter will then focus on the consequences of the diameter variation when several stone wool samples are compared. Figure 6.1 shows the fracture strength of several different basaltic stone wool samples separated into diameter ranges of 2 μm. Generally for each diameter range the fracture strengths show wide scatter. The figure clearly shows an overall tendency of decrease in strength as the fibre diameter increases. This is seen for both the maximum fracture strength in each diameter range (6.1.A.) and for the average fracture strength in each diameter range (6.1.B).
0
750
1500
2250
3000
3750
0-2 2-4 4-6 6-8 8-10 10-12
12-14
14-16
16-18
18-20
Fiber diameter (μm)
Max
str
engt
h (M
Pa)
Ob2 C-82 C-64C-31 B-30 B-5Alu250 Alu251 I-3dI-3a I-3b
A
0
750
1500
2250
3000
3750
0-2 2-4 4-6 6-8 8-10 10-12
12-14
14-16
16-18
18-20
Fiber diameter (μm)
Ave
rage
str
engt
h (M
Pa) Ob2 C-82 C-64
C-31 B-30 B-5Alu250 Alu251 I-3dI-3a I-3b
B
Figure 6.1. A number of stone wool samples plotted with tensile fracture strength as a function of fibre diameter (Sample-names in accordance with Paper 4 and Chapter 9). A) Maximum fracture strength in each of the diameter ranges of 2 μm. B) The average fracture strength in each of the diameter ranges of 2 μm.

30
The tendency shown in Figure 6.1 indicates a fairly strong diameter dependent tensile strength, in parallel to what was observed by Griffith (Griffith, 1921)– the thinnest fibres exhibit the highest tensile strength. Within the present study all tensile strength data are analysed statistically by the Weibull method (Weibull, 1939; Weibull, 1951) as also discussed in Chapter 5. Now the question arises if the observed diameter to strength dependency influences this statistical approach. In figure 6.2 two examples are shown for stone wool fibres, both samples are grouped around the average fibre diameter. One group represent fibres diameters less than the average diameter, and the other group represent fibre strength obtained from fibres with fibre diameters larger than the average measured fibre diameter. The observation from Figure 6.1 is repeated in the Weibull representation of the data, and at a confidence level of 90% the fibres thinner than the average fibre diameter of the samples are the stronger fibres.
m = 3.04R2 = 0.97
m = 3.29R2 = 0.88
-4
-3
-2
-1
0
1
2
6 7 8ln σ f [MPa]
ln(ln
(1/(1
-Pf))
Ob2 small dmOb2 larger dmConfidence 90%Confidence 90%
A
m = 2.98R2 = 0.98 m = 2.94
R2 = 0.95
-4
-3
-2
-1
0
1
2
5 6 7 8
ln σ f [MPa]
ln(ln
(1/(1
-Pf))
)
I-3d_dm<6.1I-3d_dm>6.1confidence dm<6.1confidence dm>6.1
B
Figure 6.2. Weibull diagrams of basaltic stone wool fibres. The samples are split in two around the average fibre diameter of the tested fibres. A) Sample Ob2 is a laboratorial scale stone wool; and B) Sample I-3d is an industrial stone wool. Interestingly the linear fit of both parts of the strength data results in similar Weibull modulus, m. Hence, the difference in strength among thin and thicker fibres within a single stone wool sample shifts in a parallel manner in the Weibull diagram. These parallel shifts for tensile strength data imply that the influence of the diameter is equally important in both thin and thicker stone wool fibres. In other words, despite the fact that the surface to volume ratio changes as the fibre diameters changes, the flaw population or severity of the flaws does not change. As a consequence no change in flaw population (or hence fracture mechanism) with
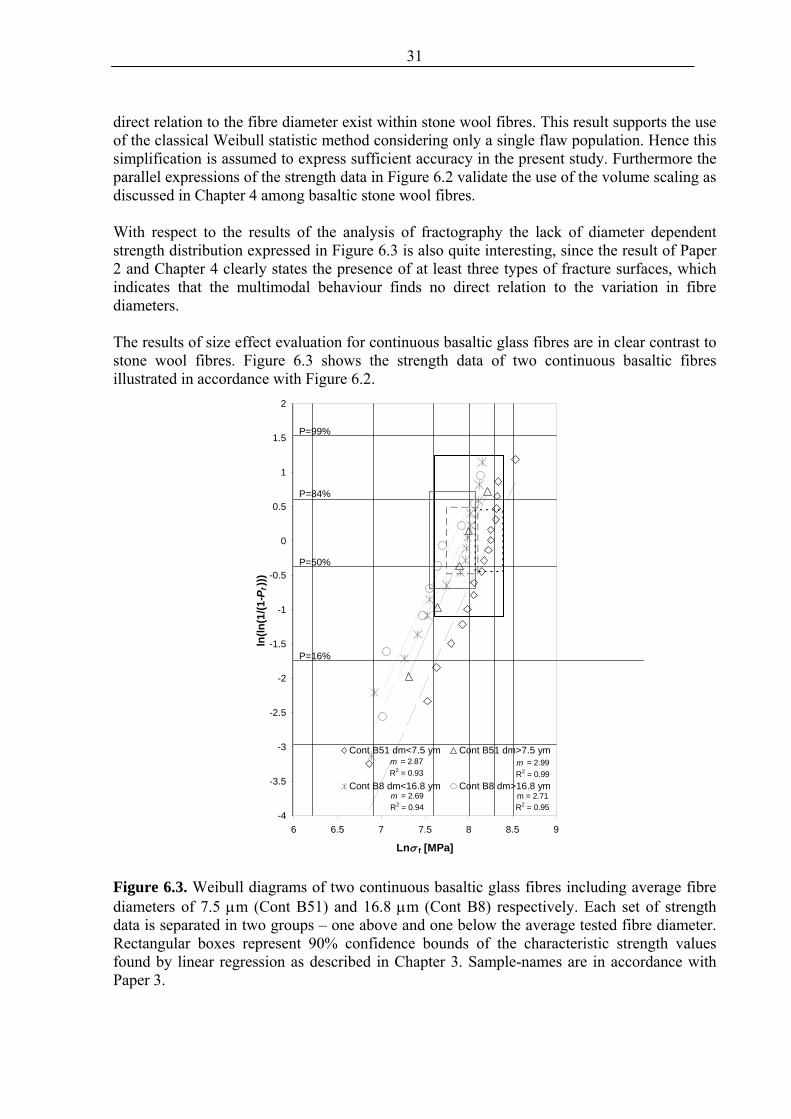
31
direct relation to the fibre diameter exist within stone wool fibres. This result supports the use of the classical Weibull statistic method considering only a single flaw population. Hence this simplification is assumed to express sufficient accuracy in the present study. Furthermore the parallel expressions of the strength data in Figure 6.2 validate the use of the volume scaling as discussed in Chapter 4 among basaltic stone wool fibres. With respect to the results of the analysis of fractography the lack of diameter dependent strength distribution expressed in Figure 6.3 is also quite interesting, since the result of Paper 2 and Chapter 4 clearly states the presence of at least three types of fracture surfaces, which indicates that the multimodal behaviour finds no direct relation to the variation in fibre diameters. The results of size effect evaluation for continuous basaltic glass fibres are in clear contrast to stone wool fibres. Figure 6.3 shows the strength data of two continuous basaltic fibres illustrated in accordance with Figure 6.2.
m = 2.87R2 = 0.93
m = 2.99R2 = 0.99
m = 2.71R2 = 0.95
m = 2.69R2 = 0.94
-4
-3.5
-3
-2.5
-2
-1.5
-1
-0.5
0
0.5
1
1.5
2
6 6.5 7 7.5 8 8.5 9
Lnσ f [MPa]
ln(ln
(1/(1
-Pf)
))
Cont B51 dm<7.5 ym Cont B51 dm>7.5 ym
Cont B8 dm<16.8 ym Cont B8 dm>16.8 ym
P=84%
P=99%
P=16%
P=50%
Figure 6.3. Weibull diagrams of two continuous basaltic glass fibres including average fibre diameters of 7.5 μm (Cont B51) and 16.8 μm (Cont B8) respectively. Each set of strength data is separated in two groups – one above and one below the average tested fibre diameter. Rectangular boxes represent 90% confidence bounds of the characteristic strength values found by linear regression as described in Chapter 3. Sample-names are in accordance with Paper 3.
32
In Figure 6.3 there is no diameter-strength relation to be found. This is true both within the individual samples (caused by the very narrow diameter variation within continuous fibre) and between the two samples even though their average fibre diameters differ from 7.5 μm to 16.8 μm. The discrepancy between continuous glass fibres and stone wool fibres with relation to the diameter-strength relation is also presented in Figure 2a and 2b of Paper 3. In this paper both continuous glass fibres and stone wool fibres are analysed. For the continuous glass fibres there are no observable diameter-strength relationship in the fibre diameter range covered by the stone wool fibres. Furthermore it can be seen that the continuous basaltic fibres exhibit much higher strength than the stone wool fibres. In Paper 3 it is discussed if strong control of the spinning parameter i.e. axial stress could explain the discrepancy in strength between stone wool fibres and continuous fibres. With respect to this discussion the observed relation between fibre diameter and strength of stone wool fibres might be more indirect and related to the drawing conditions where the axial stress, drawing force, cooling rate and fictive temperature will vary from fibre to fibre in the stone wool fibre production. The simplest way to explain the difference in fracture surfaces observed for the stone wool fibre as shown in Paper 2 and Chapter 4 and apparent diameter-strength relation seen in Figure 6.1 would be that some flaws are more closely related to the fibre surface and some more closely related to the fibre volume. But such a relationship cannot be found for the stone wool fibres, see Figure 6.2. Hence a more indirect relationship between fibre diameter and tensile strength governed by the drawing conditions satisfies this observation.
6.2. Summary In analysing the tensile strength data with respect to the large diameter variation observed in stone wool fibres, a diameter to strength relationship appears. It is tested if a simplification of the Weibull analysis affects the general picture of the strength relations in stone wool fibres. It is concluded that the applied statistics is of sufficient accuracy in the present study. The origin of the observed size effect in stone wool fibres is questioned as it contradicts the observations for continuous fibres of equal chemical composition. Therefore it is suggested that the observed relationships between fibre diameter and fibre strength originate from the drawing conditions that will show some variation from fibre to fibre in the stone wool production. Hence the observed size effect is only apparent where the axial stress during forming, drawing temperature and the fictive temperature of the fibres are more important than the actual fibre diameter.

33
7. Homogenisation effect Upon melting in the Cupola furnace used in the Rockwool production the retention time in the maximum temperature is about 15 minutes (Rockwool, 1998). In electrical melting the retention time of the melt is typical around 10 times as long. In the study of Wojnárovits stone wool fibres produced from the Cupola furnace exhibited significant lower strength than fibres prepared from electrically melted melts (Wojnárovits, 1995). In the present study industrial samples of both melting methods are analysed and no such difference in strength is observed between the tested stone wool fibres, as long as the chemistry, spinning conditions and tested volume is kept similar in both types of samples. An example is seen by comparing the results of sample I-3b and I-3c of Paper 4. These findings are interesting since recent study of the melt of the different melting environments clearly indicates heterogeneity difference both in relation to size and frequency of inclusions and bubbles in melts from a Cupola furnace and an electrical furnace (Jensen, et al. 2010). With reference to the discussion of origin of high strength of glass fibres compared to bulk fibres, the orientation of very fine bubbles or inclusions along the length of the fibre is given special attention in Paper 3. It is suggested that orientation of inclusions that are not relaxed upon annealing experiments strongly influences the strength of glass fibres and also stone wool fibres. At the laboratorial scale a simple homogenisation study is performed and the results are presented in the next section.
7.1. Case study – homogenisation of the basaltic glass melt For this case study two basaltic stone wool samples are used: Ob2 and ObHom. The samples are produced from the same initial melt. In the case of ObHom, this sample had its melt retention time (homogenisation time) extended 6 hours compared to Ob2. Melting was performed in Pt/Rd crucible in an electrical furnace well above the liquidus temperature; the cascade spinning was performed at the pilot plant at Rockwool, Hedehusene, Dk. In Paper 2 the strength data of both samples are plotted in a Weibull diagram disregarding a difference in fibre diameter variation among the samples. The <d> is 6.9 μm for Ob2 and for ObHom <d> is 6.5 μm. In Figure 4 of Paper 2 sample ObHom is apparently stronger than Ob2, and it is suggested that the additional strength is a result of the extended homogenisation time of the melt prior to fibre spinning. This suggestion is in contradiction to the results from the fractography analysis, where neither the number nor sizes of critical flaws, indicates changes upon the prolonged homogenisation time of the melt. As discussed in Chapter 4 and in Paper 4, the variation in fibre diameters among the tested samples can be overcome by including the tested volume of the stone wool fibres in the analysis. This is done in Paper 4 and when normalized to equal volumes the strength of both samples is the same. Hence in direct comparison of tensile strength of stone wool fibres it is important to consider the tested fibre diameters. In the conclusion of Paper 4 the observed difference in strength is suggested to be a result of the more oxidised iron content included in the sample of longer homogenisation time (ObHom).
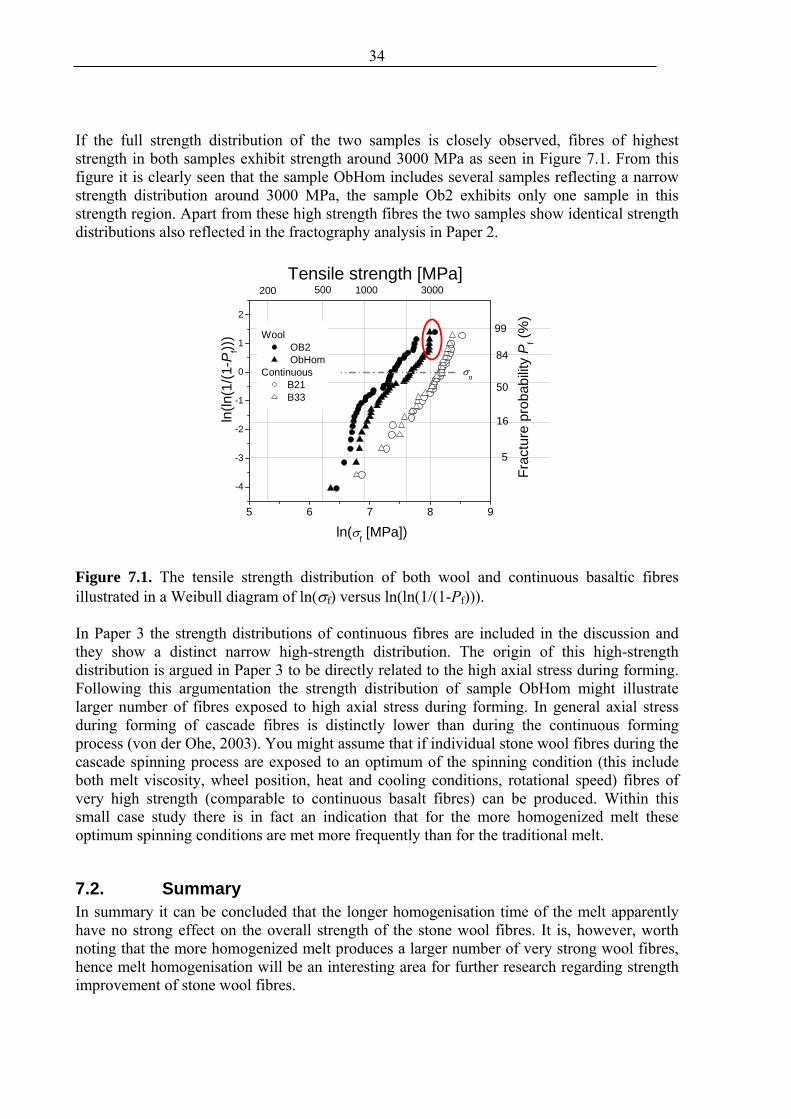
34
If the full strength distribution of the two samples is closely observed, fibres of highest strength in both samples exhibit strength around 3000 MPa as seen in Figure 7.1. From this figure it is clearly seen that the sample ObHom includes several samples reflecting a narrow strength distribution around 3000 MPa, the sample Ob2 exhibits only one sample in this strength region. Apart from these high strength fibres the two samples show identical strength distributions also reflected in the fractography analysis in Paper 2.
5 6 7 8 9
-4
-3
-2
-1
0
1
2
5
16
50
84
99
200 500 1000 3000
ln(ln
(1/(1
-Pf))
)
Frac
ture
pro
babi
lity
Pf (%
)
Wool OB2 ObHom
ContinuousB21B33
σo
ln(σf [MPa])
Tensile strength [MPa]
Figure 7.1. The tensile strength distribution of both wool and continuous basaltic fibres illustrated in a Weibull diagram of ln(σf) versus ln(ln(1/(1-Pf))). In Paper 3 the strength distributions of continuous fibres are included in the discussion and they show a distinct narrow high-strength distribution. The origin of this high-strength distribution is argued in Paper 3 to be directly related to the high axial stress during forming. Following this argumentation the strength distribution of sample ObHom might illustrate larger number of fibres exposed to high axial stress during forming. In general axial stress during forming of cascade fibres is distinctly lower than during the continuous forming process (von der Ohe, 2003). You might assume that if individual stone wool fibres during the cascade spinning process are exposed to an optimum of the spinning condition (this include both melt viscosity, wheel position, heat and cooling conditions, rotational speed) fibres of very high strength (comparable to continuous basalt fibres) can be produced. Within this small case study there is in fact an indication that for the more homogenized melt these optimum spinning conditions are met more frequently than for the traditional melt.
7.2. Summary In summary it can be concluded that the longer homogenisation time of the melt apparently have no strong effect on the overall strength of the stone wool fibres. It is, however, worth noting that the more homogenized melt produces a larger number of very strong wool fibres, hence melt homogenisation will be an interesting area for further research regarding strength improvement of stone wool fibres.
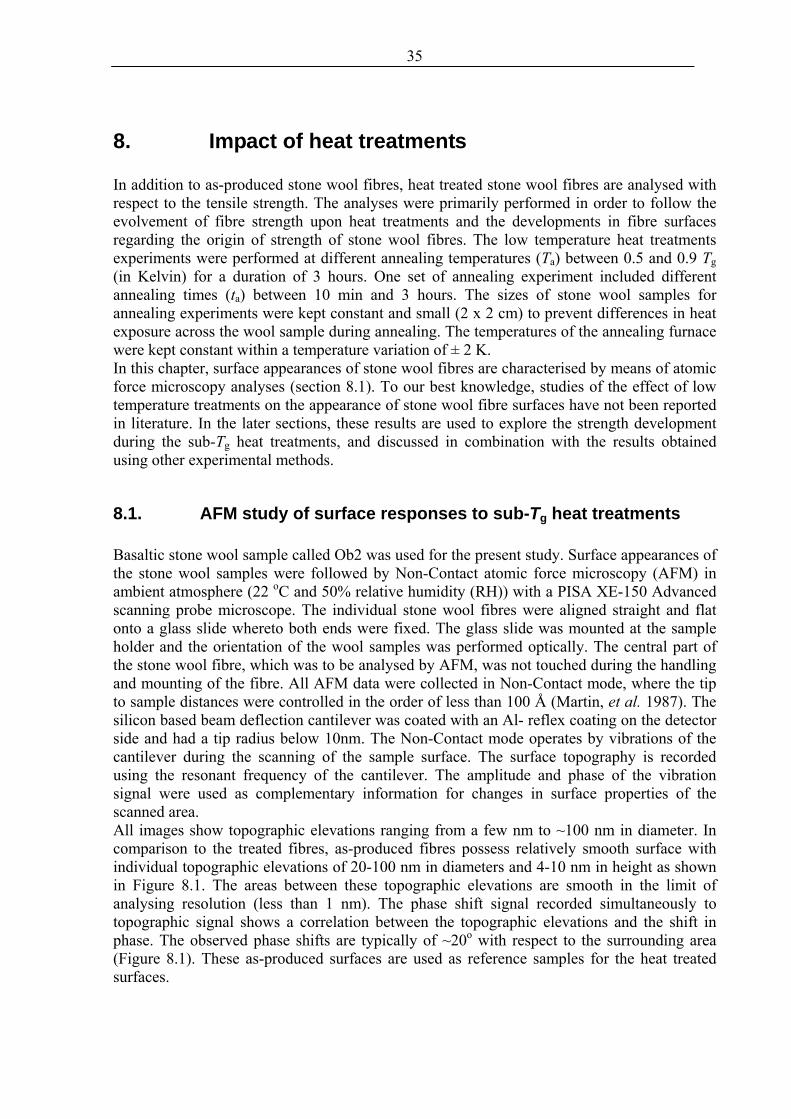
35
8. Impact of heat treatments In addition to as-produced stone wool fibres, heat treated stone wool fibres are analysed with respect to the tensile strength. The analyses were primarily performed in order to follow the evolvement of fibre strength upon heat treatments and the developments in fibre surfaces regarding the origin of strength of stone wool fibres. The low temperature heat treatments experiments were performed at different annealing temperatures (Ta) between 0.5 and 0.9 Tg (in Kelvin) for a duration of 3 hours. One set of annealing experiment included different annealing times (ta) between 10 min and 3 hours. The sizes of stone wool samples for annealing experiments were kept constant and small (2 x 2 cm) to prevent differences in heat exposure across the wool sample during annealing. The temperatures of the annealing furnace were kept constant within a temperature variation of ± 2 K. In this chapter, surface appearances of stone wool fibres are characterised by means of atomic force microscopy analyses (section 8.1). To our best knowledge, studies of the effect of low temperature treatments on the appearance of stone wool fibre surfaces have not been reported in literature. In the later sections, these results are used to explore the strength development during the sub-Tg heat treatments, and discussed in combination with the results obtained using other experimental methods.
8.1. AFM study of surface responses to sub-Tg heat treatments Basaltic stone wool sample called Ob2 was used for the present study. Surface appearances of the stone wool samples were followed by Non-Contact atomic force microscopy (AFM) in ambient atmosphere (22 oC and 50% relative humidity (RH)) with a PISA XE-150 Advanced scanning probe microscope. The individual stone wool fibres were aligned straight and flat onto a glass slide whereto both ends were fixed. The glass slide was mounted at the sample holder and the orientation of the wool samples was performed optically. The central part of the stone wool fibre, which was to be analysed by AFM, was not touched during the handling and mounting of the fibre. All AFM data were collected in Non-Contact mode, where the tip to sample distances were controlled in the order of less than 100 Å (Martin, et al. 1987). The silicon based beam deflection cantilever was coated with an Al- reflex coating on the detector side and had a tip radius below 10nm. The Non-Contact mode operates by vibrations of the cantilever during the scanning of the sample surface. The surface topography is recorded using the resonant frequency of the cantilever. The amplitude and phase of the vibration signal were used as complementary information for changes in surface properties of the scanned area. All images show topographic elevations ranging from a few nm to ~100 nm in diameter. In comparison to the treated fibres, as-produced fibres possess relatively smooth surface with individual topographic elevations of 20-100 nm in diameters and 4-10 nm in height as shown in Figure 8.1. The areas between these topographic elevations are smooth in the limit of analysing resolution (less than 1 nm). The phase shift signal recorded simultaneously to topographic signal shows a correlation between the topographic elevations and the shift in phase. The observed phase shifts are typically of ~20o with respect to the surrounding area (Figure 8.1). These as-produced surfaces are used as reference samples for the heat treated surfaces.

36
Subsequent to the fibre spinning process, chemical reactions might take place at the fibre/air interface, e.g. the fibre surface is attached by the humidity in the ambient atmosphere (Hench and Clark, 1978). This reaction involves leaching of alkali/alkaline-earth species due to water adsorption on the glass surface. Hence, pristine glass surfaces measured in atmospheric air are covered with a thin layer of water, which should be taken into account during the interpretation of the AFM images performed under ambient conditions. In a recent study of Schmitz et al. (Schmitz et al. 1997) freshly cleaved medieval glass surfaces were imaged by AFM. After a short time of surface exposure to 20%RH and 70%RH they observe surface topography of ~5nm that correlates with the phase shift signal to appear. These topographic elevations disappeared as the analysing condition was changed to dry nitrogen. Surfaces exposed to controlled humidity for longer time durations (22h/26h) showed larger topographic features and characteristic phase shifts of -18o with respect to the surrounding areas. Schmitz et al. concluded that the observed surface topography is directly related to water adsorption at the glass surface as a result of the humidity in the surrounding atmosphere (Schmitz et al. 1997). In the present study, a control of both atmosphere and humidity during AFM analysis were not possible. However, the results of Schmitz et al. are in agreement with the observations of this study with respect to the size of both topography and phase signal. It is most likely that the surfaces observed at basaltic wool fibres are results of surface corrosion due to surface exposure to ambient humidity during storing, handling and analysing of the fibres (primarily water adsorption). Furthermore, indentations performed by contact mode AFM, show that the topographic elevations appear slightly softer relative to the general fibre surface in the reference sample surfaces. AFM results show no differences in surfaces appearances of stone wool fibres stored for 20 hours or for one year. This indicates that the hydrolysed surfaces are produced rapidly after or during the fibre production. Fibre surfaces heat treated at 200ºC (0.5Tg) appear similar to the reference. Although some topographic elevations reach heights of 15 nm and diameters of 200 nm, the corresponding phase shift signal is still correlated directly to the individual topographic elevations in accordance with Figure 8.1.
Figure 8.1. AFM images of stone wool fibre surfaces. A) Surface topography and B) phase shift signal image of as-produced fibres. Small topographic elevations correspond directly to phase shift changes of ~20 o relative to the surrounding surface area. The general impression of the fibre surfaces is smooth to the limit of analysing resolution (less than 1nm).

37
Surfaces of the fibres heat treated at temperatures between 250 oC and 300 oC (0.56 and 0.62Tg) still exhibit well defined topographic elevations. A larger variation in topography occurs in these samples compared to the reference sample as indicated by the correlation between the topography and the phase shift signal. Upon a heat treatment at temperatures around 350 oC (0.67Tg), two different appearances of fibre surfaces are observed by AFM (Figure 8.2). The first surface type appears in accordance with fibre surfaces at lower temperatures (Figure 8.2.A). Although, this type of surface shows large variation in the phase shift signal and in its correlation with observed topographic elevations (Figure 8.2.B). The second type of fibre surfaces has larger surface roughness in which smooth areas to the limit of the analysing resolution are no longer present (Figure 8.2.C). In this type of surfaces a close correlation between topography and the changes in the phase shift signal are observed. At these surfaces it is the topographic valleys that correspond to the larger shifts in phase shift signals (Figure 8.2.D). This indicates a distinct change in surface properties compared to surface samples exposed to lower temperatures. Stone wool fibre surfaces show topographic elevations of heights up to 10nm after heat treatment in air at 350 oC (0.67Tg). An increase in heat treatment temperature leads to an increase the heights of the topographic elements, so that heights of 25 nm are seen on the surfaces of stone wool surfaces heat treated at 450 oC (0.78Tg) (Figure 8.3). At this temperature the phase shift signal is completely changed compared to signals from lower temperatures (Figure 8.3.B).
Figure 8.2. Two distinct different surface appearances are seen at stone wool fibres heat treated at 350 oC (0.67Tg). The differences are seen in both topography, (A and C) and phase shift images (B and D).
A
B
C
D

38
Figure 8.3. AFM images of stone wool fibres heat treated at 450 oC (0.78Tg) for a duration of 3 hours. A: Surface topography and B: phase shift signal image simultaneously recorded in a 1000 nmx1000 nm area. Variation in the heat treatments durations (10 minutes to 3 hours) at 450 oC (0.78Tg) allows AFM analyses to picture the development of fibre surfaces. Figure 8.4 shows the development in topography of stone wool fibres at 0.78Tg. During short heat treatment experiments (10-30 minutes) the fibre surfaces show numerous small topographic elevations (with heights up to 4 nm), homogeneously distributed across the fibre surface. At extended heat treatment duration i.e. 60 minutes, stone wool fibre surfaces exhibit an increase in the heights of the observed topographic elements up to heights of 100 nm (Figure 8.4.D). Figure 8.3 shows the surface topography of fibres heat treatment at 450 oC for 3 hours, where the average heights of the individual topographic elevations are around 10-20nm. Larger scan areas of these fibre surfaces indicate that the analysed surface may include more than one surface layer and in Figure 8.3 it is also seen that the surface areas between the larger individual topographic elements exhibit variations in surface topography. These observations indicate development of subsequent surface layer formation.
A
B

39
Figure 8.4. Stone wool fibre surfaces at heat treatment temperature of 0.78Tg for durations between 10 and 60 minutes imaged by AFM. The surfaces shown in figure 3 illustrate the result of similar heat treatment for duration of 3 hours.
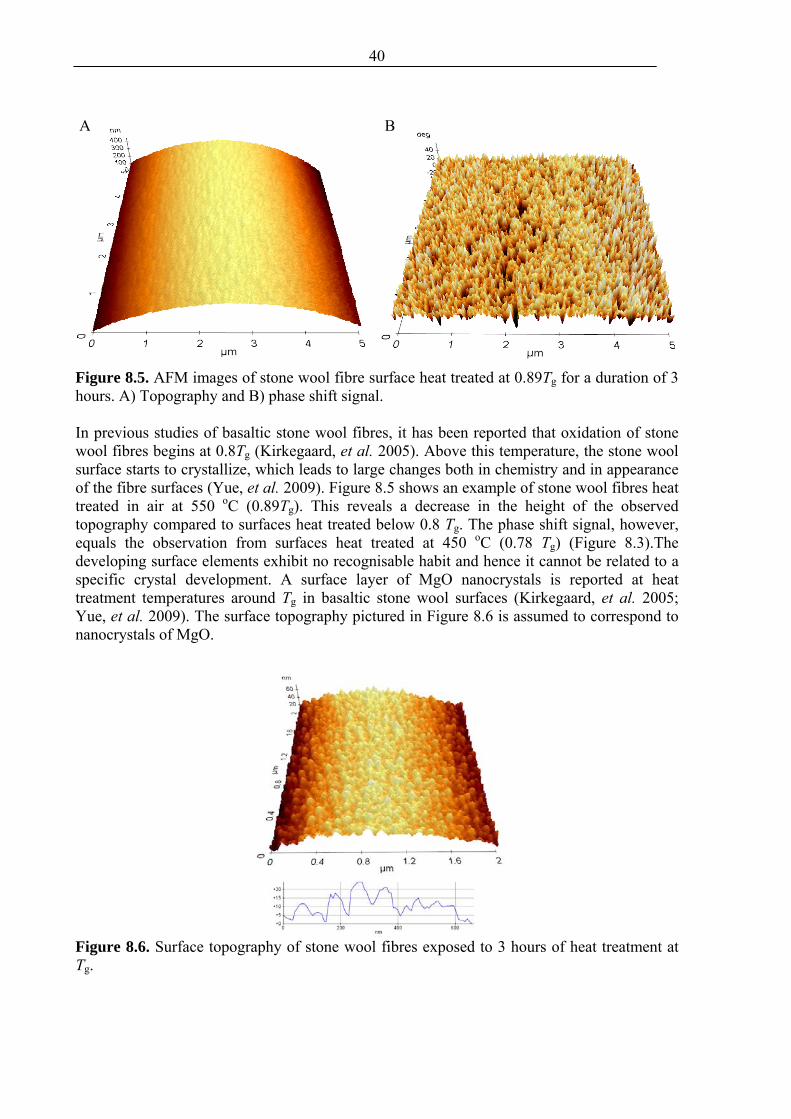
40
Figure 8.5. AFM images of stone wool fibre surface heat treated at 0.89Tg for a duration of 3 hours. A) Topography and B) phase shift signal. In previous studies of basaltic stone wool fibres, it has been reported that oxidation of stone wool fibres begins at 0.8Tg (Kirkegaard, et al. 2005). Above this temperature, the stone wool surface starts to crystallize, which leads to large changes both in chemistry and in appearance of the fibre surfaces (Yue, et al. 2009). Figure 8.5 shows an example of stone wool fibres heat treated in air at 550 oC (0.89Tg). This reveals a decrease in the height of the observed topography compared to surfaces heat treated below 0.8 Tg. The phase shift signal, however, equals the observation from surfaces heat treated at 450 oC (0.78 Tg) (Figure 8.3).The developing surface elements exhibit no recognisable habit and hence it cannot be related to a specific crystal development. A surface layer of MgO nanocrystals is reported at heat treatment temperatures around Tg in basaltic stone wool surfaces (Kirkegaard, et al. 2005; Yue, et al. 2009). The surface topography pictured in Figure 8.6 is assumed to correspond to nanocrystals of MgO.
Figure 8.6. Surface topography of stone wool fibres exposed to 3 hours of heat treatment at Tg.
A B

41
In summary, a surface response of stone wool fibres to sub-Tg heat treatments can be observed by Non-Contact AFM. The results suggest that fibre surfaces analysed at ambient conditions show a direct relationship between topography and phase shift signal related to water adhesion. Upon heat treatment, changes of the surface appearance occur, which becomes more evident with increasing temperature and duration. Surface topography is observed to change even at a rather low temperature of ~ 0.6Tg. The correlation between topography and phase shift signals changes at heat treatments around and above 0.7Tg, which indicates change in surface characteristics such as chemistry or hardness. These changes might originate from water adsorption and related alkali/alkaline-earth leaching. Chemical analysis is needed to confirm this relationship. At heat treatment temperatures around 0.9Tg oxidation of the reduced iron influences the appearances of the fibre surfaces in accordance with previous studies.
8.2. Strength development upon sub-Tg heat treatments Stone wool fibres exposed to sub-Tg heat treatment have a lower tensile strength at heat treatment temperatures around 0.8Tg as shown and discussed in Paper 3. Some additional aspects of the low temperature heat treatment are presented in this section and discussed with respect to the reduction of tensile strength. Figures 8.7 and 8.8 show the strength distribution and the strength reduction of stone wool fibres Ob2 exposed to sub-Tg heat treatment at temperatures between 200 and 635 oC (0.56-1.0Tg).
-4
-3.5
-3
-2.5
-2
-1.5
-1
-0.5
0
0.5
1
1.5
2
5 5.5 6 6.5 7 7.5 8Lnσ f [MPa]
ln(ln
(1/(1
-Pf))
)
635600550500450400350300250200Ob2 ref
P 16%
P=84%
P=99%
P=50%
Heat treatment T in CDuration 3 h
Basaltic stone wool fibres
σ 0
P=16%
P= 5%
14
Figure 8.7. Weibull diagram illustrating the strength distribution of stone wool fibres heat treated at temperatures below Tg for a duration of 3 hours.
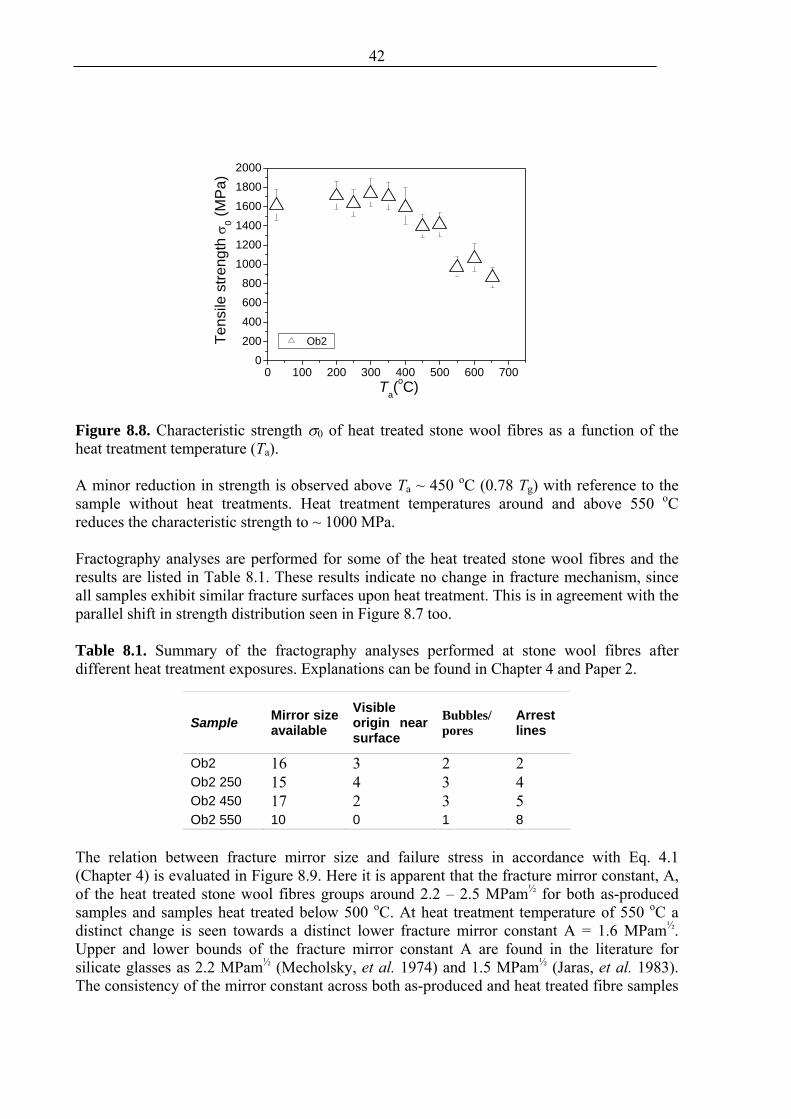
42
0 100 200 300 400 500 600 7000
200400600800
100012001400160018002000
Ten
sile
stre
ngth
σ0 (M
Pa)
Ta(oC)
Ob2
Figure 8.8. Characteristic strength σ0 of heat treated stone wool fibres as a function of the heat treatment temperature (Ta). A minor reduction in strength is observed above Ta ~ 450 oC (0.78 Tg) with reference to the sample without heat treatments. Heat treatment temperatures around and above 550 oC reduces the characteristic strength to ~ 1000 MPa. Fractography analyses are performed for some of the heat treated stone wool fibres and the results are listed in Table 8.1. These results indicate no change in fracture mechanism, since all samples exhibit similar fracture surfaces upon heat treatment. This is in agreement with the parallel shift in strength distribution seen in Figure 8.7 too. Table 8.1. Summary of the fractography analyses performed at stone wool fibres after different heat treatment exposures. Explanations can be found in Chapter 4 and Paper 2.
Sample Mirror size available
Visible origin near surface
Bubbles/ pores
Arrest lines
Ob2 16 3 2 2 Ob2 250 15 4 3 4 Ob2 450 17 2 3 5 Ob2 550 10 0 1 8
The relation between fracture mirror size and failure stress in accordance with Eq. 4.1 (Chapter 4) is evaluated in Figure 8.9. Here it is apparent that the fracture mirror constant, A, of the heat treated stone wool fibres groups around 2.2 – 2.5 MPam½ for both as-produced samples and samples heat treated below 500 oC. At heat treatment temperature of 550 oC a distinct change is seen towards a distinct lower fracture mirror constant A = 1.6 MPam½. Upper and lower bounds of the fracture mirror constant A are found in the literature for silicate glasses as 2.2 MPam½ (Mecholsky, et al. 1974) and 1.5 MPam½ (Jaras, et al. 1983). The consistency of the mirror constant across both as-produced and heat treated fibre samples
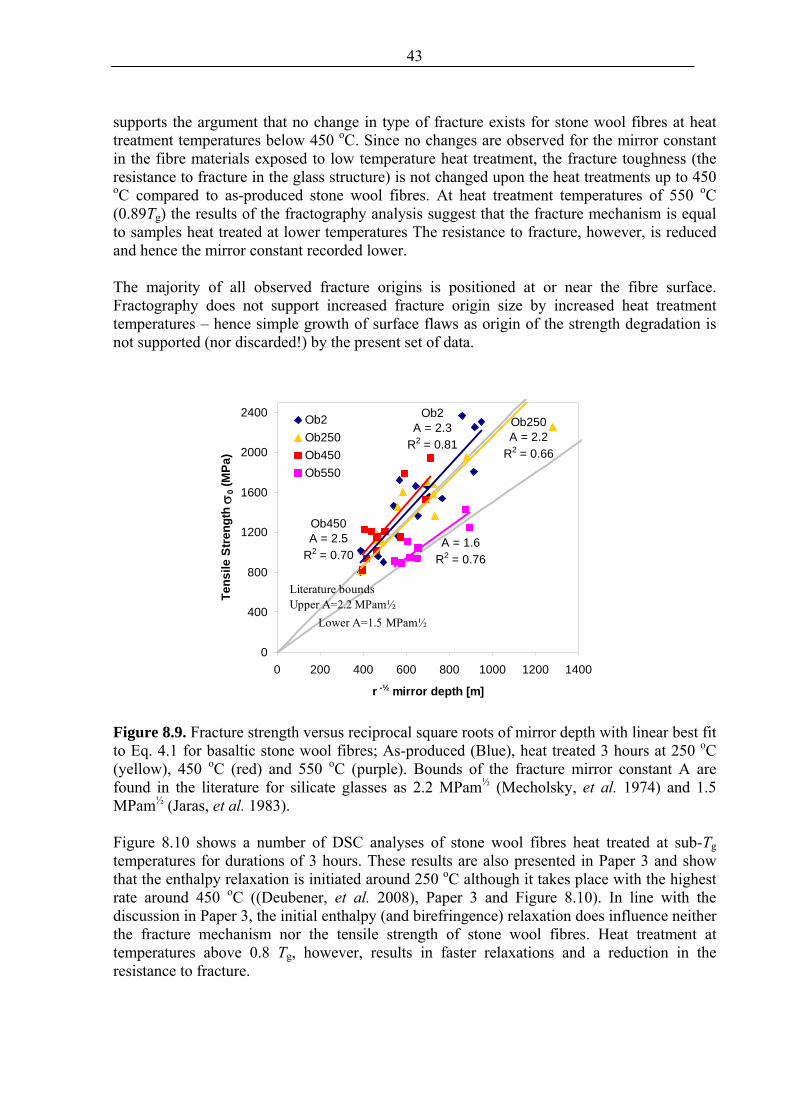
43
supports the argument that no change in type of fracture exists for stone wool fibres at heat treatment temperatures below 450 oC. Since no changes are observed for the mirror constant in the fibre materials exposed to low temperature heat treatment, the fracture toughness (the resistance to fracture in the glass structure) is not changed upon the heat treatments up to 450 oC compared to as-produced stone wool fibres. At heat treatment temperatures of 550 oC (0.89Tg) the results of the fractography analysis suggest that the fracture mechanism is equal to samples heat treated at lower temperatures The resistance to fracture, however, is reduced and hence the mirror constant recorded lower. The majority of all observed fracture origins is positioned at or near the fibre surface. Fractography does not support increased fracture origin size by increased heat treatment temperatures – hence simple growth of surface flaws as origin of the strength degradation is not supported (nor discarded!) by the present set of data.
Ob2A = 2.3
R2 = 0.81
Ob450A = 2.5
R2 = 0.70
Ob250A = 2.2
R2 = 0.66
A = 1.6R2 = 0.76
0
400
800
1200
1600
2000
2400
0 200 400 600 800 1000 1200 1400
r -½ mirror depth [m]
Tens
ile S
tren
gth σ
0 (M
Pa)
Ob2Ob250Ob450Ob550
Literature bounds Upper A=2.2 MPam½ Lower A=1.5 MPam½
Figure 8.9. Fracture strength versus reciprocal square roots of mirror depth with linear best fit to Eq. 4.1 for basaltic stone wool fibres; As-produced (Blue), heat treated 3 hours at 250 oC (yellow), 450 oC (red) and 550 oC (purple). Bounds of the fracture mirror constant A are found in the literature for silicate glasses as 2.2 MPam½ (Mecholsky, et al. 1974) and 1.5 MPam½ (Jaras, et al. 1983). Figure 8.10 shows a number of DSC analyses of stone wool fibres heat treated at sub-Tg temperatures for durations of 3 hours. These results are also presented in Paper 3 and show that the enthalpy relaxation is initiated around 250 oC although it takes place with the highest rate around 450 oC ((Deubener, et al. 2008), Paper 3 and Figure 8.10). In line with the discussion in Paper 3, the initial enthalpy (and birefringence) relaxation does influence neither the fracture mechanism nor the tensile strength of stone wool fibres. Heat treatment at temperatures above 0.8 Tg, however, results in faster relaxations and a reduction in the resistance to fracture.
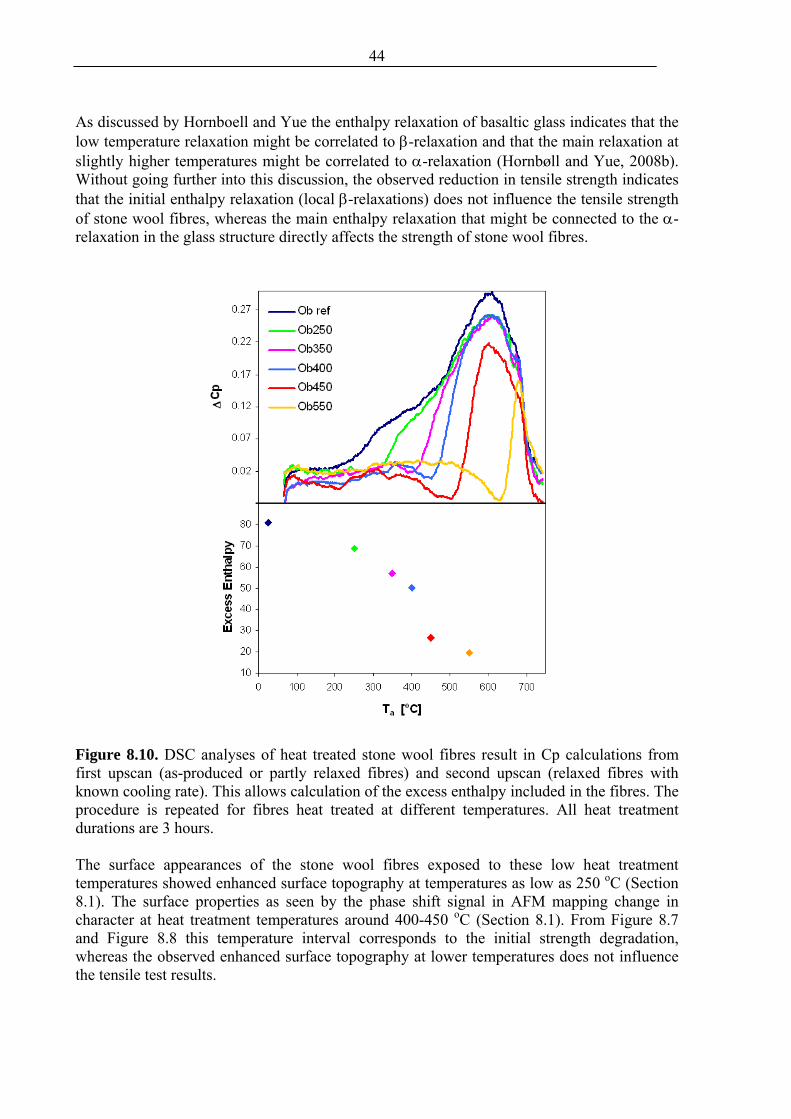
44
As discussed by Hornboell and Yue the enthalpy relaxation of basaltic glass indicates that the low temperature relaxation might be correlated to β-relaxation and that the main relaxation at slightly higher temperatures might be correlated to α-relaxation (Hornbøll and Yue, 2008b). Without going further into this discussion, the observed reduction in tensile strength indicates that the initial enthalpy relaxation (local β-relaxations) does not influence the tensile strength of stone wool fibres, whereas the main enthalpy relaxation that might be connected to the α-relaxation in the glass structure directly affects the strength of stone wool fibres.
Figure 8.10. DSC analyses of heat treated stone wool fibres result in Cp calculations from first upscan (as-produced or partly relaxed fibres) and second upscan (relaxed fibres with known cooling rate). This allows calculation of the excess enthalpy included in the fibres. The procedure is repeated for fibres heat treated at different temperatures. All heat treatment durations are 3 hours. The surface appearances of the stone wool fibres exposed to these low heat treatment temperatures showed enhanced surface topography at temperatures as low as 250 oC (Section 8.1). The surface properties as seen by the phase shift signal in AFM mapping change in character at heat treatment temperatures around 400-450 oC (Section 8.1). From Figure 8.7 and Figure 8.8 this temperature interval corresponds to the initial strength degradation, whereas the observed enhanced surface topography at lower temperatures does not influence the tensile test results.
45
The strength data of the stone wool fibres treated at low temperatures may provide some insight in some complex relations between tensile strength, fibre production parameters and glass structure. These are discussed in more detail in Paper 3.
8.3. Case study – brake pallets reinforced by stone wool fibres In a more practical and application oriented aspect the low temperature heat treatment alternation of stone wool fibres might highly influence their properties e.g. as reinforcement materials. In a case study from a business partner of Rockwool International A/S special brake pallets were produced using stone wool fibres as reinforcement material. The brake pallets reinforced by stone wool fibres show significant increase in three point flexure strength as long as the fibres used for reinforcement had not experienced heat treatment above 300 oC prior to brake pallet production. By the use of stone wool fibres heat treated at 400 oC or more no increase in three point flexure strength is seen compared to pallets without reinforcements. The heat treatments of stone wool fibres even at low temperature reduced their quality as reinforcement materials. Two arguments are noted here:
o Sub-Tg heat treatment alters the fibre surfaces of stone wool fibres. Fibre surfaces are very important in relation to adhesion and binding of the material they are supposed to reinforce.
o Reduction in strength of stone wool fibres might cause a decrease in fibre length, as fibre breakage upon materials mixing and preparation of the brake pallets result in shorter fibres when the initial fibre strength is reduced.
The observed reduction in reinforcement quality of stone wool fibres towards the brake pallets is observed already at temperatures below 400 oC. Hence the influence of the fibre surfaces is assumed to be larger than the actual tensile strength of the stone wool fibres, since the strength reduction is not very significant in this temperature interval. At temperatures above 400 oC it is clear that a combination of surface changes and fibre strength can result in bad reinforcement quality.
8.4 Summary Experimental results suggest that the strength development of stone wool fibres upon sub-Tg heat treatments is more closely related to the glass structure than to the variation in actual surface appearances of the stone wool fibres.

46
9. Impact of humidity treatment In addition to heat treatments, controlled humidity treatment was performed in order to see whether exposure to controlled climatic conditions affects the tensile strength of stone wool fibres. The humidity induced degradation in strength of glass fibres is usually attributed to the growth of surface flaws due to water attack according to crack weakening theories of Inglis and Griffith (Griffith, 1921; Inglis, 1913). By exposure of fibre surfaces to high humidity, water molecules are believed to condense at crack tips and facilitate the crack growth – thereby enhance the fatigue or simply decrease the strength of the material. So the presence of water vapour enhances the growth of the pre-existing surface flaws. Interaction between humidity and glass surface increases the existing surface flaws and thereby weakens the fibres. Interaction of water and glass surfaces is determined by surface reactivity. In literature, it has been reported that the strongest adsorption sites are associated with coordination defects (Ito and Taniguchi, 2004; Leed and Pantano, 2003). A glass with a higher fictive temperature more strongly strained bonds and coordination defects compared to a glass with lower fictive temperature. The surface activity has been characterised by surface topography related to the contact angle between water and the glass substrate, physisorption and chemisorption (e.g. (Wenzel, 1949; Garofalini, et al. 1980)). The surface activity depends on chemical compositions of the glasses (e.g. (Orowan, 1944)).
9.1. Humidity treatment of stone wool fibres A case study of two stone wool samples is presented here. Humidity treatments are performed at as-produced stone wool fibres in a climatic chamber at controlled relative humidity of 95% and temperature of 70 oC. The samples were exposed to this humidity treatment for 1, 2 and 4 weeks respectively. In this present project, two kinds of samples were investigated. One is a basalt wool sample (called Ob2), which was produced at the laboratory scale by using the cascade spinning facilities in Hedehusene. The raw material originates from Obersheld, Germany. This sample was used throughout the project as a basalt standard sample. Another sample is a stone wool sample (called Aludross or Alu250) with slightly altered standard Rockwool composition, in which a small amount of recycled aluminium slag was used as a raw material. This sample was produced at a full scale cascade production line of Rockwool International A/S in Mos, Norway. The chemical compositions of both samples are measured using XRF and given in Table 9.1.
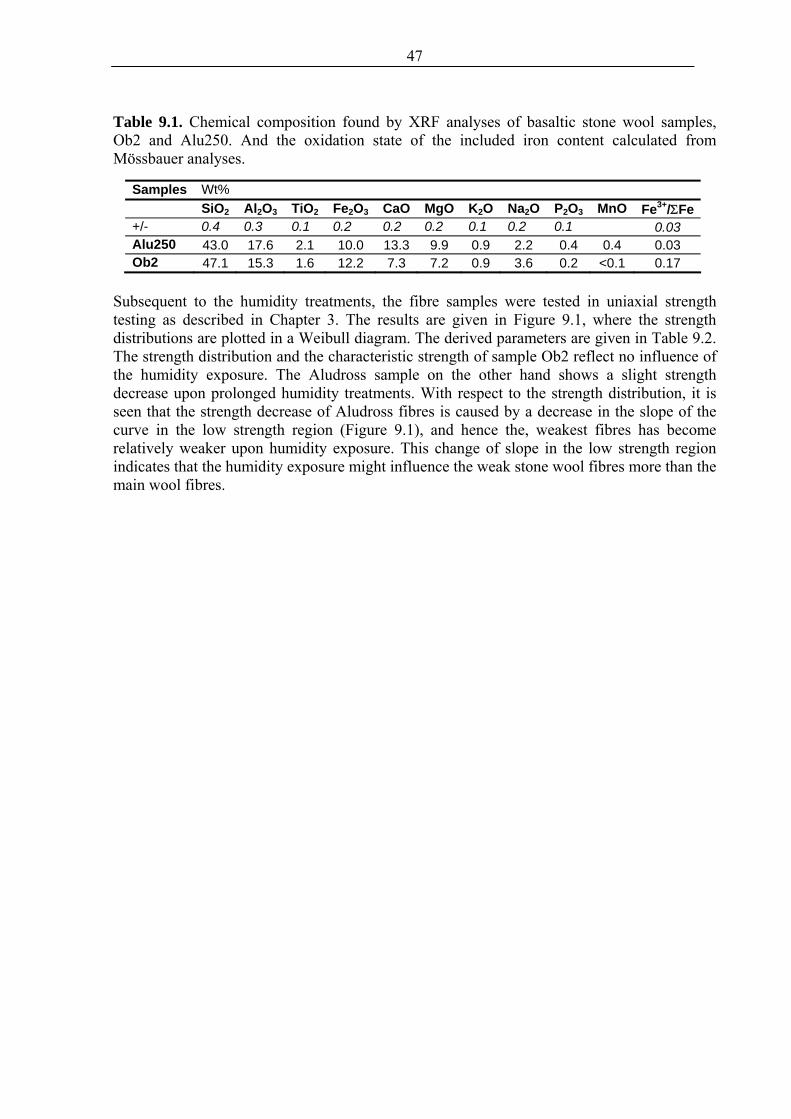
47
Table 9.1. Chemical composition found by XRF analyses of basaltic stone wool samples, Ob2 and Alu250. And the oxidation state of the included iron content calculated from Mössbauer analyses.
Samples Wt% SiO2 Al2O3 TiO2 Fe2O3 CaO MgO K2O Na2O P2O3 MnO Fe3+/ΣFe+/- 0.4 0.3 0.1 0.2 0.2 0.2 0.1 0.2 0.1 0.03 Alu250 43.0 17.6 2.1 10.0 13.3 9.9 0.9 2.2 0.4 0.4 0.03 Ob2 47.1 15.3 1.6 12.2 7.3 7.2 0.9 3.6 0.2 <0.1 0.17
Subsequent to the humidity treatments, the fibre samples were tested in uniaxial strength testing as described in Chapter 3. The results are given in Figure 9.1, where the strength distributions are plotted in a Weibull diagram. The derived parameters are given in Table 9.2. The strength distribution and the characteristic strength of sample Ob2 reflect no influence of the humidity exposure. The Aludross sample on the other hand shows a slight strength decrease upon prolonged humidity treatments. With respect to the strength distribution, it is seen that the strength decrease of Aludross fibres is caused by a decrease in the slope of the curve in the low strength region (Figure 9.1), and hence the, weakest fibres has become relatively weaker upon humidity exposure. This change of slope in the low strength region indicates that the humidity exposure might influence the weak stone wool fibres more than the main wool fibres.
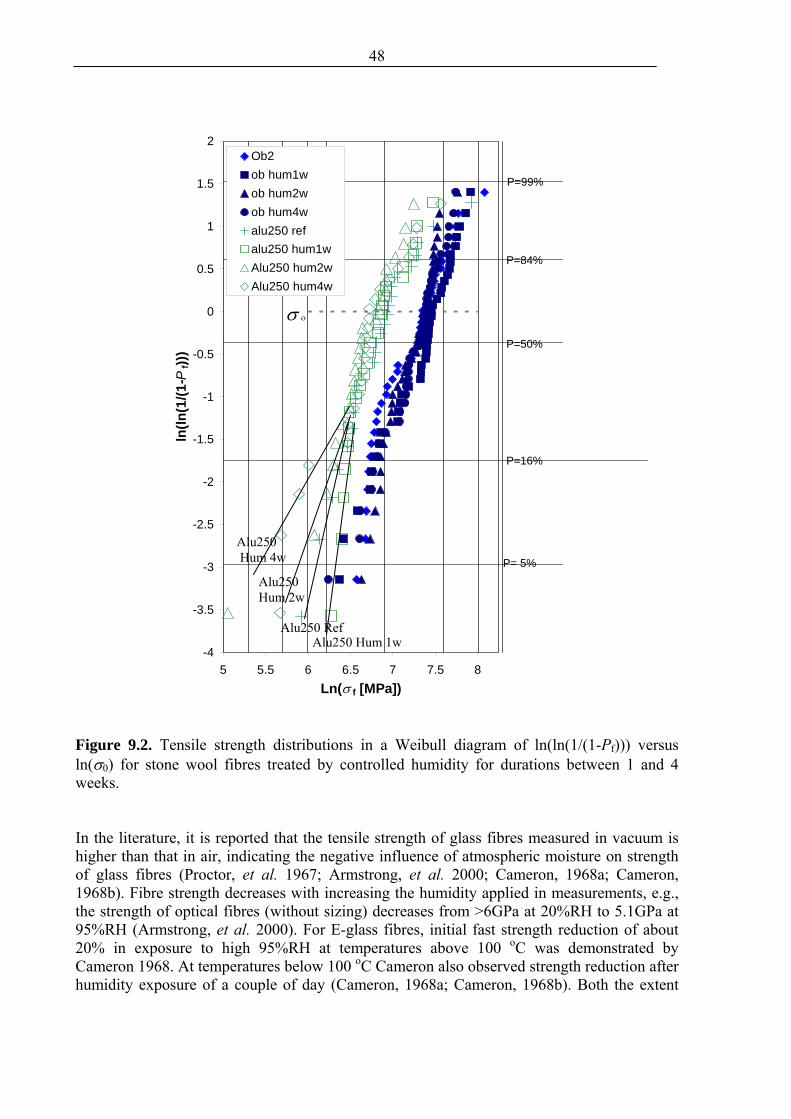
48
-4
-3.5
-3
-2.5
-2
-1.5
-1
-0.5
0
0.5
1
1.5
2
5 5.5 6 6.5 7 7.5 8Ln(σ f [MPa])
ln(ln
(1/(1
-Pf))
)
Ob2ob hum1wob hum2wob hum4walu250 refalu250 hum1wAlu250 hum2wAlu250 hum4w
P=16%
P=84%
P=99%
P=50%
P= 5%
σ ο
Figure 9.2. Tensile strength distributions in a Weibull diagram of ln(ln(1/(1-Pf))) versus ln(σ0) for stone wool fibres treated by controlled humidity for durations between 1 and 4 weeks. In the literature, it is reported that the tensile strength of glass fibres measured in vacuum is higher than that in air, indicating the negative influence of atmospheric moisture on strength of glass fibres (Proctor, et al. 1967; Armstrong, et al. 2000; Cameron, 1968a; Cameron, 1968b). Fibre strength decreases with increasing the humidity applied in measurements, e.g., the strength of optical fibres (without sizing) decreases from >6GPa at 20%RH to 5.1GPa at 95%RH (Armstrong, et al. 2000). For E-glass fibres, initial fast strength reduction of about 20% in exposure to high 95%RH at temperatures above 100 oC was demonstrated by Cameron 1968. At temperatures below 100 oC Cameron also observed strength reduction after humidity exposure of a couple of day (Cameron, 1968a; Cameron, 1968b). Both the extent
Alu250 Hum 1wAlu250 Ref
Alu250 Hum 2w
Alu250 Hum 4w
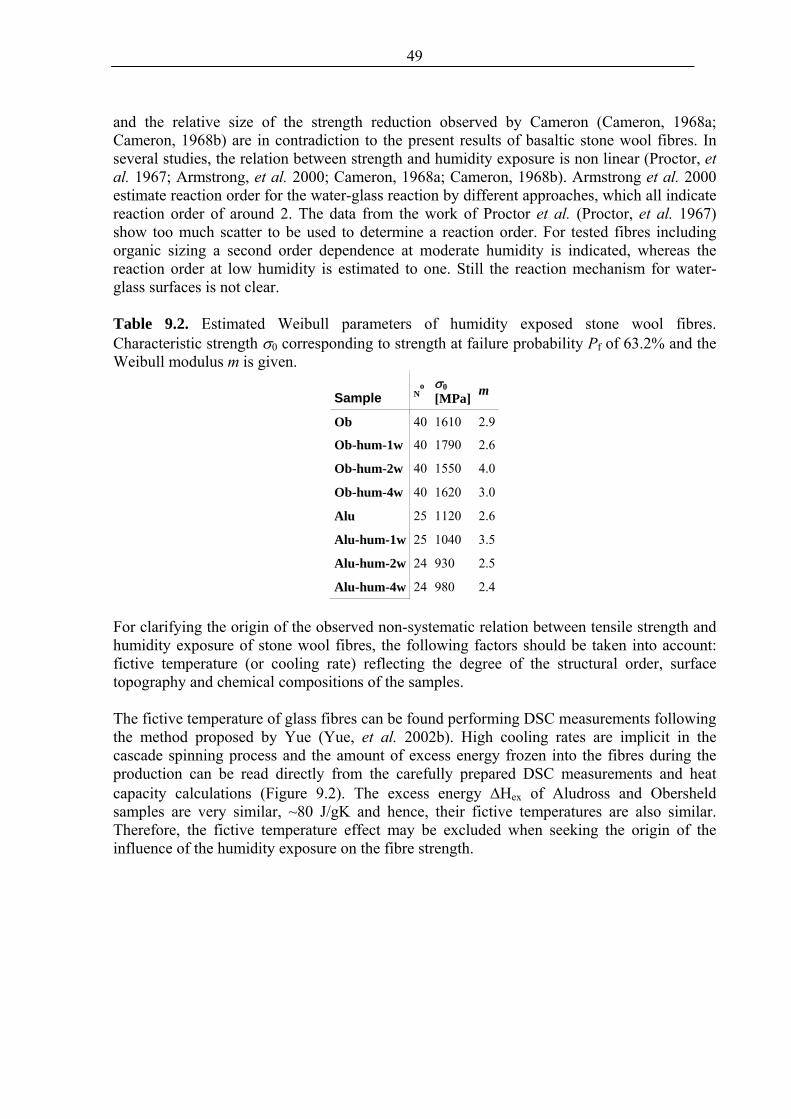
49
and the relative size of the strength reduction observed by Cameron (Cameron, 1968a; Cameron, 1968b) are in contradiction to the present results of basaltic stone wool fibres. In several studies, the relation between strength and humidity exposure is non linear (Proctor, et al. 1967; Armstrong, et al. 2000; Cameron, 1968a; Cameron, 1968b). Armstrong et al. 2000 estimate reaction order for the water-glass reaction by different approaches, which all indicate reaction order of around 2. The data from the work of Proctor et al. (Proctor, et al. 1967) show too much scatter to be used to determine a reaction order. For tested fibres including organic sizing a second order dependence at moderate humidity is indicated, whereas the reaction order at low humidity is estimated to one. Still the reaction mechanism for water-glass surfaces is not clear. Table 9.2. Estimated Weibull parameters of humidity exposed stone wool fibres. Characteristic strength σ0 corresponding to strength at failure probability Pf of 63.2% and the Weibull modulus m is given.
Sample N
o σ0 [MPa] m
Ob 40 1610 2.9
Ob-hum-1w 40 1790 2.6
Ob-hum-2w 40 1550 4.0
Ob-hum-4w 40 1620 3.0
Alu 25 1120 2.6
Alu-hum-1w 25 1040 3.5
Alu-hum-2w 24 930 2.5
Alu-hum-4w 24 980 2.4
For clarifying the origin of the observed non-systematic relation between tensile strength and humidity exposure of stone wool fibres, the following factors should be taken into account: fictive temperature (or cooling rate) reflecting the degree of the structural order, surface topography and chemical compositions of the samples. The fictive temperature of glass fibres can be found performing DSC measurements following the method proposed by Yue (Yue, et al. 2002b). High cooling rates are implicit in the cascade spinning process and the amount of excess energy frozen into the fibres during the production can be read directly from the carefully prepared DSC measurements and heat capacity calculations (Figure 9.2). The excess energy ΔHex of Aludross and Obersheld samples are very similar, ~80 J/gK and hence, their fictive temperatures are also similar. Therefore, the fictive temperature effect may be excluded when seeking the origin of the influence of the humidity exposure on the fibre strength.

50
0.7
0.9
1.1
1.3
1.5
1.7
1.9
300 400 500 600 700 800 900 1000T [K]
Cp
[J/g
K]
Alu250Ob2
Figure 9.2. Heat capacity curves (Cp) calculated from DSC measurements. Inset figure show the excess energy ΔHex of both samples to be very similar. AFM is used to image the fibre surfaces as described in section 8.1. AFM images of humidity aged sample Ob2 show that the surface appearance changes upon the humidity exposure. Figure 9.3 shows the change in both topography and phase shift signal of fibre sample exposed to humidity for four weeks. Compared to the initial surface appearances as described in Section 8.1, surface topographical changes occur during the humidity exposure. On the humidity exposed surfaces, the frequency of the topographic elements is much larger than at that of as-produced surfaces (Chapter 8). However, a good correlation between topographic heights and shifts in the phase signal is seen and the size of the phase shifts is similar to that observed on as-produced surfaces. This suggests similar origin of the observed topography on both as-produced surfaces and humidity treated surfaces. AFM analyses were not performed on the humidity exposed Aludross samples. A possible origin of the observed topographic features is the interaction between water and glass surface followed by alkali/alkaline-earth leaching. This is supported by transmission electron microscopy (TEM) images of Aludross samples, which exhibits extensive skin formation upon humidity ageing for 4 weeks (Figure 1 in Paper 1). Chemical changes observed at the fibre surfaces using EDS are shown in Paper 1 (see also Figure 9.4), which confirm the humidity-glass surface interaction for the Aludross samples. The EDS data of Sample Ob2 have not been obtained so far. When comparing AFM images of Ob2 and TEM images of Alu250 samples, a more extensive ‘rough skin’ formation is present in Aludross samples exposed to humidity for 4 weeks than in Obersheld wool fibres (See Figure 1 in Paper 1 and Figure 9.3).
0
0.05
0.1
0.15
0.2
0.25
0.3
0.35
300 500 700 900 1100T [K]
ΔH
ex [J
/gK
]
Ob refAlu250_ref

51
Figure 9.3. AFM surface topography (left panel) and phase shift signal (right panel) of stone wool sample exposed to controlled humidity for 4 weeks at 70 oC. Surface roughness analyses of glass fibres by AFM have been reported for different purposes in the literature. Surface roughening has been observed on glass fibres with and without organic coating upon humidity exposure (Matthewson and Yuce, 1994), whereas no surface roughening has been found on silica glass fibres even upon high humidity exposure (Tomozawa and Hepburn, 2004). It is tempting to relate these differences to the overall chemical differences in the tested glass fibres. With reference to the influence of the humidity exposure on the tensile strength, a direct relation between surface roughness observed by AFM and the tensile strength cannot be established from the data obtained in this work, since sample Ob2 shows increased frequency of surface topographic elements upon humidity exposure, but no detectable decrease in tensile strength. By contrast, for the Aludross sample, a relation exists between the tensile strength and the humidity exposure (Figure 9.2). Chemical analyses show slight compositional changes in the surfaces of humidity exposed Aludross fibres.
ALU50 humidity, EDS relative to Si
0,00,2
0,40,60,81,0
1,21,41,6
1,82,0
O Na Mg Al Si K Ca Ti Mn Fe
Humidity 4w Skin
Humidity 4w Interior
As recieved inside
Figure 9.4. Relative chemical composition obtained by EDS analyses of stone wool fibres as-received and exposed to humidity test for 4 weeks.
52
9.3. Summary In summary, no conclusive relation between exposures of stone wool fibre surfaces to controlled humidity condition and the tensile strength of the wool fibres can be established from the present data.

53
10. Summary In the present project, the tensile strength and fracture mechanism of glass fibres are studied by means of different approaches such as fractography analysis, tensile test, Weibull analysis, AFM and SEM imaging, DSC scan, Mössbauer and optical birefringence measurements. Basaltic stone wool fibres are main objects of this study. The focus of the study is placed on the dependence of the tensile strength on both production-related factors and fibre surface characteristics. Within the project, a fractographic method is established to analyse fracture characteristics, fracture origin and crack initiation of basaltic stone wool fibres. Based on the fractographic analysis (Paper 2), the relations between the size of the fracture mirror and the mechanical strength for bulk glass, rod glass and continuous glass fibres are also found to be valid for stone wool fibres. The fracture mirror constant, A, of stone wool fibres is comparable to rod glass and continuous oxide glasses. Comparison of tensile strength data evaluated using Weibull statistics with fractography suggests that the fracture behaviour of stone wool fibres is associated with the mechanism of bimodal flaw population. A narrow distribution of strength in the low strength region (σf < 1000 MPa) is proposed to be attributed to critical internal flaws which propagate to the fibre surface and produce fracture surfaces of type 2. Here the fracture origin can be recognised at the rim of the fibres. The amount and size-distribution of these critical internal flaws are found to be more closely related to the chemical composition of the wool fibres than to the homogenisation time of the melt prior to fibre spinning. A case study shows that a longer homogenisation time of the melt apparently has no strong effect on the overall strength of the stone wool fibres (Chapter 7). It is, however, worth noting that enhanced homogenization is beneficial to getting strong wool fibres. Hence, melt homogenisation will be an interesting subject for further research regarding strength improvement of stone wool fibres. The similarity of the tensile strength data in the high strength region in the Weibull diagram between different fibre samples suggests that a close relation exists between the high strength data and common features (e.g. cooling rate, glass structure, and chemistry) of the stone wool samples. The fractographic observations imply that fibre surface controls the strength distribution in stone wool fibres to a large extent. In spite of this, the role of the glass structure and the potential energy distribution (varying with cooling rate) in glass should be considered in exploring the origin of the fibre fracture. This aspect is discussed in Paper 3. From E-glass and basaltic compositions, both continuous and discontinuous wool fibres were drawn under similar conditions. It is found that the tensile strength of the continuous fibres increases with a decrease of the fibre diameter, i.e., from bulk glass to the thick glass fibres (about 10-17 μm in diameter), and then approaches a plateau. However, the tensile strength of the wool fibres does not follow the diameter dependence of the tensile strength of the continuous fibres. But when the strength is plotted against the axial forming stress, the strength data of the wool fibres beautifully fit the main trend of the continuous fibres. By considering the axial forming stress dependence of the optical birefringence, it is inferred that the structural anisotropy (or orientation) induced by the axial forming stress plays a crucial role in determining the tensile strength of the continuous fibres. In addition, the defect

54
orientation caused by the axial forming stress contributes to the fibre strength as well (Paper 3). By comparing the annealing induced decay of the tensile strength with both enthalpy relaxation and structural anisotropy relaxation, it is conformed that the structural anisotropy is indeed an important source of the higher strength of continuous glass fibres than the bulk glass of same composition. However, defect orientation, elevated fictive temperature, and surface homogeneities are also factors responsible for the higher strength of annealed glass fibres compared to bulk samples. Finally, the relative contributions of the above-mentioned factors to the fibre strength are estimated in terms of the tensile strength decay as a function of annealing temperature (Paper 3). In the case of basaltic stone wool fibres, the strength development with sub-Tg heat treatments (annealing) is more closely related to the glass structure than to the variation in actual surface appearances of the stone wool fibres as revealed by AFM analysis (Chapter 8). AFM analyses also reveal that stone wool fibres exposed to controlled humidity for durations between 1 and 4 weeks extensively alters the surface topography. No conclusive relation between stone wool fibre surfaces exposed to controlled humidity condition and the tensile strength of the wool fibres is found from the present data (Chapter 7). However, surfaces of basaltic stone wool fibres are morphologically modified as a consequence of chemical ageing with humidity and water. The water ageing has the largest impact on surface morphology. The chemical ageing affects the crystallization behaviour. The change in crystallization behaviour may be caused by a variation in surface chemistry due to leaching of network modifying elements (Paper 1). Furthermore, it is found that the oxidation state of the iron exerts considerable impact on the tensile strength of the fibres (Paper 4). The general tendency is that an increase in the Fe3+/ΣFe ratios enhances the tensile strength. To a large extent, this tendency could be attributed to the role of Fe3+ in strengthening glass structure. However, other factors such as melt homogeneity prior to fibre spinning and chemical variation of the samples should be taken into account when evaluating the tensile strength data of stone wool fibres in future evaluations. In summary, the tensile strength of stone wool fibres increases with increasing axial stress, cooling rate and oxidation state of the iron. But it decreases with increasing structural heterogeneities and technological defects.

55
Bibliography Anderegg F. O. (1939) Strength of Glass Fibres. Ind. Eng. Chem. 31, 290-298.
Andersons J., Joffe R., Hojo M. and Ochiai S. (2002) Glass fibre strength distribution
determined by common experimental methods. Compos. Sci. Techn. 62, 131-145.
Andersson O. L. (1958) Cooling time of strong glass fibers. J. Appl. Phys. 28, 9-12.
Armstrong J. L., Matthewson M. J. and Kurkjian C. R. (2000) Humidity dependence of the
fatigue of high-strength fused silica optical fibers. J Am Ceram Soc 83, 3100-3108.
ASTM I. (2007) Standard practice for reporting uniaxial strength data and estimating Weibull
distribution parameters for advanced ceramics. ASTM int'l C 1237-07, 1-19.
Axten C. W., Bauer J. F., Boymel P. M., Copham J. D., Cunningham R. N., Kamstrup O.,
Koenig A., Walter J., Konzen J. L., Ohberg I., Roe C., Sacks J., Singh T. M. and Wolf W.
(1993) Man-made vitreous fibers: Nomenclature, chemical and physical properties.
TIMA, 1-70.
Bartenev G. M. (1968) The structure and strength of glass fibers. J. Non Cryst. Solids 1, 69-
90.
Beetz C. P. J. (1982) The analysis of carbon fibre strength distributions exhibiting multiple
modes of failure. Fiber Sci. Technol. 16, 45-59.
Bergman B. (1986) Estimation of Weibull parameters using a weight function. J. Mater. Sci.
5, 611-614.
Bergman B. (1984) On the estimation of the Weibull modulus. J. Mater. Sci. Lett. 3, 689-692.
Brow R. K., Lower N. and Kurkjian C. R. (2005) TPB Test Provides New Insight to Fiber
Strength, Quality. Am. Ceram. Soc. Bull. 84, 50-53.
Brow R. K., Lower N. P., Kurkjian C. R. and Li H. (2009) The effects of melt history on the
failure characteristics of pristine glass fibres. Phys. Chem. Glasses. 50, 31-33.
Brüchkner R. and Stockhorst H. (1985) Influence of mechanical and thermal prehistory on the
structure of glass fibers. J. d. Phys. C8, 527-530.
Cameron N. M. (1968a) The effect of environment and temperature on strength of E-glass
fibres. Part 1. High vacuum and low temperature. Glass Technol. 9, 14-21.
Cameron N. M. (1968b) The effect of environment and temperature on the strength of E-glass
fibres. Part 2. Heating and ageing. Glass Technol. 9, 121-130.
56
Cameron N. M. (1966) Relation between melt treatment and glass fiber strength. J Am Ceram
Soc 49, 144-148.
Castilone R. J. and Glaesmann, G.S. and Hanson, T.A. (2002) Relationship between mirror
dimensions and failure stress for optical fibers. Proceedings of SPIE 4636, 11-20.
Chandan, H.C. and Parker, R.D (1994) Fractography of Optical Fibers. In Fractography of
glass (eds. R. C. Brandt and R. E. Tressler). Plenum Press, New York. pp. 143-184.
Chen C. P., Lee J. R. and Chang C. N. (2003) Fracture mirror of optical fibers. Mater. Chem.
Phys. 82, 698.
Choi S. R. and Gyekenyesi J. P. (1998) Crack Branching and Fracture Mirror Data of Glasses
and Advanced Ceramics. NASA Technical Report TM 1998-206536, 1.
Deubener J., Yue Y., Bornhöft H. and Ya M. (2008) Decoupling between birefringence
decay, enthalpy relaxation and viscous flow in calcium boroalumosilicate glasses. Chem.
Geol. 256, 299-305.
Duncan W. J., France P. W. and Craig S. P. (1985) The effect of environment on the strength
of optical fiber. In Strength of inorganic strength (ed. C. R. Kurkjian). Plenum Press,
New York. pp. 309-328.
Easler T. E., Bradt R. C. and Tressler R. E. (1981) Strength Distributions of SiC Ceramics
After Oxidation and Oxidation Under Load. J. Am. Ceram. Soc. 64, 731-734.
Evans A. G. and Jones R. L. (1978) Evaluation of a fundamental approach for the statistical
analysis of fracture. J Am Ceram Soc 61, 156-160.
Faucher B. and Tyson W. R. (1988) On the determination of Weibull parameters. J. Mater.
Sci. Lett. 7, 1199.
Feih S., Thraner A. and Lilholt H. (2005) Tensile strength and fracture surface
characterization of sized and unsized glass fibers. J. Mater, Sci. 40, 1615.
Fischer H., Rentzsch W. and Marx R. (2002) A modified size effect model for brittle
nonmetallic materials. Eng. Frac. Mech. 69, 781-791.
Garofalini S. H., Halicioglu T. and Pound G. M. (1980) Computer simulation of amorphous
surfaces: energy profile and binding energy. J. Non Cryst. Solids 37, 411-415.
Griffith A. A. (1921) The phenomena of rupture and flow in solids. Phil. Trans. Roy. Soc.
London 221, 163-198.
Hench L. L. and Clark D. E. (1978) Physical chemistry of glass surfaces. J. Non-Cryst. Sol.
28, 83.
57
Hornbøll L. and Yue Y. (2008a) Enthalpy relaxation in hyperquenched glasses of different
fragility. J. Non Cryst. Solids 354, 1862-1870.
Hornbøll L. and Yue Y. (2008b) Enthalpy relaxation of hyperquenched glasses and its
possible link to α- and β-relaxations. J. Non Cryst. Solids 354, 350-354.
Inglis C. E. (1913) Stresses in a plate due to the presence of cracks and sharp corners. Trans.
Inst. Naval Architects 55, 219-230.
Ito S. and Taniguchi T. (2004) Effect of cooling rate on structure and mechanical behavior of
glass by MD simulation. J. Non Cryst. Solids 349, 173-179.
Jakus K., Ritter J. E. and Sullivan J. M. (1981) Dependency of fatigue predictions on the form
of the crack velocity equation. J. Am. Ceram. Soc. 64, 372-374.
Jaras A. C., Norman B. J. and Simmest S. C. (1983) The measurement of glass fibre strength
in composites from studies of their fracture surfaces. J. Mater. Sci. 18, 2459-2465.
Jayatilaka A. D. S. and Trustrum K. (1977) Statistical approach to brittle fracture. J. Mater.
Sci. 12, 1426-1430.
Jensen M., Keding R. and Yue Y. (2010) Quantification of chemical striae in inorganic melts
and glasses.
Kaasgaard M., Jacobsen P. A. L. and Yue Y. (2004) High-Temperature Behaviour of
StoneWool. J. Dan. Ceram. Soc. 1, 12-15.
Katsura T. (1967) Pele's hair as a liquid of Hawaiian tholeiitic basalts. Geochem. J. 1, 157-
168.
Khalili A. and Kromp K. (1991) Statistical properties of Weibull estimators. J. Mater. Sci. 26,
6741-6752.
Kirkegaard L. F., Korsgaard M., Yue Y. and Mørup S. (2005) Redox behaviour of iron
bearing glass fibres during heat treatment under atmospheric conditions. Glass Sci. Tech.
78, 1-6.
koike A. and Tomozawa M. (2006) Size effect on surfface structural relaxation kinetics of
silica glass samples. J. Non-Cryst. Solids 352, 3787-3793.
Kurkjian C. R., Gupta P. K., Brow R. K. and Lower N. (2003) The intrinsic strength and
fatigue of oxide glasses. J. Non Cryst. Solids 316, 114-124.
Kurkjian C. R. and Prindle W. R. (2006) Strength is a blessing in itself. Presentation at 1st
international Congress on Ceramics, Toronto, Canada, 1-26.

58
Lawn B. R. and Marshall D. B. (1979) Hardness, toughness and brittleness: An indentation
analysis. J. Am. Ceram. Soc. 62, 347-350.
Leed E. A. and Pantano C. G. (2003) Computer Modeling of Water Adsorption on Silica and
Silicate Glass Fracture Surfaces. J. Non-Cryst. Sol. 325, 48-60.
Lissart N. and Lamon J. (1997) Damage and failure in ceramic matrix minicomposites:
experimental study and model. Acta Mater. 45, 1025-1044.
Loewenstein K. L. (1961) Studies in the composition and structure of glasses possessing high
Young's moduli Part I: Studies in the composition and structure of glasses possessing
high Young’s moduli. Phys. Chem. of Glasses 2, 69-82.
Loewenstein K. L. and Dowd J. (1968) An investigation of the relationship between glass
fibre tensile strength, the temperature of the glass from which the fibre is drawn, and the
fibre diameter. Glass Technol. 9, 164-171.
Lonnroth N., Muhlstein C. L., Pantano C. and Yue Y. (2008) Nanoindentation of glass wool
fibers. J. Non Cryst. Solids 354, 3887-3895.
Lonnroth N. and Yue Y. (2009) Influence of chemical compostion on the physical properties
of basaltic glasses. Glass Technol. 50, 165-173.
Lonnroth N. and Yue Y. Z. (2005) Crystallisation behaviour and structural order of iron
containing aluminosilicate liquids. Phys. Chem. Glasses. 46, 315-319.
Lower N. P., Brow R. K. and Kurkjian C. R. (2004) Inert failure strains of sodium
aluminosilicate glass fibers. J. Non-Cryst. Solids 344, 17-21.
Martin J. C., Goettler S. J., Fosse N. and Iton L. (2002) Designing intermediate-range order
in amorphous materials. Nature 419, 381-384.
Martin Y., Williams C. C. and Wickramasinghe G. H. (1987) Atomic Force Microscope-
Force Mapping and Profiling on a sub 100-A Scale. Appl. Phys. 61, 4723-4729.
Matthews J. R., McClintock F. A. and Shack W. J. (1976) Statistical determination of surface
flaw density in brittle materials. J Am Ceram Soc 59, 304-308.
Matthewson M. J., Kurkjian C. R. and Gulati S. T. (1986) Strength Measurement of Optical
Fibers by Bending. J Am Ceram Soc 69, 815-821.
Matthewson M. J. and Yuce H. H. (1994) Kinetics of degradation during fatigue and aging of
fused silica optical fiber. Proc. SPIE 2290, 204.
Mecholsky J. J. J., Rice R. W. and Freiman S. W. (1974) Prediction of Fracture Energy and
Flaw Size in Glasses from Measurements of Mirror Size. J Am Ceram Soc 57, 440-443.
59
Mecholsky J. J. and Freiman S. W. (1991) Relationship between fractal geometry and
fractography. J Am Ceram Soc 74, 3136-3140.
Mencik J. (1992) Strength and fracture of glass and ceramics. 12, 327.
Michalske T. A. (1994) Fractography of stress corrosion cracking in glass. In Fractography
of glass (eds. R. C. Bradt and R. E. Tressler). Plenum Press, New York. pp. 111-140.
Mould R. E. (1958) Crossbending Tests of Glass Fibers and the Limiting Strength of Glass. J.
Appl. Phys. 29, 1263.
Moynihan C. T., Easteal A. J., DeBolt M. A. and Tucker J. (1976) Dependence of the fictive
temperature of glass on cooling rate. J Am Ceram Soc 59, 12-16.
Mysen B. O. (1983) The structure of silicate melts. Ann. Rev. Earth. Plannet. Sci. 11, 75-97.
Orowan E. (1944) The fatigue of glass under stress. Nature 154, 341-343.
Otto W. H. (1961) Compaction effects in glass fibers. J Am Ceram Soc 44, 68-72.
Otto W. H. (1955) Relationship of tensile strength of glass fibers to diameter. J Am Ceram
Soc 38, 122-125.
Otto W. H. and Preston F. W. (1950) Evidence against oriented structure in glass fibers. J.
Soc. Glass Technol. 34, 63-68.
Pahler G. and Brückner R. (1985) Structural and mechanical properties of glass fibers with
linear and three dimensionally linked networks. Glastech. Ber 58, 45-51.
Pähler G. and Brückner R. (1982) Mechanical properties and structural aspects of binary
phosphate glass fibers. J. Non Cryst. Solids 49, 487-496.
Paramonov Y. and Andersons J. (2007) A family of weakest link models for fiber strength
distribution. Composites: Part A 38, 1227-1233.
Peterlik H. (2001) Relationship of strength and defects of ceramic materials and their
treatment by Weibull theory. J. Ceram. Soc. Japan 109, S121-S126.
Prebus A. F. and Michener J. M. (1954) Electron microscope investigation of glass. Ind. Eng.
Chem. 46, 147-153.
Proctor B. A., Whitney I. and Johnson J. W. (1967) The strength of fused Silica. Proc. Royal
Soc. London, A, 297, 534-557.
Quinn G. D. and Morrell R. (1991) Design data for engineering ceramics: A review of the
flexure test. J Am Ceram Soc 74, 2037-2066.
Quinn J. B. and Quinn G. D. (1997) Indentation brittleness of ceramics: a fresh approach. J.
Mater, Sci. 32, 4331-4346.
60
Rawson H. (1953) Internal stresses caused by disorder in vitreous materials. Nature 171, 169.
Rockwool (2009) http://www.rockwool.com/about+the+group/the+group+in+brief/history
Rockwool (1998) Production process, production properties and application of a new
generation Rockwool stone wool insulation products. Report no. April1998/RDF, 1-11.
Ross A. (2006) Basalt fibers: Alternative to glass? Composite Technology August, 1-3.
Schmitz I., Schreiner M., Friedbacher G. and Grasserbauer M. (1997) Phase imaging as an
extension to tapping mode AFM for the identification of material properties on humidity-
sensitive surfaces. Appl. Surf. Sci. 115, 190-198.
Sehgal J. and Ito S. (1999) Brittleness of glass. J. Non-Cryst. Solids 253, 126-132.
Sehgal J., Nakao Y., Takahashi H. and Ito S. (1995) Brittelness of glasses by indentation. J.
Mater. Sci. Lett. 14, 167-169.
Shand E. B. (1954) Experimental study of fracture of glass: II, Experimental data. J Am
Ceram Soc 37, 559-572.
Smekal A. (1936) Bruchtheorie spöder Körper. Z. Phys. A 103, 495-525.
Solvang M., Yue Y. Z., Christiansen J. d. and Jensen S. L. (2002) Dependence of shear
viscosity on the homogenisation process of diabase melts. Glass Technol. 43C, 340-342.
Stockhorst H. and Bruckner R. (1982) Structure sensitive measurements on E-glass fibers. J.
Non-Cryst. Solids 49, 471-484.
Tarao N. (1953) The Relation Between Resistance to Rupture and Mirror Surface of Glass. J.
Phys. Soc. Jpn 8, 545-549.
Thomas W. F. (1971) An investigation of the strength of borosilicate glass in the form of
fibres and rods. Glass Technol. 12, 42-44.
Thomas W. F. (1960) An investigation of the factors likely to affect the strength and
properties of glass fibres. Phys. Chem. Glass 1, 4-18.
Tomozawa M. and Hepburn R. W. (2004) Surface structural relaxation of silica glass: a
possible mechanism of mechanical fatigue. J. Non-Cryst. Sol. 345-346, 449-460.
Tool A. Q. (1946) Relation between inelastic deformability and thermal expansion of glass in
its annealing range. J Am Ceram Soc 29, 240-253.
Tool A. Q. and Eichlin C. G. (1931) Variations caused in the heating curves of glass by heat
treatment. J Am Ceram Soc 14, 276-308.
Trustrum K. and Jayatilaka A. D. S. (1983) Applicability of Weibull analysis for brittle
materials. J. Mater. Sci. 18, 2765-2770.
61
von der Ohe R. (2003) Simulation of glass fiber forming processes. Ph.D. thesis, Aalborg
University, Department of Production.
Watson A. S. and Smith R. L. (1985) An examination of statistical theories for fibrous
materials in the light of experimental data. J. Mater. Sci. 20, 3260-3270.
Weibull W. (1951) A statistical distribution function of wide applicability. J. appl. Mech 18,
293-297.
Weibull W. (1939) A statistical theory on the strength of materials. Ingeniorsvetenskaps-
akademiens Handlingar 151, 1-46.
Wenzel R. N. (1949) Surface roughness and contact angle. J. Phys. Chem. 53, 1466-1467.
Wiederhorn S. M. and Boltz L. H. (1970) Stress corrosion and static fatigue of glass. J Am
Ceram Soc 53, 543-548.
Wojnárovits I. (1995) Factors influencing the mechanical properties of silicate fibres.
Glastech. Ber. Glass. Sci. Technol. 68, 360-366.
Wojnárovits I. (1988) Heat-induced structural and mechanical changes of basalt wool.
Glastech. Ber. 61, 157-160.
Wu D., Zhou J. and Li Y. (2006) Methods for estimating Weibull parameters for brittle
materials. J. Mater. Sci. 41, 5630-5638.
Ya M., Deubener J. and Yue Y. (2008) Enthalpy and anisotropy relaxation of glass fibers. J
Am Ceram Soc 91, 745-752.
Yue Y. (2004) Experimental evidence for the existence of an ordered structure in a silicate
liquid above its liquidus temperature. J. Non-Cryst. Solids 345-346, 523-527.
Yue Y., Christiansen J. d. and Jensen S. L. (2002a) Determination of the fictive temperature
for a hyperquenched glass. Chem. Phys. Lett. 357, 20-24.
Yue Y., Jensen S. L. and Christiansen J. d. (2002b) Physical aging in a hyperquenched glass.
Appl. Phys. Lett. 81, 2983-2985.
Yue Y., Korsgaard M., Kirkegaard L. F. and Heide G. (2009) Formation of a nanocrystalline
layer on the surface of stone wool fibers. J. Am. Ceram. Soc. 92, 62-67.
Yue Y., von der Ohe R. and Jensen S., L. (2004) Fictive temperature, cooling rate and
viscosity of glasses. J. Chem. Phys. 120, 8053-8059.

- 62 -
- 63 -
List of papers Paper 1: Influences of chemical aging on the surface morphology and crystallization
behavior of basaltic glass fibers. Journal of Non-Crystalline Solids 354 (2008) 1151-1154. Authors: Majbritt D. Lund and Yuanzheng Yue
Paper 2: Fractography and strength of glass wool fibres. Journal of the Ceramic Society
of Japan 116 (2008) 841-845. Authors: Majbritt D. Lund and Yuanzheng Yue Paper 3: Impact of Drawing Stress on the Tensile Strength of Oxide Glass Fibers. Journal
of The American Ceramic Society, 93 [10] (2010) 3236-3243. Authors: Majbritt D. Lund and Yuanzheng Yue Paper 4: Impact of the oxidation state of iron on the tensile strength of stone wool fibres.
Glass Technology: European Journal of Glass Science and Technology Part A, 51 (3), (June 2010), 97-102.
Authors: Majbritt D. Lund, Yuanzheng Yue and Dorthe Lybye


Paper 1

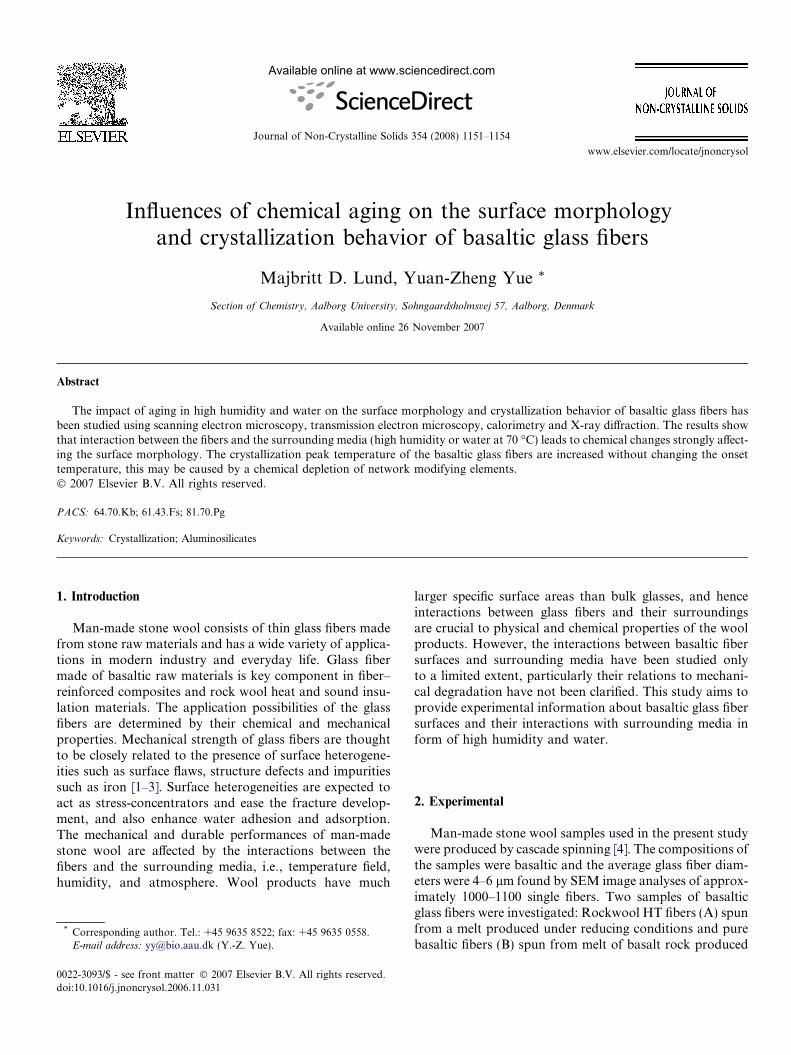
Available online at www.sciencedirect.com
www.elsevier.com/locate/jnoncrysol
Journal of Non-Crystalline Solids 354 (2008) 1151–1154
Influences of chemical aging on the surface morphologyand crystallization behavior of basaltic glass fibers
Majbritt D. Lund, Yuan-Zheng Yue *
Section of Chemistry, Aalborg University, Sohngaardsholmsvej 57, Aalborg, Denmark
Available online 26 November 2007
Abstract
The impact of aging in high humidity and water on the surface morphology and crystallization behavior of basaltic glass fibers hasbeen studied using scanning electron microscopy, transmission electron microscopy, calorimetry and X-ray diffraction. The results showthat interaction between the fibers and the surrounding media (high humidity or water at 70 �C) leads to chemical changes strongly affect-ing the surface morphology. The crystallization peak temperature of the basaltic glass fibers are increased without changing the onsettemperature, this may be caused by a chemical depletion of network modifying elements.� 2007 Elsevier B.V. All rights reserved.
PACS: 64.70.Kb; 61.43.Fs; 81.70.Pg
Keywords: Crystallization; Aluminosilicates
1. Introduction
Man-made stone wool consists of thin glass fibers madefrom stone raw materials and has a wide variety of applica-tions in modern industry and everyday life. Glass fibermade of basaltic raw materials is key component in fiber–reinforced composites and rock wool heat and sound insu-lation materials. The application possibilities of the glassfibers are determined by their chemical and mechanicalproperties. Mechanical strength of glass fibers are thoughtto be closely related to the presence of surface heterogene-ities such as surface flaws, structure defects and impuritiessuch as iron [1–3]. Surface heterogeneities are expected toact as stress-concentrators and ease the fracture develop-ment, and also enhance water adhesion and adsorption.The mechanical and durable performances of man-madestone wool are affected by the interactions between thefibers and the surrounding media, i.e., temperature field,humidity, and atmosphere. Wool products have much
0022-3093/$ - see front matter � 2007 Elsevier B.V. All rights reserved.
doi:10.1016/j.jnoncrysol.2006.11.031
* Corresponding author. Tel.: +45 9635 8522; fax: +45 9635 0558.E-mail address: [email protected] (Y.-Z. Yue).
larger specific surface areas than bulk glasses, and henceinteractions between glass fibers and their surroundingsare crucial to physical and chemical properties of the woolproducts. However, the interactions between basaltic fibersurfaces and surrounding media have been studied onlyto a limited extent, particularly their relations to mechani-cal degradation have not been clarified. This study aims toprovide experimental information about basaltic glass fibersurfaces and their interactions with surrounding media inform of high humidity and water.
2. Experimental
Man-made stone wool samples used in the present studywere produced by cascade spinning [4]. The compositions ofthe samples were basaltic and the average glass fiber diam-eters were 4–6 lm found by SEM image analyses of approx-imately 1000–1100 single fibers. Two samples of basalticglass fibers were investigated: Rockwool HT fibers (A) spunfrom a melt produced under reducing conditions and purebasaltic fibers (B) spun from melt of basalt rock produced
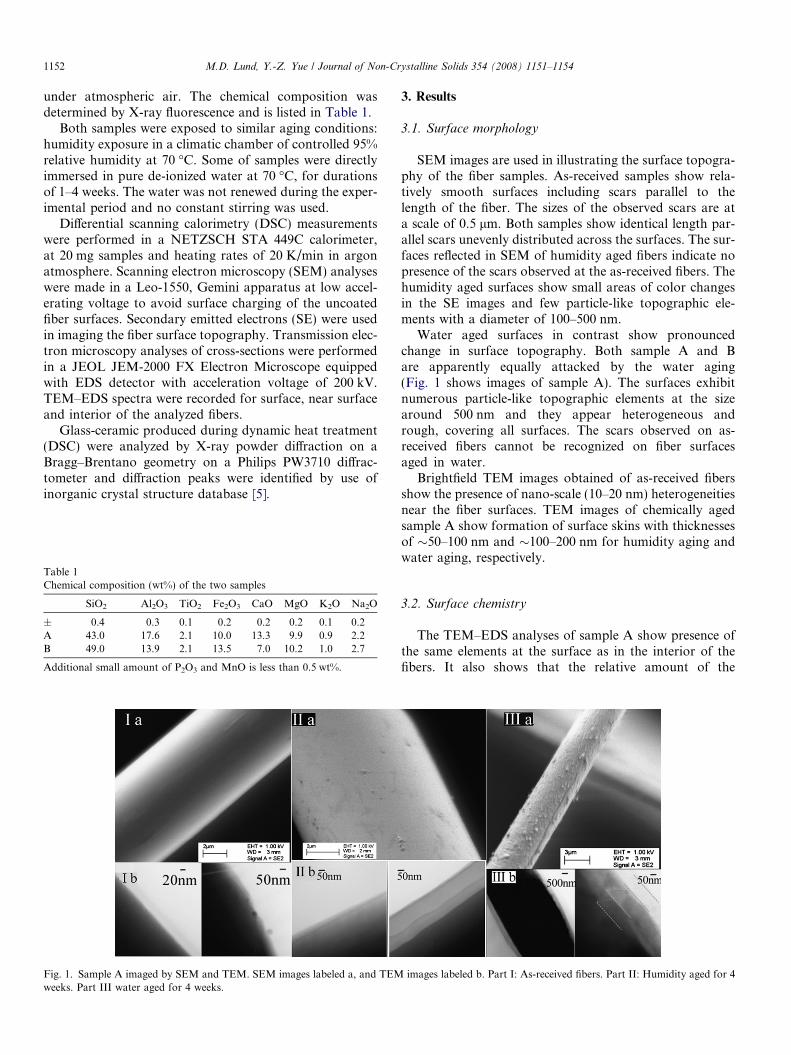
1152 M.D. Lund, Y.-Z. Yue / Journal of Non-Crystalline Solids 354 (2008) 1151–1154
under atmospheric air. The chemical composition wasdetermined by X-ray fluorescence and is listed in Table 1.
Both samples were exposed to similar aging conditions:humidity exposure in a climatic chamber of controlled 95%relative humidity at 70 �C. Some of samples were directlyimmersed in pure de-ionized water at 70 �C, for durationsof 1–4 weeks. The water was not renewed during the exper-imental period and no constant stirring was used.
Differential scanning calorimetry (DSC) measurementswere performed in a NETZSCH STA 449C calorimeter,at 20 mg samples and heating rates of 20 K/min in argonatmosphere. Scanning electron microscopy (SEM) analyseswere made in a Leo-1550, Gemini apparatus at low accel-erating voltage to avoid surface charging of the uncoatedfiber surfaces. Secondary emitted electrons (SE) were usedin imaging the fiber surface topography. Transmission elec-tron microscopy analyses of cross-sections were performedin a JEOL JEM-2000 FX Electron Microscope equippedwith EDS detector with acceleration voltage of 200 kV.TEM–EDS spectra were recorded for surface, near surfaceand interior of the analyzed fibers.
Glass-ceramic produced during dynamic heat treatment(DSC) were analyzed by X-ray powder diffraction on aBragg–Brentano geometry on a Philips PW3710 diffrac-tometer and diffraction peaks were identified by use ofinorganic crystal structure database [5].
Table 1Chemical composition (wt%) of the two samples
SiO2 Al2O3 TiO2 Fe2O3 CaO MgO K2O Na2O
± 0.4 0.3 0.1 0.2 0.2 0.2 0.1 0.2A 43.0 17.6 2.1 10.0 13.3 9.9 0.9 2.2B 49.0 13.9 2.1 13.5 7.0 10.2 1.0 2.7
Additional small amount of P2O3 and MnO is less than 0.5 wt%.
Fig. 1. Sample A imaged by SEM and TEM. SEM images labeled a, and TEMweeks. Part III water aged for 4 weeks.
3. Results
3.1. Surface morphology
SEM images are used in illustrating the surface topogra-phy of the fiber samples. As-received samples show rela-tively smooth surfaces including scars parallel to thelength of the fiber. The sizes of the observed scars are ata scale of 0.5 lm. Both samples show identical length par-allel scars unevenly distributed across the surfaces. The sur-faces reflected in SEM of humidity aged fibers indicate nopresence of the scars observed at the as-received fibers. Thehumidity aged surfaces show small areas of color changesin the SE images and few particle-like topographic ele-ments with a diameter of 100–500 nm.
Water aged surfaces in contrast show pronouncedchange in surface topography. Both sample A and Bare apparently equally attacked by the water aging(Fig. 1 shows images of sample A). The surfaces exhibitnumerous particle-like topographic elements at the sizearound 500 nm and they appear heterogeneous andrough, covering all surfaces. The scars observed on as-received fibers cannot be recognized on fiber surfacesaged in water.
Brightfield TEM images obtained of as-received fibersshow the presence of nano-scale (10–20 nm) heterogeneitiesnear the fiber surfaces. TEM images of chemically agedsample A show formation of surface skins with thicknessesof �50–100 nm and �100–200 nm for humidity aging andwater aging, respectively.
3.2. Surface chemistry
The TEM–EDS analyses of sample A show presence ofthe same elements at the surface as in the interior of thefibers. It also shows that the relative amount of the
images labeled b. Part I: As-received fibers. Part II: Humidity aged for 4

M.D. Lund, Y.-Z. Yue / Journal of Non-Crystalline Solids 354 (2008) 1151–1154 1153
elements has changed during aging experiments. Wateraged fibers show an increase of the relative amount ofthe elements Na, Mg, Al and K compared to Si qualita-tively evaluated from peak heights of EDS spectra. Theseelements are also enriched in the surface layer of humidityaged fibers but the relative increase is less pronounced. Asthe data material is limited statistics are weak and thereported findings are only used as qualitative indicationsof potential changes in surface chemistry due to aging.
Fig. 2. (a) Full range DSC upscan curve, examples of mentionedtemperatures are shown. (b) Sample A; DSC upscan curves measured at20 K/min in argon, (c) Sample B; DSC upscan curves measured at 20 K/min in argon. Exo means exothermic.
3.3. Crystallization behavior
The crystallization behavior is evaluated by dynamicheat treatment during DSC measurements and the result-ing crystallized glass-ceramic products are analyzed byXRD for phase identification.
The DSC curve in Fig. 2a for as-received samples showan endothermic deflection related to the glass transitionand an exothermic peak related to the crystallization.Tg, Tonset, and Tpeak1 represent the glass transition tem-perature, the onset temperature of the exothermic peak,and the maximum peak temperature, respectively. Forsample B aged in water for 4 weeks, the DSC curve showsa strong exothermic peak at lower temperature (Tpeak1)and a weak peak at higher temperature (Tpeak2) (seeFig. 2c). All the characteristic temperatures are listed inTable 2.
In addition, dynamic heat treatment in DSC of basalticglass shots produced during the cascade spinning process(glass droplets, which were not drawn into fibers) were car-ried out. The shots crystallize slower and at higher temper-atures. The exothermic peak is low and broad. Shots fromsample B shows a single exothermic peak, which fall inbetween the major and minor exothermic peaks of the as-received samples.
The crystallization of chemically aged samples shows ashift in crystallization peak temperature, whereas the onsettemperatures are unchanged (Fig. 2). Samples aged inwater four weeks show peak shift of 12 K and 9 K, respec-tively. Samples exposed to humidity aging show smallershift in crystallization peak temperature (7 K and 6 K,
Table 2Temperatures related to crystallization (given in K) derived from DSCmeasurements of as-received basalt fibers
Tg Tonset Tpeak1 Tpeak2
± 2 1 2 3A, as-received 950 1134 1167 –B, as-received 918 1107 1166 1270B, shots 918 1130 1232 –A, humidity 4 weeks 950 1134 1174 –A, water 4 weeks 905 1136 1179 –B, humidity 4 weeks 918 1118 1172 –B, water 4 weeks 918 1109 1175 1273
Temperatures determined by heating rates of 20 K/min.
respectively). No change in peak crystallization tempera-ture occurs for samples aged in water for two or fourweeks.
The crystalline phases identified by X-ray diffractionanalyses of the produced glass-ceramic are pyroxene andfeldspar with minor amount of iron/titanium oxides, nochanges in phases or relative amounts are seen among thechemical aged samples. No exothermic peaks exist at thedown scan of the DSC measurements, related to secondarycrystallization or recrystallization of phases produced dur-ing the first up scan; the phases identified by X-ray diffrac-tion are related to the exothermic peak observed at the firstup scan.

1154 M.D. Lund, Y.-Z. Yue / Journal of Non-Crystalline Solids 354 (2008) 1151–1154
4. Discussion
4.1. Surface morphology/surface chemistry
It is seen that water aging strongly affects the surfacetopography and combined by the indications of increasein alkali and alkali earth content in the surface layer, thissupports a preferential ion exchange of these elements,indicating that the particles at the fiber surface are leachingproducts (secondary precipitates). The signature of fibersurfaces exposed to high humidity is not equally reactive;here the SEM images indicate heterogeneous changes inthe surface composition and existence of surface particlespreferential at surface scars, i.e., from contact betweentwo fibers. Changes preferential at surface scars (scarsimply structural strain and defects) indicate origin relatedto adsorption of water molecules at specific surface posi-tions, i.e., defects or strongly strained structure bonds inagreement with [1,6,7].
The surface scars on as-received fibers cannot be recog-nized at aged fiber surfaces, this observation including theskin layer observed by TEM support formation of succes-sive hydrated layer as described for natural weathering ofvolcanic glasses, including basaltic glass [8,9].
Both TEM and EDS analyses indicate that the changesin morphology of the fiber surfaces seen by SEM are notrelated to impurities produced during aging proceduresor handling, but products of reactions between the glasssurfaces and the surrounding media.
4.2. Crystallization behavior
The crystallization during dynamic heat treatment inargon atmosphere in the DSC show one dominant exo-thermic peak at temperatures of app. 1140–1220 K (sam-ple A) and app. 1120–1300 K (sample B) and the X-rayanalyses all show the products to be polycrystallineincluding pyroxene, feldspar and minor iron/titanium oxi-des. The crystallizations of the individual phases cannotbe discriminated due to the dynamic heat treatment of20 K/min. The temperature range of crystallization is inagreement with [10].
The peak position shift of 9–12 K due to chemical treat-ment prior to crystallization does not affect the crystallizedphases enough to be recognized by the X-ray diffractionanalyses. X-ray diffraction analyses the crystalline compo-sition of the bulk material produced during dynamic heattreatment, and cannot be related directly to the observedsurface phenomena.
As the TEM images illustrate the chemical aging primar-ily affect the surface layer (50–200 nm) of the fibers, the
change in peak position is strongly associated with theobserved crystallization to the basalt fiber surfaces. Thisis supported by the crystallization behavior of the glassshots, where bulk crystallization is delayed because of alower surface area. This point strongly confirms the crucialrole of the surface in relation to the crystallizationbehavior.
The shift to higher temperatures in peak position couldbe related to a preferred leaching of network modifying ele-ments or related to the formation of a hydrated surfacelayer. The network modifying ions act as fluxes to lowerthe crystallization temperature of silicates [11], and theirdepletion could cause a shift to higher temperatures.Hydrated surface layers may cause a delay in surface crys-tallization and in this way shift the crystallization to highertemperatures.
5. Conclusion
Basaltic wool fiber surfaces are morphologically modi-fied as a consequence of chemical aging with humidityand water. The water aging has the largest impact on sur-face morphology. The chemical aging affects the crystalli-zation behavior. The change in crystallization behaviormay be caused by a variation in surface chemistry due toleaching of network modifying elements.
Acknowledgements
The authors thank M. Borksted for help with SEM anal-ysis, and S. Primdahl for useful discussions. The presentwork is supported financially by Rockwool InternationalA/S.
References
[1] A. Griffith, Philos. Trans. Roy. Soc. London Ser. A 221 (1920) 163.[2] E.N. da C. Andrade, L.C. Tsien, Proc. Roy. Soc. London Ser. A 159
(1937) 346.[3] W.F. Thomas, Phys. Chem. Glass. 1 (1960) 4.[4] C.W. Axten, J.M. Bauer, P.M. Boymel, J.D. Copham, R.N.
Cunningham, O. Kamstrup, A. Koenig, J.L. Konzen, I. Ohberg, C.Roe, J. Sacks, T.M. Singh, W. Wolf, in: W. Easters (Ed.), ManmadeVitreous Fibres: Nomenclature, Chemical, and Physical Properties,TIMA Inc., Stamford, 1991–1993, p. 17.
[5] Inorganic Crystal Structure Database (ICSD), Fiz Karlsruhe, De.[6] K.M. Davis, M. Tomozawa, J. Non-Cryst. Solids 185 (1995) 203.[7] C.G. Pantano, V.A. Bakaev, E.A. Leed, O. Sofo, XX ICG2004.[8] J.C. Petit, G. Della Mae, J.C. Dran, M.C. Magonthier, P.A. Mando,
A. Pazzagnella, Geochim. Cosmochim. Acta 54 (1990) 1941.[9] J. Crosvisier, T. Advocat, J. Dussossoy, J. Nucl. Mater. 321 (2003) 91.
[10] D. Burkhard, Mineral. Petrol. (2002) 724.[11] N.L. Bowen, The Evolution of the Igneous Rocks, Princeton
University Press, 1928.

Paper 2


841©2008 The Ceramic Society of Japan
Journal of the Ceramic Society of Japan 116 [8] 841-845 2008
Fractography and tensile strength of glass wool fibres
Majbritt D. LUND and Yuanzheng YUE
Section of Chemistry, Department of Biotechnology, Chemistry and Environmental Engineering, Aalborg University, Sohngaardsholmsvej 57, DK-9000 Aalborg, Denmark
Mechanical reliability such as strength and brittleness is of great interest for application of brittle materials, i.e. glasses and glass fibres. In this paper we study the fracture behaviour and the tensile strength of glass wool fibres (GWFs) of both basalt and E-glass compositions, which play an important role in both transportation and application of GWFs (as insulation mate-rial). GWFs are tested in uniaxial tension. The surfaces of the fractured fibres are imaged using scanning electron microscopy. Three main types of fracture surfaces produced in tensile stress are observed, all of which include fracture mirror, mist and hackle features comparable to fracture surfaces of bulk glass and continuous fibres. The three types are: a) surface without visible origin; b) surface with visible origin; c) surfaces originated from internal pores. The relations between the fracture mir-ror size and the mechanical strength shown for bulk glass and continuous glass fibres are also valid for GWFs. Relation between the fractographic observations and the strength Weibull distributions are discussed in relation to chemical composi-tion and homogeneity.©2008 The Ceramic Society of Japan. All rights reserved.
Key-words : Glass wool fibres, Tensile strength, Fracture surfaces, Weibull diagram
[Received March 4, 2008; Accepted June 19, 2008]
1. IntroductionGlass wool fibres (GWFs) are discontinuous glass fibres with
diameters of 3–15 μm and lengths three orders of magnitude larger than the diameter. GWFs are produced by means of a wheel spinning process, where melt droplets are thrown from the wheels into fibres by centrifugal force due to rapid rotation of the spinning wheel.1) GWFs are mainly applied for heat and acoustic insulation, since the individual fibres form an intertwined net-work that traps and fix the air.
Insulation products of GWFs exhibit good chemical and ther-mal durability properties as well as mechanical reliability. In spite of those advantages, GWFs still show a certain degree of brittleness, which limits the further improvement of mechanical performance for both transportation and application. Brittleness is considered to be directly related to the crack initiation, the fracture origin and the mechanical strength of the glass fibres.2),3)
The focus of this study is placed on exploring the fracture origin of GWFs by use of fractography. The fractographic obser-vations will be related to a large range of mechanical strength of GWFs. Mechanical strength of brittle materials usually shows large scatter due to numerous types of defects and flaws, i.e., different sources of fracture. Flaws of glasses have a large dis-tribution in geometry, orientation and size, which is to great extent determined by production techniques and glass forming conditions. In comparison to bulk glass, fibres are subjected to much larger tensions during forming, which leads to anisotropic microstructure, and to orientation of flaws and other defects. This is also one of main reasons why glass fibres exhibit much higher strength than bulk glasses with the same chemical com-position.4),5)
Mechanical failure of a glass is caused by crack initiation and propagation. Crack propagation through the glass results in recognisable traces on the fracture surface due to the stability of the crack propagation and velocity.6),8) Although some studies on the fracture behaviour of bulk glasses and continuous glass fibres
have been reported, the fracture behaviour of discontinuous fibres, i.e., the GWFs, have not been characterized so far, at least not to our knowledge. This work aims to reveal the nature of fracture surfaces of the GWFs by measuring the tensile strength of the GWFs and subsequently by imaging their fracture surfaces.
2. TheoryFor characterization of fracture surfaces, terms like the mirror,
mist and hackle (see Fig. 1) are often used to locate the position of the fracture origin, and hence, the crack initiation point. Sche-matic illustration for fracture surfaces caused by a surface flaw including the recognisable traces is given in Fig. 1. It is the nature of the fracture mirror and the hackle which allows iden-tification of the fracture origin (guide lines for the eyes is shown in Fig. 1 as grey arrows). However, the fracture origin is not always visible.
The size of the fracture mirror is used for calculation of the fracture stresses of glass.7) The classical relationship between mirror size and fracture strength (σ) is given in Eq. (1):
(1)
where rm is the radius of the fracture mirror and A is a constant depending on the material and the measurement conditions. Values for A reported for both silicate glasses fall in the range of 1.8–2.2 MPa·m½.9)–11) Mecholsky et al.9),12) have demonstrated a general relation between the radius of the fracture mirror and the size, a, of the critical flaw initiating the fracture. The size ratio rm/a found valid for most silicate glasses is 10/1. In the present study the depth (rd) of the fracture mirror is used as rm (see Fig. 1).
When the fracture stress is measured by means of tensile tests, the critical flaw size responsible for the tensile fracture can be calculated by the Griffith–Orowan–Irwin equation, Eq. (2).
σ = A
rm
Paper
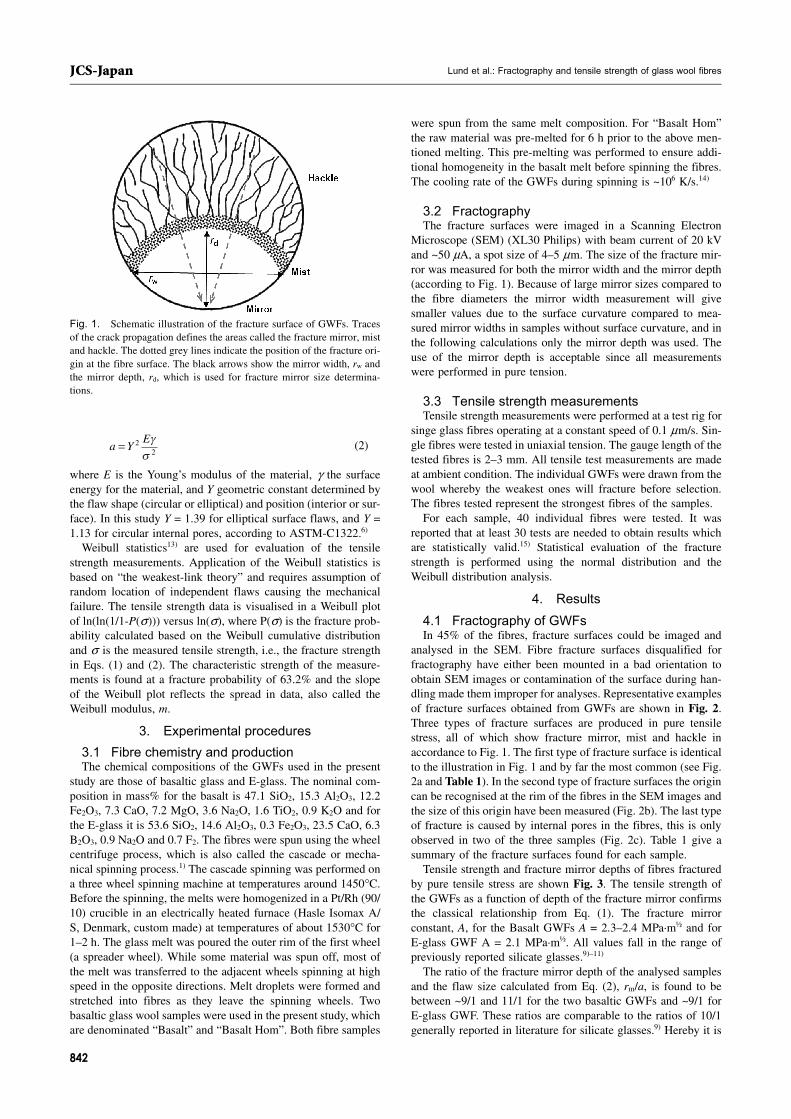
Lund et al.: Fractography and tensile strength of glass wool fibres
842
JCS-Japan
(2)
where E is the Young’s modulus of the material, γ the surface energy for the material, and Y geometric constant determined by the flaw shape (circular or elliptical) and position (interior or sur-face). In this study Y = 1.39 for elliptical surface flaws, and Y = 1.13 for circular internal pores, according to ASTM-C1322.6)
Weibull statistics13) are used for evaluation of the tensile strength measurements. Application of the Weibull statistics is based on “the weakest-link theory” and requires assumption of random location of independent flaws causing the mechanical failure. The tensile strength data is visualised in a Weibull plot of ln(ln(1/1-P(σ))) versus ln(σ), where P(σ) is the fracture prob-ability calculated based on the Weibull cumulative distribution and σ is the measured tensile strength, i.e., the fracture strength in Eqs. (1) and (2). The characteristic strength of the measure-ments is found at a fracture probability of 63.2% and the slope of the Weibull plot reflects the spread in data, also called the Weibull modulus, m.
3. Experimental procedures3.1 Fibre chemistry and productionThe chemical compositions of the GWFs used in the present
study are those of basaltic glass and E-glass. The nominal com-position in mass% for the basalt is 47.1 SiO2, 15.3 Al2O3, 12.2 Fe2O3, 7.3 CaO, 7.2 MgO, 3.6 Na2O, 1.6 TiO2, 0.9 K2O and for the E-glass it is 53.6 SiO2, 14.6 Al2O3, 0.3 Fe2O3, 23.5 CaO, 6.3 B2O3, 0.9 Na2O and 0.7 F2. The fibres were spun using the wheel centrifuge process, which is also called the cascade or mecha-nical spinning process.1) The cascade spinning was performed on a three wheel spinning machine at temperatures around 1450°C. Before the spinning, the melts were homogenized in a Pt/Rh (90/10) crucible in an electrically heated furnace (Hasle Isomax A/S, Denmark, custom made) at temperatures of about 1530°C for 1–2 h. The glass melt was poured the outer rim of the first wheel (a spreader wheel). While some material was spun off, most of the melt was transferred to the adjacent wheels spinning at high speed in the opposite directions. Melt droplets were formed and stretched into fibres as they leave the spinning wheels. Two basaltic glass wool samples were used in the present study, which are denominated “Basalt” and “Basalt Hom”. Both fibre samples
were spun from the same melt composition. For “Basalt Hom” the raw material was pre-melted for 6 h prior to the above men-tioned melting. This pre-melting was performed to ensure addi-tional homogeneity in the basalt melt before spinning the fibres. The cooling rate of the GWFs during spinning is ~106 K/s.14)
3.2 FractographyThe fracture surfaces were imaged in a Scanning Electron
Microscope (SEM) (XL30 Philips) with beam current of 20 kV and ~50 μA, a spot size of 4–5 μm. The size of the fracture mir-ror was measured for both the mirror width and the mirror depth (according to Fig. 1). Because of large mirror sizes compared to the fibre diameters the mirror width measurement will give smaller values due to the surface curvature compared to mea-sured mirror widths in samples without surface curvature, and in the following calculations only the mirror depth was used. The use of the mirror depth is acceptable since all measurements were performed in pure tension.
3.3 Tensile strength measurementsTensile strength measurements were performed at a test rig for
singe glass fibres operating at a constant speed of 0.1 μm/s. Sin-gle fibres were tested in uniaxial tension. The gauge length of the tested fibres is 2–3 mm. All tensile test measurements are made at ambient condition. The individual GWFs were drawn from the wool whereby the weakest ones will fracture before selection. The fibres tested represent the strongest fibres of the samples.
For each sample, 40 individual fibres were tested. It was reported that at least 30 tests are needed to obtain results which are statistically valid.15) Statistical evaluation of the fracture strength is performed using the normal distribution and the Weibull distribution analysis.
4. Results4.1 Fractography of GWFsIn 45% of the fibres, fracture surfaces could be imaged and
analysed in the SEM. Fibre fracture surfaces disqualified for fractography have either been mounted in a bad orientation to obtain SEM images or contamination of the surface during han-dling made them improper for analyses. Representative examples of fracture surfaces obtained from GWFs are shown in Fig. 2. Three types of fracture surfaces are produced in pure tensile stress, all of which show fracture mirror, mist and hackle in accordance to Fig. 1. The first type of fracture surface is identical to the illustration in Fig. 1 and by far the most common (see Fig. 2a and Table 1). In the second type of fracture surfaces the origin can be recognised at the rim of the fibres in the SEM images and the size of this origin have been measured (Fig. 2b). The last type of fracture is caused by internal pores in the fibres, this is only observed in two of the three samples (Fig. 2c). Table 1 give a summary of the fracture surfaces found for each sample.
Tensile strength and fracture mirror depths of fibres fractured by pure tensile stress are shown Fig. 3. The tensile strength of the GWFs as a function of depth of the fracture mirror confirms the classical relationship from Eq. (1). The fracture mirror constant, A, for the Basalt GWFs A = 2.3–2.4 MPa·m½ and for E-glass GWF A = 2.1 MPa·m½. All values fall in the range of previously reported silicate glasses.9)–11)
The ratio of the fracture mirror depth of the analysed samples and the flaw size calculated from Eq. (2), rm/a, is found to be between ~9/1 and 11/1 for the two basaltic GWFs and ~9/1 for E-glass GWF. These ratios are comparable to the ratios of 10/1 generally reported in literature for silicate glasses.9) Hereby it is
Fig. 1. Schematic illustration of the fracture surface of GWFs. Traces of the crack propagation defines the areas called the fracture mirror, mist and hackle. The dotted grey lines indicate the position of the fracture ori-gin at the fibre surface. The black arrows show the mirror width, rw and the mirror depth, rd, which is used for fracture mirror size determina-tions.
a YE= 2
2
γσ
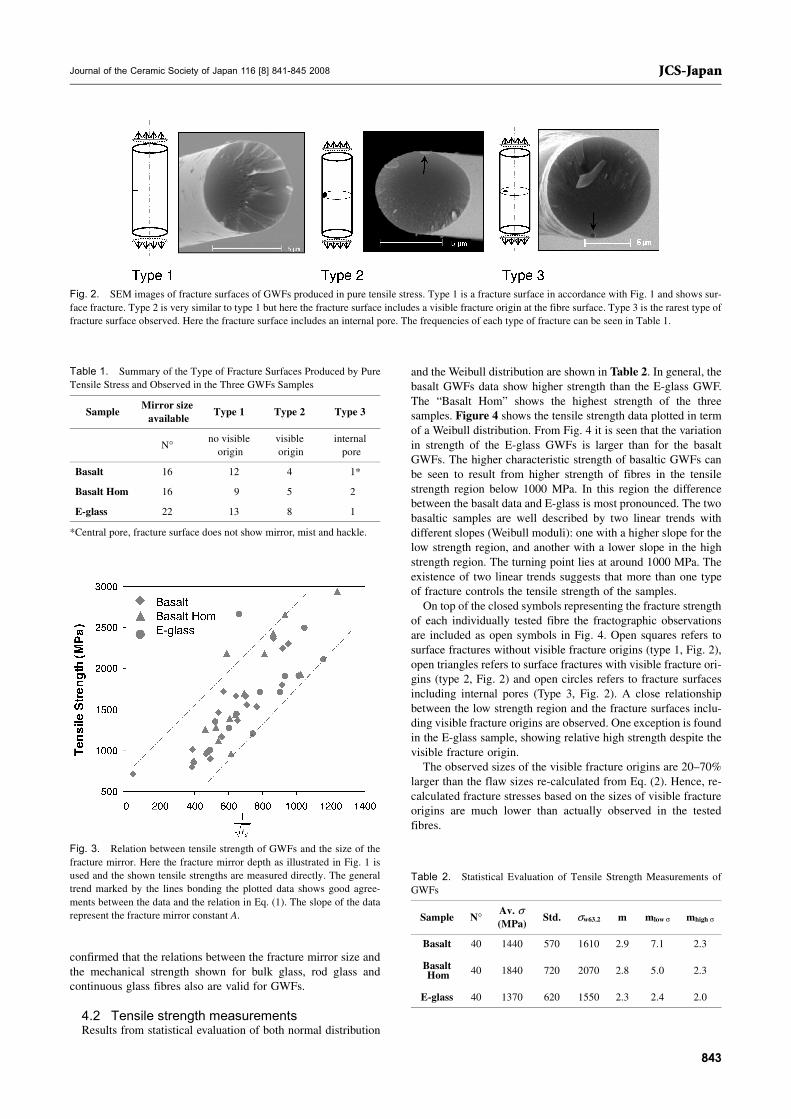
Journal of the Ceramic Society of Japan 116 [8] 841-845 2008
843
JCS-Japan
confirmed that the relations between the fracture mirror size and the mechanical strength shown for bulk glass, rod glass and continuous glass fibres also are valid for GWFs.
4.2 Tensile strength measurementsResults from statistical evaluation of both normal distribution
and the Weibull distribution are shown in Table 2. In general, the basalt GWFs data show higher strength than the E-glass GWF. The “Basalt Hom” shows the highest strength of the three samples. Figure 4 shows the tensile strength data plotted in term of a Weibull distribution. From Fig. 4 it is seen that the variation in strength of the E-glass GWFs is larger than for the basalt GWFs. The higher characteristic strength of basaltic GWFs can be seen to result from higher strength of fibres in the tensile strength region below 1000 MPa. In this region the difference between the basalt data and E-glass is most pronounced. The two basaltic samples are well described by two linear trends with different slopes (Weibull moduli): one with a higher slope for the low strength region, and another with a lower slope in the high strength region. The turning point lies at around 1000 MPa. The existence of two linear trends suggests that more than one type of fracture controls the tensile strength of the samples.
On top of the closed symbols representing the fracture strength of each individually tested fibre the fractographic observations are included as open symbols in Fig. 4. Open squares refers to surface fractures without visible fracture origins (type 1, Fig. 2), open triangles refers to surface fractures with visible fracture ori-gins (type 2, Fig. 2) and open circles refers to fracture surfaces including internal pores (Type 3, Fig. 2). A close relationship between the low strength region and the fracture surfaces inclu-ding visible fracture origins are observed. One exception is found in the E-glass sample, showing relative high strength despite the visible fracture origin.
The observed sizes of the visible fracture origins are 20–70% larger than the flaw sizes re-calculated from Eq. (2). Hence, re-calculated fracture stresses based on the sizes of visible fracture origins are much lower than actually observed in the tested fibres.
Fig. 2. SEM images of fracture surfaces of GWFs produced in pure tensile stress. Type 1 is a fracture surface in accordance with Fig. 1 and shows sur-face fracture. Type 2 is very similar to type 1 but here the fracture surface includes a visible fracture origin at the fibre surface. Type 3 is the rarest type of fracture surface observed. Here the fracture surface includes an internal pore. The frequencies of each type of fracture can be seen in Table 1.
Table 1. Summary of the Type of Fracture Surfaces Produced by Pure Tensile Stress and Observed in the Three GWFs Samples
SampleMirror size available
Type 1 Type 2 Type 3
N° no visible origin
visible origin
internal pore
Basalt 16 12 4 1*
Basalt Hom 16 9 5 2
E-glass 22 13 8 1
*Central pore, fracture surface does not show mirror, mist and hackle.
Fig. 3. Relation between tensile strength of GWFs and the size of the fracture mirror. Here the fracture mirror depth as illustrated in Fig. 1 is used and the shown tensile strengths are measured directly. The general trend marked by the lines bonding the plotted data shows good agree-ments between the data and the relation in Eq. (1). The slope of the data represent the fracture mirror constant A.
Table 2. Statistical Evaluation of Tensile Strength Measurements of GWFs
Sample N° Av. σ(MPa)
Std. σw63.2 m mlow σ mhigh σ
Basalt 40 1440 570 1610 2.9 7.1 2.3
Basalt Hom 40 1840 720 2070 2.8 5.0 2.3
E-glass 40 1370 620 1550 2.3 2.4 2.0

Lund et al.: Fractography and tensile strength of glass wool fibres
844
JCS-Japan
5. DiscussionTensile strength data evaluated by Weibull distribution are
seen in Fig. 4 and indicates a bimodal flaw distribution in the GWFs, especially for the basaltic samples. The fractography support this hypothesis by a close correlation between fracture surfaces with visible fracture origins (type 2 in Fig. 2) and the low strength region for all three samples, shown in Fig. 4 as dou-ble linear regression and the distribution of the open symbols representing the three different types of fracture surfaces described in Fig. 2. The type 2 fracture patterns do not follow the relation between fracture strength and flaw size expressed by the Griffith–Orowan–Irwin theory in Eq. 2. The visible fracture origins are in average oversized more than 50% compared to the size calculated from Eq. 2. The strength of these fibres could be governed by flaws much smaller than observed in the fracture surfaces. A possible explanation for this discrepancy could be the initial flaw that exists as an internal pore situated relatively close to the fibre surface. Upon crack initiation the flaw size would enlarge and propagate towards the fibre surface, due to the higher stress concentration and high local potential energy around the flaw. Eventually the crack would reach the fibre surface and the subsequent crack propagation would be equal to fracture caused by a crack origin at the fibre surface of a considerably larger size than the internal pore that caused the crack initiation. Guinea et al.16) has modelled this type of surface crack formation by linear elastic fracture mechanics. They showed that for internal pores with a certain size and a certain location (relative to the fibre sur-face) a situation could occur where the fracture stress of the fibre is equal to the critical stress that triggered the hypothetical inter-nal crack of a certain radius and position in the fibre. The type
3 fracture pattern shown in Fig. 2 where crack initiation origi-nates from internal pores near the surface, suggests that internal pores situated close to the fibre surface do exist in GWFs. The type 3 fracture patterns represent pore sizes and relative positions that did not produce enlarged surface fractures seen as visible fracture origins.
The correlation between low strength region and fracture sur-faces with visible fracture origins suggests that the most critical flaws in GWFs are these internal flaws, in an unfavourable posi-tion relative to the fibre surface. The theoretical sizes of these critical internal flaws calculated using Eq. (2) range from 200 to 1000 nm for “E-glass” GWFs and from 300–600 nm for “Basalt” and “Basalt Hom” GWFs, respectively. Apparently the longer homogenisation time for the melt prior to fibre spinning do alter neither the number nor the sizes of these critical internal flaws, whereas the difference in chemical composition between the E-glass and the basaltic glass causes a major difference in both the frequency and the size-distribution of these critical internal flaws. However, homogenization of the melt before fibre spin-ning has a positive impact on the tensile strength of the fibres as shown in Fig. 4. This could be due to decrease of the probability of the internal flaws with an increase of homogeneity of melts, since a homogenised melt leads to less defects in fibres than an inhomoginized melt. But in order to explore the effect of the homogeneity on the mechanical properties of the wool fibres, more systematic experiments need to be performed.
The strength distributions in the high strength region are very similar for all three samples. This implies that the flaws causing the distribution in strength in this region is more closely related to common features of the three samples, such as the internal glass structure related to the very high cooling rate from the spin-ning process. The fractography indicates that the majority of flaws in the high strength region are surface flaws. The low slopes of the Weibull curves in this region shown in Fig. 4 sug-gest large size-distribution of these surface flaws. The fluctuation of data around the general slope in the high strength region could indicate that several flaw distributions are overlapped with one another.
Finally, it should be noted that the strength of all the wool fibres studied in this work is considerably higher than that of the corresponding bulk glass. The origin of this phenomenon will be discussed elsewhere.17)
6. ConclusionBased on the fractographic analysis, the relations between the
size of the fracture mirror and the mechanical strength shown for bulk glass, rod glass and continuous glass fibres also are shown also to be valid for GWFs. The fracture mirror constants, A, of GWFs are comparable to those of rod glass and continuous oxide glasses. Comparison of tensile strength data evaluated using Weibull statistics with fractography suggests that the fracture behaviour of GWFs is associated with the mechanism of bimodal flaw population. The narrow distributions of strength in the low strength region (σ < 1000 MPa) could be attributed to critical internal flaws which propagate to the fibre surface and produce fracture surfaces of type 2, where the fracture origin can be rec-ognised at the rim of the fibres. The amount and size-distribution of these critical internal flaws are more closely related to the chemical composition of the glass fibres than to the homogeni-sation time of the melt prior to fibre spinning. However, the latter has certain positive effect on the strength of the fibres in the whole region of the Weibull plot.
The similarity of the data in the high strength region suggests
Fig. 4. Weibull plot of ln(ln1/1-P) versus ln(tensile strength). Closed symbols represent the fracture strength of each individually tested GWF and the open symbols on top of these represent fractographic observa-tions. Open squares refers to type 1 fractures of Fig. 2. Open triangles refers to type 2 fractures of Fig. 2, and open circles refers to type 3 frac-ture of Fig. 2. In the plot each data set has been split into a high strength and a low strength region with a turning point at 1000 MPa. In each region the data was fitted by linear regression, the slope of these lines represents the Weibull modulus and can be seen in Table 2.

Journal of the Ceramic Society of Japan 116 [8] 841-845 2008
845
JCS-Japan
close relation between the high strength and common features of the three samples. The fractographic observations imply that fibre surface controls the strength distribution in GWFs to large extent. These observations do not role out the interesting discus-sion on one or more origins related to the internal glass structure and the distribution of potential energy that is a result of the very high cooling rate from the spinning process. This discussion will be made in another paper also related to the present study.
Acknowledgements The authors would like to thank Pia Nielsen for performing tensile strength measurements, Winni Krøis for her help in developing and optimizing the SEM imaging of the fractured fiber surfaces. Dorthe Lybye is thanked for useful discus-sions and comments on the draft of this paper. This work is finan-cially supported by Rockwool International A/S.
References1) C. W. Axten, et al., Man-made Vitreous Fibres: Nomenclature,
Chemical and Physical Properties (Ed. Easters, W.) TIMA, Inc., Stamford, CT, 17, 1991–1993 (1993).
2) J. Sehgal and S. Ito, J. Non-Cryst. Sol., 253, 126–132 (1999).3) R. H. Doremus, “Glass Science,” Wiley, New York (1973) pp.
281.
4) M. Ya, J. Deubener and Y. Z. Yue, J. Am. Ceram. Soc., 91, 745–752 (2008).
5) W. H. Otto, J. Am. Ceram. Soc., 44 [2], 68–72 (1961).6) ASTM C1322–05b. American Society for Testing and Mate-
rials, ASTM international. (2005) pp. 1–50.7) N. Terao, J. Phys. Soc. Jpn., 8, 545–549 (1953).8) E. B. Shand, J. Am. Ceram. Soc., 37, 52–60 (1954).9) J. J. Mecholsky, R. W. Rice and S. W. Freiman, J. Am. Ceram.
Soc., 57, 440–443 (1974).10) R. J. Castilone, G. S. Glaesmann and T. A. Hanson,
“Proceedings of SPIE” Ed. by M. J. Matthewson and C. R. Kurkjian) 4639, 11–20 (2002).
11) A. C. Jaras, B. J. Norman and S. C. Simmest, J. Mater. Sci., 18, 2459–2465 (1983).
12) J. J. Mecholsky, S. W. Freimam and R. W. Rice, J. Mater. Sci., 11, 1310–1319 (1976).
13) W. Weibull, Ingeniörsvetenskapsakademiens Handlingar Nr 151, Stockholm (1939).
14) Y. Z. Yue, R. v.d. Ohe and S. L. Jensen, J. Chem. Phys., 120[17], 8053–8059 (2004).
15) K. Trustrum and A. Jayatilaka, De S. J. Mater. Sci., 14, 1080–1084 (1979).
16) G. V. Guinea, M. Elices and C. Rosselló, Eng. Frac. Mech., 69, 1057–1066 (2002).
17) M. Lund et al. (in progress).

Paper 3

Impact of Drawing Stress on the Tensile Strength of Oxide Glass Fibers
Majbritt D. Lund and Yuanzheng Yue�,w
Section of Chemistry, Aalborg University, DK-9000 Aalborg, Denmark
The sources of the tensile strength and fracture of both contin-uous glass fibers and discontinuous wool fibers are explored interms of structural anisotropy, enthalpy relaxation, defect ori-entation, and surface inhomogeneities. The fibers are spun fromthe E-glass and the basaltic glass melts, respectively. It is re-vealed that axial stress plays an important role in enhancing thestrength of the oxide glass fibers. The increase of axial stressleads to the increase of both the structural anisotropy and thedefect (flaws, bubbles, striae, etc.) orientation, and hence theincrease of the tensile strength. Besides the axial stress, the in-crease of the cooling rate also increases the tensile strength ofthe continuous fibers. These findings are further substantiated byannealing experiments on both continuous and wool fibers belowTg. The onset annealing temperature of the tensile strength de-cay is close to that of the anisotropy relaxation of the continuousfibers. The relative contributions of the different factors to thefiber strength are schematically scaled with the help of the sub-Tg annealing.
I. Introduction
THE strength of glass has been attracting the interest of sci-entists for more than a century. In spite of progress in un-
derstanding the fracture of glass, there are still challenges bothin clarifying the origin and in determining the controllingparameters of the tensile strength of glasses and glass fibers.These challenges are partly due to effects of numerous factors onthe strength of glass, e.g., chemical composition, the thermaland mechanical histories, the sample shape and the size, and thesurrounding atmosphere and so forth. In other words, the prac-tical strength is not a physical value like density because it de-pends both on internal factors (e.g., chemical composition,microstructure, and defects) and on external factors (e.g., man-ners of both sample production and strength measurements).
The rupture strength of chemical bonds, often called the the-oretical strength, is much higher than any strength valuesobtained in practice.1 It is known that thin (B10 mm) glassfibers exhibit 10–100 times higher strength than its counterpart,bulk glasses. This value is, however, much lower than the the-oretical strength. This discrepancy between theoretical and prac-tical strength values has been puzzling glass researchers for along time. The work of Griffith1 greatly influenced the field ofglass strength research, and initiated the debate on the relationbetween the tensile strength and the fiber diameters.2–10 It hasbeen hypothesized that the high fiber tensile strength might berelated to orientated molecules predisposed in the fibers duringthe fiber-drawing process.1,8 Recent studies of the effect ofdifferent parameters such as cooling rate,11,12 melting his-tory,13,14 and mechanical stretching15–17 on the fiber strength
show the role of both the microstructure and the relaxationbehavior of oxide glass fibers in influencing the fiber strength.18
In this paper, we attempt to answer the following long-standingquestions. What causes the difference in strength between fibersand bulk glasses with the same chemical composition? How doesthe axial stress (sax), the cooling rate, structural heterogeneityand the technological defects (e.g., striae, bubbles, etc.) influencethe fiber strength?
II. Experimental Procedure
(1) Fiber Drawing
Fibers used in this study were produced either from the contin-uous drawing process with a single orifice or from the cascadeprocess. Two types of glass fibers were produced from basalticand E-glass compositions shown in Table I. The differences inthe basaltic glass compositions are attributed to the chemicalvariation of the basalt raw material.
The glasses for the fiber spinning were obtained by meltingthe raw materials in an electrical furnace for 2 h at 1773–1803 Kand then casting the melt into the fiber-drawing crucible of90/10Pt/Rb (for continuous fiber drawing) or quenching it intowater (for the cascade process). The crucible for continuousfiber drawing has a dimension of 40 mm� 70 mm (dia-meter� height). In the middle of the bottom of the crucible,there is a die with the dimension of 2.0 mm� 3.0 mm (dia-meter� height). The crucible filled with glass was placed inan electrically heated cylinder furnace (SCANDIA type STTF115/400–15501C, Aller^d, Denmark), from which the fibers werecontinuously drawn at speeds between 1 and 50 m/s, and col-lected using a metallic drum. Different drawing speeds gavedifferent axial stresses to the fibers, and hence generated differ-ent fiber diameters. The drawing temperatures were 1413 K forthe basaltic fibers and 1393 K for the E-glass fibers, which cor-respond to the viscosities of 180 and 220 Pa � s, respectively. The
Table I. Chemical Compositions of Both E-Glass and BasalticGlasses for the Produced Fibers
Oxide (wt%) 7
E-glass Basalt glass
Continuous E Cascade E Continuous B Cascade B
SiO2 0.4 53.6 53.6 49.3 47.1Al2O3 0.3 14.6 14.6 15.6 15.3TiO2 0.1 — — 1.8 1.6FeO — — 6.8w 9.1w
Fe2O3 0.2 0.3 0.3 4.1w 2.1w
CaO 0.2 23.5 23.5 10.4 7.3MgO 0.2 — — 6.6 7.2Na2O 0.2 0.9 0.9 3.9 3.6K2O 0.1 — — 0.7 0.9B2O3 0.2 6.3 6.3 — —F2 0.2 0.7 0.7 — —Tg (K) 952 952 908 926
wFe2O3/SFe determined by Mossbauer spectroscopy. The compositions were
measured using X-ray fluorescence (XRF). The Tg value from differential scanning
calorimetry (DSC) measurements is listed below each composition.
L. Klein—contributing editor
Part of the content of this paper was presented at 2008 GOMDmeeting, Tucson, USA,May 17–21, 2008
This work was financially supported by Rockwool International A/S.�Member, The American Ceramic Society.wAuthor to whom correspondence should be addressed. e-mail: [email protected]
Manuscript No. 26734. Received August 24, 2009; approved April 22, 2010.
Journal
J. Am. Ceram. Soc., 93 [10] 3236–3243 (2010)
DOI: 10.1111/j.1551-2916.2010.03879.x
r 2010 The American Ceramic Society
3236

fiber diameters were determined using a scanning electron mi-croscope (SEM) (Philips XL30 ESEM, Hillsboro, OR). Samplename stands for the glass type and the drawing speed. For in-stance, E10 refers to E-glass drawn at 10 m/s, while B8 refers tobasaltic glass drawn at 8 m/s.
The discontinuous wool fibers were obtained using a three-wheel cascade spinning machine. In detail, a glass producedpreviously was remelted in an electrical furnace (Hasle IsomaxA/S, Roenne, Denmark) at 1803 K for 1 h. Subsequently, themelt was poured onto the outer rim of a spreader wheel that isrotating at a given speed. While some material was spun off,most of the melt was transferred to either of the two adjacentwheels spinning at a high rotational speed in the opposite di-rection. Fibers were formed when droplets were thrown fromthe wheels by centrifugal force. During the spinning process, thefibers were hyperquenched at a rate of B106 K/s that was es-timated using a method reported elsewhere.19 The fiber diame-ters were determined using SEM (Philips XL30 ESEM).
(2) Annealing
To study the influence of the structural relaxation on the fiberstrength, fibers were annealed in atmospheric air at differenttemperatures (Ta) chosen in the range of 0.5 Tg to Tg (in Kelvin)for 3 h. Because annealing occurred below Tg, it is thus referredto as sub-Tg annealing. The fibers were annealed in a mufflefurnace at constant temperatures with a variation of72 K, andafterward taken out directly from the furnace. It should benoted that part of basaltic wool fiber samples were annealed in atube furnace in a N2 atmosphere, so that comparison in tensilestrength can be made between the N2-annealed and the air-annealed samples.
(3) Differential Scanning Calorimetry (DSC)
The isobaric heat capacity (Cp) of a crushed fiber sample ofB20 mg was measured as a function of temperature using aDSC (Netzsch STA 449C Jupiter, Selb, Germany) in argon. Thesample was placed in a platinum crucible situated on a sampleholder of the DSC at room temperature. The samples were heldfor 5 min at an initial temperature of 333 K, then heated at 20K/min to 1.1 Tg, and then cooled back at 20 K/min to 573 K.After natural cooling to room temperature, the second upscanwas performed using the same procedure as for the first. To de-termine Cp of the samples, the heat flow data both for the base-line (using two empty crucibles) and for the reference sample(Sapphire) were measured. Cp1 and Cp2 are the heat capacities of
the samples measured during the first and second upscans, re-spectively. By using a method proposed previously,19 the glasstransition temperatures (Tg) of the basaltic glasses were foundand are listed in Table I. The area between the Cp1 and Cp2
curves represents the excess enthalpy of the hyperquenchedglasses, DH, relative to that of the standard glass. The excessenthalpy was trapped in fibers during the spinning process, andreferred to as the total excess enthalpy DHtot. DHtot will be re-leased when the fibers are reheated in DSC to a temperaturewhere the Cp curves for the first and the second scan merge.When the fibers undergo a sub-Tg annealing, i.e., annealing be-low Tg for a given duration, part of DHtot will be released, whilepart of it remains. The remaining part is denoted here by DHrem.The details of how to calculate the DHrem values are given else-where.19
(4) Tensile Strength Tests
The tensile strength tests (uniaxial tension test) of individual fi-bers were performed using a Raith FTM testing rig (RockwoolInternational A/S, Hedehusene, Denmark) for a single glassfiber operating at a constant speed of 10�5 m/s. The appliedforce, F, could be calculated from the controlled speed and thedistance that is changeable by moving the flexible end of thetesting rig. The gauge length of the tested fibers was between2 and 3 mm. All tensile tests were made at room temperatureunder ambient conditions. The diameters of the tested fiberswere measured using SEM (Philips XL30 ESEM) close to thepoint of fracture, and thus the cross-section area, A, could becalculated. The tensile strength of the samples, sf, were calcu-lated from the relation sf5F/A. Evaluation of the tensilestrengths was performed using Weibull’s statistics,20 whichis based on ‘‘the weakest-link theory’’ and assume a randomlocation of independent flaws causing mechanical failure. Theprobability of failure, Pf, is defined as
Pf ¼ 1� exp � sf
s0
� �m� �(1)
where s0 is a scale parameter (also called the characteristicstrength), corresponding to the fracture strength with a failureprobability of 63.2%, and hence is related to the mean value ofthe distribution. The Weibull modulus, m, represents the scatterin the fracture strength. The tensile strength data were plotted ina Weibull plot, i.e., ln(ln(1/1�Pf)) vs ln(sf) (see Fig. 1), from
5 6 7 8 95 6 7 8
–4
–3
–2
–1
0
1
2
B8o
5
16
50
84
1000
o
99
Fra
ctur
e pr
opab
ility
Pf (
%)
ln(ln
(1/(
1–P
f)))
ln�f ( �f in MPa)
Tensile strength �f (MPa)
200 500 3000 200 500 1000 3000
(b) Basaltic fibersWool
Casc BContinuous
B21B33B51
WoolCase E
ContinuousE10E20E30E40
(a) E-glass fibers
Fig. 1. Tensile strength (sf) distribution in Weibull diagrams, i.e. the plot of ln(ln(1(1�Pf))) vs ln(sf), where Pf is the probability of failure, for bothwool fibers and continuous fibers drawn at different speeds. (a) E-glass fibers; and (b) basaltic fibers. Straight graygray lines in the diagram represent thelinear fits of sf in the high-strength region.
October 2010 Tensile Strength of Oxide Glass Fibers 3237

which the Weibull parameters s0 and m can be found by linearregression of the data. Each test series contains 25–40 fibers.
(5) Optical Birefringence
Mechanically induced anisotropy can be quantified by measur-ing the optical birefringence of fibers under polarizedlight. Measurements of the birefringence of single fibers arenot possible due to small optical phase differences. Therefore,fiber bundles fixed in parallel orientation and fixed in a glasstube were used. A fiber bundle immersed in commercial immer-sion liquid with a refractive index of 1.558 was used for quan-titative birefringence measurements with a Brace–Kohlercompensator using a monochromatic light of 546 nm. Detailsof the methods are given elsewhere.21
III. Results
The challenge in evaluating the strength of brittle materials is thelarge scattering in data obtained within a single sample. For theglass fibers tested in this work, the data variation is visualized inWeibull’s plots shown in Fig. 1. The figure shows that the eval-uations of the fiber strength values need (at least) bimodal dis-tribution evaluations. The strength values are separated in twodistributions based on the slope of the distributions shown inFig. 1: a high-strength distribution with strength values above2700 MPa and a low-strength distribution with values below2700 MPa. The characteristic tensile strength s0 and Weibull’smodulusm are found for each distribution and listed in Table II.
The slopes of the strength curves in the region between 1000and 2700 MPa are parallel for both wool fibers and continuousfibers (Fig. 1). By studying fractography of wool fibers, it hasbeen found that these slopes reflect a broad distribution inflaws including voids or bubbles positioned in the volume ofthe fibers and small flaws near or at the surface of the fibers.22 Inaddition, the continuous fibers exhibit a narrow high-strengthdistribution above 2700 MPa, and the basaltic wool fibers showa narrow low-strength distribution in the region below 900MPa.The continuous fiber E40 has a single strength distribution, butwith a low-strength tail caused only by a single data point. Thislow-strength tail is frequently observed in strength tests of glassfibers. The E-glass wool fibers show an apparent single strengthdistribution. However, from fractography, the E-glass woolfibers possess a bimodal flaw distribution, which is also shownby basaltic wool fibers.22
The fiber diameter is often believed to have an impact on thetensile strength. Before such an impact is discussed, the diameterdistributions of fibers must be determined. Usually, the woolfibers have a larger variation in diameter than the continuous
fibers. For basaltic wool fibers, the distribution is represented bya fiber volume of 84 vol%, which has a diameter o11.4 mm,50 vol% is of do6.4 mm, and only 16 vol% has do3.1 mm. Forcontinuous fibers, the distribution is rather narrow as long as thefiber-drawing parameters are fixed. Figures 2(a) and (b) showthe tensile strength as a function of the inverse fiber diameter forboth E-glass and basaltic compositions, respectively.
From Figs. 2(a) and (b), it is seen that the tensile strength ofthe fibers is more than one order of magnitude higher than thatof bulk glasses with the same composition. For continuous ba-saltic fibers, the strength first increases with the decreasing fiberdiameter, and then reaches a plateau where the strength is in-dependent of the fiber diameter in the diameter range betweenB5 and 17 mm. Furthermore, Fig. 2 shows a significant differ-ence in strength between continuous fibers and wool fibers forsimilar fiber diameters. The tensile strengths of the wool fibersare considerably lower than those of the continuous fibers forboth glass compositions. For the E-glass composition (Fig. 2(a)),the tensile strength of the wool fibers is about 1500MPa, whereasthat of the continuous fibers is about 2250–3000 MPa. Thedifference is also seen for the basaltic composition (Fig. 2(b)),in which the tensile strength is around 1250 MPa for the woolfibers, and around 3500 MPa for the continuous fibers.
For the continuous fiber-drawing process, the relation be-tween the fiber diameter d and the drawing speed v can bedescribed by the expression21:
d ¼ Av�0:5 (2)
Table II Weibull’s Parameters of All Samples Obtained from Linear Fits of the Data of the Entire, the Lower, and the HigherTensile Strength (rf) Distributions, Respectively, as Shown in Fig. 1
Samples
Lower sf distribution Higher sf distribution
s0 (MPa) m R2 /dS (mm) Std s0(high) (MPa) m R2 /dS (mm) Std
E-glass fibersE10 1690 4.4 0.93 14.9 0.1 2880 7.2 0.95 14.9 0.5E20 2080 4.4 0.97 10.4 0.7 2810 17.2 0.94 10.2 0.2E30 1820 7.1 0.97 9.9 0.5 2450 14.1 0.83 9.5 0.3E40 1070 — — 6.5 — 2970 8.4 0.95 7.6 0.5Cascade E 1870w 3.9 0.95 7.4 2.5 — — — — —
Basaltic fibersB8 1830 3.6 0.93 16.9 0.6 3210 12.8 0.92 16.7 0.4B21 2340 3.1 0.96 9.4 0.3 3990 7.9 0.87 8.9 0.4B33 2710 3.0 0.96 8.7 0.5 3970 15.9 0.79 8.3 0.5B51 2630 3.2 0.96 8.1 2.0 4160 9.9 0.76 6.8 1.0Cascade B 1890w 4.4 0.91 6.4 2.1 — — — — —wObtained from the higher strength region for wool fibers, the slopes of which are close to those of the lower strength region for continuous fibers (see Fig. 1). s0 is the
characteristic strength taken at the failure probability of 63%; m is Weibull’s modulus representing the slope of the strength distribution; /dS is the average fiber diameter,
and Std is the standard deviation of /dS.
0
(a) E-glass compositions (b) Basaltic compositions4000
3000
2000
1000
Bulk glass Bulk glass
0.00 0.05 0.10 0.15 0.00 0.05 0.10 0.15 0.20
1/d (1/μm)
� 0 (M
Pa)
Fig. 2. Tensile strength s0 as a function of the reciprocal diameter ofE-glass (a) and basaltic fibers (b). Vertical rectangular gray box, the s0
data of bulk samples in a certain range due to the scattering of data.Solid circles, the s0 data of the wool fibers. The s0 data of continuousbasaltic fibers shown in (b) were obtained from the fibers drawn withboth the 1.8 mm (diameter) die (see the inverted triangles) and the2.0 mm die (see triangles), respectively. Error bars are shown in thefigure.
3238 Journal of the American Ceramic Society—Lund and Yue Vol. 93, No. 10

where A is a constant, which is found to be 4.66 (70.09)� 10�5
m1.5/s0.5 for the basaltic fibers and 5.12 (70.6)� 10�5 m1.5/s0.5
for the E-glass fibers.From the finite element simulation of the drawing process of
continuous basaltic glass fibers, a linear relationship is foundbetween v and the axial stress applied to the fibers during draw-ing, sax, as follows:
sax ¼ Bv (3)
where B is a slope. For the continuous basaltic glass fibers, theconstant B is found to be 1.07 106 N � s/m3. By combining Eq.(2) with Eq. (3), a direct relationship between the fiber diameterand the axial stress is obtained
sax ¼ BA2d�2 (4)
This relation also applies for the continuous E-glass fibers,because these fibers are produced under drawing conditionssimilar to those of the continuous basaltic glass fibers. For thewool fibers, the sax during forming was estimated by FEM sim-ulation to be around 0.02 MPa.
Figures 3(a) and (b) show that, for both E-glass fibers andbasaltic fibers, the tensile strength first rises rapidly with sax, andthen approaches a plateau at sax420 MPa. The difference be-tween the maximum strength of the continuous fibers and thatof the bulk glasses is separated into two intervals. Interval 1represents the s0 difference between the fibers (including con-tinuous and wool fibers) drawn at the lowest sax and the fibersdrawn at the highest sax. Interval 2 represents the s0 differencebetween wool fibers and bulk glass. These intervals will be usedin the discussion of the origin of the fiber strength in the nextsection.
Recent studies show that relaxation of the structural anisot-ropy due to annealing is much faster than the enthalpy relax-ation.18 To see whether the anisotropy and enthalpy relaxationsare linked to the evolvement of the tensile strength of glass fibersupon annealing, tensile strength of both the annealed wool andthe annealed continuous fibers is measured. Figure 4 shows thestrength decay of continuous E-glass fibers with the increasingannealing temperature (Ta) in a Weibull plot. To observe the Ta
dependence of s0, the s0 data are plotted against the Tg-scaledtemperature, Ta/Tg, in Fig. 5 for both the E-glass fibers(Fig. 5(a)) and the basaltic fibers (Fig. 5(b)), respectively.
As shown in Figs. 5(a) and (b), the onset temperature of thestrength decay is around 0.5–0.6 Tg for continuous fibers,whereas it is around 0.7–0.8 Tg for the wool fibers. It is alsoseen that the strength decay occurs faster for the continuous fi-bers than for the wool fibers. Upon a 3-h annealing near Tg, thetensile strength of all samples reduces to a level around 800–900
MPa. However, this final strength level of the glass fibers is sig-nificantly higher than that of bulk glasses of similar composi-tions. To reveal the origin of the higher tensile strength of glassfibers relative to bulk glass and wool fibers, the actual tensilestrength (s0) of as-produced basaltic fibers is described by threedistinct s0 drops in Fig. 5(b). Ds01 is the difference in strengthbetween the as-produced continuous fibers and the as-producedwool fibers. Ds02 is the drop in strength from as-produced woolfibers to that of fully relaxed fibers. Ds03 is the difference instrength between the fully relaxed fibers and bulk glass of thesame composition.
Figures 6(a) and (b) show the dependences of the remainingexcess enthalpy scaled by DHtot excess enthalpy, DHrem/DHtot
(here also called the enthalpy relaxation index), on the annealingtemperature Ta for both the E-glass (Fig. 6(a)) and the basalticfibers (Fig. 6(b)). This dependence can be described by the fol-lowing expression24:
DHrem
DHtot¼ Tr
Ta
� �C
1� exp � Ta
Tr
� �C" # !
(5)
where Tr is the characteristic annealing temperature and C is aconstant reflecting the rate at which DHrem decreases with Ta.Figure 6(b) shows that there is a similarity in the enthalpy re-laxation between the basaltic continuous and the wool fibers (seethe fitting curves). When the fibers undergo annealing near Tg
for 3 h, the excess enthalpy is reduced to zero.It is known that the enthalpy relaxation in continuous glass
fibers begins at higher annealing temperatures than the anisot-ropy relaxation process.18,21 The latter is often reflected by thedecay of the optical birefringence (Dn) of glass fibers normalizedby the initial birefringence (Dntot), Dn/Dntot (here also called an-isotropy relaxation index), with the increasing Ta. To comparethe anisotropy relaxation with the enthalpy relaxation, the Dn/Dntot data are plotted against Ta in Fig. 6(a). This plot can bedescribed by an expression similar to Eq. (5) as shown by thedashed curve in Fig. 6(a). It is observed in Fig. 6(a) that opticalbirefringence decays much faster than the excess enthalpy duringannealing.
IV. Discussion
To explore the origin of the difference in the fracture behaviorbetween the wool and the continuous glass fibers, it is useful tocompare the Weibull moduli m, i.e., the slopes of the strengthdistributions between the two types of fibers (Fig. 1). Figure 1shows that the two types of fibers have comparable Weibull’s
0 20 40 60 800 20 40 60 800
(a) E-glass compositions (b) Basaltic compositionsContinuous
fibersContinuous
fibers
Wool fibers
Bulk glass
Wool fibers
Bulk glass
interval 1
interval 21000
2000
3000
4000
� 0 (M
Pa)
�ax (MPa)
Fig. 3. Tensile strength s0 as a function of the axial stress sax appliedto fibers during drawing for both E-glass (a) and basaltic composition(b), and comparisons of the tensile strength data between continuous,wool, and bulk samples. Interval 1, the s0 difference between the con-tinuous fibers and the wool fibers for similar diameters; Interval 2, the s0
difference between the wool fibers and the bulk glass of same compo-sitions. Vertical rectangular grey box, the s0 data of bulk samples withthe scattering range. Error bars are calculated following ASTM standard1239.23
5 6 7 8 9
–4
–3
–2
–1
0
1
2
5
16
50
84
99
ln(ln
(1/(
1–P
f)))
279473523673773873973
Ta (K)E-glass fibers
Pf (
%)
ln �f (�f in MPa)
30001000500200�f (MPa)
Fig. 4. Tensile strength (sf) decay of continuous E-glass fibers as aconsequence of sub-Tg annealing at various temperatures between 0.5 Tg
and Tg, which is visualized in a Weibull diagram.
October 2010 Tensile Strength of Oxide Glass Fibers 3239

moduli in the strength region of about 1000–2700 MPa (see Ta-ble II). Above this strength region, tensile strength data areachievable only for the continuous fibers. The narrow high-strength distribution of the continuous glass fibers is reflected bythe relatively large Weibull’s modulus m ranging from 8 to 17(Table II). Within this narrow distribution, the average diameter
of fibers ranges from 7.5 to 15 mm. In this diameter range, nodiameter dependence of strength is detected if the error rangeis taken into account. The maximum tensile strength of contin-uous E-glass fibers is close to that of the 10-mm-diametercontinuous E-glass fibers reported by e.g., Kurkjian et al.25
and Cameron.26
For continuous basaltic fibers (Fig. 2(b)), the data of the woolfibers significantly deviate from the general tendency of thechange of the continuous fiber strength with the fiber diameter.In detail, the characteristic strength s0 falls far below thestrength level of the continuous fibers of similar fiber diameters(Figs. 2(a) and (b)). Importantly, sax applied to the wool fibersduring fiber spinning was found to be almost four orders ofmagnitude lower than that applied to continuous fibers. Thisimplies that the large sax difference could explain the large dis-crepancy in s0 between the wool and continuous fibers. To con-firm this, the tensile strength data are plotted against sax in Figs.3(a) and (b). Thus, a good agreement is found between the s0
data of the wool fibers and those of the continuous fibers. Thissuggests that the large sax difference between the two types offibers is indeed the origin of the s0 discrepancy. In addition,Figs. 3(a) and (b) show a rapid increase in tensile strength at sax
o10 MPa, which is then followed by a plateau, which corre-sponds to B2800 MPa for the continuous E-glass fibers andB3500 MPa for the continuous basaltic fibers, respectively.
Following the Griffith–Orowan fracture criterion,27 themaximum of the tensile strength corresponds to flaw sizes of20–40 nm. Flaws of these sizes are not associated with theatomistic local structure and atomistic bonding in glasses, andhence the maximum strength cannot be referred to as an intrin-sic strength. However, the present authors argue that the glassstructure could influence the apparent strength of glass fibersand its distribution in a different way. This statement is based onthe findings shown in Figs. 3(a) and (b), i.e., the fibers subjectedto a smaller sax have a lower s0 than those subjected to a largersax. In a previous study, it was found that an increase of the sax
results in a linear increase of the degree of structural anisot-ropy.18 Thus, it can be inferred that the increases of the struc-tural anisotropy (i.e., orientation of structural units along thefiber axis) enhances the tensile strength of glass fibers. As isknown, the structural anisotropy of continuous glass fibers lin-early increases with the drawing speed, and hence with the sax.However, unlike the anisotropy, the tensile strength reaches aplateau or maximum above a certain sax value. This suggeststhat above a critical sax value the fiber strength is controlled notonly by the structural anisotropy but also by other factors suchas inhomogeneity in atomic range,28 imperfect bonds on the
0
Δ
Δ
Δ
(a) E-glass fibers (continuous) (b) Basaltic fibers continuouswool Iwool II
4000
3000
2000
1000
� 0 (
MP
a)
0.4 0.6 0.8 1.0 0.4 0.6 0.8 1.0 1.2 1.4Ta/Tg (K/K)
�01
�02
�03
Fig. 5. Characteristic tensile strength s0, as a function of the Tg-scaled annealing temperature, Ta/Tg for durations of 3 h. (a) E-glass fibers (continuousfibers); and (b) basaltic fibers (both continuous and discontinuous wool fibers). Wool I and II refer to the samples that were heat treated in air and innitrogen, respectively. s01, s02, and s03 are the drop in the tensile strength from not annealed continuous to wool fibers, that from not annealed woolfibers to the fully relaxed fibers, and that from the fully relaxed fibers to the bulk sample, respectively. Error bars are calculated following ASTMstandard C-1239.23
1.0
0.8
Δn/Δ
n tot
ΔHrem/ΔHtot
ΔHre
m/Δ
Hto
tΔH
rem
/ΔH
tot
(b) Basaltic fibers
(a) E-glass fibers
Continuous
Wool
Δn/Δntot
0.6
0.4
0.2
0.0
1.00.80.60.4
Ta/Tg (K/K)
1.0
0.8
0.6
0.4
0.2
0.0
1.0
0.8
0.6
0.4
0.2
0.0
Fig. 6. (a) Comparison between the Tg-scaled annealing temperature(Ta/Tg) dependence of the enthalpy relaxation index (DHrem/DHtot) andthat of the anisotropy relaxation index (Dn/Dntot) for E-glass fibers.DHrem is the excess enthalpy remaining in the fibers after annealing,DHtot the total excess enthalpy of the original fibers, Dn the opticalbirefringence remaining in fibers, and Dntot the total optical birefringenceof the original fibers.18 The solid and the dash curves represent the fits ofexperimental data to Eq. (5) both for the enthalpy relaxation and for theanisotropy relaxation, respectively. (b) Comparison in DHrem/DHtot
between continuous fibers and wool fibers for basaltic compositions.The solid and the dash curve represent the fits of the experimental datato Eq. (5) both for the continuous basaltic fibers and for the wool fibers,respectively. All samples were annealed in atmospheric air for 3 h. Theenthalpy data were measured using differential scanning calorimetry inargon at an upscan rate of 20 K/min.
3240 Journal of the American Ceramic Society—Lund and Yue Vol. 93, No. 10
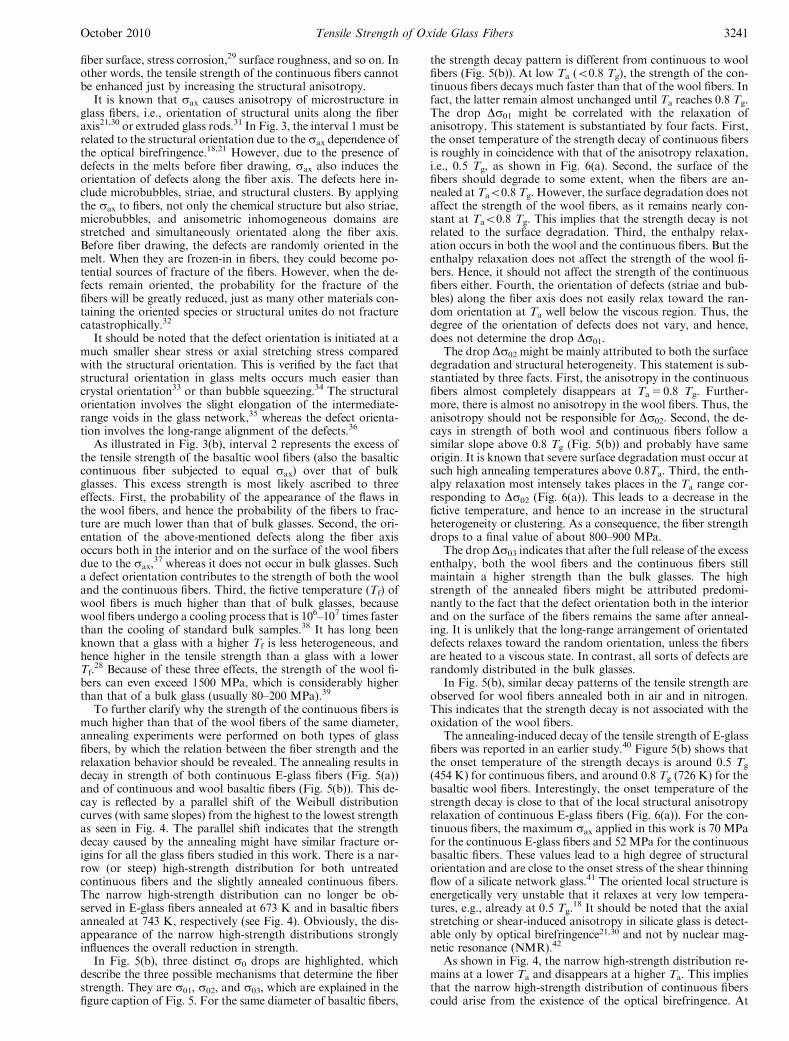
fiber surface, stress corrosion,29 surface roughness, and so on. Inother words, the tensile strength of the continuous fibers cannotbe enhanced just by increasing the structural anisotropy.
It is known that sax causes anisotropy of microstructure inglass fibers, i.e., orientation of structural units along the fiberaxis21,30 or extruded glass rods.31 In Fig. 3, the interval 1 must berelated to the structural orientation due to the sax dependence ofthe optical birefringence.18,21 However, due to the presence ofdefects in the melts before fiber drawing, sax also induces theorientation of defects along the fiber axis. The defects here in-clude microbubbles, striae, and structural clusters. By applyingthe sax to fibers, not only the chemical structure but also striae,microbubbles, and anisometric inhomogeneous domains arestretched and simultaneously orientated along the fiber axis.Before fiber drawing, the defects are randomly oriented in themelt. When they are frozen-in in fibers, they could become po-tential sources of fracture of the fibers. However, when the de-fects remain oriented, the probability for the fracture of thefibers will be greatly reduced, just as many other materials con-taining the oriented species or structural unites do not fracturecatastrophically.32
It should be noted that the defect orientation is initiated at amuch smaller shear stress or axial stretching stress comparedwith the structural orientation. This is verified by the fact thatstructural orientation in glass melts occurs much easier thancrystal orientation33 or than bubble squeezing.34 The structuralorientation involves the slight elongation of the intermediate-range voids in the glass network,35 whereas the defect orienta-tion involves the long-range alignment of the defects.36
As illustrated in Fig. 3(b), interval 2 represents the excess ofthe tensile strength of the basaltic wool fibers (also the basalticcontinuous fiber subjected to equal sax) over that of bulkglasses. This excess strength is most likely ascribed to threeeffects. First, the probability of the appearance of the flaws inthe wool fibers, and hence the probability of the fibers to frac-ture are much lower than that of bulk glasses. Second, the ori-entation of the above-mentioned defects along the fiber axisoccurs both in the interior and on the surface of the wool fibersdue to the sax,
37 whereas it does not occur in bulk glasses. Sucha defect orientation contributes to the strength of both the wooland the continuous fibers. Third, the fictive temperature (Tf) ofwool fibers is much higher than that of bulk glasses, becausewool fibers undergo a cooling process that is 106–107 times fasterthan the cooling of standard bulk samples.38 It has long beenknown that a glass with a higher Tf is less heterogeneous, andhence higher in the tensile strength than a glass with a lowerTf.
28 Because of these three effects, the strength of the wool fi-bers can even exceed 1500 MPa, which is considerably higherthan that of a bulk glass (usually 80–200 MPa).39
To further clarify why the strength of the continuous fibers ismuch higher than that of the wool fibers of the same diameter,annealing experiments were performed on both types of glassfibers, by which the relation between the fiber strength and therelaxation behavior should be revealed. The annealing results indecay in strength of both continuous E-glass fibers (Fig. 5(a))and of continuous and wool basaltic fibers (Fig. 5(b)). This de-cay is reflected by a parallel shift of the Weibull distributioncurves (with same slopes) from the highest to the lowest strengthas seen in Fig. 4. The parallel shift indicates that the strengthdecay caused by the annealing might have similar fracture or-igins for all the glass fibers studied in this work. There is a nar-row (or steep) high-strength distribution for both untreatedcontinuous fibers and the slightly annealed continuous fibers.The narrow high-strength distribution can no longer be ob-served in E-glass fibers annealed at 673 K and in basaltic fibersannealed at 743 K, respectively (see Fig. 4). Obviously, the dis-appearance of the narrow high-strength distributions stronglyinfluences the overall reduction in strength.
In Fig. 5(b), three distinct s0 drops are highlighted, whichdescribe the three possible mechanisms that determine the fiberstrength. They are s01, s02, and s03, which are explained in thefigure caption of Fig. 5. For the same diameter of basaltic fibers,
the strength decay pattern is different from continuous to woolfibers (Fig. 5(b)). At low Ta (o0.8 Tg), the strength of the con-tinuous fibers decays much faster than that of the wool fibers. Infact, the latter remain almost unchanged until Ta reaches 0.8 Tg.The drop Ds01 might be correlated with the relaxation ofanisotropy. This statement is substantiated by four facts. First,the onset temperature of the strength decay of continuous fibersis roughly in coincidence with that of the anisotropy relaxation,i.e., 0.5 Tg, as shown in Fig. 6(a). Second, the surface of thefibers should degrade to some extent, when the fibers are an-nealed at Tao0.8 Tg. However, the surface degradation does notaffect the strength of the wool fibers, as it remains nearly con-stant at Tao0.8 Tg. This implies that the strength decay is notrelated to the surface degradation. Third, the enthalpy relax-ation occurs in both the wool and the continuous fibers. But theenthalpy relaxation does not affect the strength of the wool fi-bers. Hence, it should not affect the strength of the continuousfibers either. Fourth, the orientation of defects (striae and bub-bles) along the fiber axis does not easily relax toward the ran-dom orientation at Ta well below the viscous region. Thus, thedegree of the orientation of defects does not vary, and hence,does not determine the drop Ds01.
The drop Ds02 might be mainly attributed to both the surfacedegradation and structural heterogeneity. This statement is sub-stantiated by three facts. First, the anisotropy in the continuousfibers almost completely disappears at Ta5 0.8 Tg. Further-more, there is almost no anisotropy in the wool fibers. Thus, theanisotropy should not be responsible for Ds02. Second, the de-cays in strength of both wool and continuous fibers follow asimilar slope above 0.8 Tg (Fig. 5(b)) and probably have sameorigin. It is known that severe surface degradation must occur atsuch high annealing temperatures above 0.8Ta. Third, the enth-alpy relaxation most intensely takes places in the Ta range cor-responding to Ds02 (Fig. 6(a)). This leads to a decrease in thefictive temperature, and hence to an increase in the structuralheterogeneity or clustering. As a consequence, the fiber strengthdrops to a final value of about 800–900 MPa.
The drop Ds03 indicates that after the full release of the excessenthalpy, both the wool fibers and the continuous fibers stillmaintain a higher strength than the bulk glasses. The highstrength of the annealed fibers might be attributed predomi-nantly to the fact that the defect orientation both in the interiorand on the surface of the fibers remains the same after anneal-ing. It is unlikely that the long-range arrangement of orientateddefects relaxes toward the random orientation, unless the fibersare heated to a viscous state. In contrast, all sorts of defects arerandomly distributed in the bulk glasses.
In Fig. 5(b), similar decay patterns of the tensile strength areobserved for wool fibers annealed both in air and in nitrogen.This indicates that the strength decay is not associated with theoxidation of the wool fibers.
The annealing-induced decay of the tensile strength of E-glassfibers was reported in an earlier study.40 Figure 5(b) shows thatthe onset temperature of the strength decays is around 0.5 Tg
(454 K) for continuous fibers, and around 0.8 Tg (726 K) for thebasaltic wool fibers. Interestingly, the onset temperature of thestrength decay is close to that of the local structural anisotropyrelaxation of continuous E-glass fibers (Fig. 6(a)). For the con-tinuous fibers, the maximum sax applied in this work is 70 MPafor the continuous E-glass fibers and 52 MPa for the continuousbasaltic fibers. These values lead to a high degree of structuralorientation and are close to the onset stress of the shear thinningflow of a silicate network glass.41 The oriented local structure isenergetically very unstable that it relaxes at very low tempera-tures, e.g., already at 0.5 Tg.
18 It should be noted that the axialstretching or shear-induced anisotropy in silicate glass is detect-able only by optical birefringence21,30 and not by nuclear mag-netic resonance (NMR).42
As shown in Fig. 4, the narrow high-strength distribution re-mains at a lower Ta and disappears at a higher Ta. This impliesthat the narrow high-strength distribution of continuous fiberscould arise from the existence of the optical birefringence. At
October 2010 Tensile Strength of Oxide Glass Fibers 3241

Ta40.7 Tg, the narrow high-strength distribution does not existany longer, because the structural anisotropy is nearly relaxed18
(Fig. 6). It is expected that the continuous basaltic fibers shouldhave a degree of structural anisotropy similar to that of thecontinuous E-glass fibers for comparable sax due to the similarglass systems, i.e., aluminosilicate. The optical birefringence(Dn) of the basaltic continuous fibers is not measurable usingthe present technique due to the rather limited optical transpar-ency of basaltic glasses.
From Fig. 6(a), a strong decoupling is observed between theanisotropy and the enthalpy relaxation for E-glass fibers with adiameter of about 9 mm. In other words, the anisotropy relax-ation starts at a much lower annealing temperature than theenthalpy relaxation. This decoupling is associated with thedifference in relaxation mechanism.18 The anisotropy relaxationis related, as the modifying ion motion, to local structural ar-rangements, whereas the enthalpy relaxation appears to be dom-inated by the relaxation of the silicate melt network. Theanisotropy relaxation occurs easier when the initial anisotropyof fibers is larger, i.e., the sax is larger. In other words, the largerthe anisotropy is, the more unstable is the orientated glass struc-ture, and hence the faster and easier the structure relaxes. In arecent study,43 the stress relaxation is contingent on the simul-taneous enthalpy relaxation in thick chalcogenide glass fibers(d5 400 mm). This implies that there is no decoupling betweenthe stress relaxation and the enthalpy relaxation for relativelythick fibers, i.e., the fibers with a low anisotropy. It would behighly interesting in the future to conduct a systematic studyabout the dependence of the extent of the decoupling on thefiber diameter, and hence on the sax.
From Fig. 6(b), it is observed that the enthalpy relaxationcurve of the wool fibers is slightly below that of the continuousfibers. This is attributed to the fact that the wool fibers haveundergone a faster cooling (B106 K/s) than the continuous fi-bers (B105 K/s), and hence the former have a higher excessenthalpy (DHtot) and a higher fictive temperature (Tf) than thelatter. Consequently, the excess enthalpy of the wool fibers re-laxes at a lower Ta than that of the continuous fibers.
All tensile strength tests were performed in an ambient at-mosphere, and hence interaction between fiber surfaces and hu-midity in the air could occur, and this could result in a decreasein the tensile strength. On the other hand, because of the sameambient conditions, the tensile strength data can be reasonablycompared between different types of fibers, and therefore themain conclusions drawn from this work are not influenced bythe surrounding conditions of measurements.
V. Conclusions
From E-glass and basaltic compositions, both continuous andwool glass fibers were drawn under similar conditions. All thefibers underwent tensile strength tests under ambient conditions.The results show that the tensile strength of the continuous fi-bers increases with a decrease of the fiber diameter, i.e., frombulk glass to the thick glass fibers (about 10–17 mm), and thenapproaches a plateau. However, the tensile strength of the woolfibers does not follow the diameter dependence of the tensilestrength of the continuous fibers. But when the strength is plot-ted against the sax, the strength data of the wool fibers beau-tifully fit the main trend of the continuous fibers. By consideringthe sax dependence of the optical birefringence, it is inferred thatthe structural anisotropy (or orientation) induced by the sax
plays an important role in determining the tensile strength of thecontinuous fibers. In addition, the defect orientation caused bythe sax contributes to the fiber strength as well.
By comparing the annealing-induced decay of the tensilestrength with both enthalpy relaxation and structural anisot-ropy relaxation, it is confirmed that the structural anisotropy isan important source of the higher strength of continuous glassfibers than the bulk glass of same composition. However, defectorientation, elevated fictive temperature, and surface homoge-
neities are also factors responsible for the higher strength of an-nealed glass fibers compared with bulk samples. Finally, therelative contributions of the above-mentioned factors to the fi-ber strength are estimated in terms of the tensile strength decayas a function of annealing temperature.
Acknowledgments
The authors thank R. von der Ohe, S. L. Jensen, S. Primdahl, and D. Lybye foruseful discussions. They also thank P. Nielsen for performing the tensile strengthtests.
References
1A. A. Griffith, ‘‘The Phenomena of Rupture and Flow in Solids,’’ Philos.Trans. R. Soc. London, 221, 163–98 (1921).
2F. O. Anderegg, ‘‘Strength of Glass Fibres,’’ Ind. Eng. Chem., 31, 290–8 (1939).3W. H. Otto, ‘‘Relationship of Tensile Strength of Glass Fibers to Diameter,’’
J. Am. Ceram. Soc., 38, 122–5 (1955).4R. E. Mould, ‘‘Crossbending Tests of Glass Fibers and the Limiting Strength of
Glass,’’ J. Appl. Phys., 29, 1263–4 (1958).5W. F. Thomas, ‘‘Strength of Glass Fibres,’’ Nature, 181, 1006 (1958).6G. M. Bartenev, ‘‘The Structure and Strength of Glass Fibers,’’ J. Non Cryst.
Solids, 1, 69–90 (1968).7A. Smekal, ‘‘Bruchtheorie spoder Korper,’’ Z. Phys. A, 103, 495–525 (1936).8G. M. Bartenev and L. K. Izmailova, ‘‘Nature of the High Strength and Struc-
ture of Glass Fibers,’’ Sov. Phys. Solid State, 6, 920 (1964).9W. H. Otto and F. W. Preston, ‘‘Evidence Against Oriented Structure in Glass
Fibers,’’ J. Soc. Glass Technol., 34, 63–8 (1950).10W. F. Thomas, ‘‘An Investigation of the Factors Likely to Affect the Strength
and Properties of Glass Fibres,’’ Phys. Chem. Glass, 1, 4–18 (1960).11D.-L. Kim and M. Tomozawa, ‘‘Fictive Temperature of Silica Glass Optical
Fibers—Re-Examination,’’ J. Non Cryst. Solids, 286, 132–8 (2001).12Y. Z. Yue, R. von der Ohe, and S. L. Jensen, ‘‘Fictive Temperature, Cooling
Rate, and Viscosity of Glasses,’’ J. Chem. Phys., 120, 8053–9 (2004).13N. M. Cameron, ‘‘Relation Between Melt Treatment and Glass Fiber
Strength,’’ J. Am. Ceram. Soc., 49, 144–8 (1966).14R. K. Brow, N. Lower, C. R. Kurkjian, and H. Li, ‘‘The Effects of Melt His-
tory on the Failure Characteristics of Pristine Glass Fibres,’’ Phys. Chem. Glasses,50, 31–3 (2009).
15G. Pahler and R. Bruckner, ‘‘Structural and Mechanical Properties of GlassFibers with Linear and Three Dimensional Network,’’ Glastechn. Ber., 58, 33–45(1985).
16J. Murach and R. Bruckner, ‘‘Structure-Sensitive Investigations on AlkaliMetasilicate Glass Fibers,’’ J. Non Cryst. Solids, 204, 282–93 (1996).
17V. V. Gur’ev, E. I. Neproshim, and G. E. Mostovoi, ‘‘The Effect of BasaltFiber Production Techology on Mechanical Properties of Fiber,’’ Glass Ceram.,55, 62–5 (2001).
18J. Deubener, Y. Z. Yue, H. Bornhoft, and M. Ya, ‘‘Decoupling BetweenBirefringence Decay, Enthalpy Relaxation and Viscous Flow in Calcium Boroal-umosilicate Glasses,’’ Chem. Geol., 256, 299–305 (2008).
19Y. Z. Yue, S. L. Jensen, and J. D. Christiansen, ‘‘Physical Aging in a Hyper-quenched Glass,’’ Appl. Phys. Lett., 81, 2983–5 (2002).
20W. Weibull, ‘‘A Statistical Theory on the Strength of Materials,’’ Ing-eniorsvetenskaps. Handlingar, 151, 1–46 (1939).
21M. Ya, J. Deubener, and Y. Z. Yue, ‘‘Enthalpy and Anisotropy Relaxation ofGlass Fibers,’’ J Am. Ceram. Soc., 91, 745–52 (2008).
22M. D. Lund and Y. Z. Yue, ‘‘Fractography and Tensile Strength of GlassWool Fibres,’’ J. Ceram. Soc. Jpn., 116, 841–5 (2008).
23ASTM International. Standard Practice for Reporting Uniaxial Strength Dataand EstimatingWeibull Distribution Parameters for Advanced Ceramics, C-1239-07.ASTM International, West Conshohocken, PA, 2007.
24Y. Z. Yue, ‘‘Influence of Physical Ageing on the Excessive Heat Capacity ofHyperquenched Silicate Glass Fibers,’’ J. Non Cryst. Solids, 348, 72–7 (2004).
25C. R. Kurkjian, P. K. Gupta, R. K. Brow, and N. Lower, ‘‘The IntrinsicStrength and Fatigue of Oxide Glasses,’’ J. Non Cryst. Solids, 316, 114–24 (2003).
26N. M. Cameron, ‘‘The Effect of Environment and Temperature on the Strengthof E-Glass Fibres. Part 2. Heating and Ageing,’’ Glass Technol., 9, 121–30 (1968).
27W. Vogel, Glass Chemistry, 2nd edition, Springer-Verlag, Berlin, 1994.28H. Rawson, ‘‘Internal Stresses Caused by Disorder in Vitreous Materials,’’
Nature, 171, 169 (1953).29S. M. Wiederhorn and L. H. Boltz, ‘‘Stress Corrosion and Static Fatigue of
Glass,’’ J. Am. Ceram. Soc., 53, 543–8 (1970).30H. Stockhorst and R. Bruckner, ‘‘Structure Sensitive Measurements on
E-Glass Fibers,’’ J. Non-Cryst. Solids, 49, 471–84 (1982).31M. Braun, Y. Z. Yue, C. Russel, and C. Jager, ‘‘Two-Dimensional Nuclear
Magnetic Resonance Evidence for Structural Order in Extruded PhosphateGlasses,’’ J. Non Cryst. Solids, 241, 204–7 (1998).
32C. Russel, ‘‘Oriented Crystallization of Glass. A Review,’’ J. Non Cryst.Solids, 219, 212–8 (1997).
33R. Bruckner, Y. Z. Yue, and J. Deubener, ‘‘Progress in Rheology of GlassMelts—A Survey,’’ Glass Sci. Technol., 70, 261–71 (1997).
34M. Thies and J. Deubener, ‘‘Onset of Non-Newtonian Flow of Foamed Soda-Lime-Silica Glasses,’’ Glass Technol., 43C, 43–5 (2002).
35R. Bruckner, ‘‘Anisotropic Glasses and Glass Melts—A Survey,’’ Glastechn.Ber. Glass Sci. Technol., 69, 396–411 (1996).
3242 Journal of the American Ceramic Society—Lund and Yue Vol. 93, No. 10

36Y. Z. Yue, C. Moisescu, G. Carl, and C. Russel, ‘‘Influence of the SuspendedIso- and Anisometric Crystals on the Flow of Fluroapatite Glass Ceramic DuringExtrusion,’’ Phys. Chem. Glass, 40, 243–7 (1999).
37M. D. Lund and Y. Z. Yue, ‘‘Influences of Chemical Aging on the SurfaceMorphology and Crystallization Behavior of Basaltic Glass Fibers,’’ J. Non Cryst.Solids, 354, 1151–4 (2008).
38Y. Z. Yue and A. Angel, ‘‘Clarifying the Glass-Transition Behaviour of Waterby Comparison with Hyperquenched Inorganic Glasses,’’ Nature, 427, 717–20(2004).
39H. Stolze, Glass: Nature, Structure and Properties. Spring-Verlag, Berlin, 1990.40W. F. Thomas, ‘‘An Investigation of the Factors Likely to Affect the Strength
and Properties of Glass Fibres,’’ Phys. Chem. Glass, 1, 4–18 (1960).
41Y. Z. Yue and R. Bruckner, ‘‘A New Description and Interpretation ofthe Flow Behaviour of Glass Forming Melts,’’ J. Non Cryst. Solids, 180, 66–79(1994).
42J. S. Wu, J. Deubener, J. F. Stebbins, L. Grygarova, H. Behrens, L.Wondraczek, and Y. Z. Yue, ‘‘Structural Response of a Highly Viscous Alum-inoborosilicate Melt to Isotropic and Anisotropic Compression,’’ J. Chem. Phys.,131, 104504, 9pp (2009).
43P. Lucas, E. A. King, Y. Gueguen, J. C. Sangleboeuf, V. Keryvin, R. G.Erdmann, G. Delaizir, C. Boussard-Pledel, B. Bureau, X. H. Zhang, and T.Rouxel, ‘‘Correlation Between Thermal and Mechanical Relaxation in Chalcog-enide Glass Fibers,’’ J. Am. Ceram. Soc., 92, 1986–92 (2009). &
October 2010 Tensile Strength of Oxide Glass Fibers 3243

Paper 4


Glass Technology: European Journal of Glass Science and Technology Part A Volume 51 Number 3 June 2010 97
Glass Technol.: Eur. J. Glass Sci. Technol. A, June 2010, 51 (3), 97–102
1. IntroductionStone wool fibres are attractive materials in many industrial applications due to their high mechanical performance to cost ratio (e.g. heat and sound insula-tion materials and as reinforcement materials). Basic understanding of how and why glass fibres break plays an important role in the application of glass fibres, as the primary limitation in their utilisation is their mechanical strength. The strength of the glass is not a material property of the glass, but a complex quantity depending on different factors such as thermal history, chemical composition, shape and size of the fibres, and their interaction with their surroundings. Thus, in order to fully understand the mechanical strength of glass fibres, all these factors need to be thoroughly explored.
Stone wool fibres are discontinuous, thin glass fibres. In nature, fibres of basaltic composition, called Pele’s Hair, can be found in Hawaii in areas with volcanic activity.(1–2) Manmade stone wool fibres are usually produced by a wheel centrifuge process known as cascade spinning(3) where droplets of melts are drawn into fibres by centrifugal forces. Advan-tages of basalt as a raw material for fibres are its large scale availability in nature and its fibre spinning ability. Compared to other glass fibre compositions, the basaltic composition contains a much higher iron content resulting in a brown or dark colour. A direct advantage of the elevated iron content is the increased thermal stability of stone wool fibres due to their strong crystallisation tendency. Hence, the stone
wool fibres are an excellent fire barrier.(4–6) Babcock and co-workers(7) showed that a high iron
content strongly influences the physical properties of silicate glasses such as viscosity, softening and liquidus temperatures. Only a few investigation have been performed into the physical properties, espe-cially mechanical properties, of silicate glass composi-tions with as high iron contents as basaltic glass (5–15 wt%). It is known that the redox states of iron also affect glass properties such as optical properties,(8) viscosity,(9–10) crystallisation behaviour,(11,12) thermal stability,(4) and elastic properties.(13,14) Mössbauer analyses of iron rich glasses show that variation in iron content has an impact on the glass structure.(15)
Despite many experiments, over more than five decades, to determine iron distribution and iron coordination in silicate glasses, numerous questions still remain unanswered. It is generally believed that in oxidized iron-bearing silicate glasses (Fe3+/ΣFe>50%, where ΣFe =Fe2++Fe3+) Fe3+ is predominantly in tetrahedral coordination(14,16,17) whereas in very reduced iron-bearing silicate glasses (Fe3+/SFe<30%) Fe3+ is in octahedral coordination.(16) The oxidation state of iron influences the polym-erisation degree of the glass network. The tetrahe-drally coordinated Fe3+ acts as a network former, and hence, increases the degree of polymerisation. In contrast, the octahedrally coordinated Fe3+ acts as a network modifier, and hence decreases the degree of polymerisation. The aim of the current work is to explore whether and how the oxidation state of iron influences the tensile strength of basaltic stone wool fibres.
Impact of the oxidation state of iron on the tensile strength of stone wool fibresMajbritt D. Lund, Yuanzheng Yue1
Section of chemistry, Aalborg University, DK-9000 Aalborg, Denmark
Dorthe LybyeRockwool International A/S, DK-2640 Hedehusene, Denmark
Manuscript received 8 December 2009Revision received 1 February 2010Manuscript accepted 4 February 2010
Stone wool samples of various chemical compositions and Fe3+/ΣFe ratios (=0·03–0·83) were produced using the cascade spinning method, and subsequently tested in uniaxial tension to obtain tensile strength data. The composition of the stone wool fibres resembled that of natural basalt. Stone wool fibres with the highest tensile strength were found in the most oxidised samples. An increase of the Fe3+/ΣFe ratio enhanced the tensile strength of the stone wool fibres when production conditions, e.g. total iron content, melting temperature and drawing atmosphere, were maintained constant. The Fe3+/ΣFe ratios of the stone wool fibres was controlled by the melting atmosphere and crucible materials. The origin of the increase in the tensile strength is discussed in terms of the relation of the oxidation state of iron both to melt homogeneity and to the glass structure.
1 Corresponding author. Email [email protected]

98 Glass Technology: European Journal of Glass Science and Technology Part A Volume 51 Number 3 June 2010
2. Experimental2. 1. Sample preparationTwo types of stone wool fibres were produced us-ing a cascade spinning process at laboratory scale. One type was produced from natural raw materials (basaltic rock from Obersheld in Germany), these are labelled ‘B’ (for basalt). The other type was produced from raw materials of pure oxide chemicals. These fibres were labelled with ‘C’ (for chemicals). Samples C have a composition similar to that of samples B. For preparation of samples C, all chemicals of ana-lytical grade were thoroughly mixed before melting. Oxides (SiO2, MgO, CaO, Fe2O3, TiO2 and Al2O3) and carbonates (Na2CO3) were used to obtain the chemical compositions given in Table 1.
The raw materials were melted in an electrical furnace (Hasle Isomax A/S, Denmark) in a platinum crucible of 90/10 Pt/Rh for 1 h at 1773 K. The differences in the oxidation state of the stone wool fibres were ob-tained by a two step melting procedure. After melting the raw materials in a Pt/Rh crucible, the resulting melt was transferred into in a pre-heated graphite crucible in order to reduce the melt. The reduction took place in an electric furnace at 1773 K for various time peri-ods ranging from 2–60 min. Upon fibre spinning, the melt was poured onto a centrifugal cascade spinning machine with three oppositely rotating wheels. The wool fibres were formed when droplets were thrown from the spinning wheels by centrifugal force. In the laboratory scale cascade spinning, no air stream was used to carry the fibres away from the spinning machine and no water or other additives were added during the spinning process.
Three types of industrial stone wool fibres (labelled ‘I’) were also studied. Sample I-3a contains relatively low iron, i. e. ΣFe~1 wt%, and was produced using a cupola furnace. Samples I-3b and c contain a stand-ard amount of iron ~6–8 wt% and were produced in a tank furnace and a cupola furnace, respectively. Like the samples produced at the laboratory scale, the industrial samples were prepared without sizing during the spinning process.
2.2. Sample characterisationBased on an automated analytical technique, diam-eters of 600–1800 individual fibres were measured using scanning electron microscopy (SEM) (Philips XL30 ESEM microscope) (see Table 2). Fibre diameters were obtained for volume fractions less than 16, 50 and 84%, which are referred to as d16, d50, and d84, respectively.
The chemical compositions of the stone wool fibres were measured using x-ray fluorescence (XRF) spec-troscopy. Measurements were performed on samples consisting of 0·5 g melted fibres and 6 g Li2B4O7 using the Philips PW1404 X-RAY Spectrometer except for sample C-82 which was analysed using a Philips PW2400 X-RAY Spectrometer. Before XRF measure-ments, all samples were sieved through a 250 μm mesh to remove all shots (glass droplets formed during the cascade spinning process). The chemical compositions of the samples are shown in Table 1. The total amount of iron in the samples (hereafter referred to as ΣFe) is given as Fe2O3.
Mössbauer spectroscopy was used to determine the Fe3+/ΣFe ratio in the stone wool samples using a conventional constant acceleration Mössbauer spec-trometer with a 57Co/Rh source. The spectrometer was calibrated with a 12·5 μm thick α-Fe foil, the recoil free fraction used in the Mössbauer measurements is 50–50 as described in detail by Helgason et al.(18) The error in the measurement is ±3%. The Mössbauer spectra showed doublets that were attributed to Fe2+ and Fe3+, respectively. There was no indication of metallic iron. Both types of doublets had broad lines reflecting distributions of isomer shifts and quadru-pole splitting in the amorphous materials. The lines were fitted with doublets described by Helgason et al. (18) The Fe3+/ΣFe ratios were estimated as the rela-tive area of the Fe3+ components, as the Debye–Waller factors for Fe2+ and Fe3+ at room temperature are very similar in amorphous silicates.
Tensile strengths of all the samples were meas-ured using a Raith Tensile Module for single fibres at a constant drawing speed of 0·1 μm/s. The single
Table 1. Chemical compositions of the basaltic stone wool fibres studied here. The compositions were measured using x-ray fluorescence (XRF). FeO* and Fe2O3* are calculated from the XRF and the Mössbauer measurements. The oxidation state of iron referred to in the text is given as Fe3+/ΣFe, where ΣFe = Fe3++Fe2+
Oxide wt% Samples B Samples C Industrial stone wool +/- B-41 B-17 B-30 B-5 B-3 C-82 C-64 C-31 I-3a I-3b I-3cSiO2 0·4 49·5 47·1 40·2 44·1 52·4 39·2 40·0 41·1 40·9 - 42·2Al2O3 0·3 14·4 15·3 18·2 19·3 15·5 19·6 19·7 19·9 20·7 - 18·5TiO2 0·1 2·0 1·6 1·6 1·6 2·1 2·1 1·7 1·6 0·4 - 1·8Fe2O3 0·2 12·9 12·2 8·3 7·2 8·6 8·0 7·8 7·2 1 - 5·8FeO* 6·8 9·1 5·2 6·2 7·7 1·3 2·5 4·5 0·9 - 0·3Fe2O3* 5·3 2·1 2·5 0·4 6·6 5·0 2·2 - 5·0CaO 0·2 6·9 7·3 18·8 16·5 7·1 20·8 20·3 19·8 31·8 - 16·9MgO 0·2 9·4 7·2 9·7 8·7 10·2 7·1 7·3 7·5 2·4 - 10·2Na2O 0·2 2·8 3·6 1·6 1·5 2·8 3·3 3·2 3·1 1·4 - 2·3K2O 0·1 1·1 0·9 0·7 0·8 1·1 0·1 0·1 0·1 0·4 - 1·1P2O5 0·1 0·7 0·4 0·1 0·4 <0·1 <0·1 <0·1 0·1 - 0·4MnO 0·1 <0·1 <0·1 <0·1 <0·1 <0·1 <0·1 <0·1 <0·1 0·6 - 0·3Fe3+/ΣFe 0·41 0·17 0·30 0·05 0·03 0·82 0·64 0·31 0·03 0·03 0·03
M. D. LunD et al: IMpact of the oxIDatIon state of Iron on the tensILe strength of stone wooL
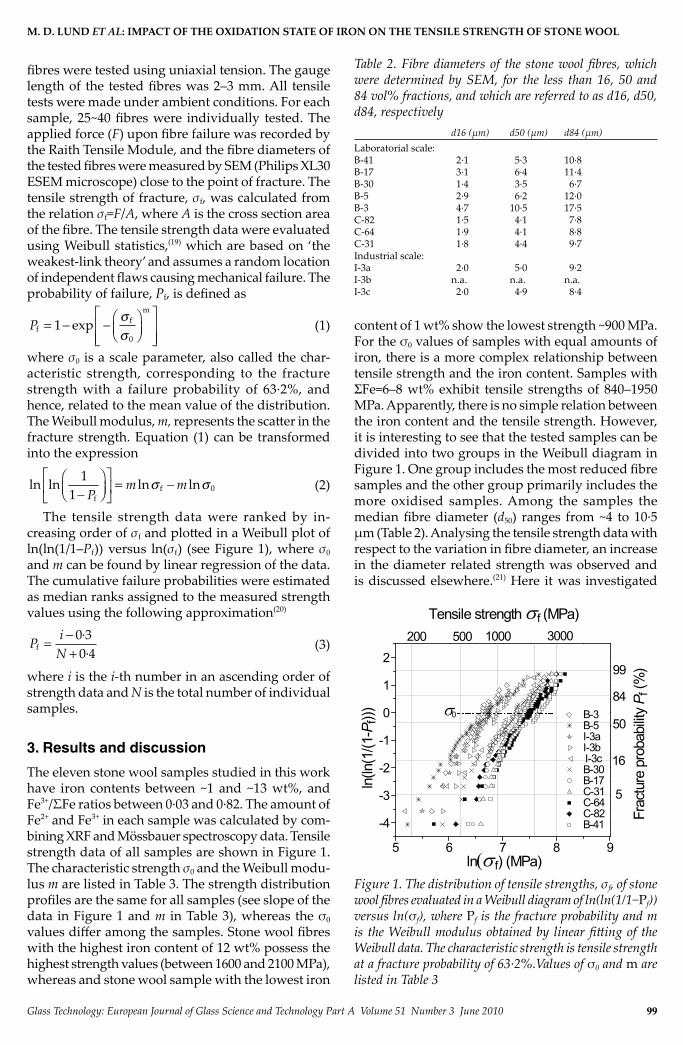
Glass Technology: European Journal of Glass Science and Technology Part A Volume 51 Number 3 June 2010 99
fibres were tested using uniaxial tension. The gauge length of the tested fibres was 2–3 mm. All tensile tests were made under ambient conditions. For each sample, 25~40 fibres were individually tested. The applied force (F) upon fibre failure was recorded by the Raith Tensile Module, and the fibre diameters of the tested fibres were measured by SEM (Philips XL30 ESEM microscope) close to the point of fracture. The tensile strength of fracture, σf, was calculated from the relation σf=F/A, where A is the cross section area of the fibre. The tensile strength data were evaluated using Weibull statistics,(19) which are based on ‘the weakest-link theory’ and assumes a random location of independent flaws causing mechanical failure. The probability of failure, Pf, is defined as
Pff
m
= - - ÊËÁ
ˆ¯
È
ÎÍÍ
˘
˚˙˙
10
exp ss
(1)
where σ0 is a scale parameter, also called the char-acteristic strength, corresponding to the fracture strength with a failure probability of 63·2%, and hence, related to the mean value of the distribution. The Weibull modulus, m, represents the scatter in the fracture strength. Equation (1) can be transformed into the expression
ln ln ln ln11 0-
ÊËÁ
ˆ¯
È
ÎÍ
˘
˚˙ = -
Pm m
ffs s (2)
The tensile strength data were ranked by in-creasing order of σf and plotted in a Weibull plot of ln(ln(1/1–Pf)) versus ln(σf) (see Figure 1), where σ0 and m can be found by linear regression of the data. The cumulative failure probabilities were estimated as median ranks assigned to the measured strength values using the following approximation(20)
P iNf =
-+0 30 4··
(3)
where i is the i-th number in an ascending order of strength data and N is the total number of individual samples.
3. Results and discussion
The eleven stone wool samples studied in this work have iron contents between ~1 and ~13 wt%, and Fe3+/ΣFe ratios between 0·03 and 0·82. The amount of Fe2+ and Fe3+ in each sample was calculated by com-bining XRF and Mössbauer spectroscopy data. Tensile strength data of all samples are shown in Figure 1. The characteristic strength σ0 and the Weibull modu-lus m are listed in Table 3. The strength distribution profiles are the same for all samples (see slope of the data in Figure 1 and m in Table 3), whereas the σ0 values differ among the samples. Stone wool fibres with the highest iron content of 12 wt% possess the highest strength values (between 1600 and 2100 MPa), whereas and stone wool sample with the lowest iron
content of 1 wt% show the lowest strength ~900 MPa. For the σ0 values of samples with equal amounts of iron, there is a more complex relationship between tensile strength and the iron content. Samples with SFe=6–8 wt% exhibit tensile strengths of 840–1950 MPa. Apparently, there is no simple relation between the iron content and the tensile strength. However, it is interesting to see that the tested samples can be divided into two groups in the Weibull diagram in Figure 1. One group includes the most reduced fibre samples and the other group primarily includes the more oxidised samples. Among the samples the median fibre diameter (d50) ranges from ~4 to 10·5 μm (Table 2). Analysing the tensile strength data with respect to the variation in fibre diameter, an increase in the diameter related strength was observed and is discussed elsewhere.(21) Here it was investigated
Table 2. Fibre diameters of the stone wool fibres, which were determined by SEM, for the less than 16, 50 and 84 vol% fractions, and which are referred to as d16, d50, d84, respectively d16 (µm) d50 (µm) d84 (µm)Laboratorial scale:B-41 2·1 5·3 10·8B-17 3·1 6·4 11·4B-30 1·4 3·5 6·7B-5 2·9 6·2 12·0B-3 4·7 10·5 17·5C-82 1·5 4·1 7·8C-64 1·9 4·1 8·8C-31 1·8 4·4 9·7Industrial scale:I-3a 2·0 5·0 9·2I-3b n.a. n.a. n.a.I-3c 2·0 4·9 8·4
Figure 1. The distribution of tensile strengths, σf, of stone wool fibres evaluated in a Weibull diagram of ln(ln(1/1−Pf)) versus ln(σf), where Pf is the fracture probability and m is the Weibull modulus obtained by linear fitting of the Weibull data. The characteristic strength is tensile strength at a fracture probability of 63·2%.Values of σ0 and m are listed in Table 3
M. D. LunD et al: IMpact of the oxIDatIon state of Iron on the tensILe strength of stone wooL
5 6 7 8 9
-4
-3
-2
-1
0
1
2200 30001000
5
16
50
84
Frac
ture
pro
babi
lity P
f (%
) Tensile strength σf (MPa)
ln(ln
(1/(1
-Pf))
)
lnσf) (MPa)
B-3 B-5 I-3a I-3b I-3c B-30 B-17 C-31 C-64 C-82 B-41
99
500
σ0

100 Glass Technology: European Journal of Glass Science and Technology Part A Volume 51 Number 3 June 2010
whether the variation in strength observed in Figure 1 was caused by the large variation in fibre diameters among the tested samples. To do so, Equation 1 was extended to the expression
P VVf
fm
= - -ÊËÁ
ˆ¯
È
ÎÍÍ
˘
˚˙˙
10 0
exp ss
(4)
where V is the tested fibre volume, which involves both the variation in gauge length and fibre diameter. The diameter variation is the controlling factor of the tested volume and hence tested fibre volume represents the diameter variation.(21) σ0 and V0 are scaling parameters. Rearranging Equation (4) leads to the expression
ln ln ln ln11-
ÊËÁ
ˆ¯
È
ÎÍ
˘
˚˙ = ( ) + ( ) -
Pm V C
ffs (5)
where C is a constant involving the scaling param-eters, i.e. C=mln(σ0)–ln(V0). Figure 2 shows the tensile strength data of the stone wool fibres, which are obtained by considering the diameter-strength rela-tionship through Equation (5). It is evident that dif-ferences in fibre diameter among the tested samples exert only a slight influence on the position of data points of the samples, whereas the overall separation of the samples into two groups regarding the tensile strength is not affected by the diameter differences. Hence, the grouping of the tensile strength data results from other factors than the diameter variation of the stone wool fibres.
In Figure 3, the data of Figure 2 is scaled to a standard volume of 100000 μm3 and plotted against Fe3+/ΣFe to describe the relation between the volume scaled characteristic tensile strength σ0v and the de-gree of oxidation of iron. From the figure, it is seen that tensile strength of the stone wool fibres increases with an increase in the oxidation state of iron. This tendency can be approximately described by a linear function with a correlation factor of R2=0·93 (see the dashed line). The possible origin of this tendency
might be attributed to the following reasons. Fe3+ acts a role as network forming ion, whereas Fe2+ predomi-nantly plays a role as a network modifying ion. This is due to the fact that the Fe3+–O bond is stronger than the Fe2+–O bond. Thus, an increase in Fe3+/ΣFe makes the glass network stronger, and hence, more capable of resisting the propagation of the cracks originating from the glass surface. To quantitatively illustrate the consequence of the increase of Fe3+/ΣFe on the glass structure, the number of bridging oxygens per tetrahedron (BO/T) is calculated using the method suggested by Mysen.(10) The results are displayed in Figure 4, showing that BO/T, i.e. the degree of the
Table 3. Weibull parameters of all samples obtained from linear fits of the strength data in Figure 1. σ0 is the characteristic strength taken at the failure probability of 63·2%; m is Weibull modulus representing the slope of the strength distribution. The correlation factor (R2) represents the quality of fit σ0 [MPa] m R2
Laboratory scale:B-41 2070 2·8 0·95B-17 1610 2·9 0·92B-30 1430 2·6 0·98B-5 880 2·1 0·97B-3 840 2·6 0·87C-82 1760 2·8 0·99C-64 1950 2·5 0·97C-31 1700 3·4 0·94Industrial scale:I-3a 920 2·5 0·96I-3c 1390 2·1 0·97I-3d 1020 2·9 0·96
Figure 2. Consideration of the effect of the fibre diameter differences among the fibres on the tensile strength data. A Weibull diagram of ln(ln(1/1–Pf)) is plotted against ln(σfV) based on Equation (5), where V is the tested fibre volume. m’ is the Weibull modulus obtained by considering the diameter effect. The characteristic volume scaled tensile strength (σ0v) can be found by defining standard volume, i.e. 100000 µm3 and subsequent reading the value at Pf=63·2%
Figure 3. Dependence of the volume scaled characteristic strength (σ0v) on the iron oxidation state expressed as Fe3+/ΣFe in the basaltic stone wool samples. The standard volume is taken as the average tested volumes of all stone wool fibres of the study, 100000 µm3
M. D. LunD et al: IMpact of the oxIDatIon state of Iron on the tensILe strength of stone wooL
16 17 18 19 20
-4
-3
-2
-1
0
1
2 I-3aB-3I-3cI-3bB-5B-30
5
16
50
84
Frac
ture
pro
babi
lity, P
f (%
)
ln(ln
(1/(1
-Pf))
)
ln(σf [MPa] V [µm2])
C-31B-17B-41C-64C-82
99Increased Fe3+/ΣFe
σ0V0
0 20 40 60 80 1000
500
1000
1500
2000
2500
Tens
ile s
treng
th σv
(M
Pa)
Fe3+/ΣFe
Stone wool fibres
I-3aI-3b&c
B-3 B-5
B-30
C-31B-17 B-41
C-64C-82

Glass Technology: European Journal of Glass Science and Technology Part A Volume 51 Number 3 June 2010 101
network polymerisation, increases with increasing Fe3+/ΣFe.
In a recent study of continuous basalt fibres,(22) it is reported that the tensile strength of those fibres is enhanced by an increase in Al2O3, i.e. by an increase in the degree of network polymerisation due to the glass forming role of Al2O3.(22) The structural role of Fe3+ might to some extent be similar to that of Al3+ regard-ing the increase of the tensile strength of basaltic stone wool fibres. As reported in literature, the presence of the iron in glass even leads to the occurrence of local ordering around iron in the glass structure,(23,24) or iron clustering like (Fe3O12)16− species.(25) Phosphate glass fibres, where a cluster of (Fe3O12)16− connects two phosphate tetrahedra to form a pyrophosphate group, exhibit exceptional high strengths of 6 GPa.(24) According to Bingham et al,(24) a strong local structural ordering around Fe3+ is present in silicate glasses. Very recently, Mössbauer spectroscopic measure-ments demonstrated a sextet band due to the strongly Fe3+–O bonded groups in silicate glasses.(26) In this context, groups of Fe3+ tetrahedra should exist in the glass systems studied in this work, strengthening the glass structure, and consequently enhancing the tensile strength of stone wool fibres.
In spite of the significant role of Fe3+ in enhancing the tensile strength of stone wool fibres, other factors influencing the tensile strength should be considered. One of those factors is the homogeneity of glass melts, particularly of the stone wool melts. This is an important factor influencing the tensile strength of the fibres. However, the samples studied in this work were not prepared by systematically varying the melting conditions prior to the fibre spinning, e.g. homogenisation temperature and time, and crucible materials used for melting. Therefore, it is hard to quantify the influence of those factors on the tensile strength of stone wool fibres. An inhomogeneous melt refers to the melt containing defects like striae
and micro bubbles. When the melt is cooled down, these defects remain in the solidified glass, and are potential sources of fracture. Another factor is that chemical compositions are different among the sam-ples although they are close to basaltic compositions. These chemical differences can lead to a variation in both the degree of polymerisation and in the bonding strength of glass network, and hence, to a change in the tensile strength. In addition, the chemical differ-ences result in variations in the viscosity of the melt prior to fibre spinning, and hence, variations in melt homogeneity. As mentioned above, the latter affects the tensile strength of the fibres.
However, from Figure 3 it is obvious that the change of tensile strength of the fibres is associated with that of the oxidation state of iron. In order to define the role of each of the above mentioned factors, systematic experiments are necessary for detecting the changes of the tensile strength of the stone wool fibres, e.g. by homologous substitution of chemi-cal components, or by regularly varying the redox condition of melting, and the melt homogenisation temperature and time. Here it should be noted that there is no evidence for a correlation between other compositional variations (except for variations in redox state) and the tensile strength of the glass fibres studied in the present work. In the future, a tensile strength study on a homologous compositional series (based on basaltic composition) would be interesting for exploring the influence of an individual compo-nent on the tensile strength of fibres.
4. Conclusions
Stone wool fibres with a broad range of different Fe3+/ΣFe ratios were produced and analysed with respect to the tensile strength. The Fe3+/ΣFe ratios of the stone wool fibres were determined by the melt-ing atmosphere and crucible materials. It was found that the oxidation state of the iron exerts a consider-able impact on the tensile strength of the fibres. The general tendency is that an increase in the Fe3+/ΣFe ratios enhances the tensile strength. To a large extent, this tendency could be attributed to the role of Fe3+ in strengthening glass structure. However, other factors such as melt homogeneity prior to fibre spinning and chemical variation of the samples should be taken into account when evaluating the tensile strength data of stone wool fibres in the future.
Acknowledgements
The authors thank Maria Augustesen and Hans Peter Jensen for help with the sample preparation, Pia Nielsen for the tensile strength tests, and Winni Krøes for diameter analyses. They also thank Svend Mørup for Mössbauer analyses. This work was financially supported by Rockwool International A/S.
Figure 4. For stone wool samples with similar amounts of iron (ΣFe) the degree of polymerisation of the glass net-work is expressed as the number of bridging oxygens per tetrahedra (BO/T) as a function of Fe3+/ΣFe
M. D. LunD et al: IMpact of the oxIDatIon state of Iron on the tensILe strength of stone wooL
0 20 40 60 80 1003.15
3.20
3.25
3.30
3.35
I-3b
B-5
C-31
C-64
BO/T
Fe3+/ΣFe
C-82
102 Glass Technology: European Journal of Glass Science and Technology Part A Volume 51 Number 3 June 2010
References 1. Potuzak, M., Dingwell, D. B. & Nichols, A. R. I. Hyperquenched
subarial Pele’s hair glasses from Kilauea Volcano, Hawaii. Geophys. Res. Abstr., 2006, 8, 157.
2. Katsura, T. Pele’s hair as a liquid of Hawaiian tholeiitic basalts. Geo-chem. J., 1967, 1, 157–68.
3. Axten, C. W., Bauer, J. F., Boymel, P. M. et al. Man-made vitreous fibres: nomenclature, chemical and physical properties. TIMA, 1993, 1–70.
4. Kaasgaard, M., Jacobsen P. A. L. & Yue, Y. Z. High-temperature behaviour of stone wool. J. Dan. Ceram. Soc., 2004, 1, 12–15.
5. Nielsen, E. R., Augustesen, M. & Sthål, K. Devitrification and high temperature properties of mineral wool. Mater. Sci. Forum, 2007, 558–9, 1255–60.
6. Yue, Y. Z., Korsgaard, M., Kirkegaard, L. F. & Heide, G. Formation of a nanocrystalline layer on the surface of stone wool fibres. J. Am. Ceram. Soc., 2009, 92, 62–7.
7. Babcock, C. L., Silverman, W. B., Close, P. et al. Effect of iron oxide on properties of soda-dolomite-lime-silica glass. J. Am. Ceram. Soc., 1942, 25, 401–8.
8. Schofield, P. F., Cressey, G. H., & Henderson, C. M. B. Origin of colour in iron and manganese-containing glasses investigated by synchrotron-radiation. Glass Technol., 1995, 36 (3), 89–94.
9. Dingwell, D. B. & Virgo, D. The effect of oxidation state on the viscosity of melts on the system Na2O–FeO–Fe2O3–SiO2. Geochim. Cosmochim. Acta.,1987, 51, 195–205.
10. Mysen, B. O. Developments in Geochemistry, Structure and Properties of Silicate Melts; Elsevier, The Netherlands, 1988, pp. 354.
11. Karamanov, A., Pisciella, P., Cantalini, C. & Pelino, M. Influence of Fe3+/Fe2+ ratio on the crystallisation of iron-rich glasses made with industrial wastes. J. Am. Ceram. Soc., 2000, 83, 3153–7.
12. Karamanov, A. & Pelino, M. Crystallisation phenomena in iron-rich glasses. J. Non-Cryst. Solids, 2001, 281, 139–51.
13. Burkard, D. J. M. Elastic properties of alkali silicate glasses with iron oxide: Relation to glass structure. Solid State Commun., 1997, 101, 903–7.
14. Burkhard, D. J. M. Iron-bearing silicate glasses at ambient conditions.
J. Non-Cryst. Solids, 2000, 275, 175–88. 15. Romero, M., Rincón, J. M., Mûsik, S. & Kozhukharov, V. Mössbauer
effect and x-ray distribution function analysis in complex Na2O–CaO–ZnO–Fe2O3–Al2O3–SiO2 glasses and glass-ceramics. Mater. Res. Bull., 1999, 34, 1107–15.
16. Virgo, D. & Mysen, B. O. The structural state of iron in oxidised vs. reduced glasses at 1 atm: a 57Fe Mössbauer study. Phys. Chem. Miner., 1985, 12, 65–76.
17. Mysen, B. O. & Richet, P. Iron-bearing melts. Silicate Glasses and Melts: Properties and Structure. Developments in Geochemistry. Edited by B. O. Mysen & P. Richet, 2005 Elsevier Science, Amsterdam, 2005, Vol. 10, 291–356.
18. Helgason, Ö., Steinthorsson, S. & Mørup, S. The ferric/ferrous ratio in basalt melts at different oxygen pressures. Hyperfine Interact., 1989, 45, 287–94.
19. Weibull, W. A statistical theory on the strength of materials. Ingeniors-vetenskapsakademiens Handlingar, 1939, 151, 1–46.
20. Faucher, B. & Tyson, W. R. On the determination of Weibull param-eters. J. Mater. Sci. Lett., 1988, 7, 1199–203.
21. Lund, M. Tensile strength of glass fibres. Aalborg University press, Denmark, 2010, pp. 1-130.
22. Gutnikov, S. I., Malakho, A. P., Lazoryak, B. I. & Loginov, V. S. Influ-ence of alumina on the properties of continuous basalt fibres. Russian J. Inorg. Chem., 2009, 54, 191–6.
23. Bingham, P. A., Parker, J. M., Searle, T., Williams, J. M. & Fyles, K. Redox and clustering of iron in silicate glasses. J. Non-Cryst. Solids., 1999, 253, 203–9.
24. Bingham, P. A., Parker, J. M., Searle, T. M. & Smith, I. Local structure and medium range ordering of tetrahedrally coordinated Fe3+ ions in alkali–alkaline earth–silica glasses. J. Non-Cryst. Solids. 2007, 353, 2479–94.
25. Marasinghe, G. K., Karabulut, M., Ray, C. S. et al. Structural features of iron phosphate glasses. J. Non-Cryst. Solids., 1997, 222, 144–52.
26. Smedskjaer, M. M., Yue, Y. Z., Deubener, J. & Gunnlaugsson, H. P. Correlation between alkaline earth diffusion and fragility of silicate glasses. J. Phys. Chem. B, 2009, 113, 11194–200.
M. D. LunD et al: IMpact of the oxIDatIon state of Iron on the tensILe strength of stone wooL


ISBN 978-87-90033-74-3
Majbritt D. Lund Tensile strength of glass fibres