aalborg universitet triclosan removal in wastewater treatment processes chen, xijuan
TRANSCRIPT

Aalborg Universitet
Triclosan removal in wastewater treatment processes
Chen, Xijuan
Publication date:2012
Document VersionEarly version, also known as pre-print
Link to publication from Aalborg University
Citation for published version (APA):Chen, X. (2012). Triclosan removal in wastewater treatment processes. Aalborg Universitet: Sektion forBioteknologi, Aalborg Universitet.
General rightsCopyright and moral rights for the publications made accessible in the public portal are retained by the authors and/or other copyright ownersand it is a condition of accessing publications that users recognise and abide by the legal requirements associated with these rights.
? Users may download and print one copy of any publication from the public portal for the purpose of private study or research. ? You may not further distribute the material or use it for any profit-making activity or commercial gain ? You may freely distribute the URL identifying the publication in the public portal ?
Take down policyIf you believe that this document breaches copyright please contact us at [email protected] providing details, and we will remove access tothe work immediately and investigate your claim.
Downloaded from vbn.aau.dk on: januar 11, 2019

PhD thesis – ‘Triclosan removal in wastewater treatment processes’ – Xijuan Chen
1
Preface and acknowledgements
This dissertation is submitted in partial fulfillment of the requirements for obtaining the
degree of Doctor of Philosophy (PhD). The dissertation consists of an introduction, a
summary of project results with related literature and 8 supporting papers.
This PhD project was carried out at the Department of Biotechnology, Chemistry and
Environmental Engineering, Aalborg University during the period December 2008 to
November 2012, partly at the xenobiotic group, Department of analytical chemistry,
University of Duisburg-Essen and partly at the Department of Environmental Science,
Aarhus University. This PhD project has been financially supported by Danish Research
Council for Technology and Production (FTP) which is gratefully acknowledged. The
ozonation study was supported by German Federal Ministry of Economics and
Technology within the agenda for the promotion of industrial cooperative research and
development (IGF) based on a decision of the German Bundestag. The sludge reed bed
study was supported by ProInno/AIF.
I want to heartily thank my supervisors, Jeppe Lund Nielsen and Kai Bester, for their
patient guidance, supports and helps for these four years. They have supervised, taught,
inspired and motivated me through hundreds of meetings and intensive discussions.
This work would not have been succeeded without the help from many people in
Denmark, Germany and China. I would like to thank Mr. Stefen Rehfus and Udo Pauly
from Eko-Plant GmbH for their collaboration and support as well as Thomas Groß and E.
Pieper for sampling in the reed bed sludge treatment study. Great thanks to Elke Dopp,
Jochen Tuerk and Jessica Richard for their collaboration and valuable scientific inputs
in the triclosan ozonation study. I acknowledge my colleagues in xenobiotic group of

PhD thesis – ‘Triclosan removal in wastewater treatment processes’ – Xijuan Chen
2
University Duisburg-Essen for their support, discussion and cooperation. A special
thanks to everybody in the Environmental Biotechnology group at Aalborg University
and in the Department of environmental science of Aarhus University for the warm
atmosphere and encouragement. All contributions and help are greatly appreciated.
Finally, thanks with all my heart to my family – their supports, advice and love always
make me enjoy studying here in the far away country and give me motivations to bring
success home.
November 2012
Xijuan Chen

PhD thesis – ‘Triclosan removal in wastewater treatment processes’ – Xijuan Chen
3
Table of Contents
Preface and acknowledgements .................................................................................. 1
Table of Contents .......................................................................................................... 3
Abstract.......................................................................................................................... 4
Resumé (Abstract in Danish) ....................................................................................... 5
List of supporting papers ............................................................................................. 6
Introduction ................................................................................................................... 7
1. Triclosan: Usage and characterization .................................................................. 7
2. Fate of triclosan in wastewater treatment plants ................................................. 10
3. Occurrence of triclosan in the environment ......................................................... 12
4. Risks of triclosan in the environment ................................................................... 13
5. Transformation of triclosan in the environment .................................................... 14
6. Objectives of the study ........................................................................................ 17
7. Technologies to remove triclosan after classical activated sludge treatment
process ...................................................................................................................... 18
7.1 Ozonation treatment process (for wastewater) ............................................. 18
7.2 Sludge reed bed treatment process (for sludge) ........................................... 20
Project conclusions .................................................................................................... 23
Future perspectives .................................................................................................... 29
References ................................................................................................................... 30

PhD thesis – ‘Triclosan removal in wastewater treatment processes’ – Xijuan Chen
4
Abstract
Triclosan is an antimicrobial agent which is widely used in household and personal care
products. Widespread use of this compound has led to the elevated concentrations of
triclosan in wastewater, wastewater treatment plants (WWTPs) and receiving waters. To
investigate the occurrence and fate of triclosan in the environment, analytical methods
for the quantification of triclosan in wastewater, sludge and deposit were developed.
The fate of triclosan in a wastewater treatment plant (biological degradation, 19%;
sorption to sludge, 61%; input into the receiving surface water, 20%) was detected
during a field study. From the laboratory-scaled experiment biodegradation products
such as 2,4-dichlorophenol, 4-chlorocatechol, triclosan-methyl, monohydroxy-triclosan,
dihydroxy-triclosan and triclosan O-sulfate have been identified. In an enrichment
culture originated from activated sludge, Methylobacillus was identified as one of the
active triclosan degraders.
Furthermore, two technologies have been studied for further removal of triclosan in
wastewater and sludge. Complete removal of triclosan from wastewater could be
achieved by using ozone and more than 95% removal of triclosan from sludge could be
found by using reed bed sludge treatment process.

PhD thesis – ‘Triclosan removal in wastewater treatment processes’ – Xijuan Chen
5
Resumé (Abstract in Danish)
Triclosan er et bakteriehæmmende middel, som ofte anvendes i husholdningsprodukter
og produkter til personlig pleje. Den store anvendelse af stoffet har ført til forhøjede
koncentrationer af triclosan i spildevand, rensningsanlæg og vandmiljøet nær udløb fra
rensningsanlæg. For at undersøge triclosans forekomst og skæbne i naturen, blev der
udviklet analytiske metoder til kvantificering af triclosan i spildevand, slam og
sedimenter. Triclosans skæbne i et spildevandsanlæg (biologisk nedbrydning, 19%,
absorbtion i slam, 61%, udledning til det modtagende vandmiljø, 20%) blev målt som en
del af et feltstudie. I laboratorie eksperimenter er nedbrydningsprodukter såsom 2,4-
dichlorphenol, 4-chlorocatechol, triclosan-methyl, monohydroxy-triclosan, dihydroxy-
triclosan og triclosan O-sulfat efter biologisk nedbrydning blevet identificeret. I en
beriget kultur, der stammede fra aktivt slam, blev Methylobacillus identificeret som en af
de, der aktivt nedbryder triclosan.
Desuden er to efterbehandlings-teknologier til at fjerne yderligere triclosan fra
spildevand og slam blevet undersøgt. Fuldstændig fjernelse af triclosan fra spildevand
kunne opnås ved hjælp af ozon og mere end 95% fjernelse af triclosan fra slammet kan
undersøges ved anvendelse af en rodzone slam behandlingsproces.

PhD thesis – ‘Triclosan removal in wastewater treatment processes’ – Xijuan Chen
6
List of supporting papers
Paper 1: Chen XJ., Pauly U., Rehfus S. and Bester K. Personal care compounds in a
reed bed sludge treatment system, Chemosphere 76 (2009) 1094–1101
Paper 2: Chen XJ., Pauly U., Rehfus S. and Bester K. Removal of personal care
compounds from sewage sludge in reed bed container (lysimeter) studies — Effects
of macrophytes, Science of the Total Environment 407 (2009) 5743–5749
Paper 3: Chen XJ. and Bester K. Determination of organic micro-pollutants such as
personal care products, plasticizer and flame retardants in sludge, Anal Bioanal
Chem (2009) 395:1877–1884
Paper 4: Bester K., Chen XJ., Pauly U. and Rehfus S. Abbau von organischen
Schadstoffen bei der Kläschlammbehandlung in Pflanzenbeeten, Korrespondenz
Abwasser, Abfall 58 (2011) 1050-1157
Paper 5: Chen XJ., Nielsen JL., Furgal K., Liu YL., Lolas IB. and Bester K. Elimination
of triclosan and formation of methyl-triclosan in activated sludge under aerobic
conditions, Chemosphere 84 (2011) 452–456
Paper 6: Chen XJ., Richard J., Dopp E., Türk J., Liu YL. and Bester K. Ozonisation
products of triclosan in advanced wastewater treatment, Water Research 46 (2012)
2247-2256
Paper 7: Lolas IB., Chen XJ., Bester K. and Nielsen JL. Identification of triclosan
degrading bacteria using stable isotope probing and microautoradiography.
Microbiology 158 (2012) 2805-2814
Paper 8: Chen XJ., Wimmer R., Ternes T., Schlüsener M., Nielsen JL. and Bester K.
Biodegradation of triclosan and Formation metabolites in activated sludge under
aerobic conditions. Manuscript in preparation

PhD thesis – ‘Triclosan removal in wastewater treatment processes’ – Xijuan Chen
7
Introduction
1. Triclosan: Usage and characterization
Triclosan (2,4,4´-trichloro-2´hydroxydiphenylether) is a synthetic, lipid-soluble, broad
spectrum antimicrobial agent which was first introduced in the health care industry in
1972 and since 1985 as a compound added to toothpaste in Europe (Joens et al., 2000).
It is also referred as Irgasan, DP300, FAT 80’023, CH 3565, and GP 41-353 in a
number of toxicology studies. It is a chlorinated organic compound with functional
groups representative of both ethers and phenols (Table 1). At normal room
temperature, triclosan appears as a white to off-white crystalline powdered solid with a
slight aromatic odor and is slightly soluble in water but readily soluble in most organic
solvents due to its physicochemical properties which are shown in Table 1.
Triclosan has a specific mechanism to inhibit bacteria activity, i.e. by inhibiting the
enoyl-acyl carrier reductase enzyme to block the lipid synthesis, which is necessary for
cell reproduction, and therefore prevents the bacteria from synthesizing new fatty acids
and thereby stop building cell membranes as well as reproducing (McMurry et al., 1998;
Heath et al., 1999).

PhD thesis – ‘Triclosan removal in wastewater treatment processes’ – Xijuan Chen
8
Table 1. Physico-chemical parameters of triclosan (MS Search v2.0; EPI Suit 4.0).
Molecular structure
Chemical name 2,4,4’-trichloro, 2’-hydroxy-diphenylether
Chemical abstracts service
registry (CAS) number
3380-34-5
Synonyms 5-chloro-2-(2,4-dichlorophenoxy)phenol
Trade names Irgasan; CH 3565, Irgasan CH 3565, Irgasan DP300, Ster-Zac, Tinosan
AM110 Antimicrobial, Invasan DP 300R, Invasan DP 300 TEX,
Irgaguard_RB 1000, VIV-20, Irgacare MP, Lexol 300, Cloxifenolum,
Aquasept, Gamophen, Vinyzene DP 7000, Vinyzene SB- 30, Sanitized
Brand, Microbanish R, Vikol THP, Ultra-Fresh, Microban Additive “B”, and
AerisGuard.
Molecular formula C12H7Cl3O2
Molecular weight 290 g/mol
Vapour pressure 0.00062 Pa
Water solubility 4621 μg/L
Boiling point 373.62 °C
log Kow 4.2-4.76
log Koc 4.265
pKa 7.9
It is known that triclosan in lower concentrations is recognized as bacteriostatic
(Champlin et al., 2005), while it becomes bactericidal in higher concentrations (Suller
and Russell, 2000; Russell, 2004). According to the results from Jones et al. (2000),
O
Cl
Cl
C l
OH

PhD thesis – ‘Triclosan removal in wastewater treatment processes’ – Xijuan Chen
9
personal care products which contain 1% of triclosan offers the ideal balance of
antimicrobialeffectiveness and mildness for use in high-risk, high-frequency
handwashing health care settings. It has shown to be highly active against some
microorganisms, such as Staphylococcus, Streptococcus and Mycobacterium (Levy et
al., 1999), as well as some fungi and protozoa (i.e. Plazmodium falciparium,
Toxoplasma gonidii) (Yazdankhah et al., 2006). Effectiveness of triclosan is also based
on the fact that it can stay on the skin for 12 hours after applied and continues killing
bacteria (Glaser, 2004).
In 1965, triclosan was produced by the specialty chemical company “Ciba” in
Switzerland (Levy et al., 1999) and then was introduced into personal care products in
the USA as an ingredient in deodorants and hand soaps. Due to the bactericidal
property and the chemical stability, triclosan became popular as an antimicrobial
substance in a wide range of applications and the demand of it has been growing
rapidly in the last 40 years (Fiss et al., 2007).
Nowadays, triclosan is used in 140 different types of consumer products including liquid
hand soap, shower gels, hand lotions, toothpaste, mouthwashes, deodorants, as well as
in the treatment of textiles and in plastic manufacture such as towels, mattresses,
toothbrushes, phones, kitchenware and plastic food containers, shoes, clothing and
children´s toys (Levy et al., 1999; Fiss et al., 2007). Triclosan has also been used in
hospitals and medical products to control bacteria and the spread of disease (Bhargava
et al., 1996; Singer et al., 2002).
In the European Union (EU), about 85% of the total amount of triclosan is used in
personal care products, compared to 5% in textiles and 10% in plastics and food

PhD thesis – ‘Triclosan removal in wastewater treatment processes’ – Xijuan Chen
10
contact materials (SCCP/1192/08, 2009). The quantity used within the EU reached
approximately 450 tons (as 100% active) in the year 2006 (SCCP/1192/08, 2009).
2. Fate of triclosan in wastewater treatment plants
Widespread use of triclosan provides a number of pathways to enter the wastewater
and finally reach the wastewater treatment plants (WWTPs). Triclosan has been
detected in the influent of WWTPs in concentrations from ng/L to μg/L (Table2). In
WWTPs using activated sludge as secondary treatment process, about 42-99% removal
was detected. The ways of elimination of triclosan in WWTPs include mineralization,
transformation by oxidation or reduction and sorption to sludge (Latch, 2003; Bester,
2003, 2005; Yu et al., 2006). In fact, both biodegradation and sorption to activated
sludge may explain the removal fate of triclosan in WWTPs.
Although triclosan is an bactericidal compound to many bacteria or fungi, some
microorganisms are resistant to triclosan and even able to use it as a sole carbon
source. In a continuous activated sludge system study in which the influent level of
triclosan was increased from 40 μg/L to 2000 μg/L, removal of triclosan exceeded 98.5%
(Federle et al., 2002). Similarly, Stasinakis et al. (2007) have reported that more than 90%
removal of triclosan was detected in two continuous-flow activated sludge systems with
received triclosan concentration in 500-2000 μg/L. Increasing levels of triclosan
concentration had no major adverse on wastewater treatment process, including
chemical oxygen demand, biological oxygen demand and ammonia removal (Federle et
al., 2002).

PhD thesis – ‘Triclosan removal in wastewater treatment processes’ – Xijuan Chen
11
Table 2. Fate of triclosan in different WWTPs.
Country Inflow
concentration
(ng/L)
Effluent
concentration
(ng/L)
Sludge (ng/g
DW)
Removal
rate
Literature/Source
USA 670-5115 40-1117 79-97% Thompson et al., 2005
4700 1600 70 60 30000 11000 98 1% Heidler and Halden, 2007
3800-16600 200-2700 500-15600 96% McAvoy et al., 2002
18850 1036 515 95% Kumar et al., 2010
13703 180 566 99% Kumar et al., 2010
86161 5370 1611 94% Kumar et al., 2010
32639 274 795 99% Kumar et al., 2010
453-4530 36-212 - 92-97% Buth et al., 2011
China 142 16.5 22.5 1.4 - 84% Wu et al., 2007
Germany 1200 80 51 8 1200 130 95-96% Bester, 2003
7300 1500 300 100 - >95% Bester, 2005
4800 550 620 1500 - 87% Bester, 2005
Japan 2680 262 19496 90% Nakada et al., 2010
11890 269 - 98% Nakada et al., 2010
Switzerland 600-1300 11-98 - 94% Singer et al., 2002
500-1300 70-650 - 44-92% Lindström et al., 2002
Australia 586-805 23-434 90-16790 72-93% Ying and Kookana, 2007
In WWTPs about 30-50% of the triclosan could be recovered in sludge as triclosan is
relatively lipophilic with log Kow of 4.2-4.8 and log Koc of 4.3 (Bester, 2003, 2005;
Coogan et al., 2007; Heidler and Halden, 2007; Kumar et al., 2010; Nakada et al., 2010).

PhD thesis – ‘Triclosan removal in wastewater treatment processes’ – Xijuan Chen
12
On the other hand, this means that most removal occurs due to biodegradation
processes (Heidler and Halden, 2007; Kumar et al., 2010; Nakada et al., 2010).
Due to the incomplete removal triclosan has also been found in the effluent of WWTPs
in concentrations of 11-1117 ng/L, whereas typical concentrations of triclosan in sludge
were 0.5-30 ng/g dry weight (DW) (Table 2).
3. Occurrence of triclosan in the environment
The widespread use and incomplete removal of triclosan in WWTPs provides a number
of pathways to enter the environment. Previous reports described triclosan as one of the
most commonly encountered substances in solid and water environmental
compartments (Lindström et al., 2002; Singer et al., 2002; Wilson et al., 2003). The
chemical properties of triclosan indicate that it may also bioaccumulate and persist in
the environment, and laboratory tests have shown it to be toxic to aquatic species, with
algae being one of the most sensitive species (Chlamydomonas, Scenedesmus,
Navicula, Synedra ) (Wilson et al., 2003).
Lindström et al. (2002) has detected that the concentrations for triclosan in lakes and a
river in Switzerland were up to 70 ng/L. Whereas the concentrations of triclosan in the
river Ruhr in Germany was ranged from <3 to 10 ng/L (Bester, 2005). Andresen et al.
(2007) has reported that the concentration of triclosan were around 20 ng/L in Hamilton
Harbor and approximately 1 ng/L in Lake Ontario. Wilson et al. (2009) have found an
average water column concentration of 3 2 ng/L in the lower Hudson River Estuary.
Urban wastewater discharge and industrial activities are identified as the main source

PhD thesis – ‘Triclosan removal in wastewater treatment processes’ – Xijuan Chen
13
for triclosan as high values up to 11-98 ng/L were found in the rivers receiving WWTPs
effluents (Bester, 2005).
Triclosan can partition to sewage sludge during wastewater treatment and subsequently
transfer to soil when applied to land. High concentrations of triclosan were found in a
field receiving biosolid in land application (Langdon et al., 2012). Furthermore, triclosan
has also been detected at concentrations of 5-27 ng/g in marine sediments of Barker
Inlet, South Australia (Fernandes et al., 2011).
In addition, several studies report that triclosan have been detected with 25-2444 ng/g
in the indoor air, which is supposed to be associated with volatilization of liquid personal
care products and diffusion from textiles and other materials treated with triclosan as
bactericide (Canosa et al., 2007; Fan et al., 2010).
4. Risks of triclosan in the environment
Considering triclosan has been detected in environment compartments discussed in last
subchapter, there is a potential risk of adverse effects in aquatic, terrestrial environment
and humans.
Ricart et al. (2010) has reported that triclosan affect both bacterial and algal
communities, indicating that the potential environment risk of triclosan is high especially
in rivers where water scarcity results in low dilution. Delorenzo et al. (2007) has
suggested that triclosan shows low toxicity risk but high potential for chronic and
sublethal effects to estuarine organisms. Lin et al. (2012) has reported that triclosan
may have potential biochemical and genetic toxicity toward earthworms (Eisenia fetida).
Considering the PNEC (Predicted No-Effect Concentration, 7ng/L) and NOEC (No
Observed Effect Concentration, 700 ng/L) values of triclosan (Thompson et al., 2005),

PhD thesis – ‘Triclosan removal in wastewater treatment processes’ – Xijuan Chen
14
the risk should be more related to chronic effect (due to the bioaccumulation) than acute
impact.
In soils, triclosan has been shown to increase dehydrogenase activity (Ying et al., 2007),
and to affect microbial respiration rates (Waller and Kookana, 2009; Butler et al., 2011).
The study of Butler et al. (2011) suggests that triclosan inhibits soil respiration but a
subsequent acclimation of the microbial community occurs.
Due to the widespread use of triclosan, there is potential for humans to receive
exposure, and in fact, triclosan has been detected in human milk (Adolfsson-Eric et al.,
2002; Toms et al., 2011), urine (Sandborgh-Englund et al., 2006; Queckenberg et al.,
2010) and plasma (Hovander et al., 2002; Sandborgh-Englund et al., 2006), indicating
that the human body can be influenced by an individual use of triclosan containing
products. It is known that triclosan in lower concentrations may disrupt thyroid function
and therefore be recognized as bacteriostatic (Champlin et al. 2005). Guo et al. (2012)
has reported that triclosan inhibits adipocyte differentiation of human mesenchyme stem
cells under concentrations that are not cytotoxic and in the range (0.1-8.1 μg/L,
Sandborgh-Englund et al., 2006) observed in human blood. Additionally, triclosan has
also been linked to a range of health effects, such as skin irritation, allergy susceptibility,
liver and inhalation toxicity (Coogan et al., 2007).
5. Transformation of triclosan in the environment
Triclosan have triggered an increasing concern for several decades all over the world. It
is toxic, last for a long time in the environment, and may travel long distances far from
their sources of usage, release and emission. Under the aerobic condition normally
present in the sub-surface layers of water, triclosan is expected to undergo primarily

PhD thesis – ‘Triclosan removal in wastewater treatment processes’ – Xijuan Chen
15
photodegradation and biodegradation (Tixier et al., 2002, Bester, 2005). Triclosan can
give derivatives which can be more persistent and more toxic than the parent compound.
Furthermore, triclosan and its transformation products can accumulate in fatty tissues of
living organism leading to undesirable effect to ecosystem and the human body.
Photodegradation is the dominant degradation pathway for triclosan in surface waters.
Tixier et al. (2002) found that direct phototransformation accounted for 80% of the
observed total elimination of triclosan from the lake within two months. Degradation
products such as chlorophenol, dichlorophenol and dioxin derivatives have been
identified (Tixier et al., 2002; Ferrer et al., 2004; Aranami and Readman, 2007; Wong-
Wah-Chung et al., 2007; Chen et al., 2008; Son et al., 2009). The degradation products
were formed also under environmental conditions in wastewater matrices, thus
suggesting their presence in real wastewater treatment process and environmental
aquatic systems (Ferrer et al., 2004). Half-life of triclosan photodegradation in the air is
about 1 day (Halden and Paull, 2005).
Biodegradation of triclosan has also been described by several investigators. Its half-life
is calculated as 11 days in surface water (Bester, 2005), 18-107 days in sludge
amended soil (Lozano et al., 2010; Ying et al., 2007; Wu et al., 2009; Waria et al., 2011),
18-78 days in the silty clay loam (Waria et al., 2011; Kookana et al., 2011) and 421 days
in the fine sand (Waria et al., 2011) depending on the initial concentration and the
environmental factors (Stasinakis et al., 2007). Under these conditions, triclosan-methyl
has been reported as the most often occurring transformation product, which presents a
greater potential for bioaccumulation than triclosan due to its log kow 5.0 (Balmer et al.,
2004; Waria et al., 2011).

PhD thesis – ‘Triclosan removal in wastewater treatment processes’ – Xijuan Chen
16
Triclosan-methyl was detected in various aquatic environments such as WWTPs, lakes
and rivers (McAvoy et al. 2002; Lindström et al. 2002). Although the concentrations of
triclosan-methyl were very low in surface waters with less than 1 ng/L (Balmer et al.
2004), it is bio-accumulating to a high extent, and causes currently the dominating peak
when analyzing lipophilic pollutants in fish from urban waters. The concentrations of
triclosan-methyl were up to 35 ng/g (wet weight) and up to 365 ng/g on a lipid basis in
the fish collected in Switzerland (Balmer et al., 2004). Additionally, occurrence of
triclosan-methyl was detected at concentrations <11 ng/g in marine sediments of Barket
Inlet, South Australia, which was linked to both wastewater discharges and biological
methylation of triclosan (Fernandes et al., 2011).
Biodegradation products such as hydroxycompounds (monohydroxy-triclosan and
dihydroxy-triclosan) and the ether bond cleavage products (4-chlorophenol and 2,4-
dichlorophenol) have been reported by Kim et al., (2010) and Wu et al. (2010). Veetil et
al. (2012) have found that triclosan could be biodegraded under aerobic, anaerobic and
anoxic conditions and phenol, catechol and 2,4-dichlorophenol were among the
products.
Sonochemical degradation of triclosan in urban runoff and wastewater influent has been
investigated by Sanchez-Prado et al. (2008) and suggesting a fast and complete
conversion of triclosan without accompanied toxic by-products. Levy et al. (1999) found
that under exposure to ozone the antibacterial activity of triclosan is derived primarily
from its phenol ring, via van der Waals and hydrogen-bonding interactions with the
bacterial enoyl-acyl carrier reductase enzyme.

PhD thesis – ‘Triclosan removal in wastewater treatment processes’ – Xijuan Chen
17
Furthermore, there are reports that suggest incineration of textile products containing
triclosan may result in the formation of dioxin-like substances (NICNAS, 2009).
6. Objectives of the study
Considering there is a severe lack of knowledge on the fate of triclosan in the
environment, i.e. 1) by which process and in which part of the treatment plants is
triclosan removed and 2) by which process is triclosan-methyl generated, 3) to what
compounds is triclosan biodegraded and 4) are there some treatment technologies
which can prevent the emission of triclosan to the environment. The primary goal for this
project was to address these issues.
1) The fate of triclosan in WWTPs was investigated through establishing a complete
mass balance of triclosan in single process step analysis in a selected wastewater
treatment plant.
2) The formation as well as the mass balance of triclosan-methyl was measured in the
same wastewater treatment plant.
3) The biodegradation of triclosan was analysed through laboratory-scale experiments
by using activated sludge bioreactors under aerobic, anaerobic and anoxic
conditions.
4) Two treatment technologies were involved in this study.
The incomplete removal of triclosan in WWTPs leading to undesirable discharges of
triclosan residuals to surface water. Thus experiment on ozonisation of triclosan was
carried out to determine the removal rate and transformation products, as well as to
assessing the potential of ozonisation as a post-treatment technology in elimination
of triclosan in full-scale treatment plant.

PhD thesis – ‘Triclosan removal in wastewater treatment processes’ – Xijuan Chen
18
Moreover, due to the high partition rate of triclosan to sewage sludge during
wastewater treatment and high concentrations of triclosan in the field receiving
sludge in land application, removal of triclosan in reed bed sludge treatment
technology has been investigated. The goal of the study was to investigate how
triclosan and other personal care products (PCPs) were removed and how the
different conditions such as temperature, oxygen concentration, macrophytes may
affect the triclosan removal in sludge reed beds.
7. Technologies to remove triclosan after classical activated sludge
treatment process
7.1 Ozonation treatment process (for wastewater)
As conventional wastewater treatment processes are unable to act as a reliable barrier
concerning triclosan, it is discussed to introduce additional advanced treatment
technologies in the areas where a persistent pollution problem has been recognized or
anticipated. Ternes et al. (2003) and Ikehata et al. (2008) have evaluated different
technologies including ozonation and advanced oxidation processes, membrane
bioreactor, membrane filtration and activated carbon adsorption, suggesting that
chemical oxidation using ozone is a highly effective treatment process for a wide
spectrum of emerging organic pollutants, including pesticides, pharmaceuticals,
personal care products, surfactants, microbial toxins and natural fatty acids.
Ozone (O3) is a very powerful disinfecting and deodorizing gas. The ability of ozone to
disinfect polluted water was recognized in 1886 by de Meritens (Laurie and Gilmore,
2008). However, the widespread introduction of ozone in drinking water treatment

PhD thesis – ‘Triclosan removal in wastewater treatment processes’ – Xijuan Chen
19
started in the 1960s (Landlais et al., 1991). For a long time ozone has been used in
removal of bacteria, vira, algae and fungi as well as sulfur, thus also in eliminating taste
and odor problems, as well as in oxidizing and mineralizing organic chemicals (Landlais
et al., 1991). Nowadays ozonation followed by granular activated carbon filtration is
already a standard method for the treatment of raw surface water to produce drinking
water.
However, the experience gained in the drinking water area can also be used in applying
the method to wastewater treatment. Ozonation has recently emerged as an important
technology for the oxidation and destruction of a wide range of organic pollutants in
wastewater (Ikehata et al., 2006). It has been proven to be an effective post-treatment
technique for pharmaceuticals and personal care products (Carballa et al., 2007; Ikhata
et al., 2008; Wert et al., 2009). Figure 1 show an ozone reactor connected to a sand
filter installed after the biological treatment step at the Wüeri WWTP in Regensdorf,
Switzerland. Substances reacting fast with ozone, i.e. most of the micropollutants were
brought to concentrations below the detection limit by an ozone dose of 0.47 g O3/g
DOC (dissolved organic carbon) (Hollender et al., 2009; Zimmermann et al., 2011).

PhD thesis – ‘Triclosan removal in wastewater treatment processes’ – Xijuan Chen
20
Figure 1. Configuration of the Wüeri WWTP in Regensdorf, Switzerland which has implemented an ozone treatment process. Ozone was produced from liquid oxygen and injected into the existing, but modified flocculation reactor between secondary clarifier and sandfiltration.
Moreover, Suarez et al. (2007) reported that nearly 100% of triclosan depletion was
achieved for a 4 mg/L O3 dose applied to a wastewater containing 7.5 mg/L of DOC,
while Wert et al. (2009) reported that >95% triclosan removal was independent of water
quality when the O3 exposure ( O3 dt) was measurable (0-0.8 mg min/L).
7.2 Sludge reed bed treatment process (for sludge)
Sewage sludge (also referred to biosolids) has been used as fertilizer on agricultural
land because of its high content of phosphorous and nitrogen (Fytili and Zabaniotou,
2008). This usage of sludge is controversial because of its high content of xenobiotics
and heavy metals (Fytili and Zabaniotou, 2008). In 2005 ca. 10 million tons (dry matter)
of sludge were produced by sewage treatment plants in Europe, of which approximately
37% of that was used in agriculture (Fytili and Zabaniotou, 2008). Currently sludge in
PhD thesis – ‘Triclosan removal in wastewater treatment processes’ – Xijuan Chen
21
urban regions is usually stabilised for 10-40 days in anaerobic digesters. However, for
rural regions another method of sludge stabilisation has been developed, in which the
sludge is treated for about ten years by reed beds to dewater and detoxify the sludge.
The reed bed treatment plant is different to conventional dry beds and sludge polders
with a new type technology, as
A) The reed beds are equipped with Phragmites australis reeds, which influence the
dewatering, and further stabilisation and the sanitizing of the sewage sludge.
B) The treatment process takes place in dedicated beds, which are separated from
the soil and the ground water by polyethylen foil (PE) to prevent the
contamination of the soil and groundwater (Pauly et al., 2006).
Reed beds facilities typically consist of several (often 7-10) beds (Figure 2). Each reed
bed is lined with a drainage system to enhance the dewatering of the sludge. The
leached water is then pumped back into the wastewater treatment plant. The sludge is
pumped straight onto the beds throughout the year in pre-determined quantities and at
preset intervals. Depending on plant design, the capacity of the beds is exhausted after
6-12 years (Nielsen, 2003). After a resting phase of approximately one year, the
individual beds are cleared and are then available again for a fresh loading cycle.
Reed beds for sludge dewatering and mineralization offer an economically attractive
alternative to pressure dewatering and centrifugation. Their primary advantages is that
they are simple in design and operation, require low manpower (Cooper et al., 2004)
and suitable for field or forest application as fertilizer as processed sludge residue
complies with agriculture standards (Nielsen and Willoughby, 2007). Nowadays reed
beds have been built in many European countries (Haber et al., 1995; Cooper et al.,

2004) an
cost and
treating
treatmen
breaking
Gustavs
Figure 2.
covering
PhD thesis
nd in the U
d low conta
wastewate
nt of sludge
g down orga
sson et al.,
. Reed bed
20,400 m2 (
– ‘Triclosan
USA (Kim an
amination m
er (Cooper e
e, true reed
anic matter
2007).
facility loca
(outlined in r
removal in wa
nd Cardena
method cons
et al., 1999
d beds hav
r and increa
ated in Kalka
red).
astewater trea
as, 1990). T
sidering su
9, Wood et
ve been ap
asing the de
ar-Hönnepel
atment proce
They have
spended so
al., 2007, Z
pplied in res
ensity of slu
l, Germany.
sses’ – Xijuan
been cons
olids and B
Zhao et al.,
spect of re
udge (Niels
It is consis
n Chen
idered as a
BOD5 remov
, 2008). Fo
educing volu
sen, 2003, 2
ting 7 reed
22
a low
val in
or the
ume,
2005,
beds

PhD thesis – ‘Triclosan removal in wastewater treatment processes’ – Xijuan Chen
23
Project conclusions
This study was carried out to fill the gap in knowledge concerning the biodegradation
and emission of triclosan in WWTPs and further removal of triclosan after the WWTPs.
Full scale study (unpublished): In the case study of Aabybro WWTP, 77% of triclosan
was removed by the WWTP, which is relatively low due to the low influent concentration.
The WWTP was chosen because it has separated denitrification and nitrification
process, to detect the removal of triclosan and formation of triclosan-methyl under
different conditions. During the treatment process, approximate 23% of the triclosan
was emitted to the environment by effluent water; 57% of the triclosan was adsorbed to
sludge particles and approximate 20% was biodegraded, in which approximate 5%
triclosan transformed into triclosan-methyl as shown in Figure 3. Most of the
transformation process (triclosan to triclosan-methyl) occurred in the nitrification process
under aerobic conditions. The sorption on sludge contributed significantly to triclosan
removal.

PhD thesis – ‘Triclosan removal in wastewater treatment processes’ – Xijuan Chen
24
2.02 g/d100% 0.4 g/d
20%
1.23g/d
61%
305.2 g/d
302.3 g/d
319.2 g/d 85.27 g/d
83.01 g/d
234.9 g/d
1. screen 2. grit and fat removal tank 3. primary sedimentation tank4. Denitrification tanks 5. Nitrification tanks 6. secondary sedimentation tank7. effluent 8. thinkner 9. anaerobic digester10. sludge treatment 11. sludge recirculation 12. excess sludge
1 2 3 4 56
7
11
12
8910
Figure 3. Mass balance of triclosan in Aabybro WWTP.
Laboratoty mechanistic study (published in paper 5 and 7): In static unfed laboratory-
scale activated sludge reactors under aerobic conditions within 7 days, the removal
rates (pure biodegradation) of triclosan were relatively lower (75-86%) when the starting
concentration was low ( 0.5 mg L-1), and reached higher values (>99%) when the
starting concentration was high ( 1 mg L-1), while less removal was observed under
anaerobic and anoxic conditions. The tentative half-life of triclosan degradation in
sludge reactor under aerobic conditions was estimated to be 54-86 hours. One percent
of the triclosan was converted to triclosan-methyl under aerobic conditions, less under
anoxic (nitrate reducing) and none under anaerobic conditions. Under aerobic
conditions, 10% of triclosan could be recovered in sludge (paper 5) and 7% was
transformed into 2,4-dichlorophenol (paper 8). More transformation products such as 4-

PhD thesis – ‘Triclosan removal in wastewater treatment processes’ – Xijuan Chen
25
chlorocatechol, monohydroxy-triclosan, dihydroxy-triclosan and triclosan O-sulfate have
been identified (Figure 4) (paper 8). In an enrichment culture originated from activated
sludge, Methylobacillus was identified as one of the active triclosan degraders by using
DNA based stable isotope probing (DNA-SIP) combined with microautoradiography-
fluorescence in situ hybridization (MAR-FISH) (paper 7).
O
OH
Cl
Cl
Cl
OH
OH
Cl
OH
Cl
Cl
O
OH
Cl
Cl
ClOH
O
OH
Cl
Cl
Cl(OH)2
O
O
Cl Cl
ClCH3
triclosan
4-chlorocatechol 2,4-dichlorophenol
dihydroxy-triclosan
monohydroxy-triclosan
Triclosan-methyl
O
Cl
Cl
Cl
OS
O
OH
O
triclosan O-sulfate
Figure 4. Proposed biodegradation pathway of triclosan.
Ozonisation study (published in paper 6): Contamination of surface water and ground
water with triclosan is an emerging issue in environment due to the incomplete removal
of triclosan in WWTPs. Additional ozonation treatment technology could be used for
triclosan removal in drinking water, wastewater and surface water. The treatment
process can remove triclosan completely and convert it into the products: 2,4-
dichlorophenol, chlorocatechol, monohydroxy-triclosan and dihydroxy-triclosan (paper

PhD thesis – ‘Triclosan removal in wastewater treatment processes’ – Xijuan Chen
26
6). Increasing the ozone amounts in the reactions leads to decreased concentration of
triclosan as well as its oxidation by-products, proving ability to remove triclosan by
ozone treatment technology (Figure 5). The transformation product 2,4-dichlorophenol
shows lower genotoxic effects than triclosan at the tested concentrations, but this
compound is classified to be toxic to aquatic organisms. The other transformation
products cannot be assessed up to now.
0 2 4 6 8 10 12 14 16 18 20 22 24 26 28 30 32 34Time (min)
20000000
40000000
60000000
80000000
20000000
40000000
60000000
80000000
20000000
40000000
60000000
80000000
Relativ
eAbu
ndance
20000000
40000000
60000000
80000000
2min
4min
5min
10min
O
OH
Cl
Cl
Cl
Transformation products
Figure 5. Chromatograms of samples by adding ozone into triclosan solution for 2, 4, 5 and 10
minutes measured by GC/MS.
Reed bed study (published in paper 1, 2, 3, 4). The reed bed sludge treatment study
showed that the reed bed sludge treatment technology is able to reduce persistent
organic pollutant such as bis(2-ethylhexyl) phthalate (DEHP), triclosan, and 1-(2,3,8,8-
tetramethyl-1,2,3,4,5,6,7,8-octahydro-naphthalen-2-yl) ethan-1-one (OTNE) significantly.
In thirteen months of reed bed sludge treatment process, the concentrations of some

PhD thesis – ‘Triclosan removal in wastewater treatment processes’ – Xijuan Chen
27
compounds such as OTNE, triclosan, and DEHP in this sludge reed bed treatment were
decreased. However, concentrations of other compounds such as polycyclic musk
compounds 1,3,4,6,7,8-hexahydro-4,6,6,7,8,8-hexamethylcyclopenta-(g)-2-benzopyran
(HHCB) and 7-acetyl-1,1,3,4,4,6 hexamethyl-1,2,3,4 tetrahydronaphthalene (AHTN) did
not change during this experiment. OTNE and triclosan degraded faster in the bottom
layer while DEHP degraded faster in the top layer, which indicates different regimes in
the different layers and different degradation processes in the respective layers (Figure
6) (paper 1, 2 and 4).
0
500
1000
1500
2000
2500
3000
Jun, 06
Aug, 06
Sep, 06
Oct, 06
Nov, 06
Jan, 07
Feb, 07
Mar, 07
Apr, 07
May, 07
Jun, 07
Jul, 07
top layer
middle layer
bottom layer
conc
entra
tion
(ng
g-1dm
)
Figure 6. Concentration of triclosan during the experiment period in top layer (0-20 cm from
surface), middle layer (20-40 cm from surface) and bottom layer (40-60 cm from surface) of the
reed beds. Error bars are from the stated uncertainty from the method development.

PhD thesis – ‘Triclosan removal in wastewater treatment processes’ – Xijuan Chen
28
Considering half-lives of 300 to 900 days, this sludge reed bed can remove more than
95% of triclosan in its 10 years production cycle. If the sludge is to be used as fertilizer
in agriculture the use of reed bed treatments can help considerably to decrease the
contamination of sludge. An accounting of material flows in addition showed that only a
small fraction (<1%) of the target substances was washed out (leached) with the effluent
and the uptake of personal care products into the biomass of the macrophytes can also
be neglected.

PhD thesis – ‘Triclosan removal in wastewater treatment processes’ – Xijuan Chen
29
Future perspectives
In WWTPs using activated sludge as secondary treatment process, most of the removal
occurred due to the adsorption and biodegradation in the activated sludge treatment
process. In this study biodegradation of triclosan and formation of metabolites have
been investigated in laboratory-scaled experiment. However, identification of the
metabolites in real WWTPs is strongly needed. Further studies to address
bioaccumulation and toxicity of the metabolites will also be required.
Based on the available data, a significant part of triclosan in wastewater is expected to
be removed by WWTPs, the residues could be removed by additional ozonation
technology. Further research could be focused on assessment of the oxidation capacity
of a full-scale ozonation step after the secondary wastewater effluent. Investigation on
oxidation of micropullutant as well as formation and removal of byproducts will be
necessary.
Regarding the results from the reed bed sludge treatment process, more than 95% of
triclosan is expected to be removed after 10 years life cycle. Further research could also
be conducted to determine the effectiveness of reed bed technology on other organic
micropollutants and the byproducts.

PhD thesis – ‘Triclosan removal in wastewater treatment processes’ – Xijuan Chen
30
References
Adolfsson-Erici M., Pettersson J., Paekkonen J. and Sturve J. (2002) Triclosan, a
commonly used bactericide found in human milk and in the aquatic environment in
Sweden. Chemosphere 46, 1485-1489
Andresen JA., Muir D., Ueno D., Darling C., Theobald N. and Bester K. (2007)
Emerging pollutants in the north sea in comparison to lake ontario data. Environ.
Toxicol. Chem. 26, 213–221
Aranami K. and Readman JW. (2007) Photolytic degradation of triclosan in freshwater
and seawater. Chemosphere 66, 1052-1056
Australian Government, Department of Health and Ageing (NICNAS) (2009) Triclosan.
Priority existing chemical assessment report No.30, P 35, 109
Balmer ME., Poiger T., Droz C., Romanin K., Bergqvist PA., Müller MD. and Buser HR.
(2004) Occurrence of methyl triclosan, a transformation product of the bactericide
triclosan, in fish from various lakes in Switzerland. Environ. Sci. Technol. 38, 390-
395
Bester K. (2003) Triclosan in a sewage treatment process – balances and monitoring
data. Water Res. 37,3891-3896
Bester K. (2005) Fate of triclosan and triclosan-methyl in sewage treatment plants and
surface waters. Arch. Environ. Contam. Toxicol. 49, 9-17
Bhargava HN. and Leonard RA. (1996) Triclosan: applications and safety. Am. J. Infect.
Control. 24, 208–218

PhD thesis – ‘Triclosan removal in wastewater treatment processes’ – Xijuan Chen
31
Buth JM., Ross MR., McNeill K. and Arnold WA. (2011) Removal and formation of
chlorinated triclosan derivatives in wastewater treatment plants using chlorine and
UV disinfection. Chemosphere 84, 1238-1243
Butler E., Whelan MJ., Ritz K., Sakrabani R. and van Egmond R. (2011) Effects of
Triclosan on Soil Microbial Respiration. Environ. Toxicol. Chem. 30, 360-366
Carballa M., Manterola G., Larrea L., Ternes T., Omil F. and Lema JM. (2007) Influence
of ozone pre-treatment on sludge anaerobic digestion: Removal of pharmaceutical
and personal care products. Chemosphere 67, 1444–1452
Champlin FR., Ellison ML., Bullard JW. and Conrad RS. (2005) Effect of outer
membrane permeabilisation on intrinsic resistance to low triclosan levels in
Pseudomonas aeruginosa. Int. J. Antimicrob. Ag. 26, 159-164
Chen ZL., Song QJ., Cao GQ. and Chen YF. (2008) Photolytic degradation of triclosan
in the presence of surfactants. Chemi. Pap. 6, 608–615
Canosa P., Perez-Palacios D., Garrido-Lopez A., Tena MT., Rodriguez I., Rubi E. and
Cela R. (2007) Pressurized liquid extraction with in-cell clean-up followed by gas
chromatography-tandem mass spectrometry for the selective determination of
parabens and triclosan in indoor dust. J of Chromatogra A 1161, 105-112
Coogan MA., Edziyie RE., La Point TW. and Venables BJ. (2007) Algal bioaccumulation
of triclocarban, triclosan, and methyl-triclosan in a North Texas wastewater
treatment plant receiving stream. Chemosphere 67, 1911–1918

PhD thesis – ‘Triclosan removal in wastewater treatment processes’ – Xijuan Chen
32
Cooper, P., Griffin, P., Humphries, S. and Pound, A. (1999) Design of a hybrid reed bed
system to achieve complete nitrification and denitrification of domestic sewage.
Water Sci. Technol. 40, 283-289
Cooper P. and Willoughby N. (2004) The use of reed-beds for sludge drying. 7th
CIWEM/AquaEnviro Conference on Biosolids and Organic Residuals, Wakefield,
Nov.2002
DeLorenzo ME., Keller JM., Arthur CD., Finnegan MC., Harper HE., Winder VL. and
Zdankiewicz DL. (2007) Toxicity of the Antimicrobial Compound Triclosan and
Formation of the Metabolite Methyl-Triclosan in Estuarine Systems. Environ. Toxicol.
23, 224-232
Fan XH., Kubwabo C., Rasmussen P. and Jones-Otazo H. (2010) Simultaneous
quantitation of parabens, triclosan, and methyl triclosan in indoor house dust using
solid phase extraction and gas chromatography-mass spectrometry. J Environ.
Monitor. 12, 1891-1897
Federle TW., Kaiser SK. and Nuck BA. (2002) Fate and effects of triclosan in activated
sludge. Environ. Toxicol. Chem. 21, 1330-1337
Fernandes M., Shareef A., Kookana R., Gaylard S., Hoare S. and Kildea T. (2011) The
distribution of triclosan and methyl-triclosan in marine sediments of Barker Inlet,
South Australia. J. Environ. Monitor. 13, 801-806
Ferrer I., Mezcua M., JoséGómez M., Thurman EM., Agüera A., Hernando MD. and
Fernández-Alba AR. (2004) Liquid chromatography/time-of-flight mass spectrometric
PhD thesis – ‘Triclosan removal in wastewater treatment processes’ – Xijuan Chen
33
analyses for the elucidation of the photodegradation products of triclosan in
wastewater samples. Rapid Commun. Mass Spectrom. 18, 443-450
Fiss EM., Rule KL. and Vikesland PJ. (2007) Formation of Chloroform and other
chlorinated byproducts by chlorination of triclosan-containing antibacterial products.
Environ. Sci. Technol. 41, 2387-2394
Fytili, D. and Zabaniotou, A. (2008) Utilization of sewage sludge in EU application of old
and new methods - A review. Renew. Sust. Energ. Rev. 12, 116-140
Glaser, A. (2004) The Ubiquitous Triclosan. Beyond Pesticides 24, 12-17
Guo LW., Wu QG., Green B., Nolen G., Shi LM., LoSurdo J., Deng HL., Bauer S., Fang
JL. and Ning BT. (2012) Cytotoxicity and inhibitory effects of low-concentration
triclosan on adipogenic differentiation of human mesenchymal stem cells. Toxicol.
Appl. Pharm. 262, 117-123
Gustavsson L., Hollert H., Jönsson S., van Bavel B. and Engwall M. (2007) Reed Beds
Receiving Industrial Sludge Containing Nitroaromatic Compounds. Environ. Sci.
Pollut. R. 14, 202 – 211
Haberl R., Perfler R. and Mayer H. (1995) Constructed wetlands in Europe. Water Sci.
Technol. 32, 305-315
Halden RU. and Paull DH. (2005) Co-Occurrence of Triclocarban and Triclosan in U.S.
Water Resources. Environ. Sci. Technol. 39, 1420-1426

PhD thesis – ‘Triclosan removal in wastewater treatment processes’ – Xijuan Chen
34
Heath RJ., Rubin JR., Holland DR., Zhang EL., Snow ME. and Rock CO. (1999)
Mechanism of triclosan inhibition of bacterial fatty acid synthesis. J. Biol. Chem. 274,
11110-11114
HeidlerJ. and Halden RU. (2007) Mass balance assessment of triclosan removal during
conventional sewage treatment. Chemosphere 66, 362-369
Hollender J., Zimmermann SG., Koepke S., Krauss M., McArdell CS., Ort C., Singer H.,
von Gunten U. and Siegrist H. (2009) Elimination of Organic Micropollutants in a
Municipal Wastewater Treatment Plant Upgraded with a Full-Scale Post-Ozonation
Followed by Sand Filtration. Environ. Sci. Technol. 43, 7862-7869
Hovander L., Malmberg T., Athanasiadou M., Athanassiadis I,. Rahm S., Bergman Å.
and Wehler EK. (2002) Identification of hydroxylated PCB metabolites and other
phenolic halogenated pollutants in human blood plasma. Arch. Environ. Contam.
Toxicol. 42, 105–117.
Ikehata K., Gamal El-Din. M. and Snyder SA. (2008) Ozonation and advanced oxidation
treatment of emerging organic pollutants in water and wastewater. Ozone-Sci. Eng.
30, 21-26
Ikehata K., Naghashkar NJ. and Ei-Din MG. (2006) Degradation of aqueous
pharmaceuticals by ozonation and advanced oxidation processes: A review. Ozone-
Sci. Eng. 28, 353-414
Jones PD., Jampani HB., Newman JL. and Lee AS. (2000) Triclosan: A review of
effectiveness and safety in health care settings. AJIC. Am. J. Infect. Control. 28,
184-96

PhD thesis – ‘Triclosan removal in wastewater treatment processes’ – Xijuan Chen
35
Kim BJ. and Cardenas R. (1990) Use of reed beds for dewatering sludge in the USA. In
Constructed Wetlands in Water Pollution, Pergamon Press, Oxford.
Kim YM., Murugesan K., Schmidt S., Bokare V., Jeon JR., Kim EJ. and Chang YS.
(2010) Triclosan susceptibility and co-metabolism - A comparison for three aerobic
pollutant-degrading bacteria. Bioresource Technol. 102, 2206-2212
Kookana RS., Ying GG. and Waller NJ. (2011) Triclosan: its occurrence, fate and
effects in the Australian environment. Water Sci. Technol. 63, 598-604
Kumar KS., Priya SM., Peck AM. and Sajwan KS. (2010) Mass Loadings of Triclosan
and Triclocarbon from Four Wastewater Treatment Plants to Three Rivers and
Landfill in Savannah, Georgia, USA. Arch. Environ. Contam. Toxicol. 58, 275-285
Langdon KA., Warne MS., Smernik RJ., Shareef A. and Kookana RS. (2012) Field
dissipation of 4-nonylphenol, 4-t-octylphenol, triclosan and bisphenol A following
land application of biosolids. Chemosphere 86, 1050-1058
Langlais B., Reckhow D.A. and Brink D.R. (1991) Ozone in water treatment: application
and engineering. Lewis Publishers, 3-8
Latch DE., Packer JL., Arnold WA. and McNeill K. (2003) Photochemical conversion of
triclosan to 2,8-dichlorodibenzo-p-dioxin in aqueous solution. J. Photochem.
Photobiol. A. Chem. 158, 63-66
Laurie A. and Gilmore PE. (2008) OzonationOverview for Operators. GAWP 2008 Fall
Conference & Laboratory Symposium

PhD thesis – ‘Triclosan removal in wastewater treatment processes’ – Xijuan Chen
36
Levy CW., Roujeinikova A., Sedelnikova S., Baker PJ., Stuitje AR., Slabas AR., Rice
DW. and Rafferty JB. (1999) Molecular basis of triclosan activity. Nature 398, 383–
384
Lin DS., Xie XJ., Zhou QX. and Liu Y. (2012) Biochemical and genotoxic effect of
triclosan on earthworms (Eisenia fetida) using contact and soil tests. Environ.Toxicol.
27, 385-392
Lindström A., Bürge IJ., Poiger T., Bergqvist PA., Müller MD., and Buser HR. (2002)
Occurrence and Environmental Behavior of the Bactericide Triclosan and Its Methyl
Derivative in Surface Waters and in Wastewater. Environ. Sci. Technol. 36, 2322-
2329
Lozano N., Rice CP., Ramirez M. and Torrents A. (2010) Fate of triclosan in agricultural
soils after biosolid applications. Chemosphere 78, 760-766
McAvoy DC., Schatowitz B., Martin J., Hauk A. and Eckhoff WS. (2002) Measurement
of triclosan in wastewater treatment systems. Environ. Toxicol. Chem. 21, 1323–
1329
McMurry LM., Oethinger M. and Levy SB. (1998) Triclosan targets lipid synthesis.
Nature. 394, 531-2
Nakada N., Yasojima M., Okayasu Y., Komori K. and Suzuki Y. (2010) Mass balance
analysis of triclosan, diethyltoluamide, crotamiton and carbamazepine in sewage
treatment plants. Water Sci. Technol. 61, 1739-1747
Nielsen S. (2003) Sludge drying reed beds. Water Sci. Technol. 48, 101–109

PhD thesis – ‘Triclosan removal in wastewater treatment processes’ – Xijuan Chen
37
Nielsen S. (2005) Mineralisation of hazardous organic compounds in a sludge reed bed
and sludge storage. Water Sci. Technol. 51, 109–117
Nielsen S. and Willoughby N. (2007) Sludge treatment and drying reed bed systems in
Denmark. Water and Environ. J. 19, 296-305
Pauly U., Rehfus S. and Peitzmeier M. (2006) 15 years operational experience in the
humification of sewage sludge in reed beds. Organic Recovery and Biological
Treatment, Weimar
Queckenberg C., Meins J., Wachall B., Doroshyenko O., Tomalik Scharte D., Bastian
B., Abdel-Tawab M. and Fuhr U. (2010) Absorption, pharmacokinetics, and safety of
triclosan after dermal administration. Antimicrob.Agents.Ch. 54, 570–572
Ricart M., Guasch H., Alberch M., Barcelo D., Bonnineau C., Geiszinger A., Farre M.,
Ferrer J., Ricciardi F., Romani AM., Morin S., Proia L., Sala L., Sureda D. and
Sabater S. (2010) Triclosan persistence through wastewater treatment plants and its
potential toxic effects on river biofilms. Aquatic Toxicology 100, 346-353
Russell AD. (2004) Whither triclosan. J. Antimicrob. Chemoth. 53, 693-695
Sanchez-Prado L., Barro R., Garcia-Jares C., Llompart M., Lores M., Petrakis C.,
Kalogerakis N., Mantzavinos D. and Psillakis E. (2008) Sonochemical degradation of
triclosan in water and wastewater. Ultrason. Sonochem. 15, 689–694
Sandborgh Englund G., Adolfsson Erici M., Odham G. and Ekstrand J. (2006)
Pharmacokinetics of triclosan following oral ingestion in humans. J. Toxicol. Environ.
Health: Pt A 69, 1861–1873

PhD thesis – ‘Triclosan removal in wastewater treatment processes’ – Xijuan Chen
38
Scientific Committee on Consumer Products (SCCP) (2009) Opinoin on triclosan.
SCCP/1192/08
Singer H., Müller S., Tixier C. and Pillonel L. (2002) The aquatic environment: field
measurements in wastewater treatment plants, surface waters, and lake sediments.
Environ Sci Technol. 36, 4998-5004
Son HS., Ko G. and Zoh KD. (2009) Kinetics and mechanism of photolysis and TiO2
photocatalysis of triclosan. J. Hazard. Mater. 166, 954-960
Stasinakis AS., Petalas AV., Mamais D., Thomaidis NS., Gatidou G. and Lekkas TD.
(2007) Investigation of triclosan fate and toxicity in continuous-flow activated sludge
systems. Chemosphere 68, 375–381
Suarez S., Dodd MC., Omil F. and Von Gunten U. (2007) Kinetics of triclosan oxidation
by aqueous ozone and consequent loss of antibacterial activity: Relevance to
municipal wastewater ozonation. Water Res. 41, 2481 – 2490
Suller MTE. and Russell AD. (2000) Triclosan and antibiotic resistance in
Staphylococcus aureus. J Antimicrob. Chemoth. 46, 11-18
Ternes TA., Stübera J., Herrmann N., McDowella D., Ried A., Kampmann M. and Teiser
B (2003) Ozonation: a tool for removal of pharmaceuticals, contrast media and musk
fragrances from wastewater? Water Res. 37, 1976-1982
Thompson A., Griffin P., Stuetz R. and Cartmell E. (2005) The fate and removal of
triclosan during wastewater treatment. Water Environ. Res. 77, 63-67
Tixier C., Singer HP., Canonica S. and Muller SR. (2002) Phototransformation of
triclosan in surface waters: A relevant elimination process for this widely used

PhD thesis – ‘Triclosan removal in wastewater treatment processes’ – Xijuan Chen
39
biocide - Laboratory studies, field measurements, and modeling. Environ. Sci.
Technol. 36, 3482-3489
Toms LML., Allmyr M., Mueller JF., Adolfsson-Erici M., McLachlan M., Murby J. and
Harden FA. (2011) Triclosan in individual human milk samples from Australia.
Chemosphere 85, 1682-1686
Veetil PGP., Nadaraja AV., Bhasi A., Khan S. and Bhanskaran K. (2012) Degradation of
Triclosan under Aerobic, Anoxic, and Anaerobic Conditions. Appl Biochem
Biotechnol. 167, 1603-1612
Waller NJ. and Kookana RS. (2009) Effect of Triclosan on Microbial Activity in
Australian Soils. Environmental Toxicology and Chemistry 28, 65-70
Waria M., O'Connor GA. and Toor GS. (2011) Biodegradation of Triclosan in Biosolids-
Amended Soils. Environ. Toxicol. Chem. 30, 2488-2496
Wert EC., Rosario-Ortiz FL. and Snyder SA. (2009) Effect of ozone exposure on the
oxidation of trace organic contaminants in wastewater. Water Res. 43, 1005 - 1014
Wilson B., Chen RF., Cantwell M., Gontz A., Zhu J. and Olsen CR. (2009) The
partitioning of Triclosan between aqueous and particulate bound phases in the
Hudson River Estuary. Mar. Pollut. Bul. 59, 207-212
Wilson BA., Smith VH., DeNoyelles F. and Larive CK. (2003) Effects of Three
Pharmaceutical and Personal Care Products on Natural Freshwater Algal
Assemblages. Environ. Sci. Technol. 37, 1713-1719

PhD thesis – ‘Triclosan removal in wastewater treatment processes’ – Xijuan Chen
40
Wong-Wah-Chung P., Rafqah S., Voyard G. and Sarakha M. (2007) Photochemical
behaviour of triclosan in aqueous solutions: Kinetic and analytical studies. J.
Photoch. Photobio. A. 191, 201-208
Wood J., Fernandez G., Barker A., Gregory J. and Cumby T. (2007) Efficiency of reed
beds in treating dairy wastewater. Biosyst. Eng. 98, 455 – 469
Wu CX., Spongberg AL. and Witter JD. (2009) Adsorption and Degradation of Triclosan
and Triclocarban in Solis and Biosolids-Amended Soils. J. Agr. Food Chem. 57,
4900-4905
Wu JL., Lam NP., Martens D., Kettrup A. and Cai, ZW. (2007) Triclosan determination
in water related to wastewater treatment. Talanta 72, 1650-1654
Wu JL., Liu J. and Cai ZW. (2010) Determination of triclosan metabolites by using in-
source fragmentation from high-performance liquid chromatography/negative
atmospheric pressure chemical ionization ion trap mass spectrometry. Rapid
Commun. Mass Spectrom. 24, 1828-1834
Yazdankhah SP., Scheie AA., Hoiby EA., Lunestad BT., Fotland TO., Naterstad K. and
Kruse H. (2006) Triclosan and Antimicrobial Resistance in Bacteria: An Overview.
Microb. Drug Resist. 12, 83-90
Ying GG. and Kookana RS. (2007) Triclosan in wastewaters and biosolids from
Australian wastewater treatment plants. Environ. Int. 33, 199–205
Ying GG., Yu XY. and Kookana RS. (2007) Biological degradation of triclocarban and
triclosan in a soil under aerobic and anaerobic conditions and comparison with
environmental fate modelling. Environ.Pollut. 150, 300-305

PhD thesis – ‘Triclosan removal in wastewater treatment processes’ – Xijuan Chen
41
Yu JC., Kwong TY., Luo Q. and Cai Z. (2006) Photocatalytic oxidation of triclosan.
Chemosphere. 65, 390-399
Zhao YQ., Babatunde AO., Razali M. and Harty F. (2008) Use of dewatered alum
sludge as a substrate in reed bed treatment systems for wastewater treatment. J.
Environ. Sci. Heal. A 43, 105–110
Zimmermann SG., Wittenwiler M., Hollender J., Krauss M., Ort C., Siegrist H. and von
Gunten U. (2011) Kinetic assessment and modeling of an ozonation step for full-
scale municipal wastewater treatment: Micropollutant oxidation, by-product formation
and disinfection. Water Res. 45, 605-617


Research paper 1:
Chen XJ., Pauly U., Rehfus S. and Bester K. Personal care compounds in a reed bed
sludge treatment system, Chemosphere 76 (2009) 1094–1101


Author's personal copy
Personal care compounds in a reed bed sludge treatment system
Xijuan Chen a, Udo Pauly b, Stefan Rehfus b, Kai Bester a,*aDepartment of Biotechnology, Chemistry and Environmental Engineering, Aalborg University, Sohngaardsholmsvej 57, 9000 Aalborg, Denmarkb EKO-PLANT GmbH, Karlsbrunnenstraße 11, D-37249 Neu-Eichenberg, Germany
a r t i c l e i n f o
Article history:Received 24 January 2009Received in revised form 8 April 2009Accepted 9 April 2009Available online 17 May 2009
Keywords:SludgeReed bed sludge treatmentDegradationPersonal care compoundsTriclosan
a b s t r a c t
Sewage sludge (also referred to as biosolids) has long been used as fertilizer on agricultural land. Theusage of sludge as fertilizer is controversial because of possible high concentration of xenobiotic com-pounds, heavy metals as well as pathogens. In this study, the fate of the xenobiotic compounds triclosan(5-chloro-2-(2,4-dichlorophenoxy)phenol), OTNE (1-(2,3,8,8-tetramethyl-1,2,3,4,5,6,7,8-octahydro-naphthalen-2-yl)ethan-1-one), HHCB (1,3,4,6,7,8-hexahydro-4,6,6,7,8,8-hexamethylcyclopenta-(g)-2-benzopyran), HHCB-lactone, AHTN (7-acetyl-1,1,3,4,4,6 hexamethyl-1,2,3,4 tetrahydronaphthalene),and DEHP (bis(2-ethylhexyl)phthalate) in advanced biological treatment of sludge was determined.During 13 months of field-incubation of the sludge in reed beds, the xenobiotic compounds were ana-
lysed. The bactericide triclosan was reduced to 60%, 45%, and 32% of its original concentration in the top,middle, and bottom layer. The fragrance OTNE was decreased to 42% in the top layer, 53% in the middlelayer, and 70% in the bottom layer, respectively. For DEHP a reduction of 70%, 71%, and 40% was observedin the top, middle, and bottom layer, respectively. The polycyclic musk compounds HHCB, AHTN, and theprimary metabolite of HHCB, i.e., HHCB-lactone showed no degradation in 13 months during the exper-imental period in this installation. Tentative half-lives of degradation of triclosan, OTNE and DEHP wereestimated to be 315–770 d, 237–630 d, and 289–578 d, respectively.
� 2009 Elsevier Ltd. All rights reserved.
1. Introduction
Sludge (also referred to biosolids) has been used as fertilizer onagricultural landbecauseof itshighcontentofphosphorousandnitro-gen (Fytili and Zabaniotou, 2008). This usage of sludge is controversialbecause of its high content of xenobiotics and heavymetals (Fytili andZabaniotou, 2008). In 2005 ca. 10 million tons (dry matter) wereproduced by sewage treatment plants in Europe. About 37% of thatwas used in agriculture (Fytili and Zabaniotou, 2008). Currentlysludge in urban regions is usually stabilised for 10–40 d in anaerobicdigesters. However, for rural regions another method of sludgestabilisation has been developed, in which the sludge is treated forabout 10 years by reed beds to dewater and detoxify the sludge.
The reed bed treatment plant is different to conventional drybeds and sludge polders with a new type technology, as
(A) The reed beds are equipped with Phragmites australis reeds,which influence the dewatering, and further stabilisationand the sanitizing of the sewage sludge.
(B) The treatment process takes place in dedicated beds, whichare separated from the soil and the ground water by poly-ethylen foil (PE) (Fig. 1) to prevent the contamination ofthe soil and groundwater (Pauly et al., 2006).
Each reed bed is lined with a drainage system to enhance thedewatering of the sludge. The leached water is then pumped backinto the wastewater treatment plant. The sludge is pumped straightonto the beds throughout the year in pre-determined quantitiesand at preset intervals. Depending on plant design, the capacity ofthe beds is exhausted after 6–12 years (Nielsen, 2003). After a rest-ing phase of approximately one year, the individual beds are clearedand are then available again for a fresh loading cycle.
A similar technology as reed beds, i.e. soil filters, has been consid-ered as a low cost and low contamination method considering sus-pended solids and BOD5 removal in treating wastewater (Cooperet al., 1999; Wood et al., 2007; Zhao et al., 2008). For the treatmentof sludge, true reed beds have been applied in respect of reducingvolume, breaking down organic matter and increasing the densityof sludge (Nielsen, 2003, 2005; Gustavsson et al., 2007), howeverwhether this enhanced biological treatment is suitable for degrada-tion of xenobiotics, was not fully elucidated before undertaking thestudy presented here. This project was conducted to study whetherreedbed treatment of sludge is suited to decrease the loading of xeno-biotics to agricultural land with by fertilising with sewage sludge.
1.1. Compounds included in this study
Musk fragrances such as HHCB (1,3,4,6,7,8-hexahydro-4,6,6,7,8,8-hexamethylcyclopenta-(g)-2-benzopyran), AHTN (7-acetyl-1,1,3,4,4,6 hexamethyl-1,2,3,4 tetrahydronaphthalene) which is
0045-6535/$ - see front matter � 2009 Elsevier Ltd. All rights reserved.doi:10.1016/j.chemosphere.2009.04.023
* Corresponding author. Tel.: +45 9940 9939.E-mail addresses: [email protected], [email protected] (K. Bester).
Chemosphere 76 (2009) 1094–1101
Contents lists available at ScienceDirect
Chemosphere
journal homepage: www.elsevier .com/locate /chemosphere

Author's personal copy
mainly used in domestic purpose as well as OTNE (1-(2,3,8,8-tetramethyl-1,2,3,4,5,6,7,8-octahydro-naphthalen-2-yl)ethan-1-one), triclosan (5-chloro-2-(2,4-dichlorophenoxy)phenol), DEHP(bis(2-ethylhexyl)phthalate) have recently been identified as ma-jor anthropogenic organic contaminants in sewage sludge (Simo-nich et al., 2002; Kinney et al., 2006).
Triclosan is currently used as an antimicrobial agent in tooth-paste, mouthwash, and in functional clothing such as sport shoesand underwear and as a stabilizing agent in a multitude of deter-gents and cosmetics (Adolfsson-Erici et al., 2002). Additionally, itis used as an antimicrobial agent in polymeric food cutting boards.Approximately 1500 tonnes are produced annually worldwide, andapproximately 350 tonnes of those are applied in Europe (Singer
et al., 2002). Triclosan has a low water solubility and very high po-tential of bio-accumulation (Coogan et al., 2007). Studies haveincreasingly linked triclosan to a range of health and environmen-tal effects, skin irritation, allergy susceptibility, and ecological tox-icity to the aquatic and terrestrial environment (Coogan et al.,2007). In sludge from North Rhine-Westphalia, triclosan is wide-spread and the concentration is in the range of more than 2000–8000 ng g�1 (dry mass) (Bester, 2005a). In Table 1 the structuralformula and other details on the compounds are presented.
Polycyclic musk compounds such as HHCB and AHTN are usedfrequently as fragrances in washing softeners, shampoos, and otherconsumer products. More than 2000 tonnes are used annually inEurope (Balk and Ford, 1999). The structural formulas of both
Fig. 1. Sludge treatment process in reed bed treatment plant (Pauly et al., 2006).
X. Chen et al. / Chemosphere 76 (2009) 1094–1101 1095

Author's personal copy
compounds are given in Table 1. After application, most of thesematerials are released to the sewer. Thus, they have been identifiedin sewage treatment plants (Eschke et al., 1994, 1995) and inthe sewage sludge (Reiner and Kannan, 2006). Both of themhave very low water solubility and high potential of bio-accumula-tion, thus they can cause ecological toxicity to the aquatic andterrestrial environment (Brunn and Rimkus, 1997). The muskcompounds are not mineralized in sewage treatment processesand sorption is their main elimination path in waste water treat-ment plants, although transformation to other compounds mayoccur (Bester, 2005b). Elimination rates of fragrance compoundsin 17 different plants in US and Europe were compared bySimonich et al. (2002). Removal rates of 50%–90% were determinedfor HHCB and AHTN. Concentration of HHCB for 3100 ± 240 ng g�1
and AHTN for 1500 ± 150 ng g�1 in digested, dewatered sludge was
determined from one STP in North Rhine-Westphalia (Bester,2004).
HHCB-lactone is the primary metabolite of HHCB, which is anoxidationproduct as shown in Table 1. The ratio ofHHCB:HHCB-lac-tone has been used to detect transformation processes of this fra-grance. During the sewage treatment process about 10% of HHCBis transformed toHHCB-lactonewhichhasbeen reported forbalanceassessment for polycyclic mask fragrances in German treatmentplantbyBester (2004). The relationHHCB:HHCB-lactonevaries from3 to 130 in surfacewaters. This indicates that degradation processes,especially degradation/transformation efficiency, in the respectivesewage treatment plants differ considerably (Bester, 2005b). Con-centrations of HHCB-lactone from sludge of 20 sewage treatmentplants were determined from 30 ng g�1 to 36,000 ng g�1 (Bester,2005b).
Table 1Compounds of interest.
OTNE (Gautschi et al., 2001; Bester et al., 2008)
O
CH3
Name: 1-(2,3,8,8-tetramethyl-1,2,3,4,5,6,7,8-octahydro-naphthalen-2-yl)ethan-1-oneMolecular formula: C16H26OMolecular weight: 234 g mol�1
CAS: 54464-57-2Boiling point: 230 �CVapour pressure: 0.2 PaWater solubility: 2.68 mg L�1
log Kow: 5.7log Koc: 4.64
HHCB (Balk and Ford, 1999)
O
Name: 1,3,4,6,7,8-hexahydro-4,6,6,7,8,8-hexamethylcyclopenta-(g)-2-benzopyranMolecular formula: C18H26OMolecular weight: 258 g mol�1
CAS: 1222-05-5Vapour pressure: 0.0682 PaWater solubility: 1.25 mg L�1
log Kow: 5.7log Koc: 4.80
AHTN (Balk and Ford, 1999)
O
Name: 7-acetyl-1,1,3,4,4,6 hexamethyl-1,2,3,4 tetrahydronaphthaleneMolecular formula: C18H26OMolecular weight: 258 g mol�1
CAS: 1506-02-1Vapour pressure: 0.0727 PaWater solubility: 1.75 mg L�1
log Kow: 5.9log Koc: 4.86
Triclosan (Bester, 2005a; Ying et al., 2007)
O
Cl
Cl
Cl
OH
Name: 5-chloro-2-(2,4-dichlorophenoxy)phenolMolecular formula: C12H7Cl3O2
Molecular weight: 290 g mol�1
CAS: 3380-34-5Vapour pressure: 0.00062 PaWater solubility: 4.621 mg L�1
Boiling point: 373.62 �Clog Kow: 4.2–4.76log Koc: 4.265
DEHP (Cheng et al., 2008)
O
O
O
O
Name: bis(2-ethylhexyl)phthalateMolecular formula: C24H38O4
Molecular weight: 391 g mol�1
CAS: 117-81-7Boiling point: 230 �CVapour pressure: 0.000034 PaWater solubility: 0.003 mg L�1
log Kow: 7.5log Koc: 5.2
HHCB-lactone (Bester, 2005b)
O
O
Name: 1,3,4,6,7,8-hexahydro-4,6,6,7,8,8-hexamethylcyclopenta [g]-2-benzopyran-1-oneMolecular formula: C18H24O2
Molecular weight: 272 g mol�1
CAS: 507442-53-7log Kow: 4.7
1096 X. Chen et al. / Chemosphere 76 (2009) 1094–1101

Author's personal copy
OTNE is widely used in consumer products (in Table 1). It hasbeen among the most popular compounds in fragrances in the lastfew years. It is marketed as Iso E Super, with 2500–3000 tonnesannually being sold (Gautschi et al., 2001). Concentrations of7000–30,000 ng g�1 OTNE in dry sludge were determined in sludgefrom the U.S. (Difrancesco et al., 2004), while European data indi-cate concentrations of 2000–4000 ng g�1(Bester et al., 2008).
DEHP is widely used as plasticizer in PVC construction materi-als, and also in varnish, paint, and cosmetics products. DEHP isused as a plasticizer because of its stability, fluidity, and low vola-tility (Giam et al., 1984). This plasticizer is eluted into wastewaterby washing and cleaning processes, it is assumed to at least havestrong ecotoxic effect to the aquatic organisms (Roh et al., 2007).Because of the relatively high lipophilicity of the compounds, sorp-tion is the main process relevant for elimination in sewage treat-ment plants. Beauchesne et al. (2008) investigated that sludgecan represent significant sources of plasticizers in the environ-ment. Typical concentration of DEHP in sludge was investigatedin the range of 10–100 lg L�1 by Fromme et al. (2002).
According to the parameters shown in Table 1, thesecompounds have low vapour pressure and low water solubilities.High octanol–water partition coefficient (Kow) and soil organicmatter–water partitioning coefficient (Koc) suggest that thesescompounds are hydrophobic and sorption is the main process ofelimination in sewage treatment plant.
2. Materials and methods
AHTN, triclosan, and DEHP were purchased from Ehrenstorfer(Augsburg, Germany) as pure compounds with purity beingP99% according to the supplier. OTNE and pure standards ofHHCB-lactone as well as HHCB were obtained from InternationalFlavours and Fragrances (IFF, Hilversum, Netherlands).
The internal standard MX D15 was used to quantify the musksand DEHP as it elutes in the same fraction as these compounds,while TPP D15 was used in this experiment to quantify triclosanand HHCB-Lactone. While Musk xylene D15 was obtained fromEhrenstorfer (Augsburg, Germany), TPP D15 was synthesized fromD6 phenol and phosphoroxychloride. These internal standardswere chosen as they give undisturbed signal, and also not undergoany reaction themselves (Andresen and Bester, 2006).
Ethyl acetate, acetone, and cyclohexane were used in analyticalgrade (p.a.) quality, while toluene and n-hexane were used in res-idue grade (z.R.) quality. All solvents were purchased from Merck,Darmstadt, Germany.
Samples were taken from the sludge reed bed from the waste-water treatment plant (WWTP) in Meppen, which processes2,000,000 m3 wastewater of 52,500 inhabitants annually. Abouthalf of the wastewater that is produced is domestic. This WWTP in-cludes primary sedimentation basins, activated sludge treatmentbasins and a final clarifier before the water is released to the river.This plant produces about 40,000 m3 excess sludge annually. Until2003 the sludge was treated by a filter press and then used as fer-tilizer in agriculture. Since June 2003 the sludge is treated in a reedbed installation consisting of seven separated beds with separateddrainage systems (Fig. 1). The reed beds (50 � 20 m each) areequipped by polyethylene foil (PE). To study whether this en-hanced biological treatment is suitable for degradation of xenobi-otics, one of the reed beds was put out of operation in 2006 andno new sludge was added during the experimental period. Theexperiment was conducted under ambient conditions: tempera-ture, water content and reed plant density were not changed butas established by nature in this bed. Monitoring of the height ofthe sludge in this bed proved a stable bed with little alterations65 cm with 2 cm standard deviation.
From June, 2006 to July, 2007 sludge sampleswere takenbyusinga stainless steel tube with a cutting edge for easy core removal. Thesamples were divided into three sub-samples according to depth.The upper third of the sample is considered to be the top layer, mid-dle third as the middle layer and lower third as the bottom layer.Then 100 g samples were taken from 10 different points of the reedbed and a homogenate for the respective layer was produced.
Two hundred grams of these homogenates were immediatelyfrozen in refrigerating room at �27 �C overnight. Frozen sub-sam-ples of 50 g wet weight were lyophilised at 2 mbar and �46 �C.Duplicates of the lyophilised sludge samples were extracted bymeans of accelerated solvent extraction (ASE) with ethyl acetateat 90 �C and 150 bar. The resulting extracts were then cleaned upwith 1 g silica (SPE) solid-phase extraction cartridges (silica 60 ob-tained from Merck, Darmstadt, Germany) by elution with ethylacetate after adding an aliquot of 100 lL internal standard solution(IS) (containing 100 ng D15 musk xylene and 100 ng TPP D15).
These resulting solutions were concentrated to 1 mL by a Büchimultiport concentrator at 80 �C and 70 mbar (Büchi, Essen,Germany). The resulting extracts were injected to a GPC-column(LC-tech, Dorfen, Germany, equipped with Biorad SX-3) ID:2.5 cm, length 30 cm, flow 5.0 mL min�1 cyclohexane: ethyl ace-tate 1:1. The solvent eluting in the first 19:30 min was drained towaste, while the fraction 19.30–30.00 min was collected. Thus,macromolecules were separated as they elute in the first fraction,while sulphur, etc. are separated from the target compounds asthey are eluted after the analyte fraction. The samples were finallytransferred into toluene. The resulting extracts were finally frac-tionated on silica using 5% Methyl-tertbutylether (MTBE) in n-hex-ane and ethyl acetate successively as eluents. These fractions werecondensed and finally analysed by gas chromatography with massspectrometric detection (GC–MS) equipped with a programmabletemperature vapouriser (PTV) injector. The PTV (1 lL injection vol-ume) was operated in PTV splitless mode. The injection tempera-ture of 115 �C was held for 3 s, it was successively ramped with12 �C s�1 to 280 �C for the transfer of the analytes. This tempera-ture was held for 1.3 min. The injector was then ramped with1 �C s�1 to 300 �C which was held for 7 min as a cleaning phase.
The GC separation was performed with a DB-5MS column (J&WScientific), L: 15 m; ID: 0.25 mm; film: 0.25 lm and a temperatureprogramme of: 100 �C (hold: 1 min) ramped with 30 �C min�1 to130 �C and with 8 �C min�1 successively to 220 �C. Finally, the bak-ing temperature was reached by ramping the column with30 �C min�1 to 280 �C which was held for 7 min.
The detector of the mass spectrometer (DSQ, Thermo Finnigan,Dreieich, Germany) was operated with 1281 V on the secondaryelectronmultiplier and about 40 msdwell time in selected ionmode(SIM) mode. The transfer line was held at 250 �C, which is sufficientto transfer all compounds from the GC into the MS as the vacuumbuilds up in the transfer line. The ion source was operated at230 �C. Helium was used as carrier gas with a flow rate of1.3 mL min�1.
When the rain water passes through the sludge layer, somecompounds can be dissolved, which can also lead to the concentra-tion reduction of compounds. Thus, liquid samples were collectedas manual grab samples in two litre glass bottles from the drainagewater of the drainage canal of the reed bed during the treatmentprocess. Two samples for out-flowing water were taken as dupli-cates. One litre samples were extracted for 20 min with 20 mL tol-uene by means of vigorous stirring with a teflonized magnetic stirbar after adding an aliquot of 100 lL internal standard solution.The organic phase was separated from the aqueous one and theresidual water was removed from the organic phase by freezingthe samples overnight at �20 �C. The resulting extracts were thenconcentrated with a rotary evaporator at 80 �C and 70 mbar to1 mL. Resulting extracts were quantified by using GC–MS.
X. Chen et al. / Chemosphere 76 (2009) 1094–1101 1097

Author's personal copy
The compounds were detected by means of their mass spectraldata and retention times. For quantitative measurements themethod was validated, by determining recovery rates, standarddeviations, and limits of quantification (see next paragraph)(Bester, 2004, 2007, 2009; Peck, 2006).
The average of the concentrations obtained from the duplicateextractions was used for further data processing. The calibrationswere performed as a multi-step internal standard calibration(10–10,000 ng mL�1). The recovery rates were assessed by extract-ing spiked manure/soil 1/1 samples. Six different concentrations(between 20 ng g�1 and 10,000 ng g�1) were dosed, for each con-centration two samples were extracted, thus 12 extractions wereperformed plus extractions for blank determination. Additionallyrecovery rates were determined by means of standard additionby spiking sludge from this experiment with respective standardconcentrations of 5000 ng g�1.
2.1. Method quality assurance
The recoveries were 60–133% for the respective compounds, therelative standard deviations varying for the specific compoundsfrom 5 to 21% (for more details see Table 2). The limit of detectionwas 3–30 ng g�1 and the limit of quantification was 10–100 ng g�1.Limits of quantification (LOQ) were calculated by two means:
(1) From the analysis of standard solutions, as the lowest con-centration which gave signal to noise ratios (s/n) of at least10 (six replicas in each series).
(2) As the lowest concentration for the respective substancethat was detectable from the recovery studies with the samerecovery rate as the higher concentrations. Full data aregiven in Table 2 (duplicates per concentration).
3. Results and discussion
3.1. Water content
During the 13 months field-incubation of the organic com-pounds in a technical reed bed sludge treatment the water contentduring time was analysed. The liquid excess sludge (used as feedfor this sludge treatment) contained about 99% water. The rainfallin this treatment facility (May 2006–July 2007) was 1130 L m�2.The water content of the sludge ranged from 85% to 73% duringthe experiment period. The lowest water content in the top layer,76%, was found in September 2006, because of the low amountof rainfall and high temperature (and enhanced transpiration bythe reed plants) at that time.
3.2. Personal care compounds
The xenobiotic compounds triclosan, HHCB, AHTN, HHCB-lac-tone, OTNE, and DEHP were identified by their retention timesand mass spectral data in sludge samples (Table 2).
The concentration of triclosan (Fig. 2) in the beginning of theexperiment was measured as 1400, 1900, and 2000 ng g�1 (dry
mass) in the top, middle, and bottom layer, comparable resultswere obtained by Bester (2005a) in sewage sludge samples from20 WWTPs in Germany with triclosan concentration ranging from400 to 8800 ng g�1. After 13 months triclosan was reduced to lessthan 60% and the concentration was 800, 900 and 600 ng g�1
(dry mass) in the top, middle, and bottom layer, respectively(Fig. 2). Considering a standard deviation of 12% from the methodvalidation this change is significant.
The concentrations of the polycyclic musk compounds HHCB,AHTN, and the primary metabolite of HHCB, i.e. HHCB-lactoneshowed no reduction in 13 months during the experimental peri-od. The concentration varied from 8000 to 12,000 ng g�1 (drymass) for HHCB, from 1500 to 2300 ng g�1 (dry mass) for AHTNand from 1400 to 2100 ng g�1 (dry mass) for HHCB-lactone. Theseare corresponding to the results obtained by Reiner and Kannan(2006) who found concentrations ranging from 7230 to108,000 ng g�1 (dry mass) for HHCB, 809 to 16,800 ng g�1 (drymass) for AHTN and 3160 to 22,000 ng g�1 (dry mass) for HHCB-lactone. Nevertheless, a few studies indicated that polycyclicmusks can be degraded in sludge-amended soils. Litz et al.(2007) investigated aerobic dissipation of HHCB and AHTN insoil/sewage sludge mixtures is very slow with half-lives of 10–17 months for HHCB and 2–24 years for AHTN. Similarly, Difrance-sco et al. (2004) also found a particularly slow dissipation for HHCBand AHTN in sludge-amended soils. Information on degradation ofHHCB-lactone is rare, only some mass balance measurement havebeen carried out that indicate HHCB-lactone is developed duringHHCB transformation process (Bester, 2004; Berset et al., 2004;Reiner and Kannan, 2006).
Fig. 2 shows the OTNE concentration as a function of time. Thehighest amount was determined in the beginning of the project.The measured concentrations were 2500 ng g�1, 2500 ng g�1, and2400 ng g�1 (dry mass) in the top, middle, and bottom layer, thisis somewhat lower that found for sludges form the US by Difrance-sco et al. (2004). After 13 months OTNE was reduced by 42% in thetop layer, 53% in the middle layer, and 70% in the bottom layer,respectively.
Similar to OTNE, the highest concentration of DEHPwas detectedin the beginning of the project. The respective concentrations were11,500, 10,500, and 7200 ng g�1 (dry mass) in the top, middle, andbottom layer. Comparable results were obtained by Beauchesneet al. (2008) ranging from15,000 ng g�1 to 346,000 ng g�1 in sewagesludge in Canada. After 13 months DEHP was reduced by 70%, 71%,and 40% in the top, middle, and bottom layer, respectively.
The processes that contributed to the dissipation of the studiedcompounds in sludge may include volatilization, plants uptake,leaching, and biological transformation (aerobic and anaerobic).Considering their generally low volatility (Table 1), the tendencyof these compounds to volatize is low. Therefore it is expected thatonly a small fraction of these compounds was volatilized into theatmosphere, where they can photolyze (Aschmann et al., 2001;Difrancesco et al., 2004; Chen et al., 2008). To quantify the uptakeof xenobiotic compounds by plants, reed samples were analysed byusing the same procedure as sludge. In these samples none ofthe compounds were detected, except small amounts of DEHP(13,000 ± 2000 ng g�1). As less than 1 kg reeds were growing in
Table 2Quality assurance data including the MS data (analytical and verifier ions) as well as recovery rate standard deviation and limit of quantification of the recovery rate experiments.
Analyte Analytical ion (amu) Verifier ion (amu) Recovery (%) RSD (%) LOQ (ng g�1)
OTNE 191 219 60 6 30HHCB 243 258 77 6 10AHTN 243 258 69 5 10Triclosan 288 290 133 12 100HHCB-lactone 257 272 65 10 30DEHP 279 167 87 21 10
1098 X. Chen et al. / Chemosphere 76 (2009) 1094–1101

Author's personal copy
1 m2 sludge reed bed, it can be assumed that less than 0.01% ofDEHP was ingested by reeds. This is in agreement with the resultsof Litz et al. (2007) who studied uptake of HHCB and AHTN by let-tuce and carrots and found HHCB and AHTN were taken up only bythe carrot roots to some small extent. Phyto-remediation (consid-ering only plant uptake) is thus not relevant for this system.
3.3. Mass balance studies
The amount of compounds in leachate can be calculated basedon the concentration of effluent and amount of rainfall (water flowthrough the system). The concentration of xenobiotics in the efflu-ent from this reed bed in November 2006 is shown in Table 3. Therainfall during the experimental period (from June 2006 to July2007) was 1130 mm (Table 3) (1 mm = 1 L m�2). Table 3 showsmass fraction of compounds which were leached by drainagewater in comparison to the mass fraction in sludge in 1 m2 reedbed. Since 0.010–0.048% of the mass fraction of the xenobioticscontained in the sludge is leached by drainage water during theexperimental period, it seems that biological transformation wasthe main dissipation mechanism for these compounds.
3.4. Kinetic analysis of dissipation data
Biological degradation of organic compounds at low concentra-tions usually follows first-order kinetics, thus an elimination rateconstant (k) for sludge removal in reed beds can be calculated fromthe concentrations from a log c � c0
�1 plot (Fig. 3) using Eq. (1). Forthe triclosan degradation process the respective k values are0.0009, 0.0021 and 0.0022 in the top, middle, and bottom layer.
K ¼ ln½c0c �t
: ð1Þ
With Eq. (2), the half-life can be assessed:
T1=2 ¼ln
C0C02
� �
k¼ ln 2
k: ð2Þ
Tentative half-lives for triclosan can be calculated as 770, 330, and315 d in the top, middle, and bottom layer, respectively (Table 4).This is corresponding to the results which were gained by Yinget al. (2007) by spiking triclosan into loamy soil with a concentra-tion of 1 mg kg�1 (i.e. 1000 ng g�1), 18 d half-life was calculated un-der aerobic conditions within this 70 d experiment.
Tentative half-lives of OTNE degradation were calculated as630, 239, 277 d in the top, middle, and bottom layer, respectively(Table 4), which indicate OTNE degraded faster in the middle andbottom layer than in the top layer. Comparable half-lives were ob-served by Difrancesco et al. in 2004 with OTNE dissipation half-lives of 30–100 d in sludge-amended soils.
0
500
1000
1500
2000
2500
3000
Jun 06
Aug 06
Sep 06
Oct 06
Nov 06
Jan 07
Feb 07
Mar 07
Apr 07
May 07
Jun 07
Jul07
triclosan
OTNE
conc
entra
tion
(ng
g-1dm
)
Fig. 2. Triclosan and OTNE concentration from the bottom layer (40–60 cm fromsurface) as a function of time. Error bars are from the stated uncertainty from themethod development.
Table 3Mass fraction (M1) of compounds dissolved in rain water passing through 1 m2 reed bed in comparison to the mass fraction in sludge (M2) in 1 m2 reed bed. As well as relativeamount of substance washed of the reed bed with the drainage water (M1/M2). Sludge density is 0.8 ton m�3.
Compounds C1 Drainage water(ng L�1)
Rainfall(L m�2)
M1 Drainagewater (mg)
C2 Sludge(ng g�1)
Depth of thereed bed (m)
M2 Sludge(mg)
M1/M2(%)
OTNE 130 1130 0.147 2370 0.6 1140 0.013HHCB 310 1130 0.35 9150 0.6 4390 0.0080AHTN 50 1130 0.057 1220 0.6 586 0.010Triclosan 270 1130 0.305 1330 0.6 638 0.048DEHP 170 1130 0.192 11,600 0.6 5570 0.0034
C1: Concentration in the drainage water (ng L�1).C2: Concentration in the sludge (ng g�1) (start of experiment).
y = -0.0022x -0.1415 R² = 0.7338
-1.4
-1.2
-1
-0.8
-0.6
-0.4
-0.2
00 100 200 300 400
log
c c 0
-1
time (days)
Fig. 3. Kinetics of triclosan degradation in log form in the bottom layer of a sludgereed bed.
Table 4Tentative half-lives of the compounds during the experimental period in a sludge reedbed. The R2 refers to the regression line in the log plots to gain the half-life values.
Compounds Tentative half-life
OTNE Top layer (0–20 cm) 630 d (R2 = 0.7361)Middle layer (20–40 cm) 239 d (R2 = 0.6047)Bottom layer (40–60 cm) 277 d (R2 = 0.4716)
HHCB Top layer (0–20 cm) 1Middle layer (20–40 cm) 1Bottom layer (40–60 cm) 770 d (R2 = 0.4858)
AHTN Top layer (0–20 cm) 1Middle layer (20–40 cm) 1Bottom layer (40–60 cm) 1
DEHP Top layer (0–20 cm) 315 d (R2 = 0.6562)Middle layer (20–40 cm) 289 d (R2 = 0.6554)Bottom layer (40–60 cm) 578 d (R2 = 0.4117)
Triclosan Top layer (0–20 cm) 770 d (R2 = 0.4822)Middle layer (20–40 cm) 330 d (R2 = 0.7588)Bottom layer (40–60 cm) 315 d (R2 = 0.7338)
HHCB-lactone Top layer (0–20 cm) 1Middle layer (20–40 cm) 1Bottom layer (40–60 cm) 1
1 means half-lives larger than 3 years.
X. Chen et al. / Chemosphere 76 (2009) 1094–1101 1099

Author's personal copy
DEHP was eliminated with half-lives as 315, 289, and 578 d inthe top, middle, and bottom layer, respectively. These can be com-pared with results obtained by Madsen et al. (1999) who foundthat more than 41% of DEHP in a sludge-amended soil was stillnot mineralization after 1 year incubation and in this study ahalf-life for DEHP in soils with sludge aggregates was estimatedto be higher than 3 years.
3.5. Comparison of layering
Triclosan and OTNE degraded very similar concerning the layersof sludge, i.e., faster in bottom layer than in the top layer.
This might be influenced by different age, compactness or oxy-gen supply in the different layers. The oxygen regime in the differ-ent layers that can be quite diverse, as reed is known to pumpoxygen from the leaves to the rizome into the surrounding med-ium (sludge) (Armstrong et al., 2000). This can be accounted for29–60 ng m�2 min�1(Armstrong et al., 2000). However the sur-rounding sludge can consume the oxygen rapidly especially if itis partially aerobically stabilized sludge as in this experiment. Dur-ing the experiment, the reed bed was monitored in intervals foraerobic and anaerobic areas. The reed bed was usually patchy, thusaerobic areas occurred as well as anaerobic ones. Additionally aircould have entered from the drainage basin. The main result at thismoment is, there is indeed an effect of the different layers futureresearch will show what might be the reason for that.
By the way of contrast DEHP degraded faster in the top layer,which suggesting the highest reduction of DEHP was achieved atthe highest temperature (Cheng et al., 2008). Possibly the degrada-tion of the different compounds is preferred at different oxygenlevels (aerobic and anaerobic processes).
4. Conclusions
In the 13 months of this experiment, the concentrations of somecompounds such as OTNE, triclosan, and DEHP in this sludge reedbed treatment were decreased. However, the concentrations of othercompounds such as polycyclic musk compounds HHCB, AHTN, andHHCB-lactonedidnot changeduring this experiment.OTNEand triclo-san degraded faster in the bottom layerwhile DEHP degraded faster inthe top layer, which is indicating different regimes in the differentlayers and different degradation processes in the respective layers.
Considering half-lives of 300–900 d, this sludge reed bed caneliminate considerable amounts of some of the pollutants in its10 years production cycle. If the sludge is to be used as fertilizerin agriculture the use of reed bed treatments can help considerablyto decrease the contamination of sludge.
Acknowledgements
The authors acknowledge the support of ProInno/AIF and xeno-biotic groups of university of Duisburg-Essen as well as ThomasGroß and Enno Pieper for sampling. Additionally the authors areindebted to the water board Stadtwerke Meppen for the possibilityto sample their sludge reed plant.
Appendix A. Supplementary material
Supplementary data associated with this article can be found, inthe online version, at doi:10.1016/j.chemosphere.2009.04.023.
References
Adolfsson-Erici, M., Pettersson, M., Parkkonen, J., Sturve, J., 2002. Triclosan, acommonly used bactericide found in human milk and in the aquaticenvironment in Sweden. Chemosphere 46, 1485–1489.
Andresen, J., Bester, K., 2006. Elimination of organophosphate ester flameretardants and plasticizers in drinking water purification. Water Res. 40, 621–629.
Armstrong, W., Cousins, D., Armstrong, J., Turner, D.W., Beckett, P.W., 2000. Oxygendistribution in wetland plant roots and permeability barriers to gas-exchangewith the risosphere: a microelectrode and modelling study with Phragmitisaustralis. Ann. Bot.-London 86, 687–703.
Aschmann, S.M., Arey, J., Atkinson, R., Simonich, S.L., 2001. Atmospheric lifetimesand fates of selected fragrance materials and volatile model compounds.Environ. Sci. Technol. 35, 3595–3600.
Balk, F., Ford, R.A., 1999. Environmental risk assessment for the polycyclic musksAHTN and HHCB in the EU I Fate and exposure assessment. Toxicol. Lett. 111,57–79.
Beauchesne, I., Barnabé, S., Cooper, D.G., Nicell, J.A., 2008. Plasticizers and relatedtoxic degradation products in wastewater sludges. Water Sci. Technol. 57, 367–374.
Berset, J.D., Kupper, T., Etter, R., Tarradellas, J., 2004. Considerations about theenantioselective transformation of polycyclic musks in wastewater, treatedwastewater and sewage sludge and analysis of their fate in a sequence batchreactor plant. Chemosphere 57, 987–996.
Bester, K., 2004. Retention characteristics and balance assessment for twopolycyclic musk fragrances (HHCB and AHTN) in a typical German sewagetreatment plant. Chemosphere 57, 863–870.
Bester, K., 2005a. Fate of triclosan and triclosan-methyl in sewage treatment plantsand surface waters. Arch. Environ. Con. Toxicol. 49, 9–17.
Bester, K., 2005b. Polycyclic musks in the Ruhr catchment area – transport,discharges of waste water, and transformations of HHCB, AHTN and HHCB-lactone. J. Environ. Monitor. 7, 43–51.
Bester, K., 2007. Personal Care Compounds in the Environment. Essen, Germany.VCH-Wiley, Weinheim, Germany. pp. 9–13.
Bester, K., 2009. Analysis of musk fragrances in environmental samples. J.Chromatogr. A 1216, 470–480.
Bester, K., Klasmeier, J., Kupper, T., 2008. Emissions of OTNE (Iso-E-super) – Massflows in sewage treatment plants. Chemosphere 71, 2003–2010.
Brunn, H., Rimkus, G., 1997. Synthetic musk compounds – Application,environmental accumulation, and toxicology. Ernährungs Umschau. 44, 4–7.
Chen, Z.L., Song, Q.J., Cao, G.Q., Chen, Y.F., 2008. Photolytic degradation oftriclosan in the presence of surfactants. Chem. Pap. – Chem. Zvesti. 62, 608–615.
Cheng, H.F., Kumar, M., Lin, J.G., 2008. Degradation kinetics of di-(2-ethylhexyl)phthalate (DEHP) and organic matter of sewage sludge duringcomposting. J. Hazard. Mater. 154, 55–62.
Coogan, M.A., Edziyie, R.E., Point, T.W., Venables, B.J., 2007. Algal bioaccumulation oftriclocarban, triclosan, and methyl-triclosan in a North Texas wastewatertreatment plant receiving stream. Chemosphere 67, 1911–1918.
Cooper, P., Griffin, P., Humphries, S., Pound, A., 1999. Design of a hybrid reed bedsystem to achieve complete nitrification and denitrification of domestic sewage.Water Sci. Technol. 40, 283–289.
Difrancesco, A.M., Chui, P.C., Standley, L.J., Allen, H.E., Salvito, D.T., 2004. Dissipationof fragrance materials in sludge-amended soils. Environ. Sci. Technol. 38, 194–201.
Eschke, H.D., Traud, J., Dibowski, H.J., 1994. Untersuchungen zum vorkommenpolycyclischer moschusduftstoffe in verschiedenen umweltkompartimenten –nachweis und analytik mit GC–MS in oberflaechen-, abwaessern und fischen (1.Mitteilung). UWSF-Z. Umweltchem. Oekotox. 6, 183–189.
Eschke, H.D., Dibowski, H.J., Traud, J., 1995. Untersuchungen zum Vorkommenpolycyclischer Moschus-Duftstoffe in verschiedenen Umweltkompartimenten.UWSF-Z. Umweltchem. Oekotox. 7, 131–138.
Fromme, H., Kuchler, T., Otto, T., Pilz, K., Muller, J., Wenzel, A., 2002. Occurrence ofphthalates and bisphenol A and F in the environment. Water Res. 36, 1429–1438.
Fytili, D., Zabaniotou, A., 2008. Utilization of sewage sludge in EU application of oldand new methods – a review. Renew. Sust. Energ. Rev. 12, 116–140.
Gautschi, M., Bajgrowicz, J.A., Kraft, P., 2001. Fragrance chemistry – milestones andperspectives. Chimia 55, 379–387.
Giam, C.S., Atlas, E., Powers, M.A., Leonard, J.E., 1984. Phthalic acid esters. In:Hutzinger, O. (Ed.), The Handbook of Environmental Chemistry. Springer,Berlin,Germany, pp. 7–142.
Gustavsson, L., Hollert, H., Jönsson, S., van Bavel, B., Engwall, M., 2007. Reed bedsreceiving industrial sludge containing nitroaromatic compounds. Environ. Sci.Pollut. R. 14, 202–211.
Kinney, C., Furlong, E., Zaugg, S., Burkhardt, M., Werner, S., Cahill, J., Jorgensen, G.,2006. Survey of organic wastewater contaminants in biosolids destined for landapplication. Environ. Sci. Technol. 40, 7207–7215.
Litz, N.T., Mueller, J., Boehmer, W., 2007. Occurrence of polycyclic musks in sewagesludge and their behaviour in soils and plants: Part 2. J. Soils Sediments 7, 36–44.
Madsen, P.L., Thyme, J.B., Henriksen, K., Moldrup, P., Roslev, P., 1999. Kinetics of di-(2-ethylhexyl)phthalate mineralization in sludge-amended soil. Environ. Sci.Technol. 33, 2601–2606.
Nielsen, S., 2003. Sludge drying reed beds. Water Sci. Technol. 48, 101–109.Nielsen, S., 2005. Mineralisation of hazardous organic compounds in a sludge reed
bed and sludge storage. Water Sci. Technol. 51, 109–117.Pauly, U., Rehfus, S., Peitzmeier, M., 2006. In: 15 Years Operational Experience in the
Humification of Sewage Sludge in Reed Beds, Proceedings. Organic Recoveryand Biological Treatment, Weimar.
1100 X. Chen et al. / Chemosphere 76 (2009) 1094–1101

Author's personal copy
Peck, A.M., 2006. Analytical methods for the determination of persistent ingredientsof personal care products in environmental matrices. Anal. Bioanal. Chem. 386,907–939.
Reiner, J.L., Kannan, K., 2006. A survey of polycyclic musks in selected householdcommodities from the United States. Chemosphere 62, 867–873.
Roh, J.Y., Jung, I.H., Lee, J.Y., Choi, J.H., 2007. Toxic effects of di(2-ethylhexyl)phthalate on mortality, growth, reproduction and stress-relatedgene expression in the soil nematode caenorhabditis elegans. Toxicology 237,126–133.
Simonich, S.L., Federle, T.W., Eckhoff, W.S., Rottiers, A., Webb, S., Sabaliunas, D., DeWolf, W., 2002. Removal of fragrance materials during US and Europeanwastewater treatment. Environ. Sci. Technol. 36, 2839–2847.
Singer, H., Muller, S., Tixier, C., Pillonel, L., 2002. Triclosan: occurrence and fate of awidely used biocide in the aquatic environment: field measurements inwastewater treatment plants, surface waters, and lake sediments. Environ.Sci. Technol. 36, 4998–5004.
Wood, J., Fernandez, G., Barker, A., Gregory, J., Cumby, T., 2007. Efficiency of reedbeds in treating dairy wastewater. Biosyst. Eng. 98, 455–469.
Ying, G.G., Yu, X.Y., Kookana, R.S., 2007. Biological degradation of triclocarban andtriclosan in a soil under aerobic and anaerobic conditions and comparison withenvironmental fate modelling. Environ. Pollut. 150, 300–305.
Zhao, Y.Q., Babatunde, A.O., Razali, M., Harty, F., 2008. Use of dewatered alum sludgeas a substrate in reed bed treatment systems for wastewater treatment. J.Environ. Sci. Heal. A 43, 105–110.
X. Chen et al. / Chemosphere 76 (2009) 1094–1101 1101

Research paper 2:
Chen XJ., Pauly U., Rehfus S. and Bester K. Removal of personal care compounds
from sewage sludge in reed bed container (lysimeter) studies — Effects of macrophytes,
Science of the Total Environment 407 (2009) 5743–5749


Author's personal copy
Removal of personal care compounds from sewage sludge in reed bed container(lysimeter) studies — Effects of macrophytes
Xijuan Chen a, Udo Pauly b, Stefan Rehfus b, Kai Bester a,c,⁎a Department of Biotechnology, Chemistry and Environmental Engineering, Aalborg University, Sohngaardsholmsvej 57, 9000 Aalborg, Denmarkb EKO-PLANT GmbH, Karlsbrunnenstraße 11, D-37249 Neu-Eichenberg, Germanyc Institute of Environmental Analytical Chemistry, University Duisburg-Essen, Universitätsstr. 15, 45141 Essen, Germany
a b s t r a c ta r t i c l e i n f o
Article history:Received 30 March 2009Received in revised form 7 July 2009Accepted 13 July 2009Available online 14 August 2009
Keywords:SludgeReed bed sludge treatmentDegradationPolycyclic musk fragrancesTriclosanOTNE
Sludge reed beds have been used for dewatering (draining and evapotranspiration) and mineralisation ofsludge in Europe since 1988. Although reed beds are considered as a low cost and low contamination methodin reducing volume, breaking down organic matter and increasing the density of sludge, it is not yet clearwhether this enhanced biological treatment is suitable for degradation of organic micro-pollutants such aspersonal care products. Within this project the effect of biological sludge treatment in a reed bed on reducingthe concentrations of the fragrances HHCB, AHTN, OTNE was studied as on the bactericide Triclosan.Additionally, the capacity of different macrophytes species to affect the treatment process was examined.Three different macrophyte species were compared: bulrush (Typha latifolia), reed (Phragmites australis) andreed canary grass (Phalaris arundinacea). They were planted into containers (lysimeters) with a size of1 m × 1 m × 1 mwhich were filled with 20 cm gravel at the bottom and 50 cm sludge on top, into which themacrophytes were planted. During the twelve months experiment reduction of 20–30% for HHCB and AHTN,70% for Triclosan and 70% for OTNE were determined under environmental conditions. The reduction is mostlikely due to degradation, since volatilization, uptake into plants and leaching are insignificant. No differencebetween the containers with different macrophyte species or the unplanted containers was observed.Considering the usual operation time of 10 years for reed beds, an assessmentwasmade for thewhole life time.
© 2009 Elsevier B.V. All rights reserved.
1. Introduction
Reed beds have been used for dewatering and mineralisation ofsludge in Europe since 1988 (Nielsen et al., 1992). In comparison to theother technologies (incineration, land filling, land application etc.) thereedbedhas a numberof advantages. It is relatively inexpensive to build,operate and maintain. It consumes less energy, and discharges aminimum of CO2 into the atmosphere in comparison to the othertechniques of sludge disposal (Davison et al., 2005).
It has beenwidely accepted that reed beds have the ability to dewaterand stabilise sludge (Edwards et al., 2001; Nielsen, 2003, 2005a; Nassar etal., 2006) and to reduce BOD and COD content (Gschlößl and Stuible,2000;Davison et al., 2005; Kayser andKunst, 2005). Additionally, removalof LAS and NPE during reed bed treatment of mesophilically digestedsludge was observed during a 9 months study by Nielsen (2005b).Moreover Nassar et al. (2006) investigated the cost of sludge treatmentusing reed bed to be 0.34 US$ m−3 compared with 1.01 US$ m−3 for
treatment using conventional drying beds in the Gaza Strip. Therefore,reed beds are used especially in rural areas where space is relativelyinexpensive for treating sludge before final disposal or use in agriculture.
Macrophytes (plants) play a critical part in the reed bed sludgetreatment process, with their rhizomes creating the necessary environ-ment for the bacterial and physical–chemical processes (Pauly et al.,2006; Nielsen, 2005a). The plant rhizomes provide surfaces for bacterialgrowthaswell as forfiltrationof solids. Furthermore, their oxygen supply(Armstrong et al., 1990) creates oxidised micro-environments, stimulat-ing both the decomposition of organic matter and the growth ofnitrifying bacteria. The roots are also thought to stabilise the hydraulicconductivity at a desired level (Gumbricht, 1992). Common reed(Phragmites australis), which is widely used in reed bed treatmenttechnologies, is an aquatic grass with a distribution extending from coldtemperate regions to the tropics (Karunaratne et al., 2003). It is a robustplant which can tolerate a fairly wide range of pH and salinity. However,the other aquatic grasses, bulrush (Typha latifolia) and reed canary grass(Phalaris arundinacea) are also frequently used in the reed bed systems(Vymazal, 1998, 2001). The first of the two aims of this paper is to assessthe role of macrophytes in the sludge reed bed treatment technologiesconcerningdifferenteffects on removal of persistentorganic compounds.
The second aim of this paper is to investigate dissipation kinetics aswell as removal mechanism of organic micro-pollutants during the
Science of the Total Environment 407 (2009) 5743–5749
⁎ Corresponding author. Department of Biotechnology, Chemistry and EnvironmentalEngineering, Aalborg University, Sohngaardsholmsvej 57, 9000 Aalborg, Denmark.Tel.: +45 9940 9939; fax: +45 9635 0558.
E-mail address: [email protected] (K. Bester).
0048-9697/$ – see front matter © 2009 Elsevier B.V. All rights reserved.doi:10.1016/j.scitotenv.2009.07.023
Contents lists available at ScienceDirect
Science of the Total Environment
j ourna l homepage: www.e lsev ie r.com/ locate /sc i totenv

Author's personal copy
sludge reed bed treatment process. In contrast to an earlier study, thatwas conducted on a technical open sludge reed bed (Chen et al., 2009),in this study more controlled enclosed environments (containerlysimeters) are being used.
Personal care product ingredients were used as marker com-pounds as they are among themost abundant in sludge (Kinney et al.,2006), and they are presumably emitted continuously in contrast tomost other pollutants. Personal care compounds are among the mostcommonly detected compounds in waste water for the last 40 years(Xia et al., 2005; Kolping et al., 2002). They are released after use viasewer system into sewage treatment plants. Because of the relativelyhigh lipophilicity of the compounds, sorption is the main processrelevant for elimination in sewage treatment plants. Previousinvestigations have indicated that land application of sludge maybe a potentially important route through which personal careproducts enter the environment (Xia et al., 2005). As a matter offact, musk fragrances such as HHCB and AHTNwhich are mainly usedin domestic purpose as well as Triclosan and OTNE have recentlybeen identified as important anthropogenic organic contaminants insewage sludge (Kinney et al., 2006; Simonich et al., 2002; Besteret al., 2008a,b).
HHCB, AHTN and OTNE are currently among the most frequentlyused fragrances in cosmetic, cleaning and personal care products,
while Triclosan is an antimicrobial agent which is widely used intoothpaste, soaps, deodorants, cosmetics and skin care lotions as wellas other consumer goods (Adolfsson-Erici et al., 2002; Bester, 2005,2007). In Table 1 the structural formulas and other details on thecompounds are presented. The annual production of the respectivecompounds is: 350 tons Triclosan (Singer et al. 2002), over 2000 tonsHHCB and AHTN (Balk and Ford, 1999; Dsikowitzky et al., 2002) and2500–3000 tons OTNE (Gautschi et al., 2001). The primary emissionroute for these compounds after usage is through waste water. Theseare very lipophilic, persistent substances, thus they are transferred to ahigh extent from waste water into sludge during waste watertreatment. Thus they were chosen as marker substances for elimina-tion/degradation studies in sludge reed beds.
2. Materials and methods
2.1. Chemicals
AHTN and Triclosan were purchased from Ehrenstorfer (Augsburg,Germany) as pure compounds with purity being ≥99% according tothe supplier. OTNE and pure standards of HHCB-lactone as well asHHCB were obtained in pure form (N99%) from International Flavoursand Fragrances (IFF, Hilversum, Netherlands).
Table 1Compounds of interest.
Name Formula name CAS Structure M.W. Log kow
HHCB 1,3,4,6,7,8-hexahydro-4,6,6,7,8,8-hexamethylcyclopenta-(g)-2-benzopyran
1222-05-5 258g mol−1 5.7
AHTN 7-acetyl-1,1,3,4,4,6 hexamethyl-1,2,3,4tetrahydronaphthalene
1506-02-1 258 g mol−1 5.9
HHCB-lactone HHCB-lactone 507442-53-7 272 g mol−1 4.7
Triclosan 2,4,4′-trichloro, 2′-hydroxy-diphenylether 3380-34-5 290 g mol−1 4.2–4.76
OTNE 7-acetyl, 1,2,3,4,5,6,7,8-octahydro-1,1,6,7-tetramethyl naphthalene
54464-57-2 234 g mol−1 5.7
5744 X. Chen et al. / Science of the Total Environment 407 (2009) 5743–5749

Author's personal copy
The internal standard MX 2D15 was used to quantify the musks andOTNE as it elutes in the same fraction throughout all clean-up steps asthese compounds, while TPP 2D15 was used in this experiment toquantify Triclosan and HHCB-Lactone. Musk xylene 2D15 was obtainedfrom Ehrenstorfer (Augsburg, Germany), TPP 2D15 was synthesizedfrom 2D6 phenol and phosphoroxychloride (Andresen and Bester,2006). These internal standards were chosen as they give undisturbedsignal, and also not undergo any reaction themselves.
Ethyl acetate, acetone and cyclohexane were used in analyticalgrade (p.a.) quality, while toluene and n-hexane were used in residuegrade (z.R.) quality. All solvents were purchased from Merck,Darmstadt, Germany.
2.2. Experimental setup and sampling
In this project pre-treated sludge from a reed bed sludge treatmentfacility in Meppen, Germany was used. This pre-treated sludge waschosen because it is plant-compatible and capable of dewatering(Nielsen, 2003; Nassar et al., 2006).
16 containerswith a sizeof 1 m × 1m × 1mwerebuilt fromstainlesssteel and filled with a 20 cm layer of gravel (16–32 mm) and 50 cm pre-treated sludge, from which plants and roots had been removed toprevent reeds from growing in the experiments with the other species(Fig. 1). The containers were placed outdoors on a test facility. Fourcontainers were planted with reed canary grass (P. arundinacea), fourwith bulrush (T. latifolia), and another four with reed (P. australis) at adensity of 12 plants m−2 to study the effects of the different species onthe degradation process of organic pollutants. Four containers were leftunplanted in order to distinguish the impact of the root system on theperformance of the containers for the degradation of the targetcompounds. From May, 2007 to April, 2008 samples were taken foranalysis of personal care products. In the first five months which was avery dry period, each container was watered by awater faucet for 2 min(ca. 27 l) per week to support the growing of the plants. The sludgesamples were taken from a depth of 5–10 cm. The experiment wasconducted under ambient temperature, water content and plant density.
2.3. Preparation and clean-up of sludge
After sampling, 200 g samples were immediately frozen in arefrigerating room at−27 °C overnight. Frozen sub-samples of 50 g wetweight were lyophilised at 2 mbar and −46 °C (ALPHA 1–2/LD, Christ,Osterode am Harz, Germany). The lyophilised sludge samples were
extracted by means of accelerated solvent extraction (ASE200, Dionex,Sunnyvale, USA) with ethyl acetate at 90 °C and 150 bar. After adding analiquot of 100 μl internal standard solution (IS) (containing 100 ng 2D15musk xylene and 100 ng TPP 2D15), the resulting extracts wereconcentrated by a Büchi Synchore multiport concentrator at 80 °C and70 mbar (Büchi, Essen, Germany) to 1 ml and were successively cleanedupwith 1 g silica SPE solid-phase extraction cartridges (silica 60 obtainedfromMerck, Darmstadt, Germany) by elution with ethyl acetate.
These resulting solutions were condensed again and injected into aGPC-column(BioradSX-3) ID: 2.5 cm, length: 30 cm,flow:5.0mlmin−1
and cyclohexane:ethyl: acetate 1:1. The solvent eluting in the first19:30 minwasdrained towaste,while the fraction19.30–30.00 minwascollected. Thus,macromoleculeswere separated as they elute in thefirstfraction, while sulphur, etc. are separated from the target compounds asthey are eluted after the analyte fraction. The samples were finallytransferred into toluene as shown above. The resulting extracts werefinally fractionated on silica using 5% Methyl-tertbutylether MTBE in n-hexane and ethyl acetate successively as eluents (2 fractions).
2.4. Instrumental analysis
The resulting fractions were condensed and finally analysed by gaschromatography with mass spectrometric detection (GC–MS)equipped with a programmable temperature vapouriser (PTV)injector. The PTV (1 μl injection volume) was operated in PTV splitlessmode. The injection temperature of 115 °C was held for 3 s, it wassuccessively ramped with 12 °C s−1 to 280 °C for the transfer of theanalytes. This temperature was held for 1.3 min. The injector was thenramped with 1 °C s−1 to 300 °C which was held for 7 min with 20mlmin−1 as a cleaning phase.
The GC separation was performed with a DB-5MS column (J&WScientific), L: 15 m; ID: 0.25 mm; film: 0.25 μm and a temperatureprogrammeof: 100 °C (hold: 1 min) rampedwith30 °Cmin−1 to 130 °Cand with 8 °C min−1 successively to 220 °C. Finally, the bakingtemperature was reached by ramping the column with 30 °C min−1 to280 °Cwhichwas held for 7 min. The detector of themass spectrometer(DSQ, Thermo Finnigan, Dreieich, Germany) was operated with 1281 V,230 °C ion source temperature and 250 °C interface temperature.
2.5. Leachate
When rain water passes through the sludge layer, some compoundscan be dissolved (mobilised from the sludge), which could also lead to a
Fig. 1. Container section plan.
5745X. Chen et al. / Science of the Total Environment 407 (2009) 5743–5749

Author's personal copy
decreased concentration of compounds in the sludge. Thus two samplesfor out-flowing water were taken as duplicates from each container. 1 lsamples were extracted for 20 min with 20 ml toluene by means ofvigorous stirringwith a teflonizedmagnetic stir barafter addinganaliquotof 100 μl internal standard solution. Theorganicphasewas separated fromthe aqueous one and the residual water was removed from the organicphase by freezing the samples overnight at−20 °C. The resulting extractswere then concentrated with a Büchi Synchore at 80 °C and 70 mbar to1 ml. The resulting extracts were quantified by using GC–MS.
The compounds were detected by means of their mass spectraldata and retention times. For quantitative measurements the methodwas validated (Simonsick and Prokai, 1995; Peck, 2006; Bester, 2004,2007, 2009). Calibrations were performed as a multi-step internalstandard calibration. Recovery rates were determined by spikingsludge with respective standard concentrations at 5000 ng g−1 (Chenet al., 2009; Chen and Bester, submitted for publication).
3. Results
3.1. Method quality assurance
The recovery rates were 60–133%, and the relative standarddeviations were 5–12%. Limits of quantification (LOQ) were calculatedfrom the analysis of standard solutions, which gave signal to noiseratios (s/n) of at least 10 as well as from the lowest concentration forthe respective substance that was detectable from the recoverystudies. Full data are given in Chen et al. (2009) and Chen and Bester(submitted for publication).
3.2. Water content
Water content increased from 52% (in May 2007) to 61% (in Sep2007) due to the 27 l of watering every week, and stayed constantafter Sep 2007 since the rainfall and evaporation were equal. Nosignificant difference of water content was detected between plantedand unplanted containers as well as containers within different plants.
3.3. Mineral content
The mineral content of sludge increased during the experimentalperiod, which indicates occurrence of degradation of organic material.The mineral content ranged from 40% to 52% in the reed canary grassplanted containers, from 40% to 49% in the bulrush planted containers,from 40% to 50% in the reed planted containers as well as unplantedcontainers. No significant difference of mineral content was detectedbetween planted and unplanted containers as well as containers withdifferent plants.
3.4. Personal care products
The highest concentrations of the polycyclic musk compoundsHHCB, AHTN were determined in the beginning of the project, whichis 11,000 ng g−1 (dry weight) HHCB and 2250 ng g−1 (dry weight)AHTN. These are corresponding to the results obtained by Muelleret al. (2006). After 12 months, the HHCB concentrations were reducedby 25% in the reed canary grass planted containers, 27% in the bulrushplanted containers, 22% in the reed planted containers and 23% in theunplanted containers. Similar to HHCB, AHTN was reduced by 24% inthe reed canary grass planted containers as well as in the bulrushplanted containers, 20% in the reed planted containers and 21% in theunplanted containers after 12 months.
Byway of contrast, the primarymetabolite of HHCB, i.e. HHCB-lactoneshowed increasing concentration during the experimental period. Theconcentration of HHCB-lactone was 1200 ng g−1 (dry mass) at thebeginning of the experiment. After 12 months the concentrationsincreased up to 1600 ng g−1 (dry mass) in the reed canary grass planted
containers aswell as in the bulrush planted containers,while 1700 ng g−1
(dry mass) was reached in the reed planted and unplanted containersafter 12 months.
HHCB started with concentration of 11,000 ng g−1 (dry mass), andbecame 8300, 8000, 8500 and 8500 ng g−1 (dry mass) in the reedcanary grass, bulrush, reed and unplanted containers. Considering theincreasing concentration of HHCB-lactone, it can be calculated thatabout 4%, 3%, 5% and 5% of the starting concentrations of HHCB wereoxidised to HHCB-lactone in the reed canary grass, bulrush, reed andunplanted containers, respectively. However, not all of the missingHHCB turns up as HHCB-lactone. It is most probable, that theoxidation and transformationwent on to form secondary metabolites.The first step is in agreement with Bester (2004), Berset et al. (2004)and Reiner and Kannan (2006) who found oxidation of HHCB toHHCB-lactone in the aeration tank of waste water sewage treatmentplant.
Fig. 2a and b shows the log C/C0 plot for OTNE concentration as afunction of time. The highest amount 1600 ng g−1 (dry mass) wasdetermined in the beginning of the project. After thirteen months theOTNE concentrationswere reducedby 70%, 73%, 72% and 73% in the reedcanary grass, bulrush, reed and unplanted containers, respectively.
The concentrations of Triclosan (log C/C0 plot: Fig. 3a) in thebeginning of the experiment were 800 ng g−1 (dry mass). Afterthirteen months the Triclosan concentrations were reduced to lessthan 50% and the concentrations were 360, 310, 390 and 360 ng g−1
(dry mass) in the reed canary grass, bulrush, reed and unplantedcontainers. Considering a standard deviation of 12% from the methodvalidation this difference to the starting concentration is significant.
Fig. 2. Kinetics of OTNE degradation in log form. a. Kinetics of OTNE degradation incontainers with different macrophyte species. b. Kinetics of OTNE degradation inbulrush planted containers with 95% confidence interval.
5746 X. Chen et al. / Science of the Total Environment 407 (2009) 5743–5749

Author's personal copy
4. Discussions
The processes that contributed to the dissipation of the studiedcompounds in sludge may include volatilization, plants uptake,leaching, and biological transformation (aerobic and anaerobic).Considering their generally low volatility (vapour pressure ofHHCB=0.073 Pa, AHTN=0.061 Pa, OTNE=0.2 Pa, and Triclo-san=0.00062 Pa), the tendency of these compounds to volatize islow. Therefore it is expected that only small fractions of thesecompounds were volatilized into the atmosphere, where they couldalso be photolyzed (Aschmann et al., 2001; Difrancesco et al., 2004;Chen et al., 2008). To identify the relevant processes the dissipationdata were analysed to determine the respective first-order reactionconstants and half-lives. To discriminate microbial processes againstuptake into plant biomass, the concentrations of the respectivecompounds were analysed in sludge as well as in plant biomass and inleachate water.
4.1. Concentrations in plant biomass
To quantify the uptake of xenobiotic compounds, roots, rhizomeand leaves of the three plants were analysed using the same procedureas for sludge. In these samples none of the compounds was detected(LOQ are give in Chen et al., 2009), which indicated that uptake intoplant material is not relevant for the mass balance in the containerexperiment. This is in agreement with the results of Litz et al. (2007)who studied uptake of HHCB and AHTN by lettuce and carrots and
found HHCB and AHTNwere taken up only by the carrot roots to somesmall extent. It is also well in agreement with the earlier field study(Chen et al., 2009).
4.2. Leachate
The amount of compounds in leachate water can be calculatedbased on the concentration of compounds in the effluent and amountof water flowing through the system. The sludge used in this project ispre-treated sludge, which is already well dry, crumbly and structured,and not as paste like as fresh sludge and therefore it is easier for waterand oxygen to pass through than for example the normal excess ordewatered sludge. In this case the worst case assumption is allrainwater and all irrigation water leach completely (no evaporation).
The rainfall amount during the experimental period (from May2007 toApril 2008) is 900 mm(1mm=1 lm−²). The irrigationvolumeis thus 900 l.
Since only 0.14% of the HHCB in the container was found in theleachatewater, it appears that, leaching is irrelevant for the removal ofcompounds from the sludge in sludge reed bed treatment. Thecorresponding numbers are 0.16% AHTN and 0.52% Triclosan as well asOTNE (calculation details see supplementary material). Thus it occursthat (micro) biological transformation was the main dissipationmechanism for these compounds. Comparable result was obtained byLitz et al. (2007) who found a leaching rate of b0.001% for HHCB andAHTN in a leaching experiment using small soil lysimeter over a testperiod of 48 h simulating a rain of 200 mm.
4.3. Kinetic analysis of dissipation data
Considering no significant volatilization, plants uptake and leach-ing occurred; biological degradation is thus dominant in the ex-periment process.
Biological degradation of organic compounds at low concentra-tions usually follows first-order kinetics, if the temperature and othercritical parameters are constant. As temperature was not constant,first-order kinetics are only an approximation of the real degradationkinetics. However, this approach, with working with big installationsunder real conditions was assessed to give more realistic results thanexperiments under temperature controlled laboratory experiments.An elimination rate constant (k) for compound removal in the reedbed containers was calculated from the concentrations during theexperiment using Eq. (1). For the HHCB degradation process therespective k values are between 0.0005 and 0.0007 in the diverseexperiments (canary grass, bulrush, reed and unplanted containers).
K =ln C0
C
h it
ð1Þ
k=elimination rate constant, C0=starting concentration, t=time.With Eq. (2), the half-life can be assessed:
t1=2 =ln½C0C02 �
k=
ln2k
: ð2Þ
Tentative half-lives were calculated for OTNE. The respective graphsare displayed in Fig. 2a. For the experiment with bulrush the results arecalculated with a confidence interval as an example (Fig. 2b). OTNE waseliminatedwithhalf-lives of 204,187,198 and187 days in the reed canarygrass, bulrush, reed and unplanted containers, respectively (Table 2).These data are consistent with data from full scale for which half-lives of239–277 d were found in the middle and bottom layers (Chen et al.,2009). Comparable half-lives were also observed by Difrancesco et al.(2004) with OTNE dissipation half-lives of 30–100 days in sludge-amended soils. No significant difference was detected for the respective
Fig. 3. Kinetics of Triclosan degradation in log form. a. Kinetics of Triclosan degradationin log formwith first data point. b. Kinetics of Triclosan degradation in log formwithoutfirst data point.
5747X. Chen et al. / Science of the Total Environment 407 (2009) 5743–5749

Author's personal copy
setups. Obviously the support of the microbial activity by the respectiveplants was not significant for these experiments.
Tentative half-lives for Triclosan were calculated as continuous first-order kinetics (Fig. 3a) 433, 330, 462 and 385 days in the reed canarygrass, bulrush, reed and unplanted containers, respectively (Table 2).However, the respective data could also be interpreted as a fastdegradation in the first month and a slower degradation in the followingones (Fig. 3b). This behaviour could be induced by oxygen supply duringinstallation of the experiments, or high temperatures. However degrada-tion half-lives of 315–330 d were also found in a full scale study for themiddle and bottom layers (Chen et al., 2009). No significant differencewas detected for the respective setups with the different plants in thecontainer study. Obviously the support of the microbial activity by therespective plants was not significant for these experiments. This iscorresponding to the results which were gained by Ying et al. (2007) byspiking Triclosan into loamy soil with a concentration of 1 mg kg−1 (i.e.1000 ng g−1), 18 days half-life was calculated under aerobic conditionswithin this 70 days experiment. Laboratory studies showed significantbiodegradation of Triclosan in activated sludge, and indicating thatadaptation was a critical factor determining the rate and extent ofbiodegradation (Federle et al., 2002).
Tentative half-lives for HHCB can be calculated as 1160, 990, 1390and 1160 days in the reed canary grass, bulrush, reed and unplantedcontainers, respectively (Table 2). No significant difference wasdetected for the respective setups. Obviously the support of themicrobial activity by the respective plants was not significant for theseexperiments. These results are consistent with data from full scaleexperiments in which HHCB also proved to be persistent with half-lives N three years (Chen et al., 2009).
Tentative half-lives of AHTN degradation were calculated as 870,770, 990 and 770 days in the reed canary grass, bulrush, reed andunplanted containers, respectively (Table 2). These values should tobe viewed as tentatively, as the experimental period (twelve months)is too short to reveal such a slow degradation process. This also wasconsistent with full scale studies, in which AHTN proved to bepersistent with half-lives over three years (Chen et al., 2009). Nosignificant difference was detected for the respective setups.Obviously the support of the microbial activity by the respectiveplants was not significant for these experiments. Nevertheless thedata indicated that HHCB and AHTN are belonging to the group of verypersistent pollutant. This is corresponding to the results which weregained by Mueller et al. (2006) and Litz et al. (2007) that aerobicdissipation of HHCB and AHTN in soil/sewage sludge mixtures is veryslow with half-lives of 10–17 months for HHCB and 2–24 years forAHTN. Similarly, Difrancesco et al. (2004) also found a particularlyslow dissipation for HHCB and AHTN in sludge-amended soils.
4.4. Effects of macrophytes
Microbial processes play a significant role for the proper function-ing of reed beds. The major role of macrophytes is probably in thedewatering of sludge. The dewatering capacity of a reed bed ismaintained or improved by the mechanical activity of the reeds in thesludge layer. The mechanical activity includes shoots and rhizomes,which move through the sludge, as well as the above groundmovement of the plants due to wind (Nielsen, 2003, 2005a).
Also, plants provide oxygen to the sludge in the reed beds. Withslow percolation of oxygen into the sludge layer, both via the reedplants and their root zone, and by diffusion through the air–sludgeinterface, the sludge gradually becomes oxidised and stabilised (DeMaeseneer, 1997). In our experiment no significant effect of thedifferent macrophytes on mineralisation and biodegradation oforganic micro-pollutants in sludge was detected, however someother research did find positive results (Zwara and Obarska-Pempkowiak, 2000; Pempkowiaka and Obarska-Pempkowiak, 2002;Nielsen, 2003, 2005a), this may be due to the low amount of sludge inthe small-scale (1 m3 box) containers, so that the influence ofboundary effects and weather gain more influence on the processesthan they do in full scale.
5. Conclusion
The sludge reed bed container study showed that the reed bedsludge treatment technology is able to reduce persistent organicpollutant (such as HHCB, AHTN, Triclosan, and OTNE) significantly.After a twelve month experiment, only 73%–78% of HHCB, 76%–80% ofAHTN, 38%–48% of Triclosan and less than 30% of OTNEwere left in thecontainers. The decrease of pollutants during the full life time(10 years) of reed beds would be much higher than, that, obviously.
It is most likely that microbial degradation processes are the domi-nating ones in this setup, since most of the corresponding degradationproducts (metabolites) could be identified (HHCB/HHCB-lactone). Anaccounting ofmaterial flows in addition showed that only a small fraction(b1%) of the target substances was washed out (leached) with theeffluent. The uptake of personal care products into the biomass of themacrophytes can also be neglected.
The different macrophyte species did not have a significant effecton the dewatering process as well as degradation of the respectivecompounds in this experiment.
Acknowledgements
The authors acknowledge the support of ProInno/AIF and xeno-biotic groups of university of Duisburg–Essen as well as Thomas Großand Enno Pieper for sampling.
Appendix A. Supplementary data
Supplementary data associated with this article can be found, inthe online version, at doi:10.1016/j.scitotenv.2009.07.023.
References
Adolfsson-Erici M, Pettersson M, Parkkonen J, Sturve J. Triclosan, a commonly usedbactericide found in human milk and in the aquatic environment in Sweden.Chemosphere 2002;46:1485—9.
Andresen J, Bester K. Elimination of organophosphate ester flame retardants andplasticizers in drinking water purification. Water Res 2006;40:621—9.
ArmstrongW, Armstrong J, Beckett PM.Measurement andmodelling of oxygen release fromroots of Phragmites australis. In: Cooper P, Findlater BC, editors. The use of constructedwetlands in water pollution control. London: Pergamon Press; 1990. p. 41—51.
Aschmann SM, Arey J, Atkinson R, Simonich SL. Atmospheric lifetimes and fates of selectedfragrance materials and volatile model compounds. Environ Sci Technol2001;35:3595—600.
Balk F, Ford RA. Environmental risk assessment for the polycyclic musks AHTN andHHCB in the EU I. Fate and exposure assessment. Toxicol Lett 1999;111:57—79.
Table 2Tentative half-lives of the compounds during the experimental period.
Compounds Plants Tentative half-life (days) 95% CI
HHCB Reed canary grass 1155 516–∞Bulrush 990 506–∞Reed N1095 513–∞Unplanted N1095 558–∞
AHTN Reed canary grass 866 553–∞Bulrush 770 447–∞Reed 990 460–∞Unplanted 770 440–∞
Triclosan Reed canary grass 433 187–∞Bulrush 330 175–∞Reed 462 201–∞Unplanted 385 183–∞
OTNE Reed canary grass 204 147–330Bulrush 187 145–263Reed 198 134–378Unplanted 187 147–259
∞ means half-lives larger than 3 years (1095 d) also 95% confidence intervals (CI) areindicated.
5748 X. Chen et al. / Science of the Total Environment 407 (2009) 5743–5749

Author's personal copy
Berset JD, Kupper T, Etter R, Tarradellas J. Considerations about the enantioselectivetransformation of polycyclic musks in wastewater, treated wastewater and sewagesludge and analysis of their fate in a sequence batch reactor plant. Chemosphere2004;57:987—96.
Bester K. Retention characteristics and balance assessment for two polycyclic muskfragrances (HHCB and AHTN) in a typical German sewage treatment plant.Chemosphere 2004;57:863—70.
Bester K. Fate of triclosan and triclosan-methyl in sewage treatment plants and surfacewaters. Arch Environ Contam Toxicol 2005;49:9-17.
Bester K. Personal care compounds in the environment. Weinheim, Germany: VCH-Wiley;2007. 9–13 pp.
Bester K. Analysis of musk fragrances in environmental samples. J Chromatogr A2009;1216:470—80.
Bester K, Hüffmeyer N, Schaub E, Klasmeier J. Surfacewater concentrations of the fragrancecompound OTNE in Germany—a comparison between data from measurements andmodels. Chemosphere 2008a;73:1366—72.
Bester K, Klasmeier J, Kupper T. Emissions of OTNE (Iso-E-super) — mass flows insewage treatment plants. Chemosphere 2008b;71:2003—10.
Chen ZL, Song QJ, Cao GQ, Chen YF. Photolytic degradation of triclosan in the presence ofsurfactants. Chem Pap-Chem Zvesti 2008;62:608—15.
Chen, X., Pauly, U., Rehfus, S., Bester, K., Personal care compounds in advanced biologicalsludge treatment. Chemosphere 2009;76:1094—1101.
Chen, X. and Bester, K., Determination of organic Micro-pollutants in sludge, Anal.Bioanal. Chem., submitted for publication.
Davison L, Headley T, Pratt K. Aspects of design, structure, performance and operation ofreed beds — eight years' experience in northeastern New South Wales, Australia.Water Sci Technol 2005;51:129—38.
De Maeseneer JL. Constructed wetlands for sludge dewatering. Water Sci Technol1997;35:279—85.
Difrancesco AM, Chui PC, Standley LJ, Allen HE, Salvito DT. Dissipation of fragrancematerials in sludge-amended soils. Environ Sci Technol 2004;38:194—201.
Dsikowitzky L, Schwarzbauer J, Littke R. Distribution of polycyclic musks in water andparticulate matter of the Lippe River (Germany). Org Geochem 2002;33:1747—58.
Edwards JK, Gray KR, Cooper DJ, Biddlestone AJ, Willoughby N. Reed bed dewatering ofagricultural sludges and slurries. Water Sci Technol 2001;44:551—8.
Federle TW, Kaiser SK, Nuck BA. Fate and effects of triclosan in activated sludge. EnvironToxicol Chem 2002;21:1330—7.
Gautschi M, Bajgrowicz JA, Kraft P. Fragrance chemistry —milestones and perspectives.Chimia 2001;55:379—87.
Gschlößl T, Stuible H. Reed bed systems: design, performance and maintainability.Water Sci Technol 2000;41:73—6.
Gumbricht T. Tertiary wastewater treatment using the root-zone method in temperateclimates. Ecol Eng 1992;1:199—212.
Karunaratne S, Asaeda T, Yutani K. Growth performance of Phragmites australis in Japan:influence of geographic gradient. Environ Exp Bot 2003;50:51—66.
Kayser K, Kunst S. Processes in vertical-flow reed beds: nitrification, oxygen transferand soil clogging. Water Sci Technol 2005;51:177—84.
Kinney C, Furlong E, Zaugg S, Burkhardt M, Werner S, Cahill J, et al. Survey of organicwastewater contaminants in biosolids destined for land application. Environ SciTechnol 2006;40:7207—15.
Kolping DW, Furlong ET, Meyer MT, Thurman EM, Zaugg SD, Barber LB, et al.Pharmaceuticals, hormones, and other organic wastewater contaminants in U.S.streams,1999–2000: a national reconnaissance. Environ Sci Technol 2002;36:1202—11.
Litz NT, Mueller J, Boehmer W. Occurrence of polycyclic musks in sewage sludge andtheir behaviour in soils and plants part 2. J Soils Sediments 2007;7:36—44.
Mueller J, Boehmer W, Litz NT. Occurrence of polycyclic musks in sewage sludge andtheir behaviour in soils and plants part 1. J Soils Sediments 2006;6:231—5.
Nassar AM, Mciwem MS, Afifi S. Sludge dewatering using the reed bed system in theGaza Strip, Palestine. Water Environ J 2006;20:27—34.
Nielsen S. Sludge drying reed beds. Water Sci Technol 2003;48:101—9.Nielsen S. Sludge reed bed facilities: operation and problems. Water Sci Technol
2005a;51:99-107.Nielsen S. Mineralisation of hazardous organic compounds in a sludge reed bed and
sludge storage. Water Sci Technol 2005b;51:109—17.Nielsen S, Andersen K, Christensen LB. Biological sludge treatment. Investigation of sludge
dewatering andmineralization plants plantedwith reeds. Research inwastewater, vol.38. Danish Environmental Protection Agency; 1992. (summary in English).
Pauly U, Rehfus S, Peitzmeier M. 15 years operational experience in the humification ofsewage sludge in reed beds, proceedings. Organic Recovery and Biological Treatment,Weimar; 2006.
Peck AM. Analytical methods for the determination of persistent ingredients of personalcare products in environmental matrices. Anal Bioanal Chem 2006;386:907—39.
Pempkowiaka J, Obarska-Pempkowiak H. Long-term changes in sewage sludge storedin a reed bed. Sci Total Environ 2002;297:59—65.
Reiner JL, Kannan K. A survey of polycyclic musks in selected household commoditiesfrom the United States. Chemosphere 2006;62:867—73.
Simonich SL, Federle TW, EckhoffWS, Rottiers A, Webb S, Sabaliunas D, et al. Removal offragrance materials during US and European wastewater treatment. Environ SciTechnol 2002;36:2839—47.
Simonsick WJ, Prokai L. Size-exclusion chromatography with electrospray mass-spectrometric detection. Chromatographic characterization of polymers-hyphe-nated and multidimensional techniques. Adv Chem Ser 1995;247:41—56.
Singer H, Muller S, Tixier C, Pillonel L. Triclosan: occurrence and fate of a widely usedbiocide in the aquatic environment: field measurements in wastewater treatmentplants, surface waters, and lake sediments. Environ Sci Technol 2002;36:4998—5004.
Vymazal J. Introduction. In: Vymazal J, Brix H, Cooper PF, Green MB, Haberl R, editors.Constructed wetlands for wastewater treatment in Europe. Leiden: BackhuysPublishers; 1998. p. 1-15.
Vymazal J. Constructed wetlands for wastewater treatment in the Czech Republic.Water Sci Technol 2001;44:369—74.
Xia K, Bhandari A, Das K, Pillar G. Occurrence and fate of Pharmaceuticals and PersonalCare Products (PPCPs) in biosolids. J Environ Qual 2005;34:91-104.
Ying GG, Yu XY, Kookana RS. Biological degradation of triclocarban and Triclosan in asoil under aerobic and anaerobic conditions and comparison with environmentalfate modelling. Environ Pollut 2007;150:300—5.
Zwara W, Obarska-Pempkowiak H. Polish experience with sewage sludge utilization inreed beds. Water Sci Technol 2000;41:65—8.
5749X. Chen et al. / Science of the Total Environment 407 (2009) 5743–5749


Research paper 3:
Chen XJ. and Bester K. Determination of organic micro-pollutants such as personal
care products, plasticizer and flame retardants in sludge, Anal Bioanal Chem (2009)
395:1877–1884

ORIGINAL PAPER
Determination of organic micro-pollutants such as personalcare products, plasticizers and flame retardants in sludge
Xijuan Chen & Kai Bester
Received: 18 August 2009 /Accepted: 7 September 2009 /Published online: 25 September 2009# Springer-Verlag 2009
Abstract In this study, a method for the determination oforganic micro-pollutants, i.e. personal care products such assynthetic musk fragrances, household bactericides, organo-phosphate flame retardants and plasticizers, as well asphthalates in sludge, has been developed. This method isbased on lyophilisation and accelerated solvent extractionfollowed by clean-up steps, i.e. solid phase extraction andsize exclusion chromatography. The determination isperformed by gas chromatography coupled to mass spec-trometry. Stable isotope-labelled compounds such as muskxylene (MX D15), tri-n-butylphosphate (TnBP D27) andtriphenylphosphate (TPP D15) were used as internal stand-ards. Recovery rates were determined to be 36–114% (withtypical relative standard deviation of 5% to 23%) for thetarget compounds. The limit of detection was 3–30 ng g−1,and the limit of quantification was 10–100 ng g−1 drymatter.
Keyword Personal care products .Musk fragrances .
Triclosan . Household bactericides . Organophosphates .
Phthalates
Introduction
Sewage sludge is produced in waste water treatment whileremoving compounds causing oxygen demand (BOD5) fromthe waste water. Thus sludge contains high concentrations oforganic matter, nutrients (nitrogen and phosphorous) andlipophilic organic micro-pollutants from the waste water.Some countries such as the Nordic countries prefer to use thenutrients in agriculture (re-cycling of sludge), while someothers (e.g. Switzerland) have decided to incinerate allsludges as they prioritised to destroy all micro-pollutants.The majority of countries do a case by case decisiondepending on the concentrations of organic micro-pollutantsand heavy metals. Thus a sound basis for analysing organicmicro-pollutants in sludge is necessary to make sure that onlysludge with low contaminations is used for re-cycling inagriculture. Established methods are usually single or groupspecific such as the methods used to analyse PAHs or PCBs[1, 2]. Often the analytical protocols are similar to thoseestablished for sediments with a high load of TOC.
The compounds included in this study were syntheticmusk fragrances (musk xylene, musk ketone, HHCB,AHTN, HHCB–lactone), an antimicrobial and its metabo-lite (triclosan, triclosan–methyl), organophosphate flameretardants and standing for organophosphate-plasticizers(tri-iso-butylphosphate (TiBP), tri-n-butylphosphate (TnBP),tris-(2-chloroethyl) phosphate (TCEP), tris-(2-chloro-iso-propyl) phosphate (TCPP), tris-(dichloro-iso-propyl) phos-phate (TDCP) and triphenylphosphate (TPP)) and thephthalate (di(2-ethylhexyl) phthalate (DEHP); Table S1).Some of these compounds have been discussed in national aswell as developing EU laws on sludge as maker compoundsfor the re-use of this material [3, 4].
Synthetic musk fragrances are compounds used as lowcost fragrances in soaps, perfumes, air fresheners, deter-
Electronic supplementary material The online version of this article(doi:10.1007/s00216-009-3138-5) contains supplementary material,which is available to authorized users.
X. Chen :K. Bester (*)Department of Biotechnology,Chemistry and Environmental Engineering, Aalborg University,Sohngaardsholmsvej 57,9000 Aalborg, Denmarke-mail: [email protected]
K. BesterInstitute of Environmental Analytical Chemistry,University Duisburg-Essen,Universitätsstr. 15,45141 Essen, Germany
Anal Bioanal Chem (2009) 395:1877–1884DOI 10.1007/s00216-009-3138-5

gents, fabric softeners and other household cleaning prod-ucts. There are four synthetic musk fragrances accounting for95% of the used musk. These are two polycyclic compounds(HHCB and AHTN) as well as the nitro-musks (musk xyleneand musk ketone). These compounds have been detected insurface water [5, 6], in waste water [7–9] and in sewagesludge [10–12]. HHCB–lactone is the primary metabolite ofHHCB (Table S1). The ratio HHCB versus its metaboliteHHCB–lactone has been used to detect transformationprocesses of this fragrance. During the sewage treatmentprocess, about 10% of HHCB is transformed to HHCB–lactone, which has been reported for balance assessment forpolycyclic musk fragrances in a German treatment plant byBester [8]. Reviews of several analytical strategies for theanalysis of musks in sludge have been described by usingaccelerated solvent extraction (ASE), supercritical fluidextraction, Soxhlet extraction and liquid–liquid extraction,all of them in combination with gas chromatography–massspectrometry (GC–MS) [13–15].
Triclosan (Table S1) is an antimicrobial agent, which iswidely used in personal care products such as toothpaste,soaps, deodorants, cosmetics and skin care lotions as wellas other consumer goods. Approximately 1,500 t isproduced annually worldwide, and approximately 350 tof those is applied in Europe [16]. Triclosan–methyl(Table S1) is a transformation product of triclosan. Thesetwo compounds have been identified in the environmentby several investigators [16–21], whereas bioaccumulationand toxicity have been studied by Orvos et al. [22],Coogan et al. [23] and De Lorenzo et al. [24]. Analyticalmethods for analysing antimicrobials in sludge by usingGC–MS and liquid chromatography–MS have beenreviewed by Peck [13].
The organophosphates included in this study werechlorinated alkylphosphates such as TCPP, TCEP andTDCP, which are mostly used as flame retardants inpolyurethane. Additionally, non-derivatised alkylphos-phates such as the two isomers of tri-butylphosphate (TnBPand TiBP) and TPP, which are used as plasticisers, werestudied as well. Because of their relatively low cost,organophosphates especially TCPP have become the mostwidely used class of flame retardants [25]. These com-pounds are washed off from the equipped items duringcleaning; the cleaning water will be discharged to the sewerand thus reach waste water treatment plants, as discussedby Fries and Puttmann [26] as well as by Meyer and Bester[27]. Additionally, these organophosphates have been detectedin indoor air as well as in indoor dust by Sanchez et al. [28]and García et al. [29]. Only a few analytical procedures todetermine organophosphates in sludge or sediment with highTOC content have been described [30, 31].
DEHP is one of the most widely used plasticizers. It isused mainly for making PVC soft and pliable. This
plasticizer is eluted into waste water by washing andcleaning processes of the respective materials; it is assumedto have ecotoxic (endocrine disrupting) effects to aquaticorganisms [32]. Because of the relatively high lipophilicityof this phthalate, sorption is the main process relevant forelimination in sewage treatment plants. Typical concentra-tion of DEHP in sludge was found to be ranging from 10to 100 μg L−1 by Fromme et al. [33]. Extraction methodsin combination with GC–MS have been described bySablayrolles et al. [34] and Aparicio et al. [35].
The main objective of the research presented in thispaper was to develop and validate an analytical multi-method to determine different classes of organic micro-pollutants such as personal care products, plasticizers andflame retardants and phthalates in sludge.
Experimental section
Materials
AHTN, triclosan, musk xylene, musk ketone and DEHPwere purchased from Ehrenstorfer (Augsburg, Germany) aspure compounds with purities being ≥99% according to thesupplier. Pure standards of HHCB–lactone as well asHHCB were obtained from International Flavours andFragrances (IFF, Hilversum, Netherlands). Triclosan–methylwas synthesised from triclosan by methylation with trime-thylsulfonium hydroxide solution (Macherey-Nagel, Dueren,Germany) at 40°C [20].
TCPP and TDCP were obtained from Akzo Nobel(Amersfoort, the Netherlands). These compounds wereused without further purification. The technical TCPP givesthree peaks in the ratio 9:3:1. In this study, only the main(first eluting) isomer was used for determination. TnBP,TiBP, TPP and TCEP were purchased from Sigma-Aldrich(Steinheim, Germany). Ethyl acetate, acetone, cyclohexaneand methanol were used in analytical grade (p.a.) quality,while toluene and n-hexane were used in residue grade(z.R.) quality. All solvents were purchased from Merck(Darmstadt, Germany).
Internal standards
The internal standard musk xylene D15 was used toquantify the musk fragrances musk xylene, musk ketone,HHCB, AHTN, triclosan–methyl and DEHP as it elutes inthe same fraction as these compounds, while TnBP D27 wasused to quantify TiBP, TnBP, TCEP and TCPP, and TPPD15 was used in this experiment to quantify triclosan,HHCB–lactone, TDCP and TPP. Musk xylene D15 andTnBP D27 were obtained from Ehrenstorfer (Augsburg,
1878 X. Chen, K. Bester

Germany); TPP D15 was synthesised from D6 phenol andphosphoroxychloride. These internal standards were chosenas they give undisturbed signal and also do not undergo anyreaction themselves [36].
Analytical method
The sample preparation scheme is shown in Fig. 1: Aftersampling, the sludge samples were immediately frozen at−27°C overnight. “Dried sludge” such as produced at wastewater treatment plants contains about 70% water; thusdrying is essential to provide good wettability of the sludgewith organic solvents. The frozen sub-samples of 40 g wetweight were then lyophilised overnight at 2 mbar and−46°C using an ALPHA 1-2/LD (Christ, Osterode am
Harz, Germany). The 4–6 g lyophilised sludge samples wasblended with about 10 g diatomaeous earth (acid-washedobtained from MP Biomedicals, Solon, OH, USA) andhomogenised in a mill (IKA A11 BASIC, Staufen,Germany) to a fine powder. The homogenates were thentransferred into a 33-mL stainless steel ASE cell andextracted successively with ethyl acetate (ASE 200,Dionex, Sunnyvale, USA). After adding an aliquot of500 μl internal standard solution (IS; containing 500 ng D15
musk xylene, 500 ng TPP D15 and 500 ng TnBP D27), theextract was concentrated to 1 mL by a Büchi Synchoremultiport concentrator (Büchi, Essen, Germany) at 80°Cand 70 mbar.
The resulting extracts were cleaned up with silica solidphase extraction (SPE) cartridges. This step is primarilyprotecting the next step (size exclusion chromatography(SEC)) from too many particles as well as very polarcompounds. It was performed by packing 1 g of silica(silica 60 obtained from Merck, Darmstadt, Germany, pre-dried at 105°C) into a glass column (60 mm long, 12 mmID) with two PTFE frits on the top and bottom of silica.The silica column was conditioned with 12 mL n-hexanebefore use and eluted with 12 mL ethyl acetate after loadingthe samples.
The resulting extracts were again concentrated by aBüchi Synchore multiport concentrator and successivelyinjected into an SEC system (GPC-Basix, purchased fromLC-Tech, Dorfen, Germany) equipped with a glass columnID: 2.5 cm, length 30 cm, packed with 50 g SX-3 (Bio-Rad,Hercules, CA, USA). The mobile phase was cyclohexaneand ethyl acetate (1:1, V/V) and the flow rate was5.0 mL min−1. The solvent eluting in the first 19.30 min(97.5 mL) containing macro-molecules was drained towaste, while the fraction 19.30–30.00 min (52.5 mL)containing the analytes was collected [37]. The sampleswere finally transferred into toluene by adding 10 mLtoluene and condensing to 1 mL. Thus, macro-moleculeswere separated as they are eluted in the first fraction, whilesulphur, etc. are separated from the target compounds asthey are eluted after the analyte fraction.
The resulting extracts were then fractionated for polarityon silica 60 using 12 mL 5% methyl-tertbutylether in n-hexane (first fraction) and 12 mL ethyl acetate (secondfraction) successively as eluents. The musks, triclosan–methyl and DEHP were eluted in the first fraction, whileTiBP, TnBP, TCEP, TCPP, TDCP and TPP as well astriclosan and HHCB–lactone were eluted in the secondfraction according to their polarity. These fractions weretransferred into toluene as described above and finallyanalysed by GC–MS detection.
The GC–MS system was a DSQ purchased fromThermo, Waltham, USA. The GC was equipped with aprogrammable temperature vapouriser (PTV) injector. The
40g sludge
Lyophilisation
2 mbar and -46ºC
ASE
Elute with ethyl acetate at 90ºC and 150 bar
1st clean up
Removal of particles
Elute with ethyl acetate
SEC
Removal of macromolecules
2 nd clean up
Fractionation for polarity
Elute with 5% methyl-
tertbutylether (MTBE) in n-hexane
/ ethyl acetate
GC-MS
Quantitative
Add 500 μl internal
standard solution (IS)
Fig. 1 Sample preparation scheme
Determination of organic micro-pollutants 1879

PTV (1 μl injection volume) was operated in PTV splitlessmode. The injection temperature of 115°C was held for 3 s;it was successively ramped with 12 to 280°C s−1 for thetransfer of the analytes into the column. This temperaturewas held for 1.3 min. The injector was then ramped with 1to 300°C s−1 (open split), which was held for 7 min as acleaning phase.
The GC separation was performed with a DB-5MScolumn (J&W Scientific), L was 15 m, ID was 0.25 mm,and film thickness was 0.25 μm. The oven temperatureprogramme started at 100°C (hold, 1 min) and was thenramped with 30 to 130°C min−1 and successively with 8 to220°C min−1. Finally, the baking temperature was reachedby ramping the oven with 30 to 280°C min−1, which washeld for 7 min.
The transfer line was held at 250°C, which is sufficientto transfer all compounds from the GC into the MS as thevacuum builds up in the transfer line. The ion source wasoperated at 230°C. Helium (4.0) was used as carrier gaswith a flow rate of 1.3 mL min−1. All compounds weredetected by means of their mass spectral data and retentiontimes as shown in Table 1.
Calibrations were performed as a multi-step internalstandard calibration. A stock solution was produced bydissolving 20 mg of the target compounds into 100 mLacetone. This stock solution was stored at 4°C in the dark.The weight of this flask was controlled before and aftereach operation. Calibration standards (3, 10, 30, 100, 300,1,000, 3,000 and 10,000 ng mL−1 in toluene) were made byserial dilution of the stock solution. The calibration stand-ards contained the internal standards with a concentrationof 100 ng mL−1. The calibration curve was calculated byusing a weighted (1/X) linear regression.
Results and discussions
Extracting organic compounds from sludge is optimisedbetween extracting as much as possible of the targetcompound and as little as possible of the organic matterof the sludge, as the latter will be corrupting the GC oreither one of the following steps.
Three experiments were performed to determine theoptimal conditions for the accelerated solvent extraction inthe method development and method validation after it hadbeen decided to focus on ethyl acetate as an extractant:
1. A temperature optimisation, which was compared tototal and destructive extractions
2. Validation from an artificial blank material to determinepotential concentration dependency of the recovery rateas well as blank problems
3. Validation from a spiked sludge to determine recoveryrates by different means as well as gain insight onrealistic precision
Optimisation of extraction temperature
Temperature is the most important parameter used in ASEextraction. ASE operates at temperatures above the normalboiling point of most solvents, using pressure to keep thesolvents in the liquid phase during the extraction process.As the temperature is increased, the viscosity of the solventis reduced, thereby increasing its ability to wet the matrixand solubilise the target analytes. However thermal degra-dation of the solvent or the sample might occur at highertemperatures [38, 39]. In this study a temperature rangefrom 50 to 150°C was tested for the optimisation of
Compound RT (min) Quantifier mass (amu) Verifier mass (amu)
OTNE 5.96 191 219
Musk xylene 8.12 282 297
Musk ketone 9.50 279 294
HHCB 8.03 243 258
AHTN 8.14 243 258
HHCB–lactone 11.73 257 272
Triclosan 11.07 288 290
Triclosan–methyl 11.30 302 304
TiBP 4.37 155 211
TnBP 5.80 155 211
TCEP 7.19 249 251
TCPP 7.46 277 279
TDCP 13.35 379 381
TPP 13.88 325 326
DEHP 14.60 149 167
Table 1 Retention times andselected mass fragments for thedetermination of the respectivecompounds using a DB-5column
1880 X. Chen, K. Bester

extraction. For the extraction of organic micro-pollutants,one sub-sample of homogenised dried sludge was extractedby ASE with temperatures of 50, 70, 90, 110, 130 and150°C, each followed by first clean up, SEC and thesecond clean up as described above. In the end the sampleswere measured by GC–MS. The highest concentration ofHHCB, AHTN, triclosan and HHCB–lactone was foundfrom the 70 and 90°C extractions, which is shown in Fig. 2.The increased concentration of HHCB–lactone found at130°C was interpreted as result of an oxidation of HHCBunder these conditions. Therefore, 90°C was selected as theextraction temperature because of the better extractionefficiency proved here and suggested references [38, 39].As a control, total extractions with acetone and acidifiedmethanol at 150°C were performed. These did not givehigher concentrations than those with ethyl acetate at 90°Cand 150 bar.
Method validation from artificial blank material(manure/soil) recovery rates and working range
These experiments were performed to determine whetherthe recovery rate was dependent on the concentration ornot. The working range was considered to range from thelowest to the highest concentrations for which the samerecovery rates were obtained. A blank material, whichcontains similar TOC and ammonia content as sludge butno analytes, was produced by mixing manure from organicfarming with soil (1:1). Various concentrations of thestandard were spiked into the dried homogenized material.The spiked sub-samples were transferred into ASE cells,which were extracted with the method described above.Table 2 shows the recovery rate and its working rangedetermined from the spiked artificial blank material. Figure S1shows the recovery rate of triclosan as the function ofconcentration. The recovery rates for all compounds areindependent on the concentrations (Table 2). It was alsodemonstrated that no other peaks (e.g. from decomposition/
pyrolysis) of biogenic material that could be mistaken for theanalytes occurred from such matrices.
Method validation from spiked sludge samples (LOQ)
These recovery experiments were carried out by providingsix homogeneous sub-samples from one sludge sample andeach was spiked with 125 μl of the stock solution(200 μg mL−1). Two other sub-samples were left unspikedas comparison. They were lyophilised and then extracted at90°C and 150 bar. The following sample preparation,extraction and clean up were identical to the proceduresdescribed above. For this study, dewatered digested sludgeof an urban waste water treatment plant with 450,000population equivalents, operating BOD, nitrogen andphosphorous removal was used. The sludge had a watercontent of 90% before lyophilisation. The mineral contentof the total solid content was 33%. The concentrations ofthe target compounds in this sludge before and after spikingare shown in Table 3. Figure 3 shows the chromatographiccharacterisation of TCPP in one unspiked sludge sample(18,400 ng g−1).
Since the standard deviation from this six spiked sampleswas low and no outlier was identified, all results wereaveraged. The mean recovery rates were 36–114%, and therelative standard deviations were 5–23% (Table 3), depend-ing on the respective compounds. The lower recovery ratesof musk xylene and musk ketone were possibly due to theoccurrence of biotransformation of the nitro-musks duringthe sample preparation process [40, 41]. The limit ofdetection was taken as signal-to-noise ratio 3:1, and thelimit of quantification (LOQ) was defined as signal-to-noiseratio 10:1, which was calculated by the Xcalibur software(Thermo, Waltham, USA) for the respective SIM chromato-grams of the standard calibration (Table 3). The thusobtained LOQs are in the same range as the lower end ofthe working range (see above, Table 2). Comparable resultswere obtained by Bester [30] who used a similar procedure
0
4000
8000
12000
16000
20000
50ºC 70ºC 90ºC 110ºC 130ºC 150ºC
Rela
tive c
oncentr
ations
HHCB AHTN Triclosan HHCB-lacton
Fig. 2 Relative concentrations of HHCB, AHTN, HHCB–lactone and triclosan obtained by ASE extractions of sludge homogenates at differenttemperatures
Determination of organic micro-pollutants 1881

but utilised a Soxhlet extraction to determine polycyclicmusk fragrances and TCPP in waste water treatment plant.
Stereoisomer separation
Stereoisomer-specific determination often gives in-depthinsights into ongoing processes; however, this analyticaltechnique is more vulnerable to matrix than conventionalanalysis, as the respective columns have lower temperaturelimits. Thus, stereoisomer-specific determination requiresbetter sample clean ups. In this study, it was tested whetherthe developed sample clean up is suitable also forstereoisomer determination. The gained extracts were usedfor stereoisomer separation of OTNE. OTNE has two chiral
centres; thus enantiomers and diastereomers may occur.The synthesis of this compound is not stereoselective; thusboth kinds of stereoisomers are expected in the product[42].
Stereoisomer separation was performed on a heptakis-(2,3-di-O-methyl-6-O-t-butyldimethyl-silyl)-β-cyclodextrin(Hydrodex 6-TBDMS) column (Macherey-Nagel, Düren,Germany). This column is able to separate enantiomers aswell as diastereomers of compounds such as polycyclicmusks [15], but for OTNE only two major peaks wereobserved (Fig. 4). Thorough temperature programme andgas flow optimisation were performed and resulted in a tem-perature programme of 90 �C 1 min½ � ! 10 �C min�1 !115 �C 70 min½ � ! 10 �C min�1 ! 200 �C 30 min½ � at aconstant flow of 1.2 mL min−1 helium gave the bestseparation from the production impurities. However, onlytwo main stereoisomers could be separated. It is thus currentlyunknown whether the achieved separation separates theenantiomers or diastereomers of OTNE. However, in thisstudy, it could be demonstrated that the extracts were cleanenough to give reliable stereoseparation. A multitude ofstandards and sludge samples were analysed in one sequencewith no change of chromatographic performance. Thus thismulti-method is capable to perform sample clean up forstereoseparations as well as conventional analysis.
Table 3 Typical concentration of compounds in sludge samples, mean recovery, relative standard deviation (RSD), limit of detection (LOD) andlimit of quantification (LOQ)
Compound Concentration inunspiked sludge (ngg−1)
Calculated concentrationin spiked sludge (ngg−1)
Determinedconcentration (ngg−1)
Mean recoveryrate (%)
RSD(%)
LOD(ngg−1)
LOQ(ngg−1)
OTNE 3,000 10,927 6,513 60 6 10 30
MX 80 9,200 4,300 47 19 10 30
MK 40 7,600 2,700 36 23 3 10
HHCB 11,800 20,300 15,700 77 6 3 10
AHTN 1,600 8,900 6,100 69 5 3 10
HHCB–lactone
800 7,900 5,200 66 10 3 10
Triclosan 4,400 11,700 15,600 114 12 30 100
Triclosan–Me 70 7,300 4,000 55 10 3 10
TiBP 100 8,100 6,200 77 10 10 30
TnBP 90 7,700 4,900 64 8 10 30
TCEP 70 11,900 7,000 59 9 10 30
TCPP 18,400 28,000 27,000 96 8 30 100
TDCP 90 8,500 4,400 52 8 10 30
TPP 400 7,600 4,300 57 5 3 10
DEHP 8,700 17,200 15,000 87 21 3 10
The LOD was taken as signal-to noise ratio 3:1, and LOQ was defined as signal-to-noise ratio 10:1, which was calculated by the Xcalibursoftware (Thermo, Waltham, USA) for the respective SIM chromatograms of the standard calibration. Mean recovery rates were calculated by theratio of determined concentration and calculated concentration in spiked sludge
Table 2 Recovery rate and working range determined by the artificialblank material
Compound Working range (ngg−1) RR (%) RSD (%)
OTNE 30–10,000 73 26
HHCB 300–10,000 87 13
Triclosan 30–10,000 88 9
TiBP 30–10,000 77 6
TCEP 10–10,000 70 11
1882 X. Chen, K. Bester

Conclusion
A precise multi-method has been developed to analyse muskfragrances, bactericides as well as organophosphates andflame retardants and phthalate by using lyophilisation, ASEin combination with the clean-up steps of SPE, SEC and thedetection of GC–MS. The recovery rates obtained from twodifferent recovery experiments performed by two differentoperators were comparable. In diverse projects, this methodhas been used to analyse several hundred sludge samples
especially in degradation and process studies, for whichprecision as well as stability of the system were crucial.Though the DSQ–MS needs regular cleaning of the curvedprefilter quadrupole after injecting about 100 extracts induplicate plus calibration standards, the method performedwell in routine operations. It is a multi-method that in lots ofcases is open to including new analytes. Also the extractswere clean enough to perform stereoseparation. Thus amethod was validated, which can be the backbone of futureresearch on organic micro-pollutants in sludge.
6.6 6.8 7.0 7.2 7.4 7.6 7.8 8.0 8.2 8.4
Time (min)
0
50
100
50
100
50
100
Re
lative
Ab
un
da
nce
50
100
TCPP standard
277 amu
TCPP standard
279 amu
TCPP sample
277 amu
TCPP sample
279 amu
First isomer
Second isomer
Fig. 3 Chromatographic char-acterisation of the organophos-phate flame retardant TCPP. Thethird isomer was not detected asthe respective SIM function wasaborted before elution of thiscompound
Time (min)
Re
lative
Ab
un
da
nce
OTNE main stereoisomers
0
50
100
50
100
50
100
50
100
50
100
50
100
45 50 55 60 65 70 75
191.0 amu
Standard
219.0 amu
Standard
234.0 amu
standard
191.0 amu
Sludge
219 amu
Sludge
234 amu
Sludge
Fig. 4 Separation of stereoisomers of OTNE on a heptakis-(2,3-di-O-methyl-6-O-t-butyldimethyl-silyl)-β-cyclodextrin (Hydrodex 6-TBDMS®) column. The main stereoisomers were detected at 58.50
and 62.27 min. Temperature programme: 90 �C 1 min½ � ! 10 �Cmin�1 ! 115 �C 70 min½ � ! 10 �C min�1 ! 200 �C 30 min½ � at aconstant flow 1.2 mL min−1
Determination of organic micro-pollutants 1883

Acknowledgements The authors acknowledge the support of theEnvironmental Protection Agency of Northrhine Westphalia throughthe project “BASPIK”, of the Ministry for Economics through theProInno/AIF project “Abbau von organischen Schadstoffen im Rahmender Klärschlammvererdung” and xenobiotic groups of University ofDuisburg-Essen as well as the skilled technical laboratory help ofJennifer Hardes for cooperation. Additionally the authors are indebted tothe co-operating waste water treatment plant for the possibility tosample their sludge for method development. The authors alsoacknowledge the support from the project “In situ characterization ofmicrobial degraders of triclosan and methyl-triclosan from wastewatertreatment plants” from the Danish research council FTP.
References
1. Riley CE (2001) Waste Manage 21:465–4702. Sánchez-Brunete C, Miguel E, Tadeo JL (2007) J Chromatogr A
1148:219–2273. Pawelczyk A (2005) ISAH. Warsaw, Poland4. Vogel I, Bannick CG, Böken H (2004) Soil and compost eco-
biology. León, Spain5. Peck AM, Hornbuckle KC (2004) Environ Sci Technol 38:367–
3726. Peck AM, Linebaugh EK, Hornbuckle KC (2006) Environ Sci
Technol 40:5629–56357. Garicano EA, Borkent I, Hermens JM, Vaes WJ (2003) Environ
Sci Technol 37:3111–31168. Bester K (2004) Chemosphere 57:863–8709. Bester K (2005) J Environ Monit 7:43–51
10. Herren D, Berset JD (2000) Chemosphere 40:565–57411. Berset JD, Bigler P, Herren D (2000) Anal Chem 72:2124–213112. Kupper T, Berset JD, Etter-Holzer R, Furrer R, Tarradellas J
(2004) Chemosphere 54:1111–112013. Peck AM (2006) Anal Bioanal Chem 386:907–93914. Chen X, Pauly U, Rehfus S, Bester K (2009) Chemosphere
76:1094–110115. Bester K (2009) J Chromatogr A 1216:470–48016. Singer H, Müller S, Tixier C, Pillonel L (2002) Environ Sci
Technol 36:4998–500417. Lopez-Avila V, Hites RA (1980) Environ Sci Technol 14:1382–1390
18. Paxeus N (1996) Water Res 30:1115–112219. Lindström A, Buerge IJ, Poiger T, Bergqvist PA, Mller MD, Buser
HR (2002) Environ Sci Technol 36:2322–232920. Bester K (2003) Water Res 37:3891–389621. Bester K (2005) Arch Environ Contam Toxicol 49:9–1722. Orvos DR, Versteeg DJ, Inauen J, Capdevielle M, Rothenstein A
(2002) Environ Toxicol Chem 21:1338–134923. Coogan MA, Edziyie RE, La Point TW, Venables BJ (2007)
Chemosphere 67:1911–191824. DeLorenzo ME, Keller JM, Arthur CD, Finnegan MC, Harper
HE, Winder VL, Zdankiewicz DL (2007) Environ Toxicol23:224–232
25. IAL Consultants (1999) IAL market report. The European FlameRetardant Chemical Industry 1998. IAL Consultants, London
26. Fries E, Puttmann W (2001) J Environ Monit 3:621–62627. Meyer J, Bester K (2004) J Environ Monit 6:599–60528. Sanchez C, Ericsson M, Carlsson H, Colmsjo A (2003) J
Chromatogr A 993:103–11029. García M, Rodríguez I, Cela R (2007) Anal Chim Acta 590:17–2530. Bester K (2005) J Environ Monit 7:509–51331. You J, Lydy MJ (2004) Arch Environ Contam Toxicol 47:148–
15332. Roh JY, Jung IH, Lee JY, Choi JH (2007) Toxicology 237:126–
13333. Fromme H, Kuchler T, Otto T, Pilz K, Muller J, Wenzel A (2002)
Water Res 36:1429–143834. Sablayrolles C, Montréjaud-Vignoles M, Benanou D, Patria L,
Treilhou M (2005) J Chromatogr A 1072:233–24235. Aparicio I, Santos JL, Alonso E (2007) Anal Chim Acta 584:455–
46136. Andresen J, Bester K (2006) Water Res 40:621–62937. Bester K, Hühnerfuss H (1997) Fresenius’ J Anal Chem 358:630–
63438. Richter BE, Jones BA, Ezzell JL, Porter NL, Avdalovic N, Pohl C
(1996) Anal Chem 68:1033–103939. Vandenburg HJ, Clifford AA, Bartle KD, Zhu SA, Carroll J,
Newton LD, Garden LM (1998) Anal Chem 70:1943–194840. Gatermarm R, Hühnerfuss H, Rimkus G, Attar A, Kettrup A
(1998) Chemosphere 36:2535–254741. Käfferlein HU, Göen T, Angerer J (1998) Crit Rev Toxicol
28:431–47642. Hicken EJ, Corey EJ (2008) Org Lett 10:1135–1138
1884 X. Chen, K. Bester
Research paper 4:
Bester K., Chen XJ., Pauly U. and Rehfus S. Abbau von organischen Schadstoffen bei
der Kläschlammbehandlung in Pflanzenbeeten, Korrespondenz Abwasser, Abfall 58
(2011) 1050-1157


09-28.indd – Dienstag, 2. 8. 2011, 11:30 Uhr
1 Fachbeiträge Abfall / Klärschlamm
KA Korrespondenz Abwasser, Abfall · 2011 (58) · Nr. 9 www.dwa.de/KA
Abbau von organischen Schadstoffen bei der Klärschlammbehandlung in PflanzenbeetenKai Bester (Roskilde/Dänemark), Xij uan Chen (Aalborg/Dänemark), Udo Pauly und Stefan Rehfus (Neu-Eichenberg)
Zusammenfassung
Im Beitrag werden die Versuchsdurchführung und die Ergebnis-se einer Untersuchung zur Abbaubarkeit von organischen Schadstoffen, die in Klärschlämmen enthalten sind, mittels be-pflanzter Beete dargestellt. Die durchgeführten Containerversu-che wie auch die parallel durchgeführten Untersuchungen an den großtechnischen Klärschlammvererdungsanlagen Meppen in Niedersachsen und Kalkar-Rees in Nordrhein-Westfalen zei-gen, dass bepflanzte Beete in der Lage sind, die Konzentrationen und Frachten, auch schwer abbaubare organische Schadstoffe wie den Weichmacher DEHP, das Bakterizid Triclosan sowie die Duftstoffe OTNE, HHCB, HHCB-Lacton und AHTN zu reduzie-ren und eine Verminderung der über den Klärschlamm in die Umwelt gelangenden Fracht von 50 % (HHCB, AHTN) bis 93 % (OTNE) zu erreichen.
Schlagwörter: Klärschlamm, Spurenstoff, anthropogen, Schadstoff, organisch, Abbaubarkeit, Elimination, Versuch, Pflanzenbeet, Fracht, Reduzierung
DOI: 10.3242/kae2011.09.004
Abstract
Degradation of Organic Pollutants in Sewage Sludge Treatment in Reed Beds
The paper describes the performance of a test and the results of a study on the degradability of organic pollutants, which are contained in sewage sludge, in reed beds. The container tests un-dertaken as well as the parallel tests in large-scale plants for the conversion of sewage sludge into humus, such as Meppen in Lower Saxony and Kalkar-Rees in North Rhine Westphalia, show that reed beds are able to reduce pollution levels and loads even of difficult to degrade organic pollutants such as DEHP, a surfactant, triclosan, a bactericide, as well as fragrances such as OTNE, HHCB, HHCB-lactone and AHTN and that the pollution loads that enter the environment via the sewage sludge can be reduced by between 50% (HHCH, AHTN) and 91% (OTNE).
Key words: sewage sludge, trace element, anthropogenic, pollutant, organic, degradability, removal, test, reed bed, load, reduction
1 Einleitung
Bepflanzte Beete werden seit 1988 in Europa für die Entwässe-rung von Klärschlämmen eingesetzt. Bei dem naturnahen Ver-fahren wird flüssiger Klärschlamm in schilfbepflanzten und zum Untergrund hin abgedichteten Beeten durch Schwerkraft (Filtration) und durch die Verdunstungsleistung der eingesetz-ten Pflanzen entwässert. Parallel zu den Entwässerungsprozes-sen findet ein Abbau eines Teils der organischen Trockenmasse durch Mikroorganismen statt. Das Endprodukt ist ein durch-wurzeltes, humoses Substrat, auf das weiterhin die Bestim-mungen der Klärschlammverordnung anzuwenden sind. Die Methode hat sich insbesondere für kleine und mittlere Kläran-lagen im ländlichen Raum als kostengünstige und ökologische Alternative zur maschinellen Entwässerung bewährt.

09-28.indd – Dienstag, 2. 8. 2011, 11:30 Uhr
2 Fachbeiträge Abfall / Klärschlamm
KA Korrespondenz Abwasser, Abfall · 2011 (58) · Nr. 9 www.dwa.de/KA
Im Rahmen des von der Arbeitsgemeinschaft industrieller Forschungsvereinigungen „Otto von Guericke e. V.“ (AiF) geför-derten zweijährigen Forschungsvorhabens „ Abbau von organi-schen Schadstoffen im Rahmen der Klärschlammvererdung“ wurden zwei großtech nische Klärschlammvererdungsanlagen in Meppen (Niedersachsen) und Kalkar-Rees (Nordrhein-West-falen, Abbildung 1) untersucht und mit 16 eigens angefertig-ten, unterschiedlich bepflanzten Modellanlagen verglichen.
Folgende Substanzen wurden untersucht:
OTNE (7-Acetyl-1,2,3,4,5,6,7,8-octahydro-1,1,6,7-tetrame-thylnaphthalen; Handelsname Iso-E-super) hat derzeit eine weite Verbreitung in Verbraucherprodukten gefunden. 2500–3000 t dieses Duftstoffs werden jährlich verkauft [3]. Konzen-trationen von 7000–30 000 ng OTNE je g Trockensubstanz (TS) Klärschlamm wurden in den USA gefunden [4], während in Europa die Konzentrationen zwischen 2000 und 4000 ng g–1 la-gen [5].
Polycyclische Moschus-Duftstoffe wie HHCB (1,3,4,6,7,8-He-xahydro-4,6,6,7,8,8-hexamethylcyclopenta-[g]-2-benzopyran, Handelsname zum Beispiel Galaxolid) und AHTN (7-Acetyl-1,1,3,4,4,6-hexamethyl-1,2,3,4-tetrahydronaphthalen, Han-delsname zum Beispiel Tonalid) werden häufig als Duftstoffe in Shampoos, Waschmitteln, Weichspülern und anderen Con-sumer-Produkten benutzt. [5, 6]. Beide Polycyclen haben eine geringe Wasserlöslichkeit und hohes Bioakkumulationspoten-zial [7]. Die Konzentrationen dieser Substanzen in Klärschläm-men aus Nordhrein-Westfalen betrugen 3100 ± 240 ng g–1 (HHCB) und 1500 ±150 ng g–1 (AHTN) [8].
HHCB-Lacton ist der Primärmetabolit von HHCB. Während der Abwasserbehandlung werden etwa 10 % des HHCB zum HHCB-Lacton oxidiert [8]. Das Verhältnis von HHCB zu HHCB-Lacton kann im Ablauf von Kläranlagen zwischen 3 und 130 variieren. Diese Zahlen können benutzt werden, um die Oxida-tionseffizienz von technischen Anlagen abzuschätzen. Die Kon-zentrationen im Klärschlamm lagen zwischen 600 ng g–1 und 3500 ng g–1 [9].
Triclosan wird derzeitig als Bakterizid in Zahnpasta, Mund-spülwasser sowie in Funktionswäsche wie zum Beispiel Unter-wäsche und Turnschuhen ebenso eingesetzt sowie zur Stabili-sierung von Waschmitteln und Kosmetika [10]. Zusätzlich wird es als Polymerzusatz in Plastik-Schneidebrettern für den Le-bensmittelbereich verwendet. Schätzungsweise 1500 t Triclo-san werden jährlich weltweit produziert, etwa 350 t davon in Europa [11]. Triclosan zeigt eine geringe Wasserlöslichkeit und ein hohes Bioakkumulationspotenzial. In allen Klärschlamm-proben aus Nordrhein-Westfalen war Triclosan mit Konzentra-tionen um 3000 ng g–1 nachweisbar [12].
DEHP [Bis(2-ethylhexyl)phthalat] wird als Weichmacher in PVC, in Baumaterialien, aber auch in Farben und Kosmetika eingesetzt [13]. Die jährliche weltweite Produktion von DEHP liegt bei 106 t [14]. Die Weichmacher werden während der Le-benszeit der entsprechenden Produkte ausgewaschen und ge-langen so ins Abwasser. DEHP ist eine der prioritären Substan-zen der Wasserrahmenrichtlinie. Die Konzentrationen von DEHP liegen bei 1740 bis 182 000 ng l–1 in Kläranlagenabläu-fen. In Klärschlämmen wurden 27 900 bis 154 000 ng g–1 Tro-

09-28.indd – Dienstag, 2. 8. 2011, 11:30 Uhr
3 Fachbeiträge Abfall / Klärschlamm
KA Korrespondenz Abwasser, Abfall · 2011 (58) · Nr. 9 www.dwa.de/KA
ckenmasse und in Sedimenten 210 bis 84 400 ng g–1 gefunden [15].
2 Material und Methoden
2.1. Versuchsdurchführung
Für die Versuchsdurchführung war vorgesehen, zunächst in Versuchscontainern, deren Aufbau einem Vererdungsbeet nach-empfunden ist, die Abbaubarkeit der Schadstoffe zu untersu-chen. Anhand der Container sollte dabei der Einfluss unter-schiedlicher Wasserregimes sowie der gewählten Pflanzenart auf die Abbaubarkeit untersucht werden. Zu diesem Zweck wurden insgesamt 16 Versuchscontainer (vier Ansätze mit je vier Parallelen) auf dem Versuchsfeld der Universität Duisburg-Essen durch EKO-Plant installiert und betreut (Abbildung 2). Die Untersuchung und Auswertung der entnommenen Proben erfolgte durch das Fachgebiet Siedlungswasser- und Abfallwirt-schaft der Universität Duisburg-Essen.
Die Container waren folgendermaßen ausgestattet:
Containermaße jeweils 1,0 � 1,0 � 0,95 m, unbehandeltes Stahlblech, außen mit Rostschutzlackierung versehen. An der Behältersohle wurde jeweils seitlich ein Kugelhahn aus Mes-sing (vernickelt) zur Entnahme von Filtratproben angebracht.
In jeden Container wurden zunächst ca. 600 l maschinell entwässerter Klärschlamm mit ca. 20 % TS aus der Kläranlage Meppen eingebracht und anschließend wie folgt bepflanzt:
Variante I: Container 1–4, bepflanzt mit Schilf (Phragmites australis),
Variante II: Container 1–4, bepflanzt mit Rohrglanzgras (Phalaris arundinacea),
Variante III: Container 1–4, bepflanzt mit Rohrkolben (Typha latifolia),
Variante IV: Container 1–4, ohne Bewuchs.
Um den Verbleib der im Klärschlamm enthaltenen organischen Stoffe bilanziell bewerten zu können, wurden neben Unter-suchungen des Klärschlamms – Proben aus dem Filtratwasser und dem Pflanzenmaterial entnommen und auf organische Schadstoffe untersucht.
Aufgrund von Problemen mit Entwässerungsfähigkeit und Pflanzenverträglichkeit des maschinell entwässerten Klär-schlamms wurden im weiteren Projektverlauf die Container entleert, mit Klärschlamm aus der Anlage Vererdungsanlage in Meppen befüllt und erneut bepflanzt. Alle Untersuchungser-gebnisse beziehen sich im Folgenden auf diesen Versuchsauf-bau.
2.2 Probenahme und Aufbereitung
Die Proben wurden mithilfe eines Stahlstechrohrs in drei Tie-fenprofilen (0–20 cm, 20–40 cm, 40–60 cm) genommen. Zehn Teilproben aus den jeweiligen Schichten wurden vereinigt und in einem Stahleimer homogenisiert. Von diesen Homogenaten wurden 200 g in Glasflaschen für die Analytik versendet.

09-28.indd – Dienstag, 2. 8. 2011, 11:30 Uhr
4 Fachbeiträge Abfall / Klärschlamm
KA Korrespondenz Abwasser, Abfall · 2011 (58) · Nr. 9 www.dwa.de/KA
2.3 Durchführung der Analysen
Die instrumentelle Analyse wurde mittels GC-MS (Gas-Chro-matographie mit massenspektrometrischer Detektion) durch-geführt. Hierzu wurde ein Thermo Finnigan DSQ mit einem PTV-Injektor und einem Trace Autosampler eingesetzt.
Die gaschromatographische Trennung wurde mithilfe einer DB5-MS-Säule (J&W Scientific), L: 15 m, ID: 0,25 mm, film: 0,25 m, und eines Temperaturprogramms durchgeführt. Die verschiedenen Verbindungen wurden über ihre massenspektro-metrischen Daten und Retentionszeiten identifiziert.
2.4 Halbwertszeiten
Da die Experimente bei wechselnden Temperaturen und Feuchtgehalten durchgeführt wurden, sind die kinetischen Da-ten nicht so belas tbar wie zum Beispiel die aus Laborversuchen unter kontrollierten Bedingungen gewonnenen Daten. Deshalb soll im Rahmen dieses Projekts nur von einer „Abschätzung“ und nicht von einer „Bestimmung“ von Halbwertszeiten berich-tet werden. Es bleibt aber hinzuzufügen, dass diese Abschät-zung unter realen Bedingungen natürlich realitätsnäher ist als die unter kontrollierten Bedingungen gewonnenen Daten. Im Rahmen dieser Arbeit wird von einem Abbau erster Ordnung ausgegangen:
K = ln
c 0
c
t
Hierbei ist c0 die Startkonzentration zum Zeitpunkt t � 0 und c die Konzentration zum Zeitpunkt t. Die Formel für die Halb-wertszeit wird durch Umformen gewonnen:
t1/2=
ln 2c 0
c 0
k=
ln2k
3 Auswertung der Versuche
3.1 Konzentrationen der Zielsubstanzen
Die höchsten OTNE-Konzentrationen wurden zu Anfang des Experimentes mit 1600 ng g–1 (TS) gefunden. Nach 13 Mona-ten waren die Konzentrationen bei allen Experimenten um 70 % der ursprünglichen Konzentration reduziert. Hierbei wur-de kein signifikanter Unterschied der verschiedenen Bewuchs-formen festgestellt (Abbildung 3).
Etwa 20 % des HHCB wurden während des Versuchs elimi-niert. Die Differenz zwischen Startkonzentration und Endkon-zentration beträgt etwa 3000 ng g–1 (TS). Im Gegensatz dazu stieg die Konzentration des Metaboliten HHCB-Lacton um 35 % in dem Container mit Rohrglanzgras, während der Zu-wachs bei dem Versuch mit Rohrkolben 32 % und bei dem mit Schilf 45 % und ohne Bewuchs 44 % (etwa 500 ng g–1 (TS)) betrug. Da die Konzentrationen des Primärmetaboliten stiegen, kann davon ausgegangen werden, dass es sich bei den Elimi-nierungsprozessen tatsächlich um oxidative Abbauprozesse durch Mikroorganismen handelt. Es muss aber ebenfalls fest-gehalten werden, dass wiederum auch ein Abbau des HHCB-Lactons erfolgt, da der Verlust des HHCB insgesamt größer ist als die Zunahme des Metaboliten.

09-28.indd – Dienstag, 2. 8. 2011, 11:30 Uhr
5 Fachbeiträge Abfall / Klärschlamm
KA Korrespondenz Abwasser, Abfall · 2011 (58) · Nr. 9 www.dwa.de/KA
Die Konzentrationen von AHTN waren erwartungsgemäß deutlich niedriger als die des HHCB, was etwa dem derzeitigen Einsatzspektrum entspricht. Sie nahmen unabhängig von der Bewuchsform ebenfalls leicht ab, leider ist für diese Substanz derzeit kein Metabolit eines Bioabbauprozesses bekannt.
Die Triclosan-Konzentrationen nahmen innerhalb des Ver-suches deutlich ab (Abbildung 4). Die Startkonzentrationen (800 ng g–1 (TS)) waren ausgesprochen niedrig, was nur da-durch zu erklären ist, dass das Material, das aus der seit April 2003 in Betrieb befindlichen Klärschlammvererdungsanlage Meppen stammte, bereits durch die vorherige Lagerungsdauer im schilfbepflanzten Beet in Meppen einem Vor-Abbau unter-zogen war.
Ähnlich wie bei OTNE und Triclosan wurde auch für DEHP eine bedeutende Abnahme der Konzentrationen während der Versuche gefunden. Etwa 40 % Abnahme erfolgte bei der Be-pflanzung mit Rohrglanzgras, während die Werte 44 % für Rohrkolben, 41 % für Schilf und 25 % für die Versuche ohne Bewuchs waren. In Bezug auf DEHP deuten sich also deutlich bessere Eliminierungen mit Pflanzenbewuchs an.
3.2 Massenbilanzen
Zur Sicherstellung der Messergebnisse wurde eine Massenbi-lanz aufgestellt (Tabelle 1), für die die Konzentrationen c1 der Zielsubstanzen im Ablaufwasser der Container bestimmt wur-den.
Den Konzentrationen wurden Wassermengen aus Nieder-schlag (900 mm bzw. 900 l je Container) und Bewässerung (432 l je Container) gegenübergestellt und als Ablaufmenge betrachtet. Dies ist sicherlich eine Überschätzung der Ablauf-menge (Wasser), da die Betrachtung die Verdunstung des Was-sers nicht berücksichtigt.
Aus diesen Ablaufmengen (Wasser) und der Konzentration in dem Ablaufwasser kann eine eluierte Menge (M1) der jewei-ligen Substanz als die maximale Menge errechnet werden, die während des Versuchszeitraums mit dem Drainagewasser aus den Containern gespült wurde.
Aus den Konzentrationen im Schlamm c2 kann bei Berück-sichtigung der Füllhöhe und der Grundfläche der Container die Menge der im Schlamm enthaltenen Substanz (M2) errechnet werden.
Hieraus lässt sich der relative, im Drainagewasser enthalte-ne Massenanteil der jeweiligen Substanz errechnen (M1/M2). Er beträgt im Falle von OTNE 0,52 % des Ausgangsgehalts und ist damit vernachlässigbar. Vergleichbare Aussagen gelten für alle hier untersuchten Substanzen. Der Anteil lag zwischen 0,01 und 0,63 %. Das Auswaschen spielt infolgedessen für kei-ne der Substanzen eine signifikante Rolle bei den Massenbilan-zen oder Eliminierungen.
Zusätzlich wurde auch die grüne Blattmasse im Rahmen der Massenbilanzierung qualitativ berücksichtigt. Ein Einfluss der grünen Blattmasse auf die Reduktion der Xenobiotica (durch Aufnahme derselben in die Biomasse) kann ebenfalls ausge-schlossen werden (�1 %), da sowohl die gemessenen Konzen-trationen in der Blattmasse sehr gering waren als auch die Blattmasse selbst gegenüber der Masse des Klärschlamms nur eine untergeordnete Rolle spielt (wenige kg/m² gegenüber mehreren Hundert kg Klärschlammmasse/m²).

09-28.indd – Dienstag, 2. 8. 2011, 11:30 Uhr
6 Fachbeiträge Abfall / Klärschlamm
KA Korrespondenz Abwasser, Abfall · 2011 (58) · Nr. 9 www.dwa.de/KA
4 Diskussion der Ergebnisse
Die durchgeführten Containerversuche wie auch die parallel durchgeführten Untersuchungen an den großtechnischen Ver-erdungsanlagen Meppen in Niedersachsen und Kalkar-Rees in Nordrhein-Westfalen zeigen deutlich, dass die vegetative Klär-schlammbehandlung in der Lage ist, auch schwer abbaubare organische Schadstoffe zu reduzieren. Dabei handelt es sich höchstwahrscheinlich um echte Abbauprozesse, da entspre-chende Abbauprodukte (Metabolite) nachgewiesen werden konnten. Eine Bilanzierung der Stoffströme zeigte ergänzend, dass nur ein Bruchteil (�1 %) der Zielsubstanzen mit dem Fil-tratwasser ausgewaschen wird. Auch die Aufnahme durch die Pflanzen kann mit �1 % vernachlässigt werden. Dass die Art der Bepflanzung zudem eine untergeordnete Rolle bei den Ab-bauprozessen gespielt hat, kann als ein weiterer Beweis gese-hen werden, dass es sich maßgeblich um substratspezifische mikrobielle Abbauprozesse handelt.
Bei den ermittelten Reduktionsraten und Halbwertszeiten ist zu berücksichtigen, dass sich diese auf Prozesse beziehen, die im schilfbepflanzten Beet allein während der rund zwölf-monatigen Trockenphase vor einer Verwertung stattfinden. Wie die niedrigen Ausgangskonzentrationen des in den Containern eingesetzten Materials aus der Anlage in Meppen zeigen, fin-det ein Abbau der Schadstoffe offenbar schon während der normalen Betriebsphase mit periodischer Beschlammung vor Einleitung einer Trockenphase statt. Setzt man eine Betriebs-dauer von fünf bis zehn Jahren bis zur eigentlichen Trocken-phase vor einer Beet-Räumung voraus, in der ebenfalls schon durch das periodische Beschicken und Trockenfallen der Beete Abbauprozesse stattfinden können, wird deutlich, dass bei die-sen Anlagen ein unter Umständen noch erheblich höheres Ab-baupotenzial für organische Schadstoffe besteht.
Für die Gesamtbilanzierung in Hinblick auf die Umweltre-levanz ist daher eine Input-Output- Betrachtung bezüglich der Frachten hilfreich. Dazu wird die ins Beet geleitete Klär-schlammtrockenmasse (in t TM) mit den in ihr enthaltenen Zielsubstanzen (in ng/g TM) im Nassschlamm ins Verhältnis zur Masse und den Konzentrationen gesetzt, die am Ende des Behandlungszyklus zur Verwertung in die Umwelt gelangen würden. Nachfolgend ist dies am Beispiel Kalkar dargestellt (Tabelle 2), da nur hier hilfsweise die Konzentration im Nass-schlamm vorlag. Die Angaben stehen unter dem Vorbehalt die-ser einmaligen Stichprobe, zeigen in ihrer Tendenz aber den deutlichen Einfluss der bepflanzten Beete auf die Entfrachtung der umweltrelevanten Zielsubstanzen.
Beispiel Klärschlammvererdungsanlage Kalkar-Rees
Gegenüber der Input-Trockensubstanzmenge von 489 t TM be-finden sich nach Abschluss der Trockenphase nur noch rund 331 t TM im Beet. Ein Großteil dieser Massenreduktion ist auf den Abbau organischer Substanz zurückzuführen. Gleichzeitig nimmt die Konzentration von der Startkonzentration c0 hin zur Endkonzentration c während des Behandlungsprozesses lau-fend ab. Unter Berücksichtigung einer Klärschlammtrocken-masse von 489 t TM Input und 331 t TM Output am Ende der Trockenphase ergeben sich die in Tabelle 3 genannten Frach-ten.

09-28.indd – Dienstag, 2. 8. 2011, 11:30 Uhr
7 Fachbeiträge Abfall / Klärschlamm
KA Korrespondenz Abwasser, Abfall · 2011 (58) · Nr. 9 www.dwa.de/KA
5 Fazit
In den Modellanlagen kommt es während des Versuchszeit-raums zu einer deutlichen Abnahme der Konzentrationen der untersuchten Xenobiotica zwischen 20 % (HHCB) und 70 % (OTNE). Aus den gewonnenen Daten wurden näherungsweise Halbwertszeiten für die Zielsubstanzen ermittelt. Die Konzent-rationsabnahmen und Halbwertszeiten aus den Modellanlagen konnten für die großtechnischen Anlagen weitgehend bestätigt oder übertroffen werden (Kalkar). Da bei großtechnischen An-lagen in der Regel Trockenphasen von zwölf Monaten eingehal-ten werden, können die Reduktionsraten der Zielsubstanzkon-zentrationen für diesen Zeitraum bei der Anlage in Kalkar wie in Tabelle 4 dargestellt angenommen werden.
Betrachtet man neben den reinen Veränderungen der Kon-zentrationen in der Trockenphase auch die Massenverände-rung, die durch Abbau von Klärschlammtrockenmasse eintritt, ergeben sich weitere Entlastungen der Umwelt. Am Beispiel Kalkar konnte eine Frachtverringerung der untersuchten Xeno-biotica zwischen rund 50 und 93 % gegenüber der direkten Nassschlammausbringung abgeschätzt werden.
Bei den Containerversuchen zeigte sich ein untergeordneter Einfluss der eingesetzten Pflanzenarten auf die Versuchsergeb-nisse. Hierbei ist zu berücksichtigen, dass im Untersuchungs-zeitraum lediglich die Verhältnisse während Trockenphasen, ohne regelmäßige Beschlammung, untersucht wurden. Durch ihre Verdunstungsleistung und ihre Rolle bei der Sauerstoffver-sorgung der Mikroorganismen sind die Pflanzen allerdings ei-ne wichtige Voraussetzung für eine optimale Entwässerungs- und Mineralisierungsleistung großtechnischer Anlagen und so-mit wichtiger, unverzichtbarer Systembestandteil bei der Klär-schlammbehandlung in Pflanzenbeeten. Insbesondere Schilfpflanzen tragen durch ihre Durchwurzelungsfähigkeit auch tieferer Schlammschichten dazu bei, das Gesamtsystem hydraulisch durchlässig und damit funktionsfähig zu halten.
Dank
Wir danken der Arbeitsgemeinschaft industrieller Forschungs-vereinigungen „Otto von Guericke“ e. V. (AiF) für die finanziel-le Unterstützung, die dieses Projekt ermöglicht hat. Dank gilt ferner den Stadtwerken Meppen und dem Abwasserbehand-lungsverband Kalkar-Rees für die Erlaubnis zur Durchführung der Untersuchungen auf ihren Klärschlamm vererdungsanlagen sowie der Kläranlage Duisburg-Kaßlerfeld für die Erlaubnis zur Durchführung der Containerversuche auf ihrem Grundstück.
Literatur[1] Deutsche Bundesstiftung Umwelt, 1996–2002: Förderschwerpunkt
Bioabfallverwertung: Steigerung der Verwertung von Klärschlamm durch verbesserte Produkte, Qualitätsnormungen und erweiterte Märkte, Projektkennblatt der Deutschen Bundesstiftung Umwelt, Az. 07491
[2] Jordan, R.: Vegetative Behandlung anaerob stabilisierter Klär-schlämme, Schriftenreihe des Instituts für Siedlungswasserwirt-schaft der TU Braunschweig, Heft 73, 2006
[3] Gautschi, M., Bajgrowicz, J. A., Kraft, P.: Fragrance Chemistry – milestones and perspectives, Chimia 2001, 55, 379–3 87
[4] Di Francesco, A. M., Chiu, P. C., Standley, L. J., Allen, H. E., Salvito, D. T.: Dissipation of fragrance materials in sludge-amended soils, Environ. Sci. Technol. 2004, 38, 194–201

09-28.indd – Dienstag, 2. 8. 2011, 11:30 Uhr
8 Fachbeiträge Abfall / Klärschlamm
KA Korrespondenz Abwasser, Abfall · 2011 (58) · Nr. 9 www.dwa.de/KA
[5] Bester, K., Klasmeier, J., Kupper, T.: Emissions of OTNE (Iso-E-super) – Mass flows in sewage treatment plants, Chemosphere, 2008, 71, 2003–2010
[6] Kannan K.: A survey of polycyclic musks in selected household com-modities from the United States, Chemosphere 2006, 62, 867–873
[7] Brunn, H., Rimkus, G.: Synthetic musk compounds − Application, environmental accumulation, and toxicology, Ernährungsumschau 1997, 44,4–7
[8] Bester, K.: Retention characteristics and balance assessment for two polycyclic musk fragrances (HHCB and AHTN) in a typical Ger-man sewage treatment plant, Chemosphere 2004, 57, 863–870
[9] Kupper, T., Berset, J. D., Etter-Holzer, R., Furrer, R., Tarradellas, J.: Concentrations and specific loads of polycyclic musks in sewage sludge originating from a monitoring network in Switzerland, Che-mosphere 2004, 54, 1111–1120
[10] Adolfsson-Erici, M., Pettersson, M., Parkkonen, J., Sturve, J.: Triclo-san, a commonly used bactericide found in human milk and in the aquatic environment in Sweden, Chemosphere 2002, 46, 1485–1489
[11] Singer, H., Muller, S., Tixier, C., Pillonel, L.: Triclosa accu-n: Occur-rence and fate of a widely used biocide in the aquatic environment: Field measurements in wastewater treatment plants, surface wa-ters, and lake sediments, Environ. Sci. Technol. 2002, 36, 4998–5004
[12] Coogan, M. A., Edziyie, R. E., La Point, T. W., Venables, B. J.: Algal bioaccumulation of triclocarban, triclosan and methyl-triclosan in a North Texas wastewater treatment plant receiving stream, Chemos-phere 2007, 67, 1911–1918
[13] Giam, C. S., Atlas, E., Powers, M. A., and Leonard, J. E.: Phthalic acid esters, in: O. Hutzinger (Hrsg.): The handbook of environmental che-mistry, Springer, Berlin, 1984, S. 67–142
[14] Nielsen, E., Larsen, P. B.: Toxicological evaluation and limit values for DEHP and phthalates other than DEHP, Environmental Review Re-port 6/1996, Danish Environmental Protection Agency, Copenha-gen, Denmark, 1996
[15] Fromme, H., Kuchler, T., Otto, T., Pilz, K., Muller, J., Wenzel, A.: Oc-currence of phthalates and bisphenol A and F in the environment, Water Res. 2002, 36, 1429–1438
AutorenPriv.-Doz. Dr. Kai BesterAarhus UniversityNational Environmental Research InstituteDepartment of Environmental Chemistry and MicrobiologyFrederiksborgvej 3994000 Roskilde, Dänemark
Xijuan Chen, M. Sc.Aalborg UniversityDepartment for Biotechnology, Chemistry and Environmental EngineeringSohngaardsholmsvej 499000 Aalborg, Dänemark
Dr.-Ing. Udo PaulyDipl.-Ing. Stefan RehfusEKO-Plant Entwicklungs- und Betriebsgesellschaft für ökotechnische Anlagen mbHKarlsbrunnenstraße 1137249 Neu Eichenberg
E-Mail: [email protected] A
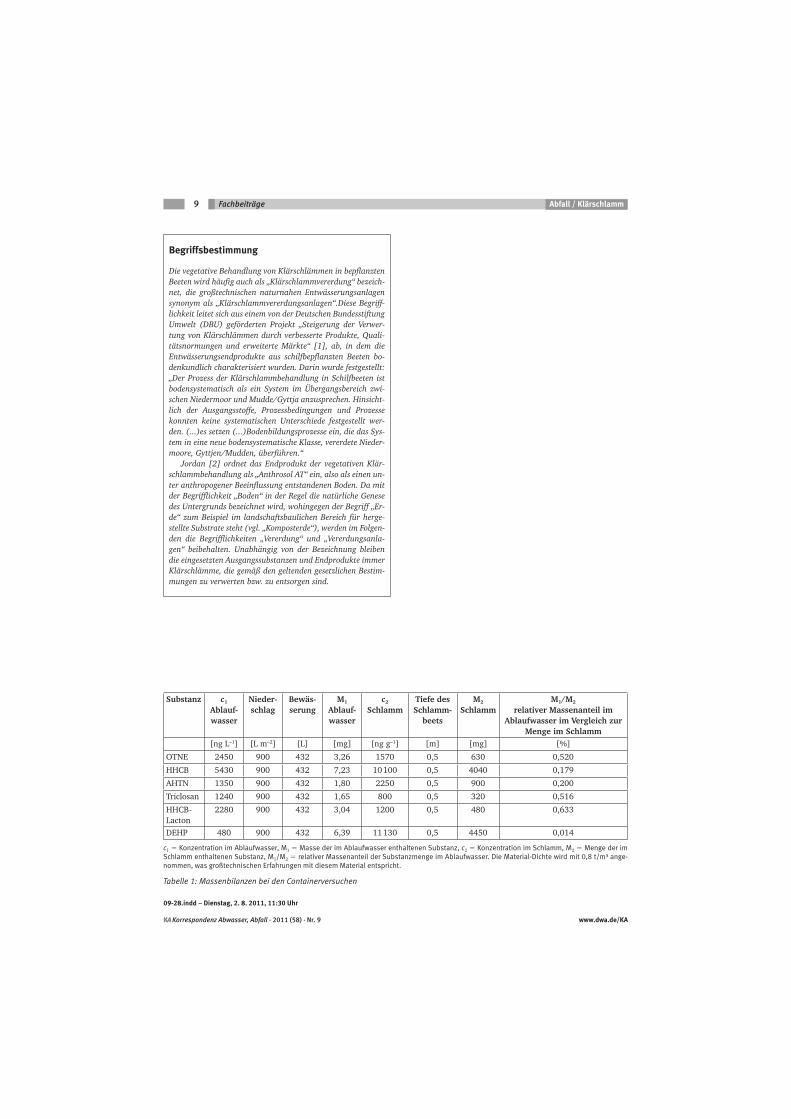
09-28.indd – Dienstag, 2. 8. 2011, 11:30 Uhr
9 Fachbeiträge Abfall / Klärschlamm
KA Korrespondenz Abwasser, Abfall · 2011 (58) · Nr. 9 www.dwa.de/KA
Begriffsbestimmung
Die vegetative Behandlung von Klärschlämmen in bepflanzten Beeten wird häufig auch als „Klärschlammvererdung“ bezeich-net, die großtechnischen naturnahen Entwässerungsanlagen synonym als „Klärschlammvererdungsanlagen“.Diese Begriff-lichkeit leitet sich aus einem von der Deutschen Bundesstiftung Umwelt (DBU) geförderten Projekt „Steigerung der Verwer-tung von Klärschlämmen durch verbesserte Produkte, Quali-tätsnormungen und erweiterte Märkte“ [1], ab, in dem die Entwässerungsendprodukte aus schilfbepflanzten Beeten bo-denkundlich charakterisiert wurden. Darin wurde festgestellt: „Der Prozess der Klärschlammbehandlung in Schilfbeeten ist bodensystematisch als ein System im Übergangsbereich zwi-schen Niedermoor und Mudde/Gyttja anzusprechen. Hinsicht-lich der Ausgangsstoffe, Prozessbedingungen und Prozesse konnten keine systematischen Unterschiede festgestellt wer-den. (...)es setzen (...)Bodenbildungsprozesse ein, die das Sys-tem in eine neue bodensystematische Klasse, vererdete Nieder-moore, Gyttjen/Mudden, überführen.“
Jordan [2] ordnet das Endprodukt der vegetativen Klär-schlammbehandlung als „Anthrosol AT“ ein, also als einen un-ter anthropogener Beeinflussung entstandenen Boden. Da mit der Begrifflichkeit „Boden“ in der Regel die natürliche Genese des Untergrunds bezeichnet wird, wohingegen der Begriff „Er-de“ zum Beispiel im landschaftsbaulichen Bereich für herge-stellte Substrate steht (vgl. „Komposterde“), werden im Folgen-den die Begrifflichkeiten „Vererdung“ und „Vererdungsanla-gen“ beibehalten. Unabhängig von der Bezeichnung bleiben die eingesetzten Ausgangssubstanzen und Endprodukte immer Klärschlämme, die gemäß den geltenden gesetzlichen Bestim-mungen zu verwerten bzw. zu entsorgen sind.
Substanz c1
Ablauf-wasser
Nieder-schlag
Bewäs-serung
M1
Ablauf-wasser
c2
SchlammTiefe des Schlamm-
beets
M2
SchlammM1/M2
relativer Massenanteil im Ablaufwasser im Vergleich zur
Menge im Schlamm[ng L–1] [L m–2] [L] [mg] [ng g–1] [m] [mg] [%]
OTNE 2450 900 432 3,26 1570 0,5 630 0,520
HHCB 5430 900 432 7,23 10 100 0,5 4040 0,179
AHTN 1350 900 432 1,80 2250 0,5 900 0,200
Triclosan 1240 900 432 1,65 800 0,5 320 0,516
HHCB-Lacton
2280 900 432 3,04 1200 0,5 480 0,633
DEHP 480 900 432 6,39 11 130 0,5 4450 0,014
c1 � Konzentration im Ablaufwasser, M1 � Masse der im Ablaufwasser enthaltenen Substanz, c2 � Konzentration im Schlamm, M2 � Menge der im Schlamm enthaltenen Substanz, M1/M2 � relativer Massenanteil der Substanzmenge im Ablaufwasser. Die Material-Dichte wird mit 0,8 t/m³ ange-nommen, was großtechnischen Erfahrungen mit diesem Material entspricht.
Tabelle 1: Massenbilanzen bei den Containerversuchen

09-28.indd – Dienstag, 2. 8. 2011, 11:30 Uhr
10 Fachbeiträge Abfall / Klärschlamm
KA Korrespondenz Abwasser, Abfall · 2011 (58) · Nr. 9 www.dwa.de/KA
Substanz Nassschlamm-Input[ng/g]
letzter Messwert im Beet[ng/g]
Konzentrationsver-
ringerung um
OTNE 18 000 1600 91 %
HHCB 13 000 9600 26 %
AHTN 2100 1500 29 %
Triclosan 2400 650 73 %
DEHP 28 000 9100 68 %
Tabelle 2: Abbau der Zielsubstanzen in der Vererdungsanlage Kal-kar während eines Behandlungszyklus
Substanz Input-Fracht[kg]
Output-Fracht (bei Verwertung)
[kg]
Entfrachtung[%]
OTNE 8,8 0,6 – 93
HHCB 6,4 3,2 – 50
AHTN 1,0 0,5 – 50
Triclosan 1,2 0,2 – 83
DEHP 14 3,0 – 79
Tabelle 3: Entfrachtung der Klärschlammerde Kalkar
Substanz Abgeschätzte Halbwertszeit
[Tage]
Konzentrationsbe zogene Eliminations rate in
zwölf Monaten
OTNE 156 77 %
HHCB 924 24 %
AHTN 492 35 %
Triclosan 205 65 %
DEHP 250 55 %
Tabelle 4: Abgeschätzte Halbwertszeiten und rechnerisch ermit-telte konzentrationsbezogene Eliminationsraten der untersuchten Xenobiotica in 12-monatiger Trockenphase (Kalkar)
Abb. 1: Klärschlammvererdungsanlage Hönnepel (acht Beete, 540 t TS) (Foto: EKO-Plant)
ist 4c

09-28.indd – Dienstag, 2. 8. 2011, 11:30 Uhr
11 Fachbeiträge Abfall / Klärschlamm
KA Korrespondenz Abwasser, Abfall · 2011 (58) · Nr. 9 www.dwa.de/KA
OTNE
0
200
400
600
800
1000
1200
1400
1600
1800
Mai, 07 Jun, 07 Jul, 07 Sep, 07 Dez, 07 Feb, 08 Apr, 08
Conc
entr
atio
n (n
g/g
TS)
RG
RK
S
OB
Abb. 3: Konzentrationen von OTNE im Containerversuch zur Schlammvererdung [ng g–1 TS]; RG: Rohrglanzgras, RK: Rohrkol-ben, S: Schilf, OB: ohne Bewuchs
ist 4c
Abb. 2: Die 16 Versuchscontainer auf dem Testgelände (Foto: EKO-Plant)
ist 4c
Triclosan
0100
200300400500
600700800
9001000
Mai, 07 Jun, 07 Jul, 07 Sep, 07 Dez, 07 Feb, 08 Apr, 08
Con
cent
ratio
n (n
g/g
TS)
RG
RK
S
OB
Abb. 4: Konzentrationen von Triclosan im Containerversuch zur Schlammvererdung [ng g–1 TS]; RG: Rohrglanzgras, RK: Rohrkol-ben, S: Schilf, OB: ohne Bewuchs
ist 4c


Research paper 5:
Chen XJ., Nielsen JL., Furgal K., Liu YL., Lolas IB. and Bester K. Elimination of
triclosan and formation of methyl-triclosan in activated sludge under aerobic conditions,
Chemosphere 84 (2011) 452–456


Biodegradation of triclosan and formation of methyl-triclosan in activatedsludge under aerobic conditions
Xijuan Chen a, Jeppe Lund Nielsen a, Karolina Furgal a, Yaling Liu a, Ihab Bishara Lolas a, Kai Bester b,⇑aDepartment of Biotechnology, Chemistry and Environmental Engineering, Aalborg University, Sohngaardsholmsvej 49, 9000 Aalborg, DenmarkbNational Environmental Research Institute, Aarhus University, Frederiksborgsvej 399, 4000 Roskilde, Denmark
a r t i c l e i n f o
Article history:Received 18 October 2010Received in revised form 20 March 2011Accepted 22 March 2011Available online 19 April 2011
Keywords:TriclosanTriclosan methylWaste water treatmentAerobic transformation
a b s t r a c t
Triclosan is an antimicrobial agent which is widely used in household and personal care products.Widespread use of this compound has led to the elevated concentrations of triclosan in wastewater,wastewater treatment plants (WWTPs) and receiving waters. Removal of triclosan and formation of tri-closan-methyl was investigated in activated sludge from a standard activated sludge WWTP equippedwith enhanced biological phosphorus removal. The removal was found to occur mainly under aerobicconditions while under anoxic (nitrate reducing) and anaerobic conditions rather low removal rates weredetermined. In a laboratory-scale activated sludge reactor 75% of the triclosan was removed under aer-obic conditions within 150 h, while no removal was observed under anaerobic or anoxic conditions.One percent of the triclosan was converted to triclosan-methyl under aerobic conditions, less underanoxic (nitrate reducing) and none under anaerobic conditions.
� 2011 Elsevier Ltd. All rights reserved.
1. Introduction
Triclosan (2,4,40-trichloro-20-hydroxydiphenylether) is cur-rently used as a bactericide in personal care products such astoothpaste, shampoos, and soaps. It is additionally used as a stabi-lizing agent in a multitude of detergents and cosmetics (Adolfson-Erici et al., 2002). Triclosan inhibits bacterial growth by blocking li-pid biosynthesis (Schweizer, 2001). Microalgae communities areparticularly sensitive to triclosan with effective concentrationsaround 10 ng L�1 (Wilson et al., 2009). A mechanism responsiblefor this effect has been proposed (Franz et al., 2008). Additionally,triclosan has also been linked to a range of health and environmen-tal effects, such as skin irritation, allergy susceptibility, and alsoother ecological toxicity to the aquatic and terrestrial environment(Coogan et al., 2007), e.g. it has an effect on earth worms (Eiseniafetida) (Lin et al., 2010) and on Japanese medaka fish (Nassefet al., 2010).
After use triclosan ends up in the wastewater with typical con-centrations of 1–10 lg L�1 (Adolfson-Erici et al., 2002; Lindströmet al., 2002; Singer et al., 2002; Bester, 2005). Removal of about90% was measured in wastewater treatment plants (WWTP)employing conventional activated sludge process of which40–60% was due to biodegradation while the remainder was dueto sorption to the sludge (Singer et al., 2002; Bester, 2003, 2005;Coogan et al., 2007; Heidler and Halden; 2007; Ying et al., 2007).
On the other hand, this means that most removal occurs due tobiodegradation processes (Singer et al., 2002; Bester, 2003; Heidlerand Halden, 2007). However, only little is known about the reac-tion pathways and conditions (Federle et al., 2002). About 5% oftriclosan is biomethylated to triclosan-methyl (2,4,40-trichloro-20-methoxy-diphenylether) (Bester, 2003, 2005; Heidler and Halden,2007). The structural formulas and basic physico-chemical param-eters of triclosan and triclosan-methyl are compared in Table 1.Another 5% of triclosan is transformed to bound residues (Bester,2003). The biochemical pathways and conditions for formation oftriclosan-methyl are largely unknown up to now, as most studiesfocused on the mass flow of triclosan-methyl in the WWTP treat-ment process (Bester, 2005), its formation in estuarine systems(DeLorenzo et al., 2007) as well as bioaccumulation of triclosan-methyl in fish samples (Lindström et al., 2002; Balmer et al.,2004). It is known, though, that triclosan-methyl is more persis-tent, lipophilic, bio-accumulative and less sensitive towardsphoto-degradation in the environment than its parent compound(Lindström et al., 2002; Balmer et al., 2004). Typical concentrationsof triclosan in sludge were 2–8 mg kg�1 dry matter in Germany(Bester, 2003) while triclosan-methyl was only detected with0.004–0.311 mg kg�1 (dry weight) in sewage sludge samples frommunicipal wastewater treatment plants in Spain (Sánchez-Bruneteet al., 2010).
To maximize the biodegradation of compounds like triclosanand triclosan-methyl it is crucial to understand by which processand in which part of the treatment plants triclosan is eliminatedand by which process triclosan-methyl is generated. There are
0045-6535/$ - see front matter � 2011 Elsevier Ltd. All rights reserved.doi:10.1016/j.chemosphere.2011.03.042
⇑ Corresponding author. Tel.: +45 46301243.E-mail address: [email protected] (K. Bester).
Chemosphere 84 (2011) 452–456
Contents lists available at ScienceDirect
Chemosphere
journal homepage: www.elsevier .com/locate /chemosphere

three basic processes in biological treatment in the WWTP: aero-bic, anaerobic and anoxic. Aerobic (oxygen present) biologicaltreatment is generally used removal of BOD (biochemical oxygendemand) as well as for nitrification (ammonia to nitrate). Anoxicconditions (no oxygen but nitrate present) are used for denitrifica-tion (nitrate to nitrogen gas). True anaerobic conditions (neitheroxygen nor nitrate present) are limited to sludge digestion pro-cesses such as methane production. These three individual typesof biological treatment processes can be run in one tank with dif-ferent operating regimes in time or in separate tanks to offer bettertreatment. The current study compared the degradation of triclo-san and formation of methyl-triclosan under the different condi-tions in laboratory-scale experiments to determine which of theprocesses were important for the biodegradation of triclosan inwaste water treatment.
2. Materials and methods
2.1. Activated sludge sampling
Activated sludge samples for the preliminary experiments weresampled from Aalborg East wastewater treatment plant (WWTP),which processes 6 � 106 m3 wastewater (100 000 populationequivalents, PE) annually. Samples for the detailed aerobic experi-ments were from Aalborg West WWTP, which processes22 � 106 m3 wastewater (330 000 PE) annually.
The other key parameters of the plants are similar. Both receiveabout 80% municipal wastewater and 20% from local industries.They run with a hydraulic retention time of 24–30 h and sludgeretention time of 25–30 d, and the process configurations includea screen chamber, primary sedimentation basins, activated sludgetreatment basins and a final clarifier before the treated water is re-leased into the Limfjord. Nitrification and denitrification are per-formed as alternating denitrification. Phosphorous removal isperformed mostly by biological means. The suspended solids (SS)content of the activated sludge was 4 g L�1 and its volatile solidscontent was 2.5 g L�1 during the sampling period.
2.2. Degradation experiments
Biodegradation experiments were carried out in 5 L glass biore-actors. During the experiments, all reactors were maintained at17 ± 2 �C. The reactors were completely covered by aluminium foilto prevent photolytic degradation. They were monitored daily forloss of water by weighing, eventual loss of water was compensated
by adding tap water. No action was undertaken to prevent volatil-ization of triclosan, as the vapor pressure of triclosan and triclosan-methyl, both are very low (Table 1). The reactors were stirred bymeans of teflonized magnetic stir bars to keep the sludge homoge-neous. No additional carbon source was added to the system, thusthey were run as static reactors. Duplicated sludge samples weretaken every day from each reactor.
The incubation conditions were established as:
(1) Aerobic conditions by supplying air through a diffuser stonewith a flow rate of 1.3 L h�1.
(2) Anaerobic conditions were maintained by constantly flushingthe respective bioreactor with nitrogen gas.
(3) Anoxic (nitrate reducing) conditions were maintained byconstant addition of potassium nitrate (KNO3)(44 gNd�1 L�1).
The preliminary experiments were incubated for 80 h underaerobic, anaerobic and anoxic conditions with starting concentra-tions of 0.1 mg L�1 triclosan, which is exceeding typical wastewa-ter concentrations by a factor of 10 but it is in the same range asexpected in activated sludge in municipal WWTPs (Bester, 2005).
Detailed aerobic experiments were performed for 10 d at fivedifferent initial triclosan concentrations to determine the rate oftriclosan-methyl formed from triclosan under aerobic conditions.Triclosan concentrations of 0.02, 0.5, 1, 2 and 3 mg L�1 were usedin order to investigate whether the degradation of triclosan andformation of triclosan-methyl were concentration related. The3 mg L�1 is towards the very high end of the concentration thatcan still be found in rare cases in sludge (Stasinakis et al., 2007).The high concentrations were chosen, to be able to discriminatebetween triclosan an triclosan-methyl already present in thesludge and those freshly spiked for the experiments. In theseexperiments oxygen concentrations were measured and continu-ously kept above 4.0 mg L�1.
2.3. Extraction and instrumental analysis
2.3.1. Liquid sludgeTen millilitre sludge samples from the experiments were di-
luted by tap water to 1 L and extracted successively for 20 minwith 10 mL toluene by means of vigorous stirring with a teflonizedmagnetic stir bar after adding an aliquot of 100 lL of internal stan-dard solution (musk xylene D15). The organic phase was separatedfrom the aqueous one and the residual water was removed from
Table 1Structural formulas and other environmental parameters of triclosan and triclosan-methyl.
Triclosan (Bester, 2005; Lindström et al., 2002, EPISuite 4.0)
Name: 2,4,40-trichloro, 20-hydroxy-diphenyletherWater solubility: 4.621 mg L�1
Vapor pressure: 0.00062 Palog Kow: 4.2–4.8log Koc: 4.3pKa: 7.9
Triclosan-methyl (Bester, 2005; Balmer et al.,2004, EPI Suite 4.0)
Name: 2,4,40-Trichloro, 20-methoxy-diphenyletherWater solubility: 0.4 mg L�1
Vapor pressure: 0.00093 Palog Kow: 5log Koc: 4.1
X. Chen et al. / Chemosphere 84 (2011) 452–456 453

the organic phase by freezing the samples overnight at -20 �C. Theorganic extracts were concentrated to 1 mL with a nitrogen flowcondensator at 55 �C.
2.3.2. Solid sludgeTo determine sorption of triclosan into the solid phase, another
10 mL sludge samples were taken every day from each reactor. Thesamples were filtered through GC-50 glass fiber filters (Advantec,Tokyo, Japan) with pore size of 0.2 lm. Filter residues (sludge solidmatter) were immediately stored in a refrigerating room at �27 �Covernight and then lyophilized at 2 mbar and �46 �C. The lyophi-lized samples were extracted by means of accelerated solventextraction (ASE) with ethyl acetate at 90 �C and 150 bar (Chenand Bester, 2009). The resulting extracts were then concentratedby using a Büchi multiport concentrator at 80 �C and 70 mbar(Büchi, Essen, Germany) after adding 10 mL toluene and 100 lLinternal standard solution.
2.3.3. Instrumental analysisTriclosan extracts from the liquid and solid sludge samples
were both finally analysed by gas chromatography with mass spec-trometric detection (GC–MS, Thermo-Trace GC–MS) equipped witha splitless injector and A200S autosampler. Samples (1 lL) were in-jected into the injector in splitless (1.5 min) mode held at a tem-perature of 240 �C. The GC separation was performed with a Rxi-5Sil MS column (Restek, Bellefonte, USA), L: 10 m; ID: 0.18 mm;film: 0.18 lm and a temperature programme of: 90 �C (hold:1 min) ramped with 50 �C min�1 to 135 �C and then with10 �C min�1 to 220 �C. Finally, the baking temperature was reachedby ramping the column with 40 �C min�1 to 260 �C which was heldfor 6 min. Helium (5.0) was used as carrier gas with a flow rate of1.3 mL min�1. The transfer line of the mass spectrometer (TraceMS, Thermo Finnigan, Dreieich, Germany) was held at 250 �C.The ion source was operated at 160 �C. The mass spectrometerwas operated in selected ion monitoring (SIM) utilizing 31–61 msdwell time. The detector of the mass spectrometer was operatedat 450 V. Table 2 lists the retention times of triclosan and triclo-san-methyl and the mass fragments used for the detection.
2.3.4. Data treatmentThe average of the duplicate extractions measured by duplicate
injections was used for further data processing. The calibrationswere performed as a multi-step internal standard calibration(10–10 000 ng mL�1). The full method and validation data for tri-closan and triclosan-methyl for liquid samples were described inBester (2005), while those for the solids were described by Chenand Bester (2009). Both are shown in Table 2. To additionally val-idate this method for recovery of triclosan from liquid sludge, itwas tested by extracting several activated sludge samples spikedwith this biocide. Five different concentrations (between 20 lg g�1
and 3000 lg g�1) were dosed and for each concentration two sam-ples were extracted; thus 10 extractions were performed. Therecovery rate of triclosan was 82% with 10% relative standard devi-ation, which is consistent with previous measurements (Bester,2005).
2.4. Materials
Triclosan was purchased from Ehrenstorfer (Augsburg,Germany) with a purity of P99% according to the supplier.Triclosan-methyl was synthesized from triclosan by methylationwith trimethylsulfonium hydroxide solution (Macherey–Nagel,Dueren, Germany) at 40 �C (Bester, 2003). Toluene was used in res-idue grade (z.R.) quality and purchased from Merck (Darmstadt,Germany). The internal standard musk xylene D15 (Ehrenstorfer,Augsburg, Germany) was used to quantify triclosan and triclosan-methyl (Andresen and Bester, 2006).
3. Results and discussions
3.1. Preliminary experiments
In this experiment the fate of triclosan was investigated in reac-tor experiments under aerobic, anaerobic and anoxic conditionswith sludge from Aalborg East WWTP. After 80 h the concentrationof the parent compound was reduced from 30 to 15 lg L�1 (49%,i.e. significantly) under aerobic conditions, but only from 32 to28 lg L�1 (11%) and from 32 to 29 lg L�1 (16%) under anaerobicand anoxic conditions, respectively, which is very close to themethod standard deviation, i.e., 11% (Bester, 2005).
Opposite to the triclosan concentrations, those of triclosan-methyl concordantly increased from 4.2 to 5.0 lg L�1 (16%) duringthe aerobic incubation and from 4.1 to 4.8 lg L�1 (17%) during theanoxic incubation. Considering the analytical standard deviation,this increase is significant. Additionally, no change of concentra-tions was detected under anaerobic condition.
In summary, the fastest removal triclosan removal and its high-est transformation rate to triclosan-methyl were determined underaerobic conditions. Therefore, the more detailed experiments on
Table 2Quality assurance data including the MS data (analytical and verifier ions) as well as limit of quantification (LOQ) of the experiments for the liquid samples. Data for recovery rate(RR) and relative standard deviation (RSD) for liquid sludge were from Bester (2003), while those for solid sludge were from Chen and Bester (2009).
Analyte Analytical ion(amu)
Verifier ion(amu)
Retention time(min)
LOQ(ng L�1)
(RR) for liquidsludge (%)
(RSD) for liquidsludge (%)
(RR) for solidsludge (%)
(RSD) for solidsludge (%)
Triclosan 288 290 6.11 10 88 11 114 12Triclosan-
methyl302 304 6.04 0.3 102 11 55 10
time (hours)0 50 100 150 200 250
0
5
10
15
20
conc
entra
tion
(µg
L-1 )
TCS in reactor with starting TCS concentration of 20 µg L-1
TCS-Me in reactor with starting TCS concentration of 20 µg L-1
Fig. 1. Concentrations of triclosan and triclosan-methyl in aerated reactors. Startingconcentration 20 lg L�1 triclosan (unspiked). Error bars indicate standard error of11% (Bester, 2005).
454 X. Chen et al. / Chemosphere 84 (2011) 452–456

degradation and methylation of triclosan were carried out in acti-vated sludge under the aerobic conditions.
3.2. Detailed aerobic kinetic experiments
To make sure the elevated concentrations of triclosan-methyl atthe end of the experiment really originated from the freshly addedtriclosan and not from an old and eventually unknown pool of tri-closan in the sludge, several experiments were performed with dif-ferent triclosan concentrations in aerobic experiments. Triclosanconcentrations were rapidly reduced in all reactors whiletriclosan-methyl concentrations increased concomitantly. Fig. 1shows these data for the reactors with 0.02 mg L�1 starting triclo-san concentrations (unspiked), while in Fig 2 the data for startingtriclosan concentrations of 1 and 2 mg L�1 (spiked) are shown,respectively. The major part of removal was achieved within150 h (Figs. 1 and 2), after which the triclosan concentrations re-mained almost constant at less than 0.01 mg L�1 to the end ofthe experiment (220 h) (Fig. 1).
The production of triclosan-methyl occurred in all experiments.The concentrations of triclosan-methyl increased according to thestarting levels of the parent compound, though the concentrationsof the metabolite remained significantly lower than the initial par-ent concentrations (Fig. 2). It is assessed that in these reactors 1% oftriclosan was transformed into triclosan-methyl during the experi-ment under aerobic conditions. However, in the reactor with triclo-san starting concentration of 0.02 mg L�1 (Fig. 1), the production of
triclosan-methyl was mostly obscured by the background concen-trations (from the sludge from the waste water treatment plant).In the reactors fed with 1 and 2 mg L�1 triclosan, the concentrationsof triclosan-methyl increased (Fig. 2), reaching the highest concen-trations after 120 h, at which they remained until the end of theexperiment. The concentration increase of themetabolite coincidedwith the concentration decrease of the parent compound. Thoughno strict mathematical equations could be established, it is clear,that the higher the starting concentration of triclosanwas, the high-er was the metabolite concentration at the end of the experiment,thus proving the triclosan-methyl was really formed from theadded triclosan. The experiment thus indicates that the biomethy-lation of triclosan can occur in aerobic reactors. As the concentra-tions of triclosan-methyl are unchanged even after more than100 h after the main pool of triclosan is consumed, it is obvious thatthe metabolite cannot be degraded within timeframes relevant forwastewater treatment.
To quantify the possible sorption of triclosan, solid sampleswere analysed. Consistently 10% of the triclosan found in theexperiment medium (liquid sludge) was sorbed to the solidsthroughout the experiment. The triclosan concentrations in the so-lid phase show thus decrease in parallel to those in the liquidphase. The partitioning of triclosan between the solid and liquidphase remains constant, thus exchange processes are quick in com-parison to the degradation. Additionally, the pH value of the sludgewas measured as triclosan adsorption and extraction are pHdependent (Lindström et al., 2002). The pH value remained con-stant (6.9 ± 0.5) during the experiment indicating that the concen-tration changes measured are not influenced by pH.
At low concentrations (normal WWTP levels, up to 20 lg L�1)the biological degradation of triclosan followed the first-orderkinetics (Fig. 1), while the reaction kinetics is more complex athigher concentrations (>500 lg L�1). Thus, the pseudo-first-orderrates and half-lives from reactors were calculated to give an over-view of the performance of the system (Table 3). The estimatedhalf-lives (t1/2) were found to be 54–86 h, and the elimination ratesconsidering a 10-d period were 75% and 86% for the reactors withinitial triclosan concentration of 0.02 and 0.5 mg L�1, and 99% forreactors with the initial triclosan concentration of 1, 2 and3 mg L�1.
The half-life of triclosan in this experiment was not dependenton the concentration. However, the elimination rates wererelatively lower when the starting concentration was low(0.02 mg L�1), and reached higher values (>99%) when the startingconcentration was high (>1 mg L�1). These data are from steadystate lab scale experiment, thus should be extrapolated to full-scale WWTPs (which are flow through systems) with caution, asexternal carbon sources, temperature, interference of other organiccompounds etc. may lead to different rates.
The rate constants of triclosan-methyl generation increasedconcordantly with the starting concentration of triclosan as shownin Table 3. With the initial triclosan concentrations of 0.5, 1, 2 and
time (hours)0 50 100 150 200 250
0
200
400
600
800
1000
1200
1400
1600
1800
2000
0
5
10
15
20
25
TCS
conc
entra
tion
(µg
L-1)
TCS-
Me
conc
entra
tion
(µg
L-1)
TCS in reactor with starting TCS concentration of 1 mg L-1
TCS in reactor with starting TCS concentration of 2 mg L-1
TCS-Me in reactor with starting TCS concentration of 1 mg L-1
TCS-Me in reactor with starting TCS concentration of 2 mg L-1
Fig. 2. Concentrations of triclosan and triclosan-methyl in aerated reactors. Startingconcentration of 1 and 2 mg L�1 triclosan (spiked). Error bars indicate standarderror of 11% (Bester, 2005).
Table 3Degradation rate constant (k) of triclosan and generation rate of triclosan-methyl in different concentrations in aerobic activated sludge systems. Starting concentration (Co) andfinal concentrations (Cf) are given. The final concentrations were measured after 220 h. Half-lives and pseudo-first-order rate constants for the degradation of triclosan werecalculated from the data between lag phase (24 h) and end of reaction (120 h), whereas generation rates of triclosan-methyl were calculated by using the data between 0–120 h.
Removal of TCS Formation of TCS-Me
Co (lg L�1) Cf (lg L�1) k (s�1) R2 t1/2 (h) Co (lg L�1) Cf (lg L�1) k (s�1)
20 5 0.0081 0.9969 86 1.6 2.2 0.004500* 55 0.0095 0.9961 73 2.8 6.4 0.00541000 10 0.0129 0.8832 54 2.2 10.7 0.01032000 10 0.0085 0.9451 82 3.2 18.7 0.01273000 10 0.0123 0.7094 56 3.2 19.8 0.0129
* This experiment was ended after 168 h.
X. Chen et al. / Chemosphere 84 (2011) 452–456 455

3 mg L�1, the rate constants were 0.0054, 0.0103, 0.0127 and0.0129 s�1, respectively.
Biomethylation of triclosan under aerobic conditions was sur-prising as methylation of pollutants such as mercury (Gray et al.,2004, 2006; Barringer and Szabo, 2006), antimony, arsenic (Dusteret al., 2008), bismuth (Michalke et al., 2002) and phenols (Pfeiferet al., 2001) is usually associated with anaerobic, anoxic (no oxy-gen but nitrate present), methanogenic or sulfate reducing re-gimes. However, biomethylation, e.g., by cobalamin (VitaminB12) (Wehmeier et al., 2004) is not restricted to anaerobic condi-tions. Older literature reported the conditions that induced meth-ylation processes were rather ‘‘organic-rich’’ (Compeau andBartha, 1985), while others have reported that polychlorinatedphenoxy phenols (PCPP) were biomethylated in contaminated soiland in several pure and mixed bacterial cultures under aerobicconditions (Valo and Salkinoja-Salonen, 1986). Additionally, biom-ethylation of chlorinated phenolic compounds (Häggblom et al.,1988) and tetrabromobisphenol-A (George and Häggblom, 2008)has been detected under aerobic conditions.
4. Conclusions
Triclosan-methyl was formed concomitantly with the removalof triclosan in activated sludge under aerobic conditions.Triclosan-methyl was also formed under anoxic (nitrate reducing)conditions although at lower rates but was not formed underanaerobic conditions in laboratory experiments. According to theselaboratory experiments, the emissions of triclosan-methyl willthus be affected mostly by the management of the BOD removaland nitrification tanks but not during anaerobic digestion.
Acknowledgement
The authors acknowledge the support of FTP (Danish ResearchCouncil for Technology and Production) and Aalborg Universityas well as the cooperation of xenobiotic group of UniversityDuisburg-Essen. The authors are gratefully acknowledging the helpof Jes Vollertsen with assessing the kinetics of the reactions. Theauthors are especially grateful to the anonymous reviewers thathelped considerably to find the right phrasing for this manuscripttouching environmental chemistry, biology and engineering issues.
References
Adolfsson-Erici, M., Pettersson, M., Parkkonen, J., Sturve, J., 2002. Triclosan, acommonly used bactericide found in human milk and in the aquaticenvironment in Sweden. Chemosphere 46, 1485–1489.
Andresen, J., Bester, K., 2006. Elimination of organophosphate ester flame retardantsand plasticizers in drinking water purification. Water Res. 40, 621–629.
Balmer, M.E., Poiger, T., Droz, C., Romanin, K., Bergqvist, P.A., Müller, M.D., Buser,H.R., 2004. Occurrence of methyl triclosan, a transformation product of thebactericide triclosan, in fish from various lakes in Switzerland. Environ. Sci.Technol. 38, 390–395.
Barringer, J.L., Szabo, Z., 2006. Overview of investigations into mercury in groundwater, soils, and septage, New Jersey coastal plain. Water Air Soil Pollut. 175,193–221.
Bester, K., 2003. Triclosan in a sewage treatment process—balances and monitoringdata. Water Res. 37, 3891–3896.
Bester, K., 2005. Fate of triclosan and triclosan-methyl in sewage treatment plantsand surface waters. Arch. Environ. Contam. Toxicol. 49, 9–17.
Chen, X.J., Bester, K., 2009. Determination of organic micro-pollutants such aspersonal care products, plasticizers and flame retardants in sludge. Anal.Bioanal. Chem. 395, 1877–1884.
Compeau, G.C., Bartha, R., 1985. Sulfate-reducing bacteria-principal methylators ofmercury in anoxic estuarine sediment. Appl. Environ. Microbiol. 50, 498–502.
Coogan, M.A., Edziyie, R.E., La Point, T.W., Venables, B.J., 2007. Algalbioaccumulation of triclocarban, triclosan, and methyl-triclosan in a NorthTexas wastewater treatment plant receiving stream. Chemosphere 67, 1911–1918.
DeLorenzo, M.E., Keller, J.M., Arthur, C.D., Finnegan, M.C., Harper, H.E., Winder, V.L.,Zdankiewicz, D.L., 2007. Toxicity of the antimicrobial compound triclosan andformation of the metabolite methyl-triclosan in estuarine systems. Environ.Toxicol. 23, 224–232.
Duester, L., Vink, J.M., Hirner, A.V., 2008. Methylantimony and –arsenic species insediment pore water tested with the sediment or fauna incubation experiment.Environ. Sci. Technol. 42, 5866–5871.
Federle, T.W., Kaiser, S.K., Nuck, B.A., 2002. Fate and effects of triclosan in activatedsludge. Environ. Toxicol. Chem. 21, 1330–1337.
Franz, S., Altenburger, R., Heilmeier, H., Schmitt-Jansen, M., 2008. What contributesto the sensitivity of microalgae to triclosan? Aquat. Toxicol. 90, 102–108.
George, K.W., Häggblom, M.M., 2008. Microbial O-methylation of the flameretardant tetrabromobisphenol-A. Environ. Sci. Technol. 42, 5555–5561.
Gray, J.E., Hines, M.E., Biester, H., 2006. Mercury methylation influenced by areas ofpast mercury mining in the Terlingua district, Southwest Texas USA. Appl.Geochem. 21, 1940–1954.
Gray, J.E., Hines, M.E., Higueras, P.L., Adatto, I., Lasorsa, B.K., 2004. Mercuryspeciation and microbial transformations in mine wastes, stream sediments,and surface waters at the Almaden mining district Spain. Environ. Sci. Technol.38, 4285–4292.
Häggblom, M.M., Nohynek, L.J., Salkinoja-Salonen, M.S., 1988. Degradation and O-methylation of chlorinated phenolic compounds by rhodococcus andmycobacterium strains. Appl. Environ. Microbiol. 54, 3043–3052.
Heidler, J., Halden, R.U., 2007. Mass balance assessment of triclosan removal duringconventional sewage treatment. Chemosphere 66, 362–369.
Lin, D., Zhou, Q., Xie, X., Liu, Y., 2010. Potential biochemical and genetic toxicity oftriclosan as an emerging pollutant on earthworms (Eisenia fetida). Chemosphere81, 1328–1333.
Lindström, A., Bürge, I.J., Poiger, T., Bergqvist, P.A., Müller, M.D., Buser, H.R., 2002.Occurrence and environmental behavior of the bactericide triclosan and itsmethyl derivative in surface waters and in wastewater. Environ. Sci. Technol.36, 2322–2329.
Michalke, K., Meyer, J., Hirner, A.V., Hensel, R., 2002. Biomethylation of bismuth bythe methanogen methanobacterium formicicum. Appl. Organomet. Chem. 16,221–227.
Nassef, M., Matsumoto, S., Seki, M., Khalil, F., Kang, I.J., Shimasaki, Y., Oshima, Y.,Honjo, T., 2010. Acute effects of triclosan, diclofenac and carbamazepine onfeeding performance of Japanese medaka fish (Oryzias latipes). Chemosphere 80,1095–1100.
Pfeifer, O., Lohmann, U., Ballschmiter, K., 2001. Halogenated methyl-phenyl ethers(anisoles) in the environment: Determination of vapor pressures, aqueoussolubilities, Henry’s law constants, and gas/water- (Kgw), n-octanol/water-(Kow) and gas/n-octanol (Kgo) partition coefficients. Fresenius J. Anal. Chem.371, 598–606.
Sánchez-Brunete, C., Miguel, E., Albero, B., Tadeo, J.L., 2010. Determination oftriclosan and methyl triclosan in environmental solid samples by matrix solid-phase dispersion and gas chromatography–mass spectrometry. J. Sep. Sci. 33,2768–2775.
Schweizer, H.P., 2001. Triclosan: a widely used biocide and its link to antibiotics.FEMS Microbiol. Lett. 202, 1–7.
Singer, H., Müller, S., Tixier, C., Pillonel, L., 2002. Triclosan: occurrence and fate of awidely used biocide in the aquatic environment: field measurements inwastewater treatment plants, surface waters, and lake sediments. Environ.Sci. Technol. 36, 4998–5004.
Stasinakis, A.S., Petalas, A.V., Mamais, D., Thomaidis, N.S., Gatidou, G., Lekkas, T.D.,2007. Investigation of triclosan fate and toxicity in continuous-flow activatedsludge systems. Chemosphere 68, 375–381.
Valo, R., Salkinoja-Salonen, M., 1986. Microbial transformation of polychlorinatedphenoxy phenols. J. Gen. Appl. Microbiol. 32, 505–517.
Wehmeier, S., Raab, A., Feldmann, J., 2004. Investigations into the role ofmethylcobalamin and glutathione for the methylation of antimony usingisotopically enriched antimony(V). Appl. Organomet. Chem. 18, 631–639.
Wilson, B., Chen, R.F., Cantwell, M., Gontz, A., Zhu, J., Olsen, C.R., 2009. Thepartitioning of triclosan between aqueous and particulate bound phases in theHudson River Estuary. Mar. Pollut. Bull. 59, 207–212.
Ying, G.G., Yu, X.Y., Kookana, R.S., 2007. Biological degradation of triclocarban andtriclosan in a soil under aerobic and anaerobic conditions and comparison withenvironmental fate modelling. Environ. Pollut. 150, 300–305.
456 X. Chen et al. / Chemosphere 84 (2011) 452–456


Research paper 6:
Chen XJ., Richard J., Dopp E., Türk J., Liu YL. and Bester K. Ozonisation products of
triclosan in advanced wastewater treatment, Water Research 46 (2012) 2247-2256


Author's personal copy
Ozonation products of triclosan in advanced wastewatertreatment
Xijuan Chen a, Jessica Richard b, Yaling Liu c, Elke Dopp b,d, Jochen Tuerk e, Kai Bester f,*aDepartment of Biotechnology, Chemistry and Environmental Engineering, Aalborg University, Aalborg, Denmarkb Institute of Hygiene and Occupational Medicine, University Hospital Essen, GermanycUniversity Duisburg-Essen, Department of Chemistry, Essen, Germanyd IWW Rheinisch-Westfalisches Institut fur Wasserforschung GmbH, Mulheim, Germanye Institut fur Energie- und Umwelttechnik e. V., IUTA (Institute of Energy and Environmental Technology), Duisburg, GermanyfEnvironmental Science, Aarhus University, Roskilde, Denmark
a r t i c l e i n f o
Article history:
Received 26 April 2011
Received in revised form
23 January 2012
Accepted 28 January 2012
Available online 7 February 2012
Keywords:
Triclosan
Ozone
Ozonation products
2,4-dichlorophenol
Toxicity
a b s t r a c t
Triclosan is an antimicrobial agent widely used in many household and personal care prod-
ucts. Widespread use of this compound has led to the elevated concentrations of triclosan in
wastewater, wastewater treatment plants and receiving waters. In this study removal of
triclosan by aqueous ozone was investigated and the degradation products formed during
ozonation of an aqueous solution of triclosan were analyzed by GC-MS and HPLC-MS/MS.
The following transformation products have been identified: 2,4-dichlorophenol, chloro-
catecol, mono-hydroxy-triclosan and di-hydroxy-triclosan during treatment process. Cyto-
toxicity and genotoxicity of pure triclosan and 2,4-dichlorophenol have been investigated and
the results showed reduced genotoxic effects after ozonation, though the respective chlor-
ophenol is harmful to aquatic organisms.
ª 2012 Elsevier Ltd. All rights reserved.
1. Introduction
Triclosan (2,4,40-trichloro-20hydroxydiphenylether, CAS: 3380-34-5) is currently used as an antimicrobial agent in toothpaste,
mouthwash, liquid soap and in functional clothing such as
functional shoes and underwear (Engelhaupt, 2007). It is also
used as a stabilizing agent in a multitude of detergents and
cosmetics and as an antimicrobial agent in polymeric food
cutting boards (Adolfsson-Erici et al., 2002; Dann and Hontela,
2011). Approximately 1500 t are produced annually world-
wide, and approximately 350 t of those are applied in Europe
(Singer et al., 2002). The primary emission route for triclosan
after usage is through wastewater. In fact, investigators have
detected triclosan in numerous municipal wastewater
influent samples at concentrations in the range of
0.5e4.5 mg L�1 (Buth et al., 2011; Lindstrom et al., 2002).
In wastewater treatment plants (WWTPs) 90% of the incoming
triclosan was removed from the water (Bester, 2003, 2005;
Heidler and Halden, 2008; Singer et al., 2002), which is a high
but not complete removal. As a result, it has been found in
some sewage treatment plant effluents as well as in surface
water and ground water in many countries (Adolfsson-Erici
et al., 2002; Balmer et al., 2004; Bester, 2005). In addition, it
has been detected in fish, soil and sediments due to its
hydrophobicity (Coogan et al., 2007; Lozano et al., 2010; Xie
et al., 2008).
* Corresponding author. Tel.: þ45 87158552.E-mail address: [email protected] (K. Bester).
Available online at www.sciencedirect.com
journal homepage: www.elsevier .com/locate/watres
wat e r r e s e a r c h 4 6 ( 2 0 1 2 ) 2 2 4 7e2 2 5 6
0043-1354/$ e see front matter ª 2012 Elsevier Ltd. All rights reserved.doi:10.1016/j.watres.2012.01.039
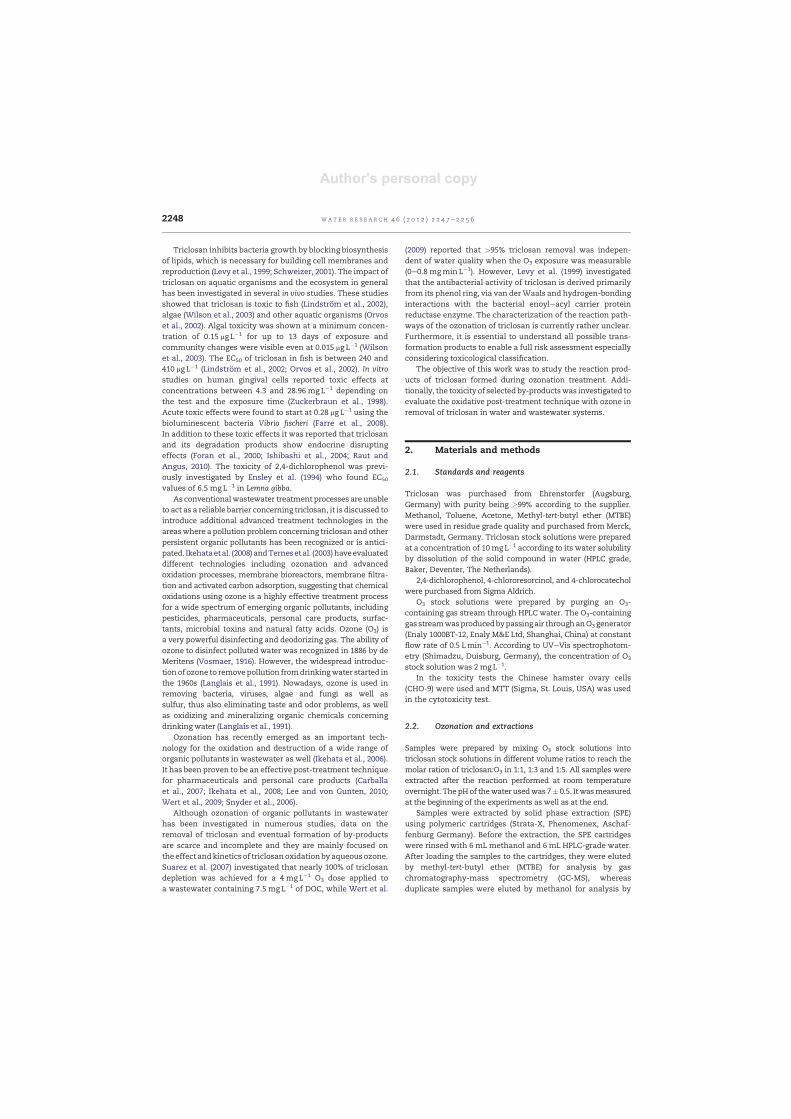
Author's personal copy
Triclosan inhibits bacteria growth by blocking biosynthesis
of lipids, which is necessary for building cell membranes and
reproduction (Levy et al., 1999; Schweizer, 2001). The impact of
triclosan on aquatic organisms and the ecosystem in general
has been investigated in several in vivo studies. These studies
showed that triclosan is toxic to fish (Lindstrom et al., 2002),
algae (Wilson et al., 2003) and other aquatic organisms (Orvos
et al., 2002). Algal toxicity was shown at a minimum concen-
tration of 0.15 mg L�1 for up to 13 days of exposure and
community changes were visible even at 0.015 mg L�1 (Wilson
et al., 2003). The EC50 of triclosan in fish is between 240 and
410 mg L�1 (Lindstrom et al., 2002; Orvos et al., 2002). In vitro
studies on human gingival cells reported toxic effects at
concentrations between 4.3 and 28.96 mg L�1 depending on
the test and the exposure time (Zuckerbraun et al., 1998).
Acute toxic effects were found to start at 0.28 mg L�1 using the
bioluminescent bacteria Vibrio fischeri (Farre et al., 2008).
In addition to these toxic effects it was reported that triclosan
and its degradation products show endocrine disrupting
effects (Foran et al., 2000; Ishibashi et al., 2004; Raut and
Angus, 2010). The toxicity of 2,4-dichlorophenol was previ-
ously investigated by Ensley et al. (1994) who found EC50
values of 6.5 mg L�1 in Lemna gibba.
As conventionalwastewater treatment processes areunable
to act as a reliable barrier concerning triclosan, it is discussed to
introduce additional advanced treatment technologies in the
areaswhere a pollution problemconcerning triclosan and other
persistent organic pollutants has been recognized or is antici-
pated. Ikehataetal. (2008)andTernesetal. (2003)haveevaluated
different technologies including ozonation and advanced
oxidation processes, membrane bioreactors, membrane filtra-
tion and activated carbon adsorption, suggesting that chemical
oxidations using ozone is a highly effective treatment process
for a wide spectrum of emerging organic pollutants, including
pesticides, pharmaceuticals, personal care products, surfac-
tants, microbial toxins and natural fatty acids. Ozone (O3) is
a very powerful disinfecting and deodorizing gas. The ability of
ozone to disinfect polluted water was recognized in 1886 by de
Meritens (Vosmaer, 1916). However, the widespread introduc-
tionof ozone to removepollution fromdrinkingwater started in
the 1960s (Langlais et al., 1991). Nowadays, ozone is used in
removing bacteria, viruses, algae and fungi as well as
sulfur, thus also eliminating taste and odor problems, as well
as oxidizing and mineralizing organic chemicals concerning
drinking water (Langlais et al., 1991).
Ozonation has recently emerged as an important tech-
nology for the oxidation and destruction of a wide range of
organic pollutants in wastewater as well (Ikehata et al., 2006).
It has been proven to be an effective post-treatment technique
for pharmaceuticals and personal care products (Carballa
et al., 2007; Ikehata et al., 2008; Lee and von Gunten, 2010;
Wert et al., 2009; Snyder et al., 2006).
Although ozonation of organic pollutants in wastewater
has been investigated in numerous studies, data on the
removal of triclosan and eventual formation of by-products
are scarce and incomplete and they are mainly focused on
the effect andkinetics of triclosanoxidationbyaqueousozone.
Suarez et al. (2007) investigated that nearly 100% of triclosan
depletion was achieved for a 4 mg L�1 O3 dose applied to
a wastewater containing 7.5 mg L�1 of DOC, while Wert et al.
(2009) reported that >95% triclosan removal was indepen-
dent of water quality when the O3 exposure was measurable
(0e0.8 mgmin L�1). However, Levy et al. (1999) investigated
that the antibacterial activity of triclosan is derived primarily
from its phenol ring, via van derWaals and hydrogen-bonding
interactions with the bacterial enoyleacyl carrier protein
reductase enzyme. The characterization of the reaction path-
ways of the ozonation of triclosan is currently rather unclear.
Furthermore, it is essential to understand all possible trans-
formation products to enable a full risk assessment especially
considering toxicological classification.
The objective of this work was to study the reaction prod-
ucts of triclosan formed during ozonation treatment. Addi-
tionally, the toxicity of selected by-productswas investigated to
evaluate the oxidative post-treatment technique with ozone in
removal of triclosan in water and wastewater systems.
2. Materials and methods
2.1. Standards and reagents
Triclosan was purchased from Ehrenstorfer (Augsburg,
Germany) with purity being �99% according to the supplier.
Methanol, Toluene, Acetone, Methyl-tert-butyl ether (MTBE)
were used in residue grade quality and purchased fromMerck,
Darmstadt, Germany. Triclosan stock solutions were prepared
at a concentration of 10mg L�1 according to its water solubility
by dissolution of the solid compound in water (HPLC grade,
Baker, Deventer, The Netherlands).
2,4-dichlorophenol, 4-chlororesorcinol, and 4-chlorocatechol
were purchased from Sigma Aldrich.
O3 stock solutions were prepared by purging an O3-
containing gas stream through HPLC water. The O3-containing
gas streamwasproducedbypassingair throughanO3generator
(Enaly 1000BT-12, Enaly M&E Ltd, Shanghai, China) at constant
flow rate of 0.5 Lmin�1. According to UVeVis spectrophotom-
etry (Shimadzu, Duisburg, Germany), the concentration of O3
stock solution was 2 mg L�1.
In the toxicity tests the Chinese hamster ovary cells
(CHO-9) were used and MTT (Sigma, St. Louis, USA) was used
in the cytotoxicity test.
2.2. Ozonation and extractions
Samples were prepared by mixing O3 stock solutions into
triclosan stock solutions in different volume ratios to reach the
molar ration of triclosan:O3 in 1:1, 1:3 and 1:5. All samples were
extracted after the reaction performed at room temperature
overnight. ThepHof thewater usedwas 7� 0.5. Itwasmeasured
at the beginning of the experiments as well as at the end.
Samples were extracted by solid phase extraction (SPE)
using polymeric cartridges (Strata-X, Phenomenex, Aschaf-
fenburg Germany). Before the extraction, the SPE cartridges
were rinsed with 6 mL methanol and 6 mL HPLC-grade water.
After loading the samples to the cartridges, they were eluted
by methyl-tert-butyl ether (MTBE) for analysis by gas
chromatography-mass spectrometry (GC-MS), whereas
duplicate samples were eluted by methanol for analysis by
wat e r r e s e a r c h 4 6 ( 2 0 1 2 ) 2 2 4 7e2 2 5 62248

Author's personal copy
high performance liquid chromatography-mass spectrometry
(HPLC-MS/MS).
2.3. Analytical methods
Samples eluted by MTBE were analyzed by gas chromatog-
raphy with mass spectrometric detection (GC-MS) equipped
with a programmable temperature vaporizer (PTV) injector.
The PTV (1 mL injection volume) was operated in PTV splitless
mode. The injection temperature of 115 �C was held for 3 s, it
was successively ramped with 12 �C s�1 to 280 �C for the
transfer of the analytes. This temperature was held for
1.3 min. The injector was then ramped with 1 �C s�1 to 300 �Cwhich was held for 7 min as a cleaning phase.
The GC separation was performed with a DB-5MS column
(J&W Scientific, Santa Clara, United States), L: 15 m; ID:
0.25 mm; film: 0.25 mm using a temperature programme of:
100 �C (hold: 1 min) rampedwith 5 �Cmin�1 to 220 �C andwith
30 �Cmin�1 successively to 280 �C. Finally, the baking
temperature 280 �C was held for 7 min. Helium (5.0) was used
as a carrier gas with a flow rate of 1.3 mL min�1. The transfer
line was held at 250 �C, which is sufficient to transfer all
compounds from the GC into the MS as the vacuum builds up
in the transfer line. The ion source of the mass spectrometer
(DSQ, Thermo Finnigan, Dreieich, Germany) was operated at
230 �C in electron impact mode. The MS was used in full scan
mode from 50 Da to 600 Da and the detector was operated
with 1218 V.
The samples eluted by methanol were analyzed by liquid
chromatography with tandem mass spectrometric detection
(HPLC-MS/MS). The separation was performed using a Phe-
nomenex synergi 4u polar-RP column (150� 2 mm I.D.,
particle size 4 mm). The flow rate was 0.25 mLmin�1. The LC
gradient was established by mixing two mobile phases: phase
A, HPLC water and phase B, Methanol. The chromatographic
separation was achieved with the following gradient: 0e2 min
100% A, changing to 100% B in 30 min, 32e36 min 100% B. The
injection volume was 10 mL.
The LC system consisted of a UltiMate 3000 autosampler
(WPS-3000 T SL), a UltiMate 3000 pump (DG-3600 M), a UltiMate
3000 columncompartmenthold (TCC-3000RS) on20 �C (all from
Dionex, California, United States). After LC separation, the
analytes were determined by an AB-Sciex (California, United
States) API 4000 triple quadruple mass spectrometer using
electrospray ionization in negative mode with full scan from
130 Da to 400 Dautilizing theprimaryquadrupole.Nitrogenwas
used as a drying (at 400 �C) nebulizing and collision gas. One
scan per second was recorded.
2.4. Toxicity tests
2.4.1. Cell cultureThe Chinese hamster ovary cells (CHO-9) were cultured in
HAM’s F12 medium supplemented with 10% Foetal Calf
Serum, 0.5% gentamycin and 0.5% L-glutamine at 37 �C and 5%
CO2 conditions.
2.4.2. ExposureTriclosan and 2,4-dichlorophenol were tested between 0.5 and
100 mg L�1 for 24 h.
2.4.3. Cytotoxicity: MTT testTo detect cytotoxic effects the MTT test was performed using
the 96-well plate format using 100,000 CHO-9 cells in 200 mL of
HAM’s F12 medium in each well. After 24 h the fresh medium
was added and the cells were exposed to the different concen-
trations of the two substances for another 24 h. After the
exposure time the medium was removed and 100 mL fresh
medium and 10 mL MTT solution (5mg MTT dissolved in 1 mL
phosphatebufferedsaline) (KCl 2.67mM,KH2PO4 1.47 mM,NaCl
137.93mM, Na2HPO4$7H2O 8.06mM; Invitrogen) were added to
each well and incubated at 37 �C for 2 h. Themediumwas then
replaced with 100 mL of lysis solution (99.4 mL dimethylsulf-
oxide, 0.6 mLacetic acid [100%] and10 g sodiumdodecyl sulfate)
and the absorption was directly measured at 590 nm.
2.4.4. Genotoxicity: alkaline comet assayThealkaline cometassaywasperformedasdescribedbyOstling
and Johanson (1984) and later on revised by Singh et al. (1988)
with some minor modifications. In short: Microgels were
prepared by adding 50 mL of low melting point agarose (L.M.P.
agarose) to a chamber. 100,000 CHO-9 cells were exposed to
different concentrations of triclosan and 2,4-dichlorophenol for
24 h. 0.1 mgL�1 N-ethyl-N-nitrosourea was used as a positive
control and added to the cells 30min prior to trypsination. After
the exposure time the cells were washed, trypsinated and
resuspended. 45 mL of low melting point agarose were mixed
with 20 mL of cell suspension containing 8000 cells and addedon
top of the first layer of agarose. After solidification the slides
were coveredwith freshlypreparedandprecooled lysis solution
overnight at 4 �C. Before electrophoresis the slides were incu-
bated in electrophoresis solution at 4 �C for 20min. Electro-
phoresis was then performed for 20 min at 4 �C with 300mA.
After electrophoresis the slides were incubated in neutraliza-
tion solution for 30minandafterwarddehydrated inethanol for
2 h. Then the slides were stored overnight to let the gels dry
completely. DNA was stained with SYBR Green� and image
analysis was performed using the Comet Assay IV Software
(Perceptive Instrument, UK) and a CCD (charge coupled device)
camera attached to a Leica microscope. All experiments were
carried out three times and statistical analysis was performed
using the ManneWhitney test.
3. Results and discussions
3.1. Identification of triclosan ozonation products
In Table 1 it can be seen that triclosan reacts under all used
conditions quantitatively with ozone, thus removal rates of
94e99.9% seem realistic.
However, four major peaks were detected in the gas chro-
matogram of a sample extract of ozonized triclosan sample
withmolar ratio of triclosan:ozone in 1:2 measured by GC-MS.
On the basis of their mass spectra, isomers of dichlorophenol
(M1) and chlorocatechol (M2) were identified at the retention
time of 5.88 min and 12.7 min, respectively. Peaks at retention
time of 24.99 min and 28.94 min were identified as triclosan
and its mono-hydroxylated product (M3). By comparing to
a true standard, 2,4-dichlorophenol was verified as the major
monoaromatic metabolite in GC-MS. The full results of all
wat e r r e s e a r c h 4 6 ( 2 0 1 2 ) 2 2 4 7e2 2 5 6 2249

Author's personal copy
transformation products identified by GC-MS are listed in
Table 2.
A chromatogram of a sample with the molar ratio of tri-
closan:ozone: 1:2 measured by HPLC-MS is shown in Fig. 1.
Similar to the results from GC-MS, dichlorophenol (M1), chlor-
ocatechol (M2) and mono-hydroxy-triclosan (M3) were identi-
fied in the chromatogram. They were detected in different
ratios by GC-MS and HPLC-MS because of different extraction
and detection methods. Additionally, two isomers of chlor-
ocatechol (M2) and di-hydroxy-triclosan (M4) were detected by
the HPLC-MS measurements. The dichlorophenol (M1) was
confirmed as 2,4-dichlorophenol by comparison to a standard
purchased from Sigma Aldrich (Steinheim, Germany), the two
isomers of M2 were confirmed as 4-chlorocatechol (4-chloro-
1,2-dihydroxybenzene) (M2a) and 4-chlororesorcinol (4-chloro-
1,3-dihydroxybenzene) (M2b) by comparison with standards
purchased from Sigma Aldrich (Steinheim, Germany).
Other transformation products did not comply with stan-
dards by means of the retention time or were not commer-
cially available. Therefore, collision-induced dissociation
(CID) was used to produce product ion scans for further
metabolite identification. For this purpose the [M-H]� ion was
selected as precursor ion. The HPLC-MS/MS results of the
metabolite identification are listed in Table 3.
Table 1 e Volumes, molar ratios, and initial concentrations of triclosan and ozone in samples in comparison to finaltriclosan concentrations and removal rates.
SampleName
Volume oftriclosan stocksolution [mL]
Volume ofaqueous
ozone [mL]
Molar ratioof triclosanto ozone
Initial concentration Residualtriclosan[mg L�1]
Removalrate [%]
Triclosan [mg L�1] Ozone [mg L�1]
Sample 1 45 55 1:1 4.5 1.1 0.26 94
Sample 2 29 71 1:3 2.9 1.42 0.087 97
Sample 3 14 86 1:5 1.4 1.72 0.001 99.9
Table 2 e GC-MS results of the transformation product identification.
Compound Structure Retentiontime [min]
MW[Da]
RTþMScompliedstandard
RTþMScompliedtheory
Mass fragments(including the
Cl isotope signals)[Da]
Triclosan (M)
O
OH
Cl
Cl
Cl
24.99 288 Yes Yes 288 (290, 292),
252 (254, 256),
218 (220)
2,4-Dichlorophenol
(M1)
Cl
Cl
OH5.88 162 Yes Yes 162 (164, 166),
126, 98, 63
Chlorocatechol
(M2)
Cl (OH)2
11.40 144 Yes 144 (146),
115, 81, 52
Mono-hydroxy-
triclosan (M3)
O
OH
Cl
Cl
ClOH
28.45 304 Yes 304 (306, 308),
234 (236, 238)
wat e r r e s e a r c h 4 6 ( 2 0 1 2 ) 2 2 4 7e2 2 5 62250

Author's personal copy
Mono-hydroxy-derivatives of triclosan (M3) were detected
at 303 and 305 Da (equivalent to the two main isotope signal
for the (M-H)� ion) at 27.56 min retention time. The product
ion scan of 303 Da and 305 Da provided abundant fragmen-
tation for this compound (Fig. 2). The identification was
confirmed by the detection of the fragment ion peak at 161
corresponding to (C6H3OCl2)�. The two chlorine atoms are
being verified by the chlorine isotope distribution in Fig. 2C.
Further analysis of Fig. 2B and C shows that fragments 125 Da
and 113 Da are attributed to [C6H2OCl]� and [C5H2OCl]�
stemming from cleavage of HCl and CHCl from 161 respec-
tively. It can thus be hypothesized that the oxidation takes
place in the triclosan ring with less chlorination.
The molecular ion peak of di-hydroxy-triclosan (M4)
was detected with the retention time at 17.65 min (Fig. 1).
The product ion spectrum of M4 showed major fragment ion
peaks at 161 and 125 Da, indicating that the double chlori-
nated ring is again still intact and not oxidized (Fig. S1). Similar
as the fragmentation spectrum of M3, the transformation
product identification was further confirmed by an investi-
gation on the chlorine isotope peaks.
3.2. Structural suggestions and verifications
After triclosan was reacted with ozone, some intermediates
were identified by using GC-MS and HPLC-MS/MS. On the
basis of their GC-MS spectra and HPLC-MS/MS fragmentation,
several ozonation products for triclosan are proposed (Table 2
and 3). Triclosan can be oxidized by ozone resulting in OH
addition forming mono-hydroxy- (M1) and di-hydroxy-
triclosan (M2) and finally breaking of the ether bond result-
ing in 2,4-dichlorophenol (M1), 4-chlorocatechol (M2a) and 4-
chlororesorcinol (M2b).
The 2,4-dichlorophenol (M1) is a well known product of
triclosan which has been detected by several investigators
within biodegradation experiments (Kim et al., 2010), as an
oxidative transformation product from reactions with
manganese oxides (Zhang and Huang, 2003), as well as
a photochemical degradation product in both natural and
buffered deionized water (Latch et al., 2005). Kim et al. (2010)
has found the chlorocatechol (M2), mono-hydroxy-triclosan
(M3) and di-hydroxy-triclosan (M4) as biodegradation prod-
ucts of triclosan frombacteria. Additionally, Zhang andHuang
(2003) have detected that mono-hydroxy-triclosan (M3) could
be one of the oxidation products of triclosan by manganese
oxides. Except the 2,4-dichlorophenol (M1), none of the other
transformation products have been published as ozonation
by-products of triclosan, to the best of our knowledge.
3.3. Ozonation of triclosan
The triclosan chromatograms of the three samples from the
experiment are shown in Fig. 3. Complete ozonation of tri-
closan (but not its transformation products) was detected in
the sample with molar ratio of triclosan:ozone¼ 1:5. Ozona-
tion was substantial in the sample with a molar ratio of
11.0 13.0 15.0 17.0 19.0 21.0 23.0 25.0 27.0 29.0 31.0 33.0Time, min
0.0
5.0e7
1.0e8
1.5e8
2.0e8
2.5e8
3.0e8
3.5e8
4.0e8
4.5e8
5.0e8
5.5e8
Inte
nsity
, cps
M2a, 4-chlorocatechol MW: 144
M4, dihydroxy-triclosan MW: 320
M2b, 4-chlororesorcinol MW: 144
M1, 2,4-dichlorophenol MW: 162
M3, monohydroxy-triclosan
MW: 304
Triclosan MW: 288
Fig. 1 e Chromatogram of sample with triclosan:ozone in 1:2 from HPLC-MS/MS (Electrospray ionization in negative
polarization ESI (L)) with suggested identification.
wat e r r e s e a r c h 4 6 ( 2 0 1 2 ) 2 2 4 7e2 2 5 6 2251

Author's personal copy
triclosan:ozone¼ 1:3 and less in the sample with molar ratio
of triclosan:ozone¼ 1:1.
2,4-dichlorophenol was detected by GC-MS and HPLC-MS
in all the three samples. Levels of 2,4-dichlorophenol in the
sample with high ozone amount (molar ration of triclosan:o-
zone in 1:3) were, however, lower than the other two samples
with lower ozone amount, which indicate that 2,4-
dichlorophenol is an intermediate product and can be
Table 3 e HPLC-MS/MS results of the transformation product identification.
Compound Structure Retentiontime [min]
MW [Da] RTþMScompliedstandard
RTþMScompliedtheory
Product ionscan fragments
[Da]
Triclosan (M)
O
OH
Cl
Cl
Cl
30.78 288 Yes Yes 287, 252, 251
2,4-Dichlorophenol
(M1)
Cl
Cl
OH24.76 162 Yes Yes 161, 125, 89,
61, 35
4-Chlorocatechol
(M2a) OH
Cl
OH
13.31 144 Yes Yes 143, 107, 79,
51, 35
4-Chlororesorcinol
(M2b) OH
Cl
OH
19.19 144 Yes Yes 143, 107, 79,
51, 35
Mono-hydroxy-
triclosan (M3)
O
OH
Cl
Cl
ClOH
27.56 304 Yes 303, 161, 125,
113, 85, 35
Di-hydroxy-
triclosan (M4)
O
OH
Cl
Cl
Cl(OH)2
17.65 320 Yes 319, 161, 125,
35
wat e r r e s e a r c h 4 6 ( 2 0 1 2 ) 2 2 4 7e2 2 5 62252

Author's personal copy
further oxidized. Chromatograms of 2,4-dichlorophenol and
triclosan during ozonation showing the somewhat longer
presence of 2,4-dichlorophenol are shown in Fig. 3. The
conversion yields of triclosan to 2,4-dichlorophenol depend
on the amount of ozone. Now, these compounds are available
they can be studied in biodegradation processes as well. More
information can be gained from Fig. S2 in which the signal
height obtained by HPLC-ESI (�) MS of all identified trans-
formation products is plotted against the relative ozone
concentration.
3.4. Toxicity of triclosan transformation products incomparison to triclosan
Cytotoxic and genotoxic effects of triclosan and its oxidation
by-product 2,4-dichlorophenol were analyzed using the MTT
test and the alkaline comet assay.
These two tests are well established toxicity tests and have
been used in the testing of chemicals for several decades and
they have been proven to be rapid and sensitive methods.
The MTT tests give a quantitative measure on the amount of
20 40 60 80 100 120 140 160 180 200 220 240 260 280 3000.01.0e42.0e43.0e44.0e45.0e46.0e47.0e48.0e49.0e41.0e5
Inte
nsity
, cps
160.7
112.7
34.9
124.6174.5
85.1
-HCl
-HC-Cl
-CO
20 40 60 80 100 120 140 160 180 200 220 240 260 280 300m/z, Da
0.04000.08000.0
1.2e41.6e42.0e42.4e42.8e43.2e43.6e44.0e44.4e4
Inte
nsity
, cps
162.6
112.6
160.6
114.735.037.3
124.7126.8 175.1
110 130 150 170 190 210 230 250 270 290 310 3300.02.0e54.0e56.0e58.0e51.0e61.2e61.4e61.6e61.8e6
Inte
nsity
, cps
[M3-H]- (303.0)
O
OH
Cl
Cl
ClOH
A
B
C
Fig. 2 eHPLC-MS/MS analysis (ESI (L)) of mono-hydroxy-triclosan, A) the full scan spectrum of themono-hydroxy-triclosan,
B) product ion spectrum of the precursor 303 of mono-hydroxy-triclosan (the isotopic composition 35Cl3), C) product ion
spectrum of the precursor of mono-hydroxy-triclosan (the isotopic composition 35Cl237Cl).
wat e r r e s e a r c h 4 6 ( 2 0 1 2 ) 2 2 4 7e2 2 5 6 2253

Author's personal copy
viable and dead cells thus the cytotoxicity of the tested
substances resulting in an idea about the general toxicity
(Mosmann, 1983). DNA damage was measured by the alkaline
comet assay which allows the detection of single and double
strand breaks as well as alkali labile sites (Singh et al., 1988;
Tice et al., 2000). In addition both tests have been previously
adapted for the use of CHO (Chinese Hamster Ovary) cells.
This is a cell line which has been derived from the ovaries of
the Chinese hamster in 1957 and widely used in toxicity
testing (Puck et al., 1958).
0 2 4 6 8 10 12 14 16 18 20 22 24 26 28 30 32 34Retention time (min)
0
5000000
10000000
15000000
20000000
5000000
10000000
15000000
20000000
5000000
10000000
15000000
20000000
OH
Cl
Cl
OH
O
lClC
Cl
Sample 1Ratio 1:1
162 + 288 Da
Sample 2Ratio 1:3
162 + 288 Da
Sample 3Ratio 1:5
162 + 288 Da
Inte
nsity
Fig. 3 e Chromatogram and MS spectra of triclosan and its ozonation product e 2,4-dichlorophenol detected by GC-MS in
electron impact ionization. To simplify the graph, the signals for 162 and 288 Da were added to gain one chromatogram for
both 2,4-dichlorophenol (162 Da) and triclosan (288 Da). Sample 1, triclosan:ozone[ 1:1. Sample 2, triclosan:ozone[ 1:3.
Sample 3, triclosan:ozone[ 1:5.
Fig. 4 e Genotoxic effects of triclosan and 2,4-dichlorophenol on CHO-9 cells after 24 h of exposure investigated using the
alkaline comet assay. Asterisks display the significance in DNA damage increase ( p< 0.05[ * significant; p< 0.01[ **
very significant; p< 0.001[ *** extremely significant).
wat e r r e s e a r c h 4 6 ( 2 0 1 2 ) 2 2 4 7e2 2 5 62254

Author's personal copy
Both substances were tested at concentrations between
0 and 100 mg L�1. The results of the MTT test show that neither
triclosan nor 2,4-dichlorophenol has any cytotoxic effect on
CHO-9 (Chinese Hamster Ovary) cells after a 24 h exposure at
the used concentrations (data not shown). For each concen-
tration the viability lies above 90% compared to the negative
control. In addition no difference can be seen comparing both
substances and their effects on cell viability.
However the results of the alkaline comet assay with
triclosan show tail moments increasing with concentrations.
Compared to triclosan and the negative control, 2,4-
dichlorophenol is less genotoxic (Fig. 4). This indicates that
ozonation is a useful tool in removing the genotoxic
compound triclosan from wastewater. However, it should be
taken into account that 2,4-dichlorophenol is prioritized
under the EU surface water directive 76/464/EC (European
Comission 1976) (Umweltbundesamt, 2005) and is classified
to be “harmful to aquatic organisms” and “may cause long-
term adverse effects in the aquatic environment”.
4. Conclusion
Contamination of surface water and ground water with tri-
closan is an emerging issue in environmental science and
engineering. The outcomes of this study are:
Removal of triclosan from water can be achieved by
using ozonation.
The treatmentprocesscaneliminate triclosancompletely
and convert it into the products: 2,4-dichlorophenol,
chlorocatechol,mono-hydroxy-triclosananddi-hydroxy-
triclosan. Increasing the ozone concentrations in the
reactions leads to decreased concentration of triclosan as
well as its oxidation by-products.
2,4-dichlorophenol shows lower genotoxic effects than
triclosanat the tested concentrations, but this compound
is classified to be toxic to aquatic organisms. The other
transformation products cannot be assessed up to now.
Formation and occurrence of the identified trans-
formation products should be investigated at full scale
applications
Reactor design should take the formation of oxidation
by-products into account and possibly use higher ozone
doses or retention times to remove by-products.
Acknowledgment
The authors would like to thank for financial support from the
Danish Research Council FTP for the project In situ character-
ization of microbial degraders of Triclosan and methyl-
triclosan from wastewater treatment plants and Aalborg
University aswell as theGermanFederalMinistryof Economics
and Technology within the agenda for the promotion of
industrial cooperative research and development (IGF) based
onadecisionof theGermanBundestag. Theaccesswasopened
by member organization environmental technology and
organized by the AiF, Arbeitsgemeinschaft industrieller For-
schungsvereinigungen, Cologne (IGF-Project No. 15862 N).
Appendix. Supplementary material
Supplementary data related to this article can be found online
at doi:10.1016/j.watres.2012.01.039.
r e f e r e n c e s
Adolfsson-Erici, M., Pettersson, M., Parkkonen, J., Sturve, J., 2002.Triclosan, a commonly used bactericide found in human milkand in the aquatic environment in Sweden. Chemosphere 46(9e10), 1485e1489.
Balmer, M.E., Poiger, T., Droz, C., Romanin, K., Bergqvist, P.A.,Muller, M.D., Buser, H.R., 2004. Occurrence of methyl triclosan,a transformation product of the bactericide triclosan, in fishfrom various lakes in Switzerland. Environmental Science andTechnology 38 (2), 390e395.
Bester, K., 2003. Triclosan in a sewage treatment processdbalancesand monitoring data. Water Research 37 (16), 3891e3896.
Bester, K., 2005. Fate of triclosan and triclosan-methyl in sewagetreatment plants and surface waters. Archives ofEnvironmental Contamination and Toxicology 49 (1), 9e17.
Buth, J.M., Ross, M.R., McNeill, K., Arnold, W.A., 2011. Removaland formation of chlorinated triclosan derivatives inwastewater treatment plants using chlorine and UVdisinfection. Chemosphere 84 (9), 1238e1243.
Carballa, M., Manterola, G., Larrea, L., Ternes, T., Omil, F.,Lema, J.M., 2007. Influence of ozone pre-treatment on sludgeanaerobic digestion: removal of pharmaceutical and personalcare products. Chemosphere 67 (7), 1444e1452.
Coogan, M.A., Edziyie, R.E., La Point, T.W., Venables, B.J., 2007.Algal bioaccumulation of triclocarban, triclosan, and methyl-triclosan in a North Texas wastewater treatment plantreceiving stream. Chemosphere 67 (10), 1911e1918.
Dann, A.B., Hontela, A., 2011. Triclosan: environmental exposure,toxicity and mechanisms of action. Journal of AppliedToxicology 31 (4), 285e311.
Engelhaupt, E., 2007.MoreTriclosanTrouble. Environmental Scienceand Technology, American Chemical Society, 2072e2077.<http://pubs.acs.org/doi/pdfplus/10.1021/es072500z>.
Ensley, H.E., Barber, J.T., Poloto, M.A., 1994. Toxicity andmetabolism of 2,4-dichlorophenol by the aquatic angiospermLemna gibba. Environmental Toxicology and Chemistry 13 (2),325e331.
European Commision, 1976. Council Directive 76/464/EEC onpollution caused by certain dangerous substances dischargedinto the aquatic environment of the Community. OfficialJournal of the European Communities L 129, 23e29.
Farre, M., Asperger, D., Kantiani, L., Gonzalez, S., Petrovic, M.,Barcelo, D., 2008. Assessment of the acute toxicity of triclosanand methyl triclosan in wastewater based on thebioluminescence inhibition of Vibrio fischeri. Analytical andBioanalytical Chemistry 390 (8), 1999e2007.
Foran, C.M., Bennett, E.R., Benson, W.H., 2000. Developmentalevaluation of a potential non-steroidal estrogen: triclosan.Marine Environmental Research 50 (1e5), 153e156.
Heidler, J., Halden, R.U., 2008. Mass balance assessment oftriclosan removal during conventional sewage treatment.Chemosphere 66 (2), 362e369.
Ikehata, K., Gamal El-Din, M., Snyder, S.A., 2008. Ozonation andadvanced oxidation treatment of emerging organic pollutants inwaterandwastewater.OzoneScience&Engineering30 (1), 21e26.
wat e r r e s e a r c h 4 6 ( 2 0 1 2 ) 2 2 4 7e2 2 5 6 2255

Author's personal copy
Ikehata, K., Naghashkar, N.J., Ei-Din, M.G., 2006. Degradation ofaqueous pharmaceuticals by ozonation and advanced oxidationprocesses: a review. Ozone Science & Engineering 28 (6),353e414.
Ishibashi, H., Matsumura, N., Hirano, M., Matsuoka, M.,Shiratsuchi, H., Ishibashi, Y., Takao, Y., Arizono, K., 2004.Effects of triclosan on the early life stages and reproduction ofmedaka Oryzias latipes and induction of hepatic vitellogenin.Aquatic Toxicology 67 (2), 167e179.
Kim, Y.M., Murugesan, K., Schmidt, S., Bokare, V., Jeon, J.R.,Kim, E.J., Chang, Y.S., 2010. Triclosan susceptibility and co-metabolism e a comparison for three aerobic pollutant-degrading bacteria. Bioresource Technology 102 (3), 2206e2212.
Langlais, B., Reckhow, D.A., Brink, D.R., 1991. Ozone in WaterTreatment: Application and Engineering. Lewis Publishers, pp.3e8.
Latch, D.E., Packer, J.L., Stender, B.L., VanOverbeke, J.,Arnold, W.A., McNeill, K., 2005. Aqueous photochemistry oftriclosan: formation of 2,4-dichlorophenol, 2,8-dichlorodibenzo-p-dioxin, and oligomerization products.Environmental Toxicology and Chemistry 24 (3), 517e525.
Lee, Y., von Gunten, U., 2010. Oxidative transformation ofmicropollutants during municipal wastewater treatment:comparison of kinetic aspects of selective (chlorine, chlorinedioxide, ferrate(VI), and ozone) and non-selective oxidants(hydroxyl radical). Water Research 44 (2), 555e566.
Levy, C.W., Roujeinikova, A., Sedelnikova, S., Baker, P.J.,Stuitje, A.R., Slabas, A.R., Rice, D.W., Rafferty, J.B., 1999.Molecular basis of triclosan activity. Nature 398 (6726), 383e384.
Lindstrom, A., Burge, I.J., Poiger, T., Bergqvist, P.A., Muller, M.D.,Buser, H.R., 2002. Occurrence and environmental behavior ofthe bactericide triclosan and its methyl derivative in surfacewaters and in wastewater. Environmental Science andTechnology 36 (11), 2322e2329.
Lozano, N., Rice, C.P., Ramirez, M., Torrents, A., 2010. Fate oftriclosan in agricultural soils after biosolid applications.Chemosphere 78 (6), 760e766.
Mosmann, T., 1983. Rapid colorimetric assay for cellular growthand survival: application to proliferation and cytotoxicityassays. Journal of Immunological Methods 65 (1e2), 55e63.
Orvos, D.R., Versteeg, D.J., Inauen, J., Capdevielle, M.,Rothenstein, A., Cunningham, V., 2002. Aquatic toxicity oftriclosan. Environmental Toxicology and Chemistry 21 (7),1338e1349.
Ostling, O., Johanson, K.J., 1984. Microelectrophoretic study ofradiation-induced DNA damages in individual mammalian-cells. Biochemical and Biophysical Research Communications123 (1), 291e298.
Puck, T.T., Cieciura, S.J., Robinson, A., 1958. Genetics of somaticmammalian cells. III. Long-term cultivation of euploid cellsfrom human and animal subjects. Journal of ExperimentalMedicine 108 (6), 945e956.
Raut, S.A., Angus, R.A., 2010. Triclosan has endocrine-disruptingeffects in male western mosquitofish, Gambusia affinis.Environmental Toxicology and Chemistry 29 (6), 1287e1291.
Schweizer, H.P., 2001. Triclosan: a widely used biocide and its linkto antibiotics. FEMS Microbiology Letters 202 (1), 1e7.
Singer, H., Muller, S., Tixier, C., Pillonel, L., 2002. Triclosan:occurrence and fate of a widely used biocide in the aquaticenvironment: field measurements in wastewater treatmentplants, surface waters, and lake sediments. EnvironmentalScience and Technology 36 (23), 4998e5004.
Singh, N.P., Mccoy, M.T., Tice, R.R., Schneider, E.L., 1988. Asimple technique for quantitation of low-levels of DNAdamage in individual cells. Experimental Cell Research 175(1), 184e191.
Snyder, S.A., Wert, E.C., Rexing, D.J., Zegers, R.E., Drury, D.D.,2006. Ozone oxidation of endocrine disruptors andpharmaceuticals in surface water and wastewater. OzoneScience & Engineering 28, 445e460.
Suarez, S., Dodd, M.C., Omil, F., Von Gunten, U., 2007. Kinetics oftriclosan oxidation by aqueous ozone and consequent loss ofantibacterial activity: relevance to municipal wastewaterozonation. Water Research 41 (12), 2481e2490.
Ternes, T.A., Stubera, J., Herrmann, N., McDowella, D., Ried, A.,Kampmann, M., Teiser, B., 2003. Ozonation: a tool for removalof pharmaceuticals, contrast media andmusk fragrances fromwastewater? Water Research 37 (8), 1976e1982.
Tice, R.R., Agurell, E., Anderson, D., Burlinson, B., Hartmann, A.,Kobayashi, H., Miyamae, Y., Rojas, E., Ryu, J.C., Sasaki, Y.F.,2000. Single cell gel/comet assay: guidelines for in vitro andin vivo genetic toxicology testing. Environmental andMolecular Mutagenesis 35 (3), 206e221.
Umweltbundesamt, 2005. Bericht der BundesrepublikDeutschland zur Durchfuhrung der Richtlinie 76/464/EWG undTochterrichtlinien betreffend die Verschmutzung infolge derAbteilung bestimmter gefahrlicher Stoffe in die Gewasser derGemeinschaft, -Zeitraum 2002e2004. Berlin.
Vosmaer, G.C.J., 1916. On the occurrence of desmas or desmoidsin Hymemacidon sanguinea. Proceedings of the KoniklijkeAkademie van Wetenschappen te Amsterdam 18, 1159e1173.
Wert, E.C., Rosario-Ortiz, F.L., Snyder, S.A., 2009. Effect of ozoneexposure on the oxidation of trace organic contaminants inwastewater. Water Research 43 (4), 1005e1014.
Wilson, B.A., Smith, V.H., DeNoyelles, F., Larive, C.K., 2003. Effectsof three pharmaceutical and personal care products onnatural freshwater algal assemblages. Environmental Scienceand Technology 37 (9), 1713e1719.
Xie, S.F., Deng, H.S., Xiang, B.R., Xiang, S.Y., 2008. Detection oftrace triclocarban in water sample using solid-phaseextraction-liquid chromatography with stochastic resonancealgorithm. Environmental Science and Technology 42 (8),2988e2991.
Zhang, H.C., Huang, C.H., 2003. Oxidative transformation oftriclosan and chlorophene by manganese oxides.Environmental Science and Technology 37 (11), 2421e2430.
Zuckerbraun, H.L., Babich, H., May, R., Sinensky, M.C., 1998.Triclosan: cytotoxicity, mode of action, and induction ofapoptosis in human gingival cells in vitro. European Journal ofOral Sciences 106 (2p1), 628e636.
wat e r r e s e a r c h 4 6 ( 2 0 1 2 ) 2 2 4 7e2 2 5 62256
Research paper 7:
Lolas IB., Chen XJ., Bester K. and Nielsen JL. Identification of triclosan degrading
bacteria using stable isotope probing and microautoradiography. Microbiology 158
(2012) 2805-2814


Identification of triclosan-degrading bacteria usingstable isotope probing, fluorescence in situhybridization and microautoradiography
Ihab Bishara Lolas,1 Xijuan Chen,1,2 Kai Bester2 and Jeppe Lund Nielsen1
Correspondence
Jeppe Lund Nielsen
Received 1 June 2012
Revised 26 July 2012
Accepted 4 September 2012
1Department of Biotechnology, Chemistry and Environmental Engineering, Aalborg University,Sohngaardsholmsvej 49, DK-9000 Aalborg, Denmark
2Department of Environmental Science, Aarhus University, Frederiksborgsvej 399, 4000 Roskilde,Denmark
Triclosan is considered a ubiquitous pollutant and can be detected in a wide range of
environmental samples. Triclosan removal by wastewater treatment plants has been largely
attributed to biodegradation processes; however, very little is known about the micro-organisms
involved. In this study, DNA-based stable isotope probing (DNA-SIP) combined with
microautoradiography-fluorescence in situ hybridization (MAR-FISH) was applied to identify
active triclosan degraders in an enrichment culture inoculated with activated sludge. Clone library
sequences of 16S rRNA genes derived from the heavy DNA fractions of enrichment culture
incubated with 13C-labelled triclosan showed a predominant enrichment of a single bacterial
clade most closely related to the betaproteobacterial genus Methylobacillus. To verify that
members of the genus Methylobacillus were actively utilizing triclosan, a specific probe targeting
the Methylobacillus group was designed and applied to the enrichment culture incubated with14C-labelled triclosan for MAR-FISH. The MAR-FISH results confirmed a positive uptake of
carbon from 14C-labelled triclosan by the Methylobacillus. The high representation of
Methylobacillus in the 13C-labelled DNA clone library and its observed utilization of 14C-labelled
triclosan by MAR-FISH reveal that these micro-organisms are the primary consumers of triclosan
in the enrichment culture. The results from this study show that the combination of SIP and MAR-
FISH can shed light on the networks of uncultured micro-organisms involved in degradation of
organic micro-pollutants.
INTRODUCTION
Triclosan [5-chloro-2-(2,4-dichloro-phenoxy)-phenol] is asynthetic antibacterial compound that inhibits the NADH-dependent enoyl-[acyl-carrier protein] reductase, an essen-tial enzyme involved in the biosynthesis of fatty acids(Heath et al., 1999; McMurry et al., 1998; Regos et al.,1979). As an effective antimicrobial agent, triclosan hasbeen used in a wide range of personal care products, suchas toothpaste and soaps, and in consumer products,including textile and plastics (DeSalva et al., 1989; Joneset al., 2000; Schweizer, 2001). Due to its extensive use andpersistence, triclosan and some of its derivatives can be
detected in different environmental matrices such aswastewaters, surface waters and sediments, and in biologicalsamples, including those from fish, algae, human plasma,urine and breast milk (Balmer et al., 2004; Hovander et al.,2002; Miller et al., 2008; Sanchez-Brunete et al., 2010;Sandborgh-Englund et al., 2006; Wilson et al., 2003; Ye et al.,2008).
Biodegradation of triclosan has been shown by mixedbacterial cultures from activated sludge (GangadharanPuthiya Veetil et al., 2012; Hay et al., 2001; Stasinakis et al.,2010) and in wastewater treatment plants (WWTPs)(Bester, 2003; Chen et al., 2011; Singer et al., 2002). Dueto insufficient removal during wastewater treatment,triclosan has been found in WWTP effluents in concentra-tions ranging from 1 to 10 mg l21 (Adolfsson-Erici et al.,2002; Bester, 2003, 2005; Lindstrom et al., 2002; Singeret al., 2002). Although mass balance assessments haveshown that biological treatment contributes to the majorremoval of triclosan in WWTPs (Bester, 2003; Heidler &Halden, 2007; Singer et al., 2002), little is known about the
Abbreviations: DGGE, denaturing gradient gel electrophoresis; FISH,fluorescence in situ hybridization; MAR, microautoradiography; SIP,stable isotope probing; WWTP, wastewater treatment plant.
The GenBank/EMBL/DDBJ accession numbers for the sequences ofthe triclosan-degrading culture clones represented in the phylogenetictree are JX099503–JX099536.
A supplementary figure is available with the online version of this paper.
Microbiology (2012), 158, 2796–2804 DOI 10.1099/mic.0.061077-0
2796 061077 G 2012 SGM Printed in Great Britain

actual mechanisms or the micro-organisms involved in thedegradation process. So far, two wastewater isolates,Sphingomonas sp. strains Rd1 (Hay et al., 2001) and PH-07 (Kim et al., 2011), have been shown to degrade triclosanvia co-metabolism. Meade et al. (2001) showed that twosoil bacteria, Pseudomonas putida and Alcaligenes xylosox-idans, have a high resistance to triclosan and can utilize itas their sole carbon source, and the nitrifying Nitrosomonaseuropea has also been shown to biodegrade triclosan(Roh et al., 2009). Recently, several triclosan-degradingstrains belonging to the genus Pseudomonas were isolatedfrom aerobic and anaerobic enrichment cultures of acti-vated sludge (Gangadharan Puthiya Veetil et al., 2012).Biodegradation of triclosan has also been reported infungi (Hundt et al., 2000). However, knowledge basedon culture-independent approaches of the identity andecophysiology of triclosan-degrading bacteria in complexmicrobial systems is still limited.
Stable-isotope probing (SIP) allows for in situ detection ofbacterial communities capable of metabolizing a specificcarbon source and thus links function to identity withoutthe need to culture the bacteria involved (Radajewski et al.,2000). SIP approaches have been used to identify varioustypes of environmental pollutant-degrading bacteria, e.g.those able to degrade nonylphenols (Zemb et al., 2012),toluene (Woods et al., 2011) and phenols (Manefield et al.,2007).
The aim of this study was to use the SIP approach toidentify the active micro-organisms in a triclosan-degrad-ing consortium derived from activated sludge exposed to13C-labelled triclosan. Genomic fingerprinting analyses ofresolved 13C-labelled DNA allowed the design of a specificfluorescence in situ hybridization (FISH) probe for aputative triclosan-degrading phylotype, which was used incombination with microautoradiography (MAR) to verifythe physiology and abundance of these micro-organisms inthe enrichment.
METHODS
Reagents and media. Triclosan (Irgasan) was purchased fromSigma-Aldrich with a purity of .97%. 13C12-Labelled triclosan(isotope purity .98%) was purchased from Wellington Laboratoriesand was dissolved in methanol. [Dichlorophenyl-U-14C]-labelledtriclosan (specific activity 5.43 MBq mg21) was donated by Ciba.Stock solutions of both radiolabelled and unlabelled triclosan wereprepared in acetone. As a standard procedure, substrate solutionswere allowed to dry at room temperature prior to the addition ofspecified media or culture. For all experiments, nitrate mineral saltsmedium (NMS) was used as carbon-free medium (Whittenbury et al.,1970). All other reagents used for SIP and MAR were commercial
products of highest grade (Chen et al., 2011; Kristiansen et al., 2011a;Neufeld et al., 2007).
Enrichment culture and growth conditions. Activated sludge wastaken from the aeration tanks from C/N/P-removing Aalborg WestWWTP (Aalborg, Denmark) and was used as source of inoculum forenrichment of triclosan-degrading organisms. The initial incubationhas been described in a preliminary report (Chen et al., 2011). Briefly,
an activated sludge sample was spiked with 2 mg triclosan l21 and
incubated in the dark under aerobic conditions at 22–25 uC on a
rotary table (150 r.p.m.). Following the initial incubation and every
9 days thereafter, the enrichment culture was transferred [10% (v/v)]
to fresh NMS medium containing 2 mg triclosan l21. The enriched
culture had a maximum cell density of 66108 cells ml21 and was
maintained for 4 months before conducting the SIP and MAR
incubations.
Analytical methods
Liquid–liquid extraction. Samples (5 ml) from the experiments were
extracted by addition of 2 ml toluene and 100 ml internal standard
solution (1000 ng musk xylene D15 ml21) and were vigorously stirred
for 5 min. The organic phase was extracted and the residual water was
removed by freezing the samples overnight at 220 uC. These organicextracts were then concentrated to 1 ml with a nitrogen flow
condensor at 55 uC.
Instrumental analysis. Triclosan extracts were finally analysed by gas
chromatography with mass spectrometric detection (GC-MS,
Thermo-Trace-MS and Trace GC) equipped with a splitless injector
and A200S autosampler. Samples (1 ml) were injected into the injector
in splitless (1.5 min) mode held at 240 uC. The GC separation was
performed with an Rxi-5Sil MS column (Restek): length, 10 m; ID,
0.18 mm; film, 0.18 mm; and a temperature programme of 90 uC(hold 1 min) ramped at 50 uC min21 to 135 uC and then at 10 uCmin21 to 220 uC. Finally, the baking temperature was reached by
ramping the column at 40 uC min21 to 260 uC which was held for
6 min. Helium (5.0) was used as carrier gas with a flow rate of 1.3 ml
min21. The transfer line of the mass spectrometer (Trace MS, Thermo
Finnigan) was held at 250 uC. The ion source was operated at 160 uC.The mass spectrometer was operated in selected ion mode (SIM)
utilizing 31–61 ms dwell time. The detector of the mass spectrometer
was operated at 450 V. The recovery rate of triclosan was 88±11%
(SD) and limit of quantification was 3 ng g21, as reported by Bester
(2003).
SIP. A total of 5 ml (approx. 100 mg dry matter) of the enriched
culture was transferred to 60 ml serum bottles and incubated with
2 mg 13C-labelled triclosan l21 for 3 days. Parallel incubations were
also prepared with unlabelled substrate and used as controls for
verification of DNA-SIP labelling and triclosan degradation. The
bottles were crimp-sealed with rubber stoppers and incubated in the
dark at 24 uC on a rotary table (150 r.p.m.) for 3 days. Subsequently,
total DNA was extracted using the FastDNA SPIN kit for Soil (MP
Biomedicals) according to the manufacturer’s instructions. The DNA
concentration was measured on a NanoDrop 2000 spectrophotometer
(Thermo Fisher Scientific). All incubations were carried out as
biological duplicates.
Isolation and fingerprinting of 13C-labelled DNA. Caesium
chloride (CsCl) gradient fractionation, DNA precipitation and DNA
quantification were set up as described previously (Neufeld et al.,
2007). Briefly, 2 mg DNA from each sample (two control samples and
two 13C-labelled samples) was added to the gradient buffer and mixed
with CsCl to a final density of 1.725 g ml21. These solutions were
added to 5.1 ml polyallomer Quik-seal centrifuge tubes (Beckman
Coulter) and ultracentrifuged at 133 000 gav for 72 h at 20 uC in a
Sorvall TH-641 swing-out rotor (Kendro). Immediately after
centrifugation, the density gradients were fractionated into 12
volumes of approximately 400 ml. The buoyant density of each
fraction was determined by measuring 5 ml from each sample on a
refractometer (AR200, Reichert). DNA from each fraction was
precipitated with polyethylene glycol and glycogen as described
elsewhere (Neufeld et al., 2007), and followed by resuspension in
Identification of triclosan degraders
http://mic.sgmjournals.org 2797

nuclease-free water. DNA was quantified using a NanoDrop 2000
spectrophotometer.
The shift in community between the control and the labelled fraction
was visualized by molecular profiling using denaturing gradient gel
electrophoresis (DGGE) and PCR. DGGE was performed as described
in detail elsewhere (Kristiansen et al., 2011a). From DGGE results,
distinct DNA bands from the labelled heavy fractions (buoyant
density 1.83 and 1.79 g ml21) were chosen for subsequent sequencing
(Fig. S1, available with the online version of this paper). Furthermore,
the 12C and 13C-labelled DNA fractions were used as template for
PCR with the 16S rRNA gene-targeted primers 26F/1492R (approx.
1450 bp product) (Lane, 1991). PCR conditions are described
elsewhere (Kristiansen et al., 2011b). A 16S rRNA clone library was
prepared from the high density fractions (1.76–1.80 g ml21) of the
SIP incubation with the 13C-labelled triclosan. The clone library
preparation and the phylogenetic analysis were performed as
described by Kristiansen et al. (2011a) except that the alignment
and phylogenetic tree construction were done using MEGA 5 (Tamura
et al., 2011). Screening of the clone sequences with Bellerophon v3
(DeSantis et al., 2006) did not identify any putative chimeras.
Sequences represented in the phylogenetic tree were named triclosan-
degrading culture clones and deposited in the GenBank database
under accession numbers JX099503–JX099536.
FISH probe design. The 16S rRNA gene sequences from the clone
library were used to design an oligonucleotide probe (Meth1138)
(Table 1) using the probe design tool in the ARB software package
(Ludwig et al., 2004); the probe was subsequently confirmed for
specificity using the CHECK PROBE programme in the Ribosomal
Database Project (Maidak et al., 2000). Optimum hybridization
stringency for the probe was determined by performing formamide
dissociation series on biomass from the enrichment culture and
activated sludge from Aalborg West WWTP with 10% formamide (v/
v) increments across a range of 0–60% (v/v). Prior to FISH, samples
were homogenized and fixed with 4% (w/v) paraformaldehyde, as
described previously (Nielsen, 2009). The group-specific probe
Meth1138 was labelled with sulfoindocyanine dyes (Cy3). FISH
analysis was performed by using the general bacterial probe mixture
EUBmix labelled with 5(6)-carboxyfluorescein-N-hydroxysuccini-
mide ester (FLUOS) and more specific probes labelled with Cy3
(Table 1). The FISH procedure was carried out as described pre-
viously (Nielsen, 2009). An epifluorescence microscope (Axioscope 2,
Carl Zeiss) was used in all FISH analyses. Bacterial abundance was
quantified by measuring the ratio of the area fluorescing with a probe
(Cy3 labelled) to the area fluorescing with EUBmix probe (FLUOS
labelled) on the same microscopic field. For each enumeration, at
least 20 images were taken from two separate hybridizations and
analysed using ImageJ software (Collins, 2007). FISH analyses were
also conducted on samples taken from seven Danish WWTPs:
Bjergmarken, Aalborg East, Ega, Ejbymølle, Hjørring, Skive andAalborg West. These plants represent stable and well-functioning C/N/P-removing treatment plants with different configurations andinfluent wastewater composition.
Microautoradiography. Microautoradiography experiments inenrichment culture in combination with FISH (MAR-FISH) wereperformed as described previously (Nielsen & Nielsen, 2005). Briefly,5 ml of the enriched culture was transferred to 9 ml serum bottlesand incubated with 10 mCi 14C-labelled triclosan (3.76107 Bq) andunlabelled triclosan to a final concentration of 2 mg l21 under aerobicconditions for 1 day on a rotary table (labelled and unlabelledtriclosan was added at time 0). As a control for chemography, asample from the enriched culture was pasteurized at 70 uC for 10 minprior to MAR incubation and run in parallel. MAR incubations wereterminated by fixing samples with 4% (w/v) paraformaldehyde. Thesamples were then washed, homogenized and immobilized on gelatin-coated coverslips as described elsewhere (Nielsen & Nielsen, 2005).Finally, the samples were subjected to FISH. After the FISHprocedure, the samples were coated with liquid film emulsion(Kodak) and exposed in the dark for 3–6 days before being developedand microscopically examined. Production of 14C-labelled CO2 wasmonitored in MAR-incubated culture by measuring the percentageaccumulation of precipitated radioactivity using a liquid scintillationcounter (Packard 1600 TR; Packard) as follows. Samples (1 ml) fromthe headspace gas were withdrawn using a syringe and mixed with1 ml 0.1 M NaOH solution in a gas-tight sealed serum bottle. At thesame time, 0.1 ml aliquots were withdrawn from the culture anddirectly transferred to 3 ml scintillation liquid (Ultima Gold XR;Packard) to measure the total radioactivity of the culture. Allincubations were carried out as biological duplicates.
RESULTS
Biodegradation of triclosan in enrichment culture
After spiking the enrichment culture with 2 mg triclosanl21, the concentration of triclosan was reduced below thelimit of quantification (3 ng l21) within 90 h, whereas thetriclosan concentration remained nearly constant in apasteurized control spiked with 1 mg triclosan l21 (Fig. 1).This indicates that the removal of triclosan was predomi-nantly due to biological activity, which agrees with theliterature (Bester, 2005; Singer et al., 2002). Degradation of2 mg triclosan l21 followed first-order kinetics with aremoval rate and half-life of 0.0431 h21 and 16 h,respectively. This was approximately five times faster than
Table 1. Oligonucleotides probes for FISH analysis
Probe Specificity Sequence (5§-3§) Reference or source
EUB338 Bacteria GCT GCC TCC CGT AGG AGT Amann et al. (1990)
EUB338II Bacteria GCA GCC ACC CGT AGG TGT Daims et al. (1999)
EUB338III Bacteria GCT GCC ACC CGT AGG TGT Daims et al. (1999)
Beta42a* Betaproteobacteria GCC TTC CCA CTT CGT TT Manz et al. (1992)
Gam42a* Gammaproteobacteria GCC TTC CCA CAT CGT TT Manz et al. (1992)
Meth1138* Methylobacillus sp. GCA CTC CAT GCT GCC GTT CG This study
Meth1138-comp. Competitor for Met1138 GCT CTC CAT GCT GCC GTT CG This study
*Used in equimolar concentrations with competitor.
I. B. Lolas and others
2798 Microbiology 158

that calculated from degradation analyses where the sameconcentration of triclosan was spiked directly into activatedsludge from the Aalborg West WWTP (Chen et al., 2011).When radiolabelled triclosan was spiked into the enrich-ment culture, the subsequent liquid scintillation countsshowed that this microbial community is able to mineralizetriclosan, with approximately 13% of the added radio-activity detected in the headspace after 3 days of incuba-tion (Fig. 1). The linear progression of 14C-labelled CO2 inthe headspace indicates that triclosan degradation startedimmediately after its addition without a lag phase (Fig. 1).Meanwhile, no further accumulation of 14C-labelled CO2
was observed when the triclosan concentration wasreduced below the detection limit.
Detection and phylogenetic analysis of 13C-labelled bacterial 16S rRNA gene sequence
Following incubation with 13C-labelled triclosan, totalDNA was extracted and centrifuged in a CsCl densitygradient to separate labelled from non-labelled DNA. Thisresulted in a linear isopycnic gradient from 1.83 to 1.57 gml21 (Fig. 2). Although the buoyant densities in our SIPfractionation were relatively broad, a clear shift towards aheavier density of the quantified DNA was observed fromboth duplicate samples incubated with unlabelled triclosanrelative to the 12C-labelled control. This shift was alsoapparent from the band intensity of the PCR product after25 cycles of amplification of the 16S rRNA genes (Fig. 2).The shift in density was further evaluated by DGGE,revealing a shift in banding patterns in the heavy fractions(density 1.80–1.76 g ml21) of the 13C-labelled triclosanincubation compared with the unlabelled control (Fig. S1).Distinct bands (1, 3, 6, 7, 8 and 9 on Fig. S1) were
identified as Methylobacillus sp. Iva (GU937479), while theremaining bands (2, 4 and 5) were unclassified.
Thirty four clones of PCR-amplified 16S rRNA genes weresequenced from the 13C-enriched DNA fractions. Most ofthe clones (31 of 34 sequences) affiliated with the genusMethylobacillus (Fig. 3). The obtained sequences had less than95% identity to the other previously describedMethylobacillusspecies. Three clone sequences were related to the genusStenotrophomonas within the Gammaproteobacteria (Fig. 3)with strong bootstrap support and less than 95% identity toother Stenotrophomonas sequences.
Identification of triclosan-utilizing bacteria
To verify that members of the genus Methylobacillus wereutilizing triclosan in the enrichment culture, a specific FISHprobe (Meth1138) targeting most members of the generawas designed. The hybridization stringency of the probe wasoptimized on biomass from the culture and from activatedsludge samples and determined to be 25% (v/v) formamide.The probe was used to quantify the relative abundance ofMethylobacillus in the enriched culture as well as in activatedsludge and was calculated to range between 2 and 4% and0.5 and 1% of the total detected cells, respectively. Nofurther enrichment was detected during SIP or MARincubations. Dense silver grain patches covering theMeth1138-hybridized cells indicated an active utilization
2500
2000
1500
1000TCS
(ng
ml-1
)
500
3000
00 10080
Time (h)604020 120
Cum
ulat
ive
dete
ctio
n of
14 C
O2
(%)
0.0
12.5
10.0
7.5
5.0
2.5
15.0
Fig. 1. Biodegradation of triclosan in the enrichment culture underaerobic conditions. The time-course of triclosan degradation (2 mgl”1) in pasteurized ($) and active (#) enriched culture is shown.Cumulative production of 14C-labelled CO2 (h) from the miner-alization of 14C-labelled triclosan is shown on the secondary y-axis.Error bars for triclosan measurements indicate the 10% stateduncertainty from the method development by Bester (2003).
(a)
(b)
Light
40
30
20
10
50
01.801.761.721.68
Buoyant density (g ml-1)1.641.601.56 1.84
DN
A (n
g μl
-1)
Heavy
12C-DNA
12C-DNA13C-DNA12C-DNA13C-DNA
13C-DNA
Fig. 2. Quantitative profiles of DNA in CsCl SIP gradients. Thedistribution of DNA in comparative SIP gradients of DNA frommicrocosms (n52) amended with 12C- or 13C-labelled triclosan isshown in (a). Open symbols show the results of the biologicalduplicate. (b) Band intensity of PCR products targeting the 16SrRNA genes (~1.5 kb) amplified from the corresponding gradientfractions and visualized after agarose gel electrophoresis.
Identification of triclosan degraders
http://mic.sgmjournals.org 2799
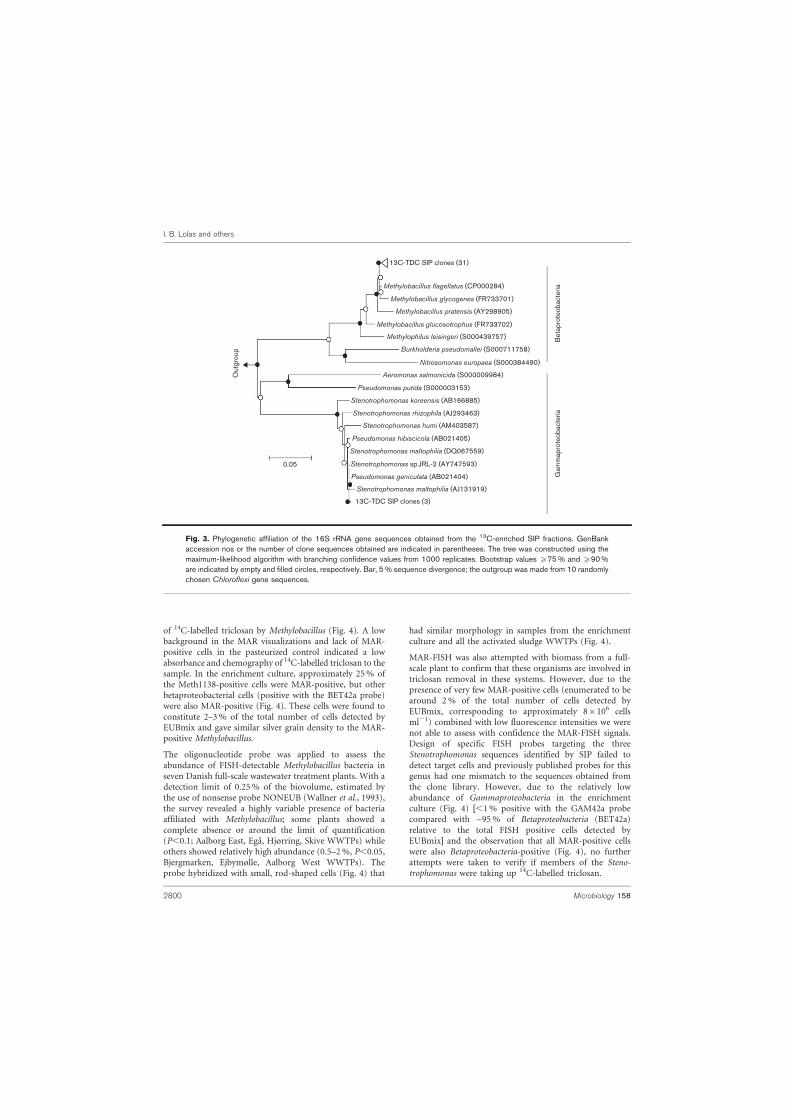
of 14C-labelled triclosan by Methylobacillus (Fig. 4). A lowbackground in the MAR visualizations and lack of MAR-positive cells in the pasteurized control indicated a lowabsorbance and chemography of 14C-labelled triclosan to thesample. In the enrichment culture, approximately 25% ofthe Meth1138-positive cells were MAR-positive, but otherbetaproteobacterial cells (positive with the BET42a probe)were also MAR-positive (Fig. 4). These cells were found toconstitute 2–3% of the total number of cells detected byEUBmix and gave similar silver grain density to the MAR-positive Methylobacillus.
The oligonucleotide probe was applied to assess theabundance of FISH-detectable Methylobacillus bacteria inseven Danish full-scale wastewater treatment plants. With adetection limit of 0.25% of the biovolume, estimated bythe use of nonsense probe NONEUB (Wallner et al., 1993),the survey revealed a highly variable presence of bacteriaaffiliated with Methylobacillus; some plants showed acomplete absence or around the limit of quantification(P,0.1; Aalborg East, Ega, Hjørring, Skive WWTPs) whileothers showed relatively high abundance (0.5–2%, P,0.05,Bjergmarken, Ejbymølle, Aalborg West WWTPs). Theprobe hybridized with small, rod-shaped cells (Fig. 4) that
had similar morphology in samples from the enrichmentculture and all the activated sludge WWTPs (Fig. 4).
MAR-FISH was also attempted with biomass from a full-scale plant to confirm that these organisms are involved intriclosan removal in these systems. However, due to thepresence of very few MAR-positive cells (enumerated to bearound 2% of the total number of cells detected byEUBmix, corresponding to approximately 86106 cellsml21) combined with low fluorescence intensities we werenot able to assess with confidence the MAR-FISH signals.Design of specific FISH probes targeting the threeStenotrophomonas sequences identified by SIP failed todetect target cells and previously published probes for thisgenus had one mismatch to the sequences obtained fromthe clone library. However, due to the relatively lowabundance of Gammaproteobacteria in the enrichmentculture (Fig. 4) [,1% positive with the GAM42a probecompared with ~95% of Betaproteobacteria (BET42a)relative to the total FISH positive cells detected byEUBmix] and the observation that all MAR-positive cellswere also Betaproteobacteria-positive (Fig. 4), no furtherattempts were taken to verify if members of the Steno-trophomonas were taking up 14C-labelled triclosan.
Methylobacillus flagellatus (CP000284)
Methylobacillus glycogenes (FR733701)
Methylobacillus pratensis (AY298905)
Methylobacillus glucosotrophus (FR733702)
Methylophilus leisingeri (S000439757)
Burkholderia pseudomallei (S000711758)
Nitrosomonas europaea (S000384490)
Aeromonas salmonicida (S000009984)Out
grou
p
0.05
Pseudomonas putida (S000003153)
Pseudomonas hibiscicola (AB021405)
Pseudomonas geniculata (AB021404)
Stenotrophomonas koreensis (AB166885)
Stenotrophomonas rhizophila (AJ293463)
Stenotrophomonas humi (AM403587)
Stenotrophomonas maltophilia (DQ067559)
Stenotrophomonas sp.JRL-2 (AY747593)
Stenotrophomonas maltophilia (AJ131919)
13C-TDC SIP clones (31)
13C-TDC SIP clones (3)
Gam
map
rote
obac
teria
Bet
apro
teob
acte
ria
Fig. 3. Phylogenetic affiliation of the 16S rRNA gene sequences obtained from the 13C-enriched SIP fractions. GenBankaccession nos or the number of clone sequences obtained are indicated in parentheses. The tree was constructed using themaximum-likelihood algorithm with branching confidence values from 1000 replicates. Bootstrap values ¢75% and ¢90%are indicated by empty and filled circles, respectively. Bar, 5% sequence divergence; the outgroup was made from 10 randomlychosen Chloroflexi gene sequences.
I. B. Lolas and others
2800 Microbiology 158

DISCUSSION
Although more than 60% of total removal of triclosan isattributed to the biodegradation processes in activatedsludge treatment (Bester 2003, 2005) very little is knownabout the micro-organisms involved. Previous studies haveshown the ability of a few isolates to degrade triclosan(Gangadharan Puthiya Veetil et al., 2012; Hay et al., 2001;Kim et al., 2011; Meade et al., 2001). However, as thesestudies rely on the use of culture-dependent methods and donot necessarily reflect the identity of the active membersinvolved in the biodegradation of triclosan in situ, the focusof this study was to apply SIP to identify bacteria capable ofutilizing triclosan in an enrichment culture. Attempts toapply the SIP approach directly on activated sludge were notsuccessful, most likely because of the low numbers ofbacteria involved in the degradation of triclosan as observedin the MAR-FISH results. Apparently, with the amount of13C-labelled triclosan added and the sequencing approachused, we were unable to reach sufficient density shift for thelabelled DNA during SIP. So, in order to identify triclosandegraders, an enrichment step was introduced. Thisapproach is biased to enrich for triclosan degraders with alow affinity for the substrate, and discriminates against cellswith a high substrate affinity.
The enrichment culture, originally started from activatedsludge, was fed on regular additions of triclosan and wasable to degrade 2 mg triclosan l21 with a half-life of 16 hcompared with 90 h in the original activated sludgesample. The relatively stable and high removal rate of
triclosan and consecutive development of 14C-labelled CO2
combined with a lack of lag phase in the degradationexperiments suggest that the enriched bacterial communityhas readily adapted to triclosan as a carbon source.The consumption of 13C-labelled triclosan resulted in asufficient amount of heavy-labelled DNA, and a shift in theaverage density of total DNA compared with the unlabelled(12C) control. Generally, to ensure sufficient DNA labellingin SIP experiments, a few doubling times with the labelledsubstrate is required. This potentially raises concernregarding cross-feeding of labelled carbon. However, weapplied a relatively short incubation period and lowconcentration of the applied 13C-labelled triclosan tominimize the risk of cross-feeding. The predominantenrichment of a single bacterial clade, the lack of by-products identified, and the confirmation by MAR-FISHwith reduced incubation time and tracer, support that theidentified Methylobacillus are the primary consumers oftriclosan in the enrichment culture. The methodologicalapproach of applying SIP with MAR-FISH is a powerfulcombination that validates the SIP findings and ensurescorrect interpretation of even organisms with low abund-ance. The MAR approach requires less uptake of tracercompared with SIP, and is therefore more sensitive and canbe used to test uptake of substrate in natural systems underin situ conditions. However, we were not able toconclusively verify that Methylobacillus was the maintriclosan consumer using in situ concentrations in theindigenous activated sludge sample due to very lownumbers of MAR-positive triclosan degraders.
Fig. 4. FISH and microautoradiographyimages of triclosan-utilizing cells. FISH imagesof the triclosan-fed enrichment culture afterhybridization with (a) the universal bacterialprobe EUBmix (green) and probe Meth1138(red), and (b) probe BET42A (green) andprobe GAM42a (red). Cells appearing yellowhybridized with both probes. RepresentativeMAR-FISH images of triclosan-utilizing bac-teria present in the enrichment culture incu-bated for 1 day at 1 mg 14C-labelled triclosanl”1 and hybridized with BET42A probe (red)(c, e) or Meth1138 (red) and EUBmix probe(green) (d, f–i). Silver grains surroundingbacterial cells indicate active cellular incorp-oration of the 14C-labelled triclosan (whitearrows), while black arrows indicate MAR-negative cells. Bars, 10 mm.
Identification of triclosan degraders
http://mic.sgmjournals.org 2801

The finding of a few Stenotrophomonas-related clones in the13C-labelled DNA clone library could indicate a broaderdiversity of triclosan degraders or the presence of multipledegradation steps catalysed by different micro-organisms.Although members of Stenotrophomonas have previouslybeen shown to be involved in the degradation ofenvironmental pollutants with aromatic structures suchas p-nitrophenol (Liu et al., 2007), nonylphenol (Soareset al., 2003) and benzene (Lee et al., 2002), their involve-ment in degradation of triclosan was not confirmed by theMAR-FISH approach. Another betaproteobacterial groupwas found to be present in similar numbers to Methylo-bacillus and with similar triclosan degradation activity;however, these cells were not identified by the SIP ap-proach. This could be due to insufficient density shift inthe SIP fractionation.
Other studies have shown that less than 1% of the triclosanadded to activated sludge is actually transformed intotriclosan-methyl, and that the increase of triclosan-methylcorresponded to the decrease of the parent compound(Chen et al., 2011). We attempted to find and identifytriclosan degradation by-products from the enrichmentculture by GC-MS and revealed the presence of 2,4-dichlorophenol but this was below the limit of quanti-fication. The lack of accumulated by-products anddevelopment of labelled CO2 in the head space duringincubation with 14C-triclosan indicates that the addedtriclosan was fully mineralized. Alternatively, the findingscould suggest the presence of a more metabolically diversecommunity of triclosan degraders in activated sludge, butthese would typically be present in small numbers andtherefore difficult to identify.
Methylobacillus belongs to methylotrophs, which is aphenotypically defined group capable of using one-carboncompounds as the sole source of energy and carbon (Hanson& Hanson, 1996). However, it has been shown that severalmethylotrophs that are within the genus Methylobacillus candegrade organic compounds through co-metabolism, such asthe pesticide carbonfuran and choline (Hanson & Hanson,1996), or through direct metabolism, such as microcystin (Huet al., 2009). Other methylotrophs are known for their abilityto participate in the co-metabolic degradation of variousenvironmental pollutants, including trichloroethylene, phenoland different aromatic compounds (Chongcharoen et al.,2005; Koh et al., 1993; Tsuji et al., 1990). Metabolic pathwayanalyses have shown that Methylobacillus contains uniqueclusters of genes encoding the degradation of chlorocatechol, amajor intermediate product in the biodegradation ofchloroaromatic compounds (Caspi et al., 2012; Spokes &Walker, 1974). Little information is available regardingthe biodegradation products of triclosan, although catecholand 3,5-dichlorocatechol were detected when triclosan wasdegraded by pure cultures of Pseudomonas-like strains(Gangadharan Puthiya Veetil et al., 2012) and Sphingomonassp. PH-07 incubated with diphenyl ether (Kim et al., 2011).This information supports the notion that members of thegenusMethylobacillusmay play a role in triclosan degradation
in the enriched culture and in WWTPs. To our knowledge,organisms within this group have not previously been linkedto triclosan degradation. The FISH surveys in the seven DanishWWTPs show that Methylobacillus are indeed present inactivated sludge although they are more abundant than can beascribed to degradation of micro-pollutants such as triclosan,and the abundance thus indicates that they are involved notonly in degrading aromatic micro-pollutants but likely also inother processes as well.
In conclusion, SIP combined with MAR-FISH was usedhere to identify the active community responsible for thedegradation of triclosan within an enrichment cultureoriginating from activated sludge. The findings show theability of members of the genus Methylobacillus to utilizetriclosan. Identifying the specific organisms involved intriclosan degradation provides valuable information thatmay lead to possible strategies to enhance micro-pollutantremoval.
ACKNOWLEDGEMENTS
This study was financially supported by the Danish Research Council
(FTP) through grant no. 09-065064. We thank Simon McIlroy
(Aalborg University) for helpful comments on the manuscript and
Ciba for providing the 14C-labelled triclosan.
REFERENCES
Adolfsson-Erici, M., Pettersson, M., Parkkonen, J. & Sturve, J.(2002). Triclosan, a commonly used bactericide found in human milk
and in the aquatic environment in Sweden. Chemosphere 46, 1485–
1489.
Amann, R. I., Binder, B. J., Olson, R. J., Chisholm, S. W., Devereux, R.& Stahl, D. A. (1990). Combination of 16S rRNA-targeted
oligonucleotide probes with flow cytometry for analyzing mixed
microbial populations. Appl Environ Microbiol 56, 1919–1925.
Balmer, M. E., Poiger, T., Droz, C., Romanin, K., Bergqvist, P. A.,Muller, M. D. & Buser, H. R. (2004). Occurrence of methyl triclosan, a
transformation product of the bactericide triclosan, in fish from
various lakes in Switzerland. Environ Sci Technol 38, 390–395.
Bester, K. (2003). Triclosan in a sewage treatment process–balances
and monitoring data. Water Res 37, 3891–3896.
Bester, K. (2005). Fate of triclosan and triclosan-methyl in sewage
treatment plants and surface waters. Arch Environ Contam Toxicol 49,
9–17.
Caspi, R., Altman, T., Dreher, K., Fulcher, C. A., Subhraveti, P.,Keseler, I. M., Kothari, A., Krummenacker, M., Latendresse, M. &
other authors (2012). The MetaCyc database of metabolic pathways
and enzymes and the BioCyc collection of pathway/genome databases.
Nucleic Acids Res 40 (Database issue), D742–D753.
Chen, X., Nielsen, J. L., Furgal, K., Liu, Y., Lolas, I. B. & Bester, K.(2011). Biodegradation of triclosan and formation of methyl-triclosan
in activated sludge under aerobic conditions. Chemosphere 84, 452–
456.
Chongcharoen, R., Smith, T. J., Flint, K. P. & Dalton, H. (2005).Adaptation and acclimatization to formaldehyde in methylotrophs
capable of high-concentration formaldehyde detoxification.Microbiology
151, 2615–2622.
I. B. Lolas and others
2802 Microbiology 158

Collins, T. J. (2007). ImageJ for microscopy. Biotechniques 43(Suppl. 1), S25–S30.
Daims, H., Bruhl, A., Amann, R., Schleifer, K. H. & Wagner, M. (1999).The domain-specific probe EUB338 is insufficient for the detection ofall Bacteria: development and evaluation of a more comprehensiveprobe set. Syst Appl Microbiol 22, 434–444.
DeSalva, S. J., Kong, B. M. & Lin, Y. J. (1989). Triclosan: a safetyprofile. Am J Dent 2 (Spec No 2), 185–196.
DeSantis, T. Z., Hugenholtz, P., Larsen, N., Rojas, M., Brodie, E. L.,Keller, K., Huber, T., Dalevi, D., Hu, P. & Andersen, G. L. (2006).Greengenes, a chimera-checked 16S rRNA gene database and work-bench compatible with ARB. Appl Environ Microbiol 72, 5069–5072.
Gangadharan Puthiya Veetil, P., Vijaya Nadaraja, A., Bhasi, A., Khan,S. & Bhaskaran, K. (2012). Degradation of triclosan under aerobic,anoxic, and anaerobic conditions. Appl Biochem Biotechnol 167, 1603–1612.
Hanson, R. S. & Hanson, T. E. (1996). Methanotrophic bacteria.Microbiol Rev 60, 439–471.
Hay, A. G., Dees, P. M. & Sayler, G. S. (2001). Growth of a bacterialconsortium on triclosan. FEMS Microbiol Ecol 36, 105–112.
Heath, R. J., Rubin, J. R., Holland, D. R., Zhang, E., Snow, M. E. &Rock, C. O. (1999). Mechanism of triclosan inhibition of bacterialfatty acid synthesis. J Biol Chem 274, 11110–11114.
Heidler, J. & Halden, R. U. (2007). Mass balance assessment oftriclosan removal during conventional sewage treatment. Chemosphere66, 362–369.
Hovander, L., Malmberg, T., Athanasiadou, M., Athanassiadis, I.,Rahm, S., Bergman, A. & Wehler, E. K. (2002). Identification ofhydroxylated PCB metabolites and other phenolic halogenatedpollutants in human blood plasma. Arch Environ Contam Toxicol42, 105–117.
Hu, L. B., Yang, J. D., Zhou, W., Yin, Y. F., Chen, J. & Shi, Z. Q. (2009).Isolation of a Methylobacillus sp. that degrades microcystin toxinsassociated with cyanobacteria. New Biotechnol 26, 205–211.
Hundt, K., Martin, D., Hammer, E., Jonas, U., Kindermann, M. K. &Schauer, F. (2000). Transformation of triclosan by Trametes versicolorand Pycnoporus cinnabarinus. Appl Environ Microbiol 66, 4157–4160.
Jones, R. D., Jampani, H. B., Newman, J. L. & Lee, A. S. (2000).Triclosan: a review of effectiveness and safety in health care settings.Am J Infect Control 28, 184–196.
Kim, Y. M., Murugesan, K., Schmidt, S., Bokare, V., Jeon, J. R., Kim,E. J. & Chang, Y. S. (2011). Triclosan susceptibility and co-metabolism–a comparison for three aerobic pollutant-degrading bacteria. BioresourTechnol 102, 2206–2212.
Koh, S. C., Bowman, J. P. & Sayler, G. S. (1993). Soluble methanemonooxygenase production and trichloroethylene degradation by atype I methanotroph, Methylomonas methanica 68-1. Appl EnvironMicrobiol 59, 960–967.
Kristiansen, A., Lindholst, S., Feilberg, A., Nielsen, P. H., Neufeld,J. D. & Nielsen, J. L. (2011a). Butyric acid- and dimethyl disulfide-assimilating microorganisms in a biofilter treating air emissions froma livestock facility. Appl Environ Microbiol 77, 8595–8604.
Kristiansen, A., Pedersen, K. H., Nielsen, P. H., Nielsen, L. P.,Nielsen, J. L. & Schramm, A. (2011b). Bacterial community structureof a full-scale biofilter treating pig house exhaust air. Syst ApplMicrobiol 34, 344–352.
Lane, D. J. (1991). 16S/23S rRNA sequencing. In Nucleic AcidTechniques in Bacterial Systematics, pp. 115–175. Edited byE. Stackebrandt & M. Goodfellow. Chichester: Wiley.
Lee, E. Y., Jun, Y. S., Cho, K. S. & Ryu, H. W. (2002). Degradationcharacteristics of toluene, benzene, ethylbenzene, and xylene by
Stenotrophomonas maltophilia T3-c. J Air Waste Manag Assoc 52, 400–
406.
Lindstrom, A., Buerge, I. J., Poiger, T., Bergqvist, P. A., Muller, M. D. &Buser, H. R. (2002). Occurrence and environmental behavior of the
bactericide triclosan and its methyl derivative in surface waters and in
wastewater. Environ Sci Technol 36, 2322–2329.
Liu, Z., Yang, C. & Qiao, C. (2007). Biodegradation of p-nitrophenol
and 4-chlorophenol by Stenotrophomonas sp. FEMS Microbiol Lett
277, 150–156.
Ludwig, W., Strunk, O., Westram, R., Richter, L., Meier, H.,Yadhukumar, Buchner, A., Lai, T., Steppi, S. & other authors(2004). ARB: a software environment for sequence data. Nucleic Acids
Res 32, 1363–1371.
Maidak, B. L., Cole, J. R., Lilburn, T. G., Parker, C. T., Jr, Saxman, P. R.,Stredwick, J. M., Garrity, G. M., Li, B., Olsen, G. J. & other authors(2000). The RDP (Ribosomal Database Project) continues. Nucleic
Acids Res 28, 173–174.
Manefield, M., Griffiths, R., McNamara, N. P., Sleep, D., Ostle, N. &Whiteley, A. (2007). Insights into the fate of a 13C labelled phenol
pulse for stable isotope probing (SIP) experiments. J Microbiol
Methods 69, 340–344.
Manz, W., Amann, R., Ludwig, W., Wagner, M. & Schleifer, K.-H.(1992). Phylogenetic oligodeoxynucleotide probes for the major
subclasses of proteobacteria: problems and solutions. Syst Appl
Microbiol 15, 593–600.
McMurry, L. M., Oethinger, M. & Levy, S. B. (1998). Triclosan targets
lipid synthesis. Nature 394, 531–532.
Meade, M. J., Waddell, R. L. & Callahan, T. M. (2001). Soil bacteriaPseudomonas putida and Alcaligenes xylosoxidans subsp. denitrificans
inactivate triclosan in liquid and solid substrates. FEMS Microbiol Lett
204, 45–48.
Miller, T. R., Heidler, J., Chillrud, S. N., DeLaquil, A., Ritchie, J. C.,Mihalic, J. N., Bopp, R. & Halden, R. U. (2008). Fate of triclosan and
evidence for reductive dechlorination of triclocarban in estuarine
sediments. Environ Sci Technol 42, 4570–4576.
Neufeld, J. D., Vohra, J., Dumont, M. G., Lueders, T., Manefield, M.,Friedrich, M. W. & Murrell, J. C. (2007). DNA stable-isotope probing.
Nat Protoc 2, 860–866.
Nielsen, J. L. (2009). Protocol for fluorescence in situ hybridization
(FISH) with rRNA-targeted oligonucleotides. In FISH Handbook for
Biological Wastewater Treatment: Identification and Quantification of
Microorganisms in Activated Sludge and Biofilms by FISH, pp. 73–84.
Edited by P. H. Nielsen, H. Daims & H. Lemmer. London: IWA
Publishing Company.
Nielsen, J. L. & Nielsen, P. H. (2005). Advances in microscopy:
microautoradiography of single cells. Methods Enzymol 397, 237–
256.
Radajewski, S., Ineson, P., Parekh, N. R. & Murrell, J. C. (2000).Stable-isotope probing as a tool in microbial ecology. Nature 403,
646–649.
Regos, J., Zak, O., Solf, R., Vischer, W. A. & Weirich, E. G. (1979).Antimicrobial spectrum of triclosan, a broad-spectrum antimicrobial
agent for topical application. II. Comparison with some other
antimicrobial agents. Dermatologica 158, 72–79.
Roh, K., Subramanya, N., Zhao, F., Yu, C. P., Sandt, J. & Chu, K. H.(2009). Biodegradation potential of wastewater micropollutants by
ammonia-oxidizing bacteria. Chemosphere 77, 1084–1089.
Sanchez-Brunete, C., Miguel, E., Albero, B. & Tadeo, J. L. (2010).Determination of triclosan and methyl triclosan in environmental
solid samples by matrix solid-phase dispersion and gas chromato-
graphy-mass spectrometry. J Sep Sci 33, 2768–2775.
Identification of triclosan degraders
http://mic.sgmjournals.org 2803

Sandborgh-Englund, G., Adolfsson-Erici, M., Odham, G. &Ekstrand, J. (2006). Pharmacokinetics of triclosan following oralingestion in humans. J Toxicol Environ Health A 69, 1861–1873.
Schweizer, H. P. (2001). Triclosan: a widely used biocide and its linkto antibiotics. FEMS Microbiol Lett 202, 1–7.
Singer, H., Muller, S., Tixier, C. & Pillonel, L. (2002). Triclosan:occurrence and fate of a widely used biocide in the aquaticenvironment: field measurements in wastewater treatment plants,surface waters, and lake sediments. Environ Sci Technol 36, 4998–5004.
Soares, A., Guieysse, B., Delgado, O. & Mattiasson, B. (2003).Aerobic biodegradation of nonylphenol by cold-adapted bacteria.Biotechnol Lett 25, 731–738.
Spokes, J. R. & Walker, N. (1974). Chlorophenol and chlorobenzoicacid co-metabolism by different genera of soil bacteria. Arch Mikrobiol96, 125–134.
Stasinakis, A. S., Kordoutis, C. I., Tsiouma, V. C., Gatidou, G. &Thomaidis, N. S. (2010). Removal of selected endocrine disrupters inactivated sludge systems: effect of sludge retention time on theirsorption and biodegradation. Bioresour Technol 101, 2090–2095.
Tamura, K., Peterson, D., Peterson, N., Stecher, G., Nei, M. & Kumar,S. (2011). MEGA5: molecular evolutionary genetics analysis usingmaximum likelihood, evolutionary distance, and maximum par-simony methods. Mol Biol Evol 28, 2731–2739.
Tsuji, K., Tsien, H. C., Hanson, R. S., DePalma, S. R., Scholtz, R. &LaRoche, S. (1990). 16S ribosomal RNA sequence analysis for
determination of phylogenetic relationship among methylotrophs.
J Gen Microbiol 136, 1–10.
Wallner, G., Amann, R. & Beisker, W. (1993). Optimizing fluorescent
in situ hybridization with rRNA-targeted oligonucleotide probes for
flow cytometric identification of microorganisms. Cytometry 14, 136–
143.
Whittenbury, R., Phillips, K. C. & Wilkinson, J. F. (1970). Enrichment,
isolation and some properties of methane-utilizing bacteria. J Gen
Microbiol 61, 205–218.
Wilson, B. A., Smith, V. H., deNoyelles, F., Jr & Larive, C. K. (2003).Effects of three pharmaceutical and personal care products on natural
freshwater algal assemblages. Environ Sci Technol 37, 1713–1719.
Woods, A., Watwood, M. & Schwartz, E. (2011). Identification of a
toluene-degrading bacterium from a soil sample through H218O DNA
stable isotope probing. Appl Environ Microbiol 77, 5995–5999.
Ye, X., Bishop, A. M., Needham, L. L. & Calafat, A. M. (2008).Automated online column-switching HPLC-MS/MS method with
peak focusing for measuring parabens, triclosan, and other envir-
onmental phenols in human milk. Anal Chim Acta 622, 150–156.
Zemb, O., Lee, M., Gutierrez-Zamora, M. L., Hamelin, J., Coupland,K., Hazrin-Chong, N. H., Taleb, I. & Manefield, M. (2012).Improvement of RNA-SIP by pyrosequencing to identify putative 4-
n-nonylphenol degraders in activated sludge. Water Res 46, 601–610.
Edited by: E. L. Madsen
I. B. Lolas and others
2804 Microbiology 158


Research paper 8:
Chen XJ., Wimmer R., Ternes T., Schlüsener M., Nielsen JL. and Bester K.
Biodegradation of triclosan and Formation metabolites in activated sludge under aerobic
conditions. Manuscript in preparation


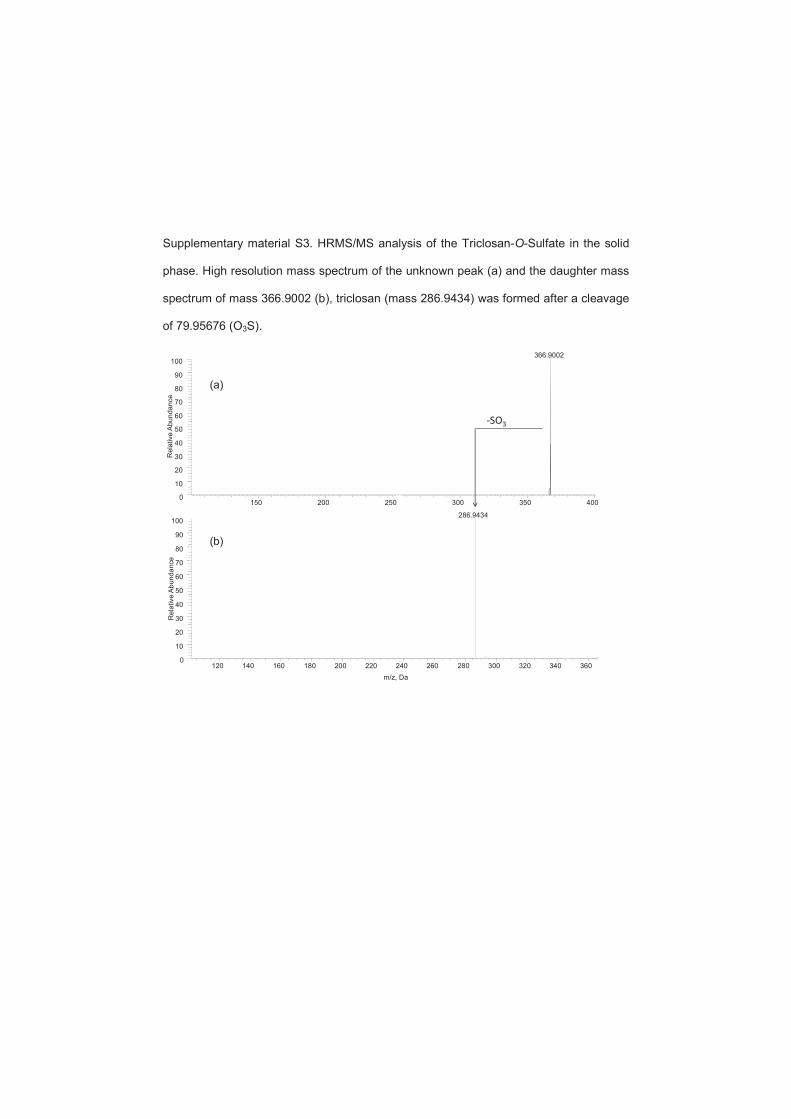

Mandatory page
Thesis title: Triclosan removal in wastewater treatment processes
Name of PhD student: Xijuan Chen
Supervisors: Jeppe Lund Nielsen, Kai Bester
List of published papers:
Paper 1: Chen XJ., Pauly U., Rehfus S. and Bester K. Personal care
compounds in a reed bed sludge treatment system, Chemosphere 76 (2009)
1094–1101
Paper 2: Chen XJ., Pauly U., Rehfus S. and Bester K. Removal of personal
care compounds from sewage sludge in reed bed container (lysimeter)
studies — Effects of macrophytes, Science of the Total Environment 407
(2009) 5743–5749
Paper 3: Chen XJ. and Bester K. Determination of organic micro-pollutants
such as personal care products, plasticizer and flame retardants in sludge,
Anal Bioanal Chem (2009) 395:1877–1884
Paper 4: Bester K., Chen XJ., Pauly U. and Rehfus S. Abbau von
organischen Schadstoffen bei der Kläschlammbehandlung in
Pflanzenbeeten, Korrespondenz Abwasser, Abfall 58 (2011) 1050-1157
Paper 5: Chen XJ., Nielsen JL., Furgal K., Liu YL., Lolas IB. and Bester K.
Elimination of triclosan and formation of methyl-triclosan in activated sludge
under aerobic conditions, Chemosphere 84 (2011) 452–456
Paper 6: Chen XJ., Richard J., Dopp E., Türk J., Liu YL. and Bester K.

Ozonisation products of triclosan in advanced wastewater treatment, Water
Research 46 (2012) 2247-2256
Paper 7: Lolas IB., Chen XJ., Bester K. and Nielsen JL. Identification of
triclosan degrading bacteria using stable isotope probing and
microautoradiography. Microbiology 158 (2012) 2805-2814
Paper 8: Chen XJ., Wimmer R., Ternes T., Schlüsener M., Nielsen JL. and
Bester K. Biodegradation of triclosan and Formation metabolites in activated
sludge under aerobic conditions. Manuscript in preparation
This thesis has been submitted for assessment in partial fulfillment of the PhD
degree. The thesis is based on the submitted and published scientific papers which
are listed above. Parts of the papers are used directly or indirectly in the extended
summary of the thesis. As part of the assessment, co-author statements have been
made available to the assessment committee and are also available at the Faculty
of Engineering and Science, Aalborg University.
