aan031 v1 evaluation of nonlinear laos experiments evaluation of... · evaluation of nonlinear laos...
TRANSCRIPT

AAN031
Evaluation of nonlinear LAOS experiments
1 AAN031 V1
ABSTRACT
The nonlinear stress response upon a sinusoidal
strain input on the ARES-G2 can be recorded and
analyzed in two ways: 1. Fast sampling of the stress
as a function of time followed by discrete Fourier
analysis (DFT) or decomposition of the stress signal
into an elastic and viscous component. 2. Direct cor-
relation of the measured stress and the input strain to
determine the magnitude and phase of the funda-
mental and harmonics up to the 9th order. This
method can be conveniently integrated into standard
test modes such as time, strain or frequency sweeps
which provide the desired results (dynamic moduli
G’n. G”n or magnitude ratio In(ωn)/I1(ω)) immedi-
ately.
Nonlinear oscillation measurements of a 4wt%
Xanthan gum solution have been performed as a
function of strain amplitude. Fourier coefficients of
the stress signal are evaluated by direct correlation,
discrete Fourier transformation and decomposition
of the measured stress in a contribution in phase
with the strain and one in phase with the strain rate.
The results are compared and analyzed in terms of
reproducibility and accuracy of the method. Struc-
tural changes during the transition from linear to
nonlinear behavior are discussed based on elastic
and viscous deformation mechanisms.
INTRODUCTION
During an oscillation experiment on a
Separate Motor Transducer (SMT) rheome-
ter, a sinusoidal deformation is applied to
the material. As long as the total deforma-
tion is small, linear viscoelasticity prevails
and the measured stress at steady state re-
mains sinusoidal. In order to evaluate the
material’s response, the stress is decom-
posed into two wave functions, one in phase
with the strain and one in phase with the
strain rate. In analogy to a solid material
(strain and stress are in phase) and a simple
fluid (strain rate and stress are in phase), the
part in phase with the strain represents the
elastic (solid like) deformation behavior,
the part in phase with the strain rate (out of
phase with the strain) is the viscous (fluid
like) behavior. As such, the stress can be
expressed by the sum of the two compo-
nents as follows:
(1)
Instead of representing the stress and
strain versus time explicitly, the stress can
be plotted against the strain directly (Figure
1). As long as the measured stress wave is
sinusoidal the stress describes an ellipsoid
in this representation, also referred to as
“Lissajous” representation1. When the
stress is in-phase with the strain, the ellip-
soid collapses to a straight line through the
origin.
When the stress response of the material
upon a sinusoidal strain input is not a sim-
ple sinusoidal function, the material be-
haves nonlinear and the ellipsoid in the
stress-strain representation changes to a
more complex geometrical shape. The
nonlinear stress response for example can
Aly Franck, TA Instruments, Germany
Keywords: LAOS, Fourier Rheology, DFT, Fourier coefficients, elastic & viscous stress, Nonlinear visco-
elasticity, strain sweep
( ) '( ) "( )t t tσ σ σ= +

2 AAN031 V1
though this mathematical analysis of
nonlinear signals provides a complete de-
scription of the stress response; it is diffi-
cult a priori to associate the results from the
Fourier analysis with physical material
properties. The dynamic modulus G’, repre-
senting the elastic nature of a material and
G”, representing the viscous dissipation of
energy in the linear region lose their physi-
cal meaning. In analogy to the linear vis-
coelasticity, the components of the nonlin-
ear response in phase with the strain and in
be developed in a Fourier series according
to:
(2)
and in complex notation:
(3)
Although the Lissajous figure represents
an excellent visual aid for qualitative analy-
sis, it is difficult to use when a quantitative
evaluation is required. In this case it is more
convenient to extract the various compo-
nents of the stress response by Fourier
transformation. The Fourier transformation
decomposes the stress signal and produces a
frequency spectrum represented by the fun-
damental and higher order odd harmonics2.
Each peak in the spectrum is characterized
by a magnitude an and a phase φn. Al-
Figure 1: Lissajous representation of the measured stress response upon a sinusoidal strain input in case of linear (upper) and nonlinear (lower) response for a PIB solution
Figure 2: Representation of the measured stress, the viscous and elastic stress for a PIB solution plotted versus time, strain and strain rate tested at 3000% strain and a frequency of 1 rad/s.
'
"
( , )sin ( , , )
( , )cos
n o
o o
n odd n o
G n tt
G n t
ω γ ωσ ω γ γ
ω γ ω=
+ =
∑
( )( , , ) ni n t
o n
n odd
t a eω φσ ω γ
∞+
=
∝ ∑&

3 AAN031 V1
phase with the strain rate can be interpreted
as elastic and viscous stress3. Based on
symmetry arguments, the measured stress
can be decomposed into an elastic stress
component σ‘ and a viscous stress compo-
nent σ” (Figure 2). Both stress components
σ' and σ” are unique functions (single curve in the Lissajous representation) of strain i.e.
strain rate. The elastic and viscous stress
components can be conveniently fitted by
Chebyshev polynomials of the first kind4.
The higher order Chebyshev coefficients
(en, vn) are excellent parameters to describe
intra-cycle changes of the elastic and vis-
cous stress. A positive e3 (3rd order coeffi-
cient) corresponds to an increase of the
maximum elastic stress (intra-cycle strain
stiffening), a negative e3 to a decrease of
the maximum elastic stress (intra-cycle
strain softening). The Chebyshev coeffi-
cients are related to the Fourier coefficients
(G’n, G”n)5 in a simple way according to:
(n=odd)
(4)
In the linear regime, all higher order coef-
ficients disappear and e1 represents G’, the
linear viscoelastic storage modulus and v1ω represents G”, the loss modulus. The same
physical interpretation of e3 can be attached
to G’3 , the 3rd order Fourier coefficient and
so on – thus providing physical meaning to
the higher harmonic coefficients obtained
from correlation i.e. Fourier transform tech-
niques, commonly used in commercial
rheometers.
EXPERIMENTAL
Oscillation rheometers generate test re-
sults in terms of elastic and viscous
modulus from dynamic mechanical experi-
ments by evaluating G’1 and G”1, the first
order Fourier coefficients. Because of in-
creasing interest in highly nonlinear mate-
rial behavior, an easy to use approach to
evaluate the results obtained under large
oscillation strains (LAOS) is needed. A
number of investigations have been con-
ducted in this respect in the nonlinear vis-
coelastic region under large oscillation
strain conditions 6, 7, 8 using discrete Fourier
transformation to evaluate the stress re-
sponse.
The special feature of the new ARES-G2
rheometer, based on the unique SMT tech-
nique is to perform experiments at large
oscillation strains and to measure the mate-
rial’s response with the accuracy and tem-
poral resolution necessary to allow a quanti-
tative analysis of the higher order harmonic
contributions of the raw stress signal. The
rheometer uses a data acquisition system
which incorporates fast acquisition channels
for displacement, torque, normal force and
an auxiliary signal with a sampling rate of
8kHz each. Pre-averaging based on over-
sampling techniques further improves the
signal to noise ratio of the raw signals. The
ARES-G2 provides two methods to analyze
the oscillation data:
1. Real time correlation to determine mag-
nitude and phase of the fundamental and
the higher order components during the
test. In this mode results up to the 9th
order harmonic contribution can be ob-
tained simultaneously. The advantage of
this approach is the full integration into
the existing methodology of performing
oscillation tests. Higher harmonic
analysis can be selectively checked in
the correlation settings of all standard
oscillation test modes.
2. Post-processing of the raw strain and
stress data using discrete Fourier trans-
formation (DFT) after previous sam-
pling and saving the raw signals. A new
test mode, the “SineTransient” collects
the raw oscillation stress (shear and/or
normal) and strain data as a function of
time. The maximum order for the har-
monic evaluation is not limited and can
be selected based on the significance of
the magnitude of the harmonics.
( 1)' 2
"'
( 1)n
n n
nn n
e G
Gv η
ω
−
= −
= =

4 AAN031 V1
The material used in this investigation is a
4wt% aqueous solution of Xanthan gum
(Sigma-Aldrich Co.). The sample was dis-
solved in purified water over night and vig-
orously stirred for several hours.
The rheological measurements were per-
formed using a 50mm diameter stainless
steel cone plate geometry with a cone angle
of 0.04rad and a cone truncation of 50µm.
Oscillation strain sweep experiments were
conducted from 10-4 to 100 strain units. The
correlation conditions for each data point
were: 10 cycles delay and 10 cycles for cor-
relation. The nth order harmonic is obtained
by correlating the measured stress and
strain signals with two out of phase refer-
ence signals at n-times the fundamental fre-
quency. The test (strain excitation) fre-
quency in this study is 1 Hz. The phase and
the magnitude of the fundamentals and the
odd harmonics (3rd, 5th, 7th, and 9th) were
recorded. In a second step, SineTransient
experiments at fixed frequency and strain
amplitude were performed in the range
from 0.01 to 63 strain units. The correlation
conditions were chosen to be the same as
those for the strain sweep experiment: 10
cycles delay and 10 cycles for data sam-
pling. The sampling rate for all measured
signals was 1000 pts/s. The stress and strain
signals are converted using a discrete Fou-
rier transformation routine (DFT) to extract
magnitude and phase for all significant har-
monic contributions and the Fourier coeffi-
cients G’n and G”n were calculated accord-
ing to equation 2. The same set of data was
also evaluated using the MITLAOS pack-
age9 to determine the Chebyshev coeffi-
cients. The same order of harmonic contri-
butions was used in both evaluations.
RESULTS
Analysis of the results from the strain
sweep experiment
Figure 3 shows the storage and loss
modulus (G’, G”) of the Xanthan gum solu-
tion as a function of the strain amplitude γo. Beyond 20% strain G’ decreases; G” ini-
tially increases slightly then decreases,
however at a lower pace. The response with
a weak G” overshoot is a type III behavior
according to the classification proposed by
Hyun et al.10. The same graph includes the
magnitudes of the higher harmonic stress
contributions, reduced to relative intensities
according to (Index 1 represents the funda-
mental):
(5)
In the linear region (below 20% strain),
the magnitudes of the higher harmonic con-
tributions are zero. At the onset of the
nonlinear response, the magnitude of the 3rd
harmonic stress increases sharply. The
shape of the stress waveform in this region
is tilted backwards and asymmetric in re-
spect to a vertical line through the mid
point. In the region characterized by a
steady decrease of G’ and G” at ~ 600%
strain, the relative magnitude of the 3rd har-
monic stress decreases again. The shape of
Figure 3: Strain sweep of a Xanthan gum (4wt%) solution with the dynamic modulus G’ and G” as well as the relative magnitudes of the 3rd, 5th, 7th and 9th harmonic stress contributions.
*
*1 1
nnI
I
σ
σ=
I. II. III. IV.
5 AAN031 V1
the stress waveform has changed signifi-
cantly, shows a flat plateau and has partially
recovered its symmetry. The relative mag-
nitudes of the 5th, 7th and 9th harmonic stress
follow the same trend, however they do ap-
pear at a higher strain and the magnitude is
less pronounced.
Below figure 3 the Lissajous figures, rep-
resenting the stress vs. strain and strain rate
at 4 strain amplitudes from the linear into
the nonlinear region are shown. In the linear
region I, the stress vs. strain and strain rate
represent ellipsoids. The elastic stress σ’(γ(t)), in phase with the strain and the viscous
stress σ”(g(t)), in phase with the strain rate
are unique functions and represent straight
lines through the origin. With increasing
strain the ellipsoids are tilted. The elastic
and viscous stress remain unique functions,
but they cannot be represented by a straight
line anymore. Higher order Fourier coeffi-
cients are necessary to describe the viscous
and elastic stress.
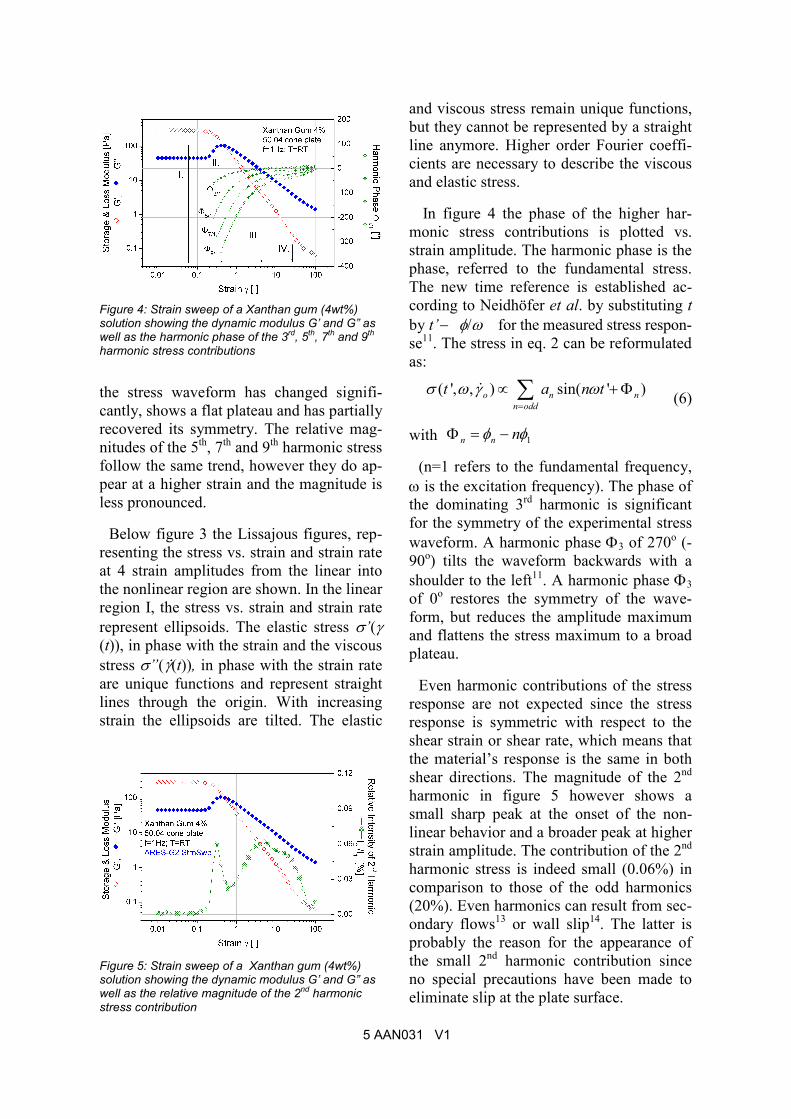
In figure 4 the phase of the higher har-
monic stress contributions is plotted vs.
strain amplitude. The harmonic phase is the
phase, referred to the fundamental stress.
The new time reference is established ac-
cording to Neidhöfer et al. by substituting t
by t’− φ/ω for the measured stress respon-
se11. The stress in eq. 2 can be reformulated
as:
(6)
with
(n=1 refers to the fundamental frequency,
ω is the excitation frequency). The phase of the dominating 3rd harmonic is significant
for the symmetry of the experimental stress
waveform. A harmonic phase Φ3 of 270o (-
90o) tilts the waveform backwards with a
shoulder to the left11. A harmonic phase Φ3
of 0o restores the symmetry of the wave-
form, but reduces the amplitude maximum
and flattens the stress maximum to a broad
plateau.
Even harmonic contributions of the stress
response are not expected since the stress
response is symmetric with respect to the
shear strain or shear rate, which means that
the material’s response is the same in both
shear directions. The magnitude of the 2nd
harmonic in figure 5 however shows a
small sharp peak at the onset of the non-
linear behavior and a broader peak at higher
strain amplitude. The contribution of the 2nd
harmonic stress is indeed small (0.06%) in
comparison to those of the odd harmonics
(20%). Even harmonics can result from sec-
ondary flows13 or wall slip14. The latter is
probably the reason for the appearance of
the small 2nd harmonic contribution since
no special precautions have been made to
eliminate slip at the plate surface.
Figure 4: Strain sweep of a Xanthan gum (4wt%) solution showing the dynamic modulus G’ and G” as well as the harmonic phase of the 3rd, 5th, 7th and 9th harmonic stress contributions
Figure 5: Strain sweep of a Xanthan gum (4wt%) solution showing the dynamic modulus G’ and G” as well as the relative magnitude of the 2nd harmonic stress contribution
1n n nφ φΦ = −
( ', , ) sin( ' )o n n
n odd
t a n tσ ω γ ω=
∝ +Φ∑&

6 AAN031 V1
Analysis of the results from the Sine
Transient experiments
Time dependent stress and strain data
have been collected at discrete stain ampli-
tudes of 1%, 3%, 6.3%, 10%, 30%, up to
6300%. The Fourier coefficients G’n, G”n were calculated from the magnitude and the
phase of the harmonic stress contributions
obtained from discrete Fourier transforma-
tion of the stress and strain waves. In order
to compare with the results of the strain
sweep experiments, the Fourier coefficients
were also calculated from the magnitude
and phase determined by the rheometer ac-
cording to:
Figure 6: Comparison of Storage and Loss modulus determined in the strain sweep experiment with the first order Fourier coefficients obtained from the DFT and MITLAOS programs of the raw stress and strain signals.
Figure 7: 3rd harmonic Fourier Coefficients G’3, G”3 as a function of the strain amplitude
(7)
with
δn is the phase referred to the fundamental
strain, φn, φs the experimental phases of the
harmonic stress contributions and the strain.
The Fourier coefficients were also calcu-
lated from the Chebyshev coefficients de-
termined with the MITLAOS(*) program,
developed by Ewoldt et al. 9 according to
equation 4.
The first order Fourier coefficients repre-
sent the linear viscoelastic storage (G1’) and
loss (G1”) modulus and are plotted in figure
6 as a function of the strain amplitude. The
results calculated using the DFT and MIT-
LAOS programs agree very well with the
data from the strain sweep experiments.
This is to be expected as the same Xanthan
gum sample was tested under merely the
same experimental conditions.
Figure 7 is the same plot for the 3rd Fou-
rier coefficient. Similar to the results for the
1st Fourier coefficients, excellent agreement
has been obtained for G’3, G”3 using the 3
evaluation methods (Correlation, DFT and
MITLAOS). In the linear region, below
20% strain, the contributions of the 3rd har-
monic are zero. At the onset of the nonlin-
ear behavior, G’3 increases to a maximum at
30% strain and then rapidly decreases to
negative values to reach its minimum value
at approximately 100% strain. This means
that the elastic Chebyshev coefficient e3,
initially becomes negative and turns posi-
tive at higher strain amplitude (Note, the
sign changes for the 3rd harmonic contribu-
tion in eq. 4.). A positive 3rd Chebyshev
coefficient provides an increase of the
*
'
*
"
sin
cos
n
n n
o
n
n n
o
G
G
σδ
γ
σδ
γ
=
=
&
&
n n snδ φ φ= −
(*)MITLAOS uses FFT to calculate Chebyshev coefficients. This avoids the complex multistep decomposi-
tion of the stress and the numerical integrations to obtain en and vn

7 AAN031 V1
maximum elastic stress, which stands for an
“intra-cycle” strain stiffening effect 4.
The viscous Fourier coefficient G”3
slightly drops to become negative at the on-
set of the nonlinear behavior and increases
significantly to a high positive maximum
value around 50% strain, followed by a
sharp drop to a negative minimum at ap-
proximately 200% strain. The viscous Che-
byshev coefficient v3 is directly propor-
tional to the viscous Fourier coefficient. A
positive viscous Chebyshev coefficient v3 represents intra-cycle shear thickening, an
increase of viscous energy dissipation. This
effect disappears with increasing strain and
is replaced by intra-cycle strain-stiffening,
an increase of the elastic response of the
material. The negative minimum in v3 at
200% strain suggest a strain shear thinning
effect, the viscous dissipation slows down
and the viscous 3rd harmonic contributions
approach zero above 10 strain units.
Reporting the elastic and viscous modulus
for various harmonics is confusing, as can
be seen from figure 8. The higher order co-
efficients follow the trend of the 3rd order
Fourier coefficients. The intensity of G’n
and G”n decreases with increasing order, but
no further insight is provided. Simple pa-
rameters combining the effects of all rele-
vant Fourier coefficients, namely an elastic
strain-stiffening/softening (S) and an vis-
cous shear-thickening/thinning (T) ratios
Figure 9: Elastic strain-stiffening/softening and vis-cous shear-thickening/thinning ratio for the 4wt% Xanthan gum gel during the transition from linear to nonlinear behavior .
have been defined by Ewoldt et al. 5.
(8)
G’M is a minimum-strain and G’L a large-
strain modulus representing local inter-
cycle variations of the elastic behavior be-
tween small and large instantaneous strain.
At the limit of small strain, G’M and G’L
converge to the linear viscoelastic modulus
G’. Along the same concept does η'M repre-sent the minimum shear viscosity and η'L a large strain rate shear viscosity. In the linear
region both S and T are equal to zero. S>0
corresponds to intra-cycle elastic stiffening
and S<0 to intra-cycle softening. T>0 repre-
sents viscous intra-cycle shear thickening,
T<0 intra-cycle shear thinning
Figure 9 shows for the Xanthan gum solu-
tion the variation of the strain stiffening/
softening and the shear thickening/thinning
ratio during the transition from low to large
amplitude strain i.e. linear to nonlinear be-
havior.
At the onset of the nonlinear behavior, the
Xanthan gum thickens (T>0), paralleled
with a slight elastic softening (S<0). Be-
yond 40% strain, the material stiffens
abruptly and S reaches a value of ~ 1.5; the
Figure 8: The elastic and viscous Fourier coefficients for all odd harmonics of the order 3 to 9 are shown as a function of strain. The significance decreases with increasing order
'' '
3
' ' '
1 3
"' '
3
' " "
1 3
4 ..
..
4 ..
..
L M
L
L M
L
GG GS
G G G
GT
G G
η ηη
− +−≡ =
− +
+−≡ =
+ +

8 AAN031 V1
elastic contribution in the material increases
sharply as the material is strained further.
At the same time the shear thickening/
thinning ratio T decreases and falls below 0
at 200% strain. Between 100 and 500%
strain, S remains constant, although exhibit-
ing strong variations at high level. Beyond
500% strain, S decreases along with T; at
this point the gel structure deteriorates very
fast. A viscous thickening at the beginning
of the nonlinear region can be expected
from the peak in the loss modulus G”1. Not
apparent form the storage modulus G’1
however is the strong elastic stiffening of
the gel before the gel structure breaks apart.
It should be noted, that the behavior of the
elastic stiffening/softening ratio S follows
the relative magnitude of the third order
harmonic contribution in figure 3.
With the concept of intra-cycle elastic and
viscous variations, the transition from linear
to nonlinear behavior can be probed in
more detail and structural changes investi-
gated.
CONCLUSION
The capability to perform highly accurate
LAOS experiments on a commercial SMT
(Separate Motor and Transducer) has been
demonstrated. Expanding standard correla-
tion techniques to provide not only the fun-
damental but also high order harmonic con-
tent in terms of magnitude and phase has
proven to be an accurate and fast tool to
analyze the nonlinear stress response. A
typical viscoelastic gel, the 4wt% Xanthan
gum solution has been tested and analyzed
using the extended correlation technique.
The raw strain and stress waveforms of the
experiments were also analyzed using com-
monly used DFT techniques and a decom-
position method proposed by Cho et al.3.
Excellent agreement has been obtained be-
tween the 3 evaluation methods. Finally the
results, represented here by the higher order
Fourier coefficients G’n and G”n were inter-
preted in terms of elastic and viscous dissi-
pation effects. Structural changes during the
transition from linear to highly non linear
behavior could be investigated in more de-
tail.
ACKNOWLEDGMENTS
The author would like to acknowledge
Prof. M. Wilhelm and Ph.D. Candidate. R.
Ewoldt for very helpful discussions.
REFERENCES
1. A.D.Crowell, Am. J. Phys. 49, 452
(1981)
2. Wilhelm, M. Reinheimer, P. Ortseifer,
M. Spiess H.W. Rheol. Acta 38, 349-356
(1999)
3. Cho, K.S. Ahn, K.H. Lee, S.J.. J.Rheol.
49(3), 747-758 (2005)
4. Ewoldt, R.H. McKinley, G.H. Hosoi,
A.E. Annual Transactions of the Nordic
Rheology Society 15, (2007)
5. Ewoldt, R.H. McKinley, G.H. Hosoi,
A.E., Fingerprinting Soft Materials: A
Framework for Characterizing Nonlinear
Viscoelasticity.arXiv, 2007. 0710.5509v1:
[cond-mat.soft]
6. Krieger, I.M. , T.F.Niu, Rheol. Acta 12,
567-571(1973)
7. Giacomin A.J., J.M. Dealy, in Tech-
niques in Rheological Measurements” ed-
ited by A.A. Collyer (Chapman and Hall,
London, 1993), Chap. 4, pp. 99-121
8. Wilhelm, M. Reinheimer, P. Ortseifer,
M. Spiess H.W. Rheol. Acta 38, 349-356
(1999)]
9. Ewoldt, R.H., P. Winter, available from
http://web.mit.edu/nnf/
10. Hyun, K.S., S.H. Kim, K.H. Ahn, S,J.
Lee, Non-Newtonian Fluid Mech. 107, 51-
65 (2002)
11. Neidhöfer, T, M. Wilhelm, J.Rheol. 47
(6), 1351-1371 (2003)
12. Hyun, K., J.G.Nam, M.Wilhelm,
K.H.Ahn, S.J.Lee, Korean-Australia
Rheology J. 15(2), 97-105 (2003)
13. Atalik, K, R.Keunings,
J.NonNewtonian Fluid Mech. 122, 107
(2004)
14. Graham, M.D. J.Rheol. 39, 697 (1995)