aapm/rsna tutorial on equipment selection: pacs equipment overview
TRANSCRIPT
IMAGING & THERAPEUTIC TECHNOLOGY 879
AAPM/RSNA Tutorialon Equipment Selection:PACS Equipment OverviewDisplay Systems1
Aldo Badano, PhD
Display systems are key components of the digital radiology depart-ment. Current display systems for medical imaging are based oncathode-ray tubes (CRTs) or active-matrix liquid crystal displays(AMLCDs). The CRT is a cathodoluminescent display: Light is gen-erated by exciting a luminescent material with energetic electrons.AMLCDs are light-modulating devices that form the image in thescreen by controlling the transparency of individual display pixels.Many image quality aspects of CRTs are determined by the way thepixel luminance is generated in the cathodoluminescent screen. Theresolution properties of AMLCDs are much better than those ofCRTs. In CRT devices, phosphor granularity and raster scanning pat-terns are the main components of spatial noise. In AMLCDs, the mostnotable feature of the noise characteristic is the subpixel structure ofcomplex pixel designs used in medical displays. The small-spot con-trast of CRTs is dominated mainly by veiling glare and reflections ofambient illumination. In addition to display reflectance, the contrast ofmedical AMLCDs is affected by crosstalk and by variations of the lu-minance at off-normal viewing angles.
Abbreviations: AMLCD � active-matrix liquid crystal display, CRT � cathode-ray tube
Index terms: Cathode ray tubes ● Computers ● Images, display ● Images, quality
RadioGraphics 2004; 24:879–889 ● Published online 10.1148/rg.243035133
1From the Office of Science and Technology, Center for Devices and Radiological Health, Food and Drug Administration, 12720 Twinbrook Pkwy,HFZ-142, Rockville, MD 20857. From the AAPM/RSNA Tutorial on Equipment Selection at the 2002 RSNA scientific assembly. Received May 13,2003; revision requested July 14 and received August 7; accepted August 21. Address correspondence to the author (e-mail: [email protected]).
The mention of commercial products herein is not to be construed as either an actual or implied endorsement of such products by the Department ofHealth and Human Services. This is a contribution of the Food and Drug Administration and is not subject to copyright.
Radio
Gra
phic
s
IntroductionThe effectiveness of all diagnostic imaging mo-dalities that use display devices is affected by thequality of the display system. Display image qual-ity defines the relationship between the informa-tion contained in the image and the informationconveyed to the observer through a luminancefield in the screen. When all available informationis transferred, the display system is considered toprovide full imaging fidelity. Display systems al-ways degrade the information content of the sig-nal due to many limitations. Nevertheless, whenthe information conveyed matches the limitationsof the observer’s visual system, the display systemcan be described as a high-fidelity system, evenwhen the system degrades image quality beyondthe human visual capabilities (1).
Current display offerings for diagnostic radiol-ogy systems are based on two competing tech-nologies: the cathode-ray tube (CRT) and theactive-matrix liquid crystal display (AMLCD).CRT technology is based on the generation oflight by excitation of a cathodoluminescent phos-phor by using focused, energetic electron beams.The AMLCD technology, based on an active ar-ray of transistors driving liquid crystal modula-tors, is a more recent technology. In this article,we briefly review the differences between thesetechnologies in current offerings for monochromemedical display systems. Finally, we cover the keyfactors affecting display image quality.
TechnologiesMany display concepts are constantly being re-ported in major display industry forums. How-ever, only a subset of those are pursued to be-come efficient devices designed to satisfy the re-quirements of demanding applications. Today,only two technologies deliver the quality requiredto display radiographic images: the CRT and theAMLCD.
Cathode-Ray TubesThe CRT is a cathodoluminescent display: Lightis generated by exciting a luminescent materialwith energetic electrons (2,3). An electron gunlocated in the back of the device emits an ener-getic beam, which strikes a phosphor screenwithin a small spot. Electrons are extracted fromthe cathode by thermal emission from low-sur-face-potential materials (typically metallic ox-
ides). The electron beam generated at the cath-ode is then accelerated, deflected, and focused bya series of electrostatic lenses and deflection coils(3).
When high luminance is needed on a regularbasis, the depletion of available electrons from thecathode material leads to cathode aging and even-tually to image quality degradation and devicefailure. This can be remediated (up to a certainpoint) by adjusting the beam current over the life-time of the CRT. Otherwise, the temporal stabil-ity of electron extraction from the cathode mate-rial in high-performance CRTs can be improvedby using dispenser cathodes, which consist of aporous pellet impregnated with emissive oxidematerial (3). The emission from a dispenser cath-ode decreases to only about 95% during thefirst 3,000 hours under heavy cathode loading,whereas the emission from standard oxide cath-odes drops to about 60% under the same condi-tions.
The emissive structure is a key component ofCRTs that greatly affects their image quality. Itconsists of all those elements responsible for thegeneration and delivery of light (see fig 7 of refer-ence 4). Emissive structures vary according to thetype of CRT. In general, they consist of a conduc-tive coating (normally a thin aluminum overcoat),a cathodoluminescent phosphor (5), a black ma-trix layer, a glass faceplate, and sometimes, anantireflective coating. The choice of a particularphosphor for a medical CRT is an important ele-ment to consider when comparing monitors. Thetypical choices include P45 (a single-componentphosphor) and P104 (a blended phosphor).These two phosphors differ in their luminous effi-ciency (percentage of luminance compared withthat of a standard phosphor [P4] under specifiedconditions) and in their noise textures. P104phosphors are about 54% more efficient than P45screens. However, P104 phosphors are madefrom a mixture of grains of different size andcolor, which causes a granular appearance andaffects the perceived noise (6,7).
Phosphors degrade over time due to materialchanges in regions of high electron bombardmentand high current density. The corresponding de-crease in the brightness needs to be corrected forover the useful lifetime of the monitor by increas-ing the beam current. The maximum luminanceof a CRT with a P45 phosphor is more stable andneeds less adjustment of the electron beam cur-rent over the lifetime of the monitor when com-pared with that of a P104 phosphor screen.
880 May-June 2004 RG f Volume 24 ● Number 3
Radio
Gra
phic
s
Active-Matrix Liquid Crystal DisplaysAs opposed to CRTs, AMLCDs are light-modu-lating devices that form the image in the screen bycontrolling the transparency of individual displaypixels (8). The base of this technology is the liq-uid crystal material, which exhibits propertiestypical of solids (ie, a highly ordered moleculararrangement) as well as properties associated withliquids (ie, viscosity) (9). Liquid crystal materialsare typically long organic molecules with delocal-ized charge that tend to orient themselves along amain axis, forming a unique spatial configurationdetermined by elasticity, viscosity, and deforma-tion constants. To modulate light transmission,the orientation of the molecules can be controlledwith an external electric field. With the help ofpolarizer films, which allow transmission of lightwhen the polarization vector and the axis of thefilm are aligned, liquid crystal cells can be de-signed to transmit (normally white) or block (nor-mally black) light.
In addition to the top and bottom substrates,liquid crystal display pixel structures requirealignment layers, polarizer films, and electrodes.The main components of a typical medicalAMLCD stack are shown in figure 8 of reference4. The gap between the substrates (on the orderof a few microns) is maintained by spherical glassbeads, which act as spacers. Because of the multi-tude of elements that light needs to go throughbefore generating an image in the front screen,liquid crystal displays are intrinsically inefficientdevices. Typically, only 3%–5% of the total lightgenerated by the backlight is seen at the front faceof color liquid crystal displays. This fraction ishigher for monochrome devices (8%–15%) dueto the lack of absorption in the color filters.
The modulation of the pixel luminance isachieved by controlling the voltage at each indi-vidual pixel. High-resolution displays used in di-agnostic radiology with a large number of rowsand columns (high pixel density) require activeaddressing methods with an array of nearly idealswitches to allow fast and accurate control of thepixel luminance. In AMLCDs, the active pixelelement is typically a hydrogenated amorphoussilicon (a-Si:H) thin-film transistor (TFT), whichis usually located in one of the corners of the pixellayout. Since the TFT circuitry is shielded fromthe high illumination coming from the backlightby an opaque coating, light is not transmittedover the TFT area. In addition, certain pixel areascan have very low light transmission (ie, metalelectrode lines). The fraction of the total pixelarea that allows transmission of light is called theaperture ratio. In consumer product displays, the
aperture ratio can be as small as 50%, whereas inhigh-performance displays it can be as high as80%. The aperture ratio affects the display powerrequirements, the control of the pixel luminance,and the noise characteristics of the panel.
Factors ThatAffect Image Quality
Display systems for radiology consist of a displaydevice and a display driver. The specificationsgiven for a system are valid only for that particularcombination. As an example, one aspect of dis-play image quality that strongly depends on thequality of the driver is the accuracy of the gray-scale representation. The relationship betweenimage values and screen luminance is determinedby the gray-scale presentation function. The digi-tal-to-analog converter (DAC) in the display con-troller determines the ability to finely modify theintrinsic response of the device to match a desiredluminance response. Conventional controllerswith 8-bit DACs have limited control over thedisplay gray-scale function.
This is particularly relevant for medicalAMLCDs, where the gray-scale resolution is alsoaffected by the intrinsic properties of the liquidcrystal pixels, which are often limited to an 8-bitscale in the luminance output. In this case, adeeper gray-scale resolution can be achieved bysubpixel modulation or by temporal modulation.Subpixel modulation uses the subpixel regions ofAMLCDs originally designed for color applica-tions to generate a look-up table, which providesadditional depth to the gray scale (10,11). In tem-porally modulated AMLCDs, the actual pixelluminance is the combined luminance of two dis-tinct luminance levels in two consecutive frames.Because the frame rate is high, human observerscannot discriminate between consecutive framesand therefore experience an average pixel lumi-nance.
SharpnessMany image quality aspects of CRTs are deter-mined by the way the pixel luminance is gener-ated in the cathodoluminescent screen. When animage is displayed, the scanning electron beam isrequired to modulate its intensity according to thegray-scale values representing the image. If largechanges in image values (which will be translatedinto large changes in beam current and luminanceoutput) are present, the electronics should be ca-pable of modulating the beam with a time con-stant smaller than the time needed for the beamto excite the phosphor at that pixel location.
RG f Volume 24 ● Number 3 Badano 881
Radio
Gra
phic
s
Therefore, the bandwidth requirements of theCRT signal amplifiers depend on the pixel arraysize. At low luminance, CRT spot sizes vary from0.15 to 0.20 mm. The large beam current neededto generate higher luminance determines a largerspot size (0.15–0.30 mm) due to the divergenceof the beam caused by electrostatic repulsion.The spot size is not constant across the screen butincreases at the edges relative to the center. Toachieve uniform spot sizes, a dynamic focus ad-justment performed by using deflection informa-tion can greatly improve the resolution uniformityof the monitor.
On the other hand, the resolution properties ofAMLCDs are much better than those of CRTs.Spatial modulation transfer functions measuredwith line patterns have been reported with closeto ideal response up to the Nyquist frequency as-sociated with the display pixel size (12).
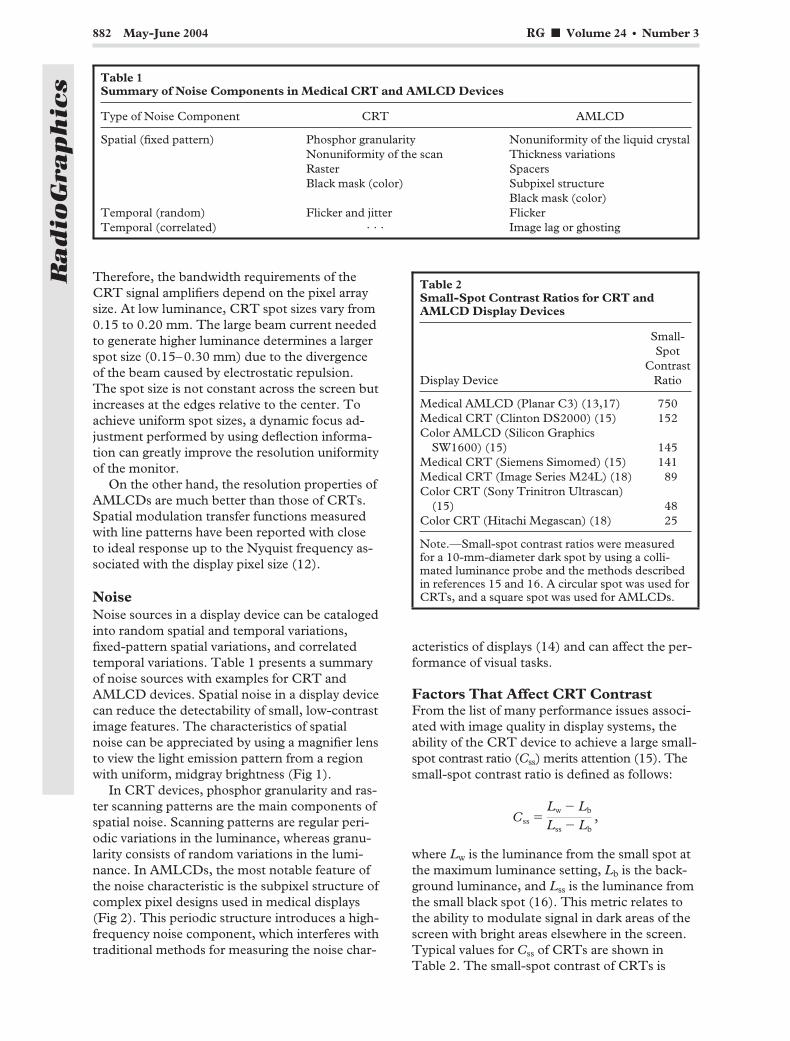
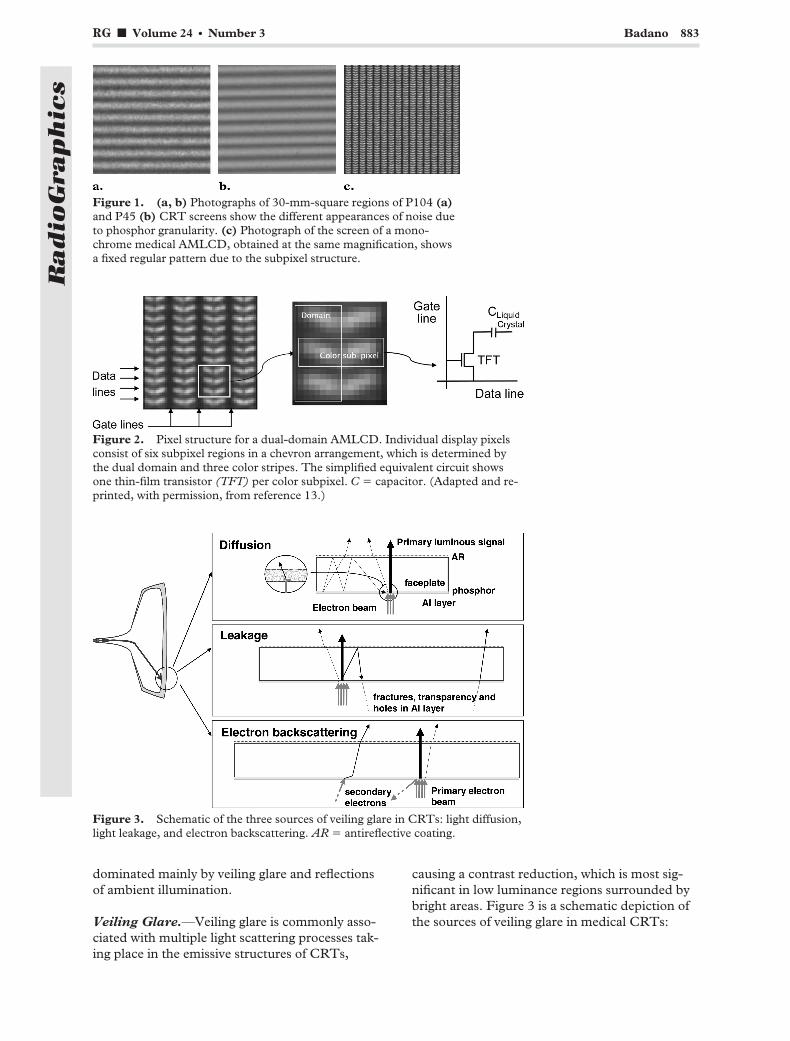
NoiseNoise sources in a display device can be catalogedinto random spatial and temporal variations,fixed-pattern spatial variations, and correlatedtemporal variations. Table 1 presents a summaryof noise sources with examples for CRT andAMLCD devices. Spatial noise in a display devicecan reduce the detectability of small, low-contrastimage features. The characteristics of spatialnoise can be appreciated by using a magnifier lensto view the light emission pattern from a regionwith uniform, midgray brightness (Fig 1).
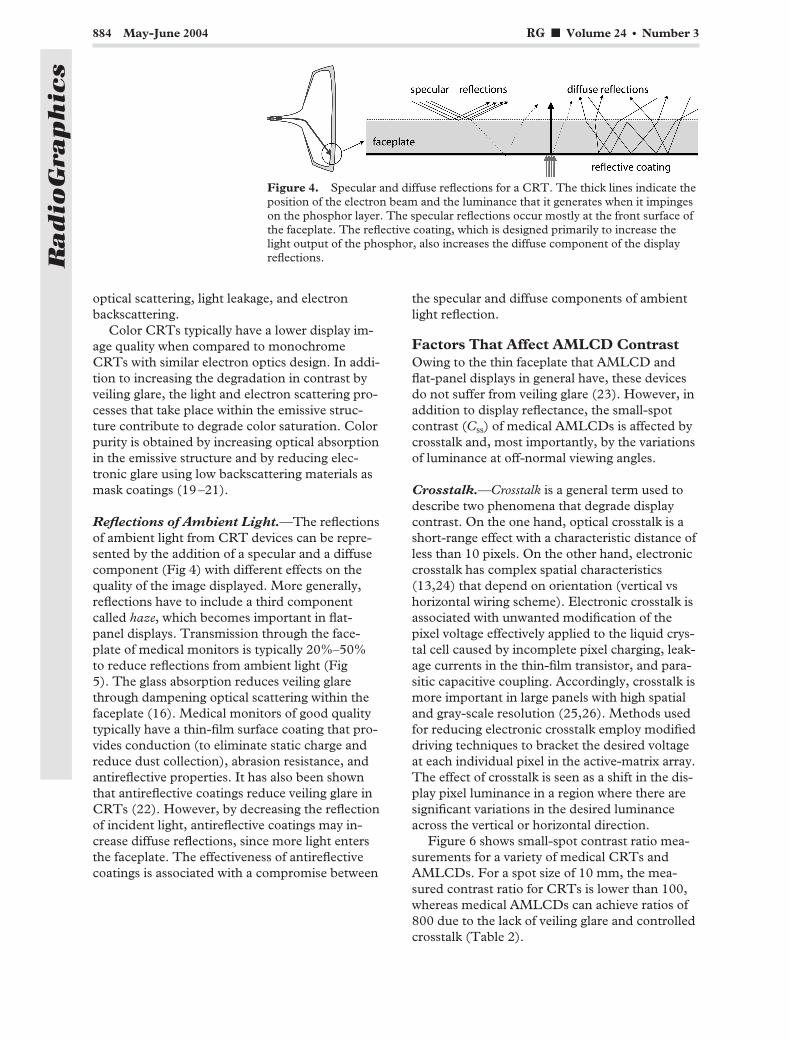
In CRT devices, phosphor granularity and ras-ter scanning patterns are the main components ofspatial noise. Scanning patterns are regular peri-odic variations in the luminance, whereas granu-larity consists of random variations in the lumi-nance. In AMLCDs, the most notable feature ofthe noise characteristic is the subpixel structure ofcomplex pixel designs used in medical displays(Fig 2). This periodic structure introduces a high-frequency noise component, which interferes withtraditional methods for measuring the noise char-
acteristics of displays (14) and can affect the per-formance of visual tasks.
Factors That Affect CRT ContrastFrom the list of many performance issues associ-ated with image quality in display systems, theability of the CRT device to achieve a large small-spot contrast ratio (Css) merits attention (15). Thesmall-spot contrast ratio is defined as follows:
Css �Lw � Lb
Lss � Lb,
where Lw is the luminance from the small spot atthe maximum luminance setting, Lb is the back-ground luminance, and Lss is the luminance fromthe small black spot (16). This metric relates tothe ability to modulate signal in dark areas of thescreen with bright areas elsewhere in the screen.Typical values for Css of CRTs are shown inTable 2. The small-spot contrast of CRTs is
Table 1Summary of Noise Components in Medical CRT and AMLCD Devices
Type of Noise Component CRT AMLCD
Spatial (fixed pattern) Phosphor granularity Nonuniformity of the liquid crystalNonuniformity of the scan Thickness variationsRaster SpacersBlack mask (color) Subpixel structure
Black mask (color)Temporal (random) Flicker and jitter FlickerTemporal (correlated) . . . Image lag or ghosting
Table 2Small-Spot Contrast Ratios for CRT andAMLCD Display Devices
Display Device
Small-Spot
ContrastRatio
Medical AMLCD (Planar C3) (13,17) 750Medical CRT (Clinton DS2000) (15) 152Color AMLCD (Silicon Graphics
SW1600) (15) 145Medical CRT (Siemens Simomed) (15) 141Medical CRT (Image Series M24L) (18) 89Color CRT (Sony Trinitron Ultrascan)
(15) 48Color CRT (Hitachi Megascan) (18) 25
Note.—Small-spot contrast ratios were measuredfor a 10-mm-diameter dark spot by using a colli-mated luminance probe and the methods describedin references 15 and 16. A circular spot was used forCRTs, and a square spot was used for AMLCDs.
882 May-June 2004 RG f Volume 24 ● Number 3
Radio
Gra
phic
s
dominated mainly by veiling glare and reflectionsof ambient illumination.
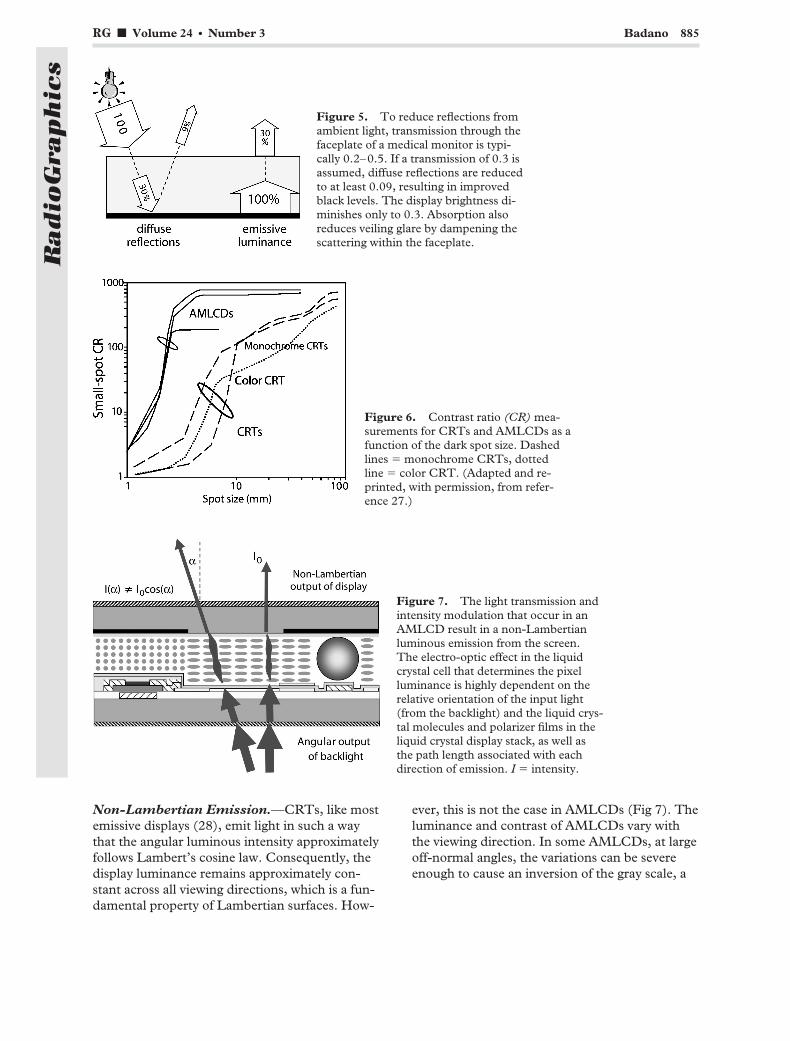
Veiling Glare.—Veiling glare is commonly asso-ciated with multiple light scattering processes tak-ing place in the emissive structures of CRTs,
causing a contrast reduction, which is most sig-nificant in low luminance regions surrounded bybright areas. Figure 3 is a schematic depiction ofthe sources of veiling glare in medical CRTs:
Figure 1. (a, b) Photographs of 30-mm-square regions of P104 (a)and P45 (b) CRT screens show the different appearances of noise dueto phosphor granularity. (c) Photograph of the screen of a mono-chrome medical AMLCD, obtained at the same magnification, showsa fixed regular pattern due to the subpixel structure.
Figure 2. Pixel structure for a dual-domain AMLCD. Individual display pixelsconsist of six subpixel regions in a chevron arrangement, which is determined bythe dual domain and three color stripes. The simplified equivalent circuit showsone thin-film transistor (TFT) per color subpixel. C � capacitor. (Adapted and re-printed, with permission, from reference 13.)
Figure 3. Schematic of the three sources of veiling glare in CRTs: light diffusion,light leakage, and electron backscattering. AR � antireflective coating.
RG f Volume 24 ● Number 3 Badano 883
Radio
Gra
phic
s
optical scattering, light leakage, and electronbackscattering.
Color CRTs typically have a lower display im-age quality when compared to monochromeCRTs with similar electron optics design. In addi-tion to increasing the degradation in contrast byveiling glare, the light and electron scattering pro-cesses that take place within the emissive struc-ture contribute to degrade color saturation. Colorpurity is obtained by increasing optical absorptionin the emissive structure and by reducing elec-tronic glare using low backscattering materials asmask coatings (19–21).
Reflections of Ambient Light.—The reflectionsof ambient light from CRT devices can be repre-sented by the addition of a specular and a diffusecomponent (Fig 4) with different effects on thequality of the image displayed. More generally,reflections have to include a third componentcalled haze, which becomes important in flat-panel displays. Transmission through the face-plate of medical monitors is typically 20%–50%to reduce reflections from ambient light (Fig5). The glass absorption reduces veiling glarethrough dampening optical scattering within thefaceplate (16). Medical monitors of good qualitytypically have a thin-film surface coating that pro-vides conduction (to eliminate static charge andreduce dust collection), abrasion resistance, andantireflective properties. It has also been shownthat antireflective coatings reduce veiling glare inCRTs (22). However, by decreasing the reflectionof incident light, antireflective coatings may in-crease diffuse reflections, since more light entersthe faceplate. The effectiveness of antireflectivecoatings is associated with a compromise between
the specular and diffuse components of ambientlight reflection.
Factors That Affect AMLCD ContrastOwing to the thin faceplate that AMLCD andflat-panel displays in general have, these devicesdo not suffer from veiling glare (23). However, inaddition to display reflectance, the small-spotcontrast (Css) of medical AMLCDs is affected bycrosstalk and, most importantly, by the variationsof luminance at off-normal viewing angles.
Crosstalk.—Crosstalk is a general term used todescribe two phenomena that degrade displaycontrast. On the one hand, optical crosstalk is ashort-range effect with a characteristic distance ofless than 10 pixels. On the other hand, electroniccrosstalk has complex spatial characteristics(13,24) that depend on orientation (vertical vshorizontal wiring scheme). Electronic crosstalk isassociated with unwanted modification of thepixel voltage effectively applied to the liquid crys-tal cell caused by incomplete pixel charging, leak-age currents in the thin-film transistor, and para-sitic capacitive coupling. Accordingly, crosstalk ismore important in large panels with high spatialand gray-scale resolution (25,26). Methods usedfor reducing electronic crosstalk employ modifieddriving techniques to bracket the desired voltageat each individual pixel in the active-matrix array.The effect of crosstalk is seen as a shift in the dis-play pixel luminance in a region where there aresignificant variations in the desired luminanceacross the vertical or horizontal direction.
Figure 6 shows small-spot contrast ratio mea-surements for a variety of medical CRTs andAMLCDs. For a spot size of 10 mm, the mea-sured contrast ratio for CRTs is lower than 100,whereas medical AMLCDs can achieve ratios of800 due to the lack of veiling glare and controlledcrosstalk (Table 2).
Figure 4. Specular and diffuse reflections for a CRT. The thick lines indicate theposition of the electron beam and the luminance that it generates when it impingeson the phosphor layer. The specular reflections occur mostly at the front surface ofthe faceplate. The reflective coating, which is designed primarily to increase thelight output of the phosphor, also increases the diffuse component of the displayreflections.
884 May-June 2004 RG f Volume 24 ● Number 3
Radio
Gra
phic
s
Non-Lambertian Emission.—CRTs, like mostemissive displays (28), emit light in such a waythat the angular luminous intensity approximatelyfollows Lambert’s cosine law. Consequently, thedisplay luminance remains approximately con-stant across all viewing directions, which is a fun-damental property of Lambertian surfaces. How-
ever, this is not the case in AMLCDs (Fig 7). Theluminance and contrast of AMLCDs vary withthe viewing direction. In some AMLCDs, at largeoff-normal angles, the variations can be severeenough to cause an inversion of the gray scale, a
Figure 5. To reduce reflections fromambient light, transmission through thefaceplate of a medical monitor is typi-cally 0.2–0.5. If a transmission of 0.3 isassumed, diffuse reflections are reducedto at least 0.09, resulting in improvedblack levels. The display brightness di-minishes only to 0.3. Absorption alsoreduces veiling glare by dampening thescattering within the faceplate.
Figure 6. Contrast ratio (CR) mea-surements for CRTs and AMLCDs as afunction of the dark spot size. Dashedlines � monochrome CRTs, dottedline � color CRT. (Adapted and re-printed, with permission, from refer-ence 27.)
Figure 7. The light transmission andintensity modulation that occur in anAMLCD result in a non-Lambertianluminous emission from the screen.The electro-optic effect in the liquidcrystal cell that determines the pixelluminance is highly dependent on therelative orientation of the input light(from the backlight) and the liquid crys-tal molecules and polarizer films in theliquid crystal display stack, as well asthe path length associated with eachdirection of emission. I � intensity.
RG f Volume 24 ● Number 3 Badano 885
Radio
Gra
phic
s
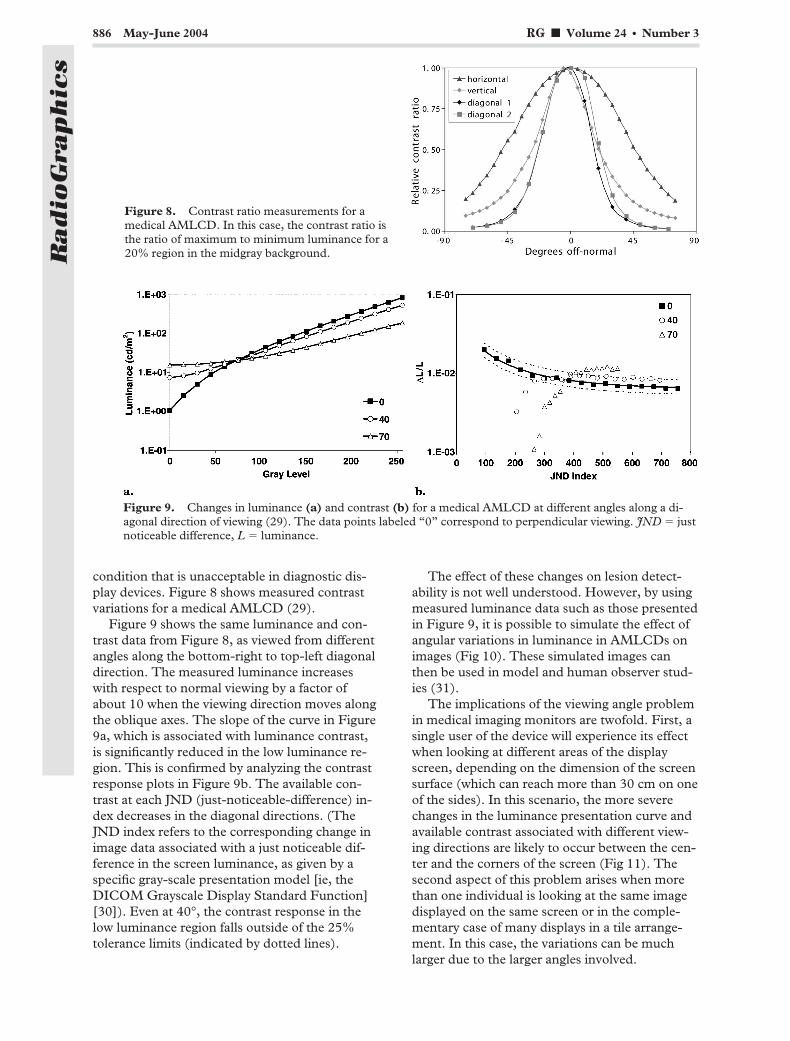
condition that is unacceptable in diagnostic dis-play devices. Figure 8 shows measured contrastvariations for a medical AMLCD (29).
Figure 9 shows the same luminance and con-trast data from Figure 8, as viewed from differentangles along the bottom-right to top-left diagonaldirection. The measured luminance increaseswith respect to normal viewing by a factor ofabout 10 when the viewing direction moves alongthe oblique axes. The slope of the curve in Figure9a, which is associated with luminance contrast,is significantly reduced in the low luminance re-gion. This is confirmed by analyzing the contrastresponse plots in Figure 9b. The available con-trast at each JND (just-noticeable-difference) in-dex decreases in the diagonal directions. (TheJND index refers to the corresponding change inimage data associated with a just noticeable dif-ference in the screen luminance, as given by aspecific gray-scale presentation model [ie, theDICOM Grayscale Display Standard Function][30]). Even at 40°, the contrast response in thelow luminance region falls outside of the 25%tolerance limits (indicated by dotted lines).
The effect of these changes on lesion detect-ability is not well understood. However, by usingmeasured luminance data such as those presentedin Figure 9, it is possible to simulate the effect ofangular variations in luminance in AMLCDs onimages (Fig 10). These simulated images canthen be used in model and human observer stud-ies (31).
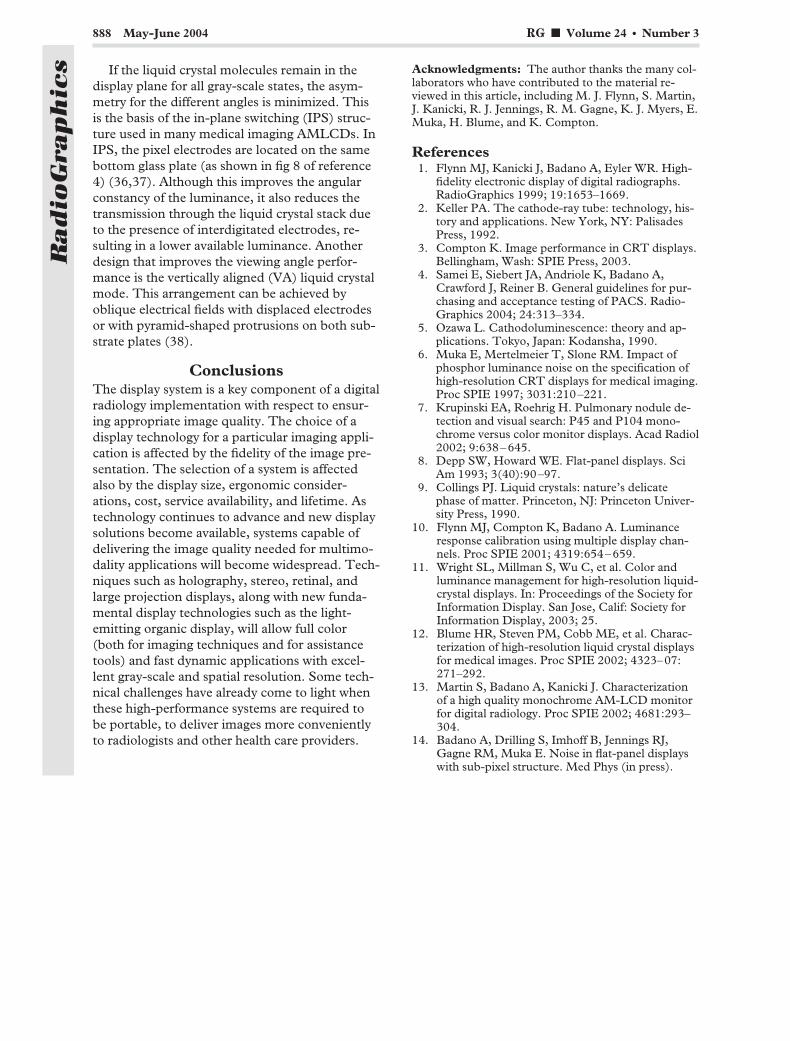
The implications of the viewing angle problemin medical imaging monitors are twofold. First, asingle user of the device will experience its effectwhen looking at different areas of the displayscreen, depending on the dimension of the screensurface (which can reach more than 30 cm on oneof the sides). In this scenario, the more severechanges in the luminance presentation curve andavailable contrast associated with different view-ing directions are likely to occur between the cen-ter and the corners of the screen (Fig 11). Thesecond aspect of this problem arises when morethan one individual is looking at the same imagedisplayed on the same screen or in the comple-mentary case of many displays in a tile arrange-ment. In this case, the variations can be muchlarger due to the larger angles involved.
Figure 8. Contrast ratio measurements for amedical AMLCD. In this case, the contrast ratio isthe ratio of maximum to minimum luminance for a20% region in the midgray background.
Figure 9. Changes in luminance (a) and contrast (b) for a medical AMLCD at different angles along a di-agonal direction of viewing (29). The data points labeled “0” correspond to perpendicular viewing. JND � justnoticeable difference, L � luminance.
886 May-June 2004 RG f Volume 24 ● Number 3
Radio
Gra
phic
s
Several solutions have been developed to com-pensate for the angular variations of the displayluminance. The approaches come from recogniz-ing that the anisotropy of the light modulation isthe dominating factor in defining the viewingangle characteristics of the device. The most com-monly used solutions include compensation films,multiple pixel domains, and modified liquidcrystal alignment modes. In current AMLCDdesigns, many if not all of these classes are com-bined and employed in the same device. The ben-efits of using one of these solutions are com-pounded by the addition of other solutions. How-ever, each of these solutions has drawbacks.Compensation films are designed to compensatefor the anisotropy introduced by the liquid crystalalignment with respect to the different directions
of light transmitted by the cell (32,33). Since thefilms are static in the sense of not being dynami-cally adjustable with the pixel gray level, the com-pensation is optimal only for a single luminancelevel.
The viewing angle of AMLCDs can be signifi-cantly improved by dividing the pixel area intomultiple subpixel domains having different liquidcrystal director orientation. Since each domainhas an asymmetric response as a function of theviewing direction, the net effect is an averageemission, which tends to reduce the luminancevariations with angle (34,35). The main challengeassociated with this technology is the stability ofthe liquid crystal alignment and increased fabrica-tion costs.
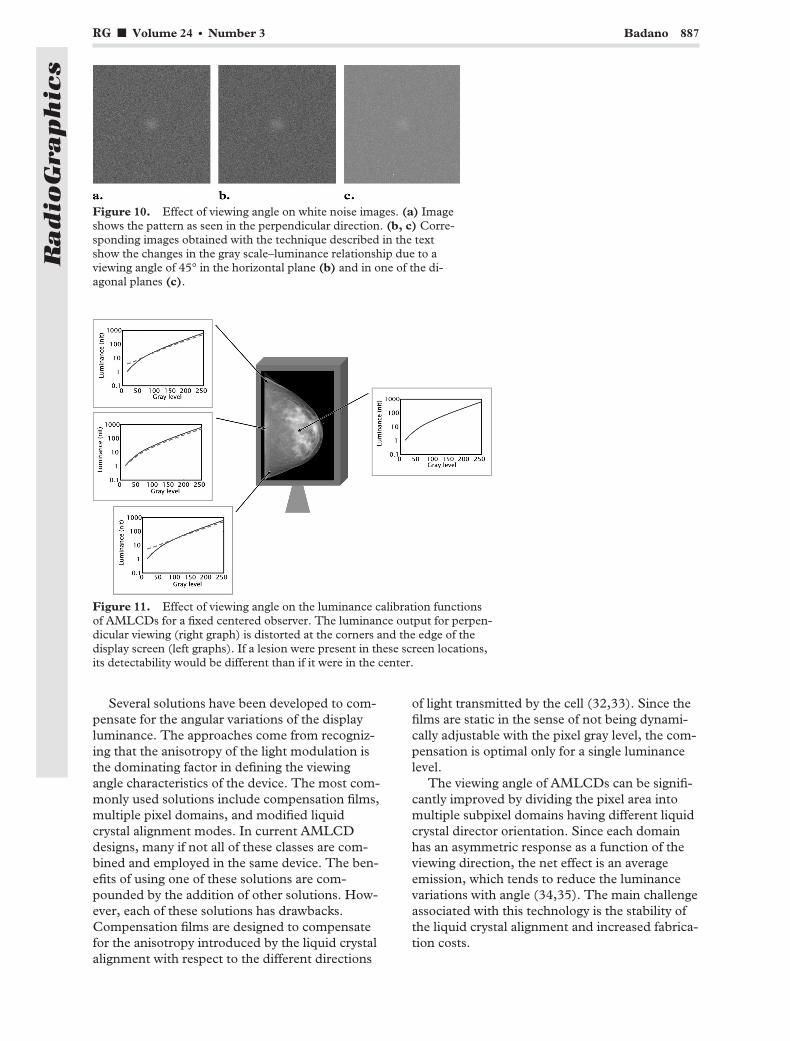
Figure 10. Effect of viewing angle on white noise images. (a) Imageshows the pattern as seen in the perpendicular direction. (b, c) Corre-sponding images obtained with the technique described in the textshow the changes in the gray scale–luminance relationship due to aviewing angle of 45° in the horizontal plane (b) and in one of the di-agonal planes (c).
Figure 11. Effect of viewing angle on the luminance calibration functionsof AMLCDs for a fixed centered observer. The luminance output for perpen-dicular viewing (right graph) is distorted at the corners and the edge of thedisplay screen (left graphs). If a lesion were present in these screen locations,its detectability would be different than if it were in the center.
RG f Volume 24 ● Number 3 Badano 887
Radio
Gra
phic
s
If the liquid crystal molecules remain in thedisplay plane for all gray-scale states, the asym-metry for the different angles is minimized. Thisis the basis of the in-plane switching (IPS) struc-ture used in many medical imaging AMLCDs. InIPS, the pixel electrodes are located on the samebottom glass plate (as shown in fig 8 of reference4) (36,37). Although this improves the angularconstancy of the luminance, it also reduces thetransmission through the liquid crystal stack dueto the presence of interdigitated electrodes, re-sulting in a lower available luminance. Anotherdesign that improves the viewing angle perfor-mance is the vertically aligned (VA) liquid crystalmode. This arrangement can be achieved byoblique electrical fields with displaced electrodesor with pyramid-shaped protrusions on both sub-strate plates (38).
ConclusionsThe display system is a key component of a digitalradiology implementation with respect to ensur-ing appropriate image quality. The choice of adisplay technology for a particular imaging appli-cation is affected by the fidelity of the image pre-sentation. The selection of a system is affectedalso by the display size, ergonomic consider-ations, cost, service availability, and lifetime. Astechnology continues to advance and new displaysolutions become available, systems capable ofdelivering the image quality needed for multimo-dality applications will become widespread. Tech-niques such as holography, stereo, retinal, andlarge projection displays, along with new funda-mental display technologies such as the light-emitting organic display, will allow full color(both for imaging techniques and for assistancetools) and fast dynamic applications with excel-lent gray-scale and spatial resolution. Some tech-nical challenges have already come to light whenthese high-performance systems are required tobe portable, to deliver images more convenientlyto radiologists and other health care providers.
Acknowledgments: The author thanks the many col-laborators who have contributed to the material re-viewed in this article, including M. J. Flynn, S. Martin,J. Kanicki, R. J. Jennings, R. M. Gagne, K. J. Myers, E.Muka, H. Blume, and K. Compton.
References1. Flynn MJ, Kanicki J, Badano A, Eyler WR. High-
fidelity electronic display of digital radiographs.RadioGraphics 1999; 19:1653–1669.
2. Keller PA. The cathode-ray tube: technology, his-tory and applications. New York, NY: PalisadesPress, 1992.
3. Compton K. Image performance in CRT displays.Bellingham, Wash: SPIE Press, 2003.
4. Samei E, Siebert JA, Andriole K, Badano A,Crawford J, Reiner B. General guidelines for pur-chasing and acceptance testing of PACS. Radio-Graphics 2004; 24:313–334.
5. Ozawa L. Cathodoluminescence: theory and ap-plications. Tokyo, Japan: Kodansha, 1990.
6. Muka E, Mertelmeier T, Slone RM. Impact ofphosphor luminance noise on the specification ofhigh-resolution CRT displays for medical imaging.Proc SPIE 1997; 3031:210–221.
7. Krupinski EA, Roehrig H. Pulmonary nodule de-tection and visual search: P45 and P104 mono-chrome versus color monitor displays. Acad Radiol2002; 9:638–645.
8. Depp SW, Howard WE. Flat-panel displays. SciAm 1993; 3(40):90–97.
9. Collings PJ. Liquid crystals: nature’s delicatephase of matter. Princeton, NJ: Princeton Univer-sity Press, 1990.
10. Flynn MJ, Compton K, Badano A. Luminanceresponse calibration using multiple display chan-nels. Proc SPIE 2001; 4319:654–659.
11. Wright SL, Millman S, Wu C, et al. Color andluminance management for high-resolution liquid-crystal displays. In: Proceedings of the Society forInformation Display. San Jose, Calif: Society forInformation Display, 2003; 25.
12. Blume HR, Steven PM, Cobb ME, et al. Charac-terization of high-resolution liquid crystal displaysfor medical images. Proc SPIE 2002; 4323–07:271–292.
13. Martin S, Badano A, Kanicki J. Characterizationof a high quality monochrome AM-LCD monitorfor digital radiology. Proc SPIE 2002; 4681:293–304.
14. Badano A, Drilling S, Imhoff B, Jennings RJ,Gagne RM, Muka E. Noise in flat-panel displayswith sub-pixel structure. Med Phys (in press).
888 May-June 2004 RG f Volume 24 ● Number 3
Radio
Gra
phic
s
15. Badano A, Flynn MJ, Kanicki J. Accurate small-spot luminance measurements. Displays 2002;23:177–182.
16. Badano A, Flynn MJ. A method for measuringveiling glare in high performance display devices.Appl Opt 2000; 39:2059–2066.
17. Martin S, Badano A, Kanicki J. High-resolutionmedical imaging AM-LCD: contrast performanceevaluation. In: Proceedings of the InternationalDisplay Research Conference. San Jose, Calif: So-ciety for Information Display, 2002; 119–122.
18. Flynn MJ, Badano A. Image quality degradationby light scattering in display devices. J Digit Imag-ing 1999; 12:50–59.
19. de Vries GC. Contrast-enhancement under lowambient illumination. In: Proceedings of the Soci-ety for Information Display. San Jose, Calif: Soci-ety for Information Display, 1995; 32–35.
20. van Oekel JJ. Improving the contrast of CRTs un-der low ambient illumination with a graphite coat-ing. In: Proceedings of the Society for InformationDisplay. San Jose, Calif: Society for InformationDisplay, 1995; 427–430.
21. van Oekel JJ, Severens MJ, Timmermans GMH,et al. Improving contrast and color saturation ofCRTs by Al2O3 shadow mask coating. In: Pro-ceedings of the Society for Information Display.San Jose, Calif: Society for Information Display,1997; 436–439.
22. Badano A, Flynn MJ, Muka E, Compton K, Mon-sees T. Veiling glare point-spread function ofmedical imaging monitors. Proc SPIE 1999; 3658:458–467.
23. Badano A, Flynn MJ. Monte Carlo modeling ofthe luminance spread function in flat panel dis-plays. In: Proceedings of the International DisplayResearch Conference. San Jose, Calif: Society forInformation Display, 1997; 382–385.
24. Badano A, Kanicki J. Characterization of crosstalkin high-resolution active-matrix liquid crystal dis-plays for medical imaging. Proc SPIE 2001; 4295:248–253.
25. Libsch FR, Lien A. A compensation drivingmethod for reducing crosstalk in XGA and higher-resolution TFT-LCDs. In: Proceedings of the So-ciety for Information Display. San Jose, Calif: So-ciety for Information Display, 1995; 253–256.
26. Libsch FR, Lien A. Understanding crosstalk inhigh-resolution color thin-film-transistor liquidcrystal displays. IBM J Res Dev 1998; 42:467–479.
27. Badano A. Principles of cathode-ray tube and liq-uid crystal display devices. In: Samei E, Flynn MJ,eds. Syllabus: a categorical course in diagnostic
radiology physics. Oak Brook, Ill: RadiologicalSociety of North America, 2003; 91–102.
28. Lee SJ, Badano A, Kanicki J. Monte Carlo model-ing of organic polymer light-emitting devices onflexible plastic substrates. Proc SPIE 2003; 4800:156–163.
29. Badano A, Flynn MJ, Martin S, Kanicki J. Angu-lar dependence of the luminance and contrast inmedical monochrome liquid crystal displays. MedPhys 2003; 30:2602–2613.
30. Digital Imaging and Communications in Medicine(DICOM), part 3.14: grayscale standard displayfunction. Rosslyn, Va: National Electrical Manu-facturers Association, 1998.
31. Badano A, Gallas BD, Myers KJ, Burgess AE. Ef-fect of viewing angle on visual detection in liquidcrystal displays. Proc SPIE 2003; 5029:474–483.
32. Hoke CD, Mori H, Bos PJ. An ultra-wide-viewingangle STN-LCD with a negative-birefringencecompensation film. In: Proceedings of the Interna-tional Display Research Conference. San Jose,Calif: Society for Information Display, 1997; 21–24.
33. Mori H, Bos PJ. Application of a negative birefrin-gence film to various LCD modes. In: Proceedingsof the International Display Research Conference.San Jose, Calif: Society for Information Display,1997; M88–M97.
34. Nam MS, Wu JW, Choi YJ, et al. Wide-viewing-angle TFT-LCD with photo-aligned four-domainTN mode. In: Proceedings of the Society for In-formation Display. San Jose, Calif: Society for In-formation Display, 1997; 933–936.
35. Chen J, Bos PJ, Bryant DR, et al. Four-domainTN-LCD fabricated by reverse rubbing or doubleevaporation. In: Proceedings of the Society forInformation Display. San Jose, Calif: Society forInformation Display, 1995; 868–871.
36. Masutani Y, Tahata S, Hayashi M, et al. NovelTFT-array structure for LCD monitors with in-plane switching mode. In: Proceedings of the Soci-ety for Information Display. San Jose, Calif: Soci-ety for Information Display, 1997; 15–18.
37. Wakemoto H, Asada S, Kato N, et al. An ad-vanced in-plane switching mode TFT-LCD. In:Proceedings of the Society for Information Dis-play. San Jose, Calif: Society for Information Dis-play, 1997; 929–932.
38. Ohmuro K, Kataoka S, Sasaki T, et al. Develop-ment of super-high-image-quality vertical-align-ment-mode LCD. In: Proceedings of the Societyfor Information Display. San Jose, Calif: Societyfor Information Display, 1997; 845–848.
RG f Volume 24 ● Number 3 Badano 889
Radio
Gra
phic
s
TiTle
a
b
c
d
e
f
g
h
i
j
k
oa
©0
Report of the ACR Task Force onInternational Teleradiology
Arl Van Moore, MDa, Bibb Allen, Jr., MDb, Shannon C. Campbell, MDc,Richard A. Carlson, MDd, N. Reed Dunnick, MDe, Thomas B. Fletcher, MDf,
J. Daniel Hanks, Jr., MDg, J. Bruce Hauser, MDh, James M. Moorefield, MDi,Richard N. Taxin, MDj, James H. Thrall, MDk
Telemedicine is becoming an increasingly important tool in the practice of medicine throughout the world. Forradiologists, telemedicine translates to teleradiology. Because an increasing amount of imaging is now archivedin a digital format, and with the application of more powerful computers in radiology, digital image transmis-sion between display stations is becoming commonplace. The ability to move large diagnostic image data setsto display stations anywhere in the world using the Internet and other high-speed data links is solving someproblems and creating others. Medicine and radiology will be challenged in many ways by the issues createdfrom the application of this burgeoning technology. Our task force was charged with investigating the evolvingpractice of international teleradiology and with developing a pubic statement to be adopted by the ACRCouncil (http://www.acr.org). This white paper is our effort to define those issues we believe to be mostpertinent to international teleradiology as we know them today. Will these issues be changing? Certainly. Forsome facets of the issue, there are currently more questions than answers. We describe several scenarios that webelieve are acceptable practices of international teleradiology as well as some that are not. We believe that muchwill be written about international teleradiology in the future as the issues of credentialing, quality assurance,licensure, American Board of Radiology certification, the maintenance of certification, jurisdictional andmedical liability issues, patient privacy, fraud and medical ethics are more precisely defined and shaped by stateand federal legislation and medical jurisprudence. This white paper is our assessment of what we believe to bethe major challenges that exist as of this writing.
Key Words: International teleradiology
J Am Coll Radiol 2005;2:121-125. Copyright © 2005 American College of Radiology
ht
cnlh
MtsiatoUpt
eleradiology has proved to be a valuable tool in provid-ng access to timely, quality radiologic interpretations.oday, teleradiology has facilitated a unique role in de-
ivering quality radiologic interpretations to hospitalmergency rooms and other health facilities that do not
Charlotte Radiology PA, Charlotte, North Carolina.
Baptist Medical Center-Montclair, Birmingham, Alabama.
University Rochester Medical Center, Rochester, New York.
Suburban Radiologic Consultant Group, Minneapolis, Minnesota.
University of Michigan, Ann Arbor, Michigan.
Austin Radiological Association, Austin, Texas.
Rome Radiology Group, PA, Rome, Georgia.
Radiology Associates of Roanoke, PC, Roanoke, Virginia.
Sacramento Radiological Group, Inc., Sacramento, California.
Crozer Chester Medical Center, Upland, Pennsylvania.
Massachusetts General Hospital, Boston, Massachusetts.
Corresponding author and reprints: Arl Van Moore, MD, Charlotte Radi-logy PA, 1701 East Blvd., Charlotte, NC 28203; e-mail: vanmoore@
uol.com.
2005 American College of Radiology091-2182/05/$30.00 ● DOI 10.1016/j.jacr.2004.08.003
ave access to a radiologist’s contemporaneous interpre-ation in the past.
Although teleradiology has led to an improved level ofare in the United States, the potential use of the tech-ology abroad raises some significant potential chal-
enges to the assurance of high-quality care that patientsave come to expect.During the summer of 2003, E. Stephen Amis, Jr.,D, chair of the ACR Board of Chancellors, convened
he ACR Task Force on International Teleradiology totudy legal, regulatory, reimbursement, insurance, qual-ty assurance, and other issues associated with this newnd emerging practice. The ability of teleradiology toransmit radiologic and other images electronically fromne location to another, outside the borders of thenited States, has made this a prominent issue for therofession and the college. This paper explores some ofhese issues and offers information we hope will prove
seful to radiologists and other health care providers as121
to
S
Idhtfvasq
vtnamtomOrmp
fti
T
Titi
torpprqn
IptelrSpb
rt2ho
loci[itip
AC
Tonwaithmi
(ohwfitpsi
R
TrepUboMpapr
122 Journal of the American College of Radiology/Vol. 2 No. 2 February 2005
hey consider the potential use of international teleradi-logy.
TATE LICENSURE
ndividual states, which have played a historical role inetermining who can appropriately practice medicine,ave generally established that physicians diagnosing andreating patients within their state boundaries need to beully licensed by the states. Licensure represents states’ested interest in regulating the practice of medicine inn effort to provide safeguards for their citizens. Licen-ure establishes a threshold for determining appropriateualifications to practice medicine.
These regulations are formulated in large part to pro-ide some assurance of accountability and quality of pa-ient care in the medical delivery system. A prime ratio-ale is that differences in qualifications between in-statend out-of-state physicians engaged in the practice ofedicine can be problematic. Establishing different
hresholds for diagnosing or treating patients on the basisf modality or site creates an uneven playing field and,ore troubling, the potential for unequal quality of care.pinions rendered by physicians via telemedicine di-
ectly affect care. Physicians rendering these opinionsust be held to at least the same standards as any other
hysician practicing in the licensing state.In considering international telemedicine, these dif-
erences may be further exacerbated when facilities seeko hire physicians who are unknown to the system of caren the United States.
HE ACR AND TELEMEDICINE
he ACR has been quite concerned about issues involv-ng both quality assurance and accountability. In 1994,he ACR Council [1] adopted a resolution addressing thessue of state licensure by stating that
he ACR endorses efforts by state licensing boards to require licensuref out-of-state physicians who provide official authenticated writtenadiological interpretations of examinations that are performed onatients in the licensing state but interpreted in another jurisdiction,rovided that such law or regulation does not restrict the ability ofadiologists to provide second opinion radiological consultations re-uested by physicians in states in which the consulting radiologist isot licensed.
n addition, the ACR Standard on Teleradiology [2]rovides that “physicians who provide the official, au-henticated interpretation of images transmitted by tel-radiology should maintain licensure appropriate to de-ivery of radiologic services at both the transmitting andeceiving sites” (note that the current ACR Technicaltandard on Teleradiology states that “physicians whorovide the official interpretation of images transmitted
y teleradiology should maintain licensure as may be aequired for provision of radiologic service at both theransmitting and receiving sites” [resolution 11, adopted003]). A physician also should be credentialed by andave medical staff privileges at every facility at which her she provides imaging services.
The American Medical Association [3] has adoptedanguage supporting full and unrestricted licensure forut-of-state physicians practicing medicine via telemedi-ine. In addition, several large state medical associations,ncluding those of California [4], Florida [5], and Ohio6], have adopted similar stances. The prospect that themages might be read by physicians who interpret outsidehe United States further erodes the degree of predictabil-ty in the uniform minimal qualifications of the inter-reting physician.
MERICAN BOARD OF RADIOLOGYERTIFICATION
he task force understands that international teleradiol-gy has the potential to improve the quality and timeli-ess of radiology services by providing interpretationshen local physicians performing those services are un-
ble to provide immediate coverage. Physicians perform-ng teleradiology services must have training equivalento those physician providers of imaging services at thatealth care institution receiving these services. Theyust also participate in lifelong learning to maintain
maging skills consistent with the work they perform.Certification by the American Board of Radiology
ABR) is recommended but is only one method of dem-nstrating these skills. The task force believes that theealth care consumer would benefit from knowinghether offshore interpreting physicians are ABR certi-ed. Therefore, when contracting for offshore radiology,here should be full disclosure of ABR status between thearties to the contract. The task force believes that ABRtatus is the most reliable guide to the quality of annterpreting physician.
EIMBURSEMENT
he ACR Task Force on International Teleradiologyecognizes that there is no inherent technological differ-nce between domestically generated teleradiology inter-retations and reports and those generated outside of thenited States (federal law prohibits Medicare from reim-ursing physicians who interpret radiologic studies fromutside the United States; see 42 USC § 1395y[a][4].edicare considers the site of service to be where the
hysician interpreted a study). In both instances, assur-nce of quality and competency is necessary. Therefore,ayment for radiologic interpretations and subsequenteports that are rendered by international teleradiology is
ppropriate if the following criteria are met:
1
2
3
4
5
MI
PtioimfstfitBcheiTAhStacPttprptt
pcmaA
tsifwrtfaaotcntcsc
apncptfpovjEttoc
ndtvwaa
otspr
wbk
Van Moore et al./Report of the ACR Task Force on International Teleradiology 123
. The person interpreting the examination and submit-ting the report to the referring physician are one andthe same,
. the person rendering the report is licensed in the stateand credentialed as a member of the medical staff atthe institution performing the examination and re-ceiving the report,
. the person performing the interpretation and render-ing the report is available for consultation,
. the report meets the guidelines for diagnostic reportsas promulgated by the ACR [7], and
. the ACR Technical Standard for Teleradiology ismet.
EDICAL LIABILITY AND JURISDICTIONALSSUES
hysicians fundamentally need liability insurance for in-ernational imaging interpretations, whether they obtaint through their employers or through contracts withther groups. As with domestic practice, physicians whontend to interpret images from outside the United States
ay have problems in obtaining such insurance. The taskorce members note that physicians providing imagingervices have successfully procured liability insurance,hrough their existing liability insurers, internationalrms such as Lloyds of London, or captive risk groupshat insure both in and outside the United States (J.ruce Hauser, MD, and Richard Taxin, MD, personalommunication). Other insurers, however, reportedlyave either refused to write policies or have limited cov-rage for physicians and their practices that are interpret-ng images overseas or obtaining these overseas services.he task force asked Physician Insurers Association ofmerica (PIAA) companies to specify how they haveandled coverage for teleradiology. One Washingtontate PIAA company reported not receiving any interna-ional teleradiology claims and was not enthusiasticbout addressing them because of uncertain liability andoncerns about inadequate quality (Thomas Kirchmeier,hysicians Insurers, Seattle, WA, personal communica-ion). Another PIAA company based in Boston indicatedhat it lacks any claims experience and might require anyhysician insured to indemnify it against teleradiology-elated liability (Al Alfonso, ProMutual, Boston, MA,ersonal communication). The task force is certain thathis will become an important issue of increasing magni-ude for PIAA companies in the future.
Issues of malpractice insurance coverage are very im-ortant. Conservatively, anyone contracting for out-of-ountry teleradiology should determine who is providingalpractice insurance coverage and in what jurisdiction
ny claims will be brought. If the provider entity is an
merican corporation, it may be in a position to guaran- oee malpractice coverage for its physician employees andhould have obtained written documentation that thensurance carrier is willing to extend insurance coverageor the exact circumstances of the services under contractith the further consent to a US jurisdiction for claims
esolution. However, insurance companies may requirehat physicians agree to help defend themselves to qualifyor contracted coverage. Several physician-owned insur-nce companies indicated that they have had very few, ifny, claims involving imaging interpretations performedutside the United States. If presented with such claims,he companies likely would require their insured physi-ians to indemnify them against liability. There may beo practical way to force an out-of-country provider toravel to the United States to participate in a malpracticease. The company organizing the teleradiology coveragehould address this point regarding its employees in anyontract.
American radiologists and representatives of hospitalsnd imaging practices must understand that physiciansroviding services from outside the United States mayot be under the same direct control of US law or USourts regarding civil proceedings as physicians who arehysically present and have assets in the country. Al-hough physicians outside the United States may beound liable in civil proceedings, from a practical stand-oint, there is no way to guarantee the implementationf such judgments unless the involved party were tooluntarily agree to them or voluntarily travel to a USurisdiction (James Wieland, Esq., and Robert Mazer,sq., Ober Kaler, Baltimore, MD, personal communica-
ion). It is difficult enough to exercise provisions of ex-radition treaties in noncapital criminal matters let alonebtain relief for civil judgments that originate in otherountries.
In situations in which an out-of-country provider isot linked to a US company or other legal entity, juris-iction is more problematic. The same observations per-ain about insurance coverage, but there is even less le-erage to secure participation in claims defense. Yet evenhen explicitly worked out in advance, there is no guar-
ntee of maintaining insurance coverage by a legal entityccessible through US courts.
The strongest jurisdictional leverage in dealing withut-of-country providers is licensure. Breach of contracto provide malpractice insurance coverage or to answerubpoena for testimony may be grounds for license sus-ension and cancellation of hospital credentials. Theseemedies do not address the financial risks.
Physicians or health care organizations contractingith providers of imaging interpretive services providedy physicians outside the United States should keep theseinds of jurisdictional considerations in mind, because
ut-of-country providers will generally be physically and,
ftcm
NA
STsekteRtsHstNNtCrarc
E
TEsS
iiebe
T
G
●
●
●
●
●
●
●
to
1
2
124 Journal of the American College of Radiology/Vol. 2 No. 2 February 2005
or practical purposes, functionally outside the jurisdic-ion of American courts for both civil and criminal pro-eedings except as contracted. Even then, such provisionsay not be enforceable.
ORTH AMERICAN FREE TRADEGREEMENT
ome have questioned whether the North American Freerade Agreement (NAFTA) could preempt US legal
tandards, such as state licensure requirements, that oth-rwise would apply to international teleradiology. Theey question is whether the legal reservation of rights thathe US government exercised under the treaty wouldxtend to “services” such as radiologic interpretations.eservation of rights means that a government may con-
inue to enforce laws and regulations such as licensuretandards if they existed before NAFTA took effect [8].owever, if a state government amended current licen-
ure laws or added new laws after NAFTA implementa-ion, those might represent a “modification” thatAFTA might supersede. It is uncertain whetherAFTA would allow non–North American physicians
o render imaging interpretations from places such asanada or Mexico to avoid US state licensure laws and
egulations. There seems to be no applicable case law ordministrative decisions, so this concern remains theo-etical at this time. The task force and the college willontinue to monitor this issue closely.
THICS ISSUE
he task force requested that the ACR Committee onthics address the ethics of the practice of radiologists
igning reports initially read from outside the Unitedtates. The committee responded that
t is unethical for a radiologist who has not personally interpreted themages obtained in a radiologic examination to sign a report of thatxamination in a manner that causes the reader of that report toelieve that the signing radiologist is the interpreter of thatxamination.
ASK FORCE FINDINGS
eneral Principles
Although international teleradiology is seen as a poten-tial way to improve the current workforce shortage, itis critical that its use not reduce quality patient care.International teleradiology (including qualifications ofpersonnel, equipment specifications, licensing, cre-dentialing, and liability) should be performed consis-tent with the ACR Technical Standard for Teleradiol-ogy.The task force believes that a physician making an
interpretation outside of the country should be appro-priately licensed in the transmitting state, have appro-priate liability insurance, be appropriately creden-tialed, and have membership on the medical staff.Physicians should independently interpret teleradiol-ogy studies that are initially read outside the UnitedStates and provide the official authenticated writtenreports. Any group that obtains final interpretationsfrom overseas should ensure that such physicians pro-viding image interpretation have proper liability cov-erage, state licensure, and credentials.All physicians providing imaging interpretations,based both in the United States and abroad, shouldregularly participate in the on-site quality assuranceprocess and be involved in documenting that process.The quality assurance program must be equivalent toor exceed that of the service hospital.All physicians rendering interpretations on emergentcases should be immediately available for consulta-tions. For nonemergent cases, interpreting physicianseither should be available for consultations or makearrangements to communicate their findings.All physicians who employ or contract with radiolo-gists or radiology group practices to interpret imagingstudies outside the United States are reminded thatsuch an arrangement is subject to US privacy laws andregulations (e.g., the privacy standards of the HealthInsurance Portability and Accountability Act of 1996)and applicable state privacy requirements. Practicesbased in the United States that contract for teleradiol-ogy services should probably expect to be held jointlyresponsible for any violations of this act resulting fromthose services regardless of proximate cause.
The task force reviewed various scenarios to determinehe appropriateness of the use of international teleradiol-gy. They include the following:
. Group lifestyle, whereby a contractual employee(partner or nonpartner) of the group rotates to agroup facility out of the country and provides read-ings at that remote location only for his group. Theremote group member is licensed to practice medicinewithin the state(s) in which the group provides ser-vices and is credentialed in all of the facilities at whichremote interpretive readings (preliminary and/or finalauthenticated reports) are rendered.
. American physicians providing imaging services fromabroad for groups or facilities based in the UnitedStates other than the group that is their primary em-ployer. The physician providing imaging services maybe an employee of a group, as delineated in situation 1above.a. The “group” may contractually link with groups in
their local geographic area to provide interpretive
services. The physicians providing imaging ser-
3
R
1
2
3
4
5
6
7
Van Moore et al./Report of the ACR Task Force on International Teleradiology 125
vices are licensed in the state(s) and credentialed inall facilities to which these services are provided.Example: A large group in a large city has a radiol-ogist rotate to Abu Dhabi on a monthly basis. Theradiologist provides services for all of the facilitieshis group covers and in addition it provides ser-vices to small radiology groups in small communi-ties in counties adjacent to the large city. The taskforce believes this is an acceptable approach for theuse of international teleradiology.
b. The “group” may contractually link with groupsremote to their local geographic area to provideinterpretive services. The physicians providing im-aging services are licensed in the state(s) and cre-dentialed in all facilities to which these services areprovided. Example: A large group in a large cityhas a radiologist rotate to Abu Dhabi on a monthlybasis. The radiologist provides services for all ofthe facilities his group covers and in addition itprovides services to radiology practices through-out the United States, coast to coast. The taskforce believes this is an acceptable approach for theuse of international teleradiology with the follow-ing caveats: (1) the task force would caution thatthe medical liability carrier must provide appro-priate coverage, and (2) the task force would ad-vocate that individuals making interpretationsfrom outside of the country need to participate indocumented ongoing quality assurance programsthat meet or exceed that of the service hospital.
. Physicians providing remote imaging services fromabroad who are employees of a legal entity whose solepurpose is to provide interpretive services to groups orfacilities based in the United States. The entity has norelationship with the groups receiving their servicesother than the contractual one for those services. Insituation 3a below, if international teleradiology isused to render an interpretation, practices shouldconsider whether to and how best to disclose thisinformation to the patient and to the referring physi-cians. In situations 3b and 3c below, if internationalteleradiology is used to render an interpretation, prac-
tices should consider how best to disclose this infor- 8mation to the patient and the referring physicians.Variations include the following:a. A physician providing imaging services is licensed
in the state where the practice of medicine is oc-curring and is credentialed in the facilities receiv-ing the interpretive services. The task force believesthis is an acceptable approach for the use of inter-national teleradiology as long as the radiologist isengaged in appropriately documented quality as-surance and the practice maintains appropriate li-ability coverage.
b. A physician providing imaging services is licensedin the state where the practice of medicine is oc-curring but is not credentialed in the facilities re-ceiving the interpretive services. The task forcebelieves this is not an acceptable approach for theuse of international teleradiology.
c. A physician providing imaging services is not li-censed in the state where the practice of medicineis occurring and is not credentialed in the facilitiesreceiving the interpretive services. The task forcebelieves this is not an acceptable approach for theuse of international teleradiology.
EFERENCES
. American College of Radiology Council. Resolution 26: ACR positionstatement on remote interpretation of radiologic images (resolution 26,1994). ACR Digest Council Actions 2004, p. 98. Reston (VA): AmericanCollege of Radiology.
. American College of Radiology. ACR Standard on Teleradiology: resolu-tion 21, adopted 1994. Reston (VA): American College of Radiology.
. American Medical Association. AMA policy statement H480.969: thepromotion of quality telemedicine (adopted 1996). Chicago: AmericanMedical Association.
. California Medical Association. Recommendation 5 (adopted 1997). Sac-ramento: California Medical Association.
. Florida Medical Association. Resolution 96-9, A-4 on licensure require-ments for telemedicine. Tallahassee: Florida Medical Association.
. Ohio State Medical Association. Amended resolution 26 (adopted 1996)on telemedicine regulation. Hilliard: Ohio State Medical Association.
. American College of Radiology. ACR practice guideline for communica-tion: diagnostic radiology (2003). Reston (VA): American College of Ra-diology.
. Laberge N. Globalization of health care. Can Assoc Radiol J 2002;46:2.
The American College of Radiology, with more than 30,000 members, is the principal organization of radiologists, radiation oncologists, and clinical
medical physicists in the United States. The College is a nonprofit professional society whose primary purposes are to advance the science of radiology,
improve radiologic services to the patient, study the socioeconomic aspects of the practice of radiology, and encourage continuing education for radiologists,
radiation oncologists, medical physicists, and persons practicing in allied professional fields.
The American College of Radiology will periodically define new practice guidelines and technical standards for radiologic practice to help advance the
science of radiology and to improve the quality of service to patients throughout the United States. Existing practice guidelines and technical standards will
be reviewed for revision or renewal, as appropriate, on their fifth anniversary or sooner, if indicated.
Each practice guideline and technical standard, representing a policy statement by the College, has undergone a thorough consensus process in which it
has been subjected to extensive review, requiring the approval of the Commission on Quality and Safety as well as the ACR Board of Chancellors, the ACR
Council Steering Committee, and the ACR Council. The practice guidelines and technical standards recognize that the safe and effective use of diagnostic
and therapeutic radiology requires specific training, skills, and techniques, as described in each document. Reproduction or modification of the published
practice guideline and technical standard by those entities not providing these services is not authorized. 1991 (Res. 5)
Revised 1995 (Res. 10) Revised 1999 (Res. 27) Revised 2001 (Res. 50) Revised 2005 (Res. 11)
Effective 10/01/05
ACR PRACTICE GUIDELINE FOR COMMUNICATION OF DIAGNOSTIC IMAGING FINDINGS PREAMBLE These guidelines are an educational tool designed to assist practitioners in providing appropriate radiologic care for patients. They are not inflexible rules or requirements of practice and are not intended, nor should they be used, to establish a legal standard of care. For these reasons and those set forth below, the American College of Radiology cautions against the use of these guidelines in litigation in which the clinical decisions of a practitioner are called into question. The ultimate judgment regarding the propriety of any specific procedure or course of action must be made by the physician or medical physicist in light of all the circumstances presented. Thus, an approach that differs from the guidelines, standing alone, does not necessarily imply that the approach was below the standard of care. To the contrary, a conscientious practitioner may responsibly adopt a course of action different from that set forth in the guidelines when, in the reasonable judgment of the practitioner, such course of action is indicated by the condition of the patient, limitations on available resources or advances in knowledge or technology subsequent to publication of the guidelines. However, a practitioner who employs an approach substantially different from these guidelines is advised to document in the patient record information sufficient to explain the approach taken. The practice of medicine involves not only the science, but also the art of dealing with the prevention, diagnosis, alleviation, and treatment of disease. The variety and
complexity of human conditions make it impossible to always reach the most appropriate diagnosis or to predict with certainty a particular response to treatment. Therefore, it should be recognized that adherence to these guidelines will not assure an accurate diagnosis or a successful outcome. All that should be expected is that the practitioner will follow a reasonable course of action based on current knowledge, available resources, and the needs of the patient to deliver effective and safe medical care. The sole purpose of these guidelines is to assist practitioners in achieving this objective. I. INTRODUCTION Effective communication is a critical component of diagnostic imaging. Quality patient care can only be achieved when study results are conveyed in a timely fashion to those ultimately responsible for treatment decisions. An effective method of communication should: (a) be tailored to satisfy the need for timeliness, (b) support the role of a diagnostic imager as a physician consultant by encouraging physician to physician communication, and (c) minimize the risk of communication errors. Various factors and circumstances unique to a clinical scenario may influence the methods of communication between diagnostic imagers and referring clinicians. Timely receipt of the report is more important than the method of delivery.
ACR PRACTICE GUIDELINE Communication Diagnostic Imaging / 5
6 / Communication Diagnostic Imaging ACR PRACTICE GUIDELINE
Communication of information is only as effective as the system that conveys the information. There is a reciprocal duty of information exchange. The referring physician or other relevant healthcare provider also shares in the responsibility for obtaining results of imaging studies he or she has ordered. Formulating a comprehensive and tailored imaging interpretation requires the commitment and cooperation of administrators, clinicians, and diagnostic imagers. Whenever possible, previous reports and images should be available for review and comparison with the current study. A request for imaging should include relevant clinical information, a working diagnosis, and/or pertinent clinical signs and symptoms. In addition, including a specific question to be answered can be helpful. Such information helps tailor the most appropriate imaging study to the clinical scenario, enhances the clinical relevance of the report, and thus promotes optimal patient care. II. DIAGNOSTIC IMAGING REPORTS An official interpretation (final report) shall be generated and archived following any examination, procedure, or officially requested consultation regardless of the site of performance (hospital, imaging center, physician office, mobile unit, etc.). A. Components of the Report The following is a suggested format for reporting:
1. Demographics
a. The facility or location where the study was performed.
b. Name of patient and another identifier. c. Name(s) of referring physician(s) or other
healthcare provider(s). If the patient is self referred, that should be stated.
d. Name or type of examination. e. Date of the examination. f. Time of the examination, if relevant (e.g.,
for patients who are likely to have more than one of a given examination per day).
g. Inclusion of the following additional items is encouraged: i. Date of dictation ii. Date and time of transcription iii. Birth date or age iv. Gender
2. Relevant clinical information and ICD-9 code as
available
3. Body of the Report
a. Procedures and materials
The report should include a description of the studies and/or procedures performed and any contrast media (including concentration, volume, and route of administration when applicable), medications, catheters, or devices used, if not recorded elsewhere. Any known significant patient reaction or complication should be recorded.
b. Findings The report should use appropriate anatomic,
pathologic, and radiologic terminology to describe the findings.
c. Potential limitations The report should, when appropriate,
identify factors that may compromise the sensitivity and specificity of the examination.
d. Clinical issues The report should address or answer any
specific clinical questions. If there are factors that prevent answering of the clinical question, this should be stated explicitly.
e. Comparison studies and reports Comparison with relevant examinations and
reports should be part of the radiologic consultation and report when appropriate and available.
4. Impression (conclusion or diagnosis)
a. Unless the report is brief, each report should contain an “impression” section.
b. A precise diagnosis should be given when possible.
c. A differential diagnosis should be rendered when appropriate.
d. Follow-up or additional diagnostic studies to clarify or confirm the impression should be suggested when appropriate.
e. Any significant patient reaction should be reported.
5. Standardized Computer-Generated Template
Reports Standardized computer-generated template reports that satisfy the above criteria are considered to conform to these guidelines.
B. Principles of Reporting (Final Report)
1. The final report is considered to be the definitive means of communicating to the referring physician or other relevant healthcare provider the results of an imaging examination or procedure. Additional methods for
ACR PRACTICE GUIDELINE Communication Diagnostic Imaging / 7
communication of results are encouraged in certain situations.
2. The final report should be proofread to minimize
typographical errors, accidentally deleted words, and confusing or conflicting statements. Use of abbreviations or acronyms should be limited to avoid ambiguity.
3. The final report should be completed in
accordance with appropriate state and federal requirements (see the Final Regulations, Mammography Quality Standards Act for Mammography Reporting). Electronic or rubber-stamp signature devices, instead of a written signature, are acceptable unless contrary to state law, if access to such devices is secure.
4. The final report should be transmitted to the
referring physician or healthcare provider who provides the clinical follow-up in accordance with the appropriate state and federal requirements. The referring physician or other relevant healthcare provider also shares in the responsibility of obtaining results of imaging studies he or she has ordered.
5. When feasible, a copy of the final report should
accompany the transmittal of relevant images to other healthcare professionals.
6. A copy of the final report should be archived by
the imaging facility as part of the patient’s medical record (paper or electronic) and be retrievable for future reference. Retention and distribution of these records should be in accordance with state and federal regulations and facility policies.
C. Communications Other Than the Final Report
1. Preliminary Report A preliminary report precedes the final report
and contains limited information. It may be time sensitive, and it should not be expected to contain all the reportable findings. A preliminary report may not have the benefit of prior imaging studies and/or reports and may be based upon incomplete information due to evolving clinical circumstances. Therefore, its accuracy may be compromised. Nevertheless, clinical decision making may be based on this report due to the need for immediate patient management.
The situations that may require preliminary
reports may include, but are not limited to, the use of teleradiology interpretations provided to
emergency and surgical departments and critical care units, or initial readings provided by trainees.
Preliminary reports may be communicated in
writing, electronically, or verbally, and communication should be documented. These preliminary communications should be reproduced into a permanent format as soon as practical and appropriately labeled as a preliminary report, distinct from the final report, when such a distinction is appropriate.
As soon as possible a change between the
preliminary and final interpretation should be reported in a manner that reliably ensures receipt by the referring or treating physicians, when such changes may impact patient care. Documentation of communication of any discrepancy should be incorporated into the final report.
2. Non-routine Communications
Routine reporting of imaging findings is communicated through the usual channels established by the hospital or diagnostic imaging facility. However, in emergent or other non-routine clinical situations, the diagnosing imager should expedite the delivery of a diagnostic imaging report (preliminary or final) in a manner that reasonably ensures timely receipt of the findings.
a. Situations that may require non-routine
communication include: i. Findings that suggest a need for
immediate or urgent intervention: Generally, these cases may occur in the
emergency and surgical departments or critical care units and may include pneumothorax, pneumoperitoneum, or a significantly misplaced line or tube.
ii. Findings that are discrepant with a
preceding interpretation of the same examination and where failure to act may adversely affect patient health:
These cases may occur when the final
interpretation is discrepant with a preliminary report or when significant discrepancies are encountered upon subsequent review of a study after a final report has been submitted.
iii. Findings that the diagnostic imager
reasonably believes may be seriously

8 / Communication Diagnostic Imaging ACR PRACTICE GUIDELINE
adverse to the patient’s health and are unexpected by the treating or referring physician:
These cases may not require immediate
attention but, if not acted upon, may worsen over time and possibly result in an adverse patient outcome.
b. Documentation of non-routine communica-
tions Diagnostic imagers should document all non-routine communications and include the time and method of communication and specifically name the person to whom the communication was made. The documentation may be placed in the radiology report, the patient’s medical record, and/or in a department log or personal journal. Documentation preserves a history for the purpose of substantiating certain findings or events. Documentation may serve as evidence of such communication, if later contested.
c. Methods of communication
Communication methods are dynamic and varied. It is important, however, that non-routine communications be handled in a manner most likely to reach the attention of the treating or referring physician in time to provide the most benefit to the patient. Communication by telephone or in person to the treating or referring physician or his/her representative is appropriate and confirms receipt of the findings. This may be accomplished directly by the diagnostic imager or when judged appropriate (by the imager) a designee. There are other forms of communication that provide documentation of receipt which may also suffice to demonstrate that the communication has been delivered and acknowledged. While other methods of communication may be considered, including text pager, facsimile, voice messaging and other non-traditional approaches, these methods may not assure receipt of the communication. Therefore, in these instances, the diagnostic imager may consider initiating a system that explicitly requests confirmation of receipt of the report by the clinician. If confirmation or other response is not received within a time appropriate to the diagnosis after the initial communication, a staff person should notify the clinician to document follow-up.
Regardless of the method selected, it must be in compliance with state and federal law.
3. Informal Communications
Occasionally, a diagnostic imager may be asked to provide an interpretation that does not result in a “formal” report but is used to make treatment decisions. Such communications may take the form of a “curbside consult,” a “wet reading” or “informal opinion” that may occur during clinical conferences, interpretations while involved in other activities, or review of an outside study. These circumstances may preclude immediate documentation and may occur in suboptimal viewing conditions without comparison studies or adequate patient history.
Informal communications carry inherent risk,
and frequently the clinician’s documentation of the informal consultation may be the only written record of the communication. Diagnostic imagers who provide consultations of this nature in the spirit of improving patient care are encouraged to document those interpretations. A system for reporting outside studies is encouraged.
III. SELF REFERRED AND THIRD-PARTY REFERRED PATIENTS Most patients evaluated by diagnostic imagers are referred by physicians or physician extenders. Some patients, however, are self-referred, such as for mammography, or are referred by a third party, such as an insurer or employer. A. Self-Referred Patients Diagnostic imagers should recognize that performing imaging studies on self-referred patients establishes a doctor-patient relationship that includes responsibility for communicating the results of imaging studies directly to the patient and arranging for appropriate follow-up. B. Third-Party Referred Patients It is not unusual for patients to be referred for imaging studies by insurance companies, employers, federal benefits programs, and in some instances lawyers. In such cases the reports of the studies are frequently communicated through the requesting entity to a clinician or directly to the third-party-designated clinician. The results of the examinations are then communicated to the patient either directly by the third party or by its designated clinician. Regardless of the source of the referral, the diagnostic imager has an ethical responsibility to ensure communication of unexpected or serious findings to the patient. Therefore, in certain
ACR PRACTICE GUIDELINE Communication Diagnostic Imaging / 9
situations the radiologist may feel it is appropriate to communicate the findings directly to the patient. IV. COMMUNICATION POLICIES An imaging department’s policy on communication can be an effective tool to promote patient care. The policy can provide guidance on the types of communications that are most critical, the individuals responsible for receiving communications and the methods of communication that are most appropriate. To be effective, however, any written policy must be followed and shared with others within the institution where the diagnostic imagers provide their services. As new methods of communication evolve, diagnostic imagers may wish to modify their actions to accommodate these changes while still conforming to the goals of this guideline. ACKNOWLEDGEMENTS This guideline was revised according to the process described in the ACR Practice Guidelines and Technical Standards book by the Guidelines and Standards Committee of the General and Pediatric Radiology Commission and was based on the Report of The Task Force on Diagnostic Reporting. Consultants: David C. Kushner, MD David B. Haseman, MD Cynthia S. Sherry, MD Guidelines and Standards Committee Kimberly E. Applegate, MD, MS, Chair Richard A. Carlson, MD Kevin M. Cawley, MD Ronald E. Cordell, MD Eric N. Faerber, MD Bob W. Gayler, MD Sam Kottamasu, MD Arnold C. Merrow, MD Diane C. Strollo, MC Susan L. Voci, MD Edward Weinberger, MD J. Bruce Hauser, MD, Chair, Commission Comments Reconciliation CommitteeDavid C. Kushner, MD, Co-Chair, CSC Paul A. Larson, MD, Co-Chair, CSC Paul H. Ellenbogen, MD, Speaker Kimberly E. Applegate, MD, MS Raymond E. Bertino, MD Craig E. Clark, MD Seth N. Glick, MD David B. Haseman, MD David A. Rubin, MD Cynthia Sherry, MD
REFERENCES 1. Berlin L. Communicating findings of radiological
examinations: whither goest the radiologist’s duty? AJR 2002; 178:809–815.
2. Berlin L. Comparing new radiographs with those obtained previously. AJR 1999; 172:3–6.
3. Berlin L. Duty to directly communicate radiologic abnormalities: has the pendulum swung too far? AJR 2003; 181:375–381.
4. Berlin L. Pitfalls of the vague radiology report. AJR 2000; 174:1511–1518.
5. Berlin L. Standards, guidelines, and roses. AJR 2003; 181:945–950.
6. Cascade PN, Berlin L. Malpractice issues in radiology. American College of Radiology standard for communication. AJR 1999; 173:1439–1442.
7. Department of Health and Human Services, Food and Drug Administration. Mammography quality standards: final rule. Federal Register Oct 28, 1997; 68:55852–55994.
8. Holman BL, Aliabadi P, Silverman SG, et al. Medical impact of unedited preliminary radiology reports. Radiology 1994; 191:519–521.
9. Kushner DC, Lucey LL. Diagnostic radiology reporting and communication: the ACR guideline. J Am Coll Radiol 2005; 2:15–21.
10. McLoughlin RF, So CB, Gray RR, et al. Radiology reports: how much descriptive detail is enough? AJR 1995; 165:803–806.
11. Physician Insurers Association of America and The American College of Radiology. Practice standards claims survey. Rockville, Md: PIAA, 1997.
12. Seltzer SE, Kelly P, Adams DF, et al. Expediting the turnaround of radiology reports in a teaching hospital setting. AJR 1997; 168:889–893.
Pertinent Legal Cases Involving Communication: Stanley v. McCarver, 92 P.2d 849 (Ariz. 2004) Diaz v. New York Downtown Hospital, 784 N.E.2d 68 (N.Y. 2002) Karpinsky v. Gavich, et al, 23 N.J. Jury Verdict Review & Anal., Vol. 23, Issue 5 (2002) Reed v. Bojarski, 764 A.2d 433 (N.J. 2001) Duckworth v. Lutheran Medical Center, 1995 WL 33070 (Ohio App. 1995) Caracci v. McChesney, 601 N.Y.S.2d 169 (N.Y. App. Div. 1993) Daly v. United States, 946 F.2d 1467 (9th Cir. 1991) Courteau v. Dodd, 773 S.W.2d 436 (Ark. 1989) Jenoff v. Gleason, 521 A.2d 1323 (N.J. App. 1987) Phillips v. Good Samaritan Hospital, 416 N.E.2d 646 (Ohio App. 1979) Merriman v. Toothaker, 515 P.2d 509 (Wash. App. 1973)
ACR PRACTICE GUIDELINE Electronic Practice / 1053
The American College of Radiology, with more than 30,000 members, is the principal organization of radiologists, radiation oncologists, and clinical medical physicists in the United States. The College is a nonprofit professional society whose primary purposes are to advance the science of radiology, improve radiologic services to the patient, study the socioeconomic aspects of the practice of radiology, and encourage continuing education for radiologists, radiation oncologists, medical physicists, and persons practicing in allied professional fields. The American College of Radiology will periodically define new practice guidelines and technical standards for radiologic practice to help advance the science of radiology and to improve the quality of service to patients throughout the United States. Existing practice guidelines and technical standards will be reviewed for revision or renewal, as appropriate, on their fifth anniversary or sooner, if indicated. Each practice guideline and technical standard, representing a policy statement by the College, has undergone a thorough consensus process in which it has been subjected to extensive review, requiring the approval of the Commission on Quality and Safety as well as the ACR Board of Chancellors, the ACR Council Steering Committee, and the ACR Council. The practice guidelines and technical standards recognize that the safe and effective use of diagnostic and therapeutic radiology requires specific training, skills, and techniques, as described in each document. Reproduction or modification of the published practice guideline and technical standard by those entities not providing these services is not authorized.
2007 (Res. 13) Effective 10/01/07
ACR TECHNICAL STANDARD FOR ELECTRONIC PRACTICE OF MEDICAL IMAGING PREAMBLE These guidelines are an educational tool designed to assist practitioners in providing appropriate radiologic care for patients. They are not inflexible rules or requirements of practice and are not intended, nor should they be used, to establish a legal standard of care. For these reasons and those set forth below, the American College of Radiology cautions against the use of these guidelines in litigation in which the clinical decisions of a practitioner are called into question. The ultimate judgment regarding the propriety of any specific procedure or course of action must be made by the physician or medical physicist in light of all the circumstances presented. Thus, an approach that differs from the guidelines, standing alone, does not necessarily imply that the approach was below the standard of care. To the contrary, a conscientious practitioner may responsibly adopt a course of action different from that set forth in the guidelines when, in the reasonable judgment of the practitioner, such course of action is indicated by the condition of the patient, limitations on available resources, or advances in knowledge or technology subsequent to publication of the guidelines. However, a practitioner who employs an approach substantially different from these guidelines is advised to document in the patient record information sufficient to explain the approach taken. The practice of medicine involves not only the science, but also the art of dealing with the prevention, diagnosis, alleviation, and treatment of disease. The variety and complexity of human conditions make it impossible to always reach the most appropriate diagnosis or to predict with certainty a particular response to treatment.
Therefore, it should be recognized that adherence to these guidelines will not assure an accurate diagnosis or a successful outcome. All that should be expected is that the practitioner will follow a reasonable course of action based on current knowledge, available resources, and the needs of the patient to deliver effective and safe medical care. The sole purpose of these guidelines is to assist practitioners in achieving this objective. I. INTRODUCTION Increasingly, medical imaging and patient information are being managed utilizing digital data during acquisition, transmission, storage, display, interpretation, and consultation. The management of these data during each of these operations may have an impact on the quality of patient care. These standards are applicable to any system of digital image data management, from a single-modality or single-use system to a complete picture archiving and communication system (PACS) to the electronic transmission of radiologic images from one location to another for the purposes of interpretation and/or consultation. This standard defines goals, qualifications of personnel, equipment guidelines, specifications of data manipulation and management, and quality control and quality improvement procedures for the use of digital image data that should result in high-quality radiological care. In all cases for which an American College of Radiology (ACR) Practice Guideline or Technical Standard exists for the modality being used or the specific examination
1054 / Electronic Practice ACR PRACTICE GUIDELINE
being performed, that guideline or standard will continue to apply when digital image data management systems are used. A glossary of commonly used terminology (Appendix A) and a reference list are included. II. GOALS The electronic practice of medical imaging is a rapidly evolving technology. New goals will continue to emerge. The goals of the electronic practice of medical imaging include, but are not limited to:
1. Initial acquisition or generation and recording of accurately labeled and identified image data.
2. Transmission of data to an appropriate storage medium from which it can be retrieved for display for formal interpretation, review, and consultation.
3. Retrieval of data from available prior imaging studies to be displayed for comparison with a current study.
4. Transmission of data to remote sites for consultation, review, or formal interpretation.
5. Appropriate compression of image data to facilitate transmission or storage, without loss of clinically significant information.
6. Archiving of data to maintain accurate patient medical records in a form that: a. May be retrieved in a timely fashion. b. Meets applicable facility, state, and federal
regulations. c. Maintains patient confidentiality.
7. Promoting efficiency and quality improvement. 8. Providing interpreted images to referring
providers. 9. Supporting telemedicine by making radiologic
consultations available in medical facilities without on-site radiologic support.
10. Providing supervision of off-site imaging studies.
11. Providing timely availability of radiologic images, image consultation, and image interpretation in emergent and nonemergent clinical care areas by: a. Facilitating radiologic interpretations in on-
call situations. b. Providing subspecialty radiologic support as
needed. 12. Enhancing educational opportunities for
practicing radiologists. 13. Minimizing the occurrence of poor image
quality. Appropriate database management procedures applicable to all of the above should be in place. It is anticipated that the goals of digital image data management will continue to evolve.
III. QUALIFICATIONS AND RESPONSIBILITIES OF PERSONNEL
Qualified personnel trained in the examination to be performed must perform the radiologic examination at the transmitting site. In all cases this means a physician, a licensed and/or registered radiologic technologist, a radiation therapist, a nuclear medicine technologist, or a sonographer. The technologist, radiation therapist, or sonographer must be under the supervision of a qualified licensed physician. It is desirable to have a Qualified Medical Physicist and/or image management specialist as a consultant. A. Physician
1. Physicians utilizing the image data management system for official interpretation1 should understand the basic technology of image acquisition, transmission, manipulation, retrieval, and display, including the strengths, weaknesses, and limitations and who is knowledgeable in the use of the image viewing equipment. Where appropriate, the interpreting physician must be familiar with the principles of radiation protection, the hazards of radiation exposure to both patients and radiological personnel, and patient and personnel monitoring requirements. The physician performing the official interpretation must be responsible for the quality of the images being reviewed and understand the elements of quality control of digital image management systems.2
2. The physician must demonstrate qualifications as delineated in the appropriate ACR guideline or standard for the particular diagnostic modality being interpreted.
3. The physician should have a working knowledge of those portions of the digital image chain from acquisition to display that affect image quality and potential artifact production.
1The ACR Medical Legal Committee defines official interpretation as that written report (and any supplements or amendments thereto) that attach to the patient’s permanent record. In health care facilities with a privilege delineation system, such a written report is prepared only by a qualified physician who has been granted specific delineated clinical privileges for that purpose by the facility’s governing body upon the recommendation of the medical staff. 2The ACR Rules of Ethics state: “It is proper for a diagnostic radiologist to provide a consultative opinion on radiographs and other images regardless of their origin. A diagnostic radiologist should regularly interpret radiographs and other images only when the radiologist reasonably participates in the quality of medical imaging, utilization review, and matters of policy which affect the quality of patient care.”
ACR PRACTICE GUIDELINE Electronic Practice / 1055
B. Qualified Medical Physicist A Qualified Medical Physicist is an individual who is competent to practice independently one or more of the subfields in medical physics. The American College of Radiology considers that certification and continuing education in the appropriate subfield(s) demonstrate that an individual is competent to practice one or more of the subfields in medical physics and to be a Qualified Medical Physicist. The ACR recommends that the individual be certified in the appropriate subfield(s) by the American Board of Radiology (ABR) or for MRI, by the American Board of Medical Physics (ABMP) in magnetic resonance imaging physics. The appropriate subfields of medical physics for this standard are Therapeutic Radiological Physics, Diagnostic Radiological Physics, Medical Nuclear Physics, and Radiological Physics. The continuing education of a Qualified Medical Physicist should be in accordance with the ACR Practice Guideline for Continuing Medical Education (CME) and should include continuing education in radiation dosimetry, radiation protection, and equipment performance related to the use of fluoroscopy. (2006 - ACR Resolution 16g)
C. Registered Radiologist Assistant A registered radiologist assistant is an advanced level radiographer who is certified and registered as a radiologist assistant by the American Registry of Radiologic Technologists (ARRT) after having successfully completed an advanced academic program encompassing an ACR/ASRT (American Society of Radiologic Technologists) radiologist assistant curriculum and a radiologist-directed clinical preceptorship. Under radiologist supervision, the radiologist assistant may perform patient assessment, patient management and selected examinations as delineated in the Joint Policy Statement of the ACR and the ASRT titled “Radiologist Assistant: Roles and Responsibilities” and as allowed by state law. The radiologist assistant transmits to the supervising radiologists those observations that have a bearing on diagnosis. Performance of diagnostic interpretations remains outside the scope of practice of the radiologist assistant. (2006 - ACR Resolution 34) D. Radiologic Technologist
The technologist must:
1. Be certified by the appropriate registry and/or possess unrestricted state licensure.
2. Meet the qualification requirements of any existing ACR guideline or standard for acquisition of a particular examination.
3. Be trained to properly operate those portions of the image data management system with which he or she must routinely interact. This training should include as appropriate: a. Image acquisition technology b. Image processing protocols c. Proper selection of examination specific
options d. Image evaluation e. Radiation dose indicators
E. Electronic/Computer Assistant Assistants should be trained to properly operate those portions of the image data management system with which they must routinely interact. F. Image Management Specialist The image management specialist should be qualified to assess and provide problem-solving input, initiate repair, and coordinate system-wide maintenance programs to assure sustainable high image quality and system function. This individual should also be directly involved with any system expansion programs. This specialist, as well as any necessary support personnel, should be available in a timely manner in case of malfunction to facilitate return to optimal system functionality. IV. EQUIPMENT SPECIFICATIONS Specifications for equipment utilized in digital image data management will vary depending on the application and the individual facility’s needs but in all cases should provide image quality and availability appropriate to the clinical needs whether that need be official interpretation or secondary review. Compliance with the current National Electrical Manufacturers Association (ACR-NEMA) Digital Imaging and Communications in Medicine (DICOM) standard is strongly recommended for all new equipment acquisitions, and consideration of periodic upgrades incorporating the expanding features of that standard should be part of the ongoing quality control program. Compliance with recommendations of the Radiological Society of North America and the “Integrating the Healthcare Enterprise Initiative” (IHE) initiative of the Healthcare Information and Management Systems Society is also strongly recommended for all new equipment acquisitions. These recommendations are embodied in available technical frameworks.
1056 / Electronic Practice ACR PRACTICE GUIDELINE
Display device guidelines are currently divided into two basic categories of digital image data set size when used for rendering the official interpretation: small matrix size (e.g., computed tomography [CT], MRI, ultrasound, nuclear medicine, digital fluorography, and digital angiography), and large matrix size (e.g., digital radiography, computed radiography, digitized radiographic films, and digital mammography). For both small-matrix and large-matrix digital image data, the initial data set should provide full resolution data for processing, manipulation, and subsequent display. Ideally, the image display’s resolution abilities should be at least as good as those of the acquisition matrix.
Small-matrix: the initial digital image data set should provide a minimum of 256 x 256 matrix size at a minimum 10-bit pixel depth for processing, or manipulation with no loss of matrix size or bit depth at display. Large-matrix: the digital image data set should be acquired with a minimum of 2.5 lp/mm spatial resolution at a minimum 10-bit pixel depth. An increased spatial resolution of 5 lp/mm at a minimum 10-bit pixel depth should be considered for pediatric imaging or the imaging of small body parts.
A. Acquisition or Digitization Initial image acquisition should be performed in accordance with the appropriate ACR modality or examination guideline or standard.
1. Direct image capture
The image data set acquired by the digital modality in the full spatial resolution (image matrix size) and pixel bit depth should be transferred to the image management system. It is recommended that the DICOM standard be used. This is the most desirable method of digital image acquisition.
2. Secondary image capture (analog-to-digital conversion)
a. Small-matrix images: Each individual image
should be digitized to a matrix size as large as or larger than that of the original image on the imaging modality. The images should be digitized to a minimum bit depth of 10 bits per pixel or greater. Film digitization or video frame grab systems conforming to the above specifications can be acceptable.
b. Large-matrix images: These images should be digitized to a matrix size corresponding to 2.5 lp/mm or greater in the original
detector plane. These images should be digitized to a minimum bit depth of 10 bits per pixel or greater.
3. General requirements
a. At the time of acquisition (small or large matrix), the system must have capabilities for capturing demographic as well as imaging information such as accession number, patient name, identification number, date and time of examination, name of facility or institution of acquisition, type of examination, patient or anatomic part orientation (e.g., right, left, superior, inferior), amount and method of data compression, and display of the total number of images acquired in the study. This information must be associated with the images when transmitted. These fields should be formatted according to the DICOM standard.
b. The ability to record patient date of birth, sex, and a brief patient history is desirable.
B. Compression Data compression may be performed to facilitate transmission and storage. The type of medical image, the modality, and the objective of the study will determine the degree of acceptable compression. Several methods, including both reversible and irreversible techniques (lossless and lossy are also common terms), may be used under the direction of a qualified physician or practitioner, with minimal if any reduction in clinical diagnostic image quality. If compression is used, algorithms recommended by the DICOM standard such as wavelet or JPEG-2000 compression methods should be used. The types and ratios of compression used for different imaging studies transmitted and stored by the system should be selected and periodically reviewed by the responsible physician to ensure appropriate clinical image quality. Regulatory bodies may require the compression ratio used to be indicated on the compressed image. The Food and Drug Administration (FDA) does not allow compression of digital mammograms at this time for retention, transmission, or final interpretation. C. Transmission The environment in which the studies are to be transmitted will determine the type and specifications of the transmission devices used. In all cases, for official interpretation, the digital data received at the receiving end of any transmission must have negligible if any loss of clinically significant information when compared to uncertainties introduced by the detector and display devices. The transmission system shall have adequate
ACR PRACTICE GUIDELINE Electronic Practice / 1057
error-checking capability. The DICOM Transmission and Storage Standard Digital X-ray Image Information Object and relevant substandards should be used for best practice implementation and incorporated by all digital imaging equipment vendors, as appropriate. D. Display Capabilities
1. Display workstations used for official interpretation for small-matrix and large-matrix systems should be capable of the following:
a. The ratio of the maximum luminance to the
minimum luminance of a display device for images other than mammography should be at least 50. Maximum luminance of the grayscale monitors not used for mammography therefore should be at least 50 foot lamberts (171 cd/m2). The contribution of ambient light reflected from the display surface should be included in luminance measurement considerations since some level of ambient light is always present.
b. Maximum luminance of the grayscale monitors used for mammography should be at least 73 foot lamberts (250 cd/m2), while 131 foot lamberts (450 cd/m2) is recommended for optimized contrast. The contrast response of the display should comply with the AAPM Task Group 18 recommendations. High display contrast ratio with low minimum luminance level (0.5 cd/m²) is most desirable. Contrast response should not deviate from the DICOM Gray-Scale Display Function (GSDF) contrast values by more than 10%. Relative luminance contrast between successive gray levels in relation to the expected DICOM GSDF should vary on average by no more than 1.0 and in no case by more than 2.0.
c. A minimum of 8-bit luminance resolution (bit depth) is required. Nine-bit or higher is recommended if the “for processing” image data is greater than 8 bit. In general, the higher the luminance ratio of the display, the larger the bit-depth resolution that is advised.
d. Selection of image sequence and display format. Hanging protocols should be flexible and tailored to user preferences with proper labeling and orientation of images.
e. Fast and easy navigation between new and old studies should be feasible.
f. Accurately associating the patient and study demographic information with the images of the study performed is essential.
g. Window and level adjustment tools must be available since the full dynamic range of most images cannot be displayed on most digital devices. Preset window/level settings (e.g., bone or lung windows using set lookup table [LUT] transformations) are recommended to increase the speed of user interaction with the display device.
h. Zoom (magnification) and pan functions capable of meeting guidelines for display at the originally acquired spatial resolutions should be used rather than the user moving closer to the display.
i. Rotating or flipping the images, provided labeling of patient orientation is preserved.
j. Calculating and displaying accurate linear measurements and pixel value determinations in values appropriate for the modality (e.g., Hounsfield units for CT images), if those data are available and can be calibrated to the acquisition device.
k. Displaying prior application of irreversible compression ratio, processing, or cropping.
l. The following elements of display information should be available: i. Matrix size should be as close to the
“for processing” image data as possible, or obtainable with magnification (image zoom and pan functionality) without sacrificing too much of the image field of view.
ii. Bit depth should be at least 8 bits. iii. The total number of images acquired in
the study needs to be accessible during interpretation.
iv. Clinically relevant technical parameters should be accessible.
2. The small matrix monitors used for primary
diagnosis should be capable of providing the following elements of display: a. Matrix size should be as close to the “for
processing” image data as possible, or attainable with magnification.
b. Bit depth should be at least 8 bits (higher dynamic range is advisable with higher luminance values).
c. The total number of images acquired in the study needs to be accessible during interpretation.
d. Clinically relevant technical parameters should be accessible.
1058 / Electronic Practice ACR PRACTICE GUIDELINE
3. The large matrix monitors used for primary diagnosis should provide the following elements of display capability: a. A 5 MP (2,048 x 2,560) monitor exceeds the
ACR standard of a displayed resolution of at least 2.5 lp/mm when viewing a 14" x 17" image and thus is sufficient for viewing all types of CR/DR images. The FDA recommends that only monitors that have been cleared for digital mammography use by FDA’s Office of Device Evaluation be used for interpreting digital mammograms.
b. A 2 MP (1,200 x 1,600) or 3 MP (1,535 x 2,048) monitor needs a 2X magnification when viewing 14" x 17" images but no magnification when viewing 8" x 10" image).
c. Similarly, a 1K x 1.2K (1,024 x 1,280) will not permit a 10" x 12", 12" x 14", or a 14" x 17" image with at least 2.5 lp/mm resolution without zooming or magnifying the image. The choice of monitor will be determined by many factors. The display requirements of the monitor will largely be determined by the needs of the clinical task. Of primary importance is the ability of the monitor and video card to display the acquired image at full resolution and adequate bit depth. For monitors that cannot display the full field of view of the acquired image, this requires that the entire image data set be stored by panning a region of interest. Note that this process may not be convenient and may impact the productivity of clinicians.
d. Conform to the current DICOM grayscale display function standard.
e. The MTF at the Nyquist frequency of the display should be greater than 35% as recommended in documents of the American Association of Physicists in Medicine (AAPM) Task Group 18.
f. A display device should not add more than a third of the noise of a typical image, limiting the display relative noise to 0.6% - 0.8%.
g. Veiling glare or the spread of light within the display can reduce contrast. Thus the glare ratio should be greater than 250.
h. Reflections from ambient light sources should be kept at a minimum even when displays have antiglare coatings. Indirect and backlight incandescent lights with dimmer switches rather than fluorescent are recommended. Light colored clothing and lab coats can increase reflections and glare. The intrinsic minimum luminance of the device should not be smaller than the ambient luminance.
i. The color tint of the display (blue, gray, yellow, etc.) is based on user preferences,but should be uniform across the display area and monitor pairs should be matched from the same manufacturing batch.
4. The FDA requires that any electronic device
used within 2.5 meters (about 10.8 feet) or less of a patient must have UL2601 certification.
5. When the display systems are not used for the
official interpretation, they need not meet all the characteristics listed above. Additional display considerations include: a. LCD versus CRT displays with regard to
static and dynamic image display and viewing angle needs and restrictions. i. Flat-surface displays are preferred over those with curved surfaces. ii. On-axis viewing is comparable for
CRTs and LCDs, but off-axis distortions are still possible with many LCDs and should be taken into account when viewing images on LCDs from nonorthogonal angles. Angular performance should not lead to a deviation of the contrast response from the DICOM GSDF by more than 30% within the operating ranges of the viewing angles (<30 degrees usually).
iii. Protective shields on LCDs add to reflections and should not be used if possible.
iv. Both CRT and LCD displays require about 30 minutes of warmup time to reach maximum performance.
b. Monochrome versus color displays with regard to luminance capabilities – Color LCD displays are now approaching the luminance output of grayscale LCD displays with similar grayscale rendition accuracy for 3 megapixel and 2 megapixel display formats, and should be acceptable for use as long as minimum luminance requirements are satisfied and the monitor/video card provides capabilities for DICOM calibration. The user must be aware of the luminance and resolution specifications of any monitor used for primary diagnosis, and validate performance for all imaging and in particular for radiographic modalities (e.g., chest, bone, mammography). i. Color displays are advantageous for
displaying color-encoded functional imaging information from modalities such as positron emission tomography (PET), nuclear medicine (NM), ultrasound (US), and magnetic
ACR PRACTICE GUIDELINE Electronic Practice / 1059
resonance imaging (MRI), as well as 3-D color imaging of volumetric datasets from cross-sectional image stacks.
ii. Emerging guidelines and standards are becoming available for calibrating color displays for grayscale radiographic image presentation, but not definitive recommendations can be made at this time. The DICOM GSDF can be applied to color displays for accurate conformance to grayscale rendition, but the issue of color display calibration is still not fully addressed. Monitors displaying images that require strict color rendition accuracy should have alternate methods of color calibration and testing.
c. Desirable display features include remote performance monitoring, calibration, and quality control.
d. Monitor set matching of contrast ratio, brightness, and color are generally accomplished with the DICOM GSDF, although color does not have a standard calibration method to date that has been accepted by the medical imaging community.
e. Viewing conditions should be optimized by controlling reading room lighting to eliminate reflections on the monitor and lowering the ambient lighting level as much as is feasible.
f. Time to bring an image up on the workstation should be 3 seconds or less for images stored on an internal network with spinning disk storage. Times for other images may take longer depending on the electronic network storage and archive architecture and on image management and retrieval methods.
g. Ergonomic considerations i. With digital display it is necessary to
insure adequate air flow, optimal temperature and humidity control.
ii. Noise considerations (computer fans, for example) are also important to minimize with digital workstations.
iii. Proper chairs with lumbar support and adjustable height controls (including armrests) are recommended to avoid injuries and excessive fatigue. The workstation table should be height adjustable, and the keyboard, mouse, and monitors should be designed to maximize comfort and efficiency.
iv. Dictation tools, internet access, and other reference tools should be readily
accessible and easy to use during image interpretation.
E. Archiving and Retrieval
1. Digital imaging data management systems should provide storage capacity capable of complying with all facility, state, and federal regulations regarding medical record retention. Images stored by either a transmitting or receiving site should meet the jurisdictional requirements of the acquisition and transmitting site. Images interpreted off-site need not be stored at the receiving facility provided they are stored at the transmitting site or its designee. However, if the images are retained at the receiving site, the retention period of that jurisdiction must be met as well. The policy on record retention must be in writing.
2. Each examination data file must have an accurate corresponding patient and examination database record that includes patient name, identification number, accession number, examination date, type of examination, and facility at which the examination was performed. It is desirable that space be available for a brief clinical history.
3. Prior examinations must be retrievable from archives in a time frame appropriate to the clinical needs of the facility and medical staff.
4. Each facility should have policies and procedures for archiving and storage of digital image data equivalent to the policies that currently exist for the protection of hardcopy storage media to preserve imaging records.
5. The exchange of imaging information should be conducted in accordance with the Integrating the Healthcare Enterprise (IHE) initiative through use of current standards developed by DICOM and Health Level Seven (HL7).
F. Security Medical images are subject to U.S. privacy laws such as the Health Insurance Portability and Accountability Act (HIPAA) of 1996 and applicable state privacy requirements. Digital image data management systems should provide network and software security protocols to protect the confidentiality of patients’ identification and imaging data as well as appropriate user accessibility and authentication. There should be measures to safeguard the data and to ensure data integrity against intentional or unintentional corruption of the data. For teleradiology purposes the use of additional software and hardware devices such as virtual private networks may be required to maintain patient privacy.
1060 / Electronic Practice ACR PRACTICE GUIDELINE
G. Reliability and Redundancy For facilities practicing electronic radiology, quality patient care depends on the stability and reliability of the digital image data management system. Written policies and procedures must be in place to ensure continuity of care at a level consistent with those for hard-copy imaging studies and medical records within a facility or institution. They should include internal redundancy systems, backup telecommunication links, and a disaster plan. V. DOCUMENTATION Physicians officially interpreting examinations3 using digital image data management systems should render reports in accordance with the ACR Practice Guideline for Communication of Diagnostic Imaging Findings. If reports are incorporated into the data management system, they should be retrievable with the same conditions of timeliness and security as those for the imaging data. VI. LICENSING, CREDENTIALING, AND
LIABILITY The interpreting physician is responsible for the quality of the images being reviewed.4 Physicians who provide the official interpretation of images transmitted by teleradiology should maintain the licensure required for providing radiologic or telemedicine service at both the transmitting and receiving sites. Physician practicing teleradiology should conduct their practice in a manner consistent with the bylaws, rules, and regulations for patient care at the transmitting site and receiving jurisdiction. Regulations should not restrict the ability of radiologists to provide second opinion consultations when requested in a jurisdiction where the consulting radiologist is not licensed. When interpreting images from a hospital, physicians should be credentialed and obtain appropriate 3The ACR Medical Legal Committee defines official interpretation as that written report (and any supplements or amendments thereto) that attach to the patient's permanent record. In health care facilities with a privilege delineation system, such a written report is prepared only by a qualified physician who has been granted specific delineated clinical privileges for that purpose by the facility's governing body upon the recommendation of the medical staff. 4 The ACR Rules of Ethics state: “it is proper for a diagnostic radiologist to provide a consultative opinion on radiographs and other images regardless of their origin. A diagnostic radiologist should regularly interpret radiographs and other images only when the radiologist reasonably participates in the quality of medical imaging, utilization review, and matters of policy which affect the quality of patient care.”
privileges at that institution. Physicians providing domestic and international teleradiology services should consult with their professional liability carrier to ensure coverage in both the sending and receiving sites (state or jurisdiction). The malpractice insurance coverage and claims jurisdiction should be determined by those contracting to receive teleradiology services. Some states may require specific patient consent for telemedicine consultation. Disclosing the use of international telemedicine to the patient and referring physician should be considered if patient confidentiality is not assured by the international provider. Physicians providing emergency interpretations should be immediately available for consultation. For nonemergent interpretations, the physician should be available for consultation or have a method to communicate and authenticate his or her findings. Images stored at either site should meet the jurisdictional requirements of the transmitting site. Images interpreted off-site need not be stored at the receiving facility, provided they are stored at the transmitting site. However, if images are retained at the receiving site, the retention period of that jurisdiction must be met as well. The policy on record retention should be in writing. Computer aided diagnosis (CAD) systems used to assist primary diagnosis must have FDA approval for the modality utilized. VII. RADIATION SAFETY IN IMAGING Radiologists, medical physicists, radiologic technologists, and all supervising physicians have a responsibility to minimize radiation dose to individual patients, to staff, and to society as a whole, while maintaining the necessary diagnostic image quality. This is the concept “As Low As Reasonably Achievable (ALARA).” Facilities, in consultation with the medical physicist, should have in place and should adhere to policies and procedures, in accordance with ALARA, to vary examination protocols to take into account patient body habitus, such as height and/or weight, body mass index or lateral width. The dose reduction devices that are available on imaging equipment should be active; if not, manual techniques should be used to moderate the exposure while maintaining the necessary diagnostic image quality. Patient radiation doses should be periodically measured by a medical physicist in accordance with the appropriate ACR Technical Standard. (2006 - ACR Resolution 17)

ACR PRACTICE GUIDELINE Electronic Practice / 1061
VIII. QUALITY CONTROL AND IMPROVEMENT, SAFETY, INFECTION CONTROL, AND PATIENT EDUCATION CONCERNS
Policies and procedures related to quality, patient education, infection control, and safety should be developed and implemented in accordance with the ACR Policy on Quality Control and Improvement, Safety, Infection Control, and Patient Education Concerns appearing elsewhere in the ACR Practice Guidelines and Technical Standards book. Any facility using a digital image data management system must have documented policies and procedures for monitoring and evaluating the effective management, safety, and proper performance of acquisition, digitization, processing, compression, transmission, display, archiving, and retrieval functions of the system. The quality control program should be designed to maximize the quality and accessibility of diagnostic information.
1. Performance testing and monitoring of official or primary interpretation display devices should be performed in accordance with any relevant ACR modality accreditation program Quality Control Manual recommendations, the equipment manu-facturer specifications, applicable industry guidelines, and state and federal regulations. In the absence of adequate manufacturer proce-dures, guidelines or standards, the recommendations for the performance evaluation of display devices testing methods and frequencies contained in AAPM Task Group 18: Assessment of Display Performance for Medical Imaging Systems should be followed.
2. Performance testing and monitoring of computed radiography equipment should be performed in accordance with the equipment manufacturer specifications, applicable industry guidelines, and state and federal regulations. In the absence of adequate manufacturer procedures, guidelines or standards, the recommendations for the performance testing methods and frequencies contained in AAPM Task Group Report No. 10: Acceptance Testing and Quality Control of Photostimulable Storage Phosphor Imaging Systems should be followed.
3. As a minimum quality check for acquisition workstation, small matrix, and secondary display devices, a test image, such as the SMPTE test pattern should be captured, transmitted, archived, retrieved, and displayed at appropriate intervals to test the overall operation of the system under conditions that simulate its normal operation. As a spatial resolution test, at least 2.5 lp/mm
resolutions should be confirmed for both small and large-matrix official interpretation. As a test of the display fidelity, SMPTE pattern data files sized to occupy the full area used to display images on the monitor should be displayed. The overall SMPTE image appearance should be inspected to assure the absence of gross artifacts (e.g., blurring or bleeding of bright display areas into dark areas or aliasing of spatial resolution patterns). All display monitors used for primary interpretation should be tested at least monthly. As a dynamic range test, both the 5% and the 95% areas should be seen as distinct from the respective adjacent 0% and 100% areas.
4. Hardcopy imager accuracy and stability testing should also be performed and documented.
5. The viewbox luminance should be sufficient to meet the diagnostic needs of the imaging procedure and applicable industry standards and/or recommendations, when available.
The use of digital imaging and digital image data management systems does not reduce the responsibilities for the management and supervision of radiologic examinations. Locations and physicians providing remote imaging services should participate in a documented ongoing quality assurance program at least equivalent to that of the originating facility. Summaries of the quality control monitoring should be provided to the originating facility ACKNOWLEDGEMENTS This standard was developed according to the process described in the ACR Practice Guidelines and Technical Standards book by the ACR Guidelines and Standards Committee of the Commission on Medical Physics. Principal Drafters: William K. Breeden, III, MS James T. Norweck, MS Guidelines and Standards Committee Nicholas A. Detorie, PhD, Chair Richard A. Geise, PhD, Vice Chair William K. Breeden, III, MS Martin W. Fraser, MS Laurie E. Gaspar, MD, MBA Mahadevappa Mahesh, MS, PhD Tariq A. Mian, PhD James T. Norweck, MS Madeline G. Palisca, MS J. Anthony Seibert, PhD James M. Hevezi, PhD, Chair, Commission Thomas B. Fletcher, MD, Chair, CSC Subcommittee
1062 / Electronic Practice ACR PRACTICE GUIDELINE
REFERENCES 1. Acceptance Testing and Quality Control of
Photostimulable Storage Phosphor Imaging Systems. College Park, Md: American Association of Physicists in Medicine; AAPM Report 10.
2. Ackerman LV, Gitlin JN. ACR-NEMA digital imaging communication standard: demonstration at RSNA ‘92 InfoRAD. Radiology 1992;185:394.
3. Ackerman SJ, Gitlin JN, Gayler RW, Flagle CD, Bryan RN. Receiver operating characteristic analysis of fracture and pneumonia detection: comparison of laser-digitized workstation images and conventional analog radiographs. Radiology 1993;186:263-268.
4. Averch TD, O’Sullivan D, Breitenbach C, et al. Digital radiographic imaging transfer: comparison with plain radiographs. J Endourol 1997;11:99-101.
5. Barnes GT, Morin RL, Staab EV. InfoRAD: computers for clinical practice and education in radiology. Teleradiology: fundamental considerations and clinical applications. Radiographics 1993; 13:673-681.
6. Batnitzky S, Rosenthal SJ, Siegel EL, et al. Teleradiology: an assessment. Radiology 1990;177:11-17
7. Baur HJ, Engelmann U, Saurbier F, Schroter A, Baur U, Meinzer HP. How to deal with security issues in teleradiology. Comput Methods Programs Biomed 1997;53:1-8.
8. Berger SB, Cepelewicz BB. Medical-legal issues in teleradiology. AJR 1996;166:505-510.
9. Bidgood WD Jr, Horii SC. Introduction to the ACR-NEMA DICOM standard. Radiographics 1992;12:345-355.
10. Bidgood WD Jr, Horii SC. Modular extension of the ACR-NEMA DICOM standard to support new diagnostic imaging modalities and services. J Digit Imaging 1996;9:67-77.
11. Blaine GJ, Cox JR Jr, Jost RG. Networks for electronic radiology. Radiol Clin North Am 1996;34:505-524.
12. Bolle SR, Sund T, Stormer J. Receiver operating characteristic study of image preprocessing for teleradiology and digital workstations. J Digit Imaging 1997;10:152-157.
13. Braunschweig R, Klose HJ, Neugebauer E, Busch HP. Digital radiography: results of a survey (part A) and a consensus conference (part B). Eur Radiol 1997;7:94-101.
14. Brenner RJ, Westenberg L. Film management and custody: current and future medicolegal issues. AJR 1996;167:1371-1375.
15. Brody WR, Johnston GS. Computer Applications to Assist Radiology, 11th Symposium for Computer Applications in Radiology. Great Falls, Va: Society for Imaging Informatics in Medicine; 1992.
16. Busch HP. Digital radiography for clinical applications. Eur Radiol 1997;7:66-72.
17. Cawthon MA, Goeringer F, Telepak RJ, et al. Preliminary assessment of computed tomography and satellite teleradiology from Operation Desert Storm. Invest Radiol 1991;26:854-857.
18. Deibel SR, Greenes RA. Radiology systems architecture. Radiol Clin North Am 1996;34:681-696.
19. De Simone DN, Kundel HL, Arenson RL, et al. Effect of a digital imaging network on physician behavior in an intensive care unit. Radiology 1988;169:41-44.
20. Dwyer SJ 3rd. Imaging system architectures for picture archiving and communication systems. Radiol Clin North Am 1996;34:495-503.
21. Dwyer SJ 3rd, Templeton AW, Batnitzky S. Teleradiology: costs of hardware and communications. AJR 1991;156:1279-1282.
22. Franken EA Jr, Berbaum KS. Subspecialty radiology consultation by interactive telemedicine. J Telemed Telecare 1996;2:35-41.
23. Franken EA Jr, Berbaum KS, Smith WL, Chang PJ, Owen DA, Bergus GR. Teleradiology for rural hospitals: analysis of a field study. J Telemed Telecare 1995;1:202-208.
24. Franken EA Jr, Harkens KL, Berbaum KS. Teleradiology consultation for a rural hospital: patterns of use. Acad Radiol 1997;4:492-496.
25. Gitlin JN. Teleradiology. Radiol Clin North Am 1986;24:55-68.
26. Goldberg MA, Rosenthal DI, Chew FS, Blickman JG, Miller SW, Mueller PR. New high-resolution teleradiology system: prospective study of diagnostic accuracy in 685 transmitted clinical cases. Radiology 1993;186:429-434.
27. Goldberg MA. Teleradiology and telemedicine. Radiol Clin North Am 1996;34:647-665.
28. Gray JF, Lisk KG, Haddick DH, Harshbarger JH, Oosterhof A, Schwenker R. Test pattern for video displays and hardcopy cameras. Radiology 1985;154:519-527.
29. Gray JE. Use of the SMPTE test pattern in picture archiving and communication systems. J Digit Imaging 1992;5:54-58.
30. Hassol A, Gaumer G, Irvin C, Grigsby J, Mintzer C, Puskin D. Rural telemedicine data/image transfer methods and purposes of interactive video sessions. J Am Med Inform Assoc 1997;4:36-37.
31. Horii SC. Image acquisition: sites, technologies, and approaches. Radiol Clin North Am 1996;34:469-494.
32. Irreversible Compression of Medical Images. Great Falls, Va: Society for Imaging Informatics in Medicine; 2000.
33. Kalyanpur A, Neklesa VP, Taylor CR, Daftary AR, Brink JA. Evaluation of JPEG and wavelet compression of body CT images for direct digital teleradiologic transmission. Radiology 2000;217:772-779.
34. Kamp GH. Medical-legal issues in teleradiology: a commentary. AJR 1996;166:511-512.
ACR PRACTICE GUIDELINE Electronic Practice / 1063
35. Kehler M, Bengtsson PO, Freitag M, Lindstrom B, Medin J. Teleradiology by two different concepts. Technical note. Acta Radiol 1997;38:338-339.
36. Kelsey CA. A guide to teleradiology systems. Reston, Va: American College of Radiology; 1993.
37. Langlotz CP, Seshadri S. Technology assessment methods for radiology systems. Radiol Clin North Am 1996;34:667-679.
38. Lou SL, Huang HK, Arenson RL. Workstation design: image manipulation, image set handling, and display issues. Radiol Clin North Am 1996;34:525-544.
39. Maldjian JA, Liu WC, Hirschorn D, Murthy R, Semanczuk W. Wavelet transform-based image compression for transmission of MR data. AJR 1997;169:23-26.
40. Martel J, Jimenez MD, Martin-Santos FJ, Lopez-Alonso A. Accuracy of teleradiology in skeletal disorders: solitary bone lesions and fractures. J Telemed Telecare 1995;1:13-18.
41. Nagy P, Siegel E, Hanson T, Kreiner L, Johnson K, Reiner B. PACS reading room design. Semin Roentgenol 2003;38:244-255.
42. Ohgiya Y, Gokan T, Nobusawa H, et al. Acute cerebral infarction: effect of JPEG compression on detection at CT. Radiology 2003;227:124-127.
43. Pierce JR. An introduction to information theory: symbols, signals, and noise. New York, NY: Dover Publications; 1980.
44. Planar Systems, Inc. Stricter medical equipment certification standards improve protection for medical patients and facilities, 2002. Available at http://www.planar.com/Advantages/WhitePapers/docs/Certification%20White%20Paper.pdf. Accessed October 17, 2006.
45. Practice guideline for electronic medical information privacy and security. In: Practice Guidelines and Technical Standards. Reston, Va: American College of Radiology; 2005:549-555.
46. Prokop M, Schaefer-Prokop CM. Digital image processing. Eur Radiol 1997;7:73-82.
47. Reiner BI, Siegel EL. Application service providers: an alternative approach to PACS implementation. J Digit Imaging 2001;14:1-8.
48. Reiner BI, Siegel EL, Siddiqui K. Evolution of the digital revolution: a radiologist perspective. J Digit Imaging 2003;16:324-330.
49. Reiner BI, Siegel EL. The cutting edge: strategies to enhance radiologist workflow in a filmless/paperless imaging department. J Digit Imaging 2002;15:178-190.
50. Reiner BI, Siegel EL, Carrino JA. Workflow optimization: current trends and future directions. J Digit Imaging 2002;15:141-152.
51. Reiner BI, Siegel EL, Carrino JA, Goldburgh MM. SCAR radiologic technologist survey: analysis of the
impact of digital technologies on productivity. J Digit Imaging 2002;15:132-140.
52. Reiner BI, Siegel EL, Carrino JA, McElveny C. SCAR radiologic technologist survey: analysis of technologist workforce and staffing. J Digit Imaging 2002;15:121-131.
53. Reiner BI, Siegel EL, Flagle C, Hooper FJ, Cox RE, Scanlon M. Effect of filmless imaging on the utilization of radiologic services. Radiology 2000;215:163-167.
54. Reiner BI, Siegel EL, Hooper FJ. Accuracy of interpretation of CT scans: comparing PACS monitor displays and hard-copy images. AJR 2002;179:1407-1410.
55. Reiner BI, Siegel EL, Hooper FJ, Pomerantz S, Dahlke A, Rallis D. Radiologists’ productivity in the interpretation of CT scans: a comparison of PACS with conventional film. AJR 2001;176:861-864.
56. Reiner BI, Siegel EL, McKay P. Adoption of alternative financing strategies to increase the diffusion of picture archiving and communication systems into the radiology marketplace. J Digit Imaging 2000;13:108-113.
57. Reiner BI, Siegel EL, Scanlon M. Changes in technologist productivity with implementation of an enterprise wide PACS. J Digit Imaging 2002;15:22-26.
58. Reiner BI, Siegel EL. Technologist’s productivity when using PACS: comparison of film-based versus filmless radiography. AJR 2002;179:33-37.
59. Report of the ACR Task Force on International Teleradiology. J Am Coll Radiol 2005, 2:121-125.
60. Rose A. Vision, human and electronic. New York, NY: Plenum Press; 1973.
61. Samei E, Badano A, Chakraborty D, et al. Assessment of display performance for medical imaging systems. American Association of Physicists in Medicine; AAPM On-Line Report 03; Task Group 18, 2005.
62. Sargent TA, Kay MG, Sargent RG. A methodology for optimally designing console panels for use by a single operator. Hum Factors 1997;39:389-409.
63. Siegel EL, Reiner BI. Electronic teaching files: seven-year experience using a commercial picture archiving and communication system. J Digit Imaging 2001;14:125-127.
64. Siegel EL, Reiner BI. Filmless radiology at the Baltimore VA Medical Center: a 9-year retrospective. Comput Med Imaging Graph 2003;27:101-109.
65. Siegel EL, Reiner BI. Work flow redesign: the key to success when using PACS. AJR 2002;178:563-566.
66. Siegel EL, Channin D, Perry J, Carr C, Reiner B. Medical image resource center 2002: an update on the RSNA’s medical image resource center. J Digit Imaging 2002;15:2-4.
67. Standards on Credentialing and Privileging Requirements Relating to Telemedicine/Contracted
1064 / Electronic Practice ACR PRACTICE GUIDELINE
Services. Oakbrook Terrace, Ill: Joint Commission on Accreditation of Healthcare Organizations.
68. Stewart BK, Aberle DR, Boechat MI, et al. Clinical utilization of grayscale work-stations. IEEE Eng Med Biol 1993:86-102.
69. Stormer J, Bolle SR, Sund T, Weller GE, Gitlin JN. ROC-study of a teleradiology workstation versus film readings. Acta Radiol 1997;38:176-180.
70. Templeton AW, Dwyer SJ 3rd, Rosenthal SJ, Eckard DA, Harrison LA, Cook LT. A dial-up digital teleradiology system: technical considerations and clinical experience. AJR 1991;157:1331-1336.
71. Wang J, Langer S. A brief review of human perception factors in digital displays for picture archiving and communications systems. J Digit Imaging 1997;10:158-168.
72. Whelan LJ. Teleradiology legal issues. J Digit Imaging 1997;10:17-18.
73. Yamamoto LG, Ash KM, Boychuk RB, et al. Personal computer teleradiology interhospital image transmission of neonatal radiographs to facilitate tertiary neonatology telephone consultation and patient transfer. J Perinatol 1996;16:292-298.
74. Yoo SK, Kim SH, Kim NH, Kim YG. Design of an emergency teleradiology system based on progressive transmission. Yonsei Med J 1995;36:426-437.
APPENDIX A
Glossary 1. Analog signal - a form of information transmission in
which the signal varies in a continuous manner and is not limited to discrete steps.
2. Archive - a repository for digital medical images in a picture archiving and communications system (PACS), typically with a specific purpose of providing either short-term or long-term (permanent) storage of images. Erasable or nonerasable media may be utilized in an archive.
3. Baud - the number of events processed in 1 second, usually expressed in bits per second (bps) or kilobits per second (kbps). Typical rates are 14.4 kbps, 28.8 kbps, and 56 kbps.
4. Bit (binary digit) - the smallest unit of digital information that a computing device handles. It represents off or on (0 or 1). All data in computing devices are processed as bits or strings of bits.
5. Bit depth - the number of bits used to encode the signal intensity of each pixel of the image.
6. Bits per second - see throughput, baud. 7. Byte - a grouping of 8 bits used to represent a
character or value. 8. Carrier - see Data carrier. 9. CCD (charge-coupled device) - a photoelectric
device that converts light information into electronic information. CCDs are commonly used in television cameras and image scanners and consist of an array
of sensors that collect and store light as a buildup of electrical charge. The resulting electrical signal can be converted into digital values and processed digitally in a computer to form an image.
10. CCD scanner - a device that uses a CCD sensor to convert film images into electronic data.
11. Clock - a component in a computer’s processor that supplies an oscillating signal used for timing command execution and information handling.
12. Clock speed - the rate at which the clock oscillates or cycles. Clock speed is expressed in MHz, equal to 1 million clock cycles per second.
13. Compression ratio - the ratio of the number of bits in an original image to that in a compressed version of that image. For example, a compression ratio of 2:1 would correspond to a compressed image with one-half the number of bits of the original.
14. Consultation system - a teleradiology system used to determine the completeness of examinations, to discuss findings with other physicians, or for other applications with the knowledge that the original images will serve as the basis for the final official interpretation rendered at some later time by the physician responsible for that report.
15. Co-processor - a device in a computer to which specialized processing operations are delegated, such as mathematical computation or video display. The advantage of a co-processor is that it significantly increases processing speed.
16. CPU (central processing unit) - the device in a computer that performs the calculations. It executes instructions (the program) and performs operations on data.
17. CR (computed radiography) - a system that uses a storage phosphor plate contained in a cassette instead of a film-screen cassette. A laser beam scans the exposed plate to produce the digital data that is then converted into an image.
18. CRT (cathode ray tube) - the monitor or display device in the teleradiology system.
19. Data carrier - the signal that is used to transmit the data. If this signal is not present, there can be no data communication between modems.
20. Data communication - all forms of computer information exchange. Data communication may take place between two computers in the same building via a local area network (LAN), across the country via telephone, or elsewhere by a wide-area network (WAN).
21. Data compression - methods to reduce the data volume by encoding it in a more efficient manner, thus reducing the image processing and transmission times and storage space required. These methods may be reversible or irreversible.
22. Data transfer rate - the speed at which information is transferred between devices, such as a scanner and a computer; between components within a device, such
ACR PRACTICE GUIDELINE Electronic Practice / 1065
as between storage and memory in a computer; or between teleradiology stations.
23. Dedicated line - a telephone line that is reserved for the exclusive use of one customer. It can be used 24 hours a day and usually offers better quality than a standard dial-up telephone line but may not significantly increase the performance of data communication.
24. DICOM (Digital Imaging and Communications in Medicine) - a standard for interconnection of medical digital imaging devices, developed and sponsored by the American College of Radiology and the National Electrical Manufacturers Association, consisting of a standard image format and a standard communications protocol.
25. Digital signal - a form of information transmission in which the signal varies in discrete steps, not in a continuous manner.
26. Digitize - the process by which analog (continuous value) information is converted into digital (discrete value) information. This process is a necessary function for computer imaging applications because visual information is inherently in analog format and most computers use only digital information.
27. Direct image capture – known as digital radiology (DR), the capture or acquisition of digital image data that has been acquired in digital format by an imaging modality. The image produced from the data, regardless of the modality that produced it (CT, MRI, CR, US), should include the full spatial resolution and bit depth of the original.
28. Diskette drive - the device on a computer that can read and write to diskettes. It is used to import and export data.
29. dpi (dots per inch) - while in conventional radiography resolution is commonly expressed in line pairs per millimeter (lp/mm), film digitizer resolution is commonly expressed as dots (pixels) per inch.
30. Dynamic range - the difference in signal intensity, or frequency, between the largest and smallest signals a system can process or display. The optical density is the difference between the lightest and darkest useful regions of the image. Increasing the number of bits per pixel in a digital image increases the dynamic range of the image.
31. File - a set of digital data that have a common purpose, such as an image, a program, or a database.
32. Floppy diskette - a data storage device made of metal-coated plastic that can store computer information and can be physically transported from one place to another. The storage capacity of floppy diskettes is usually in the range of 360 K to 1.5 MB, which is too small to be of use in imaging applications.
33. G (giga) - stands for the number 1 billion. It is used primarily when referring to computer storage
capacities; for example, 1 GB = 1 billion bytes or 1,000 megabytes.
34. Grayscale - the number of different shades of levels of gray that can be stored and displayed by a computer system. The number of gray levels is directly related to the number of bits used in each pixel: 6 bits = 64 gray levels, 7 bits = 128 gray levels, 8 bits = 256 gray levels, 10 bits = 1,024 gray levels, and 12 bits = 4,096 gray levels.
35. Gray-scale monitor - a black-to-white display with varying shades of gray, ranging from several shades to thousands, thus being suitable for use in imaging. This type of monitor also may be referred to as a monochrome display. (See also monochrome monitor)
36. Hard disk drive - an internal computer device used for storage of data.
37. Hardware - a collective term used to describe the physical components that form a computer. The monitor, CPU, disk drives, memory, modem, and other components are all considered hardware. If you can touch it, it is hardware.
38. HIS (hospital information system) - an integrated computer-based system to store and retrieve patient information, including laboratory and radiology reports.
39. IDE (integrated device electronics) - a type of interface used for hard disk drives that integrates the control electronics for the interface on the drive itself. Its purpose is to increase the speed at which information can be transferred between the hard disk and the rest of the computer.
40. IMACS - Image Management and Communication System.
41. Image - a computer’s digital representation of a physical object.
42. Image compression - reduction of the amount of data required to represent an image. Encoding the spatial and contrast information more efficiently or discarding some non-essential information or both accomplishes this.
43. Interface - the connection between two computers or parts of computers. It consists mainly of electronic circuitry.
44. Irreversible compression - some permanent alteration of digital image data. This is sometimes referred to as lossy.
45. ISDN (integrated services digital network) - a switched network with end-to-end digital connection enabling copper wiring to perform functions such as high-speed transmission, which frequently requires higher capacity fiberoptic cable.
46. K (kilo) - stands for the number 1,000. It is used primarily when referring to computer storage and memory capacities: for example, 1 kbps = 1,024 bytes.

1066 / Electronic Practice ACR PRACTICE GUIDELINE
47. LAN (local area network) - computers in a limited area linked by cables that allow the exchange of data.
48. Laser film scanner - a device that uses a laser beam to convert an image on X-ray into digital image data.
49. Leased line - same as a dedicated line. 50. Lossless - see reversible compression. 51. Lossy - see irreversible compression. 52. M (mega) - stands for the number 1 million. It is used
primarily when referring to computer storage and memory capacities: for example, 1 MB = 1 million bytes. 1 MB = 1,024 thousand bytes or 1,000 kbytes.
53. Matrix size: Small - defined as images from CT, MR, ultrasound, nuclear medicine, and digital fluorography. Large - defined as images from digital radiography and digitized radiographic films.
54. Memory - electronic circuitry within a computer that stores information.
55. Modem - a device that converts digital signals from a computer to pulse tone signals for transmission over telephone lines.
56. Monochrome monitor - a computer display in which an image is presented as different shades of gray from black to white. (see also gray-scale monitor).
57. Mouse - an input device that allows the computer user to point to objects on the screen and execute commands.
58. Operating system - software that allocates and manages the resources available within a computer system. UNIX, MS-DOS, Macintosh, and Windows are examples of operating systems.
59. Optical disk - a computer data storage disk used primarily for large amounts (GB) of data.
60. PACS - Picture Archiving and Communication System.
61. Peripheral - a device that is connected to a computer and performs a function. Scanners, mouse pointers, printers, keyboards, and monitors are examples of peripherals.
62. Phosphor - the coating on the inside of a CRT or monitor that produces light when it is struck by an electron beam.
63. Pixel (picture element) - the smallest piece of information that can be displayed on a CRT. It is represented by a numerical code within the computer and displayed on the monitor as a dot of a specific color or intensity. An image is composed of a large array of pixels of differing intensities or colors.
64. Protocol - a set of guidelines by which two different computer devices communicate with each other.
65. RAM (random access memory) - a type of temporary memory in a computer in which programs are run, images are processed, and information is stored. The amount of RAM that a computer requires varies widely depending on the specific application. Information stored in RAM is lost when the power is shut off.
66. Resolution - spatial resolution is the ability to distinguish small objects at high contrast. It is related
to and in some cases limited by the pixel size. Contrast (grayscale) resolution is the ability of a system to distinguish between objects of the same size having different signal intensity. It is related to and in some cases limited by the bit depth.
67. Reversible compression - no alteration of original image information upon reconstruction. This is sometimes referred to as lossless.
68. RIS - radiology information system. 69. Roam and zoom - the ability to select and magnify a
region in the display. 70. ROM (read-only memory) - a permanent memory
which is an integral part of the computer. Programs and information stored in ROM are not lost when the power is removed.
71. SCSI (small computer systems interface) - SCSI is an interface protocol that is used to link dissimilar computer devices so that they can exchange data. SCSI interfaces are most common in image scanners and mass storage devices. This type of interface is well suited for imaging applications.
72. Secondary image capture - the capture in digital format of image data that originally existed in another primary format (e.g., a digital image data file on a CT scanner, or a screen-film radiographic film) through the process of video capture or film digitization.
73. SMPTE - the Society of Motion Picture and Television Engineers.
74. Software - a name given to the programs or sets of programs that are executed on a computer.
75. Tera (T) - stands for approximately 1 trillion (1012). It is used primarily when referring to archive storage capabilities; for example, 1 TB=1 trillion bytes, 1 million MB, or 1,000 GB.
76. Throughput - a measure of the amount of data that is actually being communicated, expressed in bits per second. It is related to the baud rate, but is usually somewhat less in value due to non-ideal circumstances. Typically, modems with higher baud rates can attain a higher throughput.
77. Video capture - the process by which images are digitized directly from the video display console of a modality, such as CT, MRI, or ultrasound. The video signal is converted to a digital signal. This process is more efficient and produces better quality images than scanning films that are produced by the same equipment.
78. Voxel (volume element derived from pixel) - a voxel is a three-dimensional version of a pixel. Voxels are generated by computer-based imaging systems, such as CT and MRI. Using voxels, imaging systems can be reconstructed with three-dimensional simulations of objects.
79. WAN (wide-area network) - a communication system that extends over large distances (covering more than a metropolitan area), often employing multiple communication link technologies such as copper

ACR PRACTICE GUIDELINE Electronic Practice / 1067
wire, coaxial cable, and fiberoptic links. The cost of these WANs is presently dominated by transmission costs.
80. WORM (write once, read many times) - a peripheral memory device that stores information permanently.
AJR:188, January 2007 W1
AJR 2007; 188:W1–W8
0361–803X/07/1881–W1
© American Roentgen Ray Society
W1.fm — 12/7/06
Lester et al.International Interpretation of Teleradiology Images
T h e P r a c t i c e o f R a d i o l og y • O r i g i n a l R e s e a rc h
Referring Physicians’ Attitudes Toward International Interpretation of Teleradiology Images
Neil Lester1,2
Tyler Durazzo1
Alan Kaye3,4
Marilyn Ahl5
Howard P. Forman1,6
Lester N, Durazzo T, Kaye A, Ahl M, Forman HP
Keywords: practice of radiology, teleradiology
DOI:10.2214/AJR.05.1303
Received July 27, 2005; accepted after revision February 14, 2006.
1Department of Diagnostic Radiology, Yale University School of Medicine, New Haven, CT.
2Present address: 43 Boone St., Staten Island, NY 10314. Address correspondence to N. Lester ([email protected]).
3Department of Radiology, Bridgeport Hospital, Bridgeport, CT.
4Advanced Radiology Consultants, LLC, Trumbull, CT.
5Statistical Consultant, Beverly, MA.
6Yale College Department of Economics, Yale School of Management and Yale School of Public Health, New Haven, CT.
WEBThis is a Web exclusive article.
OBJECTIVE. We evaluated referring physician attitudes toward the international interpre-tation of radiologic images.
MATERIALS AND METHODS. A five-question, scenario-based survey describing fea-tures of a hypothetic local radiology firm compared with those of its hypothetic overseas counterpart,international radiology, was sent by mail to 350 physicians from a broad range of medical and surgicalspecialties. One hundred nineteen physicians responded, for a response rate of 34%. Referring phy-sicians were asked to indicate their preference for local versus international interpretation in each sce-nario using a 5-point Likert scale, with a score of –2 indicating a strong preference for internationalservices, 0 indicating no preference, and 2 indicating a strong preference for local services.
RESULTS. When all variables are held to be equal, referring physicians strongly prefer lo-cal services (mean score, 1.77; SD, 0.77). When international teleradiology provides either a2-day faster turnaround time for reports or a $30 lower out-of-pocket cost to the patient, refer-ring physicians still prefer local services, although less than they did with all variables heldequal (mean score, 0.42–0.44; SD, 1.30–1.40). When international teleradiology provides botha 2-day faster turnaround time and a $30 lower out-of-pocket cost to the patient, referring phy-sicians preferred international teleradiology, albeit only slightly (mean, –0.25; SD, 1.50). Fi-nally, when the credentials of the international radiologists are perceived to be less than thoseof the local radiologists, even in the face of faster turnaround time and $30 lower cost to thepatient, referring physicians overall strongly prefer local services (mean, 1.51; SD, 0.86).
CONCLUSION. Referring physicians prefer local interpretation of radiologic images tointernational interpretation when all things are equal. However, the timeliness of image inter-pretation and the cost to the patient are important factors in this decision.
eleradiology is the electronic trans-mission of radiologic images fromone location to another for interpre-tation or consultation [1], and it has
become an increasingly accepted method forproviding service to underserved and remote lo-cations [2–5]. Recent articles have shown thatinternational teleradiology is a potentially effec-tive means to provide nighttime coverage bytaking advantage of the time difference betweenthe United States and other countries, typicallycrossing eight to 16 time zones, substituting aday shift in the interpreting locale for whatwould otherwise be a night shift in the UnitedStates [6]. The clinical feasibility and reliabilityof an international teleradiology staffing modelhave also recently been shown [7].
In order for the international teleradiologymodel to work, acceptance and approval notonly from the radiology community but alsofrom referring physicians and their patients will
be required because other physicians and pa-tients are ultimately the consumers of the radi-ology community’s productivity. To date, littlehas been published on referring physician atti-tudes toward the international interpretation ofradiologic images. In this survey-based study,we examined the attitudes of referring physi-cians toward formal interpretations of non-emergent images via international teleradiol-ogy. This survey did not examine attitudestoward the more common nighthawk scenario,in which international teleradiologists provideinformal preliminary interpretations of emer-gent images during the night followed by for-mal reports by local radiologists in the morning.
Materials and MethodsPhysician Survey
A mail-based survey (Appendix 1) was used toassess referring physicians’ attitudes toward hav-ing their patients’ films interpreted by United
T
Lester et al.
W2 AJR:188, January 2007
W1.fm — 12/7/06
States–based radiologists compared with off-shore, internationally based radiologists. The sur-vey was developed by the authors on the basis ofthose factors that were believed most likely to in-fluence physicians’ views on different locationsfor radiologic services.
The survey consisted of five written scenariosdescribing features of a local radiology firm com-pared with those of its overseas counterpart, “inter-national radiology.” Each scenario included vari-ables that might influence a referring physician’schoice of local versus international radiology ser-vices: out-of-pocket expenses to the patient, turn-around time for generating final reports, and both ofthese elements together. All of the scenarios exceptthe last one, scenario 5, assumed an equivalent levelof training and certification between the local andinternational radiologists, and all provided for fullaccess to radiologists for consultation.
In scenario 1, both costs to patient and turn-around time for final reports are equivalent for bothfirms. In scenario 2, the costs to the patient remainthe same but international radiology provides fasterturnaround time for reports compared with 3 daysfor local. In scenario 3, costs to the patient are lowerfor international radiology compared with local,but report turnaround time is the same for both. Inscenario 4, international radiology provides bothlower out-of-pocket costs and faster turnaroundtime for reports. Finally, in scenario 5, internationalradiology provides both lower out-of-pocket costsand faster turnaround time for reports; however, theradiologists at international radiology are notAmerican-trained or board-certified, although theirwork is supervised by an American-trained radiol-ogist licensed to practice in the survey recipient’sstate, with appropriate credentials to practice in thesurvey recipient’s hospital.
For each scenario, responding physicians wereasked to rate their preference for where they wouldrefer their nonemergent CT cases. Responsesranged on a 5-point Likert scale from –2 to 2. Re-sponse choices were as follows: –2, strongly preferinternational; –1, somewhat prefer international; 0,little or no preference; 1, somewhat prefer local;and 2, strongly prefer local. Finally, the followingdemographic information was requested from therespondents: age, sex, primary specialty, year ofgraduation from medical school, number of yearslived outside the United States, and portion of train-ing received outside of the United States.
ParticipantsSurvey recipients were drawn from three sources:
referring academic physicians in a major universityteaching hospital, referring private practice physi-cians, and referring physicians in a community hos-pital, all located in the same Northeastern geo-
graphic region of the United States. The differencebetween the second and third groups was that theprivate offices of physicians in the third group were10 or fewer miles from the community hospital in-cluded in the study, whereas the private offices ofthe physicians in the second group were more than10 miles from the community hospital included inthe study. There were 350 survey recipients, with113 survey recipients in the academic group, 125 inthe private practice group, and 112 in the commu-nity hospital group.
We used predetermined lists obtained from thecommunity hospital and from the academic medicalcenter. To be included in those lists, a participant hadto have referred a patient to Yale–New Haven Hospitalor Bridgeport Hospital, a Yale affiliate, for at leastone nonemergent CT of the abdomen or pelvis during2003. The community hospital and private practicelists that we obtained contained 112 and 125 physi-cians, respectively, and the university hospital list weobtained contained more than 400 physicians. We in-cluded every physician from the community hospitaland private practice lists because these lists weremuch shorter that the academic medical center list.We included a random sampling from the academiccenter list to arrive at a sample size comparable withthe other two lists.
MethodsBefore initiating the study, we decided that
once a 30% response rate was achieved in eachgroup, the study would be closed. We chose 350participants and a 30% response rate because weestimated that this size study and response ratewould be manageable to perform, given our re-sources, and would still yield significant results.Three separate mailings, between October 2004and January 2005, were required before this goalwas achieved. Because the study remained openfor all three groups until each group had achievedthe minimum response rate, the pooled responserate for the entire sample was ultimately 34% be-cause 119 of the 350 survey recipients responded.Each mailing was identical to the previous mailingin terms of both content and recipients. The onlydifference among mailings was that additionalmailings occurred only if no response had been re-ceived from a given participant.
Exemption from requiring consent from each par-ticipant was granted by the human subjects investi-gation committee. Survey recipients were given theopportunity to indicate whether they would be inter-ested in receiving an abstract once the study wascompleted. In addition, participants were advised oftheir anonymity in a cover letter. To keep track of re-sponses in order to remove respondents from futuremailings, return mailing envelopes were coded. Thecode was used only for removing respondents from
mailings, and all survey recipients were advised ofthis. One author performed data entry and deletion ofdemographic information.
Data Analytic Procedure and StatisticsSurvey data were entered into an SPSS for Win-
dows (version 12.0, SPSS) database. The data werescreened for missing values, outliers, and normalityusing SPSS procedure Frequencies. Most of thevariables were found to be normally distributed,with minimal skewness and kurtosis. The numberof missing values for each variable was minimal(< 0.10 for each variable), and no data imputationswere required.
Data analysis consisted of five phases. Phase 1 ex-amined the characteristics of the entire sample ofphysicians across all three settings. Descriptive sta-tistics were produced using the SPSS Frequenciesprocedure. This provided the means and SDs forcontinuous demographic variables such as physicianage, year medical degree was received, and timespent outside the United States. Frequencies and per-centages were obtained for categoric variables suchas physician sex, medical specialty, and portion oftraining received outside the United States.
Phase 2 compared physician preference for localUnited States–based versus international radiologicservices for the entire pooled sample. Three statisti-cal procedures were used in this analysis. First,means and SDs were obtained for each scenario us-ing the SPSS procedure, Frequencies. Second, theSPSS procedure Paired-Samples Student’s t Tests,was used to determine the overall significance of dif-ferences among the Likert-scale scenarios. Last, theSPSS procedure General Linear Model/Univariatewas used to evaluate the significance of differencesbetween the members of each pair of means.
Before analysis, the magnitude of the mean dif-ferences among all the scenarios was evaluated tolimit the number of tests performed. The criterionfor inclusion in the set of comparisons was based ona mean difference of 0.67 or more between a pair ofmeans. The judgment was made that differences ofthis magnitude would be most likely to produce sta-tistically meaningful results. This criterion was es-tablished to decrease the probability of spurious re-sults (type 1 errors) and, with a Bonferronicorrection applied to each test, to control for theoverall type 1 error rate for the set of tests (family-wise error rate). This procedure is best done whenthe total number of variables tested (i.e., the scenar-ios) is six or fewer [8]. The number of tests for thisanalysis was thus set at five; more specific informa-tion regarding the procedures is found in the rele-vant portion of the Results section.
Phase 3 examined the relationship between onedemographic variable for the entire pooled sample—physician age—and preference for local, United
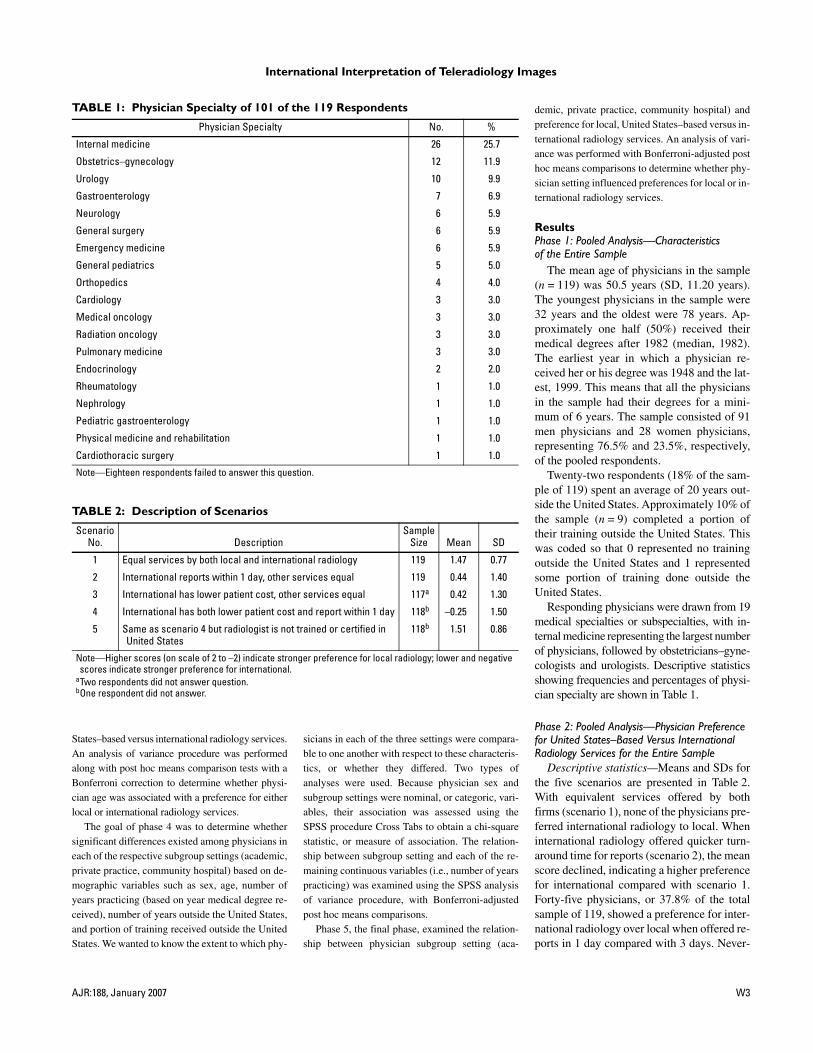
International Interpretation of Teleradiology Images
AJR:188, January 2007 W3
W1.fm — 12/7/06
States–based versus international radiology services.An analysis of variance procedure was performedalong with post hoc means comparison tests with aBonferroni correction to determine whether physi-cian age was associated with a preference for eitherlocal or international radiology services.
The goal of phase 4 was to determine whethersignificant differences existed among physicians ineach of the respective subgroup settings (academic,private practice, community hospital) based on de-mographic variables such as sex, age, number ofyears practicing (based on year medical degree re-ceived), number of years outside the United States,and portion of training received outside the UnitedStates. We wanted to know the extent to which phy-
sicians in each of the three settings were compara-ble to one another with respect to these characteris-tics, or whether they differed. Two types ofanalyses were used. Because physician sex andsubgroup settings were nominal, or categoric, vari-ables, their association was assessed using theSPSS procedure Cross Tabs to obtain a chi-squarestatistic, or measure of association. The relation-ship between subgroup setting and each of the re-maining continuous variables (i.e., number of yearspracticing) was examined using the SPSS analysisof variance procedure, with Bonferroni-adjustedpost hoc means comparisons.
Phase 5, the final phase, examined the relation-ship between physician subgroup setting (aca-
TABLE 1: Physician Specialty of 101 of the 119 Respondents
Physician Specialty No. %
Internal medicine 26 25.7
Obstetrics–gynecology 12 11.9
Urology 10 9.9
Gastroenterology 7 6.9
Neurology 6 5.9
General surgery 6 5.9
Emergency medicine 6 5.9
General pediatrics 5 5.0
Orthopedics 4 4.0
Cardiology 3 3.0
Medical oncology 3 3.0
Radiation oncology 3 3.0
Pulmonary medicine 3 3.0
Endocrinology 2 2.0
Rheumatology 1 1.0
Nephrology 1 1.0
Pediatric gastroenterology 1 1.0
Physical medicine and rehabilitation 1 1.0
Cardiothoracic surgery 1 1.0
Note—Eighteen respondents failed to answer this question.
TABLE 2: Description of Scenarios
ScenarioNo. Description
SampleSize Mean SD
1 Equal services by both local and international radiology 119 1.47 0.77
2 International reports within 1 day, other services equal 119 0.44 1.40
3 International has lower patient cost, other services equal 117a 0.42 1.30
4 International has both lower patient cost and report within 1 day 118b –0.25 1.50
5 Same as scenario 4 but radiologist is not trained or certified in United States
118b 1.51 0.86
Note—Higher scores (on scale of 2 to –2) indicate stronger preference for local radiology; lower and negative scores indicate stronger preference for international.
aTwo respondents did not answer question.bOne respondent did not answer.
demic, private practice, community hospital) andpreference for local, United States–based versus in-ternational radiology services. An analysis of vari-ance was performed with Bonferroni-adjusted posthoc means comparisons to determine whether phy-sician setting influenced preferences for local or in-ternational radiology services.
ResultsPhase 1: Pooled Analysis—Characteristics of the Entire Sample
The mean age of physicians in the sample(n = 119) was 50.5 years (SD, 11.20 years).The youngest physicians in the sample were32 years and the oldest were 78 years. Ap-proximately one half (50%) received theirmedical degrees after 1982 (median, 1982).The earliest year in which a physician re-ceived her or his degree was 1948 and the lat-est, 1999. This means that all the physiciansin the sample had their degrees for a mini-mum of 6 years. The sample consisted of 91men physicians and 28 women physicians,representing 76.5% and 23.5%, respectively,of the pooled respondents.
Twenty-two respondents (18% of the sam-ple of 119) spent an average of 20 years out-side the United States. Approximately 10% ofthe sample (n = 9) completed a portion oftheir training outside the United States. Thiswas coded so that 0 represented no trainingoutside the United States and 1 representedsome portion of training done outside theUnited States.
Responding physicians were drawn from 19medical specialties or subspecialties, with in-ternal medicine representing the largest numberof physicians, followed by obstetricians–gyne-cologists and urologists. Descriptive statisticsshowing frequencies and percentages of physi-cian specialty are shown in Table 1.
Phase 2: Pooled Analysis—Physician Preference for United States–Based Versus International Radiology Services for the Entire Sample
Descriptive statistics—Means and SDs forthe five scenarios are presented in Table 2.With equivalent services offered by bothfirms (scenario 1), none of the physicians pre-ferred international radiology to local. Wheninternational radiology offered quicker turn-around time for reports (scenario 2), the meanscore declined, indicating a higher preferencefor international compared with scenario 1.Forty-five physicians, or 37.8% of the totalsample of 119, showed a preference for inter-national radiology over local when offered re-ports in 1 day compared with 3 days. Never-
Lester et al.
W4 AJR:188, January 2007
W1.fm — 12/7/06
Fig. 1—Graph shows scores (based on Likert scale from 2 to –2) given to each scenario. Higher scores indicate stronger preference for local radiology; lower and negative scores, stronger preference for international radiology. Scenario 1 = equal ser-vices; 2 = international provides report in 1 day, all other services equal; 3 = international pro-vides lower patient cost, all other services equal; 4 = international provides both lower cost and report in 1 day; 5 = same as 4 but differ-ent training and certification.
TABLE 3: Paired Samples Student’s t Tests
Pair Consists of df tobt Mean Difference
1 Scenarios 1 and 2 118 10.02a 1.035a
2 Scenarios 1 and 4 117 14.01a 1.730a
3 Scenarios 2 and 4 115 7.66a 0.696a
4 Scenarios 4 and 5 116 –12.93a –1.791a
5 Scenarios 2 and 5 117 –8.38a 1.096a
Note—df = degrees of freedom, tobt = computed values of Student’s t test.ap < 0.001.
Scenario
Mea
n S
core
–0.5
0.0
0.5
1.0
1.5
2.0
1 2 3 4 5
theless, the mean score of 0.44 still showed anoverall preference for local.
Similarly, when international radiology of-fered lower out-of-pocket costs to patients(scenario 3), the mean score declined to 0.42from 1.47 when services were completelyequal, indicating a higher preference for inter-national radiology as compared with scenario 1.Again, 45 physicians (37.5%) of a total sam-ple of 117 showed some preference for inter-national over local when lower costs to pa-tients were available, even if the turnaroundtimes were equal (3 days). Again, the meanscore of 0.42 still showed an overall prefer-ence for local.
With both faster report time and lowerpatient costs (scenario 4), more than half(55.5%) the physicians (n = 66) of the totalsample of 119 preferred international radiol-ogy, and the mean score tipped in favor of in-ternational. Scenario 4 was the only situationin which the overall preference was for inter-national services. With scenario 5, however,
the preference for international disappeared,with only 6% (n = 7) preferring international,given the differences in training and certifica-tion between the two types of services.
Inferential statistics—To identify possiblesignificant differences among the five scenariomeans, a set of paired-samples Student’s t testswith Bonferroni adjustment was conducted onthose pairs of means for which a difference ofat least 0.67 was identified. Figure 1 graphi-cally depicts the means for all five scenarios sothat the differences among them are evident. Aset of five pairs of means was chosen on thisbasis for statistical analysis. The rationale forthis approach was explained previously in theData Analytic Procedure and Statistics section.The set of comparisons was as follows: pair 1,scenarios 1 and 2: mean difference, 1.035; pair2, scenarios 1 and 4: mean difference; 1.730,pair 3, scenarios 2 and 4: mean difference,0.696; pair 4, scenarios 4 and 5: mean differ-ence, –1.791; and pair 5: scenarios 2 and 5,mean difference, 1.096.
To maintain a familywise error rate of 0.05across all comparisons, a Bonferroni correc-tion was calculated (α = 0.05 / 5 = 0.01). Thisrepresents a more stringent alpha level andmeets the criterion for the Bonferroni in-equality that the overall alpha level for the setof analyses is less than or equal to the sum ofthe alphas for each test. The first two columnsof Table 3 show the results of the paired sam-ples Student’s t tests.
Values of t'crit are critical values of Stu-dent’s t test distribution adjusted to evaluatet'obt (the generic notation for the value ofthe Student’s t statistic obtained in pairedsamples t tests) using Bonferroni’s adjust-ment for multiple comparisons. The tabbed,computed values of the Student’s t test dis-trubution are t'crit [9], which demarcate thesignificance level or rejection level of agiven null hypothesis based on the value oft'obt. The value of t'obt is compared with thatof t'crit, and if t'obt exceeds the tabled valueof t'crit it is concluded that there is a statis-tically significant difference between themeans of the populations from which thesamples were drawn.
Following up this analysis of the overallsignificance of the mean differences foreach pair, SPSS procedure GLM/Univariatewas used to obtain pairwise comparisonsbased on the estimated marginal means.These comparisons assessed the signifi-cance of the magnitude of the difference be-tween each member of a tested pair. Resultsof these tests, with Bonferroni adjustmentfor multiple comparisons, are displayed inthe last column of Table 3. The comparisonsindicate that the size of the difference be-tween each member of a tested pair was sig-nificant at p < 0.001.
These results confirm that preference forinternational services increased significantlyover local, United States–based serviceswhen report turnaround times were faster (1day vs 3 days), and also when internationalservices offered both lower out-of-pocketcosts and faster report turnaround times. Onthe other hand, preferences for local, UnitedStates–based services increased signifi-cantly over preferences for international ser-vices when different levels of prevailedtraining and certification prevailed overseas.Despite quicker report turnaround timesavailable with international services, physi-cians preferred local, United States–basedservices when training and certification lev-els overseas differed from those found in theUnited States.
International Interpretation of Teleradiology Images
AJR:188, January 2007 W5
W1.fm — 12/7/06
Phase 3: Pooled Analysis—Relationship Between Physician Age and Preference for International Versus Local Radiology (Entire Sample)
Issues surrounding the physicians’ agevariable needed to be addressed before thisanalysis could be done. Results of exploratorydata analysis using the SPSS procedure Ex-plore identified 10 outliers that affected thenormality of the physicians’ age variable.(Five of the physicians were age 32 years andfive were 78–80 years.) The Shapiro-Wilknormality statistic (which tests the likelihoodthat the sample came from a normal popula-tion) was significant (0.969, p = 0.008), sig-naling a poor fit of this distribution (i.e., thatit may not have been drawn from a normalpopulation). This situation is sometimes han-dled by dropping outliers from the analysis.With a sample size of 116 (three respondentsdid not provide their age) for this variable,however, dropping 10 respondents wouldhave meant losing about 8% of the sampleand would not have been the optimal solutionto this problem.
We base this argument on our need to en-sure that the preferences of physicians of allages are included in the analysis. By deletingthe outliers, the scope of the analysis wouldhave been narrowed to such a degree that wemight not have been able to generate a com-plete picture of physician preferences acrossall stages of their practice lifetime. Further-more, we wanted to account for any possiblecohort or age effects to which physicians, intheir training, practice, and lifetime experi-ence, may have been subject. These effects in-clude changes in the economic, insurance,and social climates that may result in differ-ences in beliefs and attitudes in physicians atdifferent age levels but which often take yearsto become visible.
Using a continuous variable to representage may not allow us to detect major shifts inattitudes and preferences with a relativelysmall unit of measurement (i.e., a year),whereas a grouped categoric variable may bemore useful in allowing these differences toemerge. Therefore, physician age was catego-rized into the following three-group variable:(32–44 years, n = 41), (45–56 years, n = 39),and (57 years and older, n = 38). Structuringthis categoric variable into three groups of ap-proximately equal size helps to ensure againstany violation of assumptions of equal vari-ance in analysis of variance.
An analysis of variance procedure was per-formed, along with post hoc means compari-son tests using a Bonferroni correction, to de-
termine whether physician age influencedpreferences for international versus local ra-diology. Results of this analysis showed a sig-nificant difference among the three agegroups when a quicker turnaround time for re-ports was available from international ser-vices (scenario 2): Fobt = 3.96, Fcrit.05 = 3.07;df = 2, 115; p = 0.02. Fcrit are the tabled, com-puted values of the F distribution [9], whichdemarcate the significance level or rejectionlevel of a given null hypothesis based on thevalue of Fobt (the value of F obtained in theanalysis of variance.) The value of Fobt iscompared with that of Fcrit, and if Fobt exceedsthe tabled value of F crit it is concluded thatthere is a statistically significant differencebetween the means of the populations fromwhich the samples were drawn.
The Bonferroni-corrected means compar-ison tests revealed that, with quicker turn-around time for reports, physicians 45–56years old showed no preference (mean score[M] = –.0513) in contrast to physicians inthe other two age groups: 32–44 years (M =0.7805) and 57 years and older, (M =0.5789), who showed a moderate preferencefor local. Physicians 45–56 years old scored0.83 lower, however, than their youngercounterparts, indicating a higher preferencefor international radiologists. We were un-able to identify any statistically significantdifferences in preferences among the physi-cians in the three age groups with respect tothe remaining four scenarios.
Phase 4: Subgroup Analysis—Comparing Physicians in Each Setting on the Basis of Demographic Variables
Of the 113 physicians in the academic sam-ple, 36.3% (n = 41) responded; of the 125physicians in the private practice sample,30.4% (n = 38) responded; and of the 112physicians in the community hospital sample,35.7% (n = 40) responded. Data were avail-able for analysis for a total of 119 physicians.
Cross-tabulations analyses (SPSS proce-dure Cross Tabs) were performed to examinethe similarities and differences, if any, amongthe physicians in the three practice settings onthe basis of sex and the categoric age variable.An analysis of variance was used to examinethe relationship between physicians in thethree practice settings and each of the follow-ing three variables: years practicing (sinceyear MD degree was received), number ofyears spent outside the United States, andportion of training received outside theUnited States.
We were unable to identify any statisticallysignificant differences among the physiciansin each of the three settings based on any ofthe demographic variables. For example, theproportions of men and women physicianswere about 75% versus about 25%, respec-tively, across all three subgroups. Of 91 malephysicians, 30 were in each of the private andcommunity samples and 31 in the academicsample. Of 28 female physicians, 10 were inthe academic and community samples andeight in the private practice sample. The per-centages are as follows: academic sample:75.6% men, 24.4% women; community sam-ple: 75.0% men, 25.0% women; and privatepractice sample: 78.9% men, 21.1% women.Furthermore, the percentages of physicianswho lived outside the United States or re-ceived a portion of their training outside theUnited States did not differ significantlyacross each setting.
Phase 5: Subgroup Analysis—Relationship Between Physician Setting and Preference for International Versus Local Radiology
An analysis of variance procedure wasperformed, along with post hoc means com-parison tests (Bonferroni-adjusted), to deter-mine whether physician setting (academic,community hospital, or private practice) in-fluenced preferences for international versuslocal radiology. Results of this analysisshowed a significant difference among phy-sicians in the three settings when serviceswere comparable (scenario 1): (Fobt = 4.26,Fcrit.05 = 3.08; df = 2, 116; p < 0.05) andwhen a quicker turnaround time for reportswas available (scenario 2): (Fobt = 3.18,Fcrit.05 = 3.08; df = 2, 116; p < 0.05).
The post hoc means comparison tests re-vealed that, with both services comparable,academic physicians preferred local (M =1.19) less than did community hospital physi-cians (M = 1.60) and private practice physi-cians (M = 1.63). Academic physicians scored0.41 lower than the community hospital phy-sicians on this measure (with mean differencesignificant at p = 0.05, with Bonferroni ad-justment for multiple comparisons), and theyscored 0.44 lower than private practice physi-cians. With quicker report turnaround time,academic physicians also preferred local(M = 0.0244) significantly less than did com-munity hospital physicians (M = 0.7750);they scored more than 0.75 below the com-munity hospital group. We were unable toidentify any statistically significant differ-ences in preferences among the physicians in
Lester et al.
W6 AJR:188, January 2007
W1.fm — 12/7/06
the three settings with respect to the remain-ing three scenarios.
DiscussionLimitations of the Study
Limitations of this study include its rela-tively small sample size: there were 350 sur-vey recipients and 119 responses were re-ceived. Although this sample was sufficientto provide significant results in the subgroupanalysis and in the demographic variable ofage in the pooled analysis, it was not suffi-cient to provide significant results in any ofthe other demographic variables in thepooled analysis. For example, because fewerthan seven physicians represented several ofthe specialties, physician specialty was notuseful as a predictor in the inferential analy-ses. Similarly, because only 13 physicianshad completed part of their training outsidethe United States, this factor also was notuseful. Replicating this study with a largersample might uncover trends relating to theother demographic variables. For example,physicians in certain specialties might bemore willing to use international servicesthan others, depending on the extent towhich they value or require spoken consulta-tion with radiologists.
Some points should be made regarding thedemographics of the participants themselves.First, it is surprising that, in the absence ofsome selection bias, we should have obtainedsuch nicely balanced demographic sets. Theonly way to account for this would be to takeinto account some predetermined bias inher-ent in our lists because we received them fromthe medical centers. In addition, it seems sur-prising that all of the physicians in the surveyhad been in practice for a minimum of 6years. Two factors are probably at play here:a bias inherent in the lists that we received,and a 2-year delay between selection and sur-vey. Perhaps these institutions or their respec-tive geographic locales tend to have more ex-perienced clinician populations.
Another limitation of this study is the lackof geographic diversity of the sample. Al-though there were three subgroups based onphysician practice setting, nearly all of thephysicians surveyed came from the sameNortheastern geographic location, all withinapproximately a 50-mile (80-km) radius.Therefore, caution should be used in extrapo-lating from these data to the entire U. S. phy-sician population. Replicating this study witha more geographically diverse sample wouldbe instructive.
Finally, although the ideal scenario of thesurvey promised full access to interpretingteleradiologists, it may not be realistic to as-sume that this could always be ensured. Per-haps one could speak with a radiologist, but itis not certain that person would be the onewho interpreted the report. In this sense, thesurvey device may have been inexact in repli-cating the realities of practice conditions.
Physician Preference for United States–Based Versus International Radiology Services for the Entire Sample
Our results show an overall preference forlocal radiologists, which is mitigated by fac-tors such as turnaround time and lower costthat make international services more com-petitive. In addition, in the face of fasterturnaround time for reports and lower costto the patient, referring physicians overallgreatly prefer local radiology providerswhen the credentials of the outsourcing pro-viders are perceived to be less than those ofthe local radiologists. Although it is not cer-tain, it is possible that the non–American-trained, non–American-certified radiologistsmight be inferior to their American-trainedand -certified counterparts in interpretingradiologic images. In addition, geographicdistance prevents an adequate auditing ofthe supervision being provided by theAmerican-trained supervising radiologist.Referring physicians might be concernedthat the American-trained supervising radi-ologist either is not doing his or her job or issimply not capable of keeping up with thesheer volume of films interpreted by his orher employees.
Relationship Between Age in the Entire Sample and Preference for International Versus Local Radiology
Our results showed that, given equivalentlevels of training but nonequivalent servicesin the form of international radiology offer-ing a 2-day faster turnaround time, physi-cians 45–56 years old preferred interna-tional significantly more than physicians ineither of the other two age groups, both theyoungest and the oldest. This suggests thatthere is not a direct relationship betweenyouth and willingness to use this technol-ogy, which might have been otherwise ex-pected. Rather, it seems that the relationshipbetween age and willingness to refer to in-ternational services is multifactorial. Per-haps physicians in the middle age grouppossess a certain comfort with technology
that their older counterparts lack, togetherwith a real-world, practical perspectivebased in extensive experience that theiryounger counterparts lack, allowing them togive greater weight to turnaround time. Thecombination of these two factors may con-tribute to the middle age group’s greaterwillingness to outsource than either of theother two groups.
Relationship Between Physician Setting (Academic, Private Practice, Community Hospital) and Preference for International Versus Local Radiology
With both services and certificationequivalent for local and international radiol-ogy, academic physicians preferred interna-tional over local compared with communityhospital physicians, and they also preferredinternational to local compared with privatepractice physicians. It is tempting to con-clude that this might be due to a differencein personality between academic physiciansand their nonacademic counterparts. Per-haps academics are more curious and adven-turous by temperament and thus show agreater willingness to experiment with thecurrent standard. Perhaps university-basedphysicians are more amenable to teleradiol-ogy because their on-site university locationallows them convenient opportunities to dis-cuss questions with on-site radiologist col-leagues. However, the difference observedhere is more likely the result of previous ex-perience with, or even participation in, tele-radiology at this institution [6–8]. Furtherstudies at different institutions might con-firm this.
In conclusion, this study concentrated onnonemergent, formal interpretations of im-ages by teleradiologists and not on the morecommon nighthawk scenario, in which pre-liminary interpretations of urgent images areprovided by teleradiologists overnight andfollowed by a formal interpretation by localradiologists in the morning. The nighthawkscenario is already standard practice for manyhospitals around the United States. The cur-rent study explores referring physician atti-tudes to the larger, longer-term question ofoutsourcing of even nonemergent image in-terpretation. To the extent that referring phy-sicians represent the gateway to our practices,it is important to interpret their preferencesand to guide practice strategy accordingly. Ifone provides timely high-quality interpreta-tion, the risk of having one’s work outsourcedby fiat is low.
International Interpretation of Teleradiology Images
AJR:188, January 2007 W7
W1.fm — 12/7/06
References1. ACR Standard for Teleradiology. American Col-
lege of Radiology Web site. Available at:
www.acr.org. Accessed June 1, 2005
2. Kiuru MJ, Paakkala TA, Kallio TT, Aalto J, Rajama
M. Effect of teleradiology on the diagnosis, treat-
ment, and prognosis of patients in a primary care
centre. J Telemed Telecare 2002; 8:25–31
3. Hayward T, Mitchell J. The cost-effectiveness of
teleradiology at the Women’s and Children’s Hos-
pital in Adelaide. J Telemed Telecare 2000; 6[suppl
1]:S23–S25
4. Eng J, Mysko WK, Weller GE, et al. Interpretation
of emergency department radiographs: a compari-
son of emergency medicine physicians with radiol-
ogists, residents with faculty, and film with digital
display. AJR 2000; 175:1233–1238
5. Halvorsen PA, Kristiansen IS. Radiology services
for remote communities: cost minimisation study of
telemedicine. BMJ 1996; 312:1333–1336
6. Kalyanpur A, Weinberg J, Neklesa VP, Brink JA,
Forman HP. Emergency radiology coverage: tech-
nical and clinical feasibility of an international tel-
eradiology model. Emerg Radiol 2003; 10:115–118
7. Kalyanpur A, Neklesa VP, Pham DT, Forman HP,
Stein ST, Brink JA. Implementation of an interna-
tional teleradiology staffing model. Radiology
2004; 232:415–419
8. Stevens J. Applied multivariate statistics for the so-
cial sciences, 3rd ed. Mahwah, NJ: Lawrence Er-
lbaum Associates, 1996
9. Howell D. Statistical methods for psychology, 3rd
ed. Belmont, CA: Duxbury Press, 1992
APPENDIX 1: Survey of Physicians re International Interpretation of Teleradiology Images
Start here ➔ Please complete the following scenarios in order and then the important demographic information found below.• Local Radiology is a new private radiology firm located down the street from the hospital where you work.• International Radiology is a new private teleradiology firm located overseas.• The radiologists at both Local and International are American-trained, board-certified, and are licensed to practice in your state. They have
the same credentials for practicing in your hospital. In addition, they have the same levels of training and are required to complete the samelevel and amount of continuing medical education.
• You must refer for non-emergent CT interpretation to either Local or International.
Scenario #1:Both Local and International provide their services at a cost of $50 out-of-pocket to your patient, and both will have a final report in your
hand within 3 days. Furthermore, anytime you wish to contact a radiologist to speak about a report, both firms will have one available.
Scenario #2:Both Local and International provide their services at a cost of $50 out-of-pocket to your patient. Furthermore, anytime you wish to contact
a radiologist to speak about a report, both firms will have one available.Local will have a final report in your hand within 3 days. International will have a final report in your hand within 1 day.
Scenario #3:Local provides its services at a cost of $50 out-of-pocket to your patient. International costs $20 out-of-pocket.Both provide full access to radiologists for consultation, and both will have a finalized report to you in 3 days.
Where will you refer your non-emergent cases? (Circle one.)
Strongly prefer Somewhat prefer Little or no Somewhat prefer Strongly preferLocal Local preference International International
Where will you refer your non-emergent cases? (Circle one.)
Strongly prefer Somewhat prefer Little or no Somewhat prefer Strongly preferLocal Local preference International International
Where will you refer your non-emergent cases? (Circle one.)
Strongly prefer Somewhat prefer Little or no Somewhat prefer Strongly preferLocal Local preference International International
Lester et al.
W8 AJR:188, January 2007
W1.fm — 12/7/06
Scenario #4:Local provides its services at a cost of $50 out-of-pocket to your patient and will have a finalized report to you in 3 days.International provides its services at a cost of $20 out-of-pocket and will have a finalized report to you in 1 day.Both provide full access to radiologists for consultation.
Scenario #5:The radiologists at Local are American-trained, board-certified, and are licensed to practice in your state. They are credentialed to practice
in your hospital.The radiologists at International are trained in their home country and are not American-trained or board-certified. Their work is supervised
by an American-trained, board-certified radiologist who is licensed to practice in your state and credentialed to practice in your hospital. Thissupervising radiologist completes the same level and amount of continuing medical education as the radiologists at Local.
Local provides its services at a cost of $50 out-of-pocket to your patient and will have a finalized report to you in 3 days.International provides its services at a cost of $20 out-of-pocket and will have a finalized report to you in 1 day.Both provide full access to radiologists for consultation.
Demographics:Please indicate your age: ________Please circle your gender: male femaleWhat is your primary specialty? ________________________When was your year of graduation (MD degree)? ________If you were not born in the United States, how many years have you lived outside of the United States? (If you were born in the United States,
please write “N/A.”) __________If all of your medical training was not in the United States, what portion/s was/were outside of the United States? (If all of your medical train-
ing was in the United States, please write “N/A.”) ______________________________________________________
Where will you refer your non-emergent cases? (Circle one.)
Strongly prefer Somewhat prefer Little or no Somewhat prefer Strongly preferLocal Local preference International International
Where will you refer your non-emergent cases? (Circle one.)
Strongly prefer Somewhat prefer Little or no Somewhat prefer Strongly preferLocal Local preference International International
TeleradiologyPart I. History and ClinicalApplications1
James H. Thrall, MD
Teleradiology—the ability to obtainimages in one location, transmitthem over a distance, and view
them remotely for diagnostic or consul-tative purposes—has been explored fornearly 50 years and is part of the moreencompassing concept of “telemedi-cine”—the delivery of health care ser-vices over a distance. Major advances intelecommunications and computer sys-tems and advances in the ability to cap-ture medical information in digital formhave accelerated the ability to applytelemedicine methods in a practical andaffordable manner. These enabling fac-tors are especially relevant to radiology,which currently stands out as one of themost technologically and clinically ad-vanced areas for telemedicine applica-tions.
The Rise of Telemedicine andTeleradiology
On March 10, 1876, Alexander GrahamBell (1,2) spilled battery acid on himselfand summoned his assistant, ThomasWatson, saying “Mr Watson, comehere. I want you!” History records thatMr Watson heard Bell’s voice throughthe wire of the telephone system thatthey were in the process of inventing,thereby signaling the simultaneous be-ginnings of telephony and telephone-based telemedicine—a summons forhelp with a medical emergency. Tele-phonic voice communication amongproviders, between providers and pa-tients, and between other stakeholdersin health care delivery is a ubiquitoustelemedicine application that we allprobably take for granted but withoutwhich the health care system wouldgrind to a halt.
In the ensuing 130 years from theinvention of the telephone, every newmethod of communication has been ex-plored for use in telemedicine applica-
tions. When touring the Queen Maryocean liner several years ago, I was in-trigued to see a display from the 1930sthat described the use of the ship’s ma-rine radiotelephone to receive and pro-vide onboard medical consultations.The ship carried a physician as part ofits crew and had a medical clinic com-plete with a radiography machine andsurgical table. The radiotelephone pro-vided access to outside medical exper-tise and, likewise, allowed the QueenMary’s medical officer to help those onother vessels.
Extensive exploration (3) of closed-circuit and broadcast television for pa-tient consultations and for transmissionof medical images from several special-ties—radiology, pathology, and derma-tology—was performed in the 1960sand into the 1970s. Among other inves-tigators in this time frame, Dr KennethT. Bird of Massachusetts General Hos-pital (Boston) established an interactivetelevision system (4) using direct micro-wave transmission from Logan Airportin Boston to the hospital to provide carefor travelers.
In a similar vein, the Walter ReedGeneral Hospital (Washington, DC) in-stalled a closed-circuit television con-nection between the department of ra-diology and the emergency room sometime in the mid-1960s. It was still inplace when I began my internship therein 1968, but poor contrast and spatialresolution and the need to send eachimage sequentially one at a time rele-gated the system to novelty status, andit was never used seriously for patientcare. High costs for dedicated installa-tions, poor image resolution, and cum-bersome logistics doomed the use ofconventional television as an importantmedium for telemedicine (3). For themost part, television-based demonstra-tion projects from this time period wereterminated after these limitations wererecognized.
Published online10.1148/radiol.2433070350
Radiology 2007; 243:613–617
1 From the Department of Radiology, Massachusetts Gen-eral Hospital, MZ-FND 216, Box 9657, 14 Fruit St, Bos-ton, MA 02114. Received February 20, 2007; final versionaccepted February 24. Address correspondence to theauthor (e-mail: [email protected]).
Author stated no financial relationship to disclose.
� RSNA, 2007
REVIEWS
ANDCOM
MENTARY
�PERSPECTIVES
Radiology: Volume 243: Number 3—June 2007 613
Note: This copy is for your personal, non-commercial use only. To order presentation-ready copies for distribution to your colleagues or clients, use the Radiology Reprints form at the end of this article.
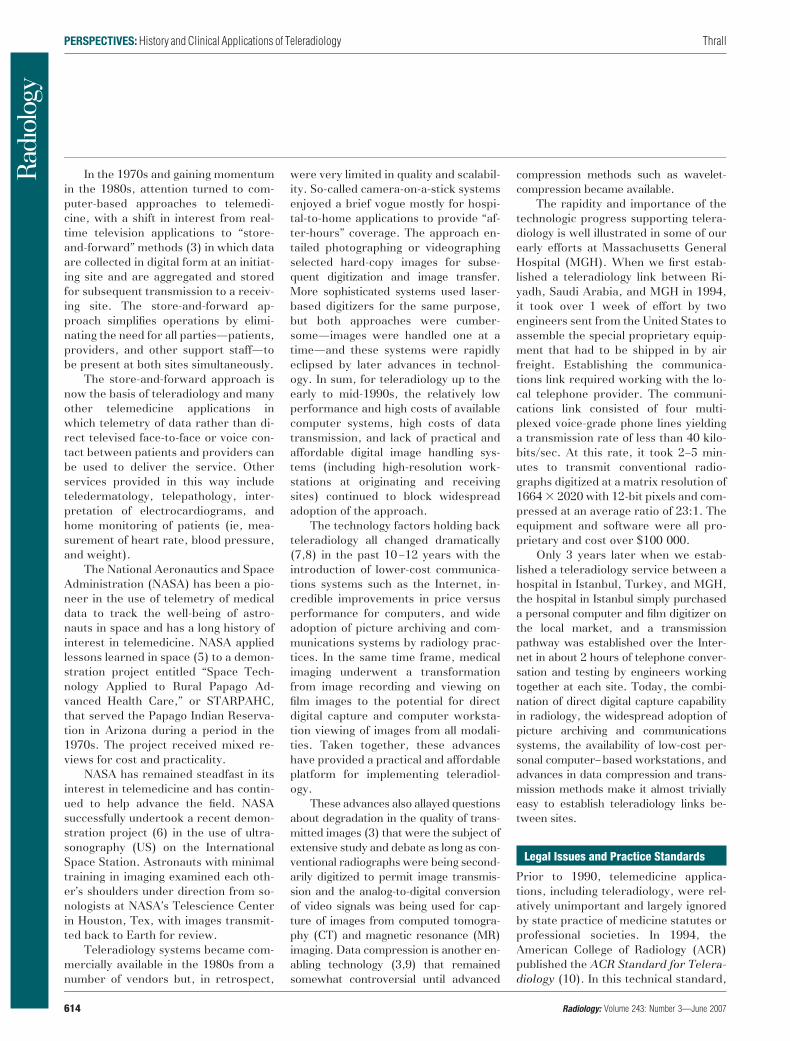
In the 1970s and gaining momentumin the 1980s, attention turned to com-puter-based approaches to telemedi-cine, with a shift in interest from real-time television applications to “store-and-forward” methods (3) in which dataare collected in digital form at an initiat-ing site and are aggregated and storedfor subsequent transmission to a receiv-ing site. The store-and-forward ap-proach simplifies operations by elimi-nating the need for all parties—patients,providers, and other support staff—tobe present at both sites simultaneously.
The store-and-forward approach isnow the basis of teleradiology and manyother telemedicine applications inwhich telemetry of data rather than di-rect televised face-to-face or voice con-tact between patients and providers canbe used to deliver the service. Otherservices provided in this way includeteledermatology, telepathology, inter-pretation of electrocardiograms, andhome monitoring of patients (ie, mea-surement of heart rate, blood pressure,and weight).
The National Aeronautics and SpaceAdministration (NASA) has been a pio-neer in the use of telemetry of medicaldata to track the well-being of astro-nauts in space and has a long history ofinterest in telemedicine. NASA appliedlessons learned in space (5) to a demon-stration project entitled “Space Tech-nology Applied to Rural Papago Ad-vanced Health Care,” or STARPAHC,that served the Papago Indian Reserva-tion in Arizona during a period in the1970s. The project received mixed re-views for cost and practicality.
NASA has remained steadfast in itsinterest in telemedicine and has contin-ued to help advance the field. NASAsuccessfully undertook a recent demon-stration project (6) in the use of ultra-sonography (US) on the InternationalSpace Station. Astronauts with minimaltraining in imaging examined each oth-er’s shoulders under direction from so-nologists at NASA’s Telescience Centerin Houston, Tex, with images transmit-ted back to Earth for review.
Teleradiology systems became com-mercially available in the 1980s from anumber of vendors but, in retrospect,
were very limited in quality and scalabil-ity. So-called camera-on-a-stick systemsenjoyed a brief vogue mostly for hospi-tal-to-home applications to provide “af-ter-hours” coverage. The approach en-tailed photographing or videographingselected hard-copy images for subse-quent digitization and image transfer.More sophisticated systems used laser-based digitizers for the same purpose,but both approaches were cumber-some—images were handled one at atime—and these systems were rapidlyeclipsed by later advances in technol-ogy. In sum, for teleradiology up to theearly to mid-1990s, the relatively lowperformance and high costs of availablecomputer systems, high costs of datatransmission, and lack of practical andaffordable digital image handling sys-tems (including high-resolution work-stations at originating and receivingsites) continued to block widespreadadoption of the approach.
The technology factors holding backteleradiology all changed dramatically(7,8) in the past 10–12 years with theintroduction of lower-cost communica-tions systems such as the Internet, in-credible improvements in price versusperformance for computers, and wideadoption of picture archiving and com-munications systems by radiology prac-tices. In the same time frame, medicalimaging underwent a transformationfrom image recording and viewing onfilm images to the potential for directdigital capture and computer worksta-tion viewing of images from all modali-ties. Taken together, these advanceshave provided a practical and affordableplatform for implementing teleradiol-ogy.
These advances also allayed questionsabout degradation in the quality of trans-mitted images (3) that were the subject ofextensive study and debate as long as con-ventional radiographs were being second-arily digitized to permit image transmis-sion and the analog-to-digital conversionof video signals was being used for cap-ture of images from computed tomogra-phy (CT) and magnetic resonance (MR)imaging. Data compression is another en-abling technology (3,9) that remainedsomewhat controversial until advanced
compression methods such as wavelet-compression became available.
The rapidity and importance of thetechnologic progress supporting telera-diology is well illustrated in some of ourearly efforts at Massachusetts GeneralHospital (MGH). When we first estab-lished a teleradiology link between Ri-yadh, Saudi Arabia, and MGH in 1994,it took over 1 week of effort by twoengineers sent from the United States toassemble the special proprietary equip-ment that had to be shipped in by airfreight. Establishing the communica-tions link required working with the lo-cal telephone provider. The communi-cations link consisted of four multi-plexed voice-grade phone lines yieldinga transmission rate of less than 40 kilo-bits/sec. At this rate, it took 2–5 min-utes to transmit conventional radio-graphs digitized at a matrix resolution of1664 � 2020 with 12-bit pixels and com-pressed at an average ratio of 23:1. Theequipment and software were all pro-prietary and cost over $100 000.
Only 3 years later when we estab-lished a teleradiology service between ahospital in Istanbul, Turkey, and MGH,the hospital in Istanbul simply purchaseda personal computer and film digitizer onthe local market, and a transmissionpathway was established over the Inter-net in about 2 hours of telephone conver-sation and testing by engineers workingtogether at each site. Today, the combi-nation of direct digital capture capabilityin radiology, the widespread adoption ofpicture archiving and communicationssystems, the availability of low-cost per-sonal computer–based workstations, andadvances in data compression and trans-mission methods make it almost triviallyeasy to establish teleradiology links be-tween sites.
Legal Issues and Practice Standards
Prior to 1990, telemedicine applica-tions, including teleradiology, were rel-atively unimportant and largely ignoredby state practice of medicine statutes orprofessional societies. In 1994, theAmerican College of Radiology (ACR)published the ACR Standard for Telera-diology (10). In this technical standard,
PERSPECTIVES: History and Clinical Applications of Teleradiology Thrall
614 Radiology: Volume 243: Number 3—June 2007
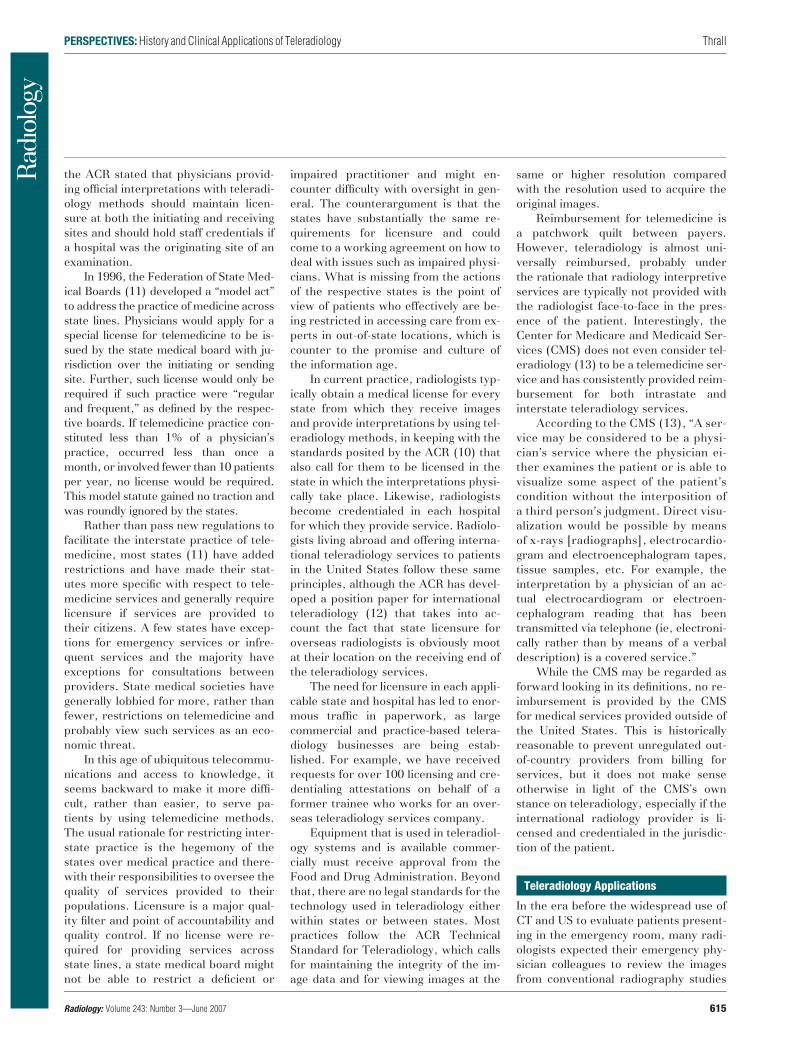
the ACR stated that physicians provid-ing official interpretations with teleradi-ology methods should maintain licen-sure at both the initiating and receivingsites and should hold staff credentials ifa hospital was the originating site of anexamination.
In 1996, the Federation of State Med-ical Boards (11) developed a “model act”to address the practice of medicine acrossstate lines. Physicians would apply for aspecial license for telemedicine to be is-sued by the state medical board with ju-risdiction over the initiating or sendingsite. Further, such license would only berequired if such practice were “regularand frequent,” as defined by the respec-tive boards. If telemedicine practice con-stituted less than 1% of a physician’spractice, occurred less than once amonth, or involved fewer than 10 patientsper year, no license would be required.This model statute gained no traction andwas roundly ignored by the states.
Rather than pass new regulations tofacilitate the interstate practice of tele-medicine, most states (11) have addedrestrictions and have made their stat-utes more specific with respect to tele-medicine services and generally requirelicensure if services are provided totheir citizens. A few states have excep-tions for emergency services or infre-quent services and the majority haveexceptions for consultations betweenproviders. State medical societies havegenerally lobbied for more, rather thanfewer, restrictions on telemedicine andprobably view such services as an eco-nomic threat.
In this age of ubiquitous telecommu-nications and access to knowledge, itseems backward to make it more diffi-cult, rather than easier, to serve pa-tients by using telemedicine methods.The usual rationale for restricting inter-state practice is the hegemony of thestates over medical practice and there-with their responsibilities to oversee thequality of services provided to theirpopulations. Licensure is a major qual-ity filter and point of accountability andquality control. If no license were re-quired for providing services acrossstate lines, a state medical board mightnot be able to restrict a deficient or
impaired practitioner and might en-counter difficulty with oversight in gen-eral. The counterargument is that thestates have substantially the same re-quirements for licensure and couldcome to a working agreement on how todeal with issues such as impaired physi-cians. What is missing from the actionsof the respective states is the point ofview of patients who effectively are be-ing restricted in accessing care from ex-perts in out-of-state locations, which iscounter to the promise and culture ofthe information age.
In current practice, radiologists typ-ically obtain a medical license for everystate from which they receive imagesand provide interpretations by using tel-eradiology methods, in keeping with thestandards posited by the ACR (10) thatalso call for them to be licensed in thestate in which the interpretations physi-cally take place. Likewise, radiologistsbecome credentialed in each hospitalfor which they provide service. Radiolo-gists living abroad and offering interna-tional teleradiology services to patientsin the United States follow these sameprinciples, although the ACR has devel-oped a position paper for internationalteleradiology (12) that takes into ac-count the fact that state licensure foroverseas radiologists is obviously mootat their location on the receiving end ofthe teleradiology services.
The need for licensure in each appli-cable state and hospital has led to enor-mous traffic in paperwork, as largecommercial and practice-based telera-diology businesses are being estab-lished. For example, we have receivedrequests for over 100 licensing and cre-dentialing attestations on behalf of aformer trainee who works for an over-seas teleradiology services company.
Equipment that is used in teleradiol-ogy systems and is available commer-cially must receive approval from theFood and Drug Administration. Beyondthat, there are no legal standards for thetechnology used in teleradiology eitherwithin states or between states. Mostpractices follow the ACR TechnicalStandard for Teleradiology, which callsfor maintaining the integrity of the im-age data and for viewing images at the
same or higher resolution comparedwith the resolution used to acquire theoriginal images.
Reimbursement for telemedicine isa patchwork quilt between payers.However, teleradiology is almost uni-versally reimbursed, probably underthe rationale that radiology interpretiveservices are typically not provided withthe radiologist face-to-face in the pres-ence of the patient. Interestingly, theCenter for Medicare and Medicaid Ser-vices (CMS) does not even consider tel-eradiology (13) to be a telemedicine ser-vice and has consistently provided reim-bursement for both intrastate andinterstate teleradiology services.
According to the CMS (13), “A ser-vice may be considered to be a physi-cian’s service where the physician ei-ther examines the patient or is able tovisualize some aspect of the patient’scondition without the interposition ofa third person’s judgment. Direct visu-alization would be possible by meansof x-rays [radiographs], electrocardio-gram and electroencephalogram tapes,tissue samples, etc. For example, theinterpretation by a physician of an ac-tual electrocardiogram or electroen-cephalogram reading that has beentransmitted via telephone (ie, electroni-cally rather than by means of a verbaldescription) is a covered service.”
While the CMS may be regarded asforward looking in its definitions, no re-imbursement is provided by the CMSfor medical services provided outside ofthe United States. This is historicallyreasonable to prevent unregulated out-of-country providers from billing forservices, but it does not make senseotherwise in light of the CMS’s ownstance on teleradiology, especially if theinternational radiology provider is li-censed and credentialed in the jurisdic-tion of the patient.
Teleradiology Applications
In the era before the widespread use ofCT and US to evaluate patients present-ing in the emergency room, many radi-ologists expected their emergency phy-sician colleagues to review the imagesfrom conventional radiography studies
PERSPECTIVES: History and Clinical Applications of Teleradiology Thrall
Radiology: Volume 243: Number 3—June 2007 615
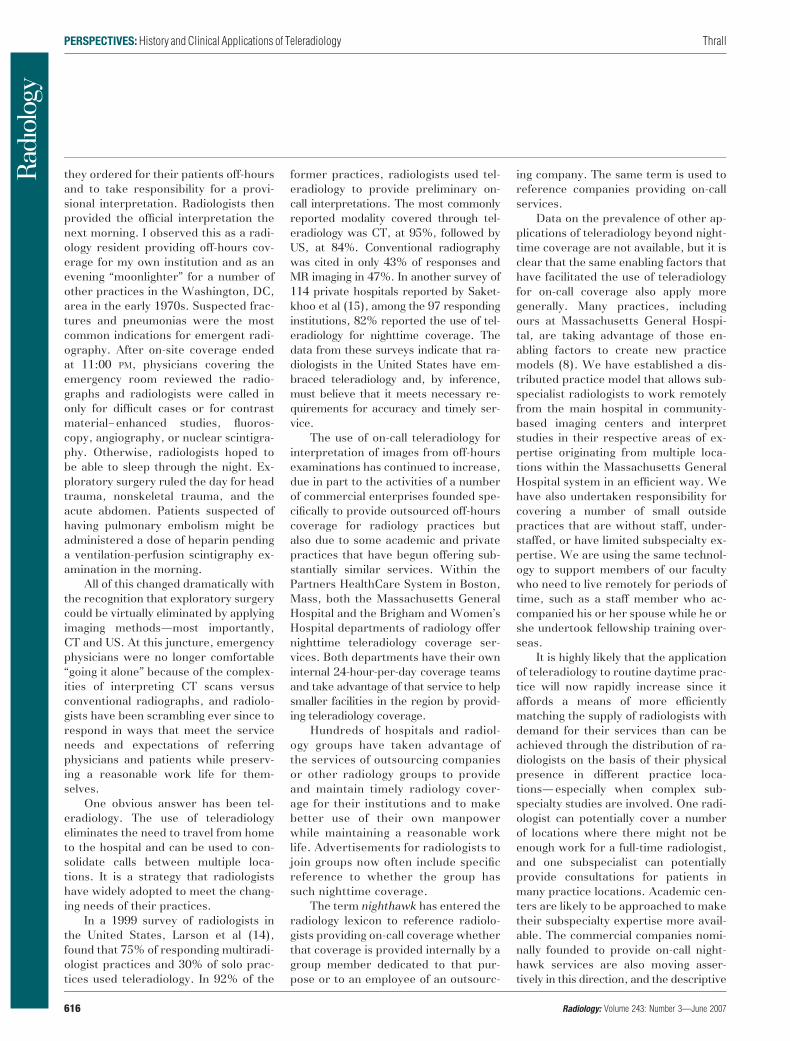
they ordered for their patients off-hoursand to take responsibility for a provi-sional interpretation. Radiologists thenprovided the official interpretation thenext morning. I observed this as a radi-ology resident providing off-hours cov-erage for my own institution and as anevening “moonlighter” for a number ofother practices in the Washington, DC,area in the early 1970s. Suspected frac-tures and pneumonias were the mostcommon indications for emergent radi-ography. After on-site coverage endedat 11:00 PM, physicians covering theemergency room reviewed the radio-graphs and radiologists were called inonly for difficult cases or for contrastmaterial–enhanced studies, fluoros-copy, angiography, or nuclear scintigra-phy. Otherwise, radiologists hoped tobe able to sleep through the night. Ex-ploratory surgery ruled the day for headtrauma, nonskeletal trauma, and theacute abdomen. Patients suspected ofhaving pulmonary embolism might beadministered a dose of heparin pendinga ventilation-perfusion scintigraphy ex-amination in the morning.
All of this changed dramatically withthe recognition that exploratory surgerycould be virtually eliminated by applyingimaging methods—most importantly,CT and US. At this juncture, emergencyphysicians were no longer comfortable“going it alone” because of the complex-ities of interpreting CT scans versusconventional radiographs, and radiolo-gists have been scrambling ever since torespond in ways that meet the serviceneeds and expectations of referringphysicians and patients while preserv-ing a reasonable work life for them-selves.
One obvious answer has been tel-eradiology. The use of teleradiologyeliminates the need to travel from hometo the hospital and can be used to con-solidate calls between multiple loca-tions. It is a strategy that radiologistshave widely adopted to meet the chang-ing needs of their practices.
In a 1999 survey of radiologists inthe United States, Larson et al (14),found that 75% of responding multiradi-ologist practices and 30% of solo prac-tices used teleradiology. In 92% of the
former practices, radiologists used tel-eradiology to provide preliminary on-call interpretations. The most commonlyreported modality covered through tel-eradiology was CT, at 95%, followed byUS, at 84%. Conventional radiographywas cited in only 43% of responses andMR imaging in 47%. In another survey of114 private hospitals reported by Saket-khoo et al (15), among the 97 respondinginstitutions, 82% reported the use of tel-eradiology for nighttime coverage. Thedata from these surveys indicate that ra-diologists in the United States have em-braced teleradiology and, by inference,must believe that it meets necessary re-quirements for accuracy and timely ser-vice.
The use of on-call teleradiology forinterpretation of images from off-hoursexaminations has continued to increase,due in part to the activities of a numberof commercial enterprises founded spe-cifically to provide outsourced off-hourscoverage for radiology practices butalso due to some academic and privatepractices that have begun offering sub-stantially similar services. Within thePartners HealthCare System in Boston,Mass, both the Massachusetts GeneralHospital and the Brigham and Women’sHospital departments of radiology offernighttime teleradiology coverage ser-vices. Both departments have their owninternal 24-hour-per-day coverage teamsand take advantage of that service to helpsmaller facilities in the region by provid-ing teleradiology coverage.
Hundreds of hospitals and radiol-ogy groups have taken advantage ofthe services of outsourcing companiesor other radiology groups to provideand maintain timely radiology cover-age for their institutions and to makebetter use of their own manpowerwhile maintaining a reasonable worklife. Advertisements for radiologists tojoin groups now often include specificreference to whether the group hassuch nighttime coverage.
The term nighthawk has entered theradiology lexicon to reference radiolo-gists providing on-call coverage whetherthat coverage is provided internally by agroup member dedicated to that pur-pose or to an employee of an outsourc-
ing company. The same term is used toreference companies providing on-callservices.
Data on the prevalence of other ap-plications of teleradiology beyond night-time coverage are not available, but it isclear that the same enabling factors thathave facilitated the use of teleradiologyfor on-call coverage also apply moregenerally. Many practices, includingours at Massachusetts General Hospi-tal, are taking advantage of those en-abling factors to create new practicemodels (8). We have established a dis-tributed practice model that allows sub-specialist radiologists to work remotelyfrom the main hospital in community-based imaging centers and interpretstudies in their respective areas of ex-pertise originating from multiple loca-tions within the Massachusetts GeneralHospital system in an efficient way. Wehave also undertaken responsibility forcovering a number of small outsidepractices that are without staff, under-staffed, or have limited subspecialty ex-pertise. We are using the same technol-ogy to support members of our facultywho need to live remotely for periods oftime, such as a staff member who ac-companied his or her spouse while he orshe undertook fellowship training over-seas.
It is highly likely that the applicationof teleradiology to routine daytime prac-tice will now rapidly increase since itaffords a means of more efficientlymatching the supply of radiologists withdemand for their services than can beachieved through the distribution of ra-diologists on the basis of their physicalpresence in different practice loca-tions—especially when complex sub-specialty studies are involved. One radi-ologist can potentially cover a numberof locations where there might not beenough work for a full-time radiologist,and one subspecialist can potentiallyprovide consultations for patients inmany practice locations. Academic cen-ters are likely to be approached to maketheir subspecialty expertise more avail-able. The commercial companies nomi-nally founded to provide on-call night-hawk services are also moving asser-tively in this direction, and the descriptive
PERSPECTIVES: History and Clinical Applications of Teleradiology Thrall
616 Radiology: Volume 243: Number 3—June 2007
term day hawking has now also enteredthe radiology lexicon.
As the current trend continues to-ward more radiology being practiced re-motely, it will promote and facilitate asubstantial consolidation of providers intolarger organizations whether they are ra-diology professional practice groups orcommercial companies. Hospitals lookingfor better performance or more account-ability in their radiology operations willturn to these entities and contract withthem to manage their radiology depart-ments. Smaller groups working in a gen-eralist model of practice will be chal-lenged to provide access to subspecialistsand will face difficult decisions aboutwhether to work with others or risk los-ing their franchises as their specialist col-leagues in other disciplines demand moreexpertise in interpretation of imagingstudies.
Teleradiology is poised to play animportant role in peer review and qual-ity assurance. With the Joint Commis-sion on Accreditation of Healthcare Or-ganizations pushing for more evidenceof performance evaluation between cre-dentialing events, radiology groups willneed to develop better systems for as-sessing the accuracy of their work andfor peer review. In some settings, radi-ologists are being challenged by theirphysician colleagues and their institu-tions to more objectively demonstratethe quality and accuracy of their inter-pretations. The use of teleradiology canfacilitate groups working together inreciprocity to review each others workor to contract with outside organiza-tions to address these quality issues.
Education in all medical disciplineshas already been indelibly changed bytelecommunications. Again, radiology isa leader because of the fidelity and flex-ibility of digital image management.Teaching files are available from na-tional and international sources on theInternet, as are Web casts of lectures,case-of-the-day presentations, and teach-ing conferences. Travel is no longer nec-essary to access outstanding learning op-
portunities, although tele-education fallsshort on direct person-to-person mentor-ing, which provides tangible and intangi-ble aspects that we should not under-value.
Research in radiology is being trans-formed through teleradiology in parallelwith clinical practice. Image data fromclinical trials can be collected faster andmore efficiently by direct digital transferthan by shipping hard-copy film records.The ACR Imaging Network has secureconnections to over 100 hospitals sup-porting data collection in 20 or more ac-tive trials (16,17). The pharmaceutical in-dustry has discovered the value of imag-ing biomarkers for use as end points inclinical trials and will undoubtedly drivefurther network development.
Conclusion
Several factors—including the prevail-ing shortage of radiologists, the increas-ing use of advanced imaging methods,the consolidation of hospitals into re-gional delivery systems, and heightenedexpectations of patients and referringphysicians for timely service—have fos-tered the increasing use of teleradiol-ogy. These factors have also helped un-derwrite the creation of new and poten-tially disruptive business models forservice delivery that can be viewed asthreats, opportunities, or both, but can-not be ignored.
References
1. Britannia biographies. Alexander Graham Bell.http://www.britannia.com/bios/bell.html. Ac-cessed February 11, 2007.
2. Lucidcafe. Alexander Graham Bell. http://www.lucidcafe.com/library/96mar/bell.html.Accessed February 11, 2007.
3. Thrall JH, Boland G. Teleradiology. In:Dreyer KJ, Mehta A, Thrall JH, eds. PACS: aguide to the digital revolution. New York,NY: Springer-Verlag, 2002;315–348.
4. Bird KT. Cardiopulmonary frontiers: qualityhealth care via interactive television. Chest1972;61:204–207.
5. Doarn CR, Ferguson EW, Nicogossian AE.Telemedicine and telescience in the US spaceprogram. http://www.quasar.org/21698/nasa/gifu.html. Accessed January 2, 2007.
6. Fincke EM, Padalka G, Lee D, et al. Evalua-tion of shoulder integrity in space: first re-port of musculoskeletal US on the Interna-tional Space Station. Radiology 2005;234:319–322.
7. Thrall JH. Reinventing radiology in the digi-tal age. I. The all-digital department. Radiol-ogy 2005;236:382–385.
8. Thrall JH. Reinventing radiology in the digi-tal age. II. New directions and new stake-holder value. Radiology 2005;237:15–18.
9. Goldberg MA, Sharif HS, Rosenthal DI, et al.Making global telemedicine practical andaffordable: demonstrations from the MiddleEast. AJR Am J Roentgenol 1994;163:1495–1500.
10. American College of Radiology. ACR stan-dard for teleradiology. Reston, Va: Ameri-can College of Radiology, 1994.
11. Gobis L. An overview of state laws and ap-proaches to minimize licensure barriers.http://www2.telemedtoday.com/articles/statelaws.shtml. Accessed January 27,2007.
12. Moore AV, Allen B, Campbell SC, et al. Re-port of the ACR task force on internationalteleradiology. http://www.acr.org/. AccessedJanuary 5, 2007.
13. American Telemedicine Association. Medicarereimbursement for telemedicine. http://www.atmeda.org/news/library.htm. Ac-cessed January 15, 2007.
14. Larson DB, Cypel YS, Forman HP, SunshineJH. A comprehensive portrait of teleradiol-ogy in radiology practices: results from theAmerican College of Radiology’s 1999 sur-vey. AJR Am J Roentgenol 2005;185:24–35.
15. Saketkhoo DD, Bhargavan M, Sunshine JH,Forman HP. Emergency department imageinterpretation services at private communityhospitals. Radiology 2004;231:190–197.
16. American College of Radiology Imaging Net-work. Location of participating institutions.http://www.acrin.org/partsites.html. Ac-cessed February 11, 2007.
17. American College of Radiology Imaging Net-work. Current protocols. http://www.acrin.org/currentprotocols.html. Accessed Febru-ary 11, 2007.
PERSPECTIVES: History and Clinical Applications of Teleradiology Thrall
Radiology: Volume 243: Number 3—June 2007 617
Radiology 2007 This is your reprint order form or pro forma invoice
(Please keep a copy of this document for your records.)
Author Name _______________________________________________________________________________________________ Title of Article _______________________________________________________________________________________________ Issue of Journal_______________________________ Reprint # _____________ Publication Date ________________ Number of Pages_______________________________ KB # _____________ Symbol Radiology Color in Article? Yes / No (Please Circle) Please include the journal name and reprint number or manuscript number on your purchase order or other correspondence. Order and Shipping Information Reprint Costs (Please see page 2 of 2 for reprint costs/fees.) ________ Number of reprints ordered $_________
________ Number of color reprints ordered $_________
________ Number of covers ordered $_________
Subtotal $_________
Taxes $_________ (Add appropriate sales tax for Virginia, Maryland, Pennsylvania, and the District of Columbia or Canadian GST to the reprints if your order is to be shipped to these locations.)
First address included, add $32 for each additional shipping address $_________
TOTAL $_________
Shipping Address (cannot ship to a P.O. Box) Please Print Clearly Name ___________________________________________ Institution _________________________________________ Street ___________________________________________ City ____________________ State _____ Zip ___________ Country ___________________________________________ Quantity___________________ Fax ___________________ Phone: Day _________________ Evening _______________ E-mail Address _____________________________________ Additional Shipping Address* (cannot ship to a P.O. Box)
Name ___________________________________________ Institution _________________________________________ Street ___________________________________________ City ________________ State ______ Zip ___________
Country _________________________________________ Quantity __________________ Fax __________________ Phone: Day ________________ Evening ______________ E-mail Address ____________________________________ * Add $32 for each additional shipping address
Payment and Credit Card Details Enclosed: Personal Check ___________ Credit Card Payment Details _________ Checks must be paid in U.S. dollars and drawn on a U.S. Bank. Credit Card: __ VISA __ Am. Exp. __ MasterCard Card Number __________________________________ Expiration Date_________________________________ Signature: _____________________________________ Please send your order form and prepayment made payable to: Cadmus Reprints P.O. Box 751903 Charlotte, NC 28275-1903 Note: Do not send express packages to this location, PO Box.
FEIN #:541274108
Invoice or Credit Card Information Invoice Address Please Print Clearly Please complete Invoice address as it appears on credit card statement Name ____________________________________________ Institution ________________________________________ Department _______________________________________ Street ____________________________________________ City ________________________ State _____ Zip _______ Country ___________________________________________ Phone _____________________ Fax _________________ E-mail Address _____________________________________ Cadmus will process credit cards and Cadmus Journal
Services will appear on the credit card statement. If you don’t mail your order form, you may fax it to 410-820-9765 with
your credit card information. Signature __________________________________________ Date _______________________________________ Signature is required. By signing this form, the author agrees to accept the responsibility for the payment of reprints and/or all charges described in this document.
Reprint order forms and purchase orders or prepayments must be received 72 hours after receipt of form either by mail or by fax at 410-820-9765. It is the policy of Cadmus Reprints to issue one invoice per order.
Please print clearly.
Page 1 of 2 RB-9/22/06
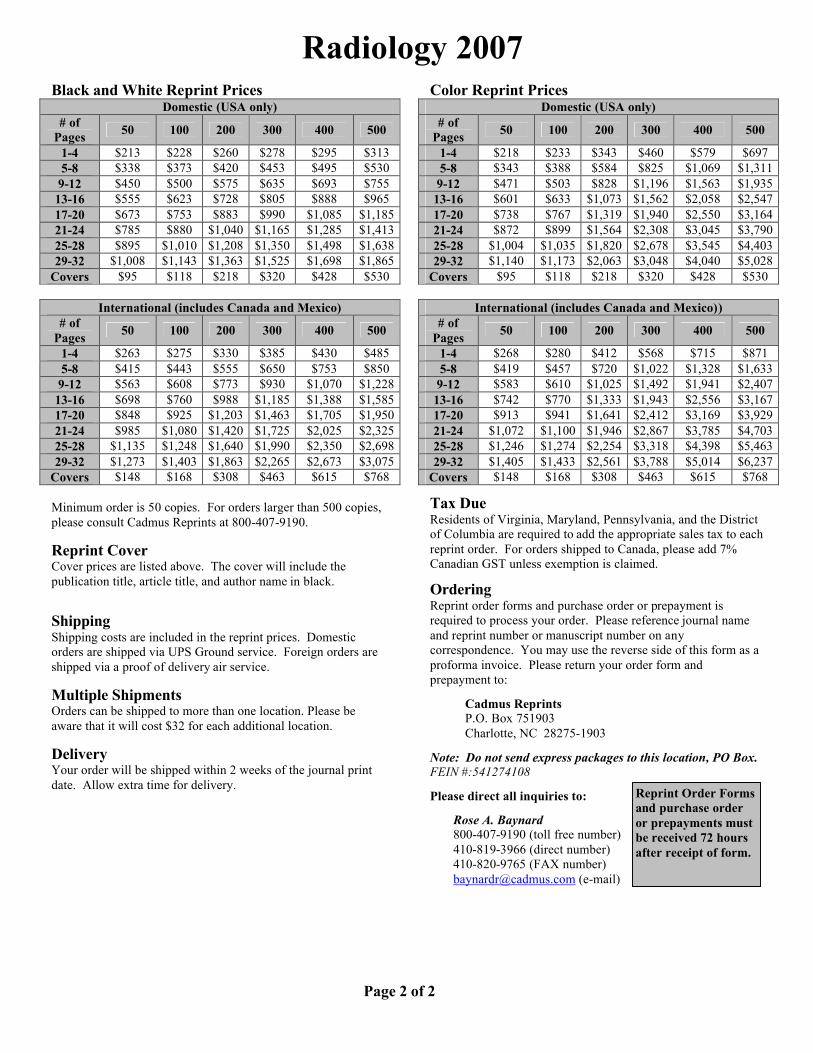
Radiology 2007 Black and White Reprint Prices
Domestic (USA only) # of
Pages 50 100 200 300 400 500
1-4 $213 $228 $260 $278 $295 $313 5-8 $338 $373 $420 $453 $495 $530
9-12 $450 $500 $575 $635 $693 $755 13-16 $555 $623 $728 $805 $888 $965 17-20 $673 $753 $883 $990 $1,085 $1,185 21-24 $785 $880 $1,040 $1,165 $1,285 $1,413 25-28 $895 $1,010 $1,208 $1,350 $1,498 $1,638 29-32 $1,008 $1,143 $1,363 $1,525 $1,698 $1,865
Covers $95 $118 $218 $320 $428 $530
International (includes Canada and Mexico) # of
Pages 50 100 200 300 400 500
1-4 $263 $275 $330 $385 $430 $485 5-8 $415 $443 $555 $650 $753 $850
9-12 $563 $608 $773 $930 $1,070 $1,228 13-16 $698 $760 $988 $1,185 $1,388 $1,585 17-20 $848 $925 $1,203 $1,463 $1,705 $1,950 21-24 $985 $1,080 $1,420 $1,725 $2,025 $2,325 25-28 $1,135 $1,248 $1,640 $1,990 $2,350 $2,698 29-32 $1,273 $1,403 $1,863 $2,265 $2,673 $3,075
Covers $148 $168 $308 $463 $615 $768 Minimum order is 50 copies. For orders larger than 500 copies, please consult Cadmus Reprints at 800-407-9190. Reprint Cover Cover prices are listed above. The cover will include the publication title, article title, and author name in black. Shipping Shipping costs are included in the reprint prices. Domestic orders are shipped via UPS Ground service. Foreign orders are shipped via a proof of delivery air service. Multiple Shipments Orders can be shipped to more than one location. Please be aware that it will cost $32 for each additional location. Delivery Your order will be shipped within 2 weeks of the journal print date. Allow extra time for delivery.
Color Reprint Prices
Domestic (USA only) # of
Pages 50 100 200 300 400 500
1-4 $218 $233 $343 $460 $579 $697 5-8 $343 $388 $584 $825 $1,069 $1,311 9-12 $471 $503 $828 $1,196 $1,563 $1,935 13-16 $601 $633 $1,073 $1,562 $2,058 $2,547 17-20 $738 $767 $1,319 $1,940 $2,550 $3,164 21-24 $872 $899 $1,564 $2,308 $3,045 $3,790 25-28 $1,004 $1,035 $1,820 $2,678 $3,545 $4,403 29-32 $1,140 $1,173 $2,063 $3,048 $4,040 $5,028
Covers $95 $118 $218 $320 $428 $530
International (includes Canada and Mexico)) # of
Pages 50 100 200 300 400 500
1-4 $268 $280 $412 $568 $715 $871 5-8 $419 $457 $720 $1,022 $1,328 $1,633 9-12 $583 $610 $1,025 $1,492 $1,941 $2,407 13-16 $742 $770 $1,333 $1,943 $2,556 $3,167 17-20 $913 $941 $1,641 $2,412 $3,169 $3,929 21-24 $1,072 $1,100 $1,946 $2,867 $3,785 $4,703 25-28 $1,246 $1,274 $2,254 $3,318 $4,398 $5,463 29-32 $1,405 $1,433 $2,561 $3,788 $5,014 $6,237
Covers $148 $168 $308 $463 $615 $768 Tax Due Residents of Virginia, Maryland, Pennsylvania, and the District of Columbia are required to add the appropriate sales tax to each reprint order. For orders shipped to Canada, please add 7% Canadian GST unless exemption is claimed. Ordering Reprint order forms and purchase order or prepayment is required to process your order. Please reference journal name and reprint number or manuscript number on any correspondence. You may use the reverse side of this form as a proforma invoice. Please return your order form and prepayment to: Cadmus Reprints P.O. Box 751903 Charlotte, NC 28275-1903 Note: Do not send express packages to this location, PO Box. FEIN #:541274108 Please direct all inquiries to:
Rose A. Baynard 800-407-9190 (toll free number) 410-819-3966 (direct number) 410-820-9765 (FAX number)
[email protected] (e-mail)
Reprint Order Forms and purchase order or prepayments must be received 72 hours after receipt of form.
Page 2 of 2
TeleradiologyPart II. Limitations, Risks,and Opportunities1
James H. Thrall, MD
Teleradiology offers the promise toimprove quality of care and qualityof service to patients and referring
providers while simultaneously improvingthe efficiency of the health care systemand the productivity and quality of worklife of radiologists. Hospital-to-home tel-eradiology is widely used in the UnitedStates for off-hours health care coverage(1), and teleradiology has become the ba-sis for the formation of a number of com-mercial enterprises that provide out-sourcing services for image interpreta-tion.
The full potential of teleradiology tochange paradigms of care is not yetknown and likely will require substantialadditional experience and experimenta-tion to understand. In the meantime,there are still serious technical and oper-ational limitations that need to be over-come before the advantages of teleradiol-ogy can be realized. There is also a daunt-ing series of risks that need to be betterunderstood before the myriad of opportu-nities associated with teleradiology can befully explored and beneficially integratedinto the health care system and the prac-tice of radiology.
Technical and Operational Limitationsof Teleradiology
Despite the many advances in electronicimage management over the past 3 de-cades, the technical Achilles heel of tel-eradiology in clinical practice (2–4) is thegeneral inability to integrate the imagemanagement systems that are resident indifferent information system security do-mains and to integrate teleradiology sys-tems with other health care informationsystems when data are transmitted be-tween different institutions or between aninstitution and outside providers who areusing a different information system.
The simplest case is that of a radiolo-gist covering services for his or her owninstitution. In this setting, a virtual private
network, or VPN, can be used to accessimages and other information from theinstitution’s various data sources, al-though it is often not possible to directlyinput a report into the radiology informa-tion system (RIS) from a remote site or toaccess work lists from the picture archiv-ing and communication system (PACS).The Web-based image distribution sys-tems used for hospital-to-home teleradiol-ogy typically do not offer the same rangeof functions—including image manipula-tion tools and navigation between imagesets—that PACS workstations do; thus,their use is restricted to applications suchas provisional interpretation of emer-gency examination results, in which priorimages or prior reports may not beneeded.
Working between different institu-tions or between an institution and a tel-eradiology outsourcing provider presentsmore challenges. Point-to-point connec-tivity for image transmission in no wayimplies true integration of systems. Evenif the PACS systems used at the sendingand receiving sites are from the samevendor, differences in registration num-bers and security issues militate againstan integrated exchange of data. Conse-quently, gaining access to images notoriginally sent as part of a teleradiologytransmission is also problematic in theseteleradiology settings, because the opera-tional model is a “demand-push” model.This means that the sending site initiatesthe transaction by “pushing” a case intothe system. Since the images are goingthrough firewalls and security systems atthe sending location and because the re-ceiving system for image handling is notintegrated with the sending site, addi-tional images cannot be directly “pulled”by the radiologist interpreting the caseshould they be required. The interpretingradiologist has no direct means of access-ing the data repositories of the sendingsite. Rather, he or she must communicatethe need for additional image data to the
Published online10.1148/radiol.2442070676
Radiology 2007; 244:325–328
1 From the Department of Radiology, Massachusetts Gen-eral Hospital, MZ-FND 216, Box 9657, 14 Fruit St, Bos-ton, MA 02114. Received April 16, 2007; final versionaccepted April 27. Address correspondence to the au-thor (e-mail: [email protected]).
Author stated no financial relationship to disclose.
� RSNA, 2007
REVIEWS
ANDCOM
MENTARY
�PERSPECTIVES
Radiology: Volume 244: Number 2—August 2007 325
Note: This copy is for your personal, non-commercial use only. To order presentation-ready copies for distribution to your colleagues or clients, use the Radiology Reprints form at the end of this article.
originating site; this is a cumbersome pro-cess at best.
A corollary limitation is the lack ofremote access to work lists. The off-siteradiologist must rely on those managingthe pushing of cases to know which casesto interpret and in what order to inter-pret them. This makes it difficult for twoor more radiologists to work in parallel ina teleradiology setting without interven-tion by other personnel who at somepoint will be central to the work flow ofthe teleradiology process. Secondary dis-tribution to the interpreting radiologist af-ter initial data collection on a centralserver is the work flow model for somecommercial teleradiology service compa-nies. This second step can be automatedbut historically has required operator in-tervention.
Image data typically are resident in aPACS and are stored separately fromother information about the patient, in-cluding reports of prior radiologic exami-nations held in the RIS and the basic clin-ical and laboratory information typicallyrecorded in a hospital information sys-tem, electronic medical record, or paper-based medical record. Therefore, eventhe most basic collateral information,such as the indications for performing anexamination, recent medical history, lab-oratory values, and pathology reports,typically must be collected by someone atthe sending site and transmitted sepa-rately from the images. There are nowidely promulgated standards, such asDigital Imaging and Communications inMedicine, or DICOM, for doing this yet.Apart from the Health Level 7 interfacestandard, no integrated information sys-tem platforms are generally available forinterinstitutional use. Even if there weresuch standards, the same issues that be-devil PACS-to-PACS image transmission—namely, different registration numbersand security issues—would still apply.
An important initiative called Inte-grating the Healthcare Enterprise, orIHE, which is supported by the Radiologi-cal Society of North America (3) andother organizations, seeks to address thislack of interinstitutional integration; how-ever, it has not reached widespread prac-tical implementation. In current practice,patient information must be faxed or
e-mailed after someone at the teleradi-ology sending end has redacted it to amanageable form. Again, interactivity ishighly problematic, so the receiving radi-ologist is typically left with what someoneat the sending site thinks is appropriate.Any additional information must be re-quested, found, redacted, and transmit-ted—again, a cumbersome process.
Even within a single institution, theintegration between systems is often lessthan ideal because the PACS resides inthe domain of the Digital Imaging andCommunications in Medicine standard,while the RIS, hospital information sys-tem, and electronic medical record residein the domain of the Health Level 7 stan-dard. This means that special interfacesor “brokers” must be employed to sendinformation between the PACS and theRIS and radiologists are faced with theconstant need to switch between systemsto access the information they need on acase-by-case basis. As noted by Siegel andChannin (4), “this lack of consensus byvarious hospital and radiology informa-tion systems, PACS, and modality ven-dors on how to use existing standards hasthwarted our efforts to automate pro-cesses.”
Sending reports back to the initiatingsite completes the cycle of teleradiologyand represents another major point ofnonintegration. There is typically no prac-tical way to electronically generate re-ports and send them for direct inclusionin the RIS of the initiating site. In practice,this means another set of e-mails or faxes.If the hospital or imaging center wishes tomake these reports available to referringphysicians through an RIS or hospital in-formation system, the reports must besecondarily transcribed or copied into thesystem electronically, with no practicalway for the interpreting radiologist to ver-ify the transcription.
From a distance, teleradiology maylook like a technologic marvel, but directexperience reveals that it is operationallychallenging because of the lack of sys-tems integration. The lack of integrationand the demand-push operational modelmake each step of the traditional teleradi-ology process cumbersome. For small-scale operations—for example, a fewcases per night from a hospital to a radiol-
ogist’s home—this cumbersomeness canordinarily be subsumed by the efforts ofexisting personnel, and the radiologistcan confirm the interpretation the nextmorning when he or she has access to thecomplete record. For larger operationsbetween an institution and an outsourcingprovider, however, addressing these is-sues requires the addition of more per-sonnel to fill in the gaps in communica-tions and the gaps resulting from theinability to integrate data flow betweendisparate PACS and information sys-tems. With current technology, establish-ing large-scale operations for conven-tional teleradiology is a personnel-inten-sive process, contrary to its high-techimage.
The issues are far less daunting whenteleradiology is practiced within an insti-tution or distributed delivery system withcommon information system componentsin all locations or within a common fire-wall or set of security systems. In our corepractice at Massachusetts General Hospi-tal (Boston, Mass), we staff six sites, in-cluding the hospital and various outpa-tient centers and imaging centers that re-quire the presence of a radiologist, andwe oversee three additional practice loca-tions that do not require on-site radiolo-gists but from which we receive images.Since all locations are networked to-gether and use the same information sys-tems, all imaging and nonimaging dataare equally available at all locations in-cluding access to work lists that governthe distribution of images to individualradiologists. In this scenario, a “demand-pull” operational model is used, meaningthat it is the radiologist who initiates theinterpretive process, calls up all the nec-essary images onto the PACS workstationmonitor, and calls up other informationonto a second workstation that is used toaccess the RIS and hospital informationsystem. Each radiologist is likely to in-terpret images from multiple locationsthrough the course of a day and may noteven take note from one case to the nextof where the images were originally ob-tained. We have used the term wide-area PACS to describe this integratedmodel and to distinguish it from conven-tional point-to-point teleradiology.
With advances in the Web distribu-
PERSPECTIVES: Limitations, Risks, and Opportunities in Teleradiology Thrall
326 Radiology: Volume 244: Number 2—August 2007
tion of images and reporting systems, it isnow feasible to extend this integratedmodel to locations that are not part ofthe institution’s network or security do-main. To solve a particular staffing issuein our department at Massachusetts Gen-eral Hospital, our information technologygroup, under the direction of KeithDreyer, DO, PhD, recently developed asystem that we have dubbed “PACS in abriefcase,” which allows access to all hos-pital systems, including the voice-report-ing system and radiology work lists. Thiscustomized system has the nominal re-quirement of a personal computer that islinked to the institution by means of anappropriate security system via a virtualprivate network over the Internet. Thesystem can run on a laptop computer withflat-panel display that can be carried in aspecial case. In this customized system,all images and patient information are ac-cessible in the demand-pull model, elimi-nating the gaps typically encountered inteleradiology. It is likely that such systemswill become generally available in the nextseveral years and thus address many ofthe technical limitations facing the prac-tice of teleradiology today. However, thecustomization of this approach for differ-ent institutions with disparate systemswill remain challenging.
The lack of opportunity for face-to-face consultation with referring physi-cians is a shared limitation of all ap-proaches to teleradiology that may beamenable—at least partially—to technol-ogy solutions. Video conferencing overthe Internet is quite feasible today andhas prompted a resurgence of interest ininteractive telemedicine applications, andthe same approach can be used for face-to-face consultations between radiologistsand referring physicians. The major limi-tations for both parties are the cost oftime and the logistics of scheduling theinteraction.
Risks Associated with Teleradiology
Some of the risks associated with telera-diology are directly related to the techni-cal limitations of the field. When it provestoo cumbersome for a remote radiologistto obtain additional images or collateralinformation, there is a risk that examina-
tion results will be interpreted in a lesscomplete fashion than they would be inconventional practice. The reason thatemergency teleradiology coverage gener-ally works quite well is largely the limitedset of indications, the general lack of needto review prior examination results, andthe limited amount of collateral informa-tion needed for interpretation. In com-parison, follow-up examination of a pa-tient in the middle of treatment for canceror another complex medical conditiongenerally requires comparison of the newimaging results with the prior examina-tion results—possibly from a number ofdifferent imaging modalities, review ofthe prior radiology reports—often sev-eral, and review of other informationsuch as pathology and laboratory reports.It is impractical to simply “push” every-thing to the remote reader, and a genericmultisite solution to the problem of mak-ing information—including image data—available in a practical manner by way ofconventional teleradiology is not yet athand.
The quality of outsourced teleradiol-ogy services is another area of risk thatany radiology group or institution mustaddress. For hospitals, reappointment tothe medical staff and regranting of privi-leges require assessment of a physician’sperformance. Therefore, anyone provid-ing a teleradiology service who holds staffcredentials must be periodically reviewedfor the quality of his or her work. It isincumbent of the on-site radiology groupand/or the institution to establish an ap-propriate system for overseeing quality.Even when this is done, it is interestingthat some radiology groups that might or-dinarily interview a number of potentialcandidates and perform background andreference checks before selecting a newgroup member now routinely accept ser-vices from any number of radiologistswho are unknown to them except throughthe credentials submitted on their behalfby a commercial teleradiology servicescompany.
Turning to outside teleradiology pro-viders for off-hours coverage carries arisk to the reputation and professionalstanding of radiologists. Arguably, radiol-ogists in an institution who cede a part oftheir practice to others are less important
to the institutional care process than theywere when they provided all professionalradiology coverage. They risk their rolesas consultants and may become lesshighly regarded professionally if their col-leagues perceive what they do as radiolo-gists to be a simple commodity that canbe purchased on the open market. In asurvey of referring physicians conductedby Lester et al (5) to compare local andinternational interpretations, cost andtimeliness issues from the viewpoint ofreferring physicians were addressed. Thesurvey results indicated that referringphysicians prefer local interpretations un-less the time and cost factors for localinterpretation are very unfavorable. Localradiologists have substantial advantages,but they will lose them if they do not pro-vide high-quality service.
Teleradiology may put entire radiol-ogy practices at risk. The shortage of ra-diologists over the past 10 years (6) andthe challenges of recruiting personnel tocertain locales have previously protectedradiologists from competition or threatsto what some may have regarded as their“franchise right” to provide coverage to aparticular institution. Those radiologistswho are perceived to have taken advan-tage of these factors by providing indiffer-ent or worse service are now especially atrisk of being replaced in sum or in part byteleradiology outsourcing service provid-ers. Commercial teleradiology companiesare clearly beginning to move into thisservice arena. Nighthawking has morphedinto dayhawking.
Radiology groups that do not havesubspecialty expertise are unquestionablyat risk of having at least a portion of theirpractice taken away from them throughteleradiology. A number of private groupsand commercial companies are now ded-icated to providing subspecialty interpre-tations. Referring physicians who are spe-cialists—for example, neurosurgeons, or-thopedists, or oncologists—are drivingthis particular trend. They value for them-selves and their patients a subspecialtylevel of interpretation rather than gener-alist-level interpretation, as well as theability to work with subspecialty-trainedradiologists who understandably are ex-pected to have greater familiarity with theclinical challenges and imaging correlates
PERSPECTIVES: Limitations, Risks, and Opportunities in Teleradiology Thrall
Radiology: Volume 244: Number 2—August 2007 327
associated with the more highly subspe-cialized disciplines of medical practice.
Radiologists and their practice col-leagues should assess their situations todetermine whether and how they are atrisk. The radiology groups in the stron-gest position are those that (a) provideoutstanding service with high patient andreferring physician satisfaction, (b) takeresponsibility for 24 hour–7-day-a-weekhealth care services themselves, (c) offerhigh-quality subspecialized interpreta-tions, and (d) represent good institutionalcitizens with high participation in qualityimprovement programs and no conflictsof interest with their affiliated institu-tions. Groups with the opposite charac-teristics in whole or in part are at greaterrisk.
Opportunities Associated withTeleradiology
When used well by radiologists dedicatedto high-quality service, teleradiology of-fers the opportunity to simultaneously im-prove medical care delivery and improvethe quality of work life for radiologists.Creative application of teleradiology canalso improve productivity and conse-quently the financial well being of radiolo-gists as well. Radiologists in the UnitedStates have already adopted teleradiologyinto their practices to achieve substantialportions of these benefits. The questionsfacing the specialty now are how muchfurther will things go and will the inevita-ble changes associated with teleradiologytransform radiology practices in waysthat most radiologists will like or will theydrive the specialty in the direction of com-moditization and corporate practice.
One direction that appears to offermajor opportunity is that of radiologistsusing teleradiology to support each otherin their practices and even create newbusiness and practice models. Smallergroups within a state could join togetherin a larger group of sufficient size to pro-vide “24-7” coverage and offer subspecial-ization. With teleradiology, one radiolo-gist in such a coalesced group could coverseveral smaller institutions for off-hoursemergency examinations; thus, the re-sponsibility would be shared and spreadover a number of people large enough to
mitigate the negative quality of work lifeissues facing a smaller group trying to ac-complish the task. Furthermore, aggre-gating the night responsibility for severalinstitutions would improve the productiv-ity of those providing the coverage. This isprecisely the economic premise of com-mercial teleradiology companies, andthere is no reason that individual groupscannot come together to achieve thesame benefits with much less administra-tive overhead because all of the partici-pants would already be licensed in theirrespective states.
The same model could be used to in-crease the capability of the expandedgroup to provide subspecialty coverage.One person or a number of people couldtake on the responsibility for each sub-specialty area of importance to the insti-tutions involved and provide coveragethrough a system similar to the describedsystem that we use in our practice at Mas-sachusetts General Hospital. Many radiol-ogists practicing as generalists have al-ready been also trained at a subspecialtylevel. Others could focus their continuingmedical education efforts on a particularsubspecialty and come to an academiccenter for a mini-fellowship.
Smaller groups could make arrange-ments with academic centers to provideover-read or consultative services for se-lected cases through teleradiology. It isinteresting that pathologists have had aculture of asking colleagues for advice andsecond opinions for years. Such a wide-spread culture of consultation has not de-veloped in the radiology field before for anumber of reasons, including the cumber-someness and cost of shipping hard-copyradiographs around the country and thefrequent need in urgent and emergentcases to determine the imaging findings asquickly as possible and act on them imme-diately. In the age of teleradiology, theseissues no longer constitute barriers in thesame way to seeking consultation.
Conclusion
Prior to teleradiology, radiologists wereprotected in their practice sinecures by avariety of barriers to competition and hadwide latitude to look at life according totheir own viewpoints and self-interests.
To their credit, most radiologists have nottaken inappropriate advantage of thisprotected situation and have practiced ata high level of integrity and quality. None-theless, teleradiology is eclipsing the pro-tected state of the radiology practice andreplacing it with a new less-protectedpractice environment in which the unmetneeds and expectations of patients, refer-ring physicians, and hospitals in terms ofbetter quality and service can now bereadily addressed through choice amongradiology providers.
It is likely that major consolidation inthe practice of radiology will be fosteredby means of teleradiology to achieve ben-efits of scale, provide more timely service,provide access to subspecialist clinical ex-pertise, and better match supply with de-mand. Radiologists can be the initiators ofthis consolidation and realize many im-portant benefits for themselves, includingthe preservation of their practices. To ac-complish this, however, radiologists firstneed to recognize and accept thatchanges in organizational structure andservice expectations are taking place inthe health care system through the avail-ability of teleradiology and are inevitable.Preserving the status quo is not a viableoption in many situations, and if radiolo-gists do not take the initiative to creativelyuse teleradiology to their advantage, oth-ers will.
References1. Larson DB, Cypel YS, Forman HP, Sunshine JH.
A comprehensive portrait of teleradiology in radi-ology practice: results from the American Collegeof radiology’s 1998 survey. AJR Am J Roentgenol2005;185:24–35.
2. Thrall JH. Reinventing radiology in the digitalage. II. New directions and new stakeholdervalue. Radiology 2005;237:15–18.
3. Integrating the healthcare enterprise: changingthe way healthcare connects. IHE Web site.http://www.ihe.net/. Accessed April 14, 2007.
4. Siegel EL, Channin DS. Integrating the healthcareenterprise: a primer. RadioGraphics 2001;21:1339–1341.
5. Lester N, Durazzo T, Kaye A, Forman HP. Refer-ring physician attitudes toward international in-terpretation of teleradiology images. AJR Am JRoentgenol 2007;188(1):W1–W8.
6. Sunshine JH, Maynard CD, Paros J, Forman HP.Update on the diagnostic radiologist shortage.AJR Am J Roentgenol 2004;182:301–305.
PERSPECTIVES: Limitations, Risks, and Opportunities in Teleradiology Thrall
328 Radiology: Volume 244: Number 2—August 2007

Radiology 2007 This is your reprint order form or pro forma invoice
(Please keep a copy of this document for your records.)
Author Name _______________________________________________________________________________________________ Title of Article _______________________________________________________________________________________________ Issue of Journal_______________________________ Reprint # _____________ Publication Date ________________ Number of Pages_______________________________ KB # _____________ Symbol Radiology Color in Article? Yes / No (Please Circle) Please include the journal name and reprint number or manuscript number on your purchase order or other correspondence. Order and Shipping Information Reprint Costs (Please see page 2 of 2 for reprint costs/fees.) ________ Number of reprints ordered $_________
________ Number of color reprints ordered $_________
________ Number of covers ordered $_________
Subtotal $_________
Taxes $_________ (Add appropriate sales tax for Virginia, Maryland, Pennsylvania, and the District of Columbia or Canadian GST to the reprints if your order is to be shipped to these locations.)
First address included, add $32 for each additional shipping address $_________
TOTAL $_________
Shipping Address (cannot ship to a P.O. Box) Please Print Clearly Name ___________________________________________ Institution _________________________________________ Street ___________________________________________ City ____________________ State _____ Zip ___________ Country ___________________________________________ Quantity___________________ Fax ___________________ Phone: Day _________________ Evening _______________ E-mail Address _____________________________________ Additional Shipping Address* (cannot ship to a P.O. Box)
Name ___________________________________________ Institution _________________________________________ Street ___________________________________________ City ________________ State ______ Zip ___________
Country _________________________________________ Quantity __________________ Fax __________________ Phone: Day ________________ Evening ______________ E-mail Address ____________________________________ * Add $32 for each additional shipping address
Payment and Credit Card Details Enclosed: Personal Check ___________ Credit Card Payment Details _________ Checks must be paid in U.S. dollars and drawn on a U.S. Bank. Credit Card: __ VISA __ Am. Exp. __ MasterCard Card Number __________________________________ Expiration Date_________________________________ Signature: _____________________________________ Please send your order form and prepayment made payable to: Cadmus Reprints P.O. Box 751903 Charlotte, NC 28275-1903 Note: Do not send express packages to this location, PO Box.
FEIN #:541274108
Invoice or Credit Card Information Invoice Address Please Print Clearly Please complete Invoice address as it appears on credit card statement Name ____________________________________________ Institution ________________________________________ Department _______________________________________ Street ____________________________________________ City ________________________ State _____ Zip _______ Country ___________________________________________ Phone _____________________ Fax _________________ E-mail Address _____________________________________ Cadmus will process credit cards and Cadmus Journal
Services will appear on the credit card statement. If you don’t mail your order form, you may fax it to 410-820-9765 with
your credit card information. Signature __________________________________________ Date _______________________________________ Signature is required. By signing this form, the author agrees to accept the responsibility for the payment of reprints and/or all charges described in this document.
Reprint order forms and purchase orders or prepayments must be received 72 hours after receipt of form either by mail or by fax at 410-820-9765. It is the policy of Cadmus Reprints to issue one invoice per order.
Please print clearly.
Page 1 of 2 RB-9/22/06

Radiology 2007 Black and White Reprint Prices
Domestic (USA only) # of
Pages 50 100 200 300 400 500
1-4 $213 $228 $260 $278 $295 $313 5-8 $338 $373 $420 $453 $495 $530
9-12 $450 $500 $575 $635 $693 $755 13-16 $555 $623 $728 $805 $888 $965 17-20 $673 $753 $883 $990 $1,085 $1,185 21-24 $785 $880 $1,040 $1,165 $1,285 $1,413 25-28 $895 $1,010 $1,208 $1,350 $1,498 $1,638 29-32 $1,008 $1,143 $1,363 $1,525 $1,698 $1,865
Covers $95 $118 $218 $320 $428 $530
International (includes Canada and Mexico) # of
Pages 50 100 200 300 400 500
1-4 $263 $275 $330 $385 $430 $485 5-8 $415 $443 $555 $650 $753 $850
9-12 $563 $608 $773 $930 $1,070 $1,228 13-16 $698 $760 $988 $1,185 $1,388 $1,585 17-20 $848 $925 $1,203 $1,463 $1,705 $1,950 21-24 $985 $1,080 $1,420 $1,725 $2,025 $2,325 25-28 $1,135 $1,248 $1,640 $1,990 $2,350 $2,698 29-32 $1,273 $1,403 $1,863 $2,265 $2,673 $3,075
Covers $148 $168 $308 $463 $615 $768 Minimum order is 50 copies. For orders larger than 500 copies, please consult Cadmus Reprints at 800-407-9190. Reprint Cover Cover prices are listed above. The cover will include the publication title, article title, and author name in black. Shipping Shipping costs are included in the reprint prices. Domestic orders are shipped via UPS Ground service. Foreign orders are shipped via a proof of delivery air service. Multiple Shipments Orders can be shipped to more than one location. Please be aware that it will cost $32 for each additional location. Delivery Your order will be shipped within 2 weeks of the journal print date. Allow extra time for delivery.
Color Reprint Prices
Domestic (USA only) # of
Pages 50 100 200 300 400 500
1-4 $218 $233 $343 $460 $579 $697 5-8 $343 $388 $584 $825 $1,069 $1,311 9-12 $471 $503 $828 $1,196 $1,563 $1,935 13-16 $601 $633 $1,073 $1,562 $2,058 $2,547 17-20 $738 $767 $1,319 $1,940 $2,550 $3,164 21-24 $872 $899 $1,564 $2,308 $3,045 $3,790 25-28 $1,004 $1,035 $1,820 $2,678 $3,545 $4,403 29-32 $1,140 $1,173 $2,063 $3,048 $4,040 $5,028
Covers $95 $118 $218 $320 $428 $530
International (includes Canada and Mexico)) # of
Pages 50 100 200 300 400 500
1-4 $268 $280 $412 $568 $715 $871 5-8 $419 $457 $720 $1,022 $1,328 $1,633 9-12 $583 $610 $1,025 $1,492 $1,941 $2,407 13-16 $742 $770 $1,333 $1,943 $2,556 $3,167 17-20 $913 $941 $1,641 $2,412 $3,169 $3,929 21-24 $1,072 $1,100 $1,946 $2,867 $3,785 $4,703 25-28 $1,246 $1,274 $2,254 $3,318 $4,398 $5,463 29-32 $1,405 $1,433 $2,561 $3,788 $5,014 $6,237
Covers $148 $168 $308 $463 $615 $768 Tax Due Residents of Virginia, Maryland, Pennsylvania, and the District of Columbia are required to add the appropriate sales tax to each reprint order. For orders shipped to Canada, please add 7% Canadian GST unless exemption is claimed. Ordering Reprint order forms and purchase order or prepayment is required to process your order. Please reference journal name and reprint number or manuscript number on any correspondence. You may use the reverse side of this form as a proforma invoice. Please return your order form and prepayment to: Cadmus Reprints P.O. Box 751903 Charlotte, NC 28275-1903 Note: Do not send express packages to this location, PO Box. FEIN #:541274108 Please direct all inquiries to:
Rose A. Baynard 800-407-9190 (toll free number) 410-819-3966 (direct number) 410-820-9765 (FAX number)
[email protected] (e-mail)
Reprint Order Forms and purchase order or prepayments must be received 72 hours after receipt of form.
Page 2 of 2
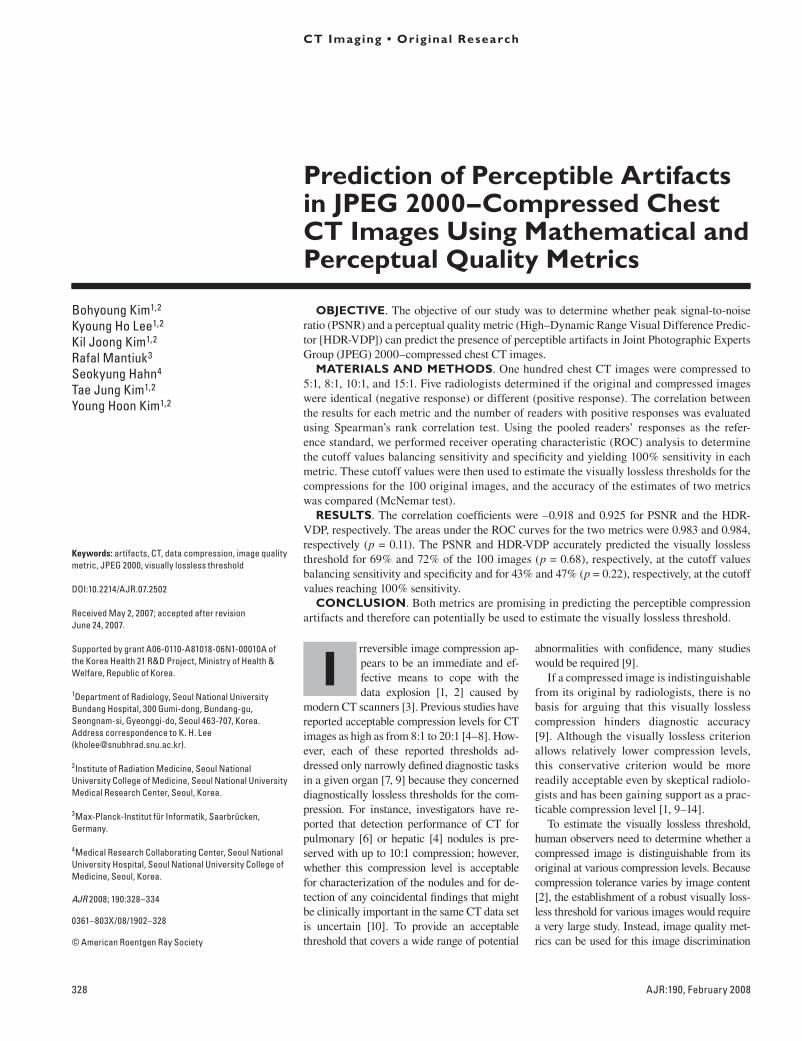
328 AJR:190, February 2008
abnormalities with confidence, many studies would be required [9].
If a compressed image is indistinguishable from its original by radiologists, there is no basis for arguing that this visually lossless compression hinders diagnostic accuracy [9]. Although the visually lossless criterion allows relatively lower compression levels, this conservative criterion would be more readily acceptable even by skeptical radiolo-gists and has been gaining support as a prac-ticable compression level [1, 9–14].
To estimate the visually lossless threshold, human observers need to determine whether a compressed image is distinguishable from its original at various compression levels. Because compression tolerance varies by image content [2], the establishment of a robust visually loss-less threshold for various images would require a very large study. Instead, image quality met-rics can be used for this image discrimination
Prediction of Perceptible Artifacts in JPEG 2000–Compressed Chest CT Images Using Mathematical and Perceptual Quality Metrics
Bohyoung Kim1,2 Kyoung Ho Lee1,2 Kil Joong Kim1,2
Rafal Mantiuk3
Seokyung Hahn4 Tae Jung Kim1,2
Young Hoon Kim1,2
Kim B, Lee KH, Kim KJ, et al.
1Department of Radiology, Seoul National University Bundang Hospital, 300 Gumi-dong, Bundang-gu, Seongnam-si, Gyeonggi-do, Seoul 463-707, Korea. Address correspondence to K. H. Lee ([email protected]). 2Institute of Radiation Medicine, Seoul National University College of Medicine, Seoul National University Medical Research Center, Seoul, Korea.
3Max-Planck-Institut für Informatik, Saarbrücken, Germany.
4Medical Research Collaborating Center, Seoul National University Hospital, Seoul National University College of Medicine, Seoul, Korea.
CT Imaging • Or ig ina l Research
AJR 2008; 190:328–334
0361–803X/08/1902–328
© American Roentgen Ray Society
Irreversible image compression ap-pears to be an immediate and ef-fective means to cope with the data explosion [1, 2] caused by
modern CT scanners [3]. Previous studies have reported acceptable compression levels for CT images as high as from 8:1 to 20:1 [4–8]. How-ever, each of these reported thresholds ad-dressed only narrowly defined diagnostic tasks in a given organ [7, 9] because they concerned diagnostically lossless thresholds for the com-pression. For instance, investigators have re-ported that detection performance of CT for pulmonary [6] or hepatic [4] nodules is pre-served with up to 10:1 compression; however, whether this compression level is acceptable for characterization of the nodules and for de-tection of any coincidental findings that might be clinically important in the same CT data set is uncertain [10]. To provide an acceptable threshold that covers a wide range of potential
Keywords: artifacts, CT, data compression, image quality metric, JPEG 2000, visually lossless threshold
DOI:10.2214/AJR.07.2502
Received May 2, 2007; accepted after revision June 24, 2007.
Supported by grant A06-0110-A81018-06N1-00010A of the Korea Health 21 R&D Project, Ministry of Health & Welfare, Republic of Korea.
OBJECTIVE. The objective of our study was to determine whether peak signal-to-noise ratio (PSNR) and a perceptual quality metric (High–Dynamic Range Visual Difference Predic-tor [HDR-VDP]) can predict the presence of perceptible artifacts in Joint Photographic Experts Group (JPEG) 2000–compressed chest CT images.
MATERIALS AND METHODS. One hundred chest CT images were compressed to 5:1, 8:1, 10:1, and 15:1. Five radiologists determined if the original and compressed images were identical (negative response) or different (positive response). The correlation between the results for each metric and the number of readers with positive responses was evaluated using Spearman’s rank correlation test. Using the pooled readers’ responses as the refer-ence standard, we performed receiver operating characteristic (ROC) analysis to determine the cutoff values balancing sensitivity and specificity and yielding 100% sensitivity in each metric. These cutoff values were then used to estimate the visually lossless thresholds for the compressions for the 100 original images, and the accuracy of the estimates of two metrics was compared (McNemar test).
RESULTS. The correlation coefficients were –0.918 and 0.925 for PSNR and the HDR-VDP, respectively. The areas under the ROC curves for the two metrics were 0.983 and 0.984, respectively (p = 0.11). The PSNR and HDR-VDP accurately predicted the visually lossless threshold for 69% and 72% of the 100 images (p = 0.68), respectively, at the cutoff values balancing sensitivity and specificity and for 43% and 47% (p = 0.22), respectively, at the cutoff values reaching 100% sensitivity.
CONCLUSION. Both metrics are promising in predicting the perceptible compression artifacts and therefore can potentially be used to estimate the visually lossless threshold.
Kim et al.Perceptible Artifacts in JPEG 2000–Compressed Chest CT Images
CT ImagingOriginal Research
AJR:190, February 2008 329
Perceptible Artifacts in JPEG 2000–Compressed Chest CT Images
task. These metrics include traditional math-ematical metrics, such as peak signal-to-noise ratio (PSNR), and computer-based perceptual metrics modeling the human visual system [15].
The purpose of this study was to determine whether PSNR and a perceptual metric, the High–Dynamic Range Difference Predictor (HDR-VDP) [16], can predict the presence of perceptible artifacts in Joint Photographic Experts Group (JPEG) 2000–compressed chest CT images and therefore can be used to estimate the visually lossless threshold for such compressions.
Materials and MethodsOur institutional review board approved this
study and waived informed patient consent.
CT ScanningThis study included 100 consecutive adult patients
(60 men and 40 women; age range, 19–94 years) who underwent contrast-enhanced chest CT using 16-MDCT scanners (Brilliance, Philips Medical Systems) during a period of 7 days in January 2006. The scanning parameters were as follows: detector collimation, 1.5 mm; gantry rotation time, 0.5 second; pitch, 1.19–1.25; tube potential, 120 kVp; and effective mAs, 109–185 (mean ± SD, 161 ± 18) using automatic tube current modulation. Reconstruction parameters were as follows: section thickness, 2 mm; section interval, 1 mm; medium-sharp reconstruction algorithm (filter type C); matrix, 512 × 512; and field of view, 210–391 mm.
One image containing the lung was randomly selected per patient to form a 100-image set. These images included 52 and 48 sections above and below the carina, respectively. The types of lesions shown in the images based on two body radiologists’ subjective classification are tabulated in Table 1; these radiologists reviewed the images together after completing their visual analyses, which we describe later. If an image contained more than two lesions, they chose the most prominent lesion by consensus.
Image CompressionThe 100 original images, having a bit depth
of 12 bits/pixel aligned on a 2-byte boundary, were irreversibly compressed to four levels (5:1, 8:1, 10:1, and 15:1) using a JPEG 2000 algorithm (PICS Tools, Pegasus Imaging Company). These compressed images were then decompressed, yielding 400 compressed (and then decompressed) images for comparison with their originals. The JPEG 2000 encoder was set to default settings: 9–7 wavelet filter for irreversible compression; single tile; six levels of wavelet decomposition; size of code-block, 64 × 64; size of precinct, 32,768 × 32,768; and a single layer. The actual compression
levels—that is, the ratio of the original 16 bits/pixel to the compressed size in bits/pixel—achieved for the four nominal levels were 5.00 ± 0.02 (mean ± SD), 8.00 ± 0.04, 10.01 ± 0.05, and 14.99 ± 0.11, respectively. The variations from the nominal levels were considered unimportant in this study. For subsequent analyses, window level and width were fixed at –600 and 1,500 H, respectively, which are the default lung window settings in our practice.
Human Observer AnalysisFive board-certified body radiologists partici-
pated. They had 4, 5, 5, 7, and 8 years of working experience in interpreting body CT findings, respectively.
Each of the 400 compressed images was paired with its original. The 400 image pairs were randomly assigned to one of eight reading sessions, avoiding repetition of a patient in a session. The order of reading sessions changed among the readers. Sessions were separated by a minimum of 2 weeks.
Each image pair was alternately displayed on a single monitor, and the order of the original and its compression was randomized. The reader selectively toggled between the two images, returning to the first image as desired. Each reader was blinded to the tested compression levels and independently determined whether the two images were identical (or indistinguishable) or different (or distinguishable). When making comparisons, the readers were asked to pay attention particularly to structural details, such as the small airways, pulmonary vessels, interlobular septa, and interlobar fissures, and to the texture of the organs. They were unaware that all images had been irreversibly compressed.
Images were displayed in a one-by-one format (1,483 × 1,483 pixels) using viewing software (PiView STAR, SmartPACS), a monochrome monitor (ME315, Totoku) with a matrix size of 1,536 × 2,048 and display size of 31.8 × 42.3 cm, and matching video hardware (LV32P1, Totoku). The display system was calibrated [17] with software (Medivisor Gray-Scale, Totoku) and a luminance meter (Minolta LS-110, Konica Minolta). The maximum and minimum luminances were 408.8 and 0.8 cd/m2, respectively. Ambient room light was subdued.
Images were presented with the lung window setting. Each reader reviewed the images without time constraints. The reading distance was limited to a range of 32–78 cm by aiming a laser beam in front of each reader’s forehead onto a ruler perpendicular to the monitor screen. The reading distance had been measured during 30 minutes of their clinical work. Limiting the reading distance was to reproduce our clinical practice because a
reading distance that was too close and one that was too far would artificially enhance and degrade the readers’ sensitivity to compression artifacts, respectively [10].
PSNRAfter converting the images to 8-bit images by
adjusting the window settings, PSNR (in decibels [dB]) was calculated as follows:
PSNR = 20 log10
RMSE = ( f (x, y) – g(x, y))2
5122
512
x = 1
,255
RMSE( )
∑512
y = 1
∑
where RMSE is the root-mean-square error and f(x, y) and g(x, y) are the pixel values in the original and compressed images, respectively.
Perceptual ModelSimilar to other perceptual metrics [15], the HDR-
VDP is a computational model that simulates low-level retinal processing of the human visual system. It is an extension of the Visual Difference Predictor (VDP) described by Daly [18] that improved prediction of perceptible image differences in the full visible range of luminance (high–dynamic range) by modeling local adaptation, nonlinear response of photoreceptors, and optics of the human eyes [16]. Because modern medical display systems offer higher–dynamic range and are significantly brighter than older cathode ray tube displays, the extended metric is more suitable for our application. The HDR-VDP takes two images as input and then outputs a probability-of-detection map in which the pixel value indicates the probability, ranging from 0 to 1, that an observer viewing the two images will detect the difference at that pixel location.
The model prediction was performed for the 400 image pairs after transforming each 8-bit image to high–dynamic range luminance format according to the display function of our display system. We set the same viewing conditions (matrix size, display size, reading distance range, and maximum luminance) for the model observer as those for the human observers. The Minkowski metric [19] with a summation parameter (β) of 2.4 was used to summarize the probability-of-detection map in a single numeric value [15].
Statistical AnalysisA biostatistician participated in the study design
and performed statistical analyses using statistical software (SAS software, version 9.1, SAS Institute). If a reader rated a compressed image as identical to the original, the response was coded as negative;
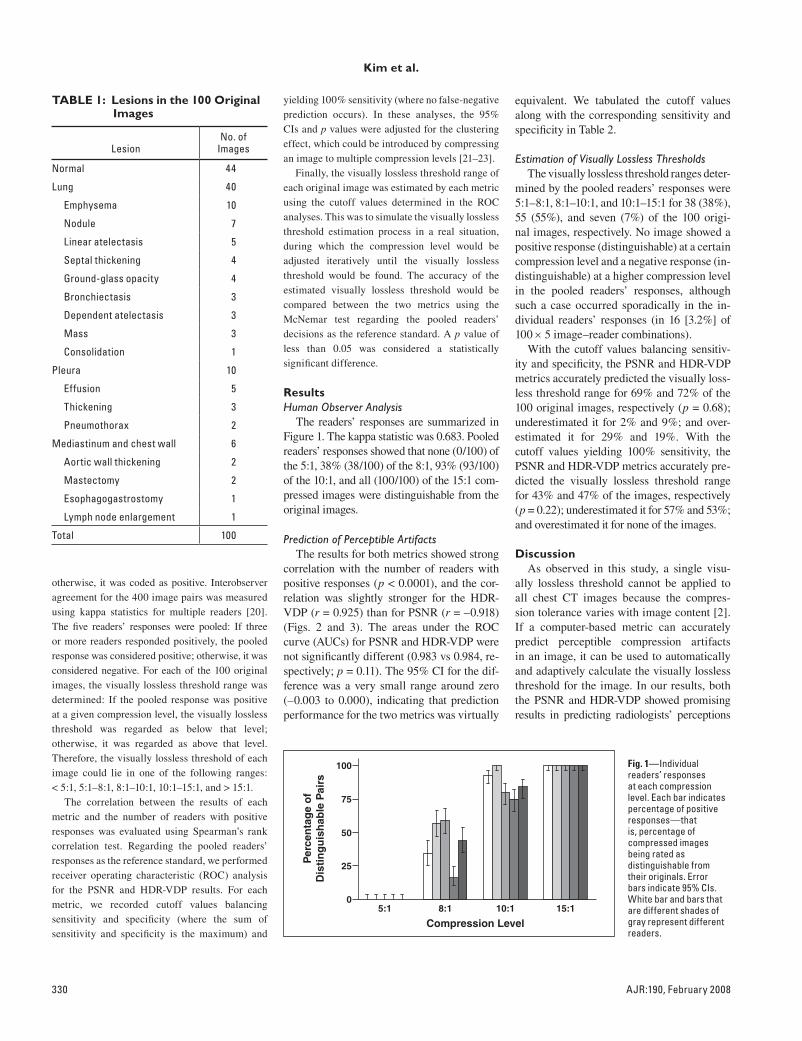
330 AJR:190, February 2008
Kim et al.
otherwise, it was coded as positive. Interobserver agreement for the 400 image pairs was measured using kappa statistics for multiple readers [20]. The five readers’ responses were pooled: If three or more readers responded positively, the pooled response was considered positive; otherwise, it was considered negative. For each of the 100 original images, the visually lossless threshold range was determined: If the pooled response was positive at a given compression level, the visually lossless threshold was regarded as below that level; otherwise, it was regarded as above that level. Therefore, the visually lossless threshold of each image could lie in one of the following ranges: < 5:1, 5:1–8:1, 8:1–10:1, 10:1–15:1, and > 15:1.
The correlation between the results of each metric and the number of readers with positive responses was evaluated using Spearman’s rank correlation test. Regarding the pooled readers’ responses as the reference standard, we performed receiver operating characteristic (ROC) analysis for the PSNR and HDR-VDP results. For each metric, we recorded cutoff values balancing sensitivity and specificity (where the sum of sensitivity and specificity is the maximum) and
yielding 100% sensitivity (where no false-negative prediction occurs). In these analyses, the 95% CIs and p values were adjusted for the clustering effect, which could be introduced by compressing an image to multiple compression levels [21–23].
Finally, the visually lossless threshold range of each original image was estimated by each metric using the cutoff values determined in the ROC analyses. This was to simulate the visually lossless threshold estimation process in a real situation, during which the compression level would be adjusted iteratively until the visually lossless threshold would be found. The accuracy of the estimated visually lossless threshold would be compared between the two metrics using the McNemar test regarding the pooled readers’ decisions as the reference standard. A p value of less than 0.05 was considered a statistically significant difference.
ResultsHuman Observer Analysis
The readers’ responses are summarized in Figure 1. The kappa statistic was 0.683. Pooled readers’ responses showed that none (0/100) of the 5:1, 38% (38/100) of the 8:1, 93% (93/100) of the 10:1, and all (100/100) of the 15:1 com-pressed images were distinguishable from the original images.
Prediction of Perceptible ArtifactsThe results for both metrics showed strong
correlation with the number of readers with positive responses (p < 0.0001), and the cor-relation was slightly stronger for the HDR-VDP (r = 0.925) than for PSNR (r = –0.918) (Figs. 2 and 3). The areas under the ROC curve (AUCs) for PSNR and HDR-VDP were not significantly different (0.983 vs 0.984, re-spectively; p = 0.11). The 95% CI for the dif-ference was a very small range around zero (–0.003 to 0.000), indicating that prediction performance for the two metrics was virtually
equivalent. We tabulated the cutoff values along with the corresponding sensitivity and specificity in Table 2.
Estimation of Visually Lossless ThresholdsThe visually lossless threshold ranges deter-
mined by the pooled readers’ responses were 5:1–8:1, 8:1–10:1, and 10:1–15:1 for 38 (38%), 55 (55%), and seven (7%) of the 100 origi-nal images, respectively. No image showed a positive response (distinguishable) at a certain compression level and a negative response (in-distinguishable) at a higher compression level in the pooled readers’ responses, although such a case occurred sporadically in the in-dividual readers’ responses (in 16 [3.2%] of 100 × 5 image–reader combinations).
With the cutoff values balancing sensitiv-ity and specificity, the PSNR and HDR-VDP metrics accurately predicted the visually loss-less threshold range for 69% and 72% of the 100 original images, respectively (p = 0.68); underestimated it for 2% and 9%; and over-estimated it for 29% and 19%. With the cutoff values yielding 100% sensitivity, the PSNR and HDR-VDP metrics accurately pre-dicted the visually lossless threshold range for 43% and 47% of the images, respectively (p = 0.22); underestimated it for 57% and 53%; and overestimated it for none of the images.
DiscussionAs observed in this study, a single visu-
ally lossless threshold cannot be applied to all chest CT images because the compres-sion tolerance varies with image content [2]. If a computer-based metric can accurately predict perceptible compression artifacts in an image, it can be used to automatically and adaptively calculate the visually lossless threshold for the image. In our results, both the PSNR and HDR-VDP showed promising results in predicting radiologists’ perceptions
TABLE 1: Lesions in the 100 Original Images
LesionNo. of
Images
Normal 44
Lung 40
Emphysema 10
Nodule 7
Linear atelectasis 5
Septal thickening 4
Ground-glass opacity 4
Bronchiectasis 3
Dependent atelectasis 3
Mass 3
Consolidation 1
Pleura 10
Effusion 5
Thickening 3
Pneumothorax 2
Mediastinum and chest wall 6
Aortic wall thickening 2
Mastectomy 2
Esophagogastrostomy 1
Lymph node enlargement 1
Total 100
0
25
50
75
100
8:15:1 10:1
Compression Level
Per
cen
tag
e o
fD
isti
ng
uis
hab
le P
airs
15:1
Fig. 1—Individual readers’ responses at each compression level. Each bar indicates percentage of positive responses—that is, percentage of compressed images being rated as distinguishable from their originals. Error bars indicate 95% CIs. White bar and bars that are different shades of gray represent different readers.
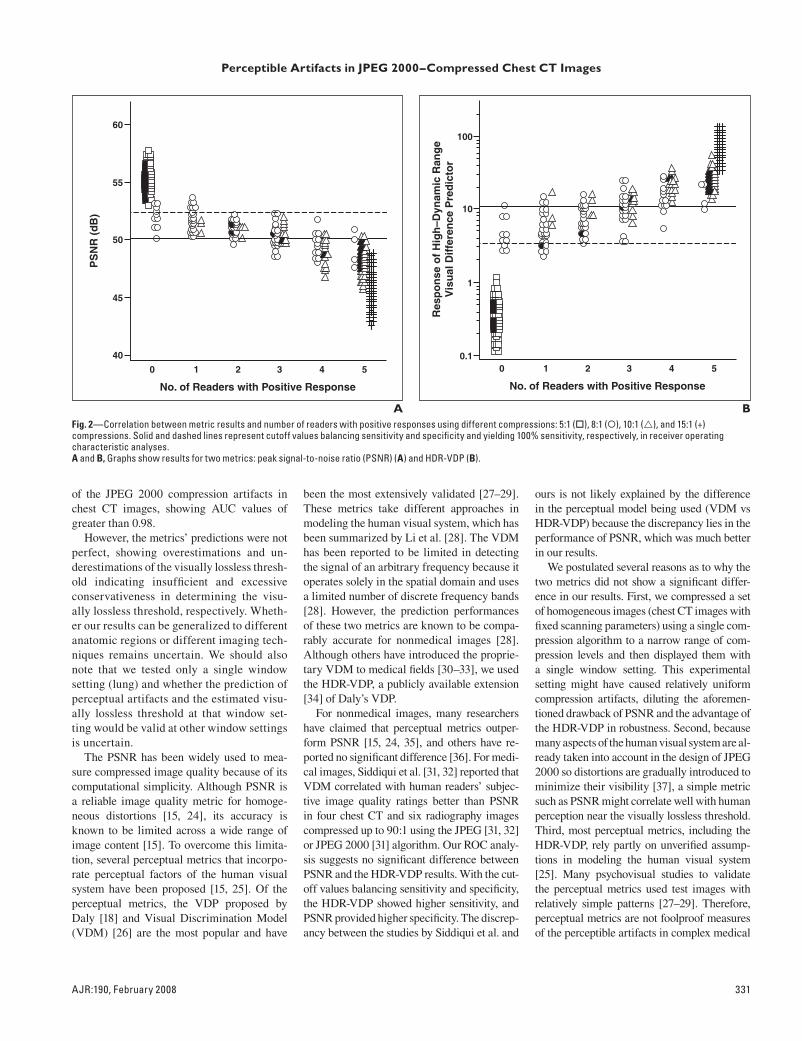
AJR:190, February 2008 331
Perceptible Artifacts in JPEG 2000–Compressed Chest CT Images
of the JPEG 2000 compression artifacts in chest CT images, showing AUC values of greater than 0.98.
However, the metrics’ predictions were not perfect, showing overestimations and un-derestimations of the visually lossless thresh-old indicating insufficient and excessive conservativeness in determining the visu-ally lossless threshold, respectively. Wheth-er our results can be generalized to different anatomic regions or different imaging tech-niques remains uncertain. We should also note that we tested only a single window setting (lung) and whether the prediction of perceptual artifacts and the estimated visu-ally lossless threshold at that window set-ting would be valid at other window settings is uncertain.
The PSNR has been widely used to mea-sure compressed image quality because of its computational simplicity. Although PSNR is a reliable image quality metric for homoge-neous distortions [15, 24], its accuracy is known to be limited across a wide range of image content [15]. To overcome this limita-tion, several perceptual metrics that incorpo-rate perceptual factors of the human visual system have been proposed [15, 25]. Of the perceptual metrics, the VDP proposed by Daly [18] and Visual Discrimination Model (VDM) [26] are the most popular and have
been the most extensively validated [27–29]. These metrics take different approaches in modeling the human visual system, which has been summarized by Li et al. [28]. The VDM has been reported to be limited in detecting the signal of an arbitrary frequency because it operates solely in the spatial domain and uses a limited number of discrete frequency bands [28]. However, the prediction performances of these two metrics are known to be compa-rably accurate for nonmedical images [28]. Although others have introduced the proprie-tary VDM to medical fields [30–33], we used the HDR-VDP, a publicly available extension [34] of Daly’s VDP.
For nonmedical images, many researchers have claimed that perceptual metrics outper-form PSNR [15, 24, 35], and others have re-ported no significant difference [36]. For medi-cal images, Siddiqui et al. [31, 32] reported that VDM correlated with human readers’ subjec-tive image quality ratings better than PSNR in four chest CT and six radiography images compressed up to 90:1 using the JPEG [31, 32] or JPEG 2000 [31] algorithm. Our ROC analy-sis suggests no significant difference between PSNR and the HDR-VDP results. With the cut-off values balancing sensitivity and specificity, the HDR-VDP showed higher sensitivity, and PSNR provided higher specificity. The discrep-ancy between the studies by Siddiqui et al. and
40
45
50
55
0 1 2 3 4 5
No. of Readers with Positive Response
PS
NR
(d
B)
60
A BFig. 2—Correlation between metric results and number of readers with positive responses using different compressions: 5:1 (), 8:1 (), 10:1 (), and 15:1 (+) compressions. Solid and dashed lines represent cutoff values balancing sensitivity and specificity and yielding 100% sensitivity, respectively, in receiver operating characteristic analyses.A and B, Graphs show results for two metrics: peak signal-to-noise ratio (PSNR) (A) and HDR-VDP (B).
0.1
1
0 1 2 3 4 5
No. of Readers with Positive Response
Res
po
nse
of
Hig
h–D
ynam
ic R
ang
eV
isu
al D
iffe
ren
ce P
red
icto
r
100
10
ours is not likely explained by the difference in the perceptual model being used (VDM vs HDR-VDP) because the discrepancy lies in the performance of PSNR, which was much better in our results.
We postulated several reasons as to why the two metrics did not show a significant differ-ence in our results. First, we compressed a set of homogeneous images (chest CT images with fixed scanning parameters) using a single com-pression algorithm to a narrow range of com-pression levels and then displayed them with a single window setting. This experimental setting might have caused relatively uniform compression artifacts, diluting the aforemen-tioned drawback of PSNR and the advantage of the HDR-VDP in robustness. Second, because many aspects of the human visual system are al-ready taken into account in the design of JPEG 2000 so distortions are gradually introduced to minimize their visibility [37], a simple metric such as PSNR might correlate well with human perception near the visually lossless threshold. Third, most perceptual metrics, including the HDR-VDP, rely partly on unverified assump-tions in modeling the human visual system [25]. Many psychovisual studies to validate the perceptual metrics used test images with relatively simple patterns [27–29]. Therefore, perceptual metrics are not foolproof measures of the perceptible artifacts in complex medical
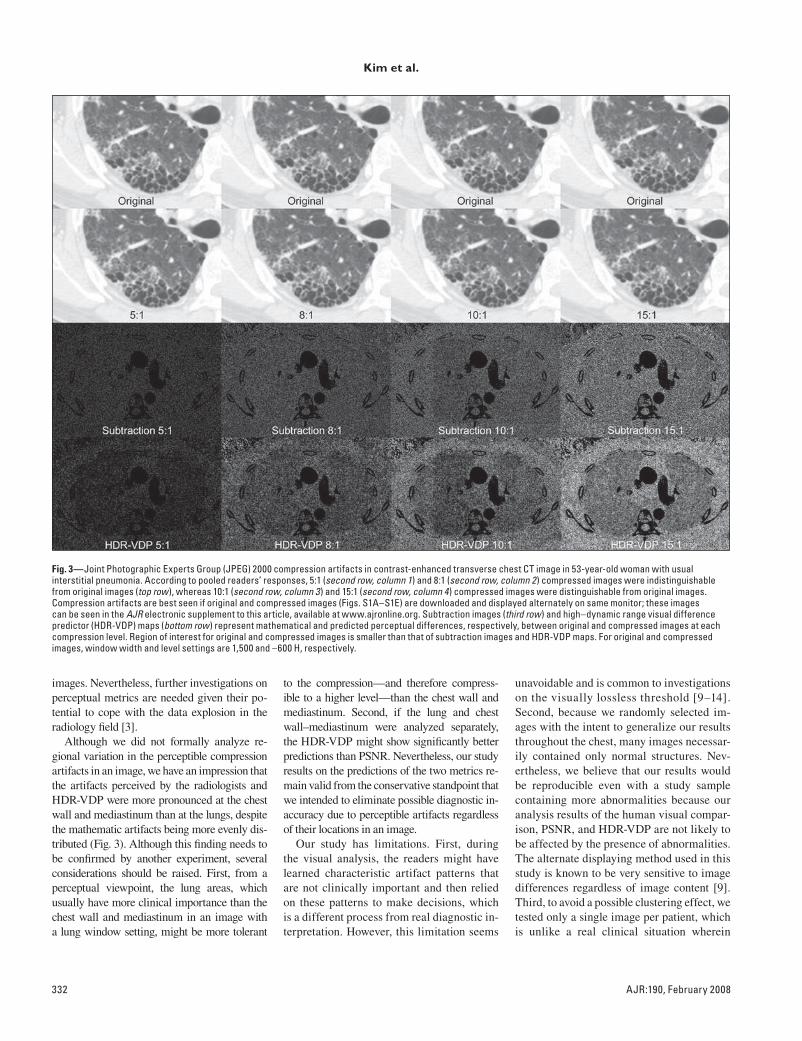
332 AJR:190, February 2008
Kim et al.
Fig. 3—Joint Photographic Experts Group (JPEG) 2000 compression artifacts in contrast-enhanced transverse chest CT image in 53-year-old woman with usual interstitial pneumonia. According to pooled readers’ responses, 5:1 (second row, column 1) and 8:1 (second row, column 2) compressed images were indistinguishable from original images (top row), whereas 10:1 (second row, column 3) and 15:1 (second row, column 4) compressed images were distinguishable from original images. Compression artifacts are best seen if original and compressed images (Figs. S1A–S1E) are downloaded and displayed alternately on same monitor; these images can be seen in the AJR electronic supplement to this article, available at www.ajronline.org. Subtraction images (third row) and high–dynamic range visual difference predictor (HDR-VDP) maps (bottom row) represent mathematical and predicted perceptual differences, respectively, between original and compressed images at each compression level. Region of interest for original and compressed images is smaller than that of subtraction images and HDR-VDP maps. For original and compressed images, window width and level settings are 1,500 and –600 H, respectively.
images. Nevertheless, further investigations on perceptual metrics are needed given their po-tential to cope with the data explosion in the radiology field [3].
Although we did not formally analyze re-gional variation in the perceptible compression artifacts in an image, we have an impression that the artifacts perceived by the radiologists and HDR-VDP were more pronounced at the chest wall and mediastinum than at the lungs, despite the mathematic artifacts being more evenly dis-tributed (Fig. 3). Although this finding needs to be confirmed by another experiment, several considerations should be raised. First, from a perceptual viewpoint, the lung areas, which usually have more clinical importance than the chest wall and mediastinum in an image with a lung window setting, might be more tolerant
to the compression—and therefore compress-ible to a higher level—than the chest wall and mediastinum. Second, if the lung and chest wall–mediastinum were analyzed separately, the HDR-VDP might show significantly better predictions than PSNR. Nevertheless, our study results on the predictions of the two metrics re-main valid from the conservative standpoint that we intended to eliminate possible diagnostic in-accuracy due to perceptible artifacts regardless of their locations in an image.
Our study has limitations. First, during the visual analysis, the readers might have learned characteristic artifact patterns that are not clinically important and then relied on these patterns to make decisions, which is a different process from real diagnostic in-terpretation. However, this limitation seems
unavoidable and is common to investigations on the visually lossless threshold [9–14]. Second, because we randomly selected im-ages with the intent to generalize our results throughout the chest, many images necessar-ily contained only normal structures. Nev-ertheless, we believe that our results would be reproducible even with a study sample containing more abnormalities because our analysis results of the human visual compar-ison, PSNR, and HDR-VDP are not likely to be affected by the presence of abnormalities. The alternate displaying method used in this study is known to be very sensitive to image differences regardless of image content [9]. Third, to avoid a possible clustering effect, we tested only a single image per patient, which is unlike a real clinical situation wherein
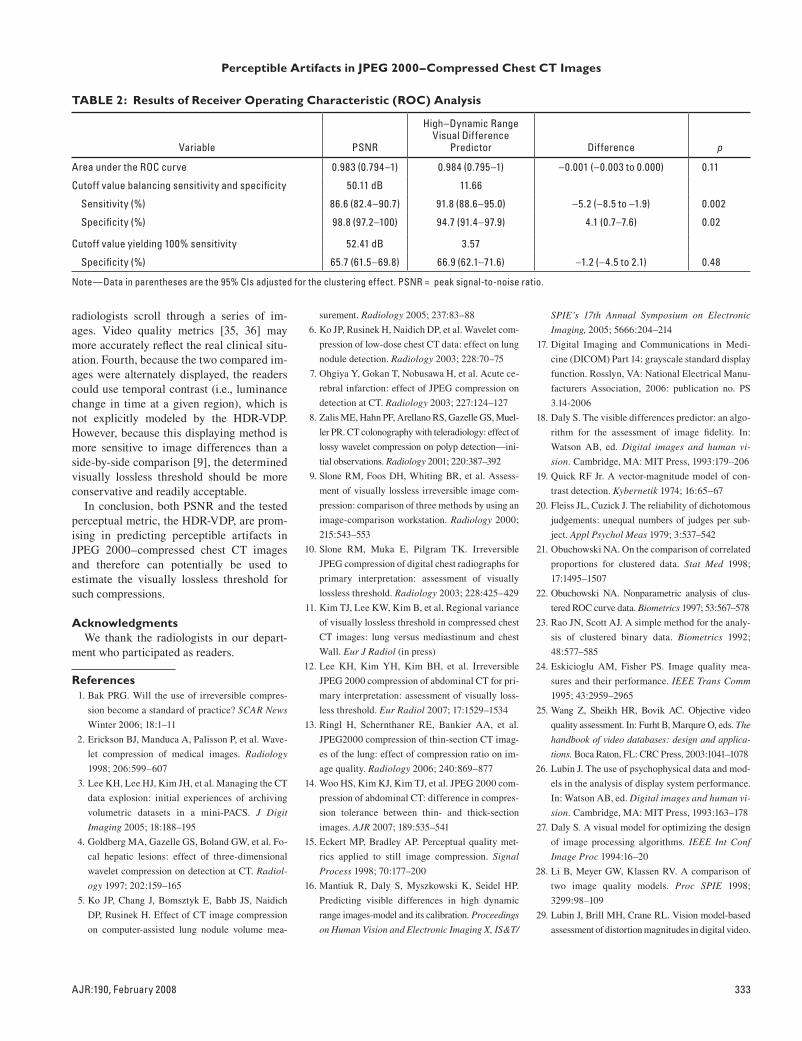
AJR:190, February 2008 333
Perceptible Artifacts in JPEG 2000–Compressed Chest CT Images
radiologists scroll through a series of im-ages. Video quality metrics [35, 36] may more accurately reflect the real clinical situ-ation. Fourth, because the two compared im-ages were alternately displayed, the readers could use temporal contrast (i.e., luminance change in time at a given region), which is not explicitly modeled by the HDR-VDP. However, because this displaying method is more sensitive to image differences than a side-by-side comparison [9], the determined visually lossless threshold should be more conservative and readily acceptable.
In conclusion, both PSNR and the tested perceptual metric, the HDR-VDP, are prom-ising in predicting perceptible artifacts in JPEG 2000–compressed chest CT images and therefore can potentially be used to estimate the visually lossless threshold for such compressions.
AcknowledgmentsWe thank the radiologists in our depart-
ment who participated as readers.
References 1. Bak PRG. Will the use of irreversible compres-
sion become a standard of practice? SCAR News
Winter 2006; 18:1–11
2. Erickson BJ, Manduca A, Palisson P, et al. Wave-
let compression of medical images. Radiology
1998; 206:599–607
3. Lee KH, Lee HJ, Kim JH, et al. Managing the CT
data explosion: initial experiences of archiving
volumetric datasets in a mini-PACS. J Digit
Imaging 2005; 18:188–195
4. Goldberg MA, Gazelle GS, Boland GW, et al. Fo-
cal hepatic lesions: effect of three-dimensional
wavelet compression on detection at CT. Radiol-
ogy 1997; 202:159–165
5. Ko JP, Chang J, Bomsztyk E, Babb JS, Naidich
DP, Rusinek H. Effect of CT image compression
on computer-assisted lung nodule volume mea-
surement. Radiology 2005; 237:83–88
6. Ko JP, Rusinek H, Naidich DP, et al. Wavelet com-
pression of low-dose chest CT data: effect on lung
nodule detection. Radiology 2003; 228:70–75
7. Ohgiya Y, Gokan T, Nobusawa H, et al. Acute ce-
rebral infarction: effect of JPEG compression on
detection at CT. Radiology 2003; 227:124–127
8. Zalis ME, Hahn PF, Arellano RS, Gazelle GS, Muel-
ler PR. CT colonography with teleradiology: effect of
lossy wavelet compression on polyp detection—ini-
tial observations. Radiology 2001; 220:387–392
9. Slone RM, Foos DH, Whiting BR, et al. Assess-
ment of visually lossless irreversible image com-
pression: comparison of three methods by using an
image-comparison workstation. Radiology 2000;
215:543–553
10. Slone RM, Muka E, Pilgram TK. Irreversible
JPEG compression of digital chest radiographs for
primary interpretation: assessment of visually
lossless threshold. Radiology 2003; 228:425–429
11. Kim TJ, Lee KW, Kim B, et al. Regional variance
of visually lossless threshold in compressed chest
CT images: lung versus mediastinum and chest
Wall. Eur J Radiol (in press)
12. Lee KH, Kim YH, Kim BH, et al. Irreversible
JPEG 2000 compression of abdominal CT for pri-
mary interpretation: assessment of visually loss-
less threshold. Eur Radiol 2007; 17:1529–1534
13. Ringl H, Schernthaner RE, Bankier AA, et al.
JPEG2000 compression of thin-section CT imag-
es of the lung: effect of compression ratio on im-
age quality. Radiology 2006; 240:869–877
14. Woo HS, Kim KJ, Kim TJ, et al. JPEG 2000 com-
pression of abdominal CT: difference in compres-
sion tolerance between thin- and thick-section
images. AJR 2007; 189:535–541
15. Eckert MP, Bradley AP. Perceptual quality met-
rics applied to still image compression. Signal
Process 1998; 70:177–200
16. Mantiuk R, Daly S, Myszkowski K, Seidel HP.
Predicting visible differences in high dynamic
range images-model and its calibration. Proceedings
on Human Vision and Electronic Imaging X, IS&T/
SPIE’s 17th Annual Symposium on Electronic
Imaging, 2005; 5666:204–214
17. Digital Imaging and Communications in Medi-
cine (DICOM) Part 14: grayscale standard display
function. Rosslyn, VA: National Electrical Manu-
facturers Association, 2006: publication no. PS
3.14-2006
18. Daly S. The visible differences predictor: an algo-
rithm for the assessment of image fidelity. In:
Watson AB, ed. Digital images and human vi-
sion. Cambridge, MA: MIT Press, 1993:179–206
19. Quick RF Jr. A vector-magnitude model of con-
trast detection. Kybernetik 1974; 16:65–67
20. Fleiss JL, Cuzick J. The reliability of dichotomous
judgements: unequal numbers of judges per sub-
ject. Appl Psychol Meas 1979; 3:537–542
21. Obuchowski NA. On the comparison of correlated
proportions for clustered data. Stat Med 1998;
17:1495–1507
22. Obuchowski NA. Nonparametric analysis of clus-
tered ROC curve data. Biometrics 1997; 53:567–578
23. Rao JN, Scott AJ. A simple method for the analy-
sis of clustered binary data. Biometrics 1992;
48:577–585
24. Eskicioglu AM, Fisher PS. Image quality mea-
sures and their performance. IEEE Trans Comm
1995; 43:2959–2965
25. Wang Z, Sheikh HR, Bovik AC. Objective video
quality assessment. In: Furht B, Marqure O, eds. The
handbook of video databases: design and applica-
tions. Boca Raton, FL: CRC Press, 2003:1041–1078
26. Lubin J. The use of psychophysical data and mod-
els in the analysis of display system performance.
In: Watson AB, ed. Digital images and human vi-
sion. Cambridge, MA: MIT Press, 1993:163–178
27. Daly S. A visual model for optimizing the design
of image processing algorithms. IEEE Int Conf
Image Proc 1994:16–20
28. Li B, Meyer GW, Klassen RV. A comparison of
two image quality models. Proc SPIE 1998;
3299:98–109
29. Lubin J, Brill MH, Crane RL. Vision model-based
assessment of distortion magnitudes in digital video.
TABLE 2: Results of Receiver Operating Characteristic (ROC) Analysis
Variable PSNR
High–Dynamic Range Visual Difference
Predictor Difference p
Area under the ROC curve 0.983 (0.794–1) 0.984 (0.795–1) –0.001 (–0.003 to 0.000) 0.11
Cutoff value balancing sensitivity and specificity 50.11 dB 11.66
Sensitivity (%) 86.6 (82.4–90.7) 91.8 (88.6–95.0) –5.2 (–8.5 to –1.9) 0.002
Specificity (%) 98.8 (97.2–100) 94.7 (91.4–97.9) 4.1 (0.7–7.6) 0.02
Cutoff value yielding 100% sensitivity 52.41 dB 3.57
Specificity (%) 65.7 (61.5–69.8) 66.9 (62.1–71.6) –1.2 (–4.5 to 2.1) 0.48
Note—Data in parentheses are the 95% CIs adjusted for the clustering effect. PSNR = peak signal-to-noise ratio.

334 AJR:190, February 2008
Kim et al.
F O R Y O U R I N F O R M A T I O N
A data supplement for this article can be viewed in the online version of the article at: www.ajronline.org.
www.mpeg.org/MPEG/JND/. Accessed July 4,
2006
30. Krupinski EA, Johnson J, Roehrig H, et al. Using
a human visual system model to optimize soft-
copy mammography display. Acad Radiol 2003;
10:1030–1035
31. Siddiqui KM, Johnson JP, Reiner BI, Siegel EL.
Discrete cosine transform JPEG compression vs.
2D JPEG2000 compression: JNDmetrix visual
discrimination model image quality analysis.
Proc SPIE 2005; 5748:202–207
32. Siddiqui KM, Siegel EL, Reiner BI, Johnson JP.
Correlation of radiologists’ image quality percep-
tion with quantitative assessment parameters:
just-noticeable difference vs. peak signal-to-noise
ratios. Proc SPIE 2005; 5748:58–64
33. Siegel EL, Siddiqui KM, Johnson JP, et al. Com-
pression of multislice CT: 2D vs. 3D JPEG2000
and effects of slice thickness. Proc SPIE 2005;
5748:162–170
34. Mantiuk R. HDR visual difference predictor.
sourceforge.net/projects/hdrvdp. Accessed July
4, 2006
35. Final report from the Video Quality Experts Group
on the validation of objective models of video qual-
ity assessment, phase II. www.its.bldrdoc.gov/vqeg/
projects/frtv_phaseII/downloads/VQEGII_Final_
Report.pdf. Accessed July 4, 2006
36. Final report from the Video Quality Experts
Group on the validation of objective models of
video quality assessment. www.its.bldrdoc.gov/
vqeg/projects/frtv_phaseI/COM-80E_final_re-
port.pdf. Accessed July 4, 2006
37. Rabbani M, Joshi R. An overview of the
JPEG2000 still image compression standard. Sig-
nal Process: Image Comm 2002; 17:3–48