aaptp 06-06 final report 01-31-11 - eng.auburn.edu · fhwa and other highway agency procedures ......
TRANSCRIPT

Final Report
AAPTP 06-06
LIFE CYCLE COST ANALYSIS FOR AIRPORT PAVEMENTS
Prepared For:
Airfield Asphalt Pavement Technology Program (AAPTP)
277 Technology Parkway
Auburn, AL 36830
Prepared By:
Applied Research Associates, Inc.
100 Trade Centre Drive, Suite 200
Champaign, IL 61820
January 2011


i
TABLE OF CONTENTS
CHAPTER 1. INTRODUCTION .................................................................................................. 1
Background ................................................................................................................................. 1
History of LCCA ......................................................................................................................... 3
Problem Statement ...................................................................................................................... 7
Project Objectives and Scope ...................................................................................................... 8
Overview of Report ..................................................................................................................... 8
CHAPTER 2. STATE OF THE TECHNOLOGY IN PAVEMENT LCCA ............................... 10
LCCA Procedures ..................................................................................................................... 12
Airport Sponsor/Consultant Procedures ................................................................................ 12
FHWA and Other Highway Agency Procedures ...................................................................... 14
Pavement Alternate Bidding Procedures ................................................................................... 22
Airport Sponsor/Consultant Procedures ................................................................................ 22
FHWA and Other Highway Agency Procedures ................................................................... 23
Louisiana DOTD ................................................................................................................... 25
Missouri DOT ........................................................................................................................ 27
Other Agencies ...................................................................................................................... 28
Summary of Experiences with Alternate Bidding ..................................................................... 28
LCCA Software Programs ........................................................................................................ 29
Airport Sponsor/Consultant Programs................................................................................... 29
FHWA and Other Highway Agency Programs ..................................................................... 29
CHAPTER 3. GUIDELINES FOR CONDUCTING AIRPORT PAVEMENT LCCA .............. 32
Introduction ............................................................................................................................... 32
LCCA Applications ................................................................................................................... 33
Recommended LCCA Practice ................................................................................................. 34
Overview ............................................................................................................................... 34
Step 1—Define Project Scope ............................................................................................... 36
Step 2—Establish LCCA Framework ................................................................................... 37
Cost Factors ........................................................................................................................... 40
Statistical Computation Approach ......................................................................................... 43

ii
Step 3—Develop Alternative Pavement Strategies ................................................................... 46
Step 4—Determine Pavement Performance and M&R Activity Timing .................................. 46
Service Lives of Initial Pavement and Future Rehabilitation Treatments ............................. 47
Timing and Extent of M&R Treatments ................................................................................ 53
Step 5—Estimate Direct/Owner Costs ...................................................................................... 54
Physical Costs of Pavement Activities .................................................................................. 55
Salvage Value ........................................................................................................................ 57
Supplemental Costs ............................................................................................................... 59
Step 6—Estimate Indirect/User Costs ....................................................................................... 59
Step 7—Develop Expenditure Stream Diagrams ...................................................................... 64
Step 8—Compute Life Cycle Costs .......................................................................................... 64
Step 9—Analyze/Interpret Results ............................................................................................ 66
Step 10—Reevaluate Strategies ................................................................................................ 72
CHAPTER 4. DEVELOPMENT OF THE LCCA PROGRAM FOR AIRPORT PAVEMENTS
....................................................................................................................................................... 74
CHAPTER 5. SUMMARY AND RECOMMENDATIONS ...................................................... 76
Summary ................................................................................................................................... 76
Recommendations ..................................................................................................................... 78
REFERENCES ............................................................................................................................. 79
APPENDIX A. AIRPORT SPONSOR/CONSULTANT LCCA SPREADSHEETS
APPENDIX B. HIGHWAY AGENCY LCCA PROGRAMS
APPENDIX C. AIRCOST USER MANUAL

iii
LIST OF FIGURES
Figure 1. Example of LADOTD A+B+C bid form .....................................................................27
Figure 2. Example of a deterministic-based LCCA for an airport pavement project. ................30
Figure 3. Process for conducting airport pavement LCCA (adapted from Walls and Smith, ........
1998). ....................................................................................................................35
Figure 4. Example illustration of deterministic sensitivity analysis ...........................................45
Figure 5. Illustration of the probabilistic LCCA process (ARA, 2004) ......................................45
Figure 6. Example pavement life-cycle model ............................................................................47
Figure 7. PCI deterioration curve for a family of pavements ......................................................49
Figure 8. Service life estimation for a family of pavements .......................................................50
Figure 9. Pavement survival curve for selected pavement family ..............................................53
Figure 10. Example of pay item unit price development ..............................................................56
Figure 11. Colorado DOT’s process for estimating initial costs (CDOT, 2009) ..........................56
Figure 12. Illustration of remaining life salvage values ................................................................58
Figure 13. Example expenditure stream diagram ..........................................................................64
Figure 14 NPW frequency distributions for alternative strategies A and B .................................70
Figure 15. NPW cumulative distributions for alternative strategies A and B ...............................70
Figure 16. Risk assessment—NPW frequency distributions.........................................................71
Figure 17. Risk assessment—NPW cumulative distributions .......................................................72
Figure 18. Sensitivity of factors affecting the NPW of a particular pavement strategy ................73

iv
LIST OF TABLES
Table 1. Summary of LCCA guide/report documents and software programs reviewed ..........11
Table 2. Pavement alternate bidding documents reviewed ........................................................12
Table 3. Summary of selected State and Provincial highway agency LCCA practices ................
(ERES, 2003; ARA, 2008) ..........................................................................................18
Table 4. Summary of highway agency LCCA practices based on recent national surveys .......21
Table 5. Performance history of a selected pavement family ....................................................51
Table 6. Pavement survival analysis table .................................................................................52
Table 7. Construction cost location adjustment factors (AFCESA, 2007) ................................57
Table 8. Example application of estimating supplemental costs ...............................................59
Table 9. Estimation of airport operating revenue losses due to construction and
rehabilitation activities .................................................................................................63
Table 10. Process for tallying life-cycle cost results on a trial-by-trial basis ..............................67
Table 11. Life-cycle cost probability matrix for trial-by-trial comparison example (ARA, 2004)68

v
ACKNOWLEDGMENTS
This report was prepared for Auburn University under the Airport Asphalt Pavement Technology
Program (AAPTP). Funding was provided by the Federal Aviation Administration (FAA) under
Cooperative Agreement Number 04-G-038. Dr. David Brill was the Contracting Officer’s
Technical Representative and serves as a Program Manager in the FAA Airport Technology
Branch at the William J. Hughes Technical Center. Mr. Monte Symons served as the Project
Director for this project. The AAPTP and the FAA thank the Project Technical Panel that
willingly gave of their expertise and time for the development of this report. They were
responsible for the oversight and the technical direction. The names of those individuals on the
Project Technical Panel follow:
Mr. Monte Symons, AAPTP.
Mr. Rodney Joel, Federal Aviation Administration.
Mr. Michael Moore, Reynolds, Smith, & Hills, Inc.
Mr. William Schauz, US Air Force Civil Engineering Support Agency
Mr. Michael Smith, Federal Highway Administration (FHWA).
Mr. Gary Mitchell, American Concrete Pavement Association.
Mr. Kent Hansen, National Asphalt Pavement Association.
Others who participated in Panel meetings included:
Nathaniel Coley, FHWA.
Bill Tudor, Campbell & Paris—Atlanta.
Tashia Clemens, FHWA.
Nadarajah Sivaneswaran (Siva), FHWA.

vi
DISCLAIMER
The contents of this report reflect the views of the authors, who are responsible for the facts and
the accuracy of the data presented within. The contents do not necessarily reflect the official
views and polices of the Federal Aviation Administration. This report does not constitute a
standard, specification, or regulation.
vii
ABSTRACT
The objective of this study was to provide a comprehensive document that describes life cycle
cost analysis (LCCA) for airport pavements, along with a companion spreadsheet based tool for
conducting LCCA. The methodology developed is applicable to both flexible and rigid airport
pavements and addresses all aspects of LCCA. The intent of the methodology is to provide
engineers and airport management with a fair, unbiased, and defensible procedure to evaluate
alternative pavement types during the design and/or bid process. The results of the project
provide airport consultants and management with information to meet Federal Aviation
Administration Order 5100.38C, paragraph 910, Life Cycle Costs in Competitive Sealed Bids.
This report addresses the following items:
Airport pavement construction, maintenance, and rehabilitation activities that are to be
used in airport pavement LCCA procedures.
Typical costs and sources of data for costs of all elements used in LCCA.
Use of airport pavement management data and systems in LCCA procedures.
Review of other appropriate LCCA methods and their applicability to airport pavements.
The LCCA methodology developed under this study considers:
Applicability of different types of cost comparisons, such as present worth and equivalent
uniform annual cost.
Process for fair comparison of remaining service life of rigid and flexible pavement
systems.
Guidance and data sources to determine appropriate discount rates.
Guidance for analysis period and difference to pavement system design life.
Guidance for evaluating both direct and indirect user and operator costs.
Deterministic and probabilistic life cycle cost methods.

1
CHAPTER 1. INTRODUCTION
Background
The conduct of life cycle cost analysis (LCCA) for airport pavement projects in the US civil
arena is governed primarily by Federal Aviation Administration (FAA) Order 5100.38C and
Advisory Circular (AC) 150/5320-6D. Section 508 of FAA Order 5100.38C states:
Life-cycle costs shall be considered in AIP procurement where specified in bidding
documents. This is a requirement of Title 49, Code of Federal Regulations, Part 18.
Life-cycle costs are defined to encompass the entire period facilities or equipment
progress through a budget, including the stages for the airport planning, construction,
commission, operating, management, maintenance, repair, improvements, and activities
decommissioning the project. Regional personnel should exercise care to treat life-cycle
airport costs fairly for sponsors without requiring unreasonable initial capital
expenditures.
In Section 910 of Order 5100.38C, FAA Airports Offices are directed to “encourage life-cycle
costing” when the following conditions can be met:
1. The invitation for bid (IFB) states that life-cycle costs will be used in determining the
low bidder;
2. The factors to be considered are specified and the costs associated with the factors
must be quantifiable: (a) “Specified” means that the invitation for bid specifically
states the factors that will be included in the life-cycle cost computation. Examples
of factors that could be specified include annual fuel consumption for a motor
vehicle, electrical consumption, and lamp replacement for lighting equipment,
recurring inspection, and maintenance. All factors that have quantifiable costs should
be specified in the bidding document. (b) “Quantifiable” means that there is
sufficient information available so that costs associated with these factors can be
readily calculated. Generally, costs associated with maintenance should only be

2
included in the life-cycle costs computation if a fair and accurate calculation of such
costs can be made. Maintenance costs, if used, should be independently validated.
3. The IFBs must explain how the costs for each of the specified factors will be
calculated: (a) The costs associated with a factor can vary substantially depending
upon how they are calculated. For this reason, any assumptions that will be used in
making the calculations should be included in the bidding document. (b) The period
of time over which the life cycle costs will be calculated should also be stated.”
Section 910 then states: “The item that meets the bidding specification and has the lowest life
cycle cost is the successful bid. Sponsors desiring to use the life-cycle cost concept should be
advised to consult with their FAA Airports Office before issuing an IFB to assure that their
procurement procedure will meet grant requirements.”
Guidance in conducting pavement LCCA is provided in appendix 1 of AC 150/5320-6D. A step-
by-step procedure for conducting the LCCA and determining pavement type is given, along with
recommendations for using the net present worth (NPW) economic analysis formula, a 4 percent
discount rate, and a 20-year analysis period for evaluating airport pavement design or
rehabilitation alternatives. NPW (sometimes called net present value, or NPV) is defined as the
total present value (PV) of a time series of cash flows. It is a standard method for using the time
value of money to appraise long-term projects. Used for capital budgeting and widely
throughout economics, it measures the excess or shortfall of cash flows, in present value terms,
once financing charges are met. Appendix 1 of AC 150/5320-6D also recommends that salvage
values be calculated on the straight-line depreciated value of the alternative at the end of the
analysis period (a method commonly referred to as the remaining life method). In concluding
the LCCA and type selection process, all alternatives are summarized, ranked, and evaluated by
initial cost, life cycle cost, construction time, and probability for success.
The use of LCCA in military airfield projects is somewhat unclear. Chapter 5 of Unified
Facilities Criteria (UFC) 3-270-08 discusses a procedure for performing economic analysis of
maintenance and rehabilitation (M&R) alternatives, including use of the NPW economic
formula, an analysis period of between 10 and 30 years, and a discount rate that is based on

3
United States Army policies (US Army, 2004). Air Force Instruction (AFI) 32-1023 emphasizes
the need to base design decisions for a variety of facilities (buildings, infrastructure, etc.) on life
cycle cost considerations (US Air Force, 1994). However, no specific guidance is given for
LCCA.
History of LCCA
The concept of LCCA, or benefit-cost analysis (BCA), was introduced in the 1950s as a factor in
selecting pavement design alternatives. Since that time, several major initiatives at the national,
state, and local levels have advanced the application of LCCA principles to pavement design and
pavement type selection. These include the following:
American Association of State Highway Officials (AASHO) Guide: Road User Benefit
Analyses for Highway Improvements (1952 and 1960).
National Cooperative Highway Research Program (NCHRP) Project 1-10: Systems
Approach to Pavement Design (1974).
The 1972 American Association of State Highway and Transportation Officials
(AASHTO) Pavement Design Guide recommended the concept of life cycle costing,
along with various costs that should be considered in LCCA.
Intermodal Surface Transportation Efficiency Act (ISTEA) required “the use of life-cycle
costs in the design and engineering of bridges, tunnels, or pavement” (1991).
The 1993 AASHTO Pavement Design Guide recommended the concept of life cycle
costing along with various costs that should be considered in LCCA.
The 1993 AASHTO LCCA Survey and Symposium revealed the tremendous variation in
how states conduct project-level LCCAs and resulted in a push for national leadership
and guidance on improving LCCA application and making the process more consistent
(FHWA, 1994).
Executive Order 12893, Principles for Federal Infrastructure Investments (1994),
required that Federal infrastructure spending decisions be based on a systematic analysis
of benefits and costs measured and appropriately discounted over the full life cycle of
each project (Federal Register, 1994a).

4
The Transportation Equity Act for the 21st Century (TEA-21) (Walls et al., 1998)
expanded the knowledge of implementing LCCA in transportation as follows: (1)
establishing an appropriate analysis period and discount rates, (2) learning how to value
and properly consider user costs, (3) determining tradeoffs between reconstruction and
rehabilitation, and (4) establishing methodologies for balancing higher initial costs of
new technologies and improved or advanced materials against lower maintenance costs.
Spawned by a 1994 Inspector General’s Government Accounting Office (OIG/GAO)
Highway Infrastructure Report, the Federal Highway Administration (FHWA) issued an
Interim LCCA Policy Statement containing guidance in the form of “good practice”
(Federal Register, 1994b) and later a Final LCCA Policy Statement asserting the
importance of LCCA in helping make highway investment decisions (Federal Register,
1996).
As a direct outgrowth of the above, FHWA developed and published its Interim
Technical Bulletin on LCCA (Walls and Smith, 1998) and initiated Demonstration Project
(DP) 115, a technology transfer project involving the development and instruction of a 2-
day workshop on LCCA, development of a probabilistic-based LCCA spreadsheet
program, and conduct of a case studies forum demonstrating the newly developed
program (FHWA, 1998).
NCHRP Project 1-37A, Development of the 2002 Guide for the Design of New and
Rehabilitated Pavement Structures, recommended the procedures contained in the FHWA
Interim Technical Bulletin on LCCA and developed life cycle costing guidance as part of
the Mechanistic-Empirical Pavement Design Guide (MEPDG) (ARA, 2004).
In 2004 and 2005, FHWA developed RealCost, a formal probabilistic LCCA spreadsheet
program, and many state highway agencies (SHAs) have adapted and use this program.
Several definitions have been developed to describe the process of LCCA. Dell’Isola and Kirk
(1981) defined LCCA as an economic assessment of an item, area, system, or facility and
competing design alternatives considering all significant costs of ownership over the economic
life, expressed in terms of equivalent dollars. The 1993 AASHTO Guide expressed LCCA as an
economic evaluation of “all costs (and in the complete sense, all benefits) which are involved in
the provision of a pavement during its complete life cycle.” In TEA-21, LCCA was defined as a

5
process for evaluating the total economic worth of a useable project segment by analyzing initial
costs and discounted future costs, such as maintenance, user, reconstruction, rehabilitation,
restoring, and resurfacing costs, over the life of the project segment (Walls and Smith, 1998).
Although several definitions have been developed over the years to describe the process of
LCCA, the general consensus is that it is an economic analysis technique that allows comparison
of investment alternatives having different cost streams. In the field of pavements, LCCA is a
decision tool that aids pavement designers and planners in identifying the most cost-effective
pavement strategies.
There are three primary components of pavement LCCA: the LCCA framework, the input
parameters, and the execution and outputs. The LCCA framework represents the governing
criteria and principles by which the costs of alternative design strategies are compared. It
includes the following:
Analysis period—The time period over which initial and future costs associated with
alternative pavement strategies are evaluated.
Economic analysis technique—The technique used to assess proposed engineering
alternatives on the basis of their economic consequences over time. It consists of both
the economic formula to be used in equating costs expended at various points in time and
the type of dollar values (real or nominal) to be used in the analysis.
Cost factors—The specific types of costs that will be considered in the LCCA. These
costs may consist of direct or agency costs (e.g., construction costs, maintenance and
rehabilitation [M&R] costs, salvage value) and indirect or user costs (e.g., travel time
delay costs, aircraft/vehicle operating costs).
Statistical computation approach—A deterministic approach treats all inputs as discrete
values, with no tendency for variation. A probabilistic approach treats each input as a
range of values to reflect uncertainty and variation.
Input parameters are the mathematical variables that must be quantified for LCCA. These
variables fall under the categories of discount rate, pavement structure and/or treatment costs,
pavement structure and/or treatment performance, user costs, and salvage value.

6
Execution and outputs consist of the computation of life cycle costs and the recorded results,
available in terms of the raw output data, key summary statistics, or illustrative graphics.
The LCCA process is the sequence of steps taken to complete a LCCA. As presented in the
FHWA Interim Technical Bulletin on LCCA (Walls and Smith, 1998) and appendix C of the
MEPDG (ARA, 2004), it consists of the following eight steps, the first six of which are
performed for each alternative strategy:
1. Establish alternative pavement strategies for the analysis period.
2. Determine pavement performance periods and establish M&R activity timing.
3. Estimate agency costs.
4. Estimate user costs.
5. Develop expenditure stream diagrams.
6. Compute NPW.
7. Analyze results.
8. Reevaluate pavement strategies.
A key part of the LCCA process is the determination of the input parameter values, which if not
properly estimated, can give biased or erroneous results.
The outputs of an LCCA provide important decision-making information for the pavement
designer/analyst. Combined with engineering judgment and other feasibility information, the
projected economic implications of alternative design strategies can be used to identify the
preferred pavement strategy. Depending on the economic formula chosen and the computational
approach used (deterministic versus probabilistic), the output will consist of some form of life
cycle costs for the various alternatives, which can be displayed in tabular or graphical format.
For probabilistic LCCA, the life cycle cost data from many simulations can be analyzed visually
and statistically to aid in the selection process.

7
Problem Statement
Over the course of the last couple decades, the FHWA and SHAs have made substantial progress
in transforming pavement LCCA from an art form to a science. Most agencies have a
documented LCCA process and corresponding computer program, and several have followed
FHWA’s lead in updating their process to reflect the principles and practices contained in the
Interim Technical Bulletin on LCCA (Walls and Smith, 1998) and updating their program to
mimic the features/capabilities of RealCost (FHWA, 2004).
Although much remains to be done in the highways arena to complete the goal of a fully
scientific-based LCCA methodology, this community has applied LCCA more consistently, and
at a higher level, than the airport pavements community. Current LCCA practices for airport
pavement projects consist mainly of in-house tools developed on spreadsheets by a given airport
sponsor/design consultant or highway LCCA tools adapted for airfield pavement use.
To help ensure that airport sponsors make the wisest economic decisions regarding the
pavements they build and maintain—and thereby make the best use of taxpayer dollars—it is
critical that a widely accepted and standardized LCCA procedure be developed, tested, validated,
and disseminated. Such a process must clearly identify the key elements and issues to be
considered, be applicable to both flexible and rigid airport pavements and non-typical pavements
such as composite pavements, and be useable within the realm of the design and contracting
scenarios that are typical for airport pavement projects.
Also, to help assure the developed LCCA procedure gets implemented and used on a significant
scale, it must be accompanied by detailed guidance and instructional information on all aspects
of LCCA, including development of inputs (e.g., estimates of pavement performance and costs,
selected discount rate), defining of LCCA parameters for a fair and proper assessment of costs,
and assessment or interpretation of results. It also must be incorporated into an easy-to-use,
spreadsheet-based computer program.

8
Project Objectives and Scope
The objective of this study was to provide a comprehensive document that describes LCCA for
airport pavements and develop a companion software package for conducting LCCA. The
guidance is applicable to both flexible and rigid airport pavements and addresses all aspects of
LCCA. Specific items addressed in this study include:
Construction, maintenance, and rehabilitation activities to be used in airport pavement
LCCA procedures.
Typical costs and sources of data for costs of all elements used in the LCCA.
Use of airport pavement management data and systems in the LCCA.
LCCA methodology, as defined by cost factors, economic analysis techniques, discount
rate, analysis period, delay costs, risk analysis techniques, and processes for fairly
comparing service lives of different pavements/strategies.
Case studies and examples to demonstrate a variety of scenarios using airport pavement
LCCA.
This research project consisted of nine tasks intended to:
Identify and provide guidance on the most appropriate procedures for (a) developing
LCCA inputs and (b) computing and evaluating life cycle costs of alternative
designs/strategies for airport pavements.
Develop a probabilistic LCCA spreadsheet program and accompanying user manual for
use by airport sponsors/consultants engaged in pavement design/strategy selection issues.
Develop training materials and case study/example applications that fully demonstrate the
principles and practices of the recommended LCCA methodology.
Overview of Report
This report is presented in five chapters. Chapter 1 is, of course, this introduction. Chapter 2
presents the state of the technology in pavement LCCA in terms of the underlying principles and
procedures and the computer programs commonly used in both airport and highway applications.
9
It also discusses the process of pavement alternate bidding and its application in airport and
highway pavement projects. Chapter 3 contains detailed guidance for conducting LCCA for
airport pavement projects. It presents the guidance in the form of a 10-step process that begins
with defining the project scope and ends with interpreting the LCCA results and determining the
need to refine the LCCA. Chapter 4 provides an overview of the development of a spreadsheet-
based LCCA program for use by airports/consultants. Chapter 5 provides a summary of the
research and a list of recommendations for further research and development of airport LCCA
procedures and programs.
Appendix A presents some of the LCCA spreadsheets currently used by airport
sponsors/consultants. Appendix B discusses and illustrates some of the more advanced software
programs available for conducting highway pavement LCCA. Appendix C provides the help
menu or user guidance for application of the developed LCCA software, AirCost.

10
CHAPTER 2. STATE OF THE TECHNOLOGY IN PAVEMENT LCCA
To assess the state of the technology in pavement LCCA, a comprehensive search/review of
literature on the subject was performed, followed by a limited LCCA interview with airport
sponsor/consultant representatives. As part of both efforts, a variety of pavement LCCA
software programs were obtained and evaluated to (a) further understand the applications of
LCCA and (b) formulate a vision for a new LCCA software program for airport pavements.
While the focus of both activities was on applications of LCCA in the airport pavements arena,
the limited amount of information and software available in this area necessitated broadening the
focus to LCCA for highway pavements and other similar fields. Also, with the impetus in recent
years toward innovative contracting techniques, the subject of pavement alternate bidding as
related to the LCCA process was investigated.
Table 1 provides a summary of the various LCCA documents and software programs collected
and reviewed as part of the literature search/review. Table 2 presents the materials on alternate
bidding that were gathered and examined.
In the airport sponsor/consultant interviews, a short survey was emailed to selected individuals
known or believed to be in the capacity of performing airport LCCAs. Substantive feedback was
obtained from five sponsors/consultants, with each submitting sample spreadsheets (and/or
reports) used in conducting LCCA for a given pavement project. Airports represented and the
responding entities included:
Pensacola Regional, Reynolds, Smith, and Hills.
Tulsa International, Applied Research Associates, Inc.
George Bush Intercontinental, Post, Buckley, Shuh, and Jernigan.
John F. Kennedy International (JFK), Port Authority of New York & New Jersey.
Jefferson County (Broomfield Colorado), CH2M Hill.

11
Table 1. Summary of LCCA guide/report documents and software programs reviewed.
Source Guide/Report Title Software Program
FAA
Federal Aviation Administration Order 5100.38C, Chapter 9, Section 910 (2005)
AC 150/5320-6E, Airport Pavement Design and Evaluation, Appendix 1 Economic Analysis (2009)
Design Guide Supplement Portland Cement Concrete Airport Pavements (2003)
FHWA
Life Cycle Cost Analysis in Pavement Design, Interim Technical Bulletin (1998)
RealCost v. 2.1 and v. 2.2 (2004/2005)
RealCost User Manual (2004) Life Cycle Cost Analysis Primer (2002)
AASHTO/NCHRP
Mechanistic-Empirical Pavement Design of New and Rehabilitated Pavement Structures, Appendix C-Life Cycle Cost Analysis Guidelines (2004)
LCCA2002 (adaptation of RealCost)
National Institute of Standards and Technology (NIST)
Life-Cycle Costing Manual, Handbook 135 (1996)
American Concrete Pavement Association (ACPA)
Life-Cycle Cost Analysis: A Guide for Comparing Alternate Pavement Designs (2002)
Asphalt Pavement Alliance (APA)
Pavement Life-Cycle Cost Studies Using Actual Cost Data: A Synthesis (2005)
Life Cycle Cost Analysis Program v. 3.1 (2005)
Pavement Type Selection Processes: A Position Paper (2004)
Asphalt Institute (AI) State of the Practice: Pavement Type Selection (2004)
LCCOST (not for comparing alternate designs, more for pavement management applications)
National Lime Association (NLA)
Life Cycle Costs for Lime in Hot Mix Asphalt: Volume I-Summary Report (2003)
Life-Cycle Cost Analysis, v. 1.3.0 (2002) (adaptation of RealCost)
Life Cycle Costs for Lime in Hot Mix Asphalt: Volume II-Appendices (2003)
Life Cycle Costs for Lime in Hot Mix Asphalt: Volume III-LCCA Software User’s Guide (2003)
California Department of Trasportation (Caltrans)
Interim Life-Cycle Cost Analysis Procedures Manual (2007)
Caltrans RealCost v. 2.2 (adaptation of RealCost)
Colorado Department of Transportation (DOT)
Life-Cycle Cost Analysis and Discount Rate on Pavements for the Colorado DOT (2006)
Indiana DOT Life-Cycle Cost Analysis for INDOT Pavement Design Procedures (2005)
Indiana DOT RealCost v. 1.0 (standalone enhancement of
12
RealCost)
Kansas DOT Determination of the Appropriate Use of Pavement Surface History in the KDOT LCCA Process (ARA, 2007)
Spreadsheet-based LCCA (deterministic)
Kentucky Transportation Cabinet (KTC)
KTC Pavement Type Selection Policy (2006)
Missouri DOT Pavement Design and Type Selection Process (2004)
Minnesota DOT Pavement Type Determination Task Force Final Report (2003)
Minnesota DOT RealCost v. 1.0 (adaptation of RealCost)
Table 2. Summary of pavement alternate bidding documents reviewed.
Source Guide/Report Title
FHWA
Federal Aid Policy Guide, Transmittal 25 23 CFR 500B (1999) Special Experimental Project No. 14—Innovative Contracting (1990)
Louisiana Department of Transportation and Development (DOTD)
Agency Process for Alternate Design and Alternate Bid of Pavements (Temple et al., 2004)
Missouri DOT Pavement Design and Type Selection Process (2004) Alternate Pavement Update (2008)
KTC Appendix E of Pavement Type Selection Policy (2006)
LCCA Procedures
Airport Sponsor/Consultant Procedures
The search for literature pertaining specifically to airport LCCA was not very productive.
Besides FAA Order 5100 and ACe 150/5320-6D, the most noteworthy documentation consisted
of the following:
FAA Northwest Mountain Region’s Design Guide Supplement: PCC Airport Pavements
(Scott, 2003)—Although primarily focused on portland cement concrete (PCC) thickness,
drainage, and joint design issues, this document emphasized the need for LCCA in the
pavement design process and recommended that cost components include:

13
Initial costs.
Future maintenance, repair, and rehabilitation costs.
User expenses from the loss of usage.
User costs incurred by both the airport and the airport users (e.g., airlines, fixed-base
operators [FBOs]) through traffic delays, re-routings, etc.
The document pointed out that, although pavement structural life is anticipated to be 20
years based on the FAA design tables, pavement lives vary with climate, soils, and other
specific conditions (e.g., fuel spillage); thus, LCCA should use a pavement life that is
based on past experience (possibly extending up to 30 to 40 years).
FAA-sponsored study, Operational Life of Airport Pavements (Garg, Guo, and McQueen,
2004)—In determining whether the FAA thickness design standards for flexible and rigid
pavements are consistent with the FAA’s standard for a 20-year pavement design life
requirement, this study established methods for determining the structural condition
index (SCI) of flexible and rigid pavements based on the distress types, extents, and
severities used in computing the pavement condition index (PCI). Historical PCI
condition survey data were gathered and analyzed to show that flexible and rigid runway,
taxiway, and apron pavements all project to have SCI values at or above 80 after 20
years.
Full-Cost Approach to Airport Pavement Management (McNerney and Harrison, 1995)—
As part of an overall discussion of the need for enhanced airport pavement management
systems, the case is made in this document for LCCA procedures that take into account
both traditional airport owner costs and the costs associated with user delays and
environmental impacts. Specific user delay costs suggested include those associated with
aircraft operations, such as air delay and additional aircraft vehicle operating costs
(VOCs) (e.g., fuel), and those associated with passenger time (with passengers broken
down into an appropriate business/social mix and hourly rates assigned to each traveler
type). Specific environmental costs suggested include the noise associated with taxiing
and waiting and air quality pollution stemming from increased holding patterns around
airports with restricted runway availability. The effect of runway roughness accelerations
on aircraft fatigue also is discussed.

14
With regard to the procedures identified in the airport sponsor/consultant interviews, the
methodology recommended in appendix 1 of FAA AC 150/5320-6D generally was followed.
All used NPW as the economic technique, and about half utilized the recommended analysis
period of 20 years. The remainder used analysis periods of 30 or 40 years. Discount rates
ranged from 3.5 to 5 percent.
FHWA and Other Highway Agency Procedures
Based on an extensive evaluation of LCCA practices, the FHWA developed and published an
Interim Technical Bulletin on LCCA (Walls and Smith, 1998). This document presented best
practices for establishing the various LCCA inputs and introduced the concept of risk analysis
(i.e., probabilistic analysis) and gave detailed guidance in determining user costs associated with
work zones.
FHWA DP 115 involved the development and conduct of a 2-day LCCA workshop designed to
reinforce the principles and practices contained in the Interim Technical Bulletin. The
workshop, which has been held for many SHAs since the late 1990s, also included demonstration
of the DP 115 probabilistic spreadsheet program (a precursor to the current RealCost program)
and a case studies forum demonstrating LCCA for actual pavement projects using both existing
deterministic procedures and probabilistic procedures.
Although the concepts and principles of LCCA are fairly uniform, the application of LCCA in
design varies considerably among highway agencies. Differences in agency philosophies,
policies, and preferences typically result in different cost factors being included or excluded,
different methods being used to determine input values, and different analysis periods being
used. The fact that different computer programs are used to compute life cycle costs, and that
LCCA results are interpreted in different ways, also adds to the variation.
Despite the current variation in practice, much greater consistency has been achieved in recent
years, due in large part to the FHWA’s LCCA development and implementation efforts. Since
the mid-1990s, the FHWA has worked closely with states and industry alike to better define the

15
LCCA process and to build greater consensus within the pavement community as to how LCCA
should be performed at the project level. The LCCA principles and process outlined in the
FHWA Interim Technical Bulletin on LCCA (Walls and Smith, 1998) and promoted under the
DP 115 project were recognized under NCHRP Project 1-37A as representing the state of the
technology at the design level, and thus were adopted for use with the MEPDG methodology
(ARA, 2004). While a detailed discussion of the technical guidance contained in the FHWA
Interim Technical Bulletin and the MEPDG could be provided here, it is sufficient to recognize
these documents as the standard-bearers for LCCA in highway pavement applications and note
that the basic components (framework, input parameters, execution and outputs) are largely
applicable to airport LCCA.
As part of the FHWA’s seminal work on LCCA, a survey of 52 SHAs was conducted in which it
nearly two-thirds reported using formal LCCA procedures for determining the type of pavement
to use in a new construction or reconstruction project (FHWA, 1998b). Most of the remaining
one-third reported using informal procedures or had plans to develop a set of procedures in the
near future. Since that survey in 1997, many agencies have evaluated and upgraded their LCCA
processes and programs to ensure more fairness in the approach, instill greater confidence in the
results, and provide better clarity in interpreting the results. Major LCCA studies have been
performed in states like Ohio, Pennsylvania, Missouri, Kansas, Colorado, South Dakota, and
Wisconsin, as well as in Canadian provinces like Ontario and Quebec (ARA, 2004).
For most highway agencies, LCCA is a major component of the pavement type selection process.
LCCA may be coupled with the subjective consideration of other factors, such as scope of
project, adjoining pavement, constructability, designer and contractor experience, traffic control,
and availability of materials, to make the final determination. A number of states, including
Ohio, Kentucky, Louisiana, Michigan, Maryland, and Missouri, have reported using alternate
bidding procedures to select pavement type under the FHWA’s Special Experimental Projects
(SEP) No. 14 – Alternate Contracting.
A summary of LCCA policies and practices is provided in the paragraphs below and in table 3.
The information is derived from a 2003 pavement type selection study performed for Ohio DOT

16
(ARA, 2003), and from update information included in a recent LCCA study performed for
Ministry of Transportation of Quebec (MTQ) (ARA, 2008).
LCCA Procedure: All highway agencies use an LCCA procedure that consists of the sum
of initial construction costs and discounted future costs. Most
highway agencies use the NPW method to calculate life cycle costs,
although the equivalent uniform annual cost (EUAC) method also is
used.
Analysis Period: Analysis period ranges from 35 to 60 years, with most agencies using
40 years.
Discount Rate: Discount rates range from 3 to 6 percent, with most using 4 or 5
percent. The FHWA recommends discount rates of 2 to 4 percent.
One-fourth of the agencies use the annual rate posted in the US
Office of Management and Budget (OMB) Circular A-94. Currently,
that rate is about 3 percent, based on the 30-year Treasury rate.
Sensitivity Analysis: Sensitivity analysis of the discount rate is performed by five highway
agencies.
Initial Costs: Five agencies have centrally developed cost data for LCCA. The other
agencies have project-specific costs or are centrally developed with
discretionary adjustments for the LCCA. While there is a similarity in
the general practice, several agencies have addressed life cycle cost
issues more rigorously. For example, Wisconsin, Michigan, and
Ontario complete a statistical analysis of their unit cost data. If
sufficient cost data are not available in a specific project area, the
data included in the analysis are expanded until sufficient information
is available to develop a confident estimate of the costs. In
Minnesota, cost estimates are based on site-specific factors such as
materials costs.
LCCA Quantity Adjustment: No agencies reviewed develop or use any adjustment factors to
account for the difference between estimated and as-built quantities.

17
Routine Maintenance: Only three agencies include the cost of annual routine maintenance in
the LCCA.
Scheduled Maintenance: Nine agencies include the cost of regularly scheduled maintenance,
such as crack sealing, joint resealing, and seal coats.

18
Table 3. Summary of selected highway agency LCCA practices.
Practices IL IN MD MI MN NY ON OH PA WA WI QEB
Use LCCA Yes Yes Yes Yes Yes Yes Yes Yes2 Yes Yes Yes Yes
Analysis period (years) 40 40 40 var.1 35 502 502 35 40 60 50 503
Discount rate (%) 3 4 4 OMB
4 4.55
OMB4
56 OM
B4 6 4 57 5
Sensitivity analysis No 0-
10%3-5% No No No ±2% No No
2-
5%8 No ±0.5
Initial cost
Centrally developed Yes No Yes Yes9 No No No Yes No No No Yes
Project-discretionary No Yes No No Yes1
0 Yes Yes No Yes Yes Yes No
Adjust LCCA for as-built
quantities No No No No No No No No No No No No
Routine maintenance
($/lane-km) Yes11 No No No No No No No Yes No No Yes11
Scheduled maintenance Yes Yes No Yes Yes Yes Yes No Yes No Yes Yes
How estimated Com1
2
MM1
3 n/a Hist14
Com12
Est15 Est15 n/a MM
13 n/a
MM13
Hist14
Rehabilitation cost Yes Yes Yes Yes Yes Yes Yes Yes Yes Yes Yes Yes
How estimated Est15 PM16 PM16 PM16 Est15 Est15 Est15 Est15PM1
6 PM16
PM1
6 Est15
Hot mix asphalt (HMA)
1st rehab (years) var.17 Proj1
8 Proj18 1019 15 15 19 12 10 15 18 12
2nd rehab (years) var.17 Proj1
8 Proj18 1319 27 27 31 22 20 30
Proj18
23
PCC
1st rehab (years) 20 Proj1
8 Proj18 919 17 15 18 22 20 20 25 19
2nd rehab (years) none Proj1
8 Proj18 1519 27 30 28 32 30 40
Proj18
29

19
Notes:
1. 50 years typically used, recommendation for at least 40 years. 13. Maintenance management system. 2. Consider and weigh initial cost and future cost separately. 14. Past history. 3. Analysis period varies to match pavement service life. 15. Best estimate. 4. OMB Circular A-94. 16. Pavement management system. 5. Use OMB Circular A94. 17. Four categories, based on traffic. 6. Ministry of Finance social discount rate. 18. Project specific. 7. Set by long standing policy. 19. Strategies reflect overall maintenance approach used 8. Use a probabilistic analysis. network wide for a specific fix, based on historical 9. Regionally adjusted. maintenance and pavement management records. 10. Not unit cost-based. Based on materials/construction 20. Remaining life. costs at specific site. 21. Plan to incorporate user delay costs into the LCCA in 11. Includes lane marking, for Québec may also include winter the near future. salt usage. 22. Consider user delay days in type selection process. 12. Developed by committee.
Rehabilitation: All agencies include the cost of rehabilitation activities, such as
overlays and concrete pavement restoration.
Time for First Rehabilitation: The year of the first rehabilitation for flexible pavements varies
considerably, from 10 to 19 years, with a median of 15 years. The
year of the first rehabilitation for rigid pavements is highly variable,
ranging from 9 to 25 years, with a median value of about 18 years.
Second Rehabilitation: The year of the second rehabilitation for flexible pavements varies
considerably, from 13 to 30 years, with a median of 27 years. The
Salvage value (method) No
Yes
(RL2
0)
Yes
(RL20
)
No No
Yes
(RL20
)
Yes
(RL2
0)
No No
Yes
(RL2
0)
Yes
(RL2
0)
Yes
(RL20
)
Const. traffic control
Initial No No Yes No Yes No No No No Yes No No
Rehabilitation No No No Yes No No No Yes Yes Yes No Yes
Engineering and admin.
Initial No No No No No No No No No Yes No No
Rehabilitation No No No Yes No 27% No Yes Yes Yes No Yes
User delay No No Yes Yes Fut2
1 Fut21
Fut2
1 Fut21 Yes Yes No Fut22
Spread of LCCA
considered equal 10% 10% 10% 0% 0% 0% 0% 15% 10% 15% 5% N/A

20
year of the second rehabilitation for rigid pavements is highly variable,
ranging from 15 to 40 years, with a median value of about 30 years.
Method for Rehab Schedule: Six agencies use pavement management data as the basis for the
rehabilitation schedule used in the LCCA and four agencies use
engineering estimates.
Salvage Value: Seven highway agencies consider salvage value in the LCCA. Each
uses the remaining life method; none use the residual/recyclable value
method. Michigan’s analysis period equals their service life.
Traffic Control Costs: Only three of the highway agencies include the cost of initial
construction traffic control costs in their analysis. Three of the
highway agencies consider cost of future rehabilitation construction
traffic control costs in their analysis.
Engineering and Admin: Only one agency includes the cost of engineering and administration
costs in its initial construction cost estimate for LCCA. Four agencies
account for the costs of engineering and administration in their cost
estimate for future rehabilitation activities.
User Delay: Four highway agencies consider user delay in their LCCA, and five
others are considering including user delay in the future.
LCCA Spread Equivalency: Four highway agencies consider life cycle costs within ±10 percent
to be statistically equivalent, thereby enabling other factors or agency
preference to factor into the selection. One agency uses 15 percent
and another uses 5 percent. Four highway agencies use 0 percent.
At least three national surveys on LCCA practices have been conducted in the last 3 years. A
South Carolina DOT survey in 2005 (SCDOT, 2005) generated responses from 33 SHAs and
two Canadian provincial highway agencies. A 2007 AASHTO Research Advisory Committee
(RAC) member survey yielded responses from 18 states and 3 provinces (Mississippi DOT,
2007). And a 2008 NCHRP survey on pavement type selection and LCCA (NCHRP Project 10-
75) (Hallin and Smith, 2008) produced responses from 32 SHAs to date. Table 4 summarizes
some of the key findings from these surveys.

21
Table 4. Summary of highway agency LCCA practices based on recent national surveys.
Item 2005 SCDOT Survey 2007 MSDOT Survey 2008 NCHRP Survey Use of LCCA as part of pavement type selection process
Yes—32/35a (91%) Yes—17/21a (81%) Yes (new/reconstruction)—
27/33a (82%) Yes (rehabilitation)—
11/33a (37%) Economic formula used in LCCA
NPW—22/27a (81%) EUAC—9/27a (33%)
Analysis period used for new/reconstruction projects
Range = 20 to 60 years
(70% of respondents specify 30 to 50
years)
Range = 28 to 50 years (40 or 50 years typical)
Mean = 38.5 years Std Dev = 9.7 years
Range = 20 to 60 years (based on 26 responses)
Analysis period used for rehabilitation projects
Mean = 28.5 years Std Dev = 10.0 years
Range = 10 to 45 years (based on 11 responses)
Discount rate used SHA Range = 3 to 5%OMB-recommended
rate used by 2 agencies
SHA Range = 3 to 4.5%OMB-recommended rate used by some agencies
Mean = 3.74% Std Dev = 0.72%
Range = 2.8 to 6.0% (based on 26 responses) (8/25 use OMB Circular
A-94) Inclusion of user costs
Yes—13/32a (41%) Yes—5/21a (24%) (2 agencies working on implementing user costs
in the process)
Yes—12/30a (40%)
Use of salvage value
Yes—19/32a (59%) Yes—13/26a (50%) (10 agencies use prorated
life method, 5 use residual/recyclable
value) Basis for establishing the type and frequency of M&R treatments
History only—8/17a (47%)
History & Theory—5/17a (29%)
Theory only—3/17a (18%)
History & Eng Judgment—1/17a (6%)
Historical Data Analysis—19/30a
Design Analysis (theory)—7/30a
Expert Analysis—2/30a
LCCA software used
RealCost—5/15a (33%)
DARWin—1/15a (7%)
RealCost (or modified)—11/30a
Proprietary—2/30a AASHTO DARWin—
22
In-house Spreadsheet—4/15a
(27%)
4/30a In-house Spreadsheet—
17/30a Statistical computation approach
Deterministic—21/24a Probabilistic—5/24a
LCCA utilized in developing pavement alternate bidding procedures
Yes—2/21a (10%) Yes (on fairly routine basis)—3/30a (10%)
Age at which total reconstruction of flexible pavements is assumed to occur
Mean = 40.0 years Std Dev = 9.0 years
Range = 20 to 50 years (based on 18 responses)
(2 agencies report never/not anticipated)
Age at which total reconstruction of rigid pavements is assumed to occur
Mean = 40.8 years Std Dev = 8.9 years
Range = 26 to 50 years (based on 20 responses)
(1 agency reports never/not anticipated)
a Number of affirmative responses out of total number of responses.
Pavement Alternate Bidding Procedures
Pavement alternate bidding is a process by which transportation agencies let bids on pavement
projects with the option for contractors to propose either asphalt or concrete as the material to be
used (CTC & Associates, 2006). Alternate bidding puts the burden of choice on potential
contractors rather than the transportation agency. Provided below is a summary of some of the
alternate bidding practices identified in this study.
Airport Sponsor/Consultant Procedures
Although no applications of pavement alternate bidding on airport projects were identified in the
literature search/review, one such project was unearthed in the airport sponsor/consultant

23
interviews. This project was the 2005 Runway 17-35 reconstruction project at Pensacola
Regional Airport. Details of this application are provided in the next section.
FHWA and Other Highway Agency Procedures
Historically, the FHWA discouraged the use of contractor selection of pavement type through an
alternate bidding process. The Federal-Aid Policy Guide, Transmittal 25 23 CFR 500B, dated
April 8, 1999, contains the following non-regulatory guidance:
1) The FHWA does not encourage the use of alternate bids to determine the mainline
pavement type, primarily due to the difficulties in developing truly equivalent pavement
designs.
2) In those rare instances where the use of alternate bids is considered, the SHA's
engineering and economic analysis of the pavement type selection process should clearly
demonstrate that there is no clear cut choice between two or more alternatives having
equivalent designs. Equivalent design implies that each alternative will be designed to
perform equally over the same performance period and have similar life-cycle costs.
However, since 1990, the FHWA has allowed highway agencies to evaluate non-traditional
contracting techniques under SEP No. 14 – Innovative Contracting. At least six states (Ohio,
Kentucky, Louisiana, Michigan, Maryland, and Missouri) have used alternate bidding procedures
under SEP-14 to select pavement type. The province of Ontario has awarded 6 projects using the
alternate bidding process.
Typically, highway alternate bidding projects use an A+C approach to evaluating the
contractor’s bid, where A is the contractor’s bid for the initial construction of the pavement and
C is the life cycle cost of a pavement excluding initial cost. The C cost typically is computed by
the agency and included in the bidding documents. There are variations of this process that
include B and D bid items reflecting construction time costs and pavement warranty costs,
respectively.

24
The FHWA recently provided policy clarification through a memorandum on the use of
pavement alternate bidding procedures on National Highway System (NHS) projects (Stephanos,
2008). The policy indicates that consideration should be given to various factors prior to and
after deciding to use alternate bidding procedures. The factors to be considered prior to
determining to use alternate bidding procedures include:
Equivalent designs—Alternatives should perform equally, provide the same level of
service over the same performance period, and have similar life cycle costs (i.e., NPW of
higher cost alternative is within 10 percent of NPW of lowest cost alternative).
Engineering judgment is required in determining what is and what is not “equivalent
design.”
Realistic discount rate—The selected discount rate should be consistent with OMB
Circular A-94. A discount rate in the range of 2 to 4 percent is reasonable based on
recent trends.
Consideration of uncertainty—The impact of uncertainty in factors such as performance
life, material costs, and construction duration, should be considered using sensitivity
analysis or probabilistic LCCA.
Realistic rehabilitation strategy—The rehabilitation strategy established for each
alternative design should accurately reflect current or anticipated agency pavement
management practices.
Subjective considerations—Despite the outcome of objective engineering and economic
analysis, agencies should consider non-economic factors, such as constructability, type of
adjacent pavements, recycling, and conservation of materials.
Appropriate application—Alternate bidding should only be used where pavement items
impacted by the alternate bid are likely to influence the final determination of the lowest
responsive bidder. Projects with substantial bridge or earthwork items or with potentially
substantial differences in equipment mobilization costs are not suited for alternate
bidding.
The factors to be considered once a decision has been made to bid alternate pavement types
include:

25
Commodity price adjustments—Price adjustment clauses should not be used when using
alternate bidding procedures, due to the difficulty in administering equal treatment of the
factors to the alternate materials.
Incentive/disincentive (I/D) provisions for quality—I/D provisions should provide
comparable opportunity for each alternate.
Specifications of material quantities—Agencies should consider approaches that balance
materials quantity risk between the alternate pavement types.
SEP-14 approval needed if using adjustment factors—If life cycle cost adjustment factors
are to be used, approval under SEP-14 is required. Moreover, it is recommended that the
appropriate stakeholders be provided an opportunity to provide input into development of
the adjustment factors.
Approval requirements—FHWA division administrator shall review the analysis and
concur in the finding of equivalency, when bidding alternate pavement types, and no
adjustment factors are used.
In short, the clarified FHWA policy instructs highway agencies interested in using alternate
bidding procedures to perform a complete LCCA (i.e., initial and future costs) to confirm that the
alternative designs are “equivalent” and are acceptable for alternate bidding. Consideration of
non-cost factors and the composition of pay items to be included in the bid is suggested in
helping determine the acceptability of alternate bidding techniques. After the decision has been
made to use alternate bidding, life cycle cost adjustment factors may be developed but are
subject to approval under SEP-14.
Louisiana DOTD
In 1998, the Louisiana DOTD developed an alternate design/alternate bid (AD/AB) procedure
that uses LCCA to estimate the long-term costs of asphalt and concrete pavements (Temple, et
al., 2004). The procedure enables pavement type selection through the bid process, which
purportedly enhances fair competition among paving industries and promotes a more cost-
effective use of highway construction funds. The AD/AB bid model uses an A+B+C approach,
where A is the contractor’s bid for the initial construction of the pavement, B is the construction

26
time-based bid component, and C is the life cycle cost adjustment factor assigned to each
pavement design alternate by the DOTD. The bidder with the lowest total A+B+C is selected.
The C component in the model represents the total future rehabilitation and user delay cost
expected for a particular project. It is computed following the FHWA LCCA methodology
(Walls and Smith, 1998), with deterministic NPW based on a 40-year analysis period for new
construction (30 years for overlays), a 4 percent discount rate, historical-based and new
technology-adjusted (e.g., Superpave, polymer-modified asphalt, material transfer devices for
asphalt pavements; larger-diameter coated dowel bars, reduced joint spacing, and widened lanes
for concrete pavements) rehabilitation schedules, and inclusion of work zone user costs only.
Only differential costs are considered between alternates (i.e., common costs, such as
mobilization, signing, and utilities are not included) and the total structure thickness for each
alternate is held constant to avoid differential earthwork quantities. Salvage value is avoided by
adjusting the design life of overlays to match the remaining time for the analysis period and
residual value of materials is not considered.
In determining pavement design alternates to be put to bid, Louisiana uses a 20 percent threshold
evaluation criterion. If the difference in total NPW (initial plus discounted future costs) of
competing pavement types is larger than 20 percent, the alternate with the lower total NPW is
selected for bidding. Otherwise, alternate pavement designs are included in the plans, with life
cycle cost adjustment factors assigned to each alternate. An example of the bid form provided to
contractors is shown in figure 1. The AD/AB process has been implemented on several projects
to date.

27
Figure 1. Example of Louisiana DOTD A+B+C bid form.
Missouri DOT
In 2004, as the first of a two-phased, integrated effort between Missouri DOT and industry
stakeholders, a consensus set of LCCA procedures was sought that would provide a fair and
accurate assessment of life cycle costs for the agency’s pavement type selection process
(Missouri DOT, 2004). Although an in-house cost-estimating spreadsheet (“Estimating 2000”)
was determined to be adequate for use in life cycle costing, agreement on design life assumptions
for different rehabilitation treatments could not be reached. As a result, Missouri instituted a
policy to reinstate alternate pavement design bidding.
Under this process, LCCAs are performed primarily to determine adjustment factors for use in
new full-depth pavement projects over 2 lane-miles in length (Missouri DOT, 2004). The
adjustment factors represent the C component of an A+C bid model, with the C values for each
pavement alternate assigned by the DOT (typically, C for the alternate with the lower life cycle
cost is assigned a value of zero and the alternate with the higher life cycle cost is assigned a C
value reflecting the difference in life cycle costs). Key aspects of the LCCA include:
Contractor’s Informational Bid It is agreed that the total bid(s) shown below, determined by the bidder, are for informational purposes and that the low bidder for this project will be determined in accordance with the special provision entitled “Cost-Plus-Time-Plus Life Cycle Cost Bidding Procedure (A+B+C Method), as determined by the Department. A1=Summation of products of quantities shown in Schedule of Items (Base Bid plus PCC Pavement, Alternate A1) multiplied by unit prices. A1=_______________________________________________________ B1=Bidders proposed contract time for Base Bid and Alternate A1 items multiplied by the Daily User Cost ($1,000) B1=_______________________________________________________ Working Days × $1,000 B1=_______________________________________________________ C1=Life Cycle Cost Adjustment Factor for PCC Pavement, determined by the Department C1=$728,100 Contractor’s Total Bid (A1+B1+C1)=______________________________ OR A2=Summation of products of quantities shown in Schedule of Items (Base Bid plus Superpave AC Pavement, Alternate A2) multiplied by unit prices.A2=_______________________________________________________ B2=Bidders proposed contract time for Base Bid and Alternate A2 items multiplied by the Daily User Cost ($1,000) B2=_______________________________________________________ Working Days × $1,000 B2=_______________________________________________________ C2=Life Cycle Cost Adjustment Factor for Superpave AC Pavement, determined by the Department C2=$2,108,000 Contractor’s Total Bid (A2+B2+C2)=___

28
Discount rate based on OMB rates (currently 3.2% for 30-year forecast).
Maintenance costs, salvage values, and user costs not included.
Incidental construction, engineering, and mobilization costs included as various
percentages of construction cost.
Phase II of Missouri’s pavement design and type selection process study was to seek
enhancements/improvements in the alternative bidding process, such as inclusion of salvage and
residual values, incorporation of maintenance costs, and consideration of certain user costs. It
also was to assess the appropriateness of extending the process to rehabilitation projects and
including friction and noise performance impacts. Through 2007, a total of 95 alternate bid
projects have been let in Missouri (Missouri DOT, 2008). Of the 89 full-depth pavement
projects, 37 were awarded to asphalt bids and 52 to concrete bids. Of the 6 rehabilitated
pavement projects, 1 was awarded to an asphalt bid and 5 to concrete bids.
Other Agencies
Kentucky allows for use of alternate bidding on selected projects. Typically, A+C bidding
models are followed, but if alternate bidding is used and the user costs during initial construction
are calculated to be greater than $2,000,000 for either alternate, the time component B may be
added for bidding purposes (KTC, 2006).
Summary of Experiences with Alternate Bidding
Noted advantages of alternative bidding include the following:
Inclusion/involvement of paving industries in process development has increased chances
of developing a consensus process that all stakeholders perceive as fair and reasonable.
Increased competition and lower bid prices because of increased competition.
Reflect truer material and construction costs than conventional pavement type selection
procedures which occur as much as 3 to 5 years prior to project letting.
29
Noted disadvantages of alternative bidding include the following:
Disagreement among paving industries regarding pavement life and rehabilitation
performance estimates, and rehabilitation type/extent assumptions.
Extra work to design plans and compute bid quantities for pavement design alternates.
Short time allotted for designers to add the alternate designs to project bid documents.
Not applicable to all situations/projects.
Inability to model surface characteristics (smoothness, noise, friction) as part of the
LCCA and thus quantify benefits associated with one design over another.
LCCA Software Programs
Airport Sponsor/Consultant Programs
No formal programs specifically developed for airport project-level LCCA were identified in the
literature search/review. However, as noted earlier, participants in the airport sponsor/consultant
interviews provided some sample LCCA spreadsheets for examination in this study. Summary
descriptions and illustrations of these spreadsheets are provided in appendix A. Although some
differences existed in the manner in which the LCCAs were carried out, the basic structure and
format of the spreadsheets were the same. Figure 2 shows the typical layout, representative of
one design alternative for a particular airport pavement improvement project.
FHWA and Other Highway Agency Programs
On the highways side, various project-level LCCA programs have been developed and used over
the years, most of which have consisted of in-house customized spreadsheets. In 1993,
AASHTO developed the DARWin pavement design software program, which included a project-
level LCCA module. Some states began utilizing the program in the years following its release,
but in recent years its usage has decreased, primarily as a result of the development of the
FHWA RealCost program.

30
Figure 2. Example of a deterministic-based LCCA for an airport pavement project.
Brief descriptions of RealCost and two proprietary LCCA programs reviewed in this study are
provided in the sections below. Additional details and illustrations of each program are provided
in appendix B.
FHWA RealCost (current version 2.5)—RealCost is a Microsoft Excel-based
probabilistic program that utilizes the principles and procedures contained in the FHWA
Interim Technical Bulletin on LCCA. The program was developed by the FHWA in
2002/2003, based on the DP 115 prototype program used in the FHWA-sponsored LCCA
workshops/demonstrations. The program performs deterministic and probabilistic LCCA
10" PCC 500,000
2,000,000 20110,000 2004100,000 3.00
10,000
UNIT PRESENTYEAR QUANTITY UNIT PRICE COST WORTH
INITIAL CONSTRUCTION
0 33,333 gal $1.00 $33,333 $33,3330 24,167 ton $40.00 $966,667 $966,6670 222,222 yd2 $32.00 $7,111,111 $7,111,1110 8,333 gal $1.00 $8,333 $8,3330 27,188 ton $40.00 $1,087,500 $1,087,5000 8,333 gal $1.00 $8,333 $8,3330 9,063 ton $40.00 $362,500 $362,500
Construct Transitions at Intersections 0 1 ea $700,000.00 $700,000 $700,000Restripe Runway 0 1 ea $35,000.00 $35,000 $35,000Electrical 0 1 LS $937,595.00 $937,595 $937,595
0 Subtotal $10,312,778 $825,022 $825,0220 Subtotal $10,312,778 $928,150 $928,150
FUTURE MAINTENANCE & REHABILITATION6 110,000 ft $1.95 $214,500 $179,640
Apply Seal Coat to Shoulder Surfaces 6 8,333 gal $1.50 $12,500 $10,469Restripe Runway 6 1 ea $0 $0
12 110,000 ft $1.95 $214,500 $150,446Apply Seal Coat to Shoulder Surfaces 12 8,333 gal $1.50 $12,500 $8,767Restripe Runway 12 1 ea $35,000.00 $35,000 $24,548
18 110,000 ft $1.95 $214,500 $125,996Apply Seal Coat to Shoulder Surfaces 18 8,333 gal $1.50 $12,500 $7,342Restripe Runway 18 1 ea $35,000.00 $35,000 $20,559
TOTAL INITIAL COST: $13,003,545 $13,003,545
TOTAL MAINTENANCE AND REHABILITATION $751,000 $527,768COST (year 0 to 20):
SALVAGE VALUE: ($4,334,515) ($2,399,916)
PRESENT WORTH: $11,131,397
EQUIVALENT UNIFORM ANNUAL COST: $748,205
Rout & Seal Joints
Design Costs at 8%Inspection Services at 9%
Rout & Seal Joints
Rout & Seal Joints
Apply Tack Coat on Runway
Place 10" PCC Unbonded Overlay
Place 3" AC Surface on Shoulders (145lb/ft3)
Place 2" AC Bond Breaker on Runway (145lb/ft3)
Apply Tack Coat on ShouldersPlace 9" AC Binder on Shoulders (145lb/ft3)Apply Tack Coat on Shoulders
Transverse joints, ft Discount rate, %Length of runway, ft
CONSTRUCTION ITEMS
Pavement area (8 lanes @ 25 ft/ln) ft2 Analysis period, yearsLongitudinal joints, ft Initial year of construction
Construct Unbonded PCC Overlay of R/W 18L-36R
Section: Shoulder area (2 @ 25 ft) ft2

31
for two alternative design strategies. Visual Basic programming functions are utilized for
probabilistic (Monte Carlo method) simulations. Both agency and user costs (delay costs
and vehicle operating costs associated with construction and rehabilitation activities) can
be computed, with separate display of results.
RealCost has two interface mechanisms—the form graphical user interface (GUI) and the
worksheet interface. While the form GUI is the primary means of interacting with the
software, all of the entered data are stored in worksheet cells, as are all outputs
(calculation results, analysis results, etc.).
At least 11 states have adopted and/or customized RealCost for use in conducting
highway pavement LCCAs. One of these states, Indiana, has developed its own stand-
alone, PC-based Windows program, called RealCost-IN.
APA LCCA (version 3.1)— The APA LCCA program is based on the procedures
contained in the FHWA Interim Technical Bulletin on LCCA (Walls and Smith, 1998). It
has the ability to perform LCCA in either a probabilistic or deterministic mode for up to
four alternatives, with probabilistic variables consisting of discount rate, traffic growth,
and construction duration (Ozbay et al., 2003). It allows for the inclusion of user costs
resulting from delay time during work zones and generates the resulting detailed analysis
graphically and in Excel format.
NLA Asphalt LCCA (version 1.3)—The NLA LCCA software package is a Microsoft
Windows-based application that was developed to perform economic analyses of two
pavement alternatives (asphalt only) subject to future M&R activities (Hicks and Scholz,
2003). The methodology is based on the approach presented in the FHWA Interim
Technical Bulletin on LCCA (Walls and Smith, 1998). The software allows analyses for
both new construction and rehabilitation projects and supports both deterministic and
probabilistic analyses.

32
CHAPTER 3. GUIDELINES FOR CONDUCTING AIRPORT PAVEMENT LCCA
Introduction
The process of planning, designing, contracting, and constructing airport pavement projects often
takes several years to complete. Typically, once a particular project is identified as needing to be
built or improved, it is assigned a general scope and cost and is scheduled with other airport
projects as part of a proposed multi-year improvement plan. After funding has been secured for
the project, preliminary design plans are developed based on the latest information concerning
the goals, needs, and constraints of the project. It is during this stage of the process that the issue
of which pavement type or rehabilitation type to use on the project usually is addressed.
Regardless of whether a traditional or an alternate bidding approach will be used for contractor
selection, two or more feasible pavement design strategies should be developed for
consideration. The alternative strategies generally will consist of those that have been used
successfully in the past to satisfy the regional and/or local conditions (traffic, climate, and
subgrade characteristics, materials and equipment availability, contractor experience, etc.).
However, they also may include revised (design and/or material modifications) and/or innovative
strategies that have shown improved and/or promising performance characteristics.
Pavement type or rehabilitation type selection for airport pavement projects requires the
collection and meticulous evaluation of a large amount of data. Such data pertain to both the
project at hand and past projects having at least some degree of relevance in terms of the various
factors considered in the selection process (pavement structure design, costs, performance, traffic
characteristics, climate, materials, subgrade, etc.). The past project data may consist of direct
source data or could be manifest as practical experience information held by the airport sponsor,
its engineering consultants, paving contractors, or various other project stakeholders (FAA, state
aeronautics agency, Air Force, etc.).
33
LCCA Applications
LCCA is a key part of both traditional and alternate bid contracting approaches, and LCCA is a
major component in the pavement type or rehabilitation type selection process undertaken for
airport projects. The exact application of LCCA will depend primarily on the type of contracting
approach (traditional or alternate bid) desired or planned for the project, the availability of data
to support the analysis, and the level of detail that can be afforded for the analysis. For projects
in which traditional bidding procedures will be used, it is recommended that either a
deterministic LCCA with sensitivity testing or a probabilistic LCCA be performed. If sufficient
data exist to define the variation or uncertainty of each of the inputs (e.g., discount rate, pay item
unit costs, pavement service lives), then probabilistic LCCA should be used. If not, then a
deterministic LCCA should be performed along with sensitivity testing to determine the effects
of varying key inputs, such as the discount rate, initial pavement service life, and the analysis
period.
For projects in which alternate bidding procedures may be sought, it is important to ensure that
the alternative strategies are considered “equivalent”—that is, their initial structures are based on
the same design life (with same reliability level) and will be maintained to the same levels of
serviceability over the same chosen analysis period (the analysis period being substantially
longer than the design life). In addition, it should be ensured that there will be no initial
construction factors or non-economic factors that would dictate an advantage for any one of the
alternatives.
Once the equivalent alternative strategies have been established, a preliminary deterministic
LCCA should be performed that includes both the initial and future costs of each alternative.
The results of this LCCA should be examined and acted on as follows:
If the difference between the alternative with the lowest NPW and the alternative with the
next highest NPW is greater than 10 percent, it is recommended that alternate bid
contracting not be pursued and that type selection be made using a more detailed LCCA
(i.e., a final LCCA consisting of either deterministic procedures with sensitivity testing or
probabilistic procedures).

34
If the difference is 10 percent or less, then alternate bidding should be considered a viable
option, with the strategy alternatives consisting of (a) the one with the lowest NPW and
(b) all others within 10 percent of the lowest alternative. A final deterministic LCCA
should then be performed in which the NPW of only the future costs of each alternative is
computed. The resulting values can then be used as life cycle cost adjustment factors
(i.e., the C component in the A+C or A+B+C bidding structures) to be applied in the
alternate bid form. Subsequently, the bid with the lowest life cycle cost (initial cost bid
plus life cycle cost adjustment factor) will be awarded.
While choosing a strategy based solely on initial costs allows for more to be accomplished with a
specified annual budget, it does not account for the long-term costs that are paid by taxpayers
and facility users. LCCA is the ideal vehicle for taking into consideration initial and future costs
and weighing them against non-economic factors (e.g., constructability, continuity of pavement
type, conservation of materials/energy, safety) to identify the preferred pavement alternative.
Recommended LCCA Practice
Overview
Chapter 1 presented an 8-step procedure for conducting project-level highway pavement LCCA.
A similar, slightly expanded version of this procedure is recommended for use in the airports
arena. It entails 10 steps, as shown in figure 3. Descriptions of and guidance for completing
each step are provided in the sections below. Although experience-based estimates can be used
in quantifying the many LCCA inputs, it is highly recommended that all available, applicable,
and reliable data be used in this effort. The quality of LCCA results is only as good as the
quality of the inputs.

35
Figure 3. Process for conducting airport pavement LCCA (Walls and Smith, 1998).
The process described herein is conducive to both traditional and alternate bidding approaches.
In alternate bidding, all of the steps used in traditional bidding are followed, except that the
initial cost in the LCCA is substituted by the actual bid price. Thus, there is no need to estimate
this cost for each of the alternative strategies. Also, since alternate bidding uses a discrete life
cycle cost adjustment factor for each alternative strategy, only a deterministic computation of the
life cycle costs associated with future expenditures is needed.
Successful application of alternate bidding requires that the LCCA process be totally transparent
and largely acceptable to both pavement industries. Its use generally is recommended in
situations where there are no primary or secondary factors that would foster an advantage for the
use of one pavement strategy over the others.
Selection of Preferred Pavement Strategy
(Consideration of Other Factors)
Step 10. Reevaluate Pavement Strategies
(Most Economical Strategy Identified?)
Step 9. Analyze Results
Step 8. Compute Life-Cycle Costs
Step 7. Develop Expenditure Stream
Diagram
Step 6. Estimate Indirect/User Costs
Step 4. Determine Expected Pavement
Performance and M&R Activity Timings
Step 3. Develop Alternative Pavement
Strategies
Step 5. Estimate Direct/Owner Costs
YES
NO
Step 2. Establish LCCA Framework
Step 1. Define Project Scope

36
Step 1—Define Project Scope
The first step in conducting an airport pavement LCCA involves defining the physical scope of
the LCCA. Airport pavement projects vary greatly in terms of the type of facility (runway,
taxiway, or apron), the specific branch(es) (e.g., Runway 12-24, Taxiway D), and specific
section(s) that are to be constructed or rehabilitated. While defining the LCCA scope for a
project consisting of just one section is easy, projects that include work on multiple branches or
facilities require thoughtful consideration of whether all the sections involved can be lumped into
one LCCA or if two or more separate LCCAs are warranted. In traditional bidding, the focus is
on “differential” costs. In alternate bidding, all pay items in the project need to be included
(lighting, drainage structures, etc.). Bid costs received from contractors need to be examined
carefully to ensure they are within reason.
In general, it is good practice to perform separate LCCAs for sections located on different
facilities. In addition, if there are significant design differences and/or forecasted traffic
applications between sections located on the same branch, separate LCCAs should be performed
for those sections. Exceptions to this guidance are sure to exist, such as when one section is
much smaller in size than another section. An LCCA for the smaller section may not be
warranted, given the mobilization and other advantages of using the same material type for both
sections (as determined via the LCCA for the larger section).
In the highways arena, LCCA often is performed on the basis of a unit representative of the
project limits. The quantities and costs for multi-mile and divided-lane projects are developed
for a short representative segment (usually 1 mile) and sometimes for the lanes in one direction,
rather than for the entire project length and width. Although this approach can be used in airport
pavement LCCA, the shorter lengths of airport projects and some of the unique design
characteristics that occur throughout the project (transition sections, electrical/lighting issues)
make the LCCA more conducive to a full representation of quantities and costs.

37
Step 2—Establish LCCA Framework
Analysis Period
The analysis period for LCCA must be sufficiently long such that each alternative pavement
strategy includes at least one future rehabilitation event. FAA pavement design practice requires
using a 20-year design life, but recent research has found that airport pavements largely exceed
this design life value, indicating that the FAA-recommended analysis period is too short (Garg,
Guo, and McQueen, 2004). This is further supported by the current practices of SHAs, which on
average use analysis periods of 38.5 and 28.5 years for new/reconstruction and rehabilitation
projects, respectively. Typical design lives for new/reconstructed highway pavements surfaces
range from 10 to 20 years for asphalt structures and 20 to 30 years for concrete structures.
Therefore, it is recommended that the analysis period for airport pavement LCCA be increased.
For new/reconstruction projects, an analysis period of 40 years or more is considered
appropriate. For rehabilitation projects, an analysis period of at least 30 years is considered
appropriate. While longer analysis periods may be warranted for long-life pavement designs, it
is cautioned that the LCCA should not extend beyond the period of reliable forecasts. One
reasonable approach is to use an analysis period of one of the alternatives that results in zero
salvage for that alternative, and apply that period to the other alternatives. Salvage for the others
would then be linearly adjusted.
Finally, it must be emphasized that the chosen analysis period is to be applied to all pavement
strategies being considered in the LCCA. No alternative should be analyzed over a time period
that is different from the other alternatives.
Economic Analysis Technique
Current FAA guidance on using NPW is adequate. The NPW should be applied using
constant/real dollars and a discount rate selected in accordance with the procedure described

38
below. The formula for NPW is as follows (note that the variable designations have been
modified from those given in AC 150/5320-6D, appendix 1, but the formula is the same):
Eq. 1
where: NPW = Net present worth, $.
IC = Present cost of initial construction or rehabilitation activity, $.
k = Number of future M&R activities.
M&Rj = Cost of jth future M&R activity in terms of present costs (i.e., constant/real
dollars), $.
idis = Discount rate.
nj = Number of years from the present of the jth future M&R activity.
SV = Salvage value, $
AP = Analysis period length, years.
As an alternative to NPW, EUAC can be used. However, since the same analysis period is used
for each pavement alternative, the EUAC values are simply NPW values that are extrapolated
out over the chosen analysis period. The formula for EUAC is as follows:
Eq. 2
Discount Rate
The discount rate is a very important and often controversial piece of the LCCA framework,
because it can influence the results of the analysis significantly. It represents the real value of
money over time and is used to convert future costs to present-day costs (in EUAC analysis, it is
used to convert NPW to annualized costs).
The discount rate is a function of both the interest rate and the inflation rate. In general, the
interest rate (often referred to as the market interest rate) is associated with the cost of borrowing
money and represents the earning power of money. Low interest rates favor those alternatives
NPW = IC + M&Rj × − SV× j=1
k1
1 + idis
nj1
1 + idis
AP
EUAC = NPW× idis(1 + idis)AP
(1 + idis)AP − 1

39
that combine large capital investments with low maintenance or user costs, whereas high interest
rates favor smaller capital investments with higher maintenance or user costs.
The inflation rate is the rate of increase in the prices of goods and services (construction and
upkeep of highways) and represents changes in the purchasing power of money. The discount
rate is approximately the difference of the interest and inflation rates, representing the real value
of money over time. The exact mathematical relationship between PW, the interest rate, and the
inflation rate is as follows:
PW = C * [(1 + iinf) / (1 + iint)]n Eq. 3
where: PW = Present-worth cost, $.
C = Future cost in present-day terms, $.
iinf = Annual inflation rate, decimal.
iint = Annual interest rate, decimal.
n = Time until cost C is incurred, years.
For practical purposes, however, the discount rate often is approximated as the difference
between the interest rate and the inflation rate. As a result, a close approximation of PW is
calculated as follows:
PW = C * [1 / (1 + idis)]n Eq. 4
where: idis = iint - iinf (decimal) Eq. 5
As discussed previously, the literature search/review and airport sponsor/consultant interviews
indicate the predominant use of discount rates in the 3 to 5 percent range. In its Interim
Technical Bulletin on LCCA (Walls and Smith, 1998), FHWA stated that “LCCA should use a
reasonable discount rate that reflects historical trends over long periods of time.” It illustrated
the discount rate trends published in OMB Circular A-94 and, based in part on those trends,

40
recommended using a rate of 3 to 5 percent (FHWA recently changed this range from 2 to 4
percent).
This study recommends the same for the application of LCCA for airport pavements. However,
it is further suggested that the discount rate values provided in OMB Circular A-94 be utilized
when possible, particularly for probabilistic LCCA. Specifically, the most current annual real
discount rate based on a long-term (10-, 20-, or 30-year) Treasury rate should be used for
deterministic LCCA and as the mean value for probabilistic normal-distribution LCCA. In
addition, the standard deviation of the daily Treasury real long-term rate for the most current
year should be used as the standard deviation value for probabilistic normal-distribution LCCA.
OMB Circular A-94 is available on the Internet at the address below. The 2009 long-term real
discount rates posted at this site are 2.2 percent (10-year), 2.7 percent (20-year), and 2.7 percent
(30-year).
www.whitehouse.gov/omb/circulars/a094/a094.html
Daily Treasury real long-term rate information can be accessed at the Internet address below.
Computations of the standard deviation discount rate for years 2000 through 2010 show this
parameter as ranging between 0.12 and 0.42 percent.
www.treasury.gov/offices/domestic-finance/debt-management/interest-
rate/real_ltcompositeindex.shtml
Cost Factors
Cost factors are subdivided into two basic categories: direct/owner costs and indirect/user costs.
Direct/owner costs are the costs forecasted to be incurred by the transportation facility
owner/operator for a given pavement strategy over the chosen analysis period. They are
embodied by the initial construction/rehabilitation event, the sequence of future M&R events,
and the salvage value of the pavement strategy at the end of the analysis period.

41
Direct/owner costs include the physical cost of the pavement structure/treatment associated with
an event and may include certain supplemental costs, such as engineering costs and materials
testing costs. In both cases (physical and supplemental costs), only the differential costs between
pavement alternatives are considered in the LCCA; costs common to all alternatives cancel out
and are excluded from LCCA calculations (Walls and Smith, 1998).
Indirect/user costs are defined as the long-term costs incurred by the users of a transportation
facility as a result of choosing and implementing a particular pavement strategy. The
indirect/user costs of concern in pavement LCCA are the differential or extra costs incurred as a
result of one investment strategy being used instead of another. Although user costs are not
borne directly by the facility owner/operator, they affect the owner/operator’s customers and the
customers’ perceptions of the owner/operator’s performance (FHWA, 2002). Moreover, since
the owner/operator acts as the proxy for public benefit, the impetus should exist to maximize
taxpayer dollars used in the construction and upkeep of facilities, as well as minimize the
expenses incurred by those who use the facilities.
In the airports arena, there are a variety of users—the aircraft crew and passengers, the airline,
air cargo, and air charter companies, the airport owner/operator, and the community of
businesses tied to airport operations (vendors/concessionaires, rental car companies, hotels, etc.).
Costs incurred by these users as a result of choosing one pavement strategy over another can be
evaluated in terms of the following components:
Normal operating conditions.
Aircraft operating costs due to added fatigue damage caused by rough pavements.
Pavement alternatives with more rehabilitation events could have a longer cumulative
period of being in a “rough” condition, resulting in additional upkeep costs.
Construction zone operating conditions.
Aircraft time delay costs due to partial or full pavement facility closures associated
with construction and M&R activities. Pavement strategies with more and/or longer
interventions could result in greater lost time/productivity of crew and passengers.
42
Aircraft operating costs due to the same. Pavement strategies with more and/or
longer interventions could result in increased business costs (fuel, maintenance, crew,
upkeep, etc.) for airlines, air cargo, and air charter companies.
Aircraft crash/accident costs due to the same. Pavement alternatives with more
and/or longer interventions yield greater risk for crashes.
Environmental costs due to the same. Pavement alternatives with more and/or longer
interventions could result in increased air pollution and energy consumption.
Although standardized procedures for estimating these costs have not been developed, there have
been some preliminary evaluations and work in recent years to correlate runway
roughness/profile with aircraft fatigue damage, and estimating amounts of air pollution and
energy consumption associated with construction operations. For instance, the Air Transport
Association (ATA) recently projected the overall cost of delay to be $72.13/minute, based on
airport system delay data (138 million delay minutes) and corresponding airline operating cost
data ($10 billion) for 77 airports in 2008 (ATA, 2009). Other evaluations of user costs are
expected in the near future, such as one outlined in a Transportation Research Board research
needs statement pertaining to the effects of rough airfield pavements on aircraft operations (TRB,
2008).
When normal airport operations are altered because of construction or M&R activities, the
business cycles of the airport and the aircraft operators are affected. Partial or full closures of
any of the airside pavement facilities for any duration can result in significant rescheduling of
aircraft operations and/or re-routing of flights to alternate airports. Airlines, air cargo
companies, etc. are the first to experience cost impacts; airport owner/operators are next.
While it is very difficult to estimate the added costs incurred by the various aircraft operators as
a result of airfield construction and M&R activities, a more tangible estimate can be made of the
airport owner/operator’s costs in terms of reduced daily operating revenues. Pavement
alternatives entailing more intensive and/or longer restrictions on airport operations, particularly
when a runway is involved, are sure to result in greater losses of daily revenue due to reduced
passengers and/or cargo, and possibly fewer aircraft operations.
43
As an example, ATA estimated the cost of closing runway 18R/36L at Dallas Fort Worth
International Airport (DFW) in 1990 at $131,000 per day in bad weather and $110,000 per day in
good weather, based upon the delay to the airlines. This estimate was used to compare block
paving construction of taxiways versus conventional construction. DFW engineers estimated
that $4.3 million in potential delay costs were avoided by choosing construction with concrete
block pavers, which allowed the runway to be open an additional 2 hours daily for 114 days
(McNerney, 1995). This shows that it is possible calculate or estimate to potential delay costs
and use those numbers in developing rehabilitation and maintenance strategies.
The loss-of-daily-operating-revenue approach is recommended as one form of user cost that a
pavement designer/analyst can consider including in an airport pavement LCCA. Other user cost
components, such as passenger delay costs and airline delay and operating costs, appear to be
relevant to LCCA but require further development before they can be adapted to the process
outlined in this report.
Statistical Computation Approach
As discussed earlier, there are two basic approaches for computing life cycle costs—
deterministic and probabilistic. In deterministic LCCA, a single value is selected for each input
parameter (usually the value considered most likely to occur, based on historical evidence or
professional experience), and the group of selected values is then used to compute a single
projected life cycle cost. Because each input parameter is represented by only one value, the
uncertainties and variations known to exist in these variables in the real world are not fully
accounted for.
To some degree, the variability associated with input estimates, projections, and assumptions can
be accounted for through a deterministic sensitivity analysis. In this process, a given input
parameter is varied over a practical range while holding all other inputs at their chosen value,
and a series of projected life cycle costs are computed. Figure 4 shows an example of a
sensitivity analysis performed on the discount rate. The projected costs are plotted as a function

44
of the variable input parameter, to reveal the relative impact of input parameter variation on life
cycle costs.
Probabilistic LCCA simulates and accounts for the inherent variability of the input parameters.
As illustrated in figure 5, for a given pavement strategy, sample input values are randomly drawn
from the defined frequency distributions and the selected values are used to compute one
forecasted life cycle cost value. The sampling process is repeated hundreds or even thousands of
times, thereby generating many forecasted life cycle cost values for the pavement strategy. The
resulting forecasted costs can then be analyzed and compared with the forecasted results of
competing alternatives to identify the most economical strategy.
For airport pavement LCCA, it is recommended that the probabilistic computation approach be
used when reliable historical data exist to model one or more of the input parameters. If such
data do not exist, then a deterministic approach should be used, supplemented with sensitivity
testing of key input parameters, such as the discount rate, major unit costs associated with the
initial pavement structures, and the service life estimates of the initial structures. For alternate
bidding applications, the deterministic computation approach should be used.

45
Figure 4. Example illustration of deterministic sensitivity analysis.
Figure 5. Illustration of the probabilistic LCCA process (ARA, 2004).
0.0
0.5
1.0
1.5
2.0
2.5
3.0
Pre
sen
t-W
orth
Lif
e-C
ycle
Cos
t, $
mill
ion
0.0 2.0 4.0 6.0 8.0 10.0
Discount Rate, %
Alternative A Alternative B
Inputs
InitialPavement
Performance
InitialPavement
Performance
FutureM&R
Performance
FutureM&R
Performance
DiscountRate
DiscountRate
1. Values randomly selectedfrom each input samplingdistribution
2. Life-cycle cost computationperformed
Results
Forecasted NPVor EUAC Values
XXXYYYZZZ
:::
Process repeatedmany times
InitialCost
InitialCost Future
CostFutureCost
NPV orEUAC
NPW
NPW or

46
Step 3—Develop Alternative Pavement Strategies
For a given project, at least two feasible pavement alternatives should be identified for
evaluation in the LCCA. In this step, each alternative is assigned a strategy consisting of the
initial structure (whether new or rehabilitated) and the probable M&R activities covering the
selected analysis period.
The traditional approach of establishing M&R activities is to make use of historical experience
and/or airport M&R policies. Most civil and military airports have pavement management
systems in place to record and track important historical pavement information. Such
information usually includes year of original construction, years and types of M&R treatments,
structural composition (material layers and thicknesses), historical traffic applications (number
of operations and types of aircraft), and historical pavement conditions (PCI or other pavement
condition/distress indicators). The airport pavement management system should provide at least
a general indication of the types of M&R treatments that have been applied to specific types of
pavement. If individual distress data are available, then critical forms of distress and modes of
failure may be identified, allowing for greater perspective on appropriate M&R treatments (i.e.,
are current and/or past M&R practices acceptable or are deviations needed?).
Step 4—Determine Pavement Performance and M&R Activity Timing
New/reconstructed pavements and rehabilitated pavements deteriorate due to a combination of
traffic- and environmental-related stresses. The deterioration prompts the need for various forms
of upkeep over a long time period to sustain the structural integrity and capacity of the pavement,
as well as its functional characteristics (smoothness, friction). Step 4 involves determining, for
each alternative pavement strategy, the expected performance life of the initial pavement
structure and each future rehabilitation treatment projected to occur over the chosen analysis
period. It also entails identifying the timings and extents of anticipated maintenance treatments.
The resulting information can then be used to establish the sequence and timings of future M&R
activities treatments, as illustrated by the life cycle model in figure 6.

47
Figure 6. Example pavement life cycle model.
Service Lives of Initial Pavement and Future Rehabilitation Treatments
A pavement’s service life is defined as that period of time from completion of construction until
the structural integrity of the pavement is considered to be unacceptable and structural
rehabilitation or replacement is required. In the example in figure 6, the service life of the initial
asphalt pavement structure is about 17 years, corresponding to the timing of the first HMA
resurfacing activity. Similarly, the service life of the first resurfacing is about 10 years,
corresponding to the timing of the second HMA resurfacing. It should be noted that, in LCCA,
service life generally is taken to mean the average or median life of the pavement (i.e., the time
associated with 50 percent probability of the need for structural rehabilitation). This is different
than the design life, which represents a time period with a relatively low probability of the need
for structural rehabilitation or reconstruction.
Pavement service life can be estimated in various ways, ranging from expert modeling using the
opinions of experienced engineers to detailed performance prediction modeling using historical
pavement performance data. Because of the potential for bias, the only time the former approach
should be considered is when reliable historical performance data are not available or are greatly
limited (for instance, if the pavement or rehabilitation types being considered are substantially
different, due to changes in traffic or use of new materials or technologies). Experience-based
estimates often can be made in conjunction with data trends from other locations.
Deep-Strength Asphalt Pavement 15 in HMA 12 in Crushed Stone Base
HMA Resurfacing 2 in Mill 3 in HMA Overlay Re-stripe Surface
HMA Resurfacing 3 in Mill 4 in HMA Overlay Re-stripe Surface
HMA Resurfacing 3 in Mill 5 in HMA Overlay Re-stripe Surface
Maint Crk Seal (10,000 ft)
Maint Surf Patch (400 yd2) Crk Seal (20,000 ft)
Maint Crk Seal (10,000 ft)
Maint Surf Treat
Maint Surf Treat
Maint Surf Treat
Maint Crk Seal (10,000 ft)
Time, years
40 302010 0
48
The airport’s pavement management system should be the first and foremost source for
developing service life estimates of the pavement structures and rehabilitation treatments
anticipated for each strategy. Depending on the data available, a variety of analyses can be
performed to develop service life estimates. For both techniques, the reliability and accuracy of
results depend greatly on the number of data points available for analysis. The more pavement
sections representative of a particular pavement type, the better. And, in the case of performance
trend analysis, the more time-series condition measurements, the better.
Performance Trend Analysis
In performance trend analysis, historical condition data for pavements similar to those
comprising each pavement strategy are compiled and plotted as a function of time. A best-fit
regression curve is then fitted through the data and projected out to a threshold condition level
representative of the need to perform structural rehabilitation. The corresponding time at which
the threshold level is reached reflects the average age at time of rehabilitation or the estimated
service life of the pavement.
Performance trend analysis is essentially a four-step process. In step 1, existing pavement
sections with structural designs, traffic loadings, and functional purposes (runway, taxiway,
apron) that are similar to the pavement alternatives being considered (i.e., same pavement
family) are identified, and their historical data are extracted from the pavement management
system or other records. Ideally, these pavement sections will be located at the subject airport,
but if insufficient sections exist, then assistance should be sought from the appropriate
Government agency to identify sections at other airports with similar climatic conditions.
As part of the first step, careful attention should be given to the acceptability of the pavement
sections. Were they built with drastically different materials than the pavement alternatives
currently being evaluated? Were there design and/or construction issues that substantially
influenced performance? Was traffic loadings significantly altered, thereby influencing
performance? Sections with these kinds of issues may warrant removal from the analysis.

49
Step 2 entails creating time-series plots of pavement performance using the available condition
data for each group or family of pavements, and developing best-fit linear or non-linear models
relating pavement condition to age. The condition data will most likely consist of PCI data, but
SCI data also may be available. Most pavement management programs have the ability to
develop customized performance/condition models for a family of pavements, but there may be
limitations on use of the surface condition data for prediction of pavement life, since other modes
of failure may be ignored. Therefore, these programs cannot be used readily for decisions
relating to reconstruction and rehabilitation.
In creating the time-series condition plots, some filtering of the data may be needed, such as
when a significant increase is observed in PCI from one year to the next. Such increases likely
indicate a rehabilitation or significant maintenance intervention. To negate their influence, the
post-treatment PCI data should be removed.
Figure 7 illustrates PCI deterioration data for asphalt taxiway pavements located at a large
commercial airport. The data points represent the PCI values recorded for individual pavement
sections with similar design and traffic characteristics. Fourth-order polynomial trend lines have
been fit through the dataset reflecting the central tendency for the deterioration of PCI over time.
Figure 7. PCI deterioration curve for a family of pavements.
0
10
20
30
40
50
60
70
80
90
100
0 5 10 15 20
Age, years
Pav
em
en
t C
on
dit
ion
In
de
x (
PC
I)

50
In step 3, an acceptable threshold condition level must be identified to serve as the trigger for
structural rehabilitation. PCI levels of 60 to 70 are fairly typical when airport pavements receive
some form of structural rehabilitation—the higher end of this range being more suitable for
runways and the lower end for aprons. Alternatively, based on a recent study of the FAA’s
thickness design procedure and 20-year design life requirement (Garg, Guo, and McQueen,
2004), SCI values of 75 to 80 appear to be suitable threshold condition levels for estimating
pavement service life. If sufficient pre-rehabilitation PCI data exist (i.e., PCI measurements
made within the year preceding a rehabilitation event), they should be examined to help identify
the appropriate threshold condition level.
With the development of pavement performance/condition trends and the establishment of a
specific condition threshold, an estimate of service life can be made for each pavement family
(step 4). Depending on the nature of each performance/condition model, there may be a need to
project the model forward so that it reaches the threshold condition level. Figure 8 illustrates this
step utilizing the PCI deterioration curve shown in the previous figure and a threshold PCI value
of 65. Projection of the PCI deterioration trendline to the threshold value results in an estimated
service life of 15 years.
Figure 8. Service life estimation for a family of pavements.
0
10
20
30
40
50
60
70
80
90
100
0 5 10 15 20
Age, years
Pav
em
en
t C
on
dit
ion
In
de
x (
PC
I)
PCI Threshold = 65
Est. Mean Life = 15 yrs
Est. Std. Dev. Life = 2.25 yrs

51
If a probabilistic LCCA will be conducted, then an estimate of the variation in expected
pavement life will be needed. In the development of the performance/condition model, a
confidence level can be defined that allows for the development of confidence bands around the
model trend line. In the above figure, the estimated standard deviation for service life is 2.25
years.
Survival Analysis
A procedure successfully used in the highways arena for estimating pavement service life is
survival analysis (alternatively known as failure analysis). This technique uses historical
construction and rehabilitation data for a family of pavements to construct a survival curve that
depicts the probability of survival with time (or traffic loadings). In survival analysis, “survival”
of a pavement section is defined as the non-occurrence of “failure” or, in other words, the non-
occurrence of structural rehabilitation, such as a substantive overlay or extensive concrete
pavement restoration.
Survival analysis begins with an assessment of the survival or failure status of each pavement
family section at the time of the analysis. As illustrated in table 5, the age of each family
pavement section that has failed is determined by subtracting the construction year from the
rehabilitation year.
Table 5. Performance history of a selected pavement family.
Section
Year Constructed
Year Rehabilitated
Age at Failure
Age in 2008
RW 14L-22R / 001
1995 — — 13
RW 14L-22R / 002
1995 — — 13
RW 14L-22R / 003
1998 — — 10
RW 14L-22R / 004
2000 — — 8
RW 14R-22L / 001
1988 2007 19 —
RW 14R-22L / 1988 — — 20

52
002 RW 14R-22L / 003
1988 2005 17 —
RW 14R-22L / 004
1990 2005 15 —
RW 14R-22L / 005
1994 — — 14
RW 7-29 / 001 1990 2006 16 — RW 7-29 / 002 1990 2008 18 — RW 7-29 / 003 1996 1993 19 — RW 7-29 / 004 1997 — — 11 RW 7-29 / 005 1999 — — 9
Mean(Standard Deviation)
17.3 (1.6)
Using the age data from table 5, a life table like the one shown in table 6 can be produced. These
data can then be used to construct a survival curve like the one shown in figure 9. Using a value
of 50 percent pavement sections surviving, an estimate of the median life (and standard
deviation) for a pavement with similar features and loading conditions can be developed and
used in LCCA.
Table 6. Pavement survival analysis life table.
Pavement
Section Age, years
Cumulative No. of Failed
Pavement Segments
CumulativeNo. of
Censored Pavement Sectionsa
Number of Pavement
Sections Left in Study
Proportion of
Pavement Sections Failed
Proportion of
Pavement Sections
Surviving
0 0 0 14 0.000 1.000 8 0 1 13 0.000 1.000 9 0 2 12 0.000 1.000 10 0 3 11 0.000 1.000 11 0 4 10 0.000 1.000 13 0 6 8 0.000 1.000 14 0 7 7 0.000 1.000 15 1 7 6 0.143 0.857 16 2 7 5 0.286 0.714 17 3 7 4 0.429 0.571 18 4 7 3 0.571 0.429 19 6 7 1 0.857 0.143 20 6 8 0 1.000 0.000
a Censored pavements are those that are still in-service at time of analysis.

53
Figure 9. Pavement survival curve for selected pavement family.
One drawback to the survival analysis approach is the potential inability to identify a sufficient
number of sections at a given airport from which to develop a pavement family survival curve.
There may or may not be enough sections at medium to large-sized airports, and there definitely
will not be enough at small airports. In such cases, pavement sections from other airports with
similar conditions should be utilized, if available, or performance trend or other types of analysis
should be used.
Timing and Extent of M&R Treatments
Occasionally, airports are faced with the need to improve only the functional characteristics of
pavements (e.g., thin overlays to address smoothness and/or friction deficiencies or transverse
grooving to restore texture for improved friction). As with structural rehabilitation treatments,
pavement management and/or history records should be consulted to identify the expected
timings and extents of these actions, if needed.
0
20
40
60
80
100
0 5 10 15 20 25
Age, years
Per
cent
Sec
tion
s Su
rviv
ing
Est. MedianLife = 17 yrs
50% Sections Surviving
Est. Std. Dev. = 1.7 yrs
54
Between the time a pavement is originally constructed and the time it is rehabilitated (or
rehabilitated and then rehabilitated again), there are sure to occur multiple maintenance
interventions. Such maintenance may range from routine activities (pothole/spall repairs,
removal of foreign objects) to preventive activities (crack sealing, joint resealing, surface
treatments) to major repairs (slab replacements, full-depth repairs, localized skin patching).
Unlike on highways, many of the routine maintenance items performed at airports are considered
extremely important and are done very frequently to maintain high levels of safety. Airport
maintenance is much more preventive in nature than highway maintenance. Typically, the
pavement management system includes maintenance activities geared to particular distresses and
these treatments may vary as a function of the distress severity level.
The ideal airport pavement LCCA captures all forms of maintenance costs, since the types,
timings, and extents of maintenance activities will be different for each pavement alternative.
However, because routine reactive-type maintenance costs generally are not very high and not
substantially different between pavement types, they usually can be ignored. Thus, the focus of
maintenance costs should be on the timing and extent of preventive and major forms of
maintenance. Again, pavement management and/or history records should be consulted to
develop this information.
Step 5—Estimate Direct/Owner Costs
The costs of building, maintaining, and rehabilitating pavements as part of each alternative
pavement strategy are an important element of LCCA. Using reliable, up-to-date unit price
estimates for each activity/material pay item associated with the initial structure (whether
new/reconstructed or rehabilitated) and future M&R treatments will ensure a fair and accurate
computation of life cycle costs. Step 5 involves estimating these unit costs and combining them
with estimated pay item quantities to develop the physical costs of pavement activities for use in
the LCCA. It also entails determining whether to account for the salvage value of the pavement
structure at the end of the analysis period and, if so, developing an estimate of that benefit (or
cost).

55
A third aspect of direct/owner costs is the supplemental costs associated with construction and
M&R activities. These costs can be categorized into administrative, engineering, and traffic
control costs. Their inclusion in the LCCA depends on whether substantive differences can be
identified among the alternative pavement strategies.
Physical Costs of Pavement Activities
The key to estimating physical costs is identifying and obtaining sufficient and reliable unit cost
data for the pay items that will go into the initial structure and individual M&R treatments. The
best sources for these data are the historical bid tabulations for projects undertaken in recent
years (preferably, within the last 5 to 7 years) at the subject airport or at other airports in the
region. These data often are compiled and summarized on a regular basis for project estimating
purposes, and in some cases they are included in the airport pavement management system.
Other good sources for unit cost data are the local highway agencies, such as the district office of
the state DOT or nearby city/county governments. Since these agencies may use different
specifications and/or pay item designations, care must be taken to ensure that the pay items
represent the same work activities as those of the subject airport.
Unit cost estimates can be developed using the unit price data from the lowest bid or three lowest
bids tendered on projects of comparable nature. Each average unit price must be adjusted to
present day to account for the effects of inflation, and consideration should be given to filtering
out prices biased by projects that included small quantities of a particular pay item. Using
inflation-adjusted and quantity-filtered unit price data, the mean cost of each pay item, as well as
key variability parameters (standard deviation, range), can be computed for use in the LCCA.
Figures 10 and 11 illustrate the process of normalizing unit cost data and developing best
estimates for both deterministic and probabilistic LCCA applications.

56
Figure 10. Example of pay item unit price development.
Figure 11. Colorado DOT’s process for estimating initial costs (Colorado DOT, 2009).
In cases where new materials/technologies are expected to be used and little or no regional cost
information is available, estimates should be derived using data available from other sources.
Pavement industry groups can be consulted to help identify appropriate sources.
0
5
10
15
20
25
30
35
2 4 6 8 10 12 14 16 18 20 22 24 26 28 30 32 34 36 38 40
Granular Base Unit Price, $/ton
Nu
mbe
r of
Pro
ject
s
No inflation adjustment, no quantityfiltering
Inflation adjusted, no quantityfiltering
Inflation adjusted, quantity filtered
Mean = $11.60/tonStd. Dev. = $2.33/ton

57
Unit cost data obtained from other sources may need to be adjusted to account for geographical
differences in construction costs. The US Air Force has developed adjustment factors on a state-
by-state basis that can serve this purpose (AFCESA, 2007). The most recent listing of
adjustment factors is shown in table 7.
Table 7. Construction cost location adjustment factors (AFCESA, 2007).
State Factor State Factor State Factor State Factor Alabama 0.82 Indiana 0.96 Nebraska 0.94 Rhode Island 1.11 Alaska 1.90 Iowa 0.98 Nevada 1.24 South Carolina 0.88 Arizona 0.97 Kansas 0.93 New Hampshire 1.06 South Dakota 0.96
Arkansas 0.85 Kentucky 0.91 New Jersey 1.17 Tennessee 0.85 California 1.18 Louisiana 0.94 New Mexico 0.98 Texas 0.85 Colorado 1.04 Maine 1.06 New York 1.07 Utah 1.02
Connecticut 1.13 Maryland 1.02 North Carolina 0.84 Vermont 1.00 Delaware 1.02 Massachusetts 1.12 North Dakota 1.04 Virginia 0.93 Florida 0.86 Michigan 1.12 Ohio 0.96 Washington 1.06 Georgia 0.84 Minnesota 1.12 Oklahoma 0.91 West Virginia 0.95 Hawaii 1.74 Mississippi 0.88 Oregon 1.06 Wisconsin 1.08 Idaho 1.03 Missouri 0.97 Pennsylvania 1.04 Wyoming 0.98
Illinois 1.20 Montana 1.14
Salvage Value
Salvage value reflects any remaining worth of a pavement alternative at the end of the analysis
period (Grogg et al., 2001). Salvage value may be either positive or negative: a positive value
represents useful, salvageable material, whereas a negative value represents a cost to remove and
dispose of the material that exceeds any possible positive salvage value (Peterson, 1985).
There are two components to salvage value: serviceable life (commonly referred to as remaining
life) and residual value. As previously discussed, current FAA guidance is for salvage value to
be based solely on serviceable life. In the highways arena, a few state DOTs use the residual
value method, but many more use the remaining life method. As illustrated in figure 12, the
remaining life method prorates the cost of the last pavement rehabilitation event using the ratio
of its remaining life at the end of the analysis period to its total expected life.
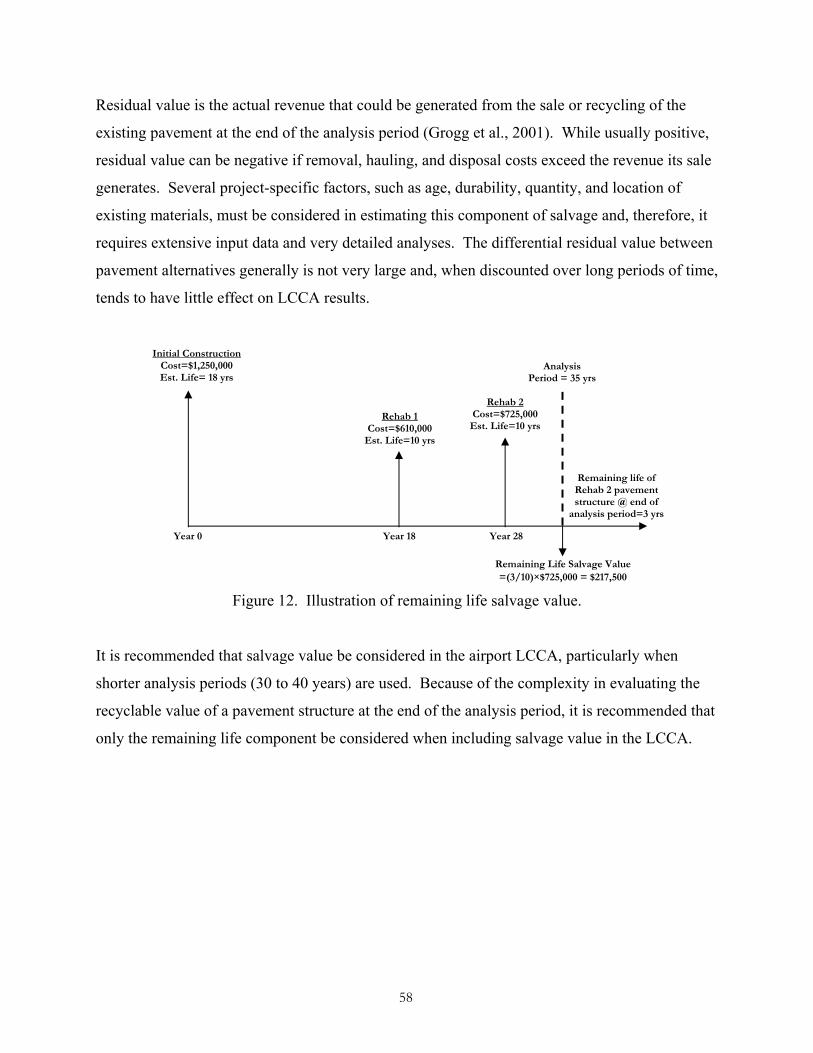
58
Residual value is the actual revenue that could be generated from the sale or recycling of the
existing pavement at the end of the analysis period (Grogg et al., 2001). While usually positive,
residual value can be negative if removal, hauling, and disposal costs exceed the revenue its sale
generates. Several project-specific factors, such as age, durability, quantity, and location of
existing materials, must be considered in estimating this component of salvage and, therefore, it
requires extensive input data and very detailed analyses. The differential residual value between
pavement alternatives generally is not very large and, when discounted over long periods of time,
tends to have little effect on LCCA results.
Figure 12. Illustration of remaining life salvage value.
It is recommended that salvage value be considered in the airport LCCA, particularly when
shorter analysis periods (30 to 40 years) are used. Because of the complexity in evaluating the
recyclable value of a pavement structure at the end of the analysis period, it is recommended that
only the remaining life component be considered when including salvage value in the LCCA.
Initial Construction Cost=$1,250,000 Est. Life= 18 yrs
Rehab 1 Cost=$610,000
Est. Life=10 yrs
Year 0 Year 18 Year 28
Analysis Period = 35 yrs
Rehab 2 Cost=$725,000
Est. Life=10 yrs
Remaining Life Salvage Value =(3/10)×$725,000 = $217,500
Remaining life of Rehab 2 pavement structure @ end of
analysis period=3 yrs

59
Supplemental Costs
Brief descriptions of supplemental costs are provided below. Each category is applicable only to
the series of anticipated future M&R events.
Administrative costs—Contract management and administrative overhead.
Engineering costs—Design and construction engineering, construction supervision, and
materials testing and analysis.
Ground traffic control costs—Traffic control setup and communications.
If the supplemental costs of the different alternatives are approximately the same, then these
costs can be ignored and only the physical costs should be considered. If there are significant
differences, the process of developing estimates for all events should proceed. Because
estimating these costs can be difficult and time-consuming, an alternative method to consider is
to specify them as a percentage of the total project-level pavement costs. Table 8 illustrates this
simple and straightforward application using a value of 5 percent to represent engineering costs.
As can be seen, the percentage is applied equally to each event in each alternative strategy.
Table 8. Example application of estimating supplemental costs.
Event
Cost Item
Pavement Alternative 1
Pavement Alternative 2
Rehabilitation No. 1
Total Pavement Cost $1,250,000 $1,560,000 5% Engineering Cost
$62,500 $78,000
Total $1,312,500 $1,638,000 Rehabilitation No. 2
Total Pavement Cost $575,000 $350,000 5% Engineering $28,750 $17,500 Total $603,750 $367,500
Step 6—Estimate Indirect/User Costs
This step should be performed if it is decided in step 2 that indirect/user costs should be included
in the airport pavement LCCA. In this step, estimates of the reduction in airport daily revenue

60
are developed for each event (initial construction/rehabilitation and future M&R treatments) in
the life cycle of each pavement alternative. Key aspects include defining the following:
Type and duration of pavement facility restrictions—Because each airport is unique in
terms of its airfield pavement system layout, how it manages air and ground traffic
operations, and how it facilitates construction and M&R practices, each event in the life
cycle of a pavement alternative must be examined carefully to identify the most probable
construction zone scenario. For each scenario, it must be determined if daily capacity
will be exceeded and, if so, for how long.
Reductions in aircraft operations, passengers, and/or cargo—If capacity is expected to be
exceeded for a given construction zone scenario, then estimates of the daily reduction in
aircraft operations, passengers, and/or cargo must be developed. These estimates should
reflect what would most likely occur in terms of how aircraft operators might alter their
services. If capacity is not expected to be exceeded, but the construction zone is such that
airlines and/or air cargo companies must reduce their operational loads due to shortened
runways, then estimates of reduced passengers and/or reduced landing weights must be
developed.
Loss of daily operating revenue—Commercial airport owner/operators derive most of
their revenues either directly or indirectly from aeronautical activities. These include
passenger, cargo, and fuel taxes/fees collected through the Airport Improvement Program
(AIP), passenger facility charges (PFCs), and aircraft take-off/landing fees. Computation
of the loss of daily operating revenue for a given construction zone scenario entails (a)
multiplying the appropriate fee or tax rates by the daily reductions in aircraft, passengers,
and cargo, (b) summing the individual daily revenue losses, and (c) multiplying the
overall daily revenue loss by the number of days the construction zone scenario is
expected to be in-place.
As an example illustration, consider the following runway construction scenario for a major
commercial airport:
Initial Year (Year 0) Data
Daily Operations = 1,250 (625 arrival flights and 625 departing flights)
Average Number of Passengers/Flight: 80

61
Daily Total Passengers = 1,250 × 80 = 100,000
Daily Passenger Enplanements = 625 × 80 = 50,000
Daily Passenger Deplanements = 625 × 80 = 50,000
Average Aircraft Fuel Usage: 320 gal/flight
Daily Fuel Flowage = 320 × 625 = 200,000 gal
Average Landing Fee = $750/aircraft
Passenger Facility Charge (PFC) = $4.50/enplaned passenger
Fuel Flowage Fee = $0.10/gal
Landing Fee Daily Revenue = 625 aircraft * $750/aircraft = $468,750
PFC Daily Revenue = 50,000 passengers * $4.50/enplaned passenger = $225,000
Fuel Flowage Daily Revenue = 200,000 gal * $0.10/gal = $20,000
Total Daily Revenue = $468,750 + $225,000 + $20,000 = $713,750
Two different pavement alternatives are being considered for the project, which is being
evaluated for life cycle costs covering a 30-year analysis period. The first alternative consists of
initial construction followed by rehabilitation activities after 15 and 25 years. The second
alternative consists of initial construction followed by a rehabilitation treatment after 20 years.
Each event for each pavement alternative entails a partial runway closure that will limit the
runway length and therefore reduce the operational loads of some aircraft. These load reductions
will cause the average landing fee to decrease from $750/aircraft to a specified value
corresponding to the events of each alternative. For simplicity, it has been assumed that aircraft
operations will remain the same over the 30-year analysis period.
Table 9 lists the anticipated reductions in flight associated with each construction and
rehabilitation event, as well as the corresponding reductions in passenger movements and fuel
usage. Based on these reductions and the various fees listed above, reductions in daily airport
operating revenues are computed for each event, along with the total lost revenue corresponding
to the estimated duration of the event. A summation of lost revenues for each pavement
alternative is also given. However, it should be noted that as part of an LCCA, the lost revenues
associated with future rehabilitation treatments would be discounted using the selected discount
rate. These values also assume that work is performed during peak hours. Should construction

62
activities be scheduled at night or during other off-peak hours such that peak-hour operations are
less impacted, reduction factors should be adjusted accordingly to reflect the reduced impact of
construction activities.

63
Table 9. Estimate of airport operating revenue losses due to construction/rehabilitation activities.
Year Pavement Alternative #1 Pavement Alternative #2 0 Initial Construction
Duration: 50 days Avg Landing Fee: $700 Passenger Reduction: 2,000 passengers Fuel Reduction: 8,000 gal Daily Lost Revenue: ($750−$700)×(625) + (2,000×$4.50) + (8,000×$0.10) = $41,050 Total Lost Revenue: 50 days × $41,050/day = $2,052,500
Initial Construction Duration: 90 days Avg Landing Fee: $700 Passenger Reduction: 2,000 passengers Fuel Reduction: 8,000 gal Daily Lost Revenue: ($750−$700)×(625) + (2,000×$4.50) + (8,000×$0.10) = $41,050 Total Lost Revenue: 90 days × $41,050/day = $3,694,500
15 Rehab #1 Duration: 25 days Avg Landing Fee: $685 Passenger Reduction: 4,000 passengers Fuel Reduction: 16,000 gal Daily Lost Revenue: ($750−$685)×(625) + (4,000×$4.50) + (16,000×$0.10) = $60,225 Total Lost Revenue: 25 days × $60,225/day = $1,505,625
—
20 — Rehab #1 Duration: 25 days Avg Landing Fee: $725 Passenger Reduction: 1,200 passengers Fuel Reduction: 4,800 gal Daily Lost Revenue: ($750−$725)×(625) + (1,200×$4.50) + (4,800×$0.10) = $21,505 Total Lost Revenue: 25 days × $21,505/day = $537,625
25 Rehab #2 Duration: 30 days Avg Landing Fee: $725 Passenger Reduction: 1,200 passengers Fuel Reduction: 4,800 gal Daily Lost Revenue: ($750−$725)×(625) + (1,200×$4.50) + (4,800×$0.10) = $21,505 Total Lost Revenue: 30 days × $21,505/day = $645,150
—
Total Lost
Revenue*
$2,052,500 + $1,505,625 + $645,150 = $4,203,275 $3,694,500 + $537,625 = $4,232,125
* Does not account for discounting of future rehab costs.

64
Step 7—Develop Expenditure Stream Diagrams
Expenditure stream diagrams are graphical or tabular representations of expenditures over time.
They are developed for each alternative pavement strategy to help the designer/analyst visualize
the magnitudes and timings of all expenditures projected for the analysis period. As shown in
figure 13, costs normally are depicted by upward arrows and benefits (e.g., salvage value) by
downward arrows.
Figure 13. Example expenditure stream diagram.
Step 8—Compute Life Cycle Costs
Once the expenditure stream for each alternative pavement strategy has been developed, the task
of computing projected life cycle costs is undertaken. For deterministic analysis, this is a simple
matter of converting all future costs (including salvage, if appropriate) projected to occur over
the chosen analysis period to present worth values using a specified discount rate. The initial
construction cost and all converted costs are then summed together to produce the NPW (see
equation 1). If desired, this cost can then be converted to EUAC using the discount rate and
analysis period (see equation 2). Sensitivity testing of selected inputs, such as the discount rate
or key unit costs, can also be performed to examine the effects on life cycle costs of varying
these inputs.
Initial Const $$
Time, years40
302010 0
Maint $$
Rehab $$
Maint $$ Maint $$ Maint $$ Maint $$Maint $$Maint $$
Rehab $$Rehab $$
Salvage $$

65
As described earlier, probabilistic LCCA involves randomly selecting a value from each input
parameter’s sampling distribution, using the selected values and the NPW/EUAC formula to
compute a single life cycle cost, and repeating these steps through hundreds or thousands of
iterations to generate an array of forecasted costs. These costs are then analyzed and compared
with the forecasted costs of the alternative pavement strategies to identify the most economical
strategy. Probabilistic simulation requires the use of either a computerized spreadsheet program
equipped with the necessary probabilistic distribution functions or a stand-alone computer
program that is properly hard-coded to perform the simulation.
When performing a probabilistic simulation, it is important to make sure that each iteration
represents a scenario that can actually occur. Two particular modeling errors with the potential
to create unrealistic scenarios are as follows (FHWA, 1998):
Lack of appropriate pre-defined relationships between input parameters—Although each
randomly selected value for a given iteration may be legitimate on its own, reality may
dictate that certain relationships exist between the input parameters. For example, since
higher traffic volume generally is linked with shorter pavement life for a given design
cross-section, it is important to establish an appropriate sampling correlation between
these two inputs. Such a correlation would ensure that, for each iteration, a sample from
the high side of the traffic probability distribution is countered with a sample on the low
side of the pavement life probability distribution, and vice versa.
Lack of fixed limits on input sampling distributions—For some types of sampling
distributions, the limits for sampling are not among the criteria used to define the
distribution (e.g., in defining a normal sampling distribution, only the mean and standard
deviation are needed). However, it is important to know the minimum and maximum
values for sampling, so that reasonable values are used in the probabilistic simulation.
Misleading simulation results can be expected, for instance, if the distribution for a cost
or pavement service life parameter allows negative values to be selected.

66
Step 9—Analyze/Interpret Results
Regardless of whether deterministic or probabilistic life cycle costs are computed, the results
must be analyzed and interpreted carefully to identify the most economical pavement strategy.
Because the outputs of each computational approach are different (deterministic yields a single
NPW/EUAC value, probabilistic yields a distribution of NPW/EUAC values), the ways in which
they are evaluated and interpreted are different.
In the analysis of deterministic results, it is common practice to compute the percent difference
in life cycle costs of the alternative strategies. If the percent difference between the two lowest
cost strategies is greater than some established minimum requirement—usually set according to
the tolerance for risk (5 and 10 percent are common)—then the lowest cost strategy is accepted
as the most economical one. If, on the other hand, the percent difference is less than the
established minimum requirement, then the life cycle costs of the two strategies are deemed
equivalent, thereby leaving the analyst with the option of reevaluating the strategies or allowing
other factors to drive the strategy selection process.
The results of probabilistic LCCA simulation can be analyzed and interpreted in different ways.
One straightforward, comprehensive approach recommended for use involves carrying out the
following evaluations in sequence:
1. Trial-by-trial comparisons of forecasted NPW/EUAC values.
2. Statistical analysis—differences between mean values.
3. Risk assessment of forecasted NPW/EUAC distributions.
Discussions of each evaluation are provided in the sections below.
Evaluation 1—Trial-By-Trial Comparisons
A preliminary indication of the most economical pavement strategy can be obtained by
examining the life cycle cost results associated with each iteration or trial computation (ARA,
2004). By tallying the number of “wins” for each alternative (i.e., trials in which one strategy

67
had the lowest life cycle cost compared to all other strategies), dividing the respective wins by
the total number of trials performed in the simulation, and multiplying by 100, the overall
probabilities for each alternative to have the lowest life cycle cost are determined. The pavement
strategy with the highest overall probability becomes the favored strategy, but additional
evaluation is needed to determine if it is the most economical one.
Table 10 shows the NPW results for three alternative strategies and 1,000 trials in columns 2
through 4. In columns 5 through 10, the outcomes as to whether a particular strategy had a lower
cost than one or all other alternatives for a given trial are indicated by values of 0 or 1—0
meaning that the cost was not lower, 1 meaning that the cost was lower. At the bottom of the
table, the results of all trials are tallied, and it can be seen that alternative C had the lowest life
cycle cost in 538 of the 1,000 total trials. Table 11 summarizes these results in terms of a
probability matrix. In the case of alternative C having the lowest life cycle cost of all three
alternatives, the probability of 53.8 percent is simply the quotient of 538 divided by 1,000,
multiplied by 100 percent.
Table 10. Process for tallying life cycle cost results on a trial-by-trial basis (ARA, 2004).
Iteration/ Trial No.
NPW, $1000 Alt. A < Alt. B
Alt. A < Alt. C
Alt. B < Alt. C
Alt. A Lowest?
Alt. B Lowest?
Alt. C Lowest?Alt. A Alt. B Alt. C
1 1,692 1,511 1,501 0 0 0 0 0 1
2 1,570 1,646 1,608 1 1 0 1 0 0
3 1,535 1,472 1,515 0 0 1 0 1 0
4 1,425 1,418 1,536 0 1 1 0 1 0
5 1,705 1,677 1,639 0 0 0 0 0 1 . . . . . . . . . .
1,000 1,492 1,541 1,476 0 0 0 0 0 1
TOTAL 302 244 386 152 310 538

68
Table 11. Life cycle cost probability matrix for trial-by-trial comparison example (ARA, 2004).
Pavement Strategy
Alternative
Probability of LCC of: Overall Probability of
Having the Lowest LCC, %
Alt. A Less Than LCC of:
Alt. B Less Than LCC
of:
Alt. C Less Than LCC
of:
A X 69.8 75.6 15.2
B 30.2 X 61.4 31.0
C 24.4 38.6 X 53.8
Evaluation 2—Statistical Analysis
In this generally straightforward exercise, the mean and standard deviation life cycle cost values
computed for each alternative pavement strategy are used to determine if significant differences
exist between the means of each strategy (ARA, 2004). If the strategy with the lowest mean life
cycle cost is shown to be statistically significantly lower than all other alternatives, then it can be
accepted as the most economical strategy. Otherwise, the third and final evaluation option must
be investigated.
For the evaluation of two competing alternatives, the difference in means is investigated using
the t-test. For three or more competing alternatives, an analysis of variance (ANOVA) can be
performed or, if appropriate, the LCCA can be narrowed down to the two seemingly lowest cost
alternatives. Because of the complexity of ANOVA, it is not discussed here.
In the t-test, the null hypothesis is that the mean life cycle cost values of the alternative strategies
are equal (e.g., LCCAltA = LCCAltB) at some prescribed confidence level (typically 90 percent).
To reject the null hypothesis and conclude that the mean life cycle costs are statistically
significantly different, the calculated t-value must fall in a critical range, defined by the chosen
confidence level and the sample size n (i.e., number of trials in the simulation). The critical
range can be determined by referring to a t-distribution table. For simulations with the
recommended minimum of 500 trials, the following critical ranges apply:

69
Confidence Level Critical Range
90% t +1.65 or t -1.65
95% t +1.96 or t -1.96
99% t +2.58 or t -2.58
The t-value is calculated using the following equation:
t = (LCCAltA – LCCAltB) / [(sAltA2 + sAltB
2)/n]0.5 Eq. 6
where: LCCAltA = Mean life cycle cost (NPW or EUAC) for alternative strategy A,
$.
LCCAltB = Mean life cycle cost for alternative strategy B, $.
sAltA = Standard deviation of life cycle cost for alternative strategy A, $.
sAltB = Standard deviation of life cycle cost for alternative strategy B, $.
n = Number of simulation trials.
As an example application of the t-test, figure 14 shows the NPW distributions of two alternative
strategies, along with their respective mean and standard deviation values. Previous trial-by-trial
comparison indicated that the favored strategy is alternative B (lowest NPW in 56.3 percent of
the 1,000 trials). Based on a confidence level of 95 percent, the critical range is established at t
+1.96 or t -1.96. Entering the respective mean and standard deviation costs into the above
equation yields the following result:
t = ($1,611,702 – $1,600,344) / [($100,1902 + $89,9962)/1000]0.5
t = $11,358 / $4,259
t = 2.67

70
Figure 14. NPW frequency distributions for alternative strategies A and B.
Since the t-value falls within one part of the critical range (i.e., +1.96), the null hypothesis is
rejected and the mean NPW of alternative strategy B is shown to be statistically significantly
lower than that of alternative A. Although there is a potential for savings in selecting alternative
A, that potential is outweighed by alternative B over the range of most probable NPW
outcomes—$1.51 to $1.7 million—as illustrated in figure 15.
Figure 15. NPW cumulative distributions for alternative strategies A and B.
00.10.20.30.40.50.60.70.80.9
1
1200 1300 1400 1500 1600 1700 1800 1900 2000
NPV, $1000
Cu
mu
lati
ve P
rob
abili
ty
Alternative A Alternative B
Most probable cost range
NPW, $1000
0102030405060708090
100
1400 1450 1500 1550 1600 1650 1700 1750 1800
NPV, $1000
Fre
qu
ency
Alternative A Alternative B
Alternative AMean = $1,611,702Std Dev = $100,190
Alternative BMean = $1,600,344Std Dev = $89,996

71
Evaluation 3—Risk Assessment
If the results of the statistical analysis are not definitive with respect to identifying the most
economical strategy, then risk assessment should be performed. The goal of this evaluation is to
identify any distinguishing probability characteristics that play to or against an agency’s
propensity for risk-taking. Since statistical analysis will have revealed no statistically significant
difference between the expected means of the lowest-cost alternatives, such distinguishing
characteristics may be looked for in the tails of the frequency distribution curves.
Suppose that alternative A from the previous illustration had a slightly lower mean NPW ($1.608
million instead of $1.611 million) and a more dispersed distribution, such that a t-test showed no
statistically significant difference between it and alternative B. The frequency distribution
curves for the two alternatives would resemble those shown in figure 16. At the tails of these
two distributions, there are clear differences in the forecasted NPWs. In the case of alternative
A, there is potential for a cost under run if the true NPW is low, say less than $1.45 million. This
opportunity for cost savings is termed upside risk. If, on the other hand, the true NPW is high,
say greater than $1.75 million, there is potential for a cost overrun associated with alternative A.
This chance for financial loss is termed downside risk.
Figure 16. Risk assessment—NPW frequency distributions.
0102030405060708090
100
1200 1300 1400 1500 1600 1700 1800 1900 2000
NPV, $1000
Fre
qu
ency
Alternative A Alternative B
Alternative AMean = $1,608,588Std Dev = $112,623
Alternative BMean = $1,600,344Std Dev = $89,996
NPW, $1000

72
In the cumulative distributions shown in figure 17, it can be seen that there is a 10 percent
probability that the NPW of alternative A will be less than alternative B by as much as $26,000.
At the other end of the spectrum, there is a 10 percent probability that alternative A will exceed
the cost of alternative B by up to $41,000. Although to many agencies this information may be
insufficient for identifying the most economical strategy, to some risk-averse agencies it may
provide enough assurance that the allocated budget is best served by choosing alternative B. In
other words, there is a greater risk of the true cost of alternative A exceeding the cost of
alternative B than vice versa.
Figure 17. Risk assessment—NPW cumulative distributions.
Step 10—Reevaluate Strategies
In the final step of the LCCA process, information resulting from the LCCA is reevaluated to
determine if any modifications to the alternative strategies are warranted, prior to making a final
decision on which alternative to use (ARA, 2004). Such adjustments may entail changes to the
original structure or rehabilitation treatment, revisions to the maintenance of traffic plans,
reductions in construction periods, or changes in future M&R activities.
Probabilistic sensitivity analysis is one technique that can provide insight on the refinement of
strategies. This technique uses correlation analysis and tornado plots (figure 18) to show the
00.10.20.30.40.50.60.70.80.9
1
1200 1300 1400 1500 1600 1700 1800 1900 2000
NPV, $1000
Cu
mu
lati
ve P
rob
abili
ty
Alternative A Alternative B
Alt B$1,489,000
Alt A$1,463,000
Alt A$1,752,000
Alt B$1,711,000
- $41,000
$26,000
NPW, $1000

73
impacts of key input parameters on life cycle costs. Inputs found to be driving the LCCA results
can be looked at more closely to determine if certain actions can be taken to improve cost-
effectiveness.
Figure 18. Sensitivity of factors affecting the NPW of a particular pavement strategy.
0.12
-0.20
-0.22
0.25
-0.35
0.60
-0.80 -0.60 -0.40 -0.20 0.00 0.20 0.40 0.60 0.80
Correlation Coefficient
Initial Const. Cost
Initial Const. Life
First Rehab Cost
Discount Rate
Second Rehab Cost
First Rehab Life

74
CHAPTER 4. DEVELOPMENT OF THE LCCA PROGRAM FOR AIRPORT
PAVEMENTS
The LCCA program developed in this project is called AirCost. It has been modeled after the
FHWA RealCost program and the other highway pavement LCCA programs reviewed in the
first phase of the study. In addition, to retain a connection with the structure and layout of past
airport pavement LCCAs (e.g., Pensacola, Tulsa), the new program uses the basic computational
template utilized in those spreadsheet-based LCCAs.
AirCost is a Microsoft Excel-based program capable of performing both deterministic and
probabilistic LCCA for use in traditional and alternate-bid (deterministic only) contracting
situations. The program utilizes Visual for Basic Applications (VBA) programming tools to
provide a user-friendly GUI and navigational tools to perform probabilistic life cycle cost
computations for up to four alternative pavement strategies. Listed below are brief descriptions
of some of the key features of the program:
Main switchboard for navigating to the various input and output screens.
FAA-based pay item library with default unit costs (mean and standard deviation) that
can be modified by the user.
Input screen for user-defined material/activity pay items and corresponding unit costs
(mean and standard deviation).
Input screen for user to define the LCCA parameters, including:
Analysis period.
Economic formula—NPW or EUAC.
Remaining life salvage value—to include or exclude.
Simulation mode (deterministic or probabilistic) for discount rate, pay item unit costs,
and pavement service lives.
Discount rate value (mean for deterministic, mean and standard deviation for
probabilistic).
Other direct costs—administrative, engineering, maintenance of traffic expressed as
percentages of construction cost.
User costs—to include or exclude, total airport daily revenue.

75
Ability to analyze up to four different pavement strategy alternatives for a given airport
pavement project. For each strategy, the user has the ability to:
Assign the pavement strategy name.
Define the initial construction/rehabilitation event in terms of the specific pay items
and quantities comprising the event, the estimated service life (mean value for
deterministic LCCA, mean and standard deviation for probabilistic LCCA) of the
event, the duration of the event and the percent reduction in airport daily revenues (if
user costs are considered), and the scheduled maintenance activities (types, timings,
and quantities) for the pavement associated with the event.
Define up to six future rehabilitation events in terms of the specific pay items and
quantities comprising each event, the estimated service lives (mean value for
deterministic LCCA, mean and standard deviation for probabilistic LCCA) of each
event, the duration of each event and the corresponding percent reduction in airport
daily revenues (if user costs are considered), and the scheduled maintenance activities
(types, timings, and quantities) for the pavement associated with each event.
Input screen for user-defined simulation parameters, including number of iterations,
convergence monitoring, and probabilistic reporting levels.
Deterministic and probabilistic simulation output tables.
File management capabilities, including saving and exiting the workbook.
Appendix C includes the AirCost user manual.
76
CHAPTER 5. SUMMARY AND RECOMMENDATIONS
Summary
This study utilized information gathered through a comprehensive literature review and through
surveys with airport sponsor/consultant representatives to develop guidance and
recommendations for performing airport pavement LCCA. It also evaluated several LCCA
spreadsheets and software programs to help guide the development of a spreadsheet-based
probabilistic LCCA program for use by airport sponsors and/or their consultants.
The recommended LCCA practice involves the following process:
1. Define project scope.
2. Establish LCCA framework.
3. Develop alternative pavement strategies.
4. Determine expected pavement performance and M&R activity timings.
5. Estimate direct/owner costs.
6. Estimate indirect/user costs.
7. Develop expenditure stream diagram.
8. Compute life cycle costs.
9. Analyze results.
10. Reevaluate pavement strategies.
The process is conducive to both traditional and alternate bidding approaches. However, since
alternate bidding uses a discrete life cycle cost adjustment factor for each alternative strategy,
only a deterministic computation of the life cycle costs associated with future expenditures is
needed for projects utilizing the alternate bidding approach.
Key recommendations made concerning airport pavement LCCA include the following:
Selection of discount rate in accordance with the long-term (10-, 20-, or 30-year)
Treasury rate values provided in OMB Circular A-94 (appendix C).

77
Use of a longer analysis period than the 20-year analysis period currently recommended
by FAA. For new/reconstruction projects, an analysis period of at least 40 years is
considered appropriate, while for rehabilitation projects, an analysis period of at least 30
years is considered appropriate.
Continued use of the NPW economic formula, using constant/real dollars and a discount
rate selected in accordance with OMB Circular A-94.
Consideration of the inclusion of indirect/user costs in the form of reduced daily
operating revenue for the airport due to cancellations and delays caused by partial or full
pavement facility closures.
Use of probabilistic LCCA procedures when reliable historical data exist to model one or
more of the input parameters (e.g., discount rate, unit costs, pavement service lives). Use
of deterministic LCCA with sensitivity testing of key input parameters (discount rate,
major unit costs associated with the initial pavement structures, service life estimates of
the initial structures) when probabilistic LCCA is not appropriate.
Estimation of pavement service life using performance trend analysis or survival analysis
techniques, when sufficient and reliable pavement history (construction and M&R
activities and dates) and performance (time-series pavement condition data) data exist.
Development of expected future M&R treatment types and extents based on pavement
history and pavement management records.
Inclusion of remaining life salvage value component, particularly when shorter analysis
periods (30 to 40 years) are used.
Analysis and interpretation of probabilistic LCCA results using the following three-step
process:
1. Trial-by-trial comparisons of forecasted NPW/EUAC values.
2. Statistical analysis—differences between mean values.
3. Risk assessment of forecasted NPW/EUAC distributions.
The recommended LCCA practices were incorporated into a new Microsoft Excel-based
program, AirCost. AirCost is modeled after the FHWA RealCost program and other highway
pavement LCCA programs, but it retains the basic computational template utilized in current
airport sponsor/consultant LCCA spreadsheets. The program utilizes VBA programming tools to

78
provide a user-friendly GUI and navigational tools to perform probabilistic life cycle cost
computations for up to four alternative pavement strategies.
Recommendations
The LCCA guidelines and recommended practices presented in this report are a significant step
toward a more transparent and fair process in the economic evaluation of alternative pavement
strategies for airport pavement projects. The process is built upon principles and procedures that
are regarded as successful in both the airports and highways arenas. Options are provided that
allow airport sponsors/consultants some flexibility in the application of LCCA, based on the
availability of cost and performance data and the desire to capture indirect/user costs.
Pavement technologies will continue to advance, prompting the need to revisit and update the
airport pavement LCCA process. A substantial amount of research related to pavement type
selection and LCCA is ongoing in the highways area, including NCHRP Project 10-75 (Guide
for Pavement Type Selection) and the FHWA LCCA for Asset Management project. Findings
from these and other studies undoubtedly will provide ideas for improvements to the process
described in this report.
Additional suggestions for future improvements to the airport LCCA process include the
investigation and possible development of methods for:
Considering other forms of indirect/user costs, such as airline and passenger delay costs.
Quantifying the costs of different pavement types based on a cost-to-own concept.
Estimating pavement performance using FAARFIELD, PCASE, and other pavement
design software.
Estimating construction and M&R costs that are more reflective of the costs at the time
the project is let (traditional LCCA often involves a 1- to 3-year gap between the time a
pavement type is selected and the time it is put to bid).

79
REFERENCES
Air Force Civil Engineering Support Agency (AFCESA). 2007. Historical Air Force
Construction Cost Handbook. AFCESA. Tyndall Air Force Base, Florida.
Air Transport Association (ATA). 2009. ATA website, www.airlines.org.
Airport International. 2008. Airport International website, http://www.airport-
int.com/categories/integrated-software-packages/elmod-5.asp.
American Association of State Highway and Transportation Officials (AASHTO). 1972.
AASHTO Guide for Design of Pavement Structures, AASHTO, Washington, D.C.
AASHTO. 1993. AASHTO Guide for Design of Pavement Structures, AASHTO, Washington,
D.C.
American Association of State Highway Officials (AASHO) Guide: Road User Benefit Analyses
for Highway Improvements (1952 and 1960).
American Concrete Pavement Association. 2002. Life-Cycle Cost Analysis: A Guide for
Comparing Alternate Paevment Designs.
Applied Research Associates, Inc. (ARA). 2003. “Ohio Pavement Selection Process Analysis:
Neutral Third-Party,” Report prepared for Ohio Department of Transportation, Columbus, Ohio.
ARA. 2004. Mechanistic-Empirical Pavement Design Guide (MEPDG), National Cooperative
Highway Research Program Project 1-37A, NCHRP, Washington, D.C.
ARA. 2007. “Determination of the Appropriate Use of Pavement Surface History in the KDOT
LCCA Process,” Draft final report prepared for Kansas DOT, Topeka, Kansas.

80
ARA. 2008. “Review of Life-Cycle Cost Analysis Procedures,” Draft report prepared for
Ministry of Transportation of Quebec, Quebec City, Quebec.
Asphalt Institute (AI). 2004. State of the Practice: Pavement Type Selection.
Asphalt Pavement Alliance (APA). 2004. Pavement Type Selection Processes: A Position
Paper.
APA. 2005. Pavement Life-Cycle Cost Studies Using Actual Cost Data: A Synthesis.
California Department of Transportation. 2007. “Interim Life-Cycle Cost Analysis Procedures
Manual,” Caltrans Pavement Standards Team & Division of Design, Sacramento.
Colorado Department of Transportation (CDOT). 2006. Life-Cycle Cost Analysis and Discount
Rate on Pavements for the Colorado DOT, Colorado DOT, Denver.
CDOT. 2009. Pavement Design Manual, Chapter 10–Pavement Type Selection and Life-Cycle
Cost Analysis, Colorado DOT, Denver.
CTC & Associates LLC. 2006. “Asphalt and Concrete Pavement Letting Through Alternate
Pavement Type Bidding,” Transportation Synthesis Report, Wisconsin Department of
Transportation, Madison.
Dell’Isola, A.J. and S.J. Kirk. 1981. Life-Cycle Costing for Design Professionals, McGraw-
Hill, New York.
Demos, G.P. 2006. Life-Cycle Cost Analysis and Discount Rate on Pavements for the Colorado
Department of Transportation, Report No. CDOT-2006-17, Colorado Department of
Transportation, Denver.

81
Federal Aviation Administration (FAA). 1999. “FAA Airport Benefit-Cost Analysis Guidance,”
FAA Office of Aviation Policy and Plans, Washington, D.C.
FAA. 2005. Order 5100.38C, Chapter 9, Section 910, Washington, D.C.
FAA. 2009. A/C 150/5320-6E, Airport Pvaement Deisgn and Evaluation, Washington, D.C.
Federal Highway Administration (FHWA). 1994. Life Cycle Cost Analysis: Searching for
Solutions, A Policy Discussion Series, Number 12, FHWA, Washington, D.C.
FHWA. 1998. Demonstration Project No. 115: Life-Cycle Cost Analysis in Pavement Design,
Participant’s Notebook, Publication No. FHWA-SA-98-040, FHWA, Washington, D.C.
FHWA. 2002. Life-Cycle Cost Analysis Primer, Publication No. FHWA IF-02-047, FHWA
Office of Asset Management, Washington, D.C.
FHWA. 2004. “RealCost (version 2.1) User Manual,” Pavement Life-Cycle Cost Analysis,”
Office of Asset Management, FHWA, Washington, D.C.
Federal Register. 1994a. Executive Order 12893: Principles for Federal Infrastructure
Investments, Volume 59, Number 20.
Federal Register. 1994b. FHWA Interim Policy Statement on Life-Cycle Cost Analysis,
Volume 59, Number 131.
Federal Register. 1996. FHWA Final Policy Statement on Life-Cycle Cost Analysis, Volume
61, Number 182.
Garg, N., E. Guo, and R. McQueen. 2004. Operational Life of Airport Pavements, Report No.
DOT/FAA/AR-04/46, FAA, Washington, D.C.

82
Government Accounting Office (GAO). 1994. “Highway Infrastructure: Quality Improvements
Would Safeguard Billions of Dollars Already Invested,” Report No. GAO/RCED-94-198,
Washington, D.C.
Grogg, M.G., K.D. Smith, S.B. Seeds, T.E Hoerner, D.G. Peshkin, and H.T. Yu. 2001. “HMA
Pavement Evaluation and Rehabilitation Reference Manual,” National Highway Institute Course
No. 131063, NHI, Arlington, Virginia.
Indiana Department of Transportation (InDOT). 2005. Life-Cycle Cost Analysis for INDOT
Pavement Design Procedures. Indiana DOT, Indianapolis.
Hicks, R.G. and T.V. Scholz. 2003. “Life Cycle Costs for Lime in Hot Mix Asphalt, Volume
III-LCCA Software User’s Guide.” Final report prepared for National Lime Association,
Arlington, Virginia.
Institut du Transport Aerien (ITA). 2000. Costs of Air Transport Delay in Europe, ITA, Paris,
France.
Kentucky Transportation Cabinet (KTC). 2006. Appendix E-Pavement Type Selection Policy,
KTC, Frankfort.
Lamptey, G., M. Ahmad, S. Labi, and K. Sinha. 2005. “Life Cycle Cost Analysis for INDOT
Pavement Design Procedures,” Report No. FHWA/IN/JTRP-2004/28, Indiana Department of
Transportation and Federal Highway Administration.
McNerney, M.T. and R. Harrison. 1995. “Full-Cost Approach to Airport Pavement
Management,” Handbook of Airline Economics (D. Jenkins, ed.), McGraw-Hill, pp. 121–130.
Minnesota Department of Transportation. 2003. Pavement Type Determination Task Force
Final Report. Minnesota DOT, St. Paul.

83
Mississippi Department of Transportation. 2008. “Life Cycle Cost Analysis for Pavement Type
Selection,” AASHTO Research Advisory Committee Member Survey, Mississippi DOT,
Jackson.
Missouri Department of Transportation. 2004. “Pavement Design and Type Selection Process,”
Phase I Report, Missouri DOT, Jefferson City.
Missouri Department of Transportation. 2008. “Alternate Pavement Update,” Missouri DOT,
Jefferson City.
National Cooperative Highway Research Program (NCHRP) Project 1-10: Systems Approach to
Pavement Design (1974).
National Institute of Standards and Technology (NIST). 1996. Life-Cycle Costing Manual,
Handbook 135.
National Lime Association (NLA). 2003. Life Cycle Cost for Lime in Hot Mix Asphalt.
Ozbay, K., N.A. Parker, D. Jawad, and S. Hussain. 2003. Guidelines for Life Cycle Cost
Analysis, Report No. FHWA-NJ-2003-012, New Jersey Department of Transportation and
Federal Highway Administration.
Peterson, D. 1985. Life-Cycle Cost Analysis of Pavements. NCHRP Synthesis 122. National
Cooperative Highway Research Program, Washington, DC.
Research and Innovative Technology Administration (RITA). 1991. Intermodal Surface
Transportation Efficiency Act of 1991. National Transportation Library. Online at
http://ntl.bts.gov/DOCS/istea.html.
South Carolina DOT. 2005. “Life Cycle Cost Analysis Questionnaire-Preliminary Survey
Results,” SPR No. 656, South Carolina DOT, Columbia.

84
Scott, J. 2003. Design Guide Supplement: PCC Airport Pavements, FAA Northwest Mountain
Region.
Stephanos, P. 2008. Memorandum on “Clarification on FHWA Policy for Bidding Alternate
Pavement Types on the National Highway System,” FHWA, Washington, D.C.
Temple, W.H., Z. Zhang, J. Lambert, and K.M. Zeringue. 2004. “Agency Process for Alternate
Design and Alternate Bid of Pavements,” Transportation Research Record 1900, Transportation
Research Board, Washington, D.C.
Tighe, S. and M. Covalt. 2008. “Implementation of an Airport Pavement Management System,”
Transportation Research Circular E-C127, Transportation Research Board, Washington, D.C.
Transportation Research Board (TRB). 2008. “Research Needs Statement: Undefined Effects of
Rough Airfield Pavements on Aircraft Operations,” TRB, Washington, D.C.
Transtec Group. 2007. “Missouri DOT Pavement Design and Type Selection Process:
Independent Peer Review,” Missouri Department of Transportation, Jefferson City.
United States Air Force. 1994. Design and Construction Standards and Execution of Facility
Construction Projects, Air Force Instruction (AFI) 32-1023, Whole Building Design Guide
(WBDG), www.wbdg.org/index.php.
United States Army. 2004. Pavement Maintenance Management, Unified Facilities Criteria
(UFC) 3-270-08, Whole Building Design Guide (WBDG), www.wbdg.org/index.php.
Walls, J. and M. Smith. 1998. Life-Cycle Cost Analysis in Pavement Design—In Search of
Better Investment Decisions, Interim Technical Bulletin, Publication No. FHWA-SA-98-079,
FHWA, Washington, D.C.

85

APPENDICES

A-1
APPENDIX A. AIRPORT SPONSOR/CONSULTANT LCCA SPREADSHEETS
Pensacola Regional Airport, 2005 Runway Reconstruction
In this unique alternate bidding project, the City of Pensacola provided an addendum to the
contract documents and specifications that specified how the LCCA was to be performed by each
responsive bidder for the Runway 17-35 reconstruction project. The City did this to ensure a
competitive environment so that both asphalt and concrete would be evaluated fairly. The City
also provided a Microsoft Excel spreadsheet that bidders were to use to enter their bid prices,
determine their level of competitiveness based on the projected life cycle costs, and adjust their
bids, as desired. Bidders were given the option of bidding on either pavement type or both.
The deterministic LCCA behind the alternate bidding process used an analysis period of 20 years
and an inflation factor of 5 percent. Expected asphalt life was 30 years, and expected concrete
life was 40 years. Maintenance schedules were specified as shown in table A-1.
Table A-1. Maintenance schedules and unit costs for Pensacola Airport Runway 17-35
project.
Concrete Runway (17 in) Asphalt Runway (12 in)
Yr 15 - Joint seal replacement, $1.70/ft Yr 6 - Pavement preservation system, $2.00/yd2
Yr 19 - Crack seal, $1.30/yd2 Yr 13 - Pavement preservation system, $2.00/yd2
Yr 20 - 5% slab replacement, $16.00/yd2 Yr 15 - Mill & overlay (3 in), $15.12/yd2 1 in = 25.4 mm 1 yd2 = 0.84 m2
Unit costs for the various maintenance items were provided by either the ACPA or the AI. The
salvage value for both alternatives was based on straight-line depreciation of the expected life of
the last major rehabilitation activity (i.e., prorated life method). The salvage value was
calculated after the mill and overlay at year 15 for the asphalt runway and from year 0 for the
concrete runway.

A-2
Figure A-1 shows the LCCA computation sheet for one of the alternatives. The bidding resulted
in the selection of concrete pavement for the new runway.
Figure A-1. Example of alternate bid LCCA for Pensacola Regional Runway 17-35 project.
Tulsa International Airport, 2004 Runway Rehabilitation
Four alternatives were considered for the rehabilitation of Runway 18L-36R at Tulsa
International, which was experiencing significant D-cracking. These included:
Removal of existing pavement and reconstruction with 17 in (406 mm) PCC and 8-in
(203-mm) drainable base.
10-in (254-mm) unbonded PCC overlay (includes 2-in [51-mm] AC bond breaker).
5-in (127-mm) bonded PCC overlay (includes wedge-milling and repair at joints).
4-in (102-mm) HMA overlay.
DESIGN LIFE (N): 20
EXPECTED LIFE: 30
INFLATION FACTOR: (%) 5
SCHEDULE "B" ASPHALTIC CONCRETE RUNWAY
YEAR ACTIVITY ITEM UNIT COST QUANTITY TOTAL PERSENT PRESENT
(N) DESCRIPTION COST WORTH WORTH
FACTOR
0 INITIAL CONSTRUCTION 12" ASPHALT/5" SUBBASE SYD 182.17$ 130,309 23,737,899 1.0000 23,737,899.05$
1 0.9524 -$
2 0.9070 -$
3 0.8638 -$
4 0.8227 -$
5 0.7835 -$
6 MAINTENANCE PAVEMENT PRESERVATION SYSTEM SYD 2.00$ 130,309 260,618 0.7462 194,477.16$
7 0.7107 -$
8 0.6768 -$
9 0.6446 -$
10 0.6139 -$
11 0.5847 -$
12 0.5568 -$
13 MAINTENANCE PAVEMENT PRESERVATION SYSTEM SYD 2.00$ 130,309 260,618 0.5303 138,211.29$
14 0.5051 -$
15 REHABILITATION MILL AND OVERLAY SYD 15.12$ 130,309 1,970,272 0.4810 947,734.56$
16 0.4581 -$
17 0.4363 -$
18 0.4155 -$
19 0.3957 -$
20 0.3769 -$
SUBTOTAL 25,018,322.06$
LESS: SALAVAGE VALUE (495,049.88)$
PRESENT WORTH 188.19$ 24,523,272.18$
Notes: Salvage value is based on straight-line depreciation of the expected life of the last rehabilitation item.
Rehabilitation cost based on mill & 3" overlay including paving, mobilization, repainting, (includes transition areas)
Runway 17-35 ReconstructionPensacola Regional Airport
Life Cycle Cost Analysis EvaluationAsphaltic Concrete Runway

A-3
A discount rate of 3 percent and analysis period of 20 years were utilized in the deterministic
LCCA. Maintenance activities included routing and sealing joints and cracks, applying seal
coats to the asphalt runway surface and shoulders, and restriping the runway. Major
rehabilitation activities included mill-and-overlay efforts for the asphalt runway and shoulders.
Unit costs and schedules for the M&R activities are shown in tables A-2 and A-3, respectively.
The salvage value for all alternatives was based on the prorated life method.
Figure A-2 illustrates the LCCA worksheet for one of the alternatives. Based on the LCCA
results for each alternative, the consultant recommended to the Tulsa Airport Authority that the
bonded PCC overlay be given the strongest consideration.

A-4
Table A-2. Initial and future M&R unit costs for Tulsa International Runway 18L-36R
project.
Reconstruction Bonded PCC Overlay
Unbonded PCC Overlay
Asphalt Overlay
Initial Costs Initial Costs Initial Costs Initial Costs Removal of PCC and base, $9.00/yd2 17-in PCC, $55.00/yd2 8-in granular base, $8.00/yd2
Mill longitudinal & transverse ejoints, $2.50/ft Prepare surface, $1.00/yd2 5-in bonded PCC, $16.00/yd2 Shoulder tack coat, $1.00/gal AC on shoulders, $40.00/ton
Tack coat, $1.00/gal AC - Shoulders and bond breaker, $40.00/ton 10-in Unbonded PCC, $32.00/yd2
Tack coat, $1.00/gal Runway AC, $60.00/ton Shoulder AC, $40.00/ton Saw & seal matching joints, $2.75/ft
M&R Costs M&R Costs M&R Costs M&R Costs Rout & seal joints, $0.87/ft
Rout & seal joints, $0.87/ft Shoulder seal coat, $1.50/gal
Rout & seal joints, $0.87/ft Shoulder seal coat, $1.50/gal
Rout & seal joints, $1.00/ft Seal coat, $1.50/gal Mill 2-in AC, $2.50/yd2 Tack coat, $1.00/gal Overlay 2-in AC, $60.00/ton Overlay 2-in shoulder, $40.00/yd2
1 in = 25.4 mm 1 yd2 = 0.84 m2 1 gal = 3.785 L 1 ton = 0.91 Mton

A-5
Table A-3. M&R schedules for Tulsa International Runway 18L-36R project.
Reconstruction Bonded PCC Overlay
Unbonded PCC Overlay
Asphalt Overlay
Yr 6 – Route and seal joints, restripe runway
Yr 6 – Route and seal joints, shoulder seal coat, restripe runway
Yr 6 – Route and seal joints, shoulder seal coat, restripe runway
Yr 3 – Route and seal joints, runway and should seal coat, restripe runway
Yr 12 – Route and seal joints, restripe runway
Yr 12 – route and seal joints, shoulder seal coat, restripe runway
Yr 12 – Route and seal joints, shoulder seal coat, restripe runway
Yr 6 – Route and seal joints, runway and should seal coat, restripe runway
Yr 18 – Route and seal joints, restripe runway
Yr 18 – Route and seal joints, shoulder seal coat, restripe runway
Yr 18 – Route and seal joints, shoulder seal coat, restripe runway
Yr 9 – Mill and overlay runway and shoulders (2 in)
Yr 12 – Route and seal joints, runway and should seal coat, restripe runway
Yr 15 – Route and seal joints, runway and should seal coat, restripe runway
Yr 18 – Mill and overlay runway and shoulders (2 in)
1 in = 25.4 mm
A-6
Figure A-2. Example of deterministic LCCA for Tulsa International Runway 18L-36R project.
10" PCC 500,000
2,000,000 20110,000 2004100,000 3.00
10,000
UNIT PRESENTYEAR QUANTITY UNIT PRICE COST WORTH
INITIAL CONSTRUCTION
0 33,333 gal $1.00 $33,333 $33,3330 24,167 ton $40.00 $966,667 $966,6670 222,222 yd2 $32.00 $7,111,111 $7,111,1110 8,333 gal $1.00 $8,333 $8,3330 27,188 ton $40.00 $1,087,500 $1,087,5000 8,333 gal $1.00 $8,333 $8,3330 9,063 ton $40.00 $362,500 $362,500
Construct Transitions at Intersections 0 1 ea $700,000.00 $700,000 $700,000Restripe Runway 0 1 ea $35,000.00 $35,000 $35,000Electrical 0 1 LS $937,595.00 $937,595 $937,595
0 Subtotal $10,312,778 $825,022 $825,0220 Subtotal $10,312,778 $928,150 $928,150
FUTURE MAINTENANCE & REHABILITATION6 110,000 ft $1.95 $214,500 $179,640
Apply Seal Coat to Shoulder Surfaces 6 8,333 gal $1.50 $12,500 $10,469Restripe Runway 6 1 ea $0 $0
12 110,000 ft $1.95 $214,500 $150,446Apply Seal Coat to Shoulder Surfaces 12 8,333 gal $1.50 $12,500 $8,767Restripe Runway 12 1 ea $35,000.00 $35,000 $24,548
18 110,000 ft $1.95 $214,500 $125,996Apply Seal Coat to Shoulder Surfaces 18 8,333 gal $1.50 $12,500 $7,342Restripe Runway 18 1 ea $35,000.00 $35,000 $20,559
TOTAL INITIAL COST: $13,003,545 $13,003,545
TOTAL MAINTENANCE AND REHABILITATION $751,000 $527,768COST (year 0 to 20):
SALVAGE VALUE: ($4,334,515) ($2,399,916)
PRESENT WORTH: $11,131,397
EQUIVALENT UNIFORM ANNUAL COST: $748,205
Rout & Seal Joints
Design Costs at 8%Inspection Services at 9%
Rout & Seal Joints
Rout & Seal Joints
Apply Tack Coat on Runway
Place 10" PCC Unbonded Overlay
Place 3" AC Surface on Shoulders (145lb/ft3)
Place 2" AC Bond Breaker on Runway (145lb/ft3)
Apply Tack Coat on ShouldersPlace 9" AC Binder on Shoulders (145lb/ft3)Apply Tack Coat on Shoulders
Transverse joints, ft Discount rate, %Length of runway, ft
CONSTRUCTION ITEMS
Pavement area (8 lanes @ 25 ft/ln) ft2 Analysis period, yearsLongitudinal joints, ft Initial year of construction
Construct Unbonded PCC Overlay of R/W 18L-36R
Section: Shoulder area (2 @ 25 ft) ft2

A-7
George Bush Intercontinental Airport, 2005 Runway 9-27 Rehabilitation
Two major alternative types were considered for this project:
12-in (305-mm) unbonded PCC overlay (includes 1.5-in [38-mm] HMA bond-breaker).
7-in (178-mm) mill-and-replace with polymer-modified asphalt (Novophalt) (includes
0.5-in [13-mm] stress absorbing membrane interlayer [SAMI]).
The LCCA report delivered to the project team for review was considered preliminary at the time
it was written, so a 20 percent contingency was incorporated into all costs. Unit rates were based
on average cost of like items in the Houston Airport System bid tabs from 1997 to 2005. All
costs were adjusted to 2005 rates. In addition, local contractors and suppliers were contacted to
provide comparison rates, which were used to further refine the unit rates. The variables utilized
in the deterministic LCCA included an annual inflation rate of 2 percent, a discount rate of 5
percent, and an analysis period of 25 years. The rate of inflation was estimated over the period
of analysis and the discount rate was used to establish the NPW. The M&R schedule used for
each alternative in the LCCA are summarized in table A-4. Unit cost information was not
available.
Table A-4. M&R schedules for George Bush Intercontinental Runway 9-27 project
Concrete Runway (12 in) Asphalt Runway (7 in) Longitudinal repair, 1% of total quantity per year
Years 11 and 21, Mill and overlay
Transverse joint repair, 1% total quantity per year
Spall repair, 0.01% per year 1 in = 25.4 mm
The results of the preliminary LCCA showed the concrete alternative as having the lower NPW,
primarily because of the difference in the number of future major interventions projected for
each (2 for the asphalt alternative, 0 for the concrete alternative). A more detailed analysis was
planned that would include more up-to-date and accurate information, as well as information on
electrical circuitry requirements.

A-8
JFK International Airport, 2007 Runway 13R-31L Construction
Two major alternatives were considered for the JFK Runway 13R-31L construction project:
18-in (457-mm) PCC.
9-in (229-mm) HMA.
Each alternative included sub-alternatives in terms of full-closure, partial-closure, and night
work scenarios.
A discount rate of 3.5 percent and an analysis period of 40 years were used in the LCCA. A
detailed M&R schedule was utilized as shown in table A-5. Unit costs used for this project were
not available. Salvage costs for the concrete and asphalt alternatives were included, but the exact
basis for their derivation was not given.
Table A-5. M&R schedules for JFK International Runway 13R-31L project.
Concrete Runway (18 in) Asphalt Runway (9 in) Yr 8 – Shoulder/erosion/fillets seal coat, PCC repair (1% of initial cost), regroove, repaint
Yr 8 – Mill and overlay, PCC repair (1% of initial cost), regroove, repaint
Yr 16, Joint seal replacement, shoulder/erosion/fillets mill and overlay, PCC repair (2% of initial cost), regroove, repaint
Yr 16 – Mill and overlay, PCC repair (2% of initial cost), shoulder/erosion mill and overlay, regroove, repaint
Yr 24 – Shoulder/erosion/fillets seal coat, PCC repair (2% of initial cost), regroove, repaint
Yr 24 – Mill and overlay, PCC repair (2% of initial cost), regroove, repaint
Yr 32, Joint seal replacement, shoulder/erosion/fillets mill and overlay, PCC repair (2% of initial cost), regroove, repaint
Yr 16 – Mill and overlay, PCC repair (4% of initial cost), shoulder/erosion mill and overlay, regroove, repaint
1 in = 25.4 mm
Figure A-3 illustrates the LCCA template established for one of the alternatives, with dummy
values inserted instead of the actual values. Figure A-4 shows the LCCA comparison template,
equipped for discount rate sensitivity analysis.

A-9
Figure A-3. Deterministic LCCA template for JFK International Runway 13R-31L project.
3.5%
YEAR (N)
ACTIVITY ITEM DESCRIPTION TOTAL COSTPRESENT WORTH FACTOR
PRESENT WORTH
0 INITIAL CONSTRUCTION SEE NOTE 1,000,000$ 1.0000 1,000,000$ 1 0.9662 -$ 2 0.9335 -$ 3 0.9019 -$ 4 0.8714 -$ 5 0.8420 -$ 6 0.8135 -$ 7 0.7860 -$ 8 REHABILITATION - 1A SEE NOTE 1,000,000$ 0.7594 759,412$ 9 0.7337 -$
10 0.7089 -$ 11 0.6849 -$ 12 0.6618 -$ 13 0.6394 -$ 14 0.6178 -$ 15 0.5969 -$ 16 REHABILITATION - 2A SEE NOTE 1,000,000$ 0.5767 576,706$ 17 0.5572 -$ 18 0.5384 -$ 19 0.5202 -$ 20 0.5026 -$ 21 0.4856 -$ 22 0.4692 -$ 23 0.4533 -$ 24 REHABILITATION - 3A SEE NOTE 1,000,000$ 0.4380 437,957$ 25 0.4231 -$ 26 0.4088 -$ 27 0.3950 -$ 28 0.3817 -$ 29 0.3687 -$ 30 0.3563 -$ 31 0.3442 -$ 32 REHABILITATION - 4A SEE NOTE 1,000,000$ 0.3326 332,590$ 33 0.3213 -$ 34 0.3105 -$ 35 0.3000 -$ 36 0.2898 -$ 37 0.2800 -$ 38 0.2706 -$ 39 0.2614 -$ 40 SALVAGE VALUE SEE NOTE 99,754,350$ 0.2526 25,195,202$
PRESENT WORTH IN 2007 DOLLARS 28,302,000$
Note:INITIAL CONSTRUCTIONREHABILITATION - 1A
REHABILITATION - 2A
REHABILITATION - 3A
REHABILITATION - 4A
SALVAGE VALUE
Discount Rate - BASED ON 2007 (%)
9" AC, AC SHOULDERS/EROSION/FILLETS, SAFETY AREA REGARDING, NEW ELECTRICAL MILL & OVERLAY, (3"-M, 4"-O), PCC REPAIR (1% OF INITIAL COST OF CONCRETE), REPAINT
MILL & OVERLAY, (6"-M, 7"-O), PCC REPAIR (2% OF INITIAL COST OF CONCRETE), SHOULDER/ EROSION M&O (3"-M, 4"-O), REPAINT
40" AC FULL DEPTH ASPHALT CONCRETE CONSTRUCTION MINUS ASPHALT RUNWAY
Runway 13R-31L ReconstructionJohn F. Kennedy International AirportLife Cycle Cost Analysis Evaluation
Asphalt Approach, Option - 3A "Full Closure"
MILL & OVERLAY, (3"-M, 4"-O), PCC REPAIR (2% OF INITIAL COST OF CONCRETE), REPAINT
MILL & OVERLAY, (6"-M, 7"-O), PCC REPAIR (4% OF INITIAL COST OF CONCRETE), SHOULDER/ EROSION M&O (3"-M, 4"-O), REPAINT
A-10
Figure A-4. Deterministic LCCA alternative comparison template for JFK Runway 13R-31L.
Jefferson County (Colorado) Airport, Taxiway A and Apron Construction
Two alternative pavement types were considered for the Jefferson County Airport construction
project:
12-in (305-mm) PCC placed on 6-in (152-mm) stabilized permeable base.
6-in (152-mm) HMA placed on 6-in (152-mm) stabilized permeable base and 12-in (305-
mm) lime-stabilized subgrade.
A discount rate of 4 percent and an analysis period of 40 years were used in the deterministic
LCCA. The unit costs and M&R schedules for each pavement alternative are shown in tables A-
6 and A-7, respectively. A salvage value was not used in either analysis, although the
spreadsheet provided by the consultant contained a placeholder for this value.
An example of the LCCA computation worksheet used for one of the alternatives is provided in
figure A-5. The asphalt alternative resulted in the lowest NPW and is assumed to have been
selected for use.
Comparison of alternative options NPVs ($1,000,000) to discount rate.
2% 3% 4% 5% 6%ASPHALT - Option Plan 1A "Night Work" 1 1 1 1 1 ASPHALT - Option Plan 2A "Partial Use" 1 1 1 1 1 ASPHALT - Option Plan 3A "Full Closure" 1 1 1 1 1 Concrete - Option Plan 2C "Partial Use" 1 1 1 1 1 Concrete - Option Plan 3C "Full Closure" 1 1 1 1 1
- - - - -
- - - - -
Note: * Cost in "Year - 0" dollars.
Cost Advantage Alt. 2C vs Alt. 2A
Net Present Value (NPV)
Cost Advantage Alt. 2C vs Alt. 1A
Activity

A-11
Table A-6. Initial and future M&R unit costs for Jefferson County Taxiway A and Apron
project.
Concrete Pavement (12 in) Asphalt Pavement (6 in)
Initial Costs Initial Costs 12 in PCC, $40.00/yd2 6 in Asphalt, $18.50/yd2 6 in Stabilized base, $14.50/yd2 6 in Stabilized base, $14.50/yd2 12 in Stabilized subgrade, $4.75/yd2 Geotextile, $1.50/yd2 12 in lime-stabilized subgrade, $4.75/yd2
M&R Costs M&R Costs Joint seal, spall repair, slab replacement, $3.20/yd2
Crack sealing, $1.25/yd2 Seal coat, $0.35/yd2 4-in Mill and overlay, $14.50/yd2 Full-depth mill and new AC, $24.50/yd2
1 in = 25.4 mm
Table A-7. M&R schedules for Jefferson County Taxiway A and Apron project
Concrete Pavement (12 in) Asphalt Pavement (6 in)
Yr 20, Joint seal, spall repair, slab replacement
Yr 4, Crack sealing
Yr 40, Joint seal, spall repair, slab replacement
Yr 8, Crack sealing
Yr 9, Seal coat Yr 12, Crack sealing
Yr 15, 4 in Mill and overlay Yr 19, Crack sealing Yr 23, Crack sealing Yr 24, Seal coat Yr 28, Crack sealing Yr 30, Full-depth mill and new AC Yr 34, Crack sealing Yr 38, Crack sealing Yr 39, Seal coat
1 in = 25.4 mm

A-12
Figure A-5. Deterministic LCCA template for Jefferson County Taxiway A and Apron project.

B-1
APPENDIX B. HIGHWAY AGENCY LCCA PROGRAMS
FHWA RealCost
FHWA’s RealCost is a Microsoft Excel-based probabilistic program that utilizes the principles
and procedures contained in the FHWA Interim Technical Bulletin on LCCA. The program was
developed by the FHWA in 2002/2003, based on the DP 115 prototype program used in the
FHWA-sponsored LCCA workshops/demonstrations. The RealCost program includes VBA
programming functions instead of the @Risk add-in program to perform the probabilistic
simulations.
RealCost applies a simulation technique that entails defining individual input parameters by
either a frequency (or probability) distribution or by a discrete value, as is done typically in
deterministic LCCA, and computing life cycle costs (using an iterative sampling of the pre-
defined frequency distributions of each input variable for the probabilistic approach). The
resulting life cycle costs (NPW as a discrete average cost or a probability distribution of costs),
can then be examined and compared with the cost or cost distribution of a competing design
alternatives. The technique utilized by RealCost for probability simulation is the Monte Carlo
method and is illustrated in figure B-1 (Walls and Smith, 1998). Both agency and user costs
(delay costs and vehicle operating costs associated with construction and rehabilitation activities)
can be computed, with separate display of results.
The RealCost program generally is user-friendly and straightforward in its application. It has
two interface mechanisms—the form GUI and the worksheet interface (FHWA, 2004). While
the form GUI is the primary means of interacting with the software, all of the entered data are
stored in worksheet cells, as are all outputs (calculation results, analysis results, etc.).

B-2
Figure B-1. NPW distribution generation (Walls and Smith, 1998).
Figure B-2 shows the program layout (i.e., the main switchboard) for RealCost. The layout
shows the various function and inputs of the program and inputs required for analysis. Figures
B-3 through B-8 show various GUI screen shots associated with input information, such as
project details, LCCA analysis options, traffic, initial and subsequent rehabilitation costs and
service lives, and probabilistic simulation. Figures B-9 and B-10 illustrate some of the LCCA
outputs.
In addition to tabular and graphical outputs, RealCost supports deterministic sensitivity analyses
and probabilistic risk analyses (FHWA, 2004). Input files for each pavement alternative being
considered can be saved and brought in, as needed, for comparing any number of alternatives.

B-3
Figure B-2. Overall program layout for RealCost.
Figure B-3. Project details screen shot.
Sherlock Holmes

B-4
Figure B-4. Screen shot of analysis options for computing life cycle costs.
Figure B-5. Traffic data screen shot.
B-5
Figure B-6. Activity cost, service life, and activity work zone inputs associated with initial
construction for a particular pavement alternative.
Figure B-7. Activity cost, service life, and activity work zone inputs associated with second
rehabilitation for a particular pavement alternative.
B-6
Figure B-8. Input screen showing sampling scheme, number of iterations, and convergence
tolerance for LCCA.
Figure B-9. Output screen showing computed life cycle costs for a particular pavement
alternative, along with basic descriptive statistics.

B-7
Figure B-10. Histogram distribution of life cycle costs for two alternative designs using
probabilistic simulation.
Minimum system requirements for RealCost include Excel 2000 and Windows 98 operating
from a computer with a 350 MHz Pentium processor, 128 MB of RAM, and 100 MB of hard
drive space. Noted shortcomings of the program include the following (Lamptey et al., 2005):
The current version is not flexible to accommodate different overall analysis periods for
different alternatives.
Software can handle only two alternatives at a time.
Value of some inputs, such as travel time, are not updated automatically to future years
using appropriate consumer price index.
Trigger values (an alternative to “activity life”) are not considered for use as an
alternative treatment timing criteria in the formulation of M&R strategies.
User is not provided a default or modifiable set of pavement design alternatives that are
typical of a given agency’s practice.
User is not provided a set of pavement M&R strategies (over a life cycle) that are typical
of an agency’s practice.
0
20
40
60
80
100
120
140
300 350 400 450 500 550 600 650 700 750 800 850 900 950
Cost, $
Fre
quen
cy
5- to 7-ton construction standard 9- to 10-ton construction standard
Cost, $1000

B-8
User is not provided an automated method to compute agency costs on the basis of line
items and their unit rates based on reliable data of such contractual work activities
State DOT Adaptations of RealCost
Based on a recent survey by the South Carolina DOT (South Carolina DOT, 2005), eight SHAs
have adopted and/or customized the RealCost program for conducting LCCAs:
Caltrans—Chose RealCost as the official software for evaluating the cost-effectiveness of
alternative pavement designs for new roadways and for existing roadways requiring
capital preventive maintenance or rehabilitation/reconstruction (Caltrans, 2007). Because
probability distribution functions for individual LCCA input variables are still under
development, Caltrans only uses the deterministic approach at this time.
Colorado DOT—In 2004, formed a task force to investigate which probabilistic LCCA
software to use, and RealCost was selected unanimously (Demos, 2006).
Indiana DOT—Modified and enhanced RealCost software package to suit Indiana’s
pavement design and maintenance practices (Lamptey et al., 2003). The program, called
RealCost-IN, was written using Microsoft Visual Basic.NET and SQL. It is a PC-based
Windows program and can run in either the Windows 9X or XP environments.
Modifications and enhancements made to the existing RealCost program included:
Mechanism for estimating costs of construction and M&R activities based on pay
items and their unit costs.
Ability to simultaneously carry out analysis for more than two alternatives.
The form of menus of default M&R strategies, such that they are modifiable by the
user.
Improved GUI data input forms and output displays/reporting.
Ability of user to specify the percentage of user cost to be used in the analysis.

B-9
APA LCCA (version 3.1)
APA’s LCCA program is based on the procedures contained in the FHWA Interim Technical
Bulletin on LCCA. It has the ability to perform LCCA in either a probabilistic or deterministic
mode for up to four alternatives, with probabilistic variables consisting of discount rate, traffic
growth, and construction duration (Ozbay, 2003). It allows for the inclusion of user costs
resulting from delay time during work zones and generates the resulting detailed analysis
graphically and in Excel format. Figure B-11 shows the main screen for the program.
Figure B-11. Main screen of APA LCCA software program.
The APA program has been noted to be more user-friendly than other LCCA programs and has
an elaborate module for work zone user cost computation (one that optimizes work zone timing
to minimize user costs based on the hourly traffic distribution and the work-zone duration)

B-10
(Lamptey et al., 2005). Noted shortcomings include limited analysis capacity (only four
alternatives can be considered at once, not flexible to accommodate different analysis periods for
different alternatives) and inability to compute user costs during normal traffic operation
(Lamptey et al., 2005). Also, the program is handicapped by the large number of variables and
assumptions that have to be considered to run the analysis, thus making it almost impossible to
justify the results generated for each pavement type selection (Missouri DOT, 2004).
NLA Asphalt LCCA (version 1.3)
The NLA LCCA software package is a Windows-based application that was developed to
perform economic analyses of two asphalt pavement alternatives subject to future M&R
activities (Hicks and Scholz, 2003). The methodology is based on the approach developed by
the FHWA (Walls and Smith, 1998). The software allows analyses for both new construction
and rehabilitation projects and supports both deterministic and probabilistic analyses.
Figures B-12 through B-15 illustrate some of the primary input screens of the NLA LCCA
program. The program’s GUI interacts with a 32-bit Microsoft Access 97 database. All data
utilized by the LCCA software package are contained in the database. System operating
requirements include Windows 98, 200, or NT 4.0, Pentium central processing unit (CPU), 20
MB of hard disk space, and 16 MB RAM.

B-11
Figure B-12. NLA LCCA project information screen.
Figure B-13. NLA LCCA initial construction screen.

B-12
Figure B-14. NLA LCCA rehabilitation screen.
Figure B-15. NLA LCCA analysis screen.
Key assumptions and features of the program include equal VOCs and crash costs, lane rental
fees used as a surrogate for user delay costs, prorated life method used in computing salvage

B-13
value, and normal (Gaussian) distributions for the probabilistic variables (i.e., treatment lives,
treatment costs, and discount rate) (Hicks and Scholz, 2003). Noted limitations of the program
include the fact that 1) only one type of maintenance treatment can be applied to a pavement
alternative, and future costs are in real (constant) dollars and the discount rate is a real discount
rate (one that does not reflect an inflation premium).

C-1
APPENDIX C. AIRCOST USER MANUAL
Introduction
AirCost® is a life cycle analysis tool for airport pavement maintenance. AirCost allows users to
analyze and document airport pavement cost activities as well as perform scenario analysis for
future needs and cost requirements. AirCost is built as an application with Microsoft Excel.
This provides an easy-to-use tool with the benefits of the standard Excel features, functionality,
and familiarity.
AirCost Application Interface
Below is an example of the main AirCost interface, showing the component modules of the
application.

C-2
LCCA Parameters
The LCCA Parameters module allows the user to input information into the system for
subsequent analysis. As shown in the screen above, this module includes five elements:
General Airport/Project Information.
Project Details.
Edit LCCA Parameters.
Add Spec/Pay Items & Unit Costs.
View Spec/Pay Items & Unit Costs Library.

C-3
General Airport/Project Information
Click on General Airport/Project Information to input details for the airport project.
1. Click the Clear Form button to clear the current data from the form.
2. Enter the correct data in the corresponding fields:
i. Airport Name – Specify the name of the airport where work is performed.
ii. Location (City, state) – Specify the city and the state for the airport.

C-4
iii. Airport Owner/Authority – Specify the owner/authority for the airport.
iv. Airport Design Consultant Name – Specify the organization that is performing the
work at the airport.
v. Project AIP Number - Specify the Airport Improvement Program (AIP) project
number.
vi. Project Overview Description – Provide a brief description of the project and the
work to be performed.
vii. Date of LCCA – Specify the date when the LCCA assessment was performed.
3. Click OK to save the data and return to the main screen.
Project Details
The Project Details screen allows the user to input specific details regarding the category of work
to be performed at the airport.
1. Click the Clear Form button to clear the current data from the form.
2. Enter the correct data in the corresponding fields:
i. Feature/Facility Type – Specify the airport feature (e.g, runway, taxiway, ramp,

C-5
apron).
ii. Feature/Facility ID – Specify the feature/facility identification value.
iii. Initial Event Type – Specify the type of task event (e.g., rehabilitation, new
construction).
iv. Project Description – Specify a brief description of the project (i.e, the event and
activity).
v. From STA – Enter beginning station.
vi. To STA – Enter ending station.
vii. Pavement Area – Specify the area of pavement.
viii. Shoulder Area – Specify the area of the shoulder.
ix. Lighting.
x. Striping.
xi. Grooved Pavement Area – Specify the area of the grooved pavement.
xii. Comments – Specify any desired comments about the projects and/or tasks.
3. Click OK to submit the data.
Edit LCCA Parameters
The Edit LCCA Parameters screen allows the user to modify the LCCA input parameters that
will be used during the simulation.

C-6
1. Click the Clear Form button to clear the current data from the form.
2. Enter the correct data in the corresponding fields:
i. Analysis Base Year – Specify the base year for which all the NPV values are
calculated (typically, the year in which the analysis is performed).
ii. Initial Construction Year – Specify the year when initial construction begins.
This value should not be confused with the analysis base year. The year of initial
construction typically is later than the analysis base year by a couple years.

C-7
iii. Analysis Period – Specify the number of years to include in the simulation. The
analysis period should be sufficiently long that each alternative includes at least
one rehabilitation event. For new construction or reconstruction projects, analysis
periods of 35 to 50 years are typical. For rehabilitation project, analysis periods
of 25 to 30 years are appropriate.
iv. Salvage Value – Specify a method of calculation for the salvage value for the
asset:
a. None – The analysis assumes that there is no value of the existing pavement
or final rehabilitation event at the end of the analysis period.
b. Prorated – The prorated salvage value linearly depreciates the final
rehabilitation event until the end of the analysis period. Note that only those
line items that are specified to be included in the salvage value will be
included in the calculation.
v. Analysis Variables – Specify the desired parameters for discount rate, service life,
and pay item unit costs (see the following figure). Each analysis variable can be
modeled as either deterministic or probabilistic. If any variable is specified as
probabilistic, the simulation will update that parameter in a probabilistic manner
during the simulation. The application will proceed through the iteration for that
variable if or until convergence is realized.

C-8
a. Discount Rate – The annually updated 30-year discount rate can be found in
OMB Circular A-95A. This value typically is around 3 percent. If the user
wishes to use a probabilistic discount rate, professional judgment should be used
to determine an appropriate standard deviation. A standard deviation of 0.25
percent would be a good starting point.
b. Service Life – Service lives for each rehabilitation should be based on experience
and knowledge of similar rehabilitations, preferably on pavements that are subject
to similar loading and environmental conditions.
c. Pay Item Unit Costs – Unit costs should be representative of products purchased

C-9
and used in the same geographic region, as the costs of materials can vary
significantly throughout different geographic regions.
vi. Supplemental Costs – Specify additional percentage cost to the project for
administration, engineering, and maintenance of traffic. These cost factors cover
other costs associated with the construction activities. Line items such as quality
testing, construction supervision, traffic control, and preliminary engineering often
are not included in the cost of purchasing and placing materials. If these values are
not appreciably different between competing alternatives, the user may omit these
supplement costs from the analysis.
vii. Indirect/User Costs – The user can decide whether to include the cost that considers
the airport daily revenue. This computation considers the:
a. Daily airport revenue ($).
b. Revenue growth rate:
Compound – Long range revenue projection. Apply the growth rate based on
the previous year’s revenue. This represents exponential growth.
Simple – Short period revenue projection. Apply the growth rate at a uniform
value over the years. This represents linear growth.
3. Click OK to submit the data.

C-10
Add Spec/Pay Items & Unit Costs
The Add Spec/Pay Items & Unit Costs screen allows users to add line items to the material
library for inclusion in events and alternatives. Each pay item must be input into the material
library before it can be added to an event.

C-11
1. Click the Clear Form button to clear the current data from the form.
2. Enter the correct data in the corresponding fields:
i. Spec/Pay Item Name – Specify the desired pay item name.
ii. Spec/Pay Item No. – Specify the number for the given pay item.
iii. Classification – Specific the details for the pay item.
a. Soil/Subgrade.
b. Base/Subbase.
c. Intermediate/Surface.
d. Other Pavement.
e. Maintenance & Rehab.
f. Non-Pavement.
iv. Unit – Specify the measurement units.
v. Mean Unit Cost – Specify mean cost for a pay item unit.
vi. Standard Deviation Unit Costs – Specify the standard deviation of the pay items unit
cost.
vii. View Spec/Pay Items & Unit Cost Library – When you select this option, it opens a
standard Excel Spreadsheet populated with the pay item details:
a. Classification.
b. Number.
c. Unit of Measurement.
d. Mean Unit Cost.
e. Std. Deviation of Unit Cost.
3. Click OK to submit the data.
View Spec/Pay Items & Unit Costs Library
The View Spec/Pay Items & Unit Cost Library allows the user to view current pay items and
their details. The values shown in the default Pay Items and Costs Library are not representative
of a particular geographical region and should not be assumed to be accurate for any particular
project. The user should ensure that values in the library accurately reflect the costs of pay items
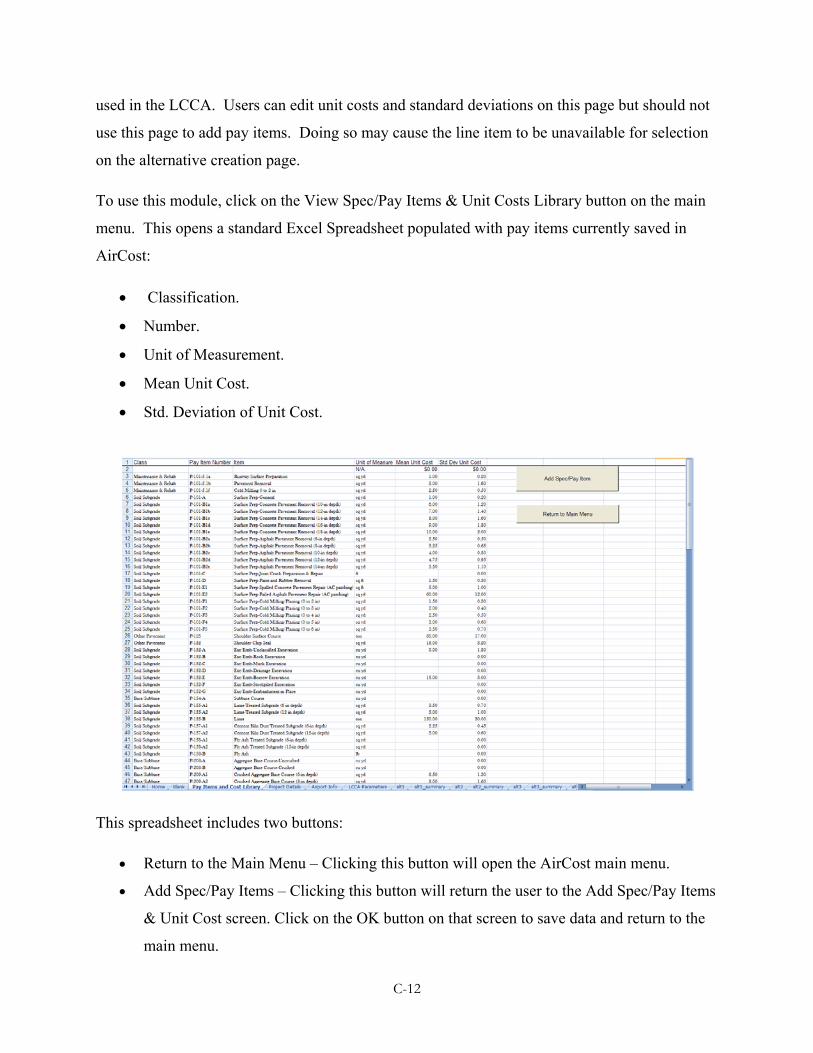
C-12
used in the LCCA. Users can edit unit costs and standard deviations on this page but should not
use this page to add pay items. Doing so may cause the line item to be unavailable for selection
on the alternative creation page.
To use this module, click on the View Spec/Pay Items & Unit Costs Library button on the main
menu. This opens a standard Excel Spreadsheet populated with pay items currently saved in
AirCost:
Classification.
Number.
Unit of Measurement.
Mean Unit Cost.
Std. Deviation of Unit Cost.
This spreadsheet includes two buttons:
Return to the Main Menu – Clicking this button will open the AirCost main menu.
Add Spec/Pay Items – Clicking this button will return the user to the Add Spec/Pay Items
& Unit Cost screen. Click on the OK button on that screen to save data and return to the
main menu.

C-13
Create/Modify Alternatives
The Create/Modify Alternatives module allows the user to add up to four different scenarios for
analysis, providing the opportunity to perform and compare analysis of alternative decisions.
On the main menu screen, the Create/Modify Alternatives options are displayed as shown below.
The same procedure is used for creating/modifying each of the four alternatives. Click on the
Alternative 1 button to begin.

C-14
On this screen, enter the following information:
1. Select Pavement Life-Cycle Event – Specify a life cycle event (e.g., initial construction,
rehabilitation).
2. Alternative Description – Assign a description to the alternative, ideally self-explanatory.

C-15
3. Exclude from analysis – Check the box to exclude an alternative from the analysis, if
desired. Note that it is necessary to toggle on alternatives in sequence. In other words, if
you would like to run Alternative 1 and Alternative 3, you must include Alternative 2 as
well.
The Copy the Alternatives and/or Event feature is available if the user is running Excel 2007 or
later. This allows the user to copy events from one alternative to another using the following
steps:.
1. Select the desired alternatives (Source Data). The event box will be populated with the
events associated with the alternative.
2. Click on the event in the Select Event to Copy box.
3. Select the alternative to which you would like to copy the events (Copy Data To...).
4. Click on the recipient location in the Select Recipient Location box.
5. Click Execute (or click Cancel to return to the previous screen without copying data).

C-16
Mainline Construction
Enter mainline construction data on this tab
1. Select a pavement life cycle event to activate the mainline construction data entry form.
2. Enter the correct data in the corresponding fields:
i. Event Description – Specify a self-explanatory description.
ii. Service Life – Specify the mean service life of the event (and standard deviation if
using probabilistic analysis). Ideally, the service is based on projects of similar
scope at locations with similar traffic and environmental considerations.
iii. Description – Specify a task description.
iv. Spec/Pay Item – Select the spec/pay item from the drop-down options.
v. Quantity – Specify the quantity of the spec/pay item needed for the task.
vi. Units – Automatically populated with pay item data from the pay item library.
vii. Unit Cost – Automatically populated with pay item data from the pay item library.
viii. Click the Salvage checkbox to include salvage value analysis for this project.
3. Click OK to submit the data.

C-17
Shoulder Construction
Click the Shoulder Construction tab to input analysis data for shoulder construction projects.
The data entry screen appears identical to the Mainline Construction screen, as shown in the
following figure. Enter data as described under Mainline Construction. However, note that
Service Life is not applicable on the Shoulder Construction tab. The service life entered for
mainline construction applies to all aspects of the event.
After entering the data on this tab, click the OK button.

C-18
Scheduled Maintenance #1
Click the Schedule Maintenance #1 tab to specify analysis data for both mainline and shoulder
maintenance. The data entry screen is shown below.

C-19
Enter the following data:
1. Maintenance Description – Specify a self-explanatory description of the maintenance
project.
2. Application Frequency. – Maintenance applications are always deterministic and applied
at specified intervals.
a. Max No. Applications – Enter the maximum number of times a maintenance
activity can be repeated for the given rehabilitation.
b. Repeated Every … Years – Enter the frequency of maintenance applications. The
maintenance activity will be repeated every “X” years until the end of the service
life is reached or the maximum number of applications is attained
For mainline maintenance and shoulder maintenance, enter the following:
1. Description – Specify a task description.
2. Spec/Pay Item – Select the spec/pay item from the drop down options.
3. Quantity – Specify the quantity of the spec/pay item need for the task.
4. Units – Automatically populated with pay item data from the pay item library.
5. Unit Cost – Automatically populated with pay item data from the pay item library.
Note that the checkbox for including or excluding a line item in the salvage value is deactivated
on the maintenance activity page. All maintenance activities are excluded from salvage value
and given no credit at the end of the analysis period.
After entering the desired data, click OK to submit data.
Scheduled Maintenance #2
Follow the same procedure as for scheduled maintenance #1.

C-20
Run LCCA Simulation
The Run LCCA Simulation module allows the user to run a simulation based on the alternatives
specified in the Create/Modify Alternatives module.
Access the Run Simulation module by clicking on the Execute Simulation button on the main
menu screen.
This will open the following data entry screen.
1. Included Alternatives – Specify which alternatives to use in the simulation (you can

C-21
chose multiple alternatives). At least one alternative must be selected to activate the
Execute LCCA button.
2. Probabilistic Simulation (only active if running in probabilistic mode):
i. Number of Iterations – The number of iterations to perform during the simulation.
A minimum of 1,000 iterations should be run if convergence is not desired.
ii. Monitor Convergence – Check this box to terminate the simulation upon
convergence. If convergence is reached, the software has determined that no
further iterations are necessary, as the result from more iterations will be
statistically insignificant. Convergence is based on changes in average NPW, as
well as the 5th, 10th, 25th, 50th, 75th, 90th, and 95th percentiles and the standard
deviation.
iii. Monitor Frequency (Number of Iterations) – Specify the frequency of checking
convergence. Larger intervals generally will take longer to converge. A
monitoring frequency of 100 iterations is typical.
iv. Convergence Tolerance – Specify the acceptable level of tolerance for the
convergence of the simulation. The tolerance is the criterion which all factors
listed above must meet to ensure that convergence has been attained. A tolerance
of 2.5 percent is typical and ensures that a representative probabilistic solution has
been found.
3. Probabilistic Reporting Levels (only active if running in probabilistic mode) – Specify
the distribution of values in the report by percentile. These four fields can be used to
evaluate the statistical distribution of the iterative results.
After entering data, click the Execute LCCA button to start the simulation. After the simulation
is completed, AirCost will display the following message:

C-22
Click OK to view the simulation results in an Excel spreadsheet.
In addition to these tabular NPW results, the user can view EUAC results by clicking the
appropriate button at the bottom of the spreadsheet. There also is a button to print the analysis
results.
When you have finished reviewing the simulation results, click the Done button to return to the
main menu screen.

C-23
View Simulation Results
The View Simulation Results module allows the user to view the results after executing the
simulation. These results include both probabilistic and deterministic values for NPV and
EUAC.
View Deterministic NPV Table
Clicking this button opens a spreadsheet similar to the one shown below.

C-24
:
The selected analysis base year, analysis period, and discount rate are shown at the top. Then,
for each alternative selected for the analysis, the following are displayed:
Agency Costs NPV – The agency costs consider only the cost of construction and
maintenance activities during the analysis period. The salvage costs and user costs are
considered separately. The NPV of the alternative assumes that costs are constant
(relative to inflation) over the duration of the analysis and uses the discount rate to
determine the investment required during the base year to cover the cost of the entire
alternative. In essence, the NPV represents the current, up-front costs that must be
invested in the base year and that are assumed to grow at a rate equal to the discount rate,
to cover the entire cost of the alternative.
Salvage Costs NPV – The salvage value is the value of the pavement assumed to exist at
the end of the analysis period. If the salvage value is included in the analysis, the value
will represent a linear depreciation of the final rehabilitation event from the beginning to
the end of the analysis period. For example, if a $5 million overlay with an expected

C-25
service life of 10 years was placed in year 36 of a 40-year analysis, the salvage value
would be roughly equal to 60 percent of the $5 million rehabilitation cost, or $3 million,
as only 40 percent of the anticipated service life was used. This value will be decreased
substantially as a result of the discount rate and backcasting the value in year 40 to the
base year of the analysis. As a result, that same $3 million salvage value in year 40
would have a NPV of only $129,800, assuming a discount rate of 3 percent.
User Costs – The user costs are those costs incurred as a result of the disruption to full
pavement access. In the AirCost analysis, this cost represents lost daily airport revenue.
To determine the user cost, the daily revenue is projected based on the initial daily
revenue, the annual revenue growth factor (either compound or simple growth), the
percentage reduction in daily revenue, and the assumed duration of the rehabilitation
event. For each event, the disruption to revenue is determined and backcasted to the base
year. These values are then totaled for a total user cost.
Total Cost – The total cost of an alternative is the summation of the agency costs and the
user cost, with the salvage costs applied as a credit. In a deterministic model, the
alternative with the lower NPV is considered to be the best alternative, all other factors
being equal. In a probabilistic model, the mean NPV is a factor in choosing the best
alternative, but the standard deviation also must be considered to assess the amount of
risk inherent in a given alternative. An alternative with a higher standard deviation
indicates that cost estimates are more variable and, therefore, more risky.
Click the Done button to return to the main menu screen.

C-26
View Probabilistic NPV Table
A sample probabilistic NPV table is shown in the figure below. Most of the data elements and
navigation buttons are similar to those described previously. However, this table also displays
the percentile analysis results based on the simulation iterations.

C-27
View Deterministic EUAC Table
A sample deterministic EUAC table is shown in the figure below. The data elements and
navigation buttons are similar to those described previously.
i.

C-28
View Probabilistic EUAC Table
A sample probabilistic EUAC table is shown in the figure below.
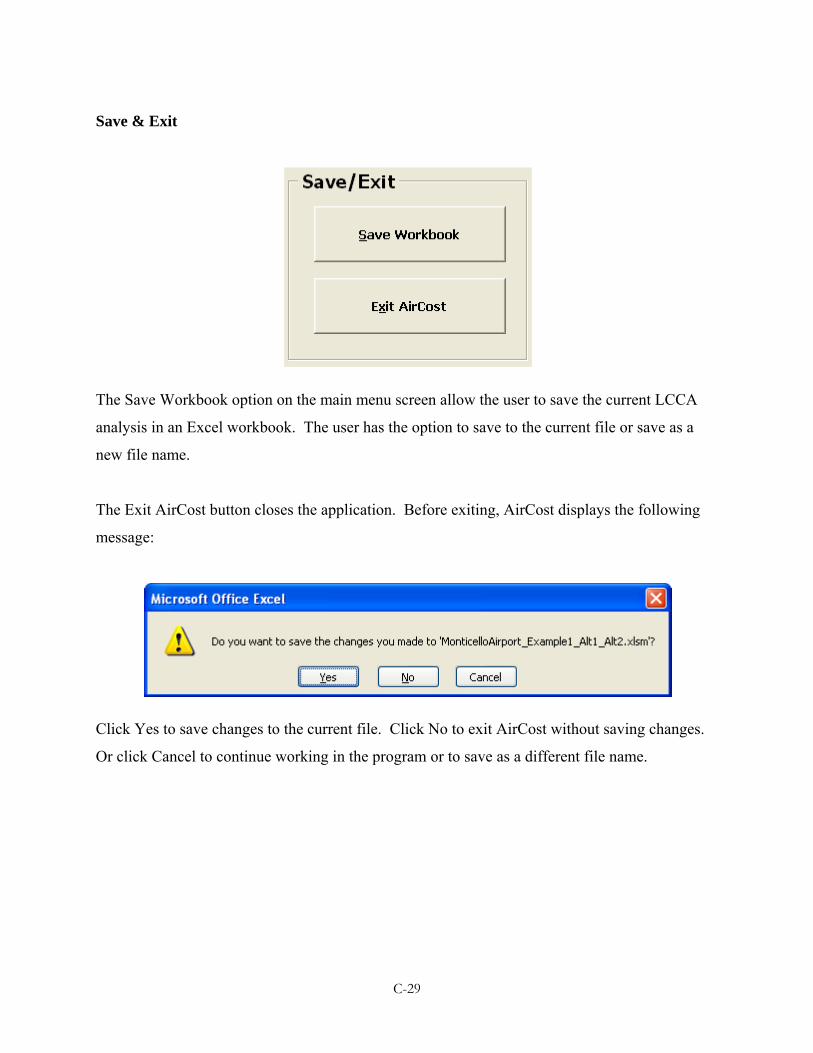
C-29
Save & Exit
The Save Workbook option on the main menu screen allow the user to save the current LCCA
analysis in an Excel workbook. The user has the option to save to the current file or save as a
new file name.
The Exit AirCost button closes the application. Before exiting, AirCost displays the following
message:
Click Yes to save changes to the current file. Click No to exit AirCost without saving changes.
Or click Cancel to continue working in the program or to save as a different file name.