ab initio calculations p.a. marrone 1, * 1department … · a promising area is the coupling...
TRANSCRIPT

SOLVATION EFFECTS ON KINETICS OF METHYLENE CHLORIDE
REACTIONS IN SUB- AND SUPERCRITICAL WATER: THEORY,
EXPERIMENT, AND AB INITIO CALCULATIONS
P.A. Marrone1, T.A. Arias2, W.A. Peters1, and J.W. Tester1, *
1Department of Chemical Engineering and Energy Laboratory2Department of Physics
Massachusetts Institute of Technology77 Massachusetts Ave.Cambridge, MA 02139
617-253-3401 (tel.)617-253-8013 (fax)
[email protected] (e-mail)
Revised and Submitted for Publication as a RegularResearch Paper to the Journal of Physical Chemistry A
5/7/98
* To whom correspondence should be sent
1
Abstract
The nature of the CH2Cl2 neutral/acidic hydrolysis reaction from ambient to supercritical
conditions (25 to 600°C at 246 bar) is explored. Of primary interest is the effect of the changing
dielectric behavior of the water solvent over this temperature range on this reaction. Experiments
reveal that significant CH2Cl2 hydrolysis occurs under subcritical temperatures, while relatively
little hydrolysis occurs under supercritical conditions. These trends cannot be explained by simple
Arrhenius behavior. A combination of Kirkwood theory and ab initio modeling provides a means
of successfully accounting for this behavior both qualitatively and quantitatively. The results show
that increases in the activation energy and a changing reaction profile with a decreasing dielectric
constant provide a mechanism for a slowing of the reaction at higher temperatures by as much as
three orders of magnitude. These solvent effects are captured quantitatively in a correction factor to
the Arrhenius form of the rate constant, which is incorporated into a global rate expression
proposed for CH2Cl2 hydrolysis that provides good predictions of the experimental data.

2
I. INTRODUCTION
In recent years, there has been much interest in the use, disposal, and environmental fate of
chlorinated organic compounds. The past popularity of many of these halocarbons can be traced to
their extensive use in industrial processes, most notably as solvents, extractants, cleaning agents,
pesticides, and chemical intermediates. In the last decade, public concern has grown over their
increasing presence and persistence in the environment, and their potential toxicity. For example,
polychlorinated alkanes now account for a significant fraction of organic chemicals on the US EPA
designated priority pollutant list.1 Supercritical water oxidation (SCWO) is one innovative
technology that has been shown to effectively destroy many types of organic compounds including
these more refractory halocarbons.2 At conditions above its critical point (374°C, 221 bar), water
is relatively nonpolar due to diminished hydrogen bonding. Consequently, most nonpolar organic
compounds and gases such as oxygen are completely miscible in supercritical water and rapidly
react to form CO2 and H2O. Typically, greater than 99.99% destruction of organic species can be
attained under conditions of 550-650°C, 250 bar, and residence times of 1 minute or less without
formation of toxic by-products. In the oxidation of chlorinated compounds, Cl heteroatoms are
ultimately converted to HCl. In the case of higher molecular weight and/or labile organic
compounds, appreciable destruction can even be achieved under subcritical temperatures (wet
oxidation) and without oxygen present (hydrolysis or pyrolysis conditions).
Over the last decade, ab initio calculations have been very successful in describing
microscopic phenomena involving the rearrangements of chemical bonds such as when reactions
occur in vacuum. Recently, it has been recognized that it is possible to couple such calculations
with more coarse-grained macroscopic theories in unified multiscale approaches in order to study
vastly more complex systems. Yet, exactly how this is to be done for different reactions remains
an open question. A promising area is the coupling between a reacting molecular complex and a
dielectric solvent.
3
Methylene chloride (CH2Cl2) in aqueous solution is a useful model system for this study
because it has been a widely used solvent in industry and is a common environmental
contaminant.3 On the molecular level, its dipole moment also has the potential to couple strongly
with the dielectric water solvent. Methylene chloride thus poses an interesting scenario for linking
ab initio calculations to a macroscopic system. Furthermore, study of CH2Cl2 also allows the
details of C-Cl chemistry in sub- and supercritical water to be investigated using a comparatively
simple substrate. In an earlier paper,4 data on CH2Cl2 conversion and the product spectrum and
distribution were presented, along with a preliminary proposed reaction network. There we noted
a somewhat counterintuitive result: significant destruction of CH2Cl2 under subcritical temperatures
(i.e., in a section of the feed preheater with T < 374°C) and little additional reaction under generally
more highly reactive supercritical conditions. Our overall goal here is to explain this behavior.
Toward this end, the objectives of this paper are four-fold. The first is to review the
experimental data and trends observed, and to demonstrate that a simple Arrhenius form for the rate
constant does not alone capture these trends. The second is to establish that it is the influence of
the changing dielectric properties of the solvent which dramatically slows the reaction at higher
temperatures. We will find that because of the rapidly changing dielectric constant, the transition
state itself is highly sensitive to the solvent environment in this case. The third objective is to
develop a quantitative theory of the kinetics of such a reaction. This will be accomplished by the
use of a unique combination of Kirkwood theory, transition state theory, and ab initio quantum
mechanical calculations. Our final objective is to then use these results, along with experimental
temperature profiles, to generate engineering-oriented global kinetic rate expressions for the
hydrolysis reaction of CH2Cl2. A more complete reaction network has also been developed for
CH2Cl2 hydrolysis and its products based on our experimental data and studies in the literature and
is presented by Marrone et al.5
4
Although there have been several studies of subcritical liquid and vapor hydrolysis of
various chlorinated hydrocarbons,6, 7 only a few have been carried out at supercritical conditions.
Recent studies in supercritical water include that of Foy et al.8 on hydrolysis and oxidation of
trichloroacetic acid, trichloroethylene, and 1,1,1-trichloroethane; and of Houser and Liu 9 on
hydrolysis of 1-chloro-3-phenylpropane, 2-chlorotoluene, and 4-chlorophenol in metal and glass
ampoule batch reactors to explore catalytic effects. Some recent and relevant (although not
supercritical) studies focusing specifically on reactions of CH2Cl2 include oxidative pyrolysis,10
and several involving heterogeneous reactions such as catalytic hydrolysis,11 catalytic oxidation in
both dry and humid air,12 and surface reduction with iron in the presence of water.13
II. SUMMARY OF EXPERIMENTAL DATA AND OBSERVATIONS
The heated portion of the experimental system (see Figure 1 and Marrone et al.4 for more
details) consisted of two separate preheater coils and a main tubular reactor heated in a fluidized
sandbath. One preheater coil contained a pressurized aqueous feed solution of CH2Cl2 and another
contained a pressurized O2/water solution (for oxidation runs) or just pressurized pure deionized
water (for hydrolysis runs). Each preheater coil was approximately 3 m in length, with only the
lower 2.75 m heated (i.e., submerged in the fluidized sand). The preheater tubing had an I.D. of
0.108 cm and a wall thickness of 0.025 cm, and was constructed of Hastelloy C-276. Both feeds
entered their respective preheaters at ambient temperature and were heated to a specified operating
temperature before reaching a mixing tee and the main reactor. Between 70 - 80% of the residence
time in the preheater tubing was spent at subcritical temperatures. Measured mixing tee
temperatures were usually within about 5°C of the sandbath temperature. Hydrolysis conditions
always existed in the CH2Cl2 feed preheater coil in all experiments. For oxidation runs, oxidizing
conditions existed only in the main reactor, after the point at which the aqueous O2 and CH2Cl2
feed solutions were mixed.

5
The main reactor tube was 4.71 m in length, had a 0.171 cm I.D. and 0.232 cm wall
thickness, and was constructed of Inconel 625. The main reactor was always kept at turbulent
(and nearly plug) flow and isothermal conditions at a supercritical temperature between 450 and
600°C. The fluid temperature was measured just before exiting the main reactor at the top of the
sandbath. The effluent fluid was then immediately quenched down to ambient temperature rapidly
(i.e., in < 1 s) in a shell and tube heat exchanger, followed by reduction of pressure to
atmospheric.
Sandbath temperature, residence times, and feed concentrations were varied considerably
over all of the experiments performed. Table 1 contains the complete range of experimental
operating conditions for the preheater tubing and the main reactor. All experiments were isobaric at
approximately 246 bar. Feed concentrations at the beginning of the preheater are values at ambient
temperature, while at the entrance to the isothermal main reactor they correspond to the reactor
operating temperature after adjusting for dilution due to the mixing of the two feed solutions. In all
calculations, the concentrations of the CH2Cl2 and O2 feed solutions were considered sufficiently
dilute to permit the use of density values for pure water at the given temperature and pressure. The
values for the initial CH2Cl2 feed concentrations and [O2]o/[CH2Cl2]o feed ratios in the main reactor
differ from those cited in our earlier paper4 because these current values now account for the
considerable CH2Cl2 hydrolysis that occurred in the preheater tubing, as will be discussed shortly.
Preheater tubing residence times, calculated from temperature profile models described below, and
main reactor residence times are also provided in Table 1.
The major results and trends regarding CH2Cl2 reaction are summarized as follows:
• CH2Cl2 conversions ranged from 26±9% to 91±1% for pure hydrolysis experiments and
30±9% to 99.9±0.1% for oxidation experiments.
• CH2Cl2 conversions from hydrolysis runs were significant, and similar to those observed from
oxidation runs under the same conditions at sandbath temperatures ≤ 525°C (see Figure 2).

6
• O2 had a detectable effect on CH2Cl2 conversion only at sandbath temperatures > 525°C. At a
constant sandbath temperature, varying the O2 concentration over the range cited in Table 1 had
little effect on CH2Cl2 conversion.
• Corrosion was observed in four separate CH2Cl2 feed preheater coils in a region up to at least
40 cm downstream of the point at which the tubing entered the sandbath. The most severe
corrosion resulted in through-wall failure of each tube in a region between 7 and 29 cm. Tube
life before failure ranged from 45 to 104 hrs of use at operating temperatures (see Mitton et
al.14, 15 for details). Because the only source of Cl- (one of the most aggressive agents of
corrosion) was CH2Cl2, HCl must have formed from CH2Cl2 breakdown sufficiently early in
the preheater tubing to cause the corrosion to occur where it was observed near the beginning
of the heated section. This evidence implies that reaction definitely occurred in this region of
the preheater tube. This evidence alone, however, indicates nothing about the reaction rate
further down the tube.
• Of the 23 hydrolysis experiments, two were performed at sandbath temperatures of 450°C and
575°C with the main reactor removed and replaced by a short 40 cm stainless steel tube which
connected the mixing tee to the heat exchanger. Similar CH2Cl2 conversions were observed
with and without the supercritical main reactor present (Table 2), even at comparable residence
times. This evidence indicates that in fact only a very limited amount of further hydrolysis
conversion occurred under supercritical conditions in the main reactor, and that the reaction rate
was actually slower on average in the reactor than in the preheater tubing
The products that were detected and identified from both hydrolysis and oxidation reactions
of CH2Cl2 included formaldehyde, hydrochloric acid, carbon monoxide, carbon dioxide, hydrogen
gas, methanol, and trace amounts of methane, chloromethane, chloroform, trichloroethylene, and
isomers of dichloroethylene.4 The mean carbon mass balance over all runs was 99.9%, with a
standard deviation of 6.6%. The mean chlorine mass balance over all runs was 100.0%, with a
standard deviation of 5.7%. Despite the variety of products observed over the different
7
experimental operating conditions explored, only CO2 and HCl were found under oxidizing
conditions at a sandbath temperature of 600°C and a total residence time of 23 s (6 s in the presence
of O2). The prominent role of O2 was in affecting the product spectrum and distribution, rather
than the extent of CH2Cl2 conversion itself. For a further discussion of product-associated trends
as they relate to the complete reaction network, see Marrone et al.5
III. GENERAL NATURE OF THE CH2Cl2 HYDROLYSIS REACTION
The results summarized above indicate that substantial hydrolysis of CH2Cl2 occurred
under subcritical, non-oxidative conditions in the preheater tubing. The appreciable and closely
similar conversions between hydrolysis and oxidation experiments (Figure 2), the early corrosive
failures of the CH2Cl2 feed preheater tubing, and the similarity in conversions observed with and
without the supercritical main reactor in place (Table 2) all together suggest that for this apparatus
most of the conversion of the initial CH2Cl2 feed occurred via hydrolysis in the subcritical zone of
the preheater tubing. These data imply a rapid subcritical hydrolysis reaction that decreases in rate
significantly as temperature increases into the supercritical regime. In order to explain this
behavior, one must first consider the nature of the subcritical hydrolysis reaction.
In an earlier investigation, Fells and Moelwyn-Hughes16 studied the hydrolysis kinetics of
CH2Cl2 in liquid water from 80 to 150°C in a series of batch experiments conducted in Pyrex
ampoules, under both neutral and basic conditions. Despite the lower temperatures and different
experimental system, their kinetics results support the proposition that much of the CH2Cl2
breakdown observed in our apparatus occurred at subcritical temperatures.
The hydrolysis of CH2Cl2 can generally be classified as a nucleophilic substitution reaction.
As is usually the case with methyl and methylene halides, the reaction mechanism is most likely of
the single-step, bimolecular type (SN2) rather than the two-step, unimolecular type (SN1).17, 18 The
8
products observed and intermediates postulated by Fells and Moelwyn-Hughes are consistent with
this type of reaction. Under neutral conditions, water adds an OH group to the central carbon
replacing one Cl, which combines with the extra H+ to form HCl:
CH Cl H O CH ClOH HCl2 2 2 2+ → +
The resulting unstable species CH2ClOH then undergoes a much faster internal rearrangement,
expelling another H+ and Cl- to form HCHO:
CH ClOH HCHO HCl2 → +
The overall rate of reaction is dictated by the slower first substitution step.16 Nucleophilic
substitution reactions usually involve one or more charged or polar species (reactants or
intermediates) and proceed via a polar mechanism. This probably accounts, in part, for why
hydrolysis of CH2Cl2 occurred readily under subcritical temperatures, since the polar water solvent
under these conditions could clearly support this type of reaction.
Although H2O and OH- are both possible nucleophiles for a hydrolysis reaction, H2O was
more important under our operating conditions. While the OH- ion is a stronger nucleophile than
H2O by about four orders of magnitude,19 the concentration of OH- (formed only from dissociation
of water in our experiments) was much less than that of the solvent water. At the most favorable
conditions for [OH-], we have estimated the rate of neutral hydrolysis to still be greater than that of
basic hydrolysis by at least a factor of 103 (typically much higher) under the full range of
experimental conditions employed. The presence of H2O as the dominant nucleophile is further
supported by Schwarzenbach et al.,20 who state that reactions of aliphatic halides in aqueous
solution with OH- are unimportant at pH values less than about 10, which was well above the
acidic pH of the present experiments.
9
IV. FAILURE OF ARRHENIUS-FORM RATE EXPRESSION FOR HIGH
TEMPERATURE CH2Cl2 HYDROLYSIS
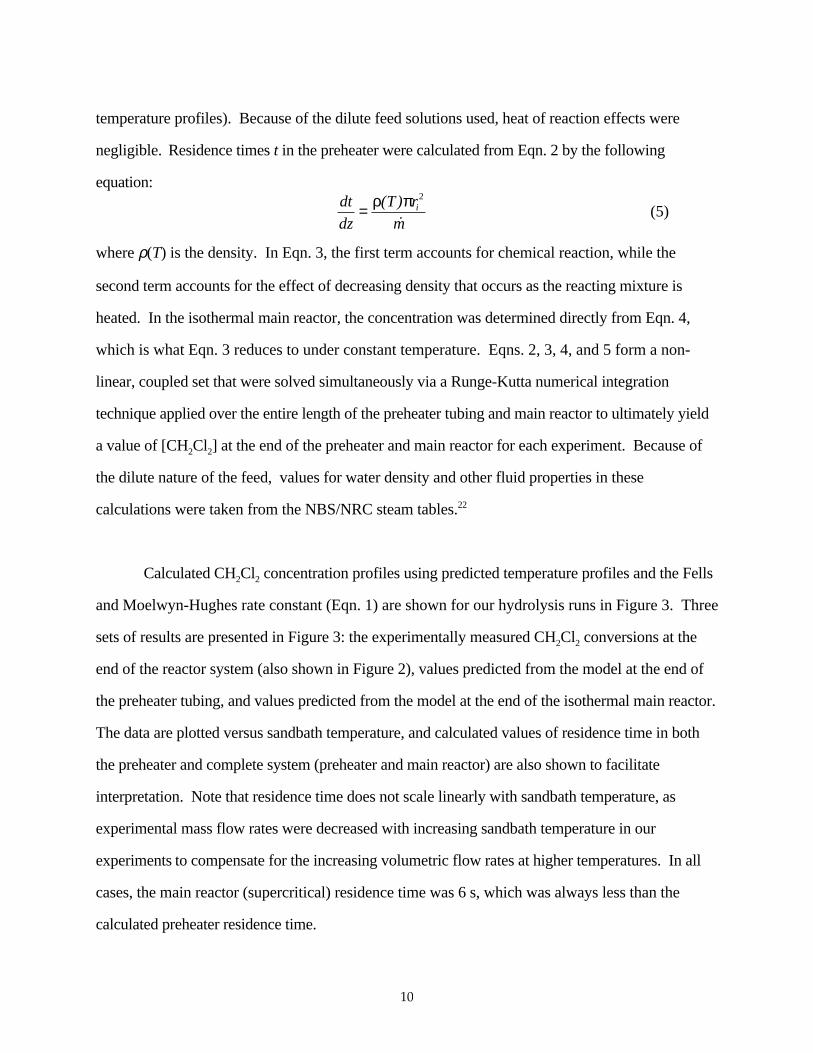
Fells and Moelwyn-Hughes16 proposed the following empirical, Arrhenius type correlation
for the first order rate constant for neutral/acidic hydrolysis of CH2Cl2:
log . . log . /k T TFMH = − −98 4408 29 66 10597 3 (1)
where T is in Kelvins and kFMH in s-1. Note that kFMH is almost of simple Arrhenius form, but
includes an explicit temperature dependence in the pre-exponential factor via the log T term. We
explored the suitability of Eqn. 1 to predict the CH2Cl2 hydrolysis conversion in our experimental
system. Note that this required extrapolation far outside the 80 to 150°C range for which the
correlation was developed.
Following the approach of Holgate et al.,21 a differential transient analysis of coupled heat
transfer and kinetics was used to estimate the temperature and CH2Cl2 concentration variations in
our experimental system. In the preheater tubing, the set of relevant differential equations is:
dT
dz
r U T T
mC Ti i fsb
p=
−2π ( )
˙ ( ) (2)
d R r T
m T
d T
dT
dT
dzhyd iCH Cl
dz
CH Cl2 22
2 2[ ] = −( )
+ [ ]( )
( )π ρρ
ρ˙
(3)
where the hydrolysis reaction rate Rhyd (using Eqn. 1 for kFMH) is given as:
Rd
dtk Thyd FMH= [ ] = − [ ]CH Cl
CH Cl2 22 2( ) (4)
Eqn. 2 is a differential heat balance where z is the axial position in the tube, r i is the internal radius
of the tube, Tfsb is the sandbath temperature, m is the mass flow rate of the feed solution, Cp is the
heat capacity of the feed solution, and Ui is the overall heat transfer coefficient based on inner
surface area of the tube (see Appendix for details on the calculation of Ui and experimental
10
temperature profiles). Because of the dilute feed solutions used, heat of reaction effects were
negligible. Residence times t in the preheater were calculated from Eqn. 2 by the following
equation:dt
dz
T r
mi= ρ π( )
˙
2
(5)
where ρ(T) is the density. In Eqn. 3, the first term accounts for chemical reaction, while the
second term accounts for the effect of decreasing density that occurs as the reacting mixture is
heated. In the isothermal main reactor, the concentration was determined directly from Eqn. 4,
which is what Eqn. 3 reduces to under constant temperature. Eqns. 2, 3, 4, and 5 form a non-
linear, coupled set that were solved simultaneously via a Runge-Kutta numerical integration
technique applied over the entire length of the preheater tubing and main reactor to ultimately yield
a value of [CH2Cl2] at the end of the preheater and main reactor for each experiment. Because of
the dilute nature of the feed, values for water density and other fluid properties in these
calculations were taken from the NBS/NRC steam tables.22
Calculated CH2Cl2 concentration profiles using predicted temperature profiles and the Fells
and Moelwyn-Hughes rate constant (Eqn. 1) are shown for our hydrolysis runs in Figure 3. Three
sets of results are presented in Figure 3: the experimentally measured CH2Cl2 conversions at the
end of the reactor system (also shown in Figure 2), values predicted from the model at the end of
the preheater tubing, and values predicted from the model at the end of the isothermal main reactor.
The data are plotted versus sandbath temperature, and calculated values of residence time in both
the preheater and complete system (preheater and main reactor) are also shown to facilitate
interpretation. Note that residence time does not scale linearly with sandbath temperature, as
experimental mass flow rates were decreased with increasing sandbath temperature in our
experiments to compensate for the increasing volumetric flow rates at higher temperatures. In all
cases, the main reactor (supercritical) residence time was 6 s, which was always less than the
calculated preheater residence time.

11
Figure 3 shows that the simple Arrhenius-type model of Fells and Moelwyn-Hughes has
major shortcomings. Although the calculated values of conversion are of the same order of
magnitude as the experimental values, the shape of the curves formed by the set of calculated
conversion values (both at the end of the preheater tubing and at the end of the main reactor) clearly
do not match the experimental trends. Note also that, in each case, almost half of the total
conversion is predicted to occur in the supercritical main reactor, which contradicts the
experimental observations (Table 2). These results are not necessarily unexpected, since the
magnitude of the Fells and Moelwyn-Hughes rate constant (and indeed of any rate constant of
Arrhenius form) should increase monotonically with increasing temperature. Thus, considering
only temperature effects, one would in fact predict that the amount of total conversion would be
very high in the supercritical main reactor, as opposed to the lower temperature preheater tubing,
for a rate constant of this form. This model, however, is unable to capture the behavior shown by
the experimental data and observations over our extended sub- and supercritical temperature range.
These discrepancies between experimental results and the Fells and Moelwyn-Hughes
model suggest that the simple Arrhenius-type rate expression is failing to account for some
important effect. Specifically, an additional temperature-dependent phenomenon must be offsetting
the strong positive temperature effect of the Arrhenius term at high temperatures. Apart from the
temperature, the one factor which varied significantly during the course of each experiment was the
nature of the water solvent itself. Below we investigate the impact of solvation effects on the
CH2Cl2 hydrolysis reaction rate.
V. THE INFLUENCE OF THE SOLVENT ON REACTION RATES
When water is heated from ambient to supercritical conditions, it transforms from being a
dense, strongly polar, hydrogen bonded liquid to a lower density, nonpolar fluid with gas-like
diffusivity and viscosity.2, 23, 24 Two quantities which are likely to affect reaction rates in
12
supercritical water are thus the density and dielectric nature of the solvent. The polar nature of the
subcritical hydrolysis of CH2Cl2 makes it reasonable to suspect that the changing dielectric nature
plays a key role. Below, we will present ab initio-based evidence that, in this case, the dielectric
effect is two to three orders of magnitude more important than the density effect.
The literature provides strong precedent for noticeable solvent effects on reaction rates,
particularly in the vicinity of the critical point of water. For example, the computer simulations of
Gao and Xia25 show that the rate of two reactions, the Claisen rearrangement of allyl vinyl ether
and the SN2 reaction of NH3 and CH3Cl increase when conducted in aqueous solution as opposed
to the gas phase. Researchers at the University of Texas at Austin have explored the solvation
effects of supercritical water on a number of reactions via simulation and spectroscopy, including
proton transfer reactions26, 27 and the SN2 reaction between Cl- and CH3Cl.28 Townsend et al.29
observed parallel pyrolysis and hydrolysis mechanisms for the reaction of a number of coal model
compounds in sub- and supercritical water, and found the product selectivity to be dependent upon
the solvent. These trends were also seen in a similar study of nitroaniline explosive simulants.30
In addition, Townsend et al.29 found that the value of the rate constant for a few compounds was
highly correlated to the dielectric constant of the water solvent. In a follow-up study, Huppert et
al.31 showed that the hydrolysis rate constant of guaiacol could be manipulated by changes in the
solvent water density near the critical point (at a temperature of 383°C) by pressure variation and by
adding salts. Similarly, in a study of 1-propanol dehydration in supercritical water, Narayan and
Antal32 observed a decrease in the acid-catalyzed rate constant by a factor of three when the water
dielectric constant was increased by a proportional amount by an increase in pressure. Iyer and
Klein33 incorporated a dielectric constant dependent term in their correlation for the rate constant for
butyronitrile hydrolysis to account for changes in the electrostatic nature of the solvent resulting
from pressure variation. Finally, Habenicht et al.34 observed improved fits in their reaction model
when accounting for the influence of the solvent dielectric constant on the synthesis of ethyl tert-
butyl ether from tert-butyl alcohol in liquid ethanol.

13
The qualitative picture of the dielectric solvent effect is that when the solvents tend to
stabilize the transition state complex of a reaction (relative to the reactants), this enhances the
reaction rate. For those reactions where the electric fields associated with the transition state are
stronger, due to for instance a higher net charge or stronger dipole moment, a solvent with strong
dielectric response or high polarity will tend to lower the energy of the transition state relative to the
reactants, resulting in a faster reaction.35 Conversely, for those reactions where the reactants have
stronger electric fields than the transition state, a solvent with high dielectric constant will lower the
total energy of the reactants more than that of the transition state, resulting in a higher activation
energy and a slower reaction. The trends are opposite when the dielectric constant of the solvent is
low. In the present case, the dielectric response of H2O decreases dramatically with increasing
temperature near the critical point. We thus in principle expect the rate of an aqueous reaction with
a highly polar transition state to slow down as the water is heated from subcritical to supercritical
conditions, and for the reaction to accelerate if the reactants are more polar than the transition state.
For qualitative determination of solvent effects on rates of nucleophilic substitution
reactions, Lowry and Richardson35 have divided the family of nucleophilic substitution reactions
into four main categories based on the electrical nature of the nucleophile and the leaving group.
The neutral hydrolysis reaction of CH2Cl2, with the neutral nucleophile H2O and the charged
leaving group Cl-, falls under Type 2, which is the only category in which the transition state
produces stronger electric fields than the isolated reactants. The basic hydrolysis of CH2Cl2, on
the other hand, with charged nucleophile OH- and leaving group Cl-, falls under Type 1, in which
the electric fields of the isolated reactants are stronger than for the transition state. We thus expect
a solvent medium of high dielectric constant to favor the neutral hydrolysis reaction, and a solvent
medium of low dielectric constant to favor the basic hydrolysis reaction, relative to each other. As
water goes through the critical point with increasing temperature, therefore, the rate of the neutral
hydrolysis reaction is expected to be retarded due to the changing nature of the solvent. Although

14
one in principle would expect the rate of basic hydrolysis to accelerate under the same conditions,
the greatly reduced water dissociation constant and low ion solubilities typical in supercritical water
would likely result in a low OH- concentration available and prevent basic hydrolysis from
becoming significant. The experimentally observed fast hydrolysis of CH2Cl2 under subcritical
conditions but much slower reaction under supercritical conditions is thus consistent with the
neutral hydrolysis mechanism.
VI. THEORETICAL DEVELOPMENT
Kirkwood Theory To account quantitatively for the solvent-induced slowing of the CH2Cl2
hydrolysis reaction in going from sub- to supercritical conditions, one starts by invoking transition
state theory. This application is not straight-forward, however, as it requires accounting of the
varying energy of solvation of the reactants and the transition state as the polar nature of the water
reaction environment changes. Further complications arise as the conformation of the transition
state itself depends on its molecular environment, an effect which can only be accounted for
properly by an accurate quantum mechanical description of the reaction. The theoretical description
which we use involves a unique combination of transition state theory, electrostatics and ab initio
quantum calculations.
For a first attempt at such a combined theory, we shall take the picture originally developed
by Kirkwood36 as a reasonable starting point for computing the energy of solvation of a molecule,
deferring refinements for future work. Kirkwood modeled the solvation energy of a species as the
change in Gibbs free energy as the species is transferred from vacuum to a dielectric continuum
with dielectric constant ε equal to that observed experimentally for the solvent. To a first
approximation, the charge distribution of the solute (represented by point charges qk) is held fixed
during this process and the dielectric constant of the solvent has the value ε everywhere except
inside a spherical volume of radius r (representing the solute) from which the solvent is excluded
by short range interactions with the solute (Figure 4). In this work, we follow the more common

15
practice of taking the dielectric constant within this sphere to be that of free space (i.e. εi = 1).36, 37
With this approach, the energy of solvation is simply the energy required to create the charge
distribution of the solute within the dielectric cavity. Solution to this standard electrostatic
boundary value problem results in the following expression:
∆GZ e
r rsolv io o
, = − + −+
+2 2 2
381
412 1πε
εε
µπε
εε
K (6)
where ∆Gsolv, i is the energy of solvation for a species i, Ze is the total charge of the solute, µ is its
dipole moment, and εo is the vacuum permittivity. Generally for species carrying a net charge, the
first term dominates and the higher order terms are neglected.38 For neutral but polar species, as
are CH2Cl2 and H2O and their transition state, the first term is zero and the second dipolar term
dominates the result. Below, we shall always truncate Eqn. 6 to just these two terms, again
referring refinements to future work.
The subtle effects missed in this simple description of a solute molecule can in principle be
treated correctly in a series of ever more demanding calculations (described in Section IX). Eqn.
6, however, is a reasonable approximation of at least semiquantitative reliability which we apply in
this initial attempt to understand and characterize the reaction.
Application to Transition State Theory Transition state theory provides the connection
between the solvation energy and reaction rate. The rate constant for two neutral molecular species
A and B is
kk T
heb
GRT= −∆ ‡
, (7)
where kb is Boltzmann's constant, h is Planck's constant, R is the universal gas constant, and ∆G‡
is the standard Gibbs free energy of activation for the reaction of A and B to form the transition
state complex AB‡. In this case, the ∆G‡ can be divided into two separate terms for each species i
(reactant or product),

16
∆ ∆G G Gii
io
solv i‡
,= +( )∑ ν . (8)
Here νi is the stoichiometric coefficient for species i according to the reaction, Gio is the standard
Gibbs free energy for a molecule of species i in vacuum, and ∆Gsolv, i is the solvation energy from
the vacuum state for species i, as given in Eqn. 6. Note that the sum νii
ioG∑ is just the standard
state free energy change ∆Gorxn for the reaction in vacuum, which quantum mechanical calculations
normally provide. Combining Eqns. 6, 7 and 8 gives:
ln ln ‡
‡
k kN
RT r r ro
A
o
A
A
B
B
= − −( )+( )
− −
1
4 2 1
2
3
2
3
2
3ε
πε εµ µ µ
(9)
where NA is Avogadro's number, µi and r i are the dipole moment and radius of species i,
respectively, and ko is the rate constant for the reaction in vacuum. The second term on the right in
Eqn. 9 containing the Kirkwood expression is the factor that “corrects” the magnitude of the rate
constant for solvation effects. Note that, as expected from the previous qualitative arguments, the
value of this Kirkwood correction factor increases the reaction rate as the solvent dielectric constant
ε increases, provided that the µ‡
2/r‡
3 term for the transition state is greater than the sum of the
corresponding terms for the reactants.
A more practical reference state than vacuum is the dielectric environment of ambient water
(ε = εa ≈ 80). To use this as the reference, we first compare the prediction of Eqn. 9 for such
ambient conditions with the observable behavior near ambient temperature characterized by an
Arrhenius form with pre-exponential factor A and activation energy Ea:
ln lnk AE
RTa= − (10)
Equating Eqn. 9 evaluated at ambient conditions with Eqn.10 in order to solve for ko, and then
inserting the result back into Eqn. 9 yields:
17
ln lnk ART
EN
r r raA
o
a
a
A
A
B
B
= − +−( )+( ) − −( )
+( )
− −
14
1
2 11
2 1
2
3
2
3
2
3πεεε
εε
µ µ µ‡
‡
(11)
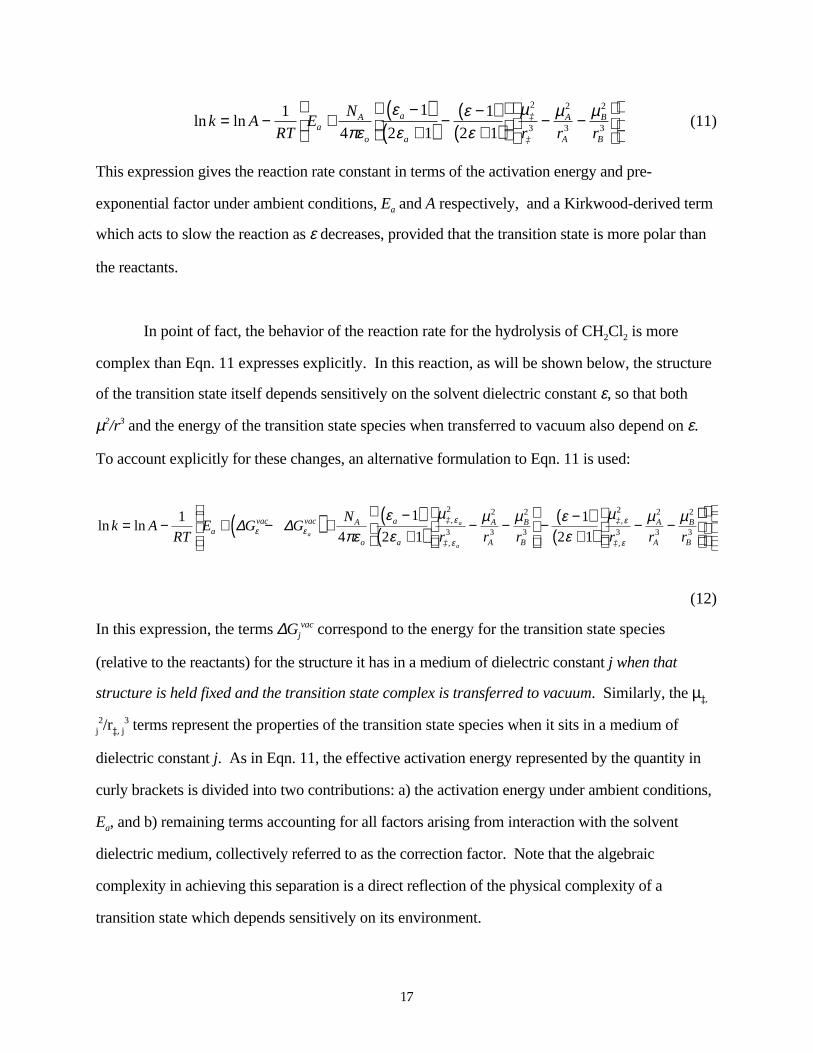
This expression gives the reaction rate constant in terms of the activation energy and pre-
exponential factor under ambient conditions, Ea and A respectively, and a Kirkwood-derived term
which acts to slow the reaction as ε decreases, provided that the transition state is more polar than
the reactants.
In point of fact, the behavior of the reaction rate for the hydrolysis of CH2Cl2 is more
complex than Eqn. 11 expresses explicitly. In this reaction, as will be shown below, the structure
of the transition state itself depends sensitively on the solvent dielectric constant ε, so that both
µ2/r3 and the energy of the transition state species when transferred to vacuum also depend on ε.
To account explicitly for these changes, an alternative formulation to Eqn. 11 is used:
ln lnk ART
E G GN
r r r r r ravac vac A
o
a
a
A
A
B
B
A
A
B
Ba
a
a
= − + −( ) +−( )+( ) − −
− −( )+( )
− −
14
1
2 11
2 1
2
3
2
3
2
3
2
3
2
3
2
3∆ ∆ε εε
ε
ε
επεεε
µ µ µ εε
µ µ µ‡,
‡,
‡,
‡,
(12)
In this expression, the terms ∆Gjvac correspond to the energy for the transition state species
(relative to the reactants) for the structure it has in a medium of dielectric constant j when that
structure is held fixed and the transition state complex is transferred to vacuum. Similarly, the µ‡,
j2/r‡, j
3 terms represent the properties of the transition state species when it sits in a medium of
dielectric constant j. As in Eqn. 11, the effective activation energy represented by the quantity in
curly brackets is divided into two contributions: a) the activation energy under ambient conditions,
Ea, and b) remaining terms accounting for all factors arising from interaction with the solvent
dielectric medium, collectively referred to as the correction factor. Note that the algebraic
complexity in achieving this separation is a direct reflection of the physical complexity of a
transition state which depends sensitively on its environment.
18
Calculation of the correction factor in either Eqn. 11 or 12 requires knowledge of a number
of variables. The value of ε for water has been measured experimentally as a function of
temperature and pressure and can be determined from the correlation of Uematsu and Franck.39
For stable molecules or reactants such as water or CH2Cl2, a number of sources exist that contain
tabulated experimental values for the dipole moment, such as that by McClellan.40 However, to
determine the dipole moment and structure of the unstable transition state complex as well as the
size of all relevant species requires ab initio quantum mechanical calculations, because no tabulated
data exist for these quantities.
Ab Initio theory Ab initio calculations have the great advantage of giving unambiguous results
for a variety of fundamental molecular properties, thus limiting the uncertainties in final results and
correlations. In addition to providing the necessary physical property values for use in calculating
the rate constant correction factor, this approach provides valuable insight into the nature of
reactions, such as environment-dependent solvent effects, as will be shown below.
Our ab initio calculations were carried out within the total energy plane wave density
functional pseudopotential approach,41 using the Perdew-Zunger parametrization42 of the Ceperly-
Alder exchange-correlation energy43 and non-local pseudopotential of the Kleinmann-Bylander
form44 constructed using the optimization procedure of Rappe et al.45 Our potential for carbon
employed a Kleinmann-Bylander projector for the s channel, whereas for oxygen and chlorine we
used a projector for the p channel. The electronic wave functions were expanded in a plane wave
basis up to a kinetic energy cutoff of 40 Rydberg for a total of thirty-five thousand coefficients for
each wave function. The calculations were carried out in a periodic supercell of dimensions 15 Å x
9 Å x 9 Å, allowing for sufficient separation between periodic images of the reacting species to
minimize spurious effects, even for the rather elongated transition state. Note that all ab initio
calculations described herein were performed in vacuum. The minimization of the energy over the
19
electronic coordinates was carried out using a parallel implementation of the conjugate-gradient
technique of Teter et al.46
Ground state molecular structures were determined by moving the ionic cores along the
Hellman-Feynman forces until all forces were less than 0.1 eV/Å. Candidate transition state
structures were determined by holding the appropriate reaction coordinate (chosen as the distance
between the carbon and oxygen atoms) fixed and relaxing the remaining coordinates along their
respective forces until those forces were less than, again, 0.1 eV/Å. The vacuum energies of
species (Givac) are the direct output of this procedure. The dipole moment of each species was
determined directly from the electronic charge density and nuclear arrangement, which are also
direct byproducts of the minimization of the density-functional.
Determination of suitable “radii” r i for the different species for use in Eqns. 11 or 12 is
more subtle. First, the species appearing in Eqns. 11 and 12 (the transition state in particular) are
not spherical. To conform to Kirkwood's formulation in terms of spherical molecules, we use an
average radius determined by the radius of a sphere equal in volume to the region about the
molecule within which we expect the dielectric response from the solvent to be small, due to the
exclusion of solvent molecules by short range repulsive forces. This radius we define as the
equivalent spherical radius of the species.
Both the simplified equivalent spherical approach which we follow here and more
sophisticated approaches require a procedure for estimating the region of diminished solvent
dielectric activity resulting from the presence of the solute. To do this, we first generalize the
concept of the van der Waals radius to a non-spherical surface, such that under experimental
conditions it is very unlikely to find two species with their van der Waals surfaces overlapping. To
determine the location of these surfaces, we performed ab initio calculations which show that the
interaction energy between two water molecules rises rapidly above kbT when their oxygen nuclei
20
approach within 2.5 Å (0.25 nm) of each other. The van der Waals surface for water thus extends
1.25 Å outward along this direction (which is in good agreement with the 1.4 Å radius determined
from the experimental van der Waals equation of state for pure water47). A similar analysis of the
interaction between CH2Cl2 and H2O determined also that the van der Waals surface for CH2Cl2
extends 1.25 Å outward from the carbon nucleus in the direction directly opposite the leaving
chlorine nuclei. It would be computationally prohibitive to map out the van der Waals surfaces
completely in all directions in this manner using ab initio calculations. Instead, we determined this
surface approximately as the constant electron density contour which passes through the two points
identified. This is reasonable because such a surface conforms to the shape of the molecule in
much the same way as we expect the van der Waals surface would.
The van der Waals surface is relevant because the dielectric response of the solvent must
drop to zero within the van der Waals surface of the solute. This is because solvent molecules
cannot contribute any charge to this region. In general, the dielectric response of the solvent will
vary continuously from zero up to its full value as we move outward from the van der Waals
surface into the solvent over some distance characteristic of the size of the solvent molecules. The
region of depressed dielectric response, represented by the cavity in Kirkwood's formulation, thus
extends outward beyond the van der Waals surface. Simple model Monte Carlo calculations of
isolated water molecules subjected to a constant electric field near a rigid interface showed this
extra distance to be approximately 0.9 Å. With the region of depressed dielectric response about
CH2Cl2 thus determined to extend 2.15 Å from the carbon atom along the direction specified above,
we approximated the volume of depressed dielectric response to be all points contained within the
electron charge density contour passing through this point. Using this same charge density
contour value for all species, we determined all equivalent spherical radii needed in Eqn.12.

21
VII. RESULTS AND IMPLICATIONS OF AB INITIO CALCULATIONS
Reactants Parameters describing the reactants H2O and CH2Cl2 provide an opportunity to
validate our ab initio technique with existing measurements, and to check our choice of planewave
cutoff and the construction of pseudopotentials in particular. The structure of these molecules, as
summarized in Table 3, is well reproduced. For both, all bond lengths were within ± 0.03 Å of
their tabulated values. The correct bent and tetrahedral geometries were observed for the stable
equilibrium structure calculated for H2O and CH2Cl2. The H-C-H and Cl-C-Cl bond angles for
CH2Cl2 differed from their accepted values by only 0.5° and 0.2° respectively, while the H-O-H
angle in the water molecule was within 1.6° of the established value of 104.5°.
Figure 5 gives a three-dimensional representation of the full molecule showing a charge
density contour containing 99.5% of the total charge density of the molecule. From such densities
the predicted dipole moment values are in good agreement with the experimental values (Table 3).
The equivalent spherical radii for these species were also determined from the molecular charge
densities according to the procedure described above. The equivalent spherical radius for water as
determined from the charge density contour chosen from the CH2Cl2 molecule is 2.14 Å. The fact
that this is very nearly the same as the sum of our 1.25 Å van der Walls radius for H2O and the 0.9
Å width of our dielectric buffer zone supports our notion of using a fixed charge density contour,
and suggests that the appropriate value is reasonably transferable between species. Overall, our
results confirm that our pseudopotentials are well suited for the atomic species involved in the
reactions, and that our energy cutoff in the plane wave expansion is sufficient to describe the
electronic wave functions of the system.
Transition State With a validated ab initio approach, we can now proceed to look at the
transition state. Because of the demanding nature of the ab initio calculations, a complete search
for all possible transition states would be prohibitive. Fortunately, the chemistry of the present
reaction is sufficiently well-understood that the pathway to search for the transition state is already

22
known. The SN2 reaction mechanism occurs via a very specific stereochemistry, with the
nucleophile attacking from the “back side”; the side directly opposite from the leaving group. To
locate the transition state, we positioned a water molecule (as specified by the coordinates of its
atomic nuclei) on the opposite side of the leaving Cl atom in a CH2Cl2 molecule, as depicted in
Figure 6. The carbon atom was held fixed at the origin (i.e. the center of the supercell of the
calculation) as the oxygen atom was forced to approach the carbon atom along the long axis of the
supercell. At each C-O separation distance λ describing the reaction coordinate for this reaction,
the remaining degrees of freedom of the complex were relaxed without constraint, so that the
molecules could change orientations at will until the equilibrium configuration and minimum
energy were obtained. Rotational symmetry of the system ensures that this choice of reaction
coordinate results in no loss of generality.
To ensure that the molecules did not lock into false local minima during the approach, we
explored the two most likely pathways for H2O-CH2Cl2 approach. In the first, (a) the two
hydrogen atoms from H2O began in the same plane as the carbon and leaving chlorine atoms. This
approach minimizes the energy by positioning the hydrogen atoms from the H2O as far as possible
from the two hydrogen atoms from CH2Cl2 (see Figure 6). In the second approach, (b) the H2O
molecule was rotated 90° so that its hydrogen atoms now began in the plane orthogonal to that
containing the H2O molecule in (a). In this alignment, one proton from the H2O molecule
approaches the non-leaving Cl and the other approaches the two hydrogen atoms of the CH2Cl2
molecule. For the case explored, at a typical value of λ where the transition state complex was
found to occur, the results from orientation (b) showed a significantly greater energy than from
orientation (a) by about 20 kJ/mol. We thus focused our effort on pathway (a).
In our cell of length 15 Å, the largest possible value of the generalized coordinate, λ = 7.5
Å, corresponds to two separate, stable H2O and CH2Cl2 molecules. We confirmed that the
resulting equilibrium structures at λ = 7.5 Å match our results for the two isolated species. As λ

23
decreases, the two reactants begin to feel the effects of their proximity. The most critical region
occurs over the range 2.0 Å < λ < 1.4 Å. As λ decreases through this range, the dipole moment µ
increases by more than a factor of two (Figure 7), and the total energy (in vacuum) of the system
relative to the isolated reactants at λ = 7.5 Å increases by almost a factor of three (ε = 1 curve in
Figure 8). This dramatic variation in the dipole moment over such a small range of the reaction
coordinate has profound consequences for the reaction as the nature of its dielectric environment
changes, as we shall discuss below. However, because there is not much change in the physical
size of the transition state over such a limited range of reaction coordinate, variations in the volume
of the activated complex are minimal (e.g. ± 0.1 Å in the equivalent spherical radius over the same
range in λ.).
Although the total energy of the H2O and CH2Cl2 pair clearly changes as the two molecules
are brought closer together, in vacuum it does not show the usual profile one would expect for two
reacting species. Note that the reaction profile, or the energy relative to isolated reactants as a
function of the reaction coordinate, increases monotonically with decreasing separation when ε = 1
(Figure 8). This implies that there is always repulsion and never attraction between the species and
thus no stable reaction product under vacuum conditions.
To represent the behavior of H2O and CH2Cl2 in a solvent of dielectric constant ε, the
energy of solvation must be added to the vacuum energy. Using the relation for ∆Gsolv, i derived
from Kirkwood theory (Eqn. 6) along with the appropriate ab initio values of µ(λ) and r(λ) already
correlated, the total energy for the H2O/CH2Cl2 pair can be calculated in a solvent of arbitrary
dielectric constant ε at any separation distance λ. The results (Figure 8) show a dramatically
different behavior for H2O and CH2Cl2 when surrounded by a water solvent. Figure 8 also shows
the reaction profiles for a variety of different dielectric strengths ε (which at fixed pressure is a
function only of temperature). For values of ε > 3.6, the reaction profiles exhibit the local
maximum and minimum characteristic of the formation of a product. Because the ab initio
24
technique used results in the minimum configuration energy at any position λ, the profiles in
Figure 8 represent the lowest energy pathway for reaction at any given ε. Along any profile,
therefore, we identify the value of λ where the local maximum in energy occurs as the location of
the transition state complex. The location of the local minimum likewise corresponds to the
product. This maximum and minimum in the profiles become more pronounced as ε increases.
Thus, the influence of the solvent on the CH2Cl2-H2O transition state, and therefore on the nature
of the reaction itself, is substantial.
Close examination of the reaction profiles in Figure 8 reveals that the local maximum
energy points do not all occur at the same value of λ, but happen at slightly smaller values of λ as ε
decreases. Thus for every ε, there is a particular, slightly different, value of λ at which the
transition state occurs. As a result, the structure and physical properties of the transition state,
already functions of λ, are ultimately functions of ε (or T at fixed pressure, from the correlation of
Uematsu and Franck39), and can be traced and correlated as such.
Over the full range of values for ε appearing in our experiments, the structural
transformations predicted along the reaction pathway are consistent with the known
stereochemistry of the SN2 reaction and with empirical rules for intermolecular transition states. As
ε varies from 80 (22°C) to 1.3 (600°C), our predicted location of the transition state occurs at
values of λ of 1.72 Å to 1.63 Å respectively (Figure 9). Values of the other predicted bond
lengths for the transition state corresponding to both limiting values of λ are displayed in Table 4,
along with the accepted bond lengths for stable molecules. The calculations show that as the H2O
molecule approaches the carbon atom of the CH2Cl2 molecule (i.e. λ, or C-O bond length,
decreases), the Cl atom opposite the approaching H2O begins to move further away from the
carbon atom (i.e. C-Cl bond length increases), as expected for this reaction. Note that the C-O
bond length calculated for the transition state is about 0.2 - 0.3 Å greater than the normal C-O bond
length of 1.41 Å. Likewise, the C-Cl bond length (for the leaving Cl) calculated for the transition

25
state is about 0.5 - 0.7 Å greater than the normal C-Cl bond length of 1.77 Å. These variations in
bond length are consistent with the empirical rule cited by Benson49 that bonds in the process of
being formed or broken in intermolecular transition states for molecule-molecule reactions should
be 0.3 - 0.5 Å greater than their nominal length in stable molecules.
Although the lengths of bonds not participating in the reaction do not deviate far from their
values in the isolated reactants (Table 4), the orientations of these bonds change significantly along
the reaction pathway. Specifically, the two C-H bonds and the C-Cl bond with the non-leaving Cl
fold over from their tetrahedral geometry to a planar arrangement perpendicular to the direction of
the incoming water molecule, as shown in Figure 6. This planar configuration for the transition
state corresponds precisely to the stereochemistry expected for an SN2 reaction.
Although the reaction coordinate λ at which the transition state occurs varies by only 0.1 Å
over the range of ε sampled in our experiments, the calculated value of the dipole moment for the
transition state varies by almost 2 Debye units (or about 25%) (Table 4). This is because the value
of µ for the CH2Cl2-H2O pair is particularly sensitive to the value of λ in the region where the
transition state was found to occur (i.e., the steep portion of the curve in Figure 7). One should
also note that the magnitude of µ for the transition state in this active region is predicted to be more
than four times larger than that for either of the reactants, which again is consistent with
expectations for an SN2-type reaction between neutral reactants resulting in a charged leaving
group. Both trends observed for µ will be shown to have a profound effect on the hydrolysis rate.
In contrast, the equivalent spherical radius varies by only 0.02 Å over the relevant range of λ and
therefore is not the determining factor in the behavior of the rate constant.
Implications of Solvent Effects on Reaction Rate Figure 8 exhibits three major trends in
the behavior of the transition state as the dielectric nature of the solvent varies. The detailed
26
information which the ab initio calculations provide allow us to understand these trends in terms of
the behavior of the reacting molecular complex, summarized as follows:
(1) As already mentioned earlier, the transition state occurs at smaller values of λ as ε
decreases. The reason for this is that as ε decreases, the dielectric solvent environment becomes
less effective in its role in stabilizing the reactants. To compensate, the transition state moves to
less negative values of λ (smaller intermolecular distances), where the dipole moment of the
complex is stronger.
(2) As ε decreases, the energy associated with the transition state (local maximum)
increases. Since the difference in energy between that of the transition state and that of the two
reactants (which is what is plotted in Figure 8) is defined as the activation energy for the reaction,
the calculations predict an increasing activation energy with decreasing solvent polarity. This
increase in energy can be traced to the fact that despite the increase in µ described in item 1, the
vacuum energy of the transition state complex (Figure 8) rises so quickly as λ decreases that the
net effect is for energy to increase with decreasing ε. The resulting trend is consistent with a
decreasing reaction rate, as observed experimentally.
(3) The local maximum and minimum in energy become less pronounced and move closer
together (i.e. occur at the same value of λ) as ε decreases and vacuum conditions are approached.
By the point where ε = 3.6 (corresponding to 386°C), the maximum and minimum become
indistinguishable and are replaced by a small plateau (inflection point). This decreasing energetic
separation between the maximum and minimum points as ε decreases indicates a reaction whose
product is becoming less stable and more likely to recross the transition state barrier and return to
the original reactants. This too would lead to a reduced net rate of reaction.
27
Item (2) above provides the theoretical explanation for the experimental observation of
slower hydrolysis kinetics of CH2Cl2 upon heating from sub-to supercritical conditions. Table 5
lists values of the activation energy for CH2Cl2 hydrolysis calculated from our ab initio results at
various temperatures and corresponding values of ε. A value of 130 kJ/mol is predicted for the
ambient activation energy Ea at 25°C. The accuracy of the local density approximation used in our
calculations for an absolute reaction barrier is generally to be considered to be on the order of 10 to
20 kJ/mol because of the large difference in the variation in the molecular electron density in going
from the isolated reactants to the transition state. Our determination of the reaction barrier in
ambient water also depends upon several approximations inherent in the Kirkwood approach.
More detailed calculations50 place the error associated with these approximations also at around 10
kJ/mole when comparing isolated reactants and the transition state. Given these uncertainties, our
ab initio result for Ea compares quite well with the value of 107 kJ/mol found experimentally by
Fells and Moelwyn-Hughes16 at 115°C.
Finally, item (3) raises the issue as to the nature of the reaction when ε < 3.6 (i.e. above
386°C at 246 bar). Within simple transition state theory, the disappearance of the maxima and
minima in the reaction profile that our calculations have revealed for T ≥ 386°C would imply that
there is no stable product and that the reaction comes to a halt. However, because we have not
explored the entire possible phase space of this two-step reaction, it would be precipitous to
construct a model where the reaction rate is taken to be strictly zero above this temperature. Rather
than this, which is equivalent to setting the reaction barrier to infinity above T = 386°C, we have
taken a more conservative approach. We allow for the possibility for further reaction above this
temperature by extrapolating the value of the energy barrier as a continuous function of
temperature. The particular form we chose for extrapolation was to take the energy barrier to be
the value of the energy at the inflection point in the profiles above T = 386°C, which connects
continuously to the maxima and minima at this temperature. Our results show that the reaction rate
28
has slowed enough by 386°C that even with this more conservative extrapolation, not much
conversion occurs above this temperature (see below).
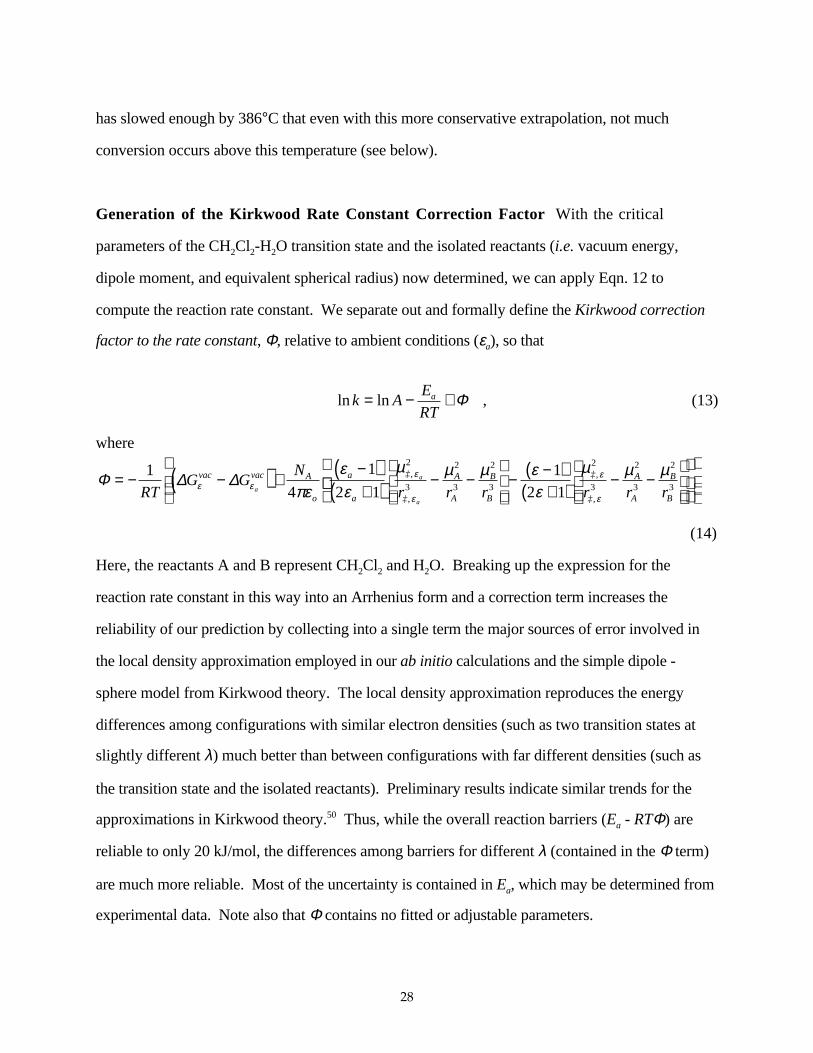
Generation of the Kirkwood Rate Constant Correction Factor With the critical
parameters of the CH2Cl2-H2O transition state and the isolated reactants (i.e. vacuum energy,
dipole moment, and equivalent spherical radius) now determined, we can apply Eqn. 12 to
compute the reaction rate constant. We separate out and formally define the Kirkwood correction
factor to the rate constant, Φ, relative to ambient conditions (εa), so that
ln lnk AE
RTa= − + Φ , (13)
where
Φ ∆ ∆= − −( ) +−( )+( ) − −
− −( )+( )
− −
14
1
2 11
2 1
2
3
2
3
2
3
2
3
2
3
2
3RTG G
N
r r r r r rvac vac A
o
a
a
A
A
B
B
A
A
B
Ba
a
a
ε εε
ε
ε
επεεε
µ µ µ εε
µ µ µ‡,
‡,
‡,
‡,
(14)
Here, the reactants A and B represent CH2Cl2 and H2O. Breaking up the expression for the
reaction rate constant in this way into an Arrhenius form and a correction term increases the
reliability of our prediction by collecting into a single term the major sources of error involved in
the local density approximation employed in our ab initio calculations and the simple dipole -
sphere model from Kirkwood theory. The local density approximation reproduces the energy
differences among configurations with similar electron densities (such as two transition states at
slightly different λ) much better than between configurations with far different densities (such as
the transition state and the isolated reactants). Preliminary results indicate similar trends for the
approximations in Kirkwood theory.50 Thus, while the overall reaction barriers (Ea - RTΦ) are
reliable to only 20 kJ/mol, the differences among barriers for different λ (contained in the Φ term)
are much more reliable. Most of the uncertainty is contained in Ea, which may be determined from
experimental data. Note also that Φ contains no fitted or adjustable parameters.

29
Table 6 and Figure 10 show Φ as a function of the dielectric constant and temperature.
These calculated results indicate that Φ ≤ 0 over the entire temperature range of interest (25-600°C),
consistent with the expected tendency to retard the reaction as the water solvent becomes less polar.
In the subcritical region where water is still quite polar, Φ is small; however, in the range of
temperatures just beyond the critical point where ε drops by an order of magnitude, Φ increases
dramatically. By 550°C, well into the supercritical regime, we predict the Kirkwood correction
factor to decrease the rate constant by 7.5 natural log units (three orders of magnitude) relative to
that predicted by simple Arrhenius behavior. Because the density of the solvent drops by only a
single order of magnitude over the same range of conditions, our results demonstrate that for this
reaction, the rate is much more strongly correlated to the dielectric constant than to the density. To
facilitate calculations, four separate polynomial functions were fit to representΦ (T) in Figure 10
for the temperature ranges 25-374°C, 374-386°C, 386-525°C, and 525-600°C (see Table 7).
To illustrate the effect that the Kirkwood correction factor Φ can have on CH2Cl2
hydrolysis kinetics, we have used it to modify the empirical correlation for the rate constant, kFMH,
proposed by Fells and Moelwyn-Hughes16 (see Eqn. 1):
ln ln′ = +k kFMH Φ (15)
Figure 11 compares the value of ln kFMH to its corrected value ln k’ over the much wider
temperature range of 25 to 600°C (compared to the 80-150°C range originally studied by Fells and
Moelwyn-Hughes). Note that in the limited temperature range of Fells and Moelwyn-Hughes’
experimental data, both k’ and kFMH are essentially the same, verifying that solvent effects are
negligible in this regime. As temperature increases, the two rate constant values begin to diverge
from each other due to the increasing magnitude of Φ. In the supercritical region at T > 400°C, k’
is substantially lowered to a value comparable to that seen around 165°C, where the rate is
relatively slow. Solvent effects decrease the uncorrected hydrolysis rate by more than a factor of
1700 at 550°C (Table 6). Thus inclusion of the Kirkwood correction factor in the form of the rate
30
constant yields rate behavior consistent with our experimental observation of a slowing reaction
with increasing temperature.
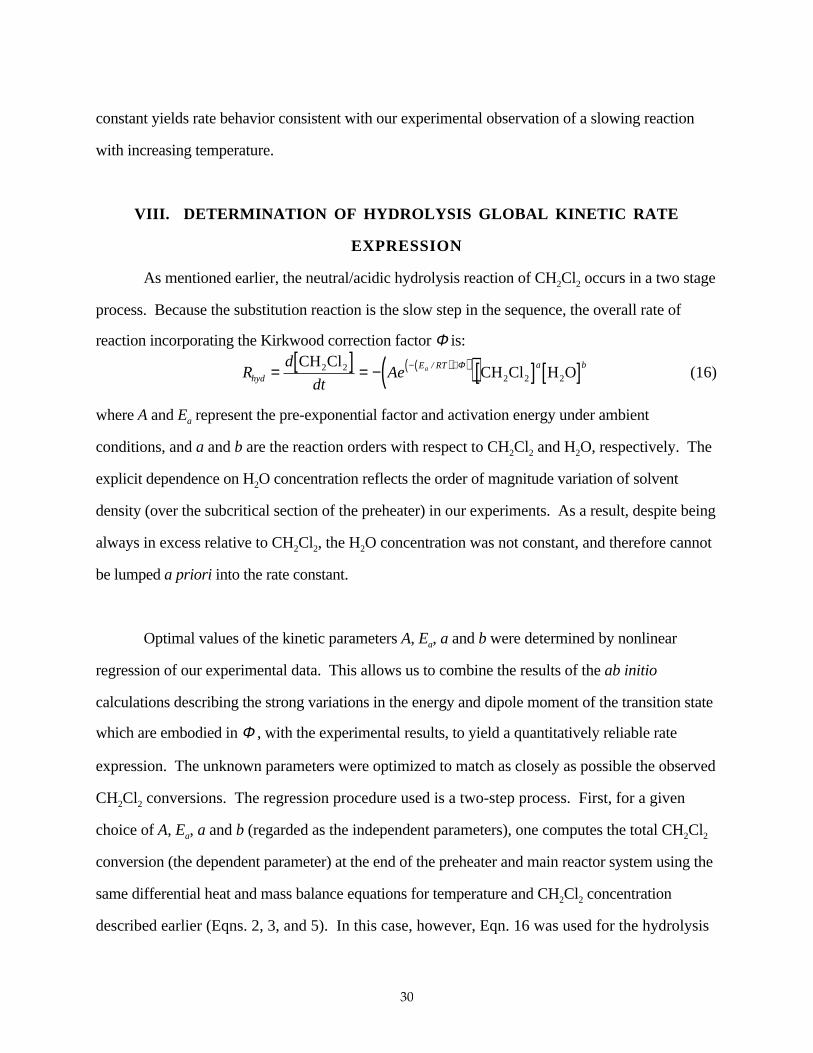
VIII. DETERMINATION OF HYDROLYSIS GLOBAL KINETIC RATE
EXPRESSION
As mentioned earlier, the neutral/acidic hydrolysis reaction of CH2Cl2 occurs in a two stage
process. Because the substitution reaction is the slow step in the sequence, the overall rate of
reaction incorporating the Kirkwood correction factor Φ is:
Rd
dtAehyd
E RT a ba= [ ] = −( )[ ] [ ]−( )+( )CH ClCH Cl H O2 2
2 2 2
/ Φ (16)
where A and Ea represent the pre-exponential factor and activation energy under ambient
conditions, and a and b are the reaction orders with respect to CH2Cl2 and H2O, respectively. The
explicit dependence on H2O concentration reflects the order of magnitude variation of solvent
density (over the subcritical section of the preheater) in our experiments. As a result, despite being
always in excess relative to CH2Cl2, the H2O concentration was not constant, and therefore cannot
be lumped a priori into the rate constant.
Optimal values of the kinetic parameters A, Ea, a and b were determined by nonlinear
regression of our experimental data. This allows us to combine the results of the ab initio
calculations describing the strong variations in the energy and dipole moment of the transition state
which are embodied in Φ , with the experimental results, to yield a quantitatively reliable rate
expression. The unknown parameters were optimized to match as closely as possible the observed
CH2Cl2 conversions. The regression procedure used is a two-step process. First, for a given
choice of A, Ea, a and b (regarded as the independent parameters), one computes the total CH2Cl2
conversion (the dependent parameter) at the end of the preheater and main reactor system using the
same differential heat and mass balance equations for temperature and CH2Cl2 concentration
described earlier (Eqns. 2, 3, and 5). In this case, however, Eqn. 16 was used for the hydrolysis

31
rate expression Rhyd instead of Eqn. 4 or 15. Second, one adjusts the independent parameters
iteratively until a best-fit to the experimental conversion results is obtained. The latter process was
performed using the multivariable Powell SSQMIN algorithm51 as the nonlinear optimization
routine.
The full four-parameter regression to the hydrolysis experimental data showed the best-fit
values of b, A and Ea to be highly correlated, making it difficult to extract meaningful values.
(Similar behavior was noticed by Holgate et al.21 in performing a four-parameter regression for the
water gas shift reaction between CO and H2O.) As the expected reaction order for H2O (given the
nature of the SN2 reaction) is first order, b was set to unity in all further regression attempts.
With b = 1, the three-parameter regression for A, Ea, and a yielded the following global
rate expression for CH2Cl2 hydrolysis:
Rd
dtehyd
RT= [ ] = −( )[ ] [ ]± − ±( )+( ) ±CH ClCH Cl H O2 2
2 2 21016 5 4 6 210 40 1 52 0 67. . / . .Φ (17)
where Rhyd is in units of mol/(L s), activation energy is measured in kJ/mol, and the concentrations
are in mol/L. All parameter uncertainties are quoted at the 95% confidence level, and Φ is as given
by Eqn. 14, with values determined through the polynomial correlations given in Table 7. The
regressed value of 210±40 kJ/mol for the ambient activation energy (Ea) includes all experimental
uncertainties, modeling uncertainties, and variability due to the number of parameters in the
regression. Therefore this value is not unreasonable when compared to the parameter-free
Kirkwood-ab initio determined value of 130 kJ/mol (Table 5).
Figure 12 compares total CH2Cl2 conversion calculated with the rate expression of Eqn. 17
as a function of experimental residence time and sandbath or final reactor temperature with the
experimental hydrolysis data and the results of the simple first-order model of Fells and Moelwyn-

32
Hughes.16 Predicted values of conversion at both the end of the preheater and after the main
reactor are presented. Figure 12 demonstrates that accounting for solvent dielectric and density
effects improves significantly the prediction of conversion both qualitatively and quantitatively over
simply extrapolating the experimental Arrhenius correlation of Fells and Moelwyn-Hughes. Use
of the Kirkwood correction factor Φ in Eqn. 17 also leads to a much reduced further conversion of
CH2Cl2 in the supercritical main reactor itself, in agreement with our experimental observations.
For sandbath temperatures below 525°C (total residence times < 16.5 s), predicted conversions at
the end of the preheater and main reactor were within the experimental error of the data, and were
essentially identical at 450°C (14 s), exactly as observed. The ability of Eqn. 17 to capture this
behavior, not predicted by extrapolation of the single Arrhenius rate expression of the Fells and
Moelwyn-Hughes model, underscores the importance of the Kirkwood correction factor on the
kinetics of polar reactions occurring in solvent media undergoing appreciable changes in dielectric
constant. At higher temperatures and longer residence times, the fit of predicted conversion at the
end of the reactor from Eqn. 17 still matches the data well, but is increasingly higher than that
predicted at the end of the preheater. Although the maximum difference between predicted
preheater and main reactor conversions was only 16%, it is higher than the 3% difference observed
experimentally at a sandbath temperature of 575°C (20 s) (Table 2).
Figure 13 shows how predicted CH2Cl2 conversion (from Eqn. 17) varies as a function of
temperature within the preheater tubing. The graph presents results for four runs, which include
the experimental sandbath temperature and residence time extremes. In all cases, most of the
conversion occurs below 390°C, with a smaller amount occurring under supercritical conditions.
In the temperature range from 390 - 540°C (well above the critical point), the model predicts no
noticeable conversion. The small increase in conversion that appears after about 540°C for the
higher sandbath temperature runs, which is correlated to the somewhat higher main reactor
conversions under these conditions shown in Figure 12, appears to be a feature of the model at
these highest temperatures. It arises from our conservative treatment of the reaction rate as
33
continuing after the disappearance of the energy maxima and minima in the reaction profile above
386°C, as discussed above.
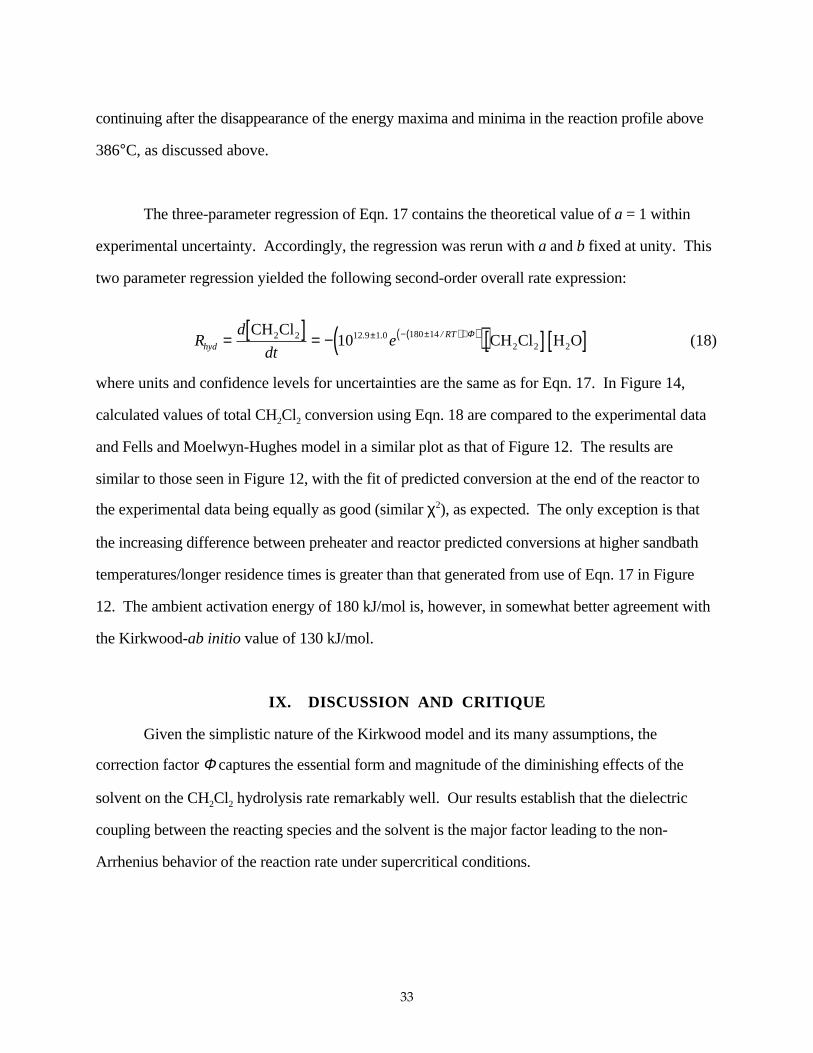
The three-parameter regression of Eqn. 17 contains the theoretical value of a = 1 within
experimental uncertainty. Accordingly, the regression was rerun with a and b fixed at unity. This
two parameter regression yielded the following second-order overall rate expression:
Rd
dtehyd
RT= [ ] = −( )[ ] [ ]± − ±( )+( )CH ClCH Cl H O2 2
2 2 21012 9 1 0 180 14. . / Φ (18)
where units and confidence levels for uncertainties are the same as for Eqn. 17. In Figure 14,
calculated values of total CH2Cl2 conversion using Eqn. 18 are compared to the experimental data
and Fells and Moelwyn-Hughes model in a similar plot as that of Figure 12. The results are
similar to those seen in Figure 12, with the fit of predicted conversion at the end of the reactor to
the experimental data being equally as good (similar χ2), as expected. The only exception is that
the increasing difference between preheater and reactor predicted conversions at higher sandbath
temperatures/longer residence times is greater than that generated from use of Eqn. 17 in Figure
12. The ambient activation energy of 180 kJ/mol is, however, in somewhat better agreement with
the Kirkwood-ab initio value of 130 kJ/mol.
IX. DISCUSSION AND CRITIQUE
Given the simplistic nature of the Kirkwood model and its many assumptions, the
correction factor Φ captures the essential form and magnitude of the diminishing effects of the
solvent on the CH2Cl2 hydrolysis rate remarkably well. Our results establish that the dielectric
coupling between the reacting species and the solvent is the major factor leading to the non-
Arrhenius behavior of the reaction rate under supercritical conditions.
34
The modest discrepancies between our prediction of preheater and main reactor conversions
at higher sandbath temperatures, however, suggests that our physical model is still incomplete.
There are three possible explanations for this behavior: (1) more than one reaction mechanism
occurred over the extended temperature range covered in the experiments, confounding our
attempts to model the conversion as proceeding by a single reaction; (2) our conservative
continuation of the reaction rate beyond the disappearance of the local energy maximum along the
reaction profile for ε < 3.6 (T > 386°C) is unrealistic as the reaction rate might become negligible
beyond this temperature; (3) our picture is essentially correct and the discrepancies which we
observe are purely due to quantitative errors associated with the simplifying assumptions in the
Kirkwood model itself.
A more detailed view of the first possibility is that the reaction may be proceeding via
different pathways at different temperatures (i.e. subcritical polar vs. supercritical free radical
pathways), or that one or more additional reactions involving CH2Cl2 become important at higher
temperatures. However, there is no direct evidence either in the literature or the experimental
product distribution from our studies that suggests that any significant secondary reactions could
have occurred.5 In addition, recent isothermal batch experiments on CH2Cl2 hydrolysis in the
presence of Hastelloy C-276 beads confirm no effect of the metal on hydrolysis kinetics52.
With the second possibility, the precise nature of the change in the reaction signaled by the
disappearance of the local energy maximum and minimum at T = 386°C (ε = 3.6) is uncertain.
Without further exploration of the reaction phase space, we chose the more conservative route of
allowing for a finite reaction rate above this temperature. Even with this approach of extrapolating
the decreasing reaction rate near T = 386°C, most of the CH2Cl2 hydrolysis is still predicted to
occur in the subcritical region. It does appear, however, that the magnitude of the correction factor
at higher temperatures (i.e. > 540°C) is not large enough to counteract the increasing magnitude of
the Arrhenius component of the rate expression. The comparison of this with the experimental
35
results may signify that the disappearance of the maxima and minima should be taken to mean that
the reaction stops completely above 386°C. One interesting direction for future work is therefore to
explore the hydrolysis reaction phase space more fully.
With regards to the third possibility, shortcomings of the Kirkwood model are readily
apparent. First are the structural idealizations: (a) molecules are not spherical, so that one cannot
properly characterize the size of a molecule like CH2Cl2 or its hydrolysis transition state complex
by a single radius; and (b) the charge distribution of a molecular complex is distributed in space
and not concentrated at a point so that in the vicinity of such a complex, where the coupling to the
solvent is the strongest, the charge distribution cannot be captured by the first few terms in a
multipolar expansion. Second, is the manner in which the dielectric response of the solvent is
treated on the molecular level: (c) by using a local dielectric function ε outside of the molecule,
Kirkwood theory ignores molecular correlations which are needed to describe such effects as
hydrogen bonding; and (d) the theory also assumes an unrealistically sharp transition of the solvent
dielectric as one approaches the interior of the molecule. Minor flaws include an uncertainty as to
how to define the interior and exterior regions of the molecule and the value of the dielectric
constant which one should use in the interior solute region. Our ab initio work described above,
however, mitigates the uncertainties as to the boundary of the molecule, and it is clear that in self-
consistent ab initio calculations, the dielectric constant inside of the molecule should be taken to be
that of vacuum.
Both continuum and molecular-level studies are underway to evaluate the importance of the
above simplifications and to find ways to correct for these deficiencies. Preliminary results show
that the impact of using a more realistic shape for the molecular cavity and the complete ab initio
charge distribution as opposed to a spherical cavity containing only the dipole moment of the
distribution is relatively mild, changing the correction factor by less than 10%.50 Thus, while
future improved results may refine some of the quantitative details of our regression, they will

36
preserve the overall picture. Finally, molecular dynamics (MD) simulations of large numbers of
water molecules interacting with the potential field of the solute as determined by ab initio are
underway to evaluate the impact of more realistic microscopic treatment of the dielectric response
of the solvent.
X. SUMMARY AND CONCLUSIONS
Experimental evidence shows that hydrolysis is a significant pathway of destruction for
CH2Cl2, with most breakdown occurring at subcritical temperatures. Slower hydrolysis rates with
little additional CH2Cl2 conversion occurred under supercritical conditions. With these
complexities, a simple, Arrhenius form for the hydrolysis rate constant does not match the
experimentally observed trends over the extended temperature range investigated.
There are qualitative reasons to believe that the CH2Cl2 hydrolysis reaction should slow
down as T increases and ε decreases. The changing nature of the water solvent when heated from
sub- to supercritical conditions decreases its ability to stabilize the polar transition state complex.
Kirkwood Theory provides an effective framework and ab initio techniques provide accurate
microscopic parameters with which to quantify these solvent effects.
The ab initio predicted stereochemistry and physical properties of both reactants and their
transition state are consistent with expectations. Increases in the activation energy and a changing
reaction profile with decreasing ε (increasing T) provide a mechanism for reducing the reaction rate
at higher temperatures. The hydrolysis rate is predicted to decrease by about three orders of
magnitude at 550°C relative to that predicted without accounting for these solvent-related effects.
The presence of the screening provided by the solvent is necessary to stabilize the transition state.
Thus, the transition state and activation energy for the hydrolysis reaction are highly sensitive to
the changing dielectric constant as water becomes supercritical. The magnitude of these effects are
properly captured and correlated by a Kirkwood correction factor to the rate constant, Φ (Eqn. 14).

37
A regressed global rate expression for hydrolysis incorporating Φ (Eqn. 17, 18) was developed to
predict the trends in the experimental data and provide a model of the reaction rate over an extended
temperature range of interest in engineering applications.
APPENDIX
Determination of Overall Heat Transfer Coefficient Values Values of the overall heat
transfer coefficient Ui were needed for use in Eqn. 2 in order to calculate the temperature profile in
the preheater tubing of the experimental system. For these calculations, Ui was considered to be a
function of z and was computed at each step in the numerical integration using the usual sum of
resistances formula:
1 1U h
t d
k d
d
d hi i
w i
w LM
i
o o
= + + (A-1)
where hi and ho are the internal and external heat transfer coefficients, respectively; di , do, and dLM
are the inner, outer, and log mean diameter, respectively; tw is the wall thickness; and kw is the wall
thermal conductivity.
Calculation of hi in this system required consideration of a number of important factors and
phenomena including substantial changes in physical properties (particularly near the critical point),
geometric and flow effects, and the proper coupling of forced and natural convection. A detailed
analysis is provided by Marrone.52 Six correlations were taken from the literature to cover the
three different spatial orientations of sections of the tubing (vertical downflow, horizontal flow,
and vertical upflow) and whether the flow was laminar or turbulent. Sources of these correlations
are listed in Table A1. All of these correlations are given in terms of the Nusselt number Nu and
can generally be written as follows:
Nuh d
kf Gr
C
Ci i w p
p
= =
Re,Pr, , ,
ρρ
(A-2)
38
where Re is the Reynolds number, Pr is the Prandtl number, Gr is the Grashof number, ρ w and ρ
are the density at the wall and in the bulk respectively, and Cp and Cp are the average heat capacity
between wall and bulk temperatures and the bulk heat capacity respectively.
Values for the tube wall conductivity, kw, were calculated from a temperature-dependent
empirical equation fit to thermal conductivity data for Hastelloy C-276.57 The external heat transfer
coefficient, ho, was assumed constant over the tubing length for a given sandbath temperature.
Values for ho were chosen for each experiment so that the model predicted the measured value of
the mixing tee temperature at the end of the preheater tubing. For the entire range of operating
conditions, the necessary values of ho ranged from 69 to 316 W/m2K, varying by less than a factor
of 5. Uncertainty in the measured mixing tee temperature had only a modest effect on calculated ho
values; a ± 1°C change in the mixing tee temperature resulted in only a 3% change in ho. The
assumption that ho was constant is reasonable, given the uniform thermal conditions that existed in
the fluidized sandbath in which the preheater tubing and main reactor were immersed. The
experimentally fitted values of ho agree reasonably well with values of about 260-450 W/m2K
calculated from the correlation of Vreedenberg58 for a horizontal tube in a fluidized sandbath.
Based on the values of hi, kw, and ho calculated for the conditions of our experiments, most
of the heat transfer resistance occurred external to the preheater tubing. Typically, hi was about an
order of magnitude larger than ho. The resulting temperature-time profiles indicate preheater
residence times of 7 to 17 s, with about 70-80% of the total residence time of the fluid spent below
390°C, where water is still sufficiently polar for CH2Cl2 hydrolysis to occur. Temperature
predictions also agree with independent corrosion measurements in that a range of 110-350°C was
predicted for the region of the preheater tube wall where most of the observed corrosion occurred.
This hot, but still subcritical, temperature range is where the tube wall should be most susceptible
to chloride-induced corrosion.
39
ACKNOWLEDGMENTS
The authors would like to thank the U.S. Army Research Office (grants DAAL03-92-G-
0177, DAAH04-93-G-0361, DAAG04-94-G-0145, and DAAH04-96-1-0174) under the
University Research Initiative program supervised by Dr. Robert Shaw, and the National Institute
of Environmental Health Sciences (grant No. 5 P42 ESO4675-10), for their partial support of this
research. TAA is supported in part by a grant from the Alfred P. Sloan Foundation (BR-3456).
Computational support was provided by the MIT Xolas prototype SUN cluster. Prof. Phil
Gschwend of the Department of Civil and Environmental Engineering at MIT is gratefully
acknowledged for providing insight on the nature of the subcritical CH2Cl2 hydrolysis reaction.
References
(1) Roberts, A.L.; Jeffers, P.M.; Wolfe, N.L.; Gschwend, P.M. Critical Reviews in Environmental Science and Technology 1993, 23(1), 1.
(2) Tester, J.W.; Holgate, H.R.; Armellini, F.J.; Webley, P.A.; Killilea, W.R.; Hong, G.T.; Barner, H.T. ACS Symp. Ser. 1993, 518, 35.
(3) Page, G.W. Environ. Sci. Technol. 1981, 15(12), 1475.
(4) Marrone, P.A.; Lachance, R.P.; DiNaro, J.L.; Phenix, B.D.; Meyer, J.C.; Tester, J.W.; Peters, W.A.; Swallow, K.C. ACS Symp. Ser. 1995, 608, 197.
(5) Marrone, P.A.; Gschwend, P.M.; Peters, W.A.; J.W. Tester Accepted for publication in J. Supercrit. Fluids 1998.
(6) Jeffers, P.M.; Ward, L.M.; Woytowitch, L.M.; Wolfe, N.L. Environ. Sci. Technol. 1989, 23(8), 965.
(7) Jeffers, P.M.; Wolfe, N.L. Environmental Toxicology and Chemistry 1996, 15(7), 1066.
(8) Foy, B.R.; Waldthausen, K.; Sedillo, M.A.; Buelow, S.J. Environ. Sci. Technol. 199630(9), 2790.
(9) Houser, T.J.; Liu, X. J. Supercrit. Fluids 1996, 9, 167.
(10) Taylor, P.H.; Dellinger, B.; Tirey, D.A. Int. J. Chem. Kinet. 1991, 23, 1051.
(11) Bond, G.C.; Rosa C., F. Catalysis Letters 1996, 39, 261.
(12) Papenmeier, D.M.; Rossin, J.A. Ind. Eng. Chem. Res 1994, 33, 3094.
(13) Gillham, R.W.; O’Hannesin, S.F. Ground Water 1994, 32(6), 958.

40
(14) Mitton, D.B.; Orzalli, J.C.; Latanision, R.M. ACS Symp. Ser. 1995, 608, 327.
(15) Mitton, D.B.; Marrone, P.A., Latanision, R.M. J. Electrochem. Soc. 1996, 143 (3), L59.
(16) Fells, I.; Moelwyn-Hughes, E.A J. Chem. Soc. 1958, 1326.
(17) Hine, J.; Lee, D.E. J. Am. Chem. Soc. 1951, 73, 22.
(18) Hine, J.; Thomas, C.H.; Ehrenson, S.J. J. Am. Chem. Soc. 1955, 77, 3886.
(19) Swain, G.C.; Scott, C.B. J. Am. Chem. Soc. 1953, 75, 141.
(20) Schwarzenbach, R.P.; Gschwend, P.M.; Imboden, D.M. Environmental Organic Chemistry; John Wiley & Sons: New York, 1993.
(21) Holgate, H.R.; Webley, P.A.; Tester, J.W.; Helling, R.K. Energy & Fuels 1992, 6(5), 586.
(22) Haar, L.; Gallagher, J.S.; Kell, G.S. NBS/NRC Steam Tables, Hemisphere Publishing Corp.: Washington, 1984.
(23) Modell, M. In Standard Handbook of Hazardous Waste Treatment and Disposal, 8.153, Freeman, H.M., Ed.; McGraw-Hill: New York, 1989.
(24) Franck, E.U. J. Chem. Thermodynamics 1987, 19, 225.
(25) Gao, J.; Xia, X. ACS Symp. Ser. 1994, 568, 212.
(26) Xiang, T.; Johnston, K.P. J. Phys. Chem. 1994, 98, 7915.
(27) Ryan, E.T.; Xiang, T.; Johnston, K.P.; Fox, M. A. J. Phys. Chem. 1996, 100, 9395.
(28) Balbuena, P.B.; Johnston, K.P.; Rossky, P.J. J. Phys. Chem. 1995, 99, 1554.
(29) Townsend, S.H.; Abraham, M.A.; Huppert, G.L.; Klein, M.T.; Paspek, S.C. Ind. Eng. Chem.Res. 1988, 27, 143.
(30) Wang, X.; Gron, L.U.; Klein, M.T.; Brill, T.B. J. Supercritical Fluids 1995, 8, 236.
(31) Huppert, G.L.; Wu, B.C.; Townsend, S.H.; Klein, M.T.; Paspek, S.C. Ind. Eng. Chem. Res. 1989, 28, 161.
(32) Narayan, R.; Antal, M.J. J. Am. Chem. Soc. 1990, 112, 1927.
(33) Iyer, S.D.; Klein, M.T. J. Supercritical Fluids 1997, 10, 191.
(34) Habenicht, C.; Kam, L.C.; Wilschut, M.J.; Antal, M.J. I&EC Research 1995, 34, 3784.
(35) Lowry, T.H.; Richardson, K.S. Mechanism and Theory in Organic Chemistry, 2nd ed.; Harper & Row Publishers: New York, 1981.
(36) Kirkwood, J.G. J. Chem. Phys. 1934, 2(7), 351.
41
(37) Moore, J.W.; Pearson, R.G. Kinetics and Mechanism, 3rd ed.; John Wiley & Sons: New York, 1981.
(38) Laidler, K.J.; Chemical Kinetics, 2nd ed.; McGraw-Hill: New York, 1965.
(39) Uematsu, M.; Franck, E.U. J. Phys. Chem. Ref. Data 1980, 9(4), 1291.
(40) McClellan, A.L. Tables of Experimental Dipole Moments; W.H. Freeman & Co.: San Francisco, 1963.
(41) Payne, M.C.; Teter, M.P.; Allan, D.C.; Arias, T.A.; Joannopoulos, J.D. Rev. Mod. Phys. 1992, 64(4), 1045.
(42) Perdew, J.P.; Zunger, A. Phys. Rev. B 1981, 23(10), 5048.
(43) Ceperly, D.M.; Alder, B.J. Phys. Rev. Lett. 1980, 45(7), 566.
(44) Kleinman, L.; Bylander, D.M. Phys Rev. Lett. 1982, 48(20), 1425.
(45) Rappe, A.M.; Rabe, K.M.; Kaxiras, E.; Joannopoulos, J.D. Phys. Rev. B 1990, 41, 1227.
(46) Teter, M.P.; Payne, M.C.; Allan, D.C. Phys. Rev. B 1989, 40(18), 12255.
(47) Atkins, P.W. Physical Chemistry, 3rd ed.; W.H. Freeman & Co.: New York, 1986.
(48) Lide, D.R. (ed.) Handbook of Chemistry and Physics, 77th ed.; CRC Press: Boca Raton, Florida, 1996.
(49) Benson, S.W.; Thermochemical Kinetics, 2nd ed.; John Wiley & Sons: New York, 1976.
(50) Ismail-Beigi, S.; Marrone, P.A.; Arias, T.A.; Tester, J.W.; Husbands, P.; Edelman, A. tobe submitted to Phys. Rev. B 1998.
(51) Kuester, J.L.; Mize, J.H. Optimization Techniques with Fortran; McGraw-Hill: New York, 1973.
(52) Marrone, P.A.; Doctoral thesis; Massachusetts Institute of Technology, Cambridge, 1998.
(53) Churchill, S.W. In Heat ExchangerDesign Handbook, Vol. 2.5.10; Hemisphere Publishing Corp.: Washington, 1984.
(54) Watts, M.J.; Chou, C.T. In Proceedings of the Seventh International Heat Transfer Conference, Vol. 3, 495; Munich, Fed. Rep. of Germany, 1982.
(55) Morcos, S.M.; Bergles, A.E. J. Heat Transfer 1975, 97, 212.
(56) Robakidze, L.V.; Miropol’skii, Z.L.; Khasanov-agaevenin, L.R. Thermal Engineering1983, 30(6), 368.
(57) Alloy Digest, Data on INCO Alloy C-276, Alloy Digest Inc., NJ, 1985.
(58) Vreedenberg, H.A Chem. Eng. Sci. 1958, 9, 52.

42

43
List of Tables
Table 1 Experimental Operating Conditions. Concentrations cited are for the conditions prevailing at the beginning of the preheater tubing or isothermal main reactor.
Table 2 Comparison of Conversions Measured in Experiments with and without the Supercritical Main Reactor.
Table 3 Calculated and Experimental Values of Bond Lengths and Angles, Dipole Moments, and Radii for H2O and CH2Cl2. Experimental values of bond lengths and angles are taken from Lide.48 Experimental values of dipole moments are takenfrom McClellan.40 Calculated values of all above physical properties were generated via ab initio simulation.
Table 4 Calculated and Expected Values of Bond Lengths, Dipole Moment, and Equivalent Spherical Radius for the CH2Cl2 Hydrolysis Transition State Complex. All calculated values were generated via ab initio simulation. Expected bond length values are determined via the criteria of Benson49 for a “tight” transition state species. Stable molecule bond lengths represent accepted single bond length valuesbetween the listed atoms found in unreacting molecules, and are taken from Lide.48
Table 5 Values of Activation Energy for CH2Cl2 Hydrolysis at Various Temperatures. Values listed from the present study were determined from the difference in energy between the transition state species and two reactants at the given temperature. Energy values were determined via ab initio simulation in vacuum and adjusted for
the effects of solvation via Eqn. 6.
Table 6 Values of the Kirkwood Correction Factor (Φ), and the Hydrolysis Rate Decrease Relative to that Predicted by Fells and Moelwyn-Hughes,16 at Various Values of T and ε. ε is calculated from T at 246 bar from the correlation for water by
Uematsu and Franck.39 Φ is calculated according to Eqn. 14, using data from Figures 7 and 8 and Table 4. k’ and kFMH are calculated as defined in Eqns. 15 and 1 respectively.
Table 7 Correlations for Kirkwood Correction Factor Φ Determined from Data in Figure 10. Appropriate values of coefficients to use are chosen based on the temperature range of interest.
Table A1 Sources of Empirical Correlations Used for Calculation of Internal Heat Transfer Coefficient, hi.
List of Figures
Figure 1 Diagram of the Preheater Tubing and Main Reactor of the Experimental Apparatus, Heated in a Fluidized Sandbath.
Figure 2 Graph of Experimental CH2Cl2 Conversion Versus Sandbath Temperature for Hydrolysis and Oxidation Runs. Total pressure = 246 bar. Error bars indicate 95% confidence intervals.
44
Figure 3 Experimental and Predicted CH2Cl2 Hydrolysis Conversion As a Function of Sandbath Temperature and Residence Time. Total pressure = 246 bar; error bars indicate 95% confidence intervals. Model values generated using the first order rateconstant correlation of Fells and Moelwyn-Hughes (Eqn. 1). Note that residence time does not scale linearly with sandbath temperature.
Figure 4 The Kirkwood Model for a Solute Molecule in Solution.
Figure 5 Three-Dimensional Representation of CH2Cl2 Molecule in Terms of Charge DensityDetermined from Ab Initio Calculations. Boundary of molecule shown includes 99.5% of charge density. Center spheres indicate locations of atomic nuclei.
Figure 6 Stereochemistry of Species in CH2Cl2 Hydrolysis Determined from Ab Initio Calculations. (a) reactants (b) transition state complex.
Figure 7 Plot of Dipole Moment µ of the H2O - CH2Cl2 Pair as a Function of the Carbon -
Oxygen Separation Distance λ . All values of µ were determined from charge densities calculated via ab initio simulation.
Figure 8 Energy of the H2O - CH2Cl2 Pair in Solution as a Function of Their Carbon - Oxygen Atom Separation Distance λ and dielectric constant ε. All energy values are determined from ab initio calculations and Eqn. 6, and are referenced to the sum of energies for the individual H2O and CH2Cl2 molecules.
Figure 9 Graph of the Carbon-Oxygen Separation Distance Corresponding to the CH2Cl2 Hydrolysis Transition State (λTS) as a Function of Temperature.
Figure 10 Kirkwood Correction Factor Φ and Water Dielectric Constant ε as a Function of
Temperature. The curve for Φ is determined from ab initio data in Figures 7and 8 and Table 4. Polynomial correlations for this curve are given in Table 7. Values of ε determined from the correlation of Uematsu and Franck39 at 246 bar.
Figure 11 Plot of the Natural Logarithm of the Fells and Moelwyn-Hughes Rate Constant with and without the Kirkwood Correction Factor (k’ and kFMH respectively) as a Function of Temperature. Values of k’ and kFMH are calculated as defined in Eqns. 15 and 1. The temperature range of the Fells and Moelwyn-Hughes16 experiments on neutral CH2Cl2 hydrolysis (80-150°C) is indicated.
Figure 12 Experimental and Predicted CH2Cl2 Hydrolysis Conversion as a Function of Sandbath Temperature and Residence Time (3 parameter model). FMH predicted conversion is from the first order model of Fells and Moelwyn-Hughes16 with the rate constant as given in Eqn. 1. MIT + Kirkwood predicted conversion uses the three parameter global rate expression of Eqn. 17 developed in the present work.
Figure 13 Predicted CH2Cl2 Conversion Versus Temperature in the Preheater Tubing for FourDifferent Sandbath Temperatures and Flow Rates. All values calculated using the global rate expression of Eqn. 17
Figure 14 Experimental and Predicted CH2Cl2 Hydrolysis Conversion as a Function of Sandbath Temperature and Residence Time (2 parameter model). FMH predicted conversion is from the first order model of Fells and Moelwyn-Hughes16 with the

45
rate constant as given in Eqn. 1. MIT + Kirkwood predicted conversion uses the two parameter global rate expression of Eqn. 18 developed in the present work for a and b forced to 1.
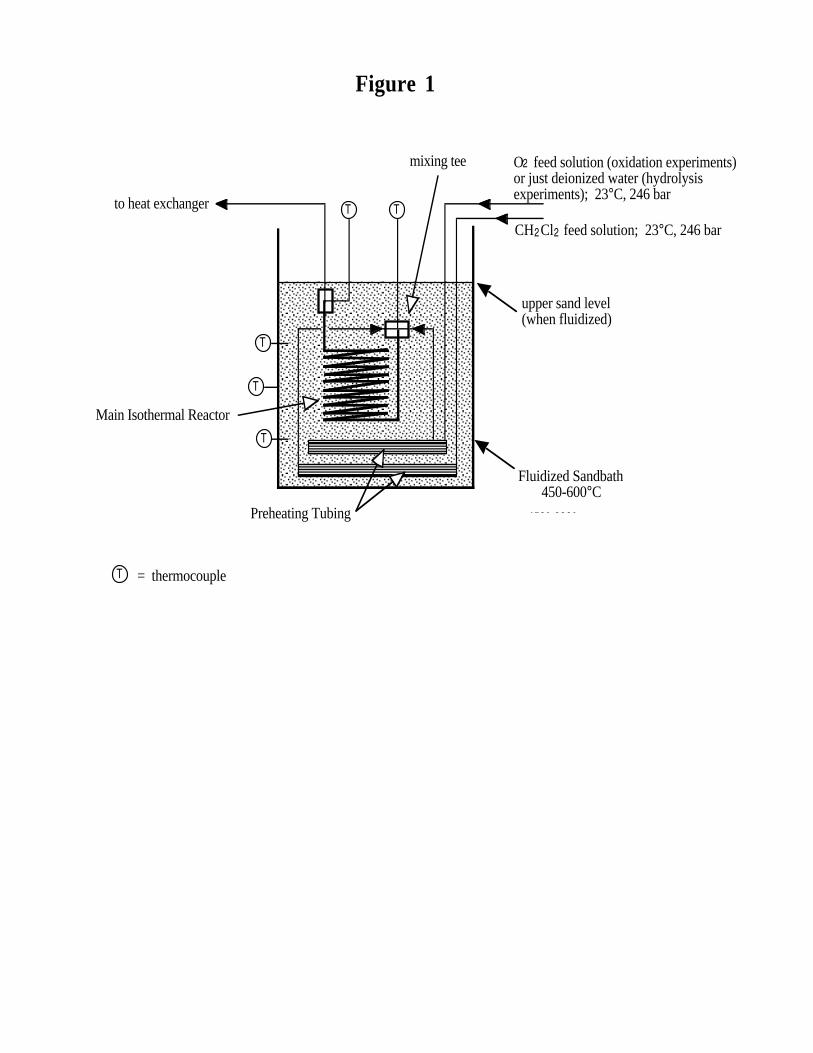
T
Fluidized Sandbath 450-600°C
450°-600°
T
T
T
T
Preheating Tubing
Main Isothermal Reactor
upper sand level(when fluidized)
CH Cl feed solution; 23°C, 246 bar2 2
O feed solution (oxidation experiments) or just deionized water (hydrolysis experiments); 23°C, 246 bar
2
to heat exchanger
mixing tee
Figure 1
T = thermocouple
Table A1
Tube Orientation Flow Direction Flow Type Correlation Source
Vertical Upward, Downward Laminar Churchill, 1984 53
Vertical Upward, Downward Turbulent Watts and Chou, 1982 54
Horizontal Laminar Morcos and Bergles, 1975 55
Horizontal Turbulent Robakidze et al., 1983 56
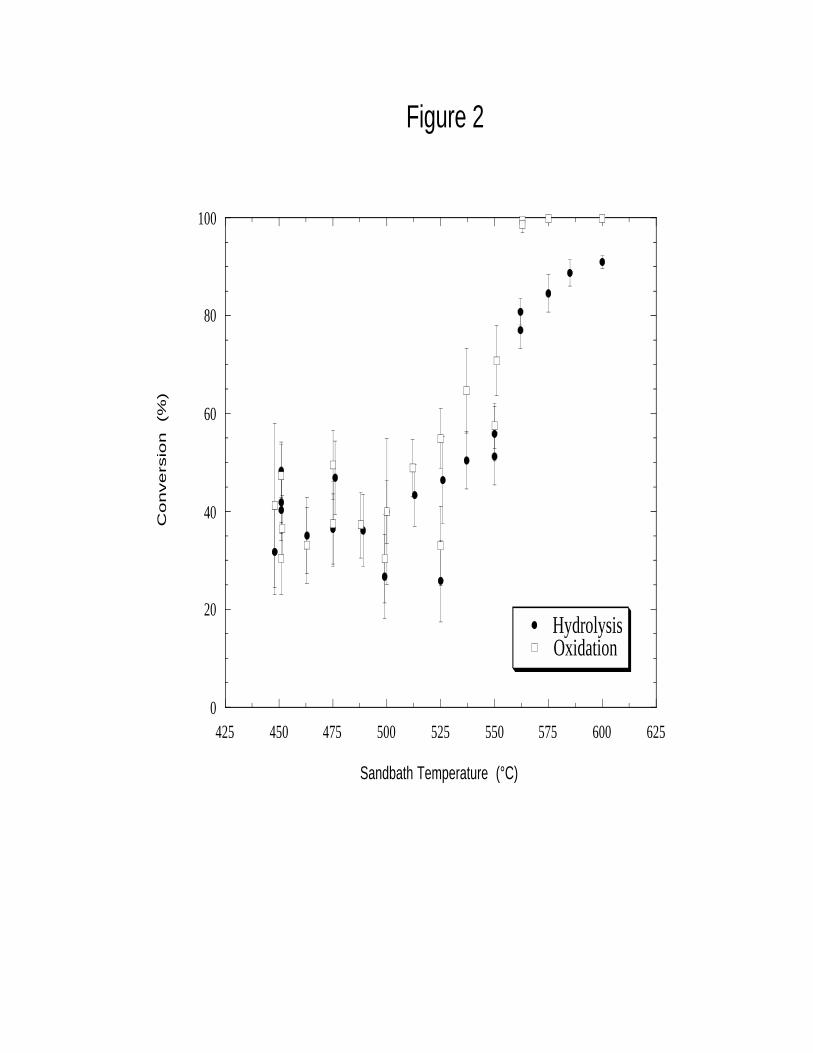
0
20
40
60
80
100
425 450 475 500 525 550 575 600 625
HydrolysisOxidation
Co
nve
rsio
n
(%)
Sandbath Temperature (°C)
Figure 2

0
20
40
60
80
100
400 450 500 550 600
Experimental conversion (end of reactor)Predicted conversion at end of preheaterPredicted conversion at end of reactor
Co
nve
rsio
n
Sandbath T (°C)
Figure 3
Preheater residence time (s)
Total residence time (s)8
14
10
16
11
17
16
22
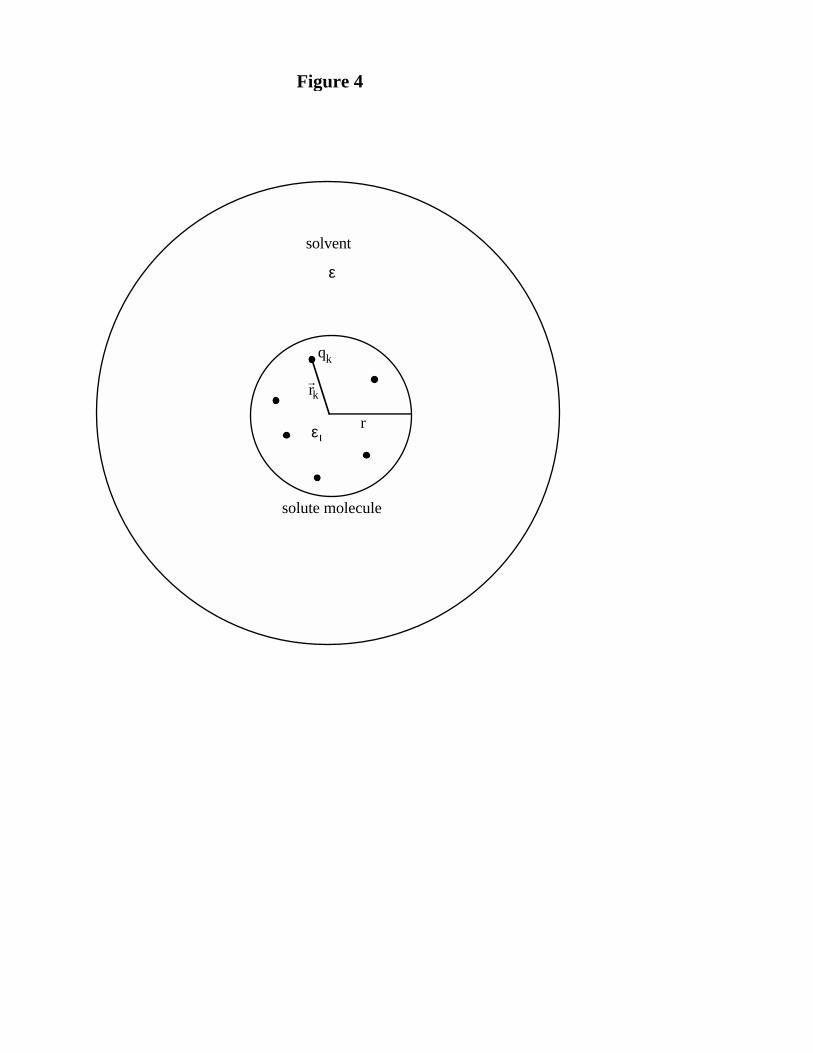
Figure 4
rει
qk
r
r k
solute molecule
solvent
ε
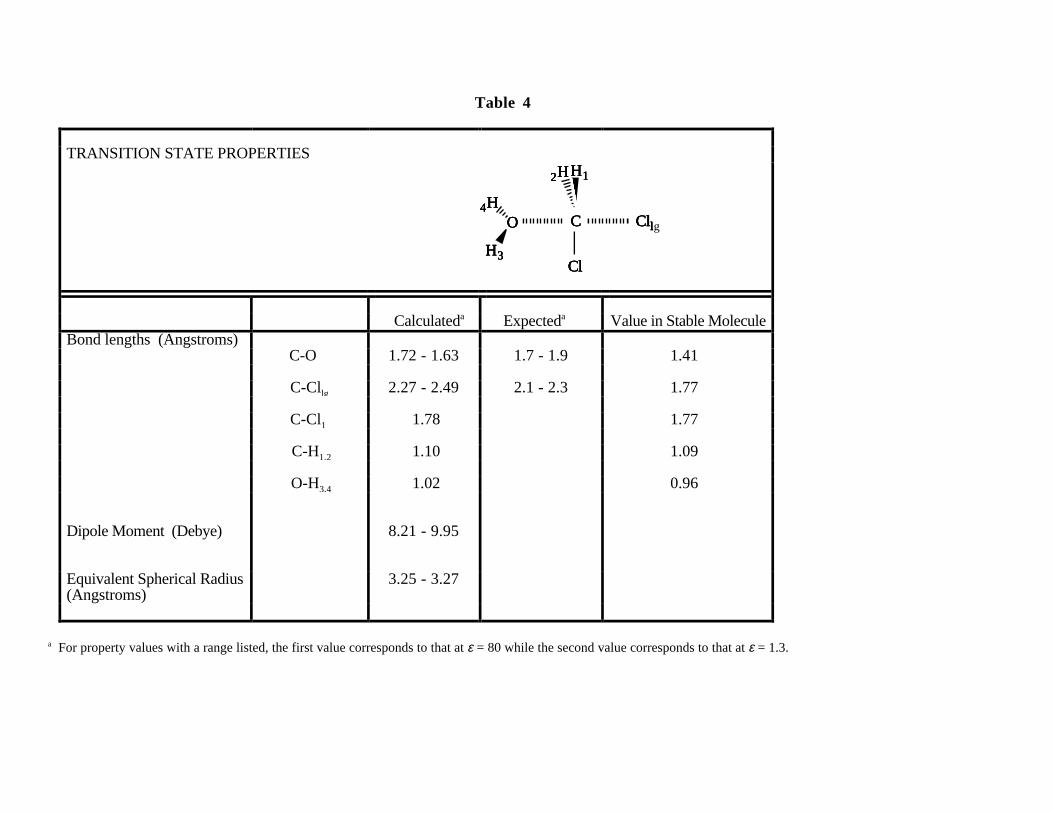
Table 4
TRANSITION STATE PROPERTIES
CO Cll4H
H3Cl
H12H
CO Cll4H
H3Cl
H12H
CO Cll4H
H3Cl
H12H
CO Cllg4H
H3Cl
H12H
Calculateda Expecteda Value in Stable MoleculeBond lengths (Angstroms)
C-O 1.72 - 1.63 1.7 - 1.9 1.41
C-Cllg 2.27 - 2.49 2.1 - 2.3 1.77
C-Cl1 1.78 1.77
C-H1,2 1.10 1.09
O-H3,4 1.02 0.96
Dipole Moment (Debye) 8.21 - 9.95
Equivalent Spherical Radius(Angstroms)
3.25 - 3.27
a For property values with a range listed, the first value corresponds to that at ε = 80 while the second value corresponds to that at ε = 1.3.

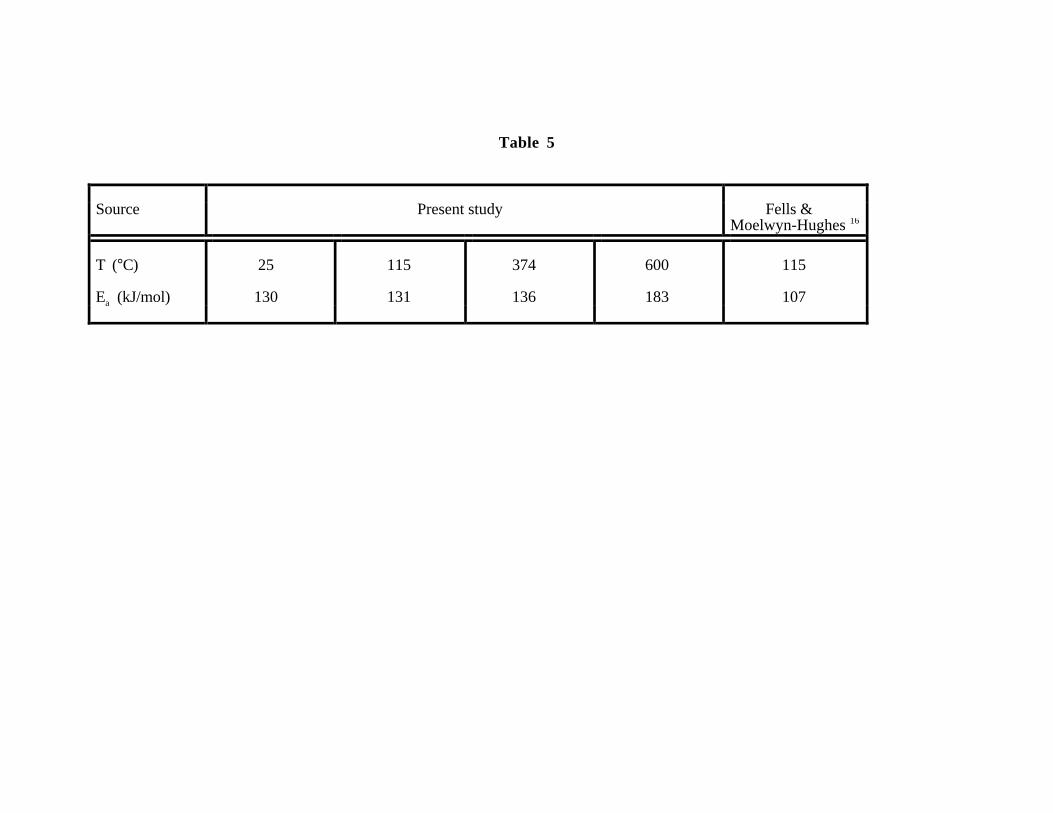
Table 5
Source Present study Fells &Moelwyn-Hughes 16
T (°C) 25 115 374 600 115
Ea (kJ/mol) 130 131 136 183 107

(a)
(b)

Table 6
T (°C) 50 374 550
ε 70.8 10.4 1.4
Φ -0.04 -1.00 -7.48
kFMH / k´ 1.04 2.72 1765 (rate decrease factor)

4.0
5.0
6.0
7.0
8.0
9.0
10.0
11.0
12.0
2.10 1.95 1.80 1.65 1.50 1.35
Figure 7D
ipo
le M
om
en
t (
De
bye
s)
λ (Angstroms)

Table 7
Φ = α0 + α1T + α2T2 + α3T
3 + α4T4+ α5T
5 + α6T6 + α7T
7 + α8T8 + α9T
9
Temperature range (°C)
25 ≤ T < 374 374 ≤ T ≤ 386 386 < T ≤ 525 525 < T ≤ 600
α0 1.3658 x 10⁻¹ 7.2641851 x 10⁴ 1.2294119 x 10⁵ -2.6826 x 101
α1 -1.1319 x 10⁻² -5.8225257 x 10² -1.4212424 x 10³ 1.1691 x 10⁻¹
α2 3.8850 x 10⁻⁴ 1.5556709 x 100 6.3373575 x 100 -2.3416 x 10⁻⁴
α3 -7.9558 x 10⁻⁶ -1.3855168 x 10⁻³ -1.2385424 x 10⁻² 1.5557 x 10⁻⁷
α4 9.4188 x 10⁻⁸ 4.1293324 x 10⁻⁶
α5 -6.7546 x 10⁻¹⁰ 2.3961584 x 10⁻⁸
α6 2.9717 x 10⁻¹² -3.8255570 x 10⁻¹¹
α7 -7.8277 x 10⁻¹⁵ 1.8223581 x 10⁻¹⁴
α8 1.1315 x 10⁻¹⁷
α9 -6.8988 x 10⁻²¹
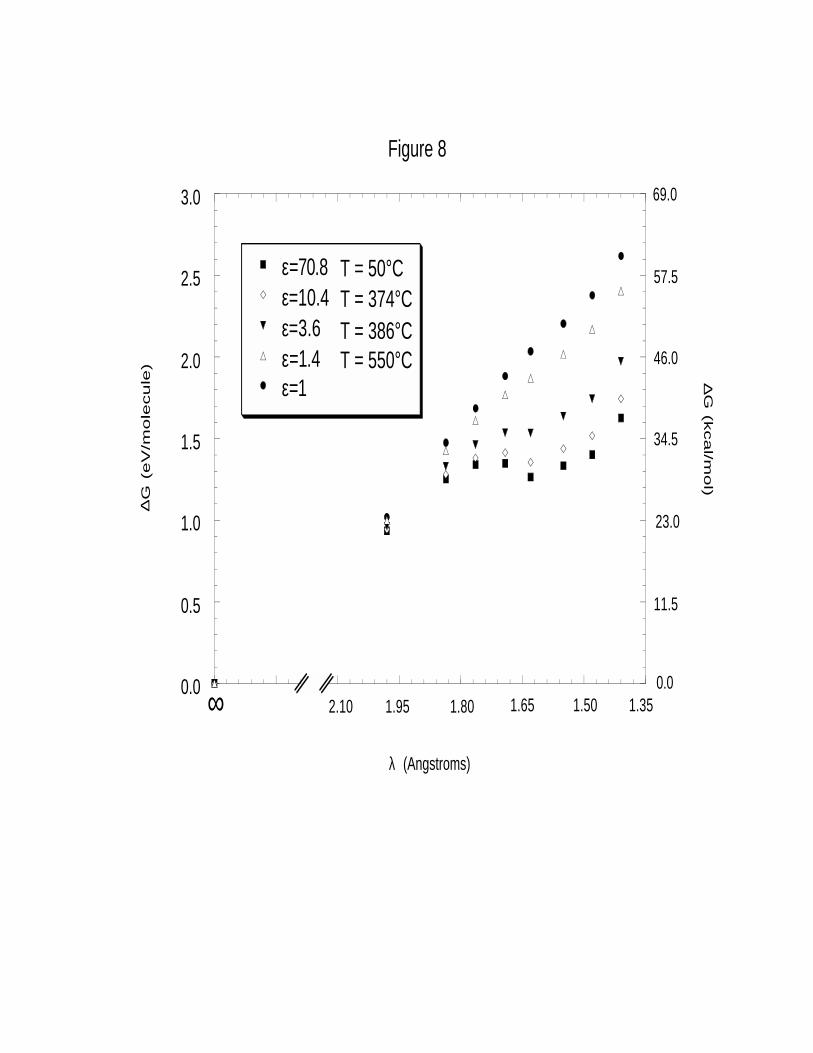
0.0
0.5
1.0
1.5
2.0
2.5
3.0
Figure 8
ε=1
ε=70.8ε=10.4 ε=3.6ε=1.4
1.65
∆G
(e
V/m
ole
cu
le)
1.80 1.50 1.35
λ (Angstroms)
2.10 1.95∞
T = 50°C
T = 550°C
∆G
(kca
l/mo
l)
11.5
23.0
34.5
46.0
57.5
69.0
0.0
T = 386°CT = 374°C
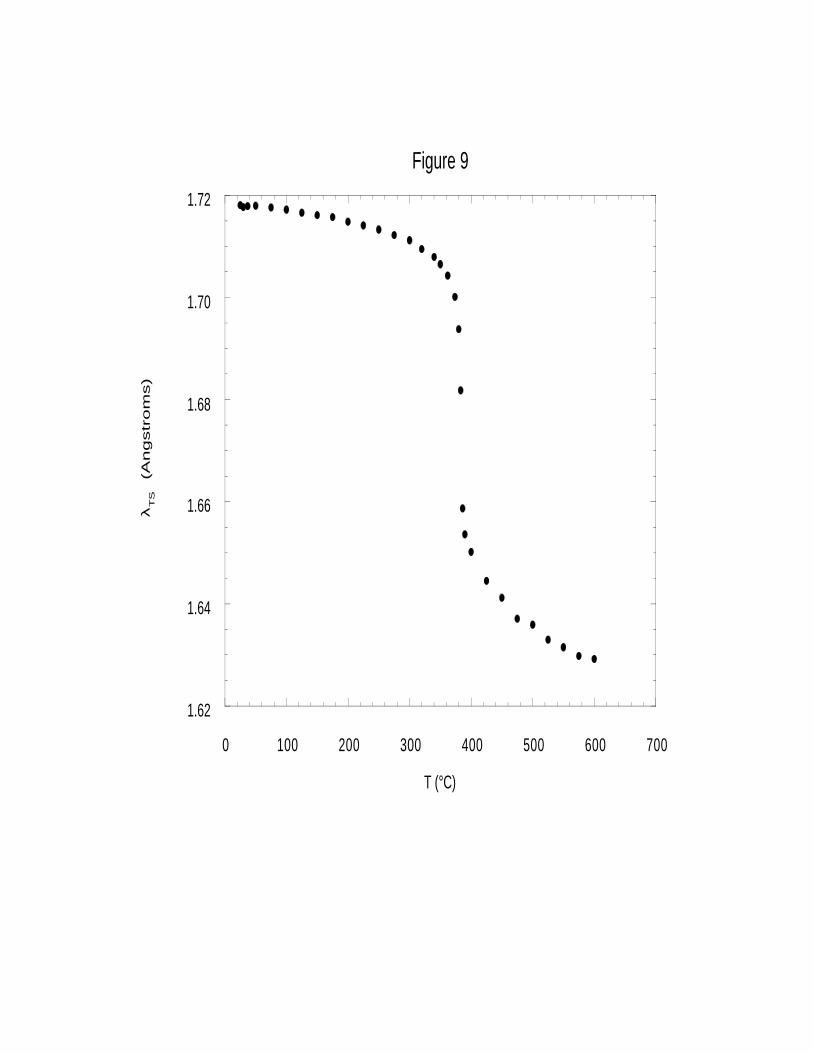
1.62
1.64
1.66
1.68
1.70
1.72
0 100 200 300 400 500 600 700
Figure 9λ
TS
(An
gstr
om
s)
T (°C)
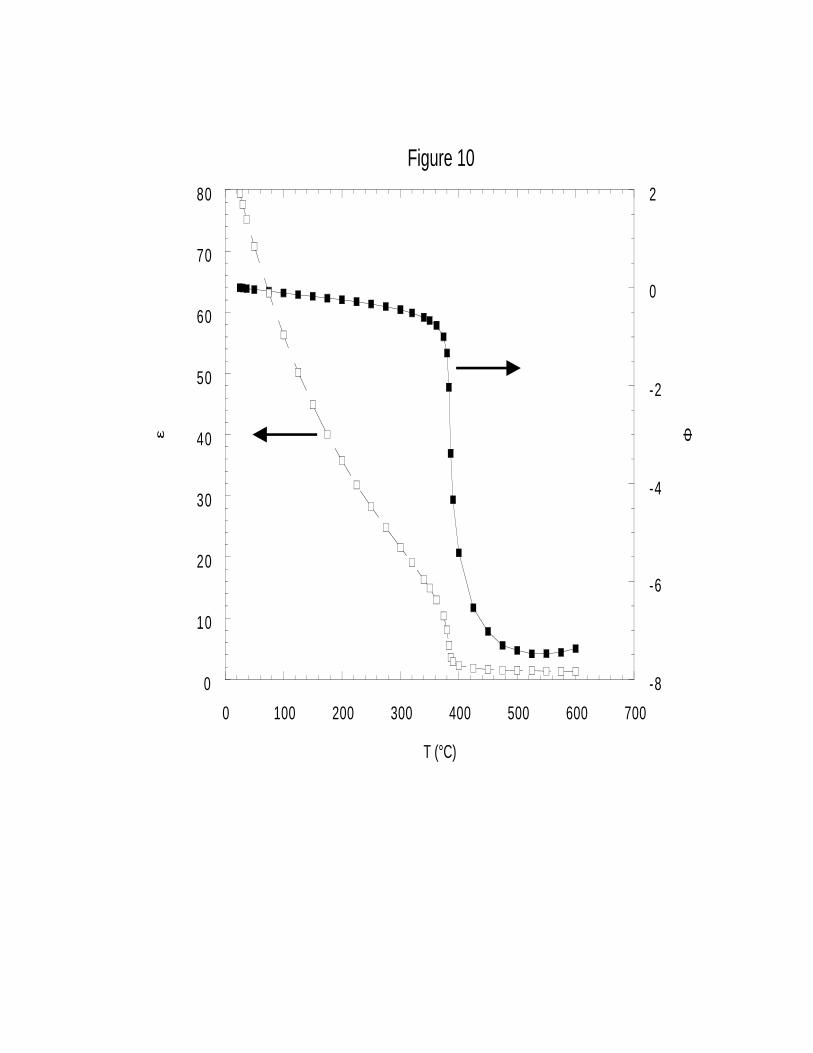
0
10
20
30
40
50
60
70
80
-8
-6
-4
-2
0
2
0 100 200 300 400 500 600 700
Figure 10ε
Φ
T (°C)
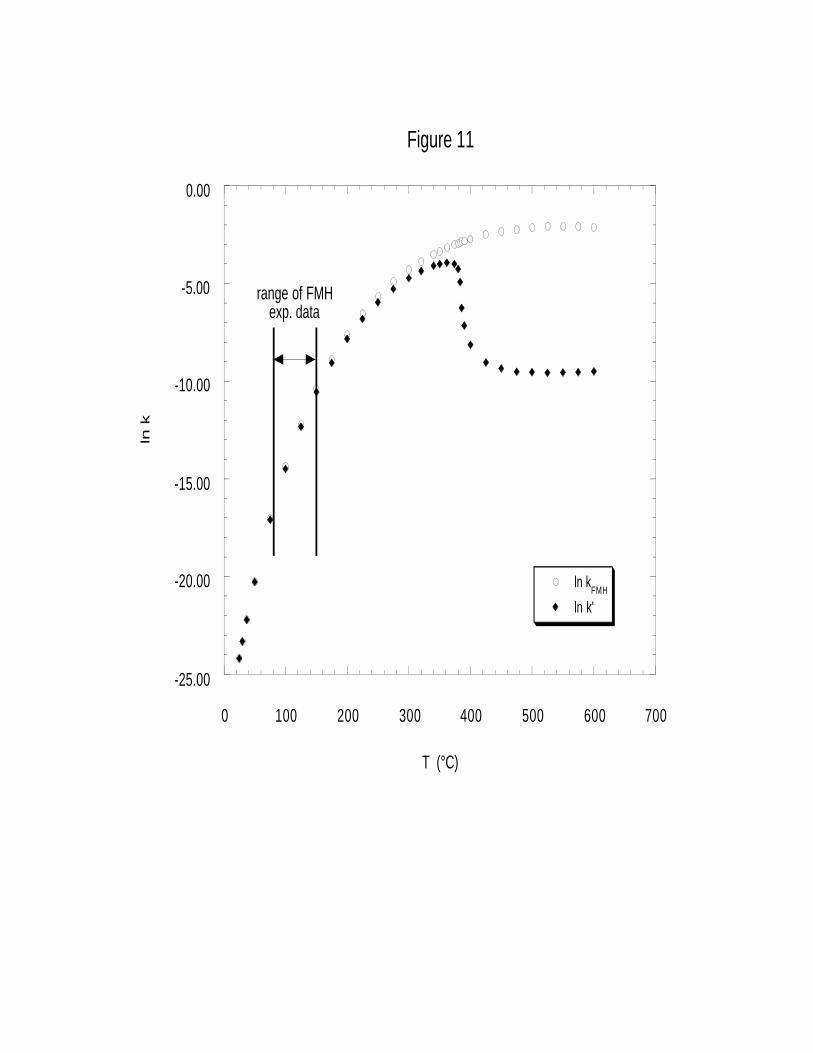
-25.00
-20.00
-15.00
-10.00
-5.00
0.00
0 100 200 300 400 500 600 700
Figure 11
ln kFMH
ln k'
ln k
T (°C)
range of FMHexp. data
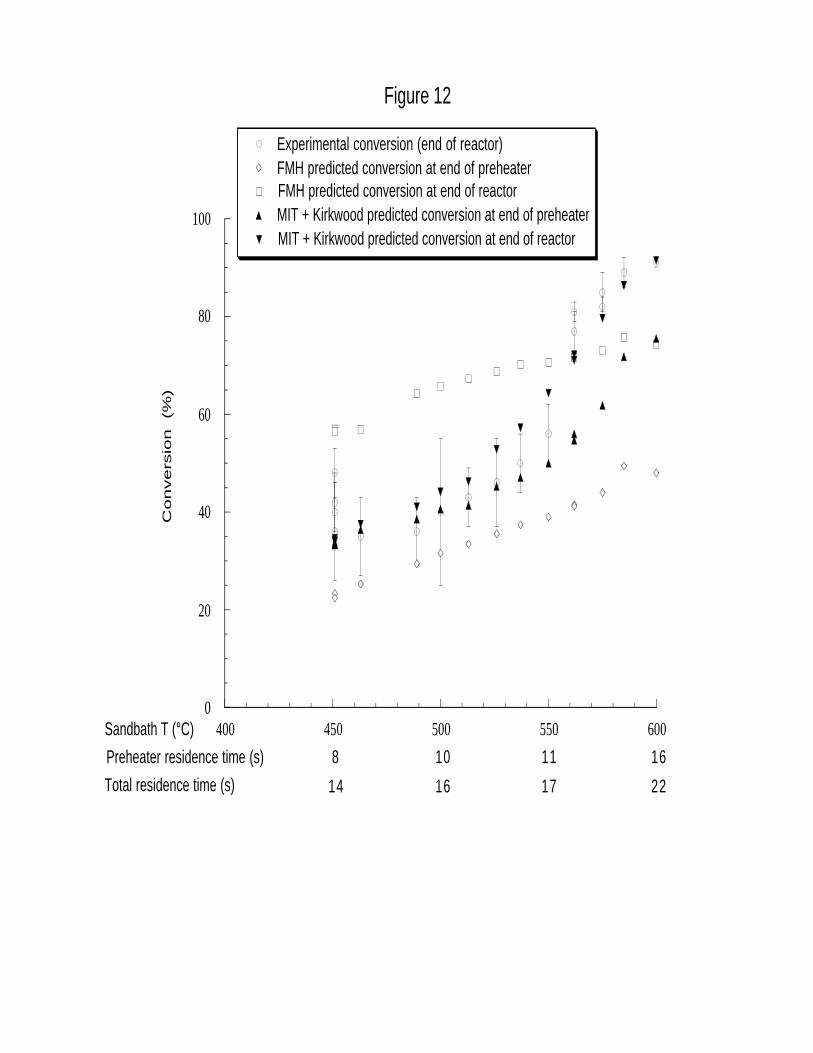
0
20
40
60
80
100
400 450 500 550 600
Experimental conversion (end of reactor)FMH predicted conversion at end of preheaterFMH predicted conversion at end of reactorMIT + Kirkwood predicted conversion at end of preheaterMIT + Kirkwood predicted conversion at end of reactor
Co
nve
rsio
n
(%)
Sandbath T (°C)
Figure 12
Preheater residence time (s)
Total residence time (s)
8
14
10
16
11
17
16
22

0.0
0.2
0.4
0.6
0.8
1.0
0 100 200 300 400 500 600
Predicted conversion vs temperature in preheater
450°C, 6.4 g/min
500°C, 4.5 g/min
550°C, 3.3 g/min
600°C, 2.4 g/min
Co
nve
rsio
n
T (°C)
Sandbath Temperaturesand Mass Flow Rates

0
20
40
60
80
100
400 450 500 550 600
Experimental conversion (end of reactor)FMH predicted conversion at end of preheaterFMH predicted conversion at end of reactorMIT + Kirkwood predicted conversion at end of preheaterMIT + Kirkwood predicted conversion at end of reactor
Co
nve
rsio
n
(%)
Sandbath T (°C)
Figure 14
Preheater residence time (s)
Total residence time (s)
8
14
10
16
11
17
16
22
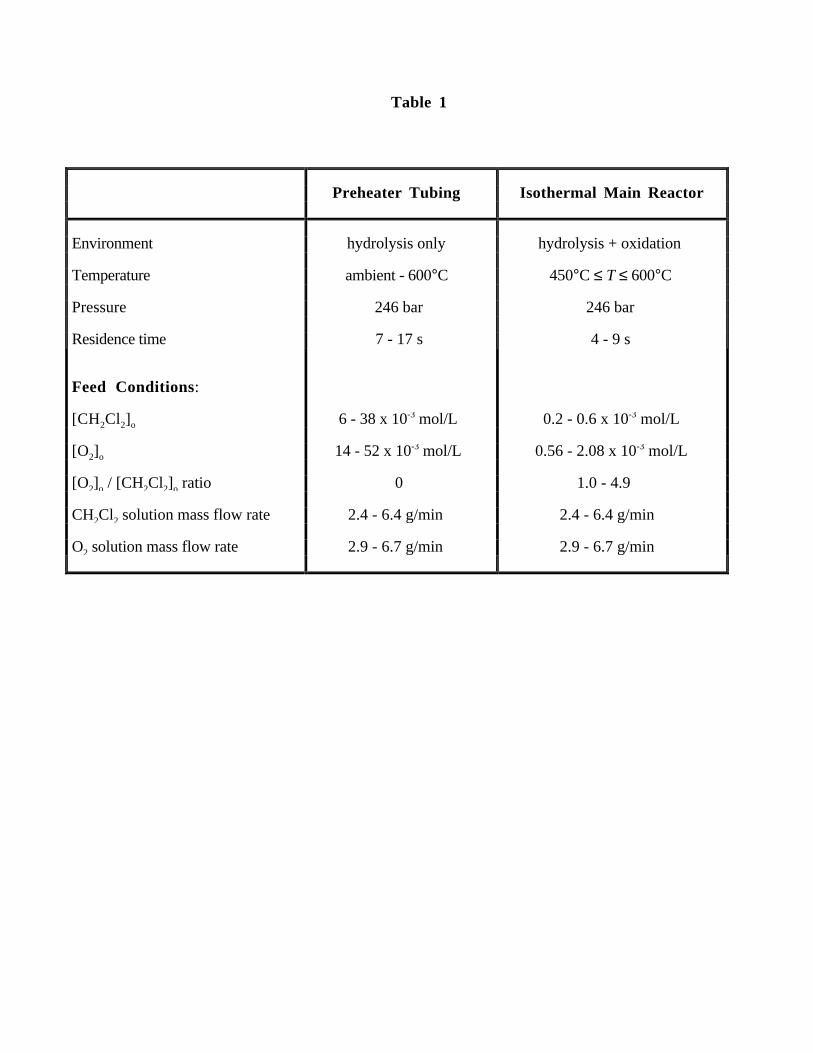
Table 1
Preheater Tubing Isothermal Main Reactor
Environment hydrolysis only hydrolysis + oxidation
Temperature ambient - 600°C 450°C ≤ T ≤ 600°C
Pressure 246 bar 246 bar
Residence time 7 - 17 s 4 - 9 s
Feed Conditions:
[CH2Cl2]o 6 - 38 x 10-3 mol/L 0.2 - 0.6 x 10⁻³ mol/L
[O2]o 14 - 52 x 10-3 mol/L 0.56 - 2.08 x 10⁻³ mol/L
[O2]o / [CH2Cl2]o ratio 0 1.0 - 4.9
CH2Cl2 solution mass flow rate 2.4 - 6.4 g/min 2.4 - 6.4 g/min
O2 solution mass flow rate 2.9 - 6.7 g/min 2.9 - 6.7 g/min

Table 2
SandbathTemperature (°C)
CH2Cl2 Conversion(no reactor)
CH2Cl2 Conversion(with reactor; no O2)
Preheater ResidenceTime (s) b
Main ReactorResidence Time (s) c
450 36±10 % 40±13 % a 8.1 6.0
575 82±2 % 85±4 % 13.2 6.0
a Average of four data pointsb Preheater residence times correspond to fluid temperatures from 25°C up to sandbath temperaturec Main reactor residence times correspond to isothermal fluid temperatures equal to the sandbath temperature
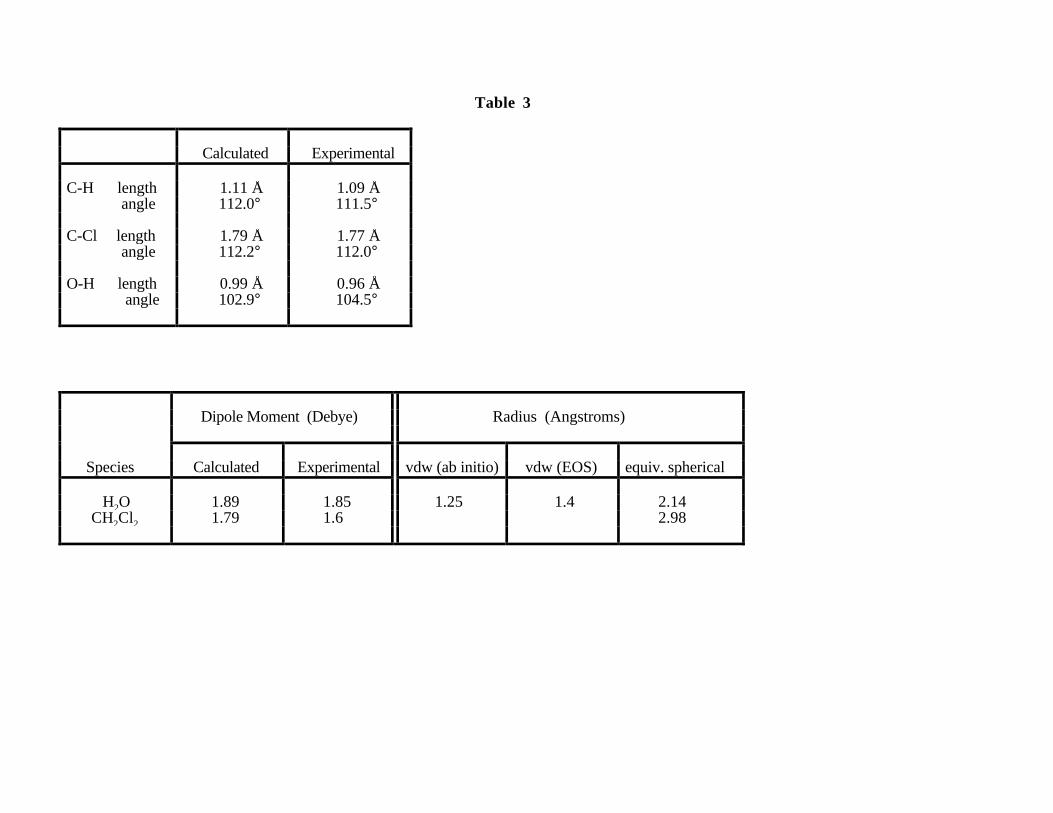
Table 3
Calculated Experimental
C-H length 1.11 Å 1.09 Å angle 112.0° 111.5°
C-Cl length 1.79 Å 1.77 Å angle 112.2° 112.0°
O-H length 0.99 Å 0.96 Å angle 102.9° 104.5°
Dipole Moment (Debye) Radius (Angstroms)
Species Calculated Experimental vdw (ab initio) vdw (EOS) equiv. spherical
H2O 1.89 1.85 1.25 1.4 2.14 CH2Cl2 1.79 1.6 2.98