abayesianmodeltoforecastnewproduct ...bear.warrington.ufl.edu/centers/mks/articles/684541.pdf ·...
TRANSCRIPT

0732-2399/99/1802/0115$05.00Copyright � 1999, Institute for Operations Researchand the Management Sciences
Marketing Science/Vol. 18, No. 2, 1999
pp. 115–136
A Bayesian Model to Forecast New ProductPerformance in Domestic and International
Markets
Ramya Neelamegham • Pradeep ChintaguntaINSEAD, Boulevard de Constance, 77305 Fontainebleau, Cedex, France, [email protected] School of Business, University of Chicago, 1101 E. 58th Street, Chicago, Illinois 60637,
AbstractThis paper attempts to shed light on the following researchquestions: When a firm introduces a new product (or service)how can it effectively use the different information sourcesavailable to generate reliable new product performance fore-casts? How can the firm account for varying informationavailability at different stages of the new product launch andgenerate forecasts at each stage? We address these questionsin the context of the sequential launches of motion picturesin international markets.
Players in the motion picture industry require forecasts atdifferent stages of the movie launch process to aid decision-making, and the information sets available to generate suchforecasts vary at different stages. Despite the importance ofsuch forecasts, the industry struggles to understand and pre-dict sales of new movies in domestic and overseas markets.
We develop a Bayesian modeling framework that predictsfirst-week viewership for new movies in both domestic andseveral international markets. We focus on the first week be-cause industry players involved in international markets(studios, distributors, and exhibitors) are most interested inthese predictions. We draw on existing literature on fore-casting performance of new movies to formulate our model.Specifically, we model the number of viewers of a movie ina given week using a Poisson count data model. The numberof screens, distribution strategy, movie attributes such asgenre, and presence/absence of stars are among the factorsmodeled to influence viewership. We employ a hierarchicalBayes formulation of the Poisson model that allows the de-terminants of viewership to vary across countries. We adoptthe Bayesian approach for two reasons: First, it provides aconvenient framework to model varying assumptions of in-formation availability; specifically, it allows us to make fore-casts by combining different sources of information such asdomestic and international market-specific data. Second, thismethodology provides us with the entire distribution of thenew movie’s performance forecast. Such a predictive distri-bution is more informative than a point estimate and pro-vides a measure of the uncertainty in the forecasts.
We propose a Bayesian prediction procedure that pro-vides viewership forecasts at different stages of the newmovie release process. The methodology provides forecastsunder a number of information availability scenarios. Thus,forecasts can be obtained with just information from a his-torical database containing data on previous new productlaunches in several international markets. As more infor-mation becomes available, the forecasting methodology al-lows us to combine historical information with data on theperformance of the new product in the domestic market andthereby to make forecasts with less uncertainty and greateraccuracy.
Our results indicate that for all the countries in the dataset the number of screens on which a movie is released is themost important influence on viewership. Furthermore, wefind that local distribution improves movie sales internation-ally in contrast to the domestic market. We also find evidenceof similar genre preferences in geographically disparatecountries. We find that the proposed model provides accu-rate forecasts at the movie-country level. Further, the modeloutperforms all the extant models in the marketing literaturethat could potentially be used for making these forecasts. Acomparison of root mean square and mean absolute errorsfor movies in a hold out sample shows that the model thatcombines information available from the different sourcesgenerates the lowest errors. A Bayesian predictive model se-lection criterion corroborates the superior performance ofthis model. We demonstrate that the Bayesian model can becombined with industry rules of thumb to generate cumu-lative box office forecasts.
In summary, this research demonstrates a Bayesian mod-eling framework that allows the use of different informationsources to make new product forecasts in domestic and in-ternational markets. Our results underscore the theme thateach movie is unique as is each country—and viewershipresults from an interaction of the product and the market.Hence, the motion picture industry should use both product-specific and market-specific information to make new movieperformance forecasts.(Hierarchical Bayes; New Products; Motion Pictures; Interna-tional Markets; Forecasting)

A BAYESIAN MODEL TO FORECAST NEW PRODUCT PERFORMANCEIN DOMESTIC AND INTERNATIONAL MARKETS
116 Marketing Science/Vol. 18, No. 2, 1999
1. IntroductionCompanies that operate in global markets typicallylaunch their products in newmarkets in several stages.At each stage in this sequential launch process, salesforecasts serve as critical inputs for a variety of mar-keting decisions. For example, initial forecasts serve asinputs for “go–no-go” decisions, and forecasts madelater in the launch process aid in finalizing marketingmix decisions, formulating competitive strategies, etc.Because new products are launched sequentially in in-ternational markets, increasing amounts of informa-tion become available for generating sales forecasts asone moves from the initial stage to the later stages inthe launch process. Thus, the forecasting challenge ininternational settings is generating a sequence of salespredictions that utilizes increasing amounts of priorinformation available from similar product categoriesand other markets where the new product has beenlaunched.
The U.S. movie industry provides a powerful settingto develop and test a model that combines multipleinformation sources to generate a sequence of fore-casts. Decision makers in the industry are required tomake a series of decisions at different stages of themovie release process. Initially, in the market evaluationstage,movie studios have yet to pick a particularmovieand have not decided whichmarkets to enter. The onlyinformation available at this stage is the performanceof previous movie releases in different markets. Werefer to such data on previous releases as the “histori-cal database.” The historical database can be used togenerate initial base forecasts. After production of a spe-cific movie, decision-makers need sales forecasts in or-der to make market entry and mix decisions. Becausethe attributes of the new movie, such as genre andpresence/absence of major stars, become known at thisstage, they can be combined with the historical data-base to generate an updated forecast. Immediatelyprior to domestic launch of a newmovie, the studios havedetermined the marketing mix for the domestic mar-ket.1 Thus data on marketing mix variables, such asthe number of screens in the domestic market, can be
1Asmovies are typically released simultaneously in theUnited Statesand in Canada, our references to the domestic market include boththese countries.
incorporated to generate a prelaunch forecast for thedomestic market. These forecasts are inputs for mar-keting mix decisions for the entire life cycle of themovie. Post domestic release, forecasts of movie perfor-mance in international markets are required to finalizedecisions such as distribution strategy and releaseschedule in these markets. At this stage, decision mak-ers have an information set that consists of the histori-cal database, movie attributes, and performance of thenew movie in the domestic market. Just prior to the in-ternational launch, the studios have finalized the mar-keting mix variables for international markets for theinitial week. Forecasts of first-week viewership are re-quired to fine-tune strategic decisions, assess compe-tition, and plan marketing activities for future weeks.The information set available to generate this final setof forecasts includes the historical database, newmovie attributes, domestic performance data for thenew movie, and marketing mix information on screensand distributors in international markets. In sum, themotion picture industry requires forecasts at differentstages of themovie launch process to aid decisionmak-ing and needs the information sets available to gener-ate such forecasts vary at different stages.
In this paper, we present a Bayesian modelingframework to forecast new product performance. Weapply our framework and estimation methodology toforecast the performance of U.S. movies released inoverseas markets. To generate the requisite forecasts,we model the determinants of viewership for movies.Specifically, we relate the number of viewers per weekto its determinants using a Poisson regression model(King 1988). The poisson parameter is modeled as afunction of the number of screens (Jones and Ritz1991), number of previous viewers as a proxy for wordof mouth effects (Mahajan et al. 1984), a time trend(Squire 1992), movie attributes such as genre and pres-ence/absence of stars (Sawhney and Eliashberg 1996),and distribution strategy. Because international mar-kets differ significantly in market infrastructure, insti-tutional arrangements, and consumer preferences, weexpect the effects of the above variables to differ acrosscountries. Accordingly, we model the effects of the in-dependent variables as country-specific. In this man-ner, we document interesting cross-countrydifferences
NEELAMEGHAM AND CHINTAGUNTAA Bayesian Model to Forecast New Product Performance
Marketing Science/Vol. 18, No. 2, 1999 117
in the impact of marketing mix variables and movieattributes on movie viewership patterns.
We begin estimating our model using data from thehistorical database. Next, we generate first-week view-ership predictions for movies in a hold-out sample atdifferent stages of the movie launch process describedabove. In particular, we generate first-week forecastsat the post-movie production, pre- and post-domestic-launch, and pre-international-launch stages. We adopta Bayesian prediction procedure that allows us (i) tomake forecasts by combining different sources of in-formation such as domestic and international market-specific data and (ii) to model the uncertainty in sce-narios with less than complete information.Additionally, by employing the Bayesianmethodologywe are able to generate a predictive distribution of thefirst-week viewership of a new movie. Such a predic-tive distribution is more informative than a point es-timate and provides a measure of the uncertainty inthe forecasts (Gelman et al. 1995).2 To evaluate the fore-cast performance of our model, we compare its pre-dictive performance with those of several models inthe extant marketing literature. In addition to gener-ating first-week predictions we demonstrate how ourformal model can be combined with industry rules ofthumb to obtain cumulative viewership forecasts.
Our research contributes to the new products fore-casting literature by developing a hierarchical Bayesmodel to forecast new product performances at differ-ent stages of product launch. In previous research,Lenk and Rao (1990) present a Bayesian model thatuses information from previous product launches tomake new product forecasts. In contrast, we pool in-formation from both previously launched productsand markets. Additionally, we also model the role ofmarketing activity at the level of each country. Rossiet al. (1996) use a Bayesian choice model to assess theinformation content of various information sets avail-able for direct marketing purposes. They focus on thevalue of different information sets in making infer-ences about posterior parameters of individual con-sumers. In contrast, we use different information sets
2We treat the decision of whether or not to release a movie in aparticular country as exogenous and focus on obtaining forecastsonce such a decision has been made.
to generate out of sample forecasts and thereby assessthe value of additional information available to man-agers at different stages of the new product launchprocess.
Our paper also adds to the modeling literature ininternational marketing that has primarily focused onunderstanding variations in intercountry sales diffu-sion patterns (Gatignon et al. 1989, Helson et al. 1993,Putsis et al. 1997). We add to this research bymodelingthe impact of marketing mix variables on product per-formance at the level of each country. Thus, our modeloutputs provide insights at the country level and cantherefore be used to adapt marketing strategy to suiteach country.
Finally, our work also contributes to the growingacademic literature on motion pictures (Jones and Ritz1991, Sawhney and Eliashberg 1996, Eliashberg andShugan 1997, Krider and Weinberg 1998,Neelamegham and Jain 1999). In their study of motionpictures in the U.S. market, Sawhney and Eliashberg(1996) state, “Our attempts to predict revenue patternswithout any sales data meet with limited success.” In thisresearch, we propose a methodology to make first-week viewership forecasts in the domestic and severalinternational markets with no data available on themovie’s performance in these markets. Furthermore,we discuss how our model complements previous re-search (Sawhney and Eliashberg 1996) in generatingmanagerially relevant cumulative box office forecasts.
From a managerial perspective, the domestic and in-ternational box office forecasts of the model shouldbenefit decisionsmade by studios, distributors, and ex-hibitors. The international market for movies accountsfor over half the box-office receipts of the U.S. motionpicture industry and is a growing business area for thisindustry (World Trade 1996). In the past decade, reve-nues from foreign exhibition have doubled making theneed for new product forecasts in each of the overseasmarkets very critical (Variety 1994b). The trade pressand industry experts however, repeatedly emphasizethe lack of a systematic methodology to predict boxoffice performance (Variety 1994a, 1994b). By provid-ing forecasts for new movies at the country level atdifferent stages of the product launch process, our pro-posed Bayesian model can aid all three groups in the

NEELAMEGHAM AND CHINTAGUNTAA Bayesian Model to Forecast New Product Performance
118 Marketing Science/Vol. 18, No. 2, 1999
movie channel, i.e., studios, distributors, and exhibi-tors, in planning and finalizing their marketing activ-ities and negotiating contracts.3
The remainder of the paper is organized as follows.The next section contains a detailed description of thedata used in the analysis. This is followed by the pro-posed Bayesian model and forecasting procedure.Next, we describe the results. Finally, we discuss andconclude with some limitations and future researchdirections.
2. Data SetOur data are obtained from the domestic and overseasbox office receipts reported in Variety Magazine. TheVariety sample is a weekly report of worldwide boxoffice performance covering the top 60 movies in theUnited States and the top 10 movies in internationalmarkets.4 Data reported consist of the box office reve-nue, number of screens showing a film, number ofweeks of the run on any prior release, the rank, thenumber of first-run engagements, and the name ofeach film’s foreign rights holder and local distributor.Our particular sample of data covers the period Janu-ary 1, 1994 to May 26, 1996. We obtained data for 35movies for the United States and for the following 13countries: Australia, Brazil, Canada, France, Germany,Italy, Japan, Mexico, Netherlands, Spain, South Africa,Sweden, and the United Kingdom.5 These 13 countriesrepresent over 80% of overseas box office (Variety1994b). We tracked each film in the sample from itsrelease in the domestic market to its international re-lease and the time that it dropped out from the do-mestic and international charts. We also collected data
3The studios in the United States produce movies and sell rights forforeign territories to distributors. These distributors contact exhibi-tors in different countries and arrange for the theatrical release ofthe movies. While studios and distributors work across many coun-tries, exhibitors are often very fragmented and are more interestedin forecasts for their own country and region as opposed to multi-country box office predictions.4Because of this constraint in data availability, the movies includedin our sample are not representative of all movies introduced in theinternational market. The methodology we employ for generatingfirst-week forecasts, however, can be readily applied to any newmovie.5Data is reported jointly for the United Kingdom and Ireland.
on movie attributes such as genre, presence/absenceof stars, critic reviews, and MPAA ratings from Cine-mania Index (1996).6 (See Table 1.)
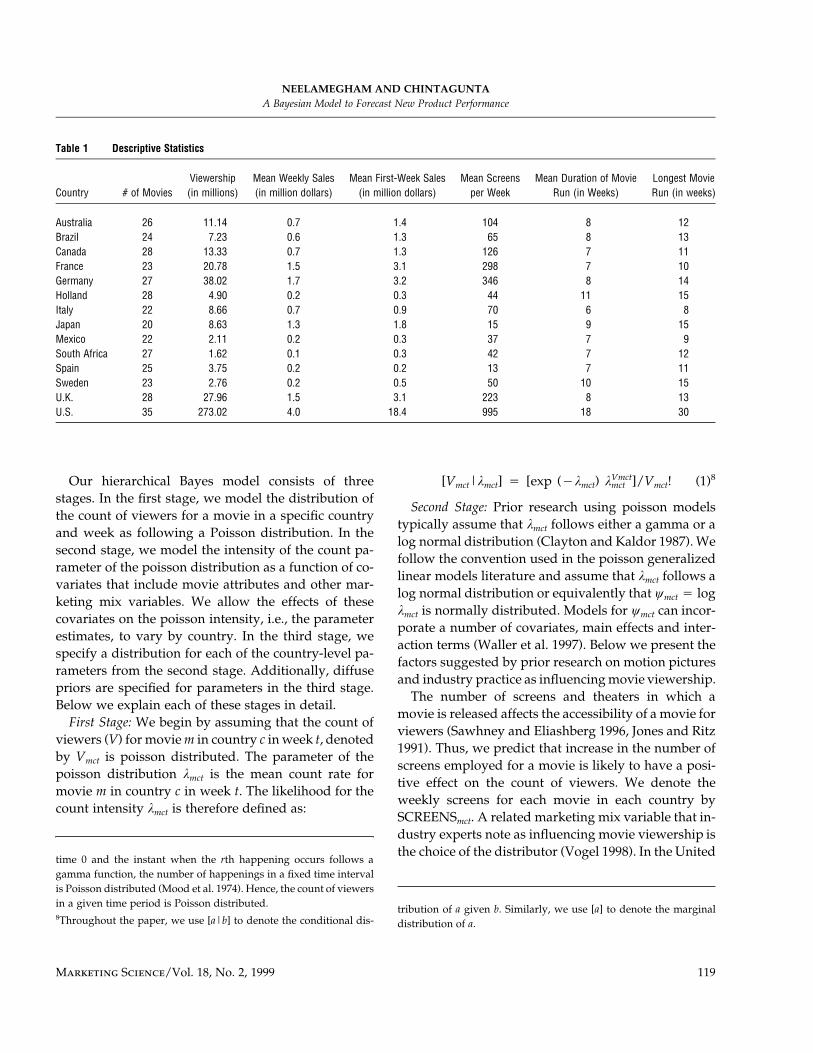
The data set consists of 2,325 weekly observationsthat span 343 unique movie-country pairs. Table 1 pro-vides selected descriptive statistics for the sample. Thesecond column shows the number of movies from thesample released in each of the countries. Whereas 35of the sampledmovies are released in the United Statesand 28 movies in Canada (which constitute the do-mestic market), fewer numbers are released in othercountries. Total movie viewership numbers reveal thatthe United States, United Kingdom, Germany, andFrance are the relatively larger markets. The meanweekly sales in these markets tend to be larger thanthe corresponding numbers in other countries. In mostcountries, the mean first-week viewership is almostdouble the mean weekly viewership, implying that thefirst-week viewership contributes to a significant pro-portion of total viewership. This underscores the im-portance of forecasting first-week viewership.
3. Model DevelopmentThe movie industry tracks weekly sales for eachmoviein several countries. Because the price per ticket for allfirst-run movies is constant across movies within acountry, variation in the number or count of viewersis what drives variation in weekly sales. In this paper,we employ a hierarchical Bayes Poisson regression tomodel the number of viewers per week. Such a modelis consistent with prior literature and conceptualiza-tion of the movie viewership process (Sawhney andEliashberg 1996).7
6The criterion for inclusion of movies in the sample was their “long”runs in a number of countries. Consistent with prior research, weused data from only those countries where the movies had a run ofgreater than four weeks (Jones and Ritz 1991). Furthermore, moviesincluded in the sample made it to the charts in at least two countriesother than in the domestic market for greater than four weeks. Thisenabled us to assess the generalizability of the proposed procedureacross different countries.7Sawhney and Eliashberg (1996) model the time it takes for an in-dividual consumer to adopt a movie and aggregate it to estimate thenumber of people who will view the movie. They obtain the CDFfor the time to adopt for an individual as a Generalized Gammadistribution. It can be proved that when the length of time between
NEELAMEGHAM AND CHINTAGUNTAA Bayesian Model to Forecast New Product Performance
Marketing Science/Vol. 18, No. 2, 1999 119
Table 1 Descriptive Statistics
Country # of MoviesViewership(in millions)
Mean Weekly Sales(in million dollars)
Mean First-Week Sales(in million dollars)
Mean Screensper Week
Mean Duration of MovieRun (in Weeks)
Longest MovieRun (in weeks)
Australia 26 11.14 0.7 1.4 104 8 12Brazil 24 7.23 0.6 1.3 65 8 13Canada 28 13.33 0.7 1.3 126 7 11France 23 20.78 1.5 3.1 298 7 10Germany 27 38.02 1.7 3.2 346 8 14Holland 28 4.90 0.2 0.3 44 11 15Italy 22 8.66 0.7 0.9 70 6 8Japan 20 8.63 1.3 1.8 15 9 15Mexico 22 2.11 0.2 0.3 37 7 9South Africa 27 1.62 0.1 0.3 42 7 12Spain 25 3.75 0.2 0.2 13 7 11Sweden 23 2.76 0.2 0.5 50 10 15U.K. 28 27.96 1.5 3.1 223 8 13U.S. 35 273.02 4.0 18.4 995 18 30
Our hierarchical Bayes model consists of threestages. In the first stage, we model the distribution ofthe count of viewers for a movie in a specific countryand week as following a Poisson distribution. In thesecond stage, we model the intensity of the count pa-rameter of the poisson distribution as a function of co-variates that include movie attributes and other mar-keting mix variables. We allow the effects of thesecovariates on the poisson intensity, i.e., the parameterestimates, to vary by country. In the third stage, wespecify a distribution for each of the country-level pa-rameters from the second stage. Additionally, diffusepriors are specified for parameters in the third stage.Below we explain each of these stages in detail.First Stage: We begin by assuming that the count of
viewers (V) for moviem in country c inweek t, denotedby Vmct is poisson distributed. The parameter of thepoisson distribution kmct is the mean count rate formovie m in country c in week t. The likelihood for thecount intensity kmct is therefore defined as:
time 0 and the instant when the rth happening occurs follows agamma function, the number of happenings in a fixed time intervalis Poisson distributed (Mood et al. 1974). Hence, the count of viewersin a given time period is Poisson distributed.8Throughout the paper, we use [a|b] to denote the conditional dis-
Vmct[V |k ] � [exp (�k ) k ]/V ! (1)8mct mct mct mct mct
Second Stage: Prior research using poisson modelstypically assume that kmct follows either a gamma or alog normal distribution (Clayton and Kaldor 1987). Wefollow the convention used in the poisson generalizedlinear models literature and assume that kmct follows alog normal distribution or equivalently that wmct � logkmct is normally distributed. Models for wmct can incor-porate a number of covariates, main effects and inter-action terms (Waller et al. 1997). Below we present thefactors suggested by prior research on motion picturesand industry practice as influencingmovie viewership.
The number of screens and theaters in which amovie is released affects the accessibility of a movie forviewers (Sawhney and Eliashberg 1996, Jones and Ritz1991). Thus, we predict that increase in the number ofscreens employed for a movie is likely to have a posi-tive effect on the count of viewers. We denote theweekly screens for each movie in each country bySCREENSmct. A related marketing mix variable that in-dustry experts note as influencing movie viewership isthe choice of the distributor (Vogel 1998). In the United
tribution of a given b. Similarly, we use [a] to denote the marginaldistribution of a.

NEELAMEGHAM AND CHINTAGUNTAA Bayesian Model to Forecast New Product Performance
120 Marketing Science/Vol. 18, No. 2, 1999
States, for example, prior work indicates that moviesdistributed by major studios (e.g., Warner Bros, BuenaVista) tend to have higher viewership than movies dis-tributed by independent distributors (Ornstein 1998).If this holds internationally (in France, for example),the international branch of Buena Vista will generatehigher weekly sales for a given movie than an inde-pendent French distributor. To measure the impact ofa major distributor on movie viewership we define adummy variable DISTmc. Specifically, DISTmc � 1when the movie is distributed by an independent dis-tributor and 0 otherwise.
Another factor influencing viewership count for amovie is the number of weeks since the initial release.Studios recognize the decline in size of movie view-ership after the initial release week and closelymonitorthe ‘‘drop off’’ rate for each movie (Squire 1992). Thisdrop off in viewership is a regular phenomenon formovies launched using a wide release strategy. Awiderelease begins with a large simultaneous release of themovie in many theaters and subsequent reduction innumbers of screens. Experts in the motion picture in-dustry concur that films launched internationally tendto be big budget movies launched using the wide re-lease strategy (Zetlin 1993). Thus, we expect to observea drop off for international releases and we measurethis using a trend variable (TRENDmct). This variabletakes the value of the number of weeks the movie hasbeen playing in a particular country since its initial re-lease in that country. We expect TRENDmct to have anegative impact on viewership count.
A critical influence of a movie’s viewership is thenature of word of mouth for the movie (Mahajan et al.1984). The influence of word of mouth on movie adop-tion depends on three factors: valence of word ofmouth (positive/negative/neutral), volume oramount of word of mouth discussion, and persuasive-ness of the word of mouth generated (Mahajan et al.1984, Neelamegham and Jain 1999, Mizerski 1982). Be-cause we do not have access to individual survey datafor each movie in each country, we use cumulativeviewership as a proxy for word of mouth. Cumulativeviewership for week t is measured from the week ofinitial release up to the week preceding week t and isdenoted by CUMVIEWERSmct�1.
Sawhney and Eliashberg (1996) identify a number ofmovie attributes that are relevant for prediction ofmovie viewership in the United States. Given the na-ture of our sample and availability of internationallycomparable data, we include the following movie at-tributes: presence/absence ofmajor stars and the genreof the movie. Following Sawhney and Eliashberg(1996), we use a dummy variable denoted by STARSmto indicate the presence/absence of major stars. Theclassification was based on a list of major stars pos-sessing “marquee value” (Variety 1994b). The genreclassification and definitions are based on genre re-search by Austin and Gordon (1987). We use the Ci-nemania Index (1996) to classify movies in this studyinto THRILLER, ROMANCE, ACTION, DRAMA, andCOMEDY genres. We use a dummy indicator for eachgenre with comedy as the base.
In addition to the systematic influence of the movie-specific variables outlined above, we anticipate thatviewership is likely to be influenced by country-specific idiosyncrasies. In post-mortems of interna-tional movie sales, industry analysts discuss a numberof reasons for movie performance ranging from unfa-vorable weather to national holidays (Variety 1994a).We use country-specific intercepts to capture these un-observed cross-country differences in movie viewer-ship (Allenby and Rossi 1998).
Finally, we hypothesize that product-market inter-actions are an important determinant of product per-formance in international markets. In other words, weexpect the influence of each of the above covariates tovary across markets. Thus, the same number of screensmay have a greater influence in Spain than in SouthAfrica, or the thriller genre may be more appreciatedin Japan than in Canada. Modeling such cross-countryvariations allows us to understand the differences inthe relative impact of different marketing mix vari-ables in each market. We model these variations byspecifying country-specific parameters for each of thecovariates.
Thus, we obtain the following specification for thecount intensity parameter (kmct) in the second stagemodel. Recall that we set log(kmct) to be equal to wmct.Accordingly, we obtain:
NEELAMEGHAM AND CHINTAGUNTAA Bayesian Model to Forecast New Product Performance
Marketing Science/Vol. 18, No. 2, 1999 121
w � � � b ln(SCREENS ) � c (DIST )mct c 1c mct 1c mc
� b (TREND ) � b ln(CUMVIEWERS )2c mct 3c mct�1
� c (STARS ) � c (THRILLER ) � c (ACTION )2c m 3c m 4c m
� c (ROMANCE ) � c (DRAMA ), (2)5c m 6c m
where �c is the country-specific intercept;
b1c, b2c, b3c are the country-specific parameters forSCREENS, TREND and CUMVIEWERS, respectively;c1c, c2c, c3c, c4c, c5c, c6c are the country-specific param-
eters for DIST, STARS, THRILLER, ACTION, RO-MANCE, and DRAMA, respectively.
Note that we use b for parameters associated with co-variates that vary across movies, countries, and time.The c parameters are for covariates that vary at themovie or the movie-country level alone.Third Stage: To complete the Bayesian model speci-
fication, it is necessary to incorporate variability in theparameters in Equation (2) above by specifying distri-butions for them. Following previous Bayesian analy-sis of Poisson-log link models (see for example, Ghoshet al. 1998), we assume that the parameters for the in-tercept and covariates are mutually independent. Fur-thermore, we specify the country-specific intercept tobe drawn from a normal distribution with mean 0 andvariance , i.e., �c � N (0, ). provides us with a2 2 2r r r� � �
measure of the dispersion of the unobserved hetero-geneity across countries. We specify the other country-specific parameters as being normally and indepen-dently distributed. The country-specific parametersare thus distributed as follows:
ind 2b � N (l , r ), j � 1, 2, 3,jc bj bj
ind 2c � N (l , r ), i � 1, 2,. . ., 6. (3)ic ci ci
The above means and variances provide us insights onthe relative effects of the covariates included in thismodel across countries. For example, lb1 represents themean effect of SCREENS across all countries and 2rb1provides a measure of the cross-country dispersion ofthe effects of screens. In the following discussion, forthe sake of brevity, we define bc � {b1c, b2c, b3c}, cc �
{c1c, c2c, c3c, c4c, c5c, c6c}, lb � (lb1, lb2, lb3) and lc � (lc1,lc2, lc3, lc4, lc5, lc6) and � ( ) and �2 2 2 2 2r r , r , r rb b1 b2 b3 c
( ).2 2 2 2 2 2r , r , r , r , r , rc1 c2 c3 c4 c5 c6
Next, we specify noninformative (but proper) dis-tributions for the set of hyperpriors lb, lc, , and2 2r , r� b
. We assume a diffuse normal prior for each element2rcof lb and lc. In case of the variance terms , and2 2r , r� b
, we follow the convention of specifying a gamma2rcprior for the inverse of the variance of each parameter.For example, let the inverse of the variance (precision)of be sb1. A conjugate gamma distribution Ga(a,b)2rb1is specified for sb1.
In summary, the three stages of the hierarchicalmodel specified above, give us the following series ofconditional distributions:
Stage 1 V |k , (4a)mct mct
Stage 2 k |� , b , c , movie- andmct c c c
country-specific covariates, (4b)
2Stage 3 � |wc �
2b |l , rc b b
2c |l r . (4c)c c c
Diffuse priors are specified for the hyperparameters inthe third stage.
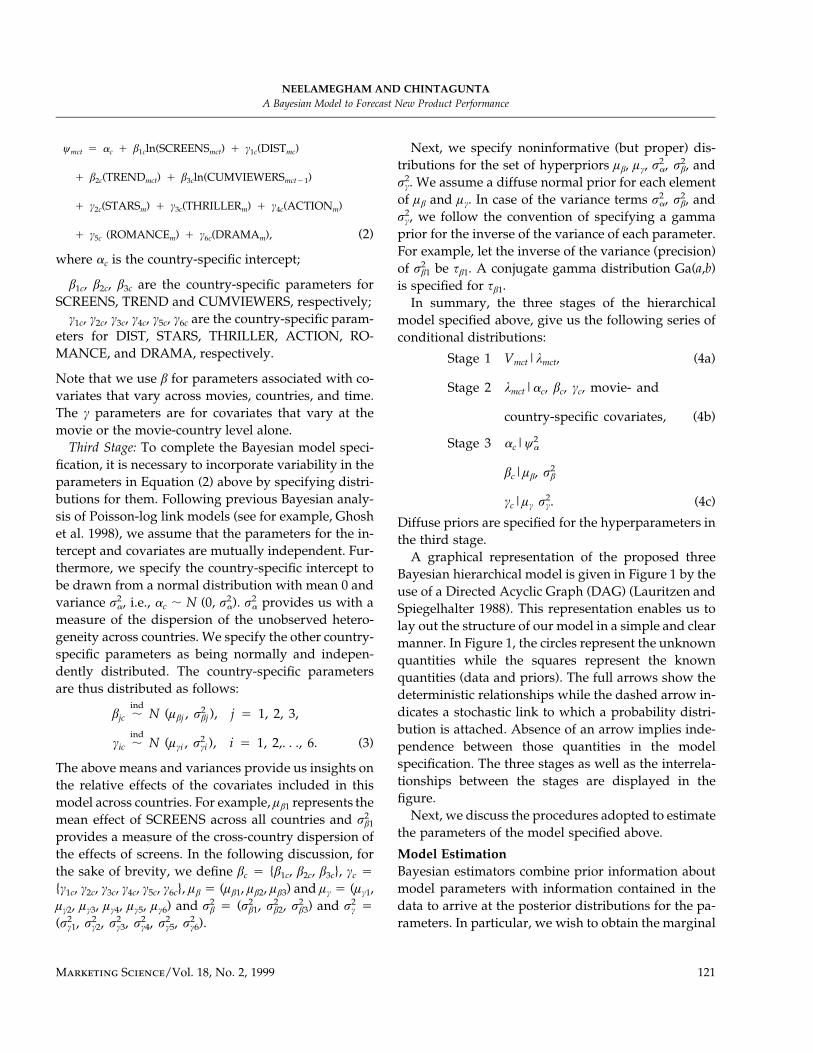
A graphical representation of the proposed threeBayesian hierarchical model is given in Figure 1 by theuse of a Directed Acyclic Graph (DAG) (Lauritzen andSpiegelhalter 1988). This representation enables us tolay out the structure of our model in a simple and clearmanner. In Figure 1, the circles represent the unknownquantities while the squares represent the knownquantities (data and priors). The full arrows show thedeterministic relationships while the dashed arrow in-dicates a stochastic link to which a probability distri-bution is attached. Absence of an arrow implies inde-pendence between those quantities in the modelspecification. The three stages as well as the interrela-tionships between the stages are displayed in thefigure.
Next, we discuss the procedures adopted to estimatethe parameters of the model specified above.
Model EstimationBayesian estimators combine prior information aboutmodel parameters with information contained in thedata to arrive at the posterior distributions for the pa-rameters. In particular, we wish to obtain the marginal

NEELAMEGHAM AND CHINTAGUNTAA Bayesian Model to Forecast New Product Performance
122 Marketing Science/Vol. 18, No. 2, 1999
Figure 1 Model Specification
posterior distributions of the model parameters. How-ever, obtaining the marginal posteriors for parametersof interest in hierarchical Bayesian models such as theone proposed above is complicated by the intractabil-ity of these distributions.
Recent advances in statistics known as MarkovChain Monte Carlo methods permit samples to bedrawn from the joint posteriors of the parameters andthereby from the marginal posteriors. The key ideahere is to sample each parameter in turn from its dis-tribution conditional upon data and current values ofall other parameters (its full conditional distribution).Gibbs sampling thus expoits the hierarchical nature ofthe model to estimate the parameters (Tanner andWong 1989, Gelfand and Smith 1990; for marketing ap-plications see Allenby and Ginter 1995, Lenk et al.1996, Rossi et al. 1996).
We fit the proposedmodel via Gibbs sampling usingBUGS (Spiegelhuter et al. 1995), aided by the CODA S� function (Best et al. 1995) for assessing convergenceand computing posterior summaries. BUGS uses S-likesyntax, for specifying fairly complex hierarchical mod-els (Ghosh et al. 1998). The program converts this syn-tax into a directed acyclic graph (see Figure 1). The
nodes of the graph correspond to the complete condi-tional distributions necessary for the Gibbs algorithm.See Gilks et al. (1996) for details and examples of mod-els estimated using the BUGS syntax.
In our model estimationwe ran five parallel, initiallyoverdispersed MCMC chains. Convergence of theGibbs sampler was assessed according to three criteria.First, we graphically monitored the chains and plottedthe traces from each chain for each parameter as aseparate time series. Second, we calculated sample au-tocorrelations. Third, we monitored the Gelman andRubin (1992) diagnostic measure. This measure isbased on a comparison of within and between chainvariances for each variable. These criteria enabled usto detect the iteration at which an acceptable degree ofconvergence is achieved. A large number of iterationsafter the convergence were used to generate parameterestimates and standard deviations. As a byproduct ofthe Gibbs sampling procedure we obtain the distribu-tion of the posterior coefficients. In the following, wediscuss the use of the distribution of these posteriorparameters (wmct, �c, bc, cc, , lb, lc, ) to make2 2 2r r , r� b c
first-week predictions for new movies in domestic andinternational markets.

NEELAMEGHAM AND CHINTAGUNTAA Bayesian Model to Forecast New Product Performance
Marketing Science/Vol. 18, No. 2, 1999 123
Prediction ProcedureBelow we describe the procedure used for predictingthe first-week performance of movies in a hold-outsample. For a certain country, c, suppose Vmct denotesthe unobserved first week viewership of a new movie(m�). We follow Bayesian modeling convention(Gelman et al. 1995) and use the observed data (forexample, performance of previous movie releases) andposterior parameters obtained from our model esti-mation to make inferences about Vmct. Recall fromEquation (1) that movie viewership (Vmct) is assumedto follow a Poisson distribution with an intensity pa-rameter kmct. Hence, we can obtain the distribution ofVm�ct conditional on the observed data and the modelparameter km�ct (i.e., the posterior predictive distribu-tion of Vm�ct) as:
p(V |Data) � p(V |k )p(k |Data)dk . (5)m�ct m�ct m�ct m�ct m�ct�The first of the two factors in the integral is just the
poisson distribution for the future observation giventhe value of km�ct (Equation (1)). The second factor isthe posterior distribution of km�ct given the observeddata. The posterior predictive distribution of Vm�ct canthus be thought of as an average of the conditionalpredictions over the posterior distribution of k. Thekey challenge in generating forecasts of viewership isdetermining the predictive distribution of k (i.e.p(km�ct|Data)). Once p(km�ct|Data) is obtained, the dis-tribution of Vm�ct can be generated using the relationspecified in Equation (1).
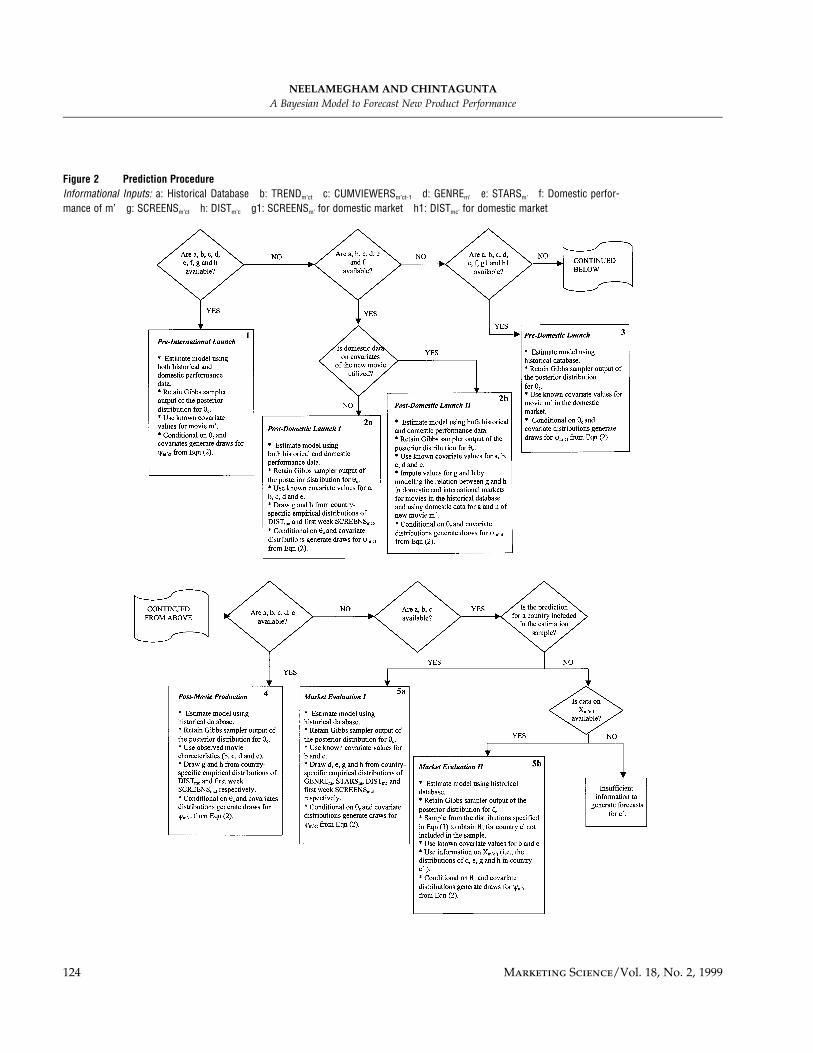
We now discuss how to obtain p (km�ct|Data) at dif-ferent stages of new movie launch process. Figure 2presents (a) the different stages in the movie launchprocess and the nature of information available at eachstage, and (b) how it is possible to use such informationto infer the distribution of p(wm�ct|data) where wm�ct �
log km�ct. In Figure 2, we present differences in the ex-tent of movie-specific covariate information (denotedby b, c, d, e, g, h, gl, and hl) and data (denoted by a andf ) available to estimate posterior parameters at differ-ent stages of the movie launch process. We derive be-low the predictive distributions for wm�ct at each stagein the movie launch process, beginning with the initialstage with the least amount of information. We usethese predictive distributions to generate new movie
first-week forecasts following the computational stepslaid out in panels 1 to 5 in the bottom half of Figure 2.
(a) Market Evaluation: This is the beginning of thedecision process for movie releases. Base forecasts ofaverage movie performances in different markets arenecessary to make market prioritization decisions. Atthis stage, the forecaster has access to information inthe “historical database,” i.e., the performances of pre-vious releases in the different markets contained in oursample. Because we are interested in the first weekforecast, the value for TRENDm�ct is one, and the valuefor CUMVIEWERSm�ct-t is zero because there are noprevious viewers.
Let Xm�ct denote the set all unknown covariates forthe new movie, h denote the set of country-specific pa-rameters, and f denote the set of hyperparameters.Thus Xm�ct � {SCREENSm�ct, DISTm�c, GENREm�,STARSm�}, h � {�c, bc, cc}, f � { , lb, , lc, }. If we2 2 2r r r� b c
knew the exact values of both Xm�ct and h we could usethe relation in Equation (2) to obtain the distributionof wm�ct. However, we do not know the exact values ofthe covariates. Hence, we must integrate out Xm�ct us-ing a distribution of Xm�ct that represents our beliefsabout the likely values of Xm�ct, i.e.,
p(w |h, f) � p(w |h,f, X )p(X )dX . (6)m�ct m�ct m�ct m�ct m�ct�In the absence of any other information, we use the
empirical distribution of the covariates from the his-torical database to generate random draws of Xm�ct
(Rossi et al. 1996). We use the empirical distribution offirst-week screens for country c and generate randomdraws from this distribution to obtain SCREENSm�ct.9
Similarly, we draw from the country-specific empiricaldistributions for movie characteristics (DISTm�c GEN-RESm�, and STARSm�).
Additionally, we also need to account for uncer-tainty in our knowledge of h. The nature of uncertaintyabout h depends upon the type of prediction we wishto make. If we wish to make a prediction for a countryalready included in our sample (for example, France),
9We use country-specific empirical distributions for screens becauseof the large variations in market infrastructure across the countries.Furthermore, because there is a significant difference in the numberof screens in the first and subsequent weeks, we use first-week screensdata for generating draws to be used in first-week predictions.
NEELAMEGHAM AND CHINTAGUNTAA Bayesian Model to Forecast New Product Performance
124 Marketing Science/Vol. 18, No. 2, 1999
Figure 2 Prediction ProcedureInformational Inputs: a: Historical Database b: TRENDm’ct c: CUMVIEWERSm’ct-1 d: GENREm’ e: STARSm’ f: Domestic perfor-mance of m’ g: SCREENSm’ct h: DISTm’c g1: SCREENSm’ for domestic market h1: DISTmc’ for domestic market

NEELAMEGHAM AND CHINTAGUNTAA Bayesian Model to Forecast New Product Performance
Marketing Science/Vol. 18, No. 2, 1999 125
it is reasonable to use the posterior distribution of h forthat particular country (e.g., hFRANCE) in making ourpredictions. Thus, we obtain the predictive distribu-tion for wm�ct based on observed historical data to be:
p(w |Historical Data) � p(w |h, f, X )m�ct m�ct m�ct���p(h, f|Historical Data)p(X )dhdfdX . (7)m�ct m�ct
The steps required to compute the integrals in Equa-tion (7) are specified in Panel 5a of Figure 2. To makepredictions for countries not included in our sample(for example, South Korea) we need to infer thecountry-specific parameters based on the distributionfor the hyper parameters (i.e., f). Thus, we can accountfor our lack of specific knowledge of South Korean pa-rameters. Let h� denote the posterior parameters for acountry c� not included in our estimation sample. Thepredictive distribution for wm�ct given historical datafor the countries in the sample and information on thecovariate distribution in c� is given by:
p(w |Data) � p(w |h�, f, X )p(h�|f)m�c�t m�c�t m�c�t���p(f|Hist. Data)p(X )dh�dfdX . (8)m�c�t m�c�t
Panel 5b in Figure 2 specifies the steps required tocompute the integral in (8). Because of the paucity ofreadily available data on Xm�c�t we do not present em-pirical results for countries not included in our sample.
(b) Post-Movie-Production: At this stage of the de-cision process, the information set expands to includethe movie characteristics (i.e., genre and absence/pres-ence of stars). The movie has however not beenlaunched in any market and the managers require pre-launch forecasts for both domestic and internationalmarkets.
We generate forecasts for the international marketsat the post movie-production stage by conditioningour inferences about wm�ct on the observed movie char-acteristics. Let Mm� denote the known movie charac-teristics (TRENDm�ct � 1, CUMVIEWERm�ct-l � 0,STARSm�, GENREm�) and Dm�ct denote the unobservedDISTm�c and SCREENSm�ct. In contrast to the market-evaluation stage, in the post-movie-production stage,we only average over the empirical distributions forSCREENSm�ct and DISTm�c and not all the other covar-iates. Hence we obtain the distribution of wm�ct to be:
p(w |Hist.Data) � p(w |h,f, M , D )m�ct m�ct m� m�ct���p(h, f|Historical Data)p(D )dhdfdD . (9)m�ct m�ct
To generate forecasts for international markets, weuse the country-specific empirical distributions to ob-tain random draws from SCREENSm�ct andDISTm�c.Weuse these draws, observed movie characteristics, andproceed as per steps described in Panel 4 of Figure 2.
(c) Pre-Domestic-Launch: New movies are typicallyfirst launched in the domestic markets (United Statesand Canada). Prelaunch forecasts in the domestic mar-kets are required to plan marketing activity over themovie’s life cycle and make decisions regarding theinternational launch (Sawhney and Eliashberg 1996).In addition to information from the historical databaseand movie characteristics, information on the distri-bution strategy (DISTm�c) and SCREENSm�ct for the do-mestic market is typically available to make pre-domestic-launch launch forecasts (Squire 1992). Thus,we have access to all the information in movie-specificcovariates for the domestic markets. Hence, we obtainthe distribution of wm� for the domestic market (theUnited States) to be as follows:
p(w |Historical Data, X ) � p(wm�USAt m�USA mUSAt��|X , h, f)p(h, f|Historical Data)dhdf. (10)m�USAt
To compute the above integral and generate the pre-domestic-launch forecasts, we follow steps delineatedin Panel 3 of Figure 2.
(d) Post-Domestic-Launch I and II: Once the movieis released in the domestic market, forecasts in inter-national markets are required to finalize marketingmix decisions in each market. The information set atthis stage expands to include domestic performancedata for the new movie. At this stage, therefore, weaugment the data in the historical data set with dataon the new movie’s domestic performance. Estimationof the proposed model with this new data set providesus with a distribution of posterior parameters.
We use two methods to generate the distribution ofcovariates for which the values are unknown(SCREENSm�ct and DISTm�c). Forecasts from the Post-Domestic-Launch I model are obtained by using thecountry-specific empirical distributions of

NEELAMEGHAM AND CHINTAGUNTAA Bayesian Model to Forecast New Product Performance
126 Marketing Science/Vol. 18, No. 2, 1999
SCREENSm�ct and DISTm�c along with the observedmovie characteristics as covariates. Panel 2a describesthe steps in the prediction procedure for this model.
We also generate forecasts from a model called Post-Domestic-Launch IImodel that utilizes the observed do-mestic data on SCREENSm�ct and DISTm�c. Specifically,we generate these forecasts by treating the lack of in-formation on SCREENS and DIST in the internationalmarkets as a missing data problem (Gelman et al.1995). To impute values for this “missing” data (i.e.,SCREENS and DIST in international markets), wemodel the relation between the SCREENS and DIST inthe domestic and international markets for movies inthe historical database. First, we calculate the ratio ofthe SCREENS in each of the international markets tothe SCREENS in the domestic market. We also calcu-late the number of times there was a match in the dis-tribution strategy used in the domestic market andeach of the international markets. Making these cal-culations for each country and movie in the historicaldatabase provides us with a distribution of theSCREENS proportions and DIST matches for each in-ternational market. For example, the averageSCREENS proportion in Germany is 1.17 and 78% ofthe time there is a match in the DIST variable in thedomestic and German market.
Next, wemultiply the country-specific empirical dis-tributions of SCREENS proportions and DIST matcheswith the number of SCREENS and DIST in the domes-tic market for the new movie. This provides us with adistribution for SCREENS and DIST for each interna-tional market. Thus, if the number of screens for thenew movie is 93 in the domestic market, the averageof the distribution of SCREENS for Germany for thenew movie is 93*1.17 � 109 screens. We use these dis-tributions for SCREENSm�ct and DISTm�c and generatefirst-week viewership forecasts following the stepsoutlined in Panel 2b of Figure 2.
(e) Pre-International-Launch: Managers requirefirst-week international market forecasts at this stageto fine-tune strategic decisions, assess competition, andplan marketing activities for future weeks. At thisstage, the decisions regarding market choice and num-ber of screens for release have already been finalizedfor each of the international markets. Hence, exact val-ues for all the covariates are available, as well as both
the historical database and domestic market data. Weestimate the proposed model with a data set that con-sists of both the historical and domestic new movieperformance data, and we obtain the distribution ofposterior parameters. These are used along with theexact covariate values to generate wm�ct (Figure 2, Panel1).
In summary, first-week viewership forecasts are re-quired for managerial decisions in all five stages. Theinformation available increases as we move from stage(a) to stage (e), and the methodology we have de-scribed above allows us to make predictions while ac-counting for the varying information availability. Inthe empirical section, we make predictions for newmovies in all five stages and compare the relative valueof additional information at each stage.
4. ResultsIn this section, we first discuss the substantive resultswe obtain from our model estimation. Next, we assessthe fit of our model by conducting in-sample modelcomparisons and presenting first-week forecasts forhold-out sample generated with different informationsets. Finally, we illustrate how the model outputs canbe combined with industry rules of thumb to generatemanagerially relevant forecasts.
Model EstimationTables 2 and 3 report descriptive statistics of the pos-terior coefficients for the proposed model. In Table 2,we summarize the posterior distributions of the third-stage parameters of the model by reporting theirmeans, standard deviations, and percentiles. Recallthat these parameters measure the impact of the in-dependent variables on viewership and are estimatedby pooling the data across countries (see Equation (3)).The posterior mean for coefficient SCREENS (lb1)equals 1.65 and is almost nine standard deviationsgreater than zero. Jones and Ritz (1991) present evi-dence that retailer’s adoption of screens is an impor-tant determinant of movie viewership in the U.S. mar-ket. Our findings confirm this result and suggest thatthe critical importance of screens for movie viewershipextends to international markets. Consistent with ourexpectations we find that the posterior mean forTREND is negative and statistically significant. We

NEELAMEGHAM AND CHINTAGUNTAA Bayesian Model to Forecast New Product Performance
Marketing Science/Vol. 18, No. 2, 1999 127
Table 2 Proposed Model Stage 3 Parameter Estimates
Estimated Posterior Summaries
Stage 2 Parameter Stage 3 Parameter Mean SD Mean/SD Percentiles (2.5, 97.5)
Country-Specific Intercept Precision (sa) 0.06 0.02 3.000 (0.03, 0.11)Screens Mean (lb1) 1.65 0.19 8.658 (1.270, 2.04)
Precision (sb1) 2.48 0.98 2.542 (0.968, 4.78)Trend Mean (lb2) �0.63 0.06 �10.376 (�0.755, �0.513)
Precision (sb2) 24.30 10.23 2.375 (8.64, 47.4)Cumulative Viewers Mean (lb3) �0.10 0.04 �2.715 (�0.164, �0.025)
Precision (sb3) 70.54 30.13 2.341 (25.8, 141)Distribution Mean (lc6) 0.07 0.03 2.293 (0.009, 0.123)
Precision (sc6) 140.10 72.14 1.942 (41.4, 315)Stars Mean (lc5) 0.09 0.03 3.128 (0.031, 0.141)
Precision (sc5) 115.30 47.23 2.441 (42.9, 224)Thriller Mean (lc1) 0.13 0.04 3.369 (0.054, 0.214)
Precision (sc1) 63.61 28.50 2.232 (22.1, 136)Action Mean (lc2) 0.10 0.04 2.537 (0.021, 0.176)
Precision (sc2) 72.81 38.33 1.900 (23.7, 170)Romance Mean (lc3) 0.10 0.05 1.971 (�0.003, 0.204)
Precision (sc3) 36.52 15.11 2.417 (13.4, 71.9)Drama Mean (lc4) �0.02 0.04 �0.540 (�0.094, 0.053)
Precision (sc4) 70.69 29.88 2.366 (26.4, 142)
also find that the posterior mean for CUMVIEWERS isnegative, suggesting that the word-of-mouth gener-ated across countries for the movies in the sample isnegative. This, however, does not have face validitygiven the superior box office performance of the mov-ies in the sample. We conclude, therefore, that CUM-VIEWERS is not a good proxy for word-of-mouth ef-fects. Instead, the sign of the posterior coefficientsuggests that this measure may be capturing marketsaturation effects.
The table indicates that the impact of big-name starson viewership, as measured by the STARS variable, ispositive and statistically significant, thus adding to theevidence on this variable presented by Sawhney andEliashberg (1996). Similarly, the use of local distribu-tors, as measured by the DIST variable, is associatedwith significant increase in viewership. The means ofthe posterior distributions of the indicator variables forthe various genres suggest that, across countries,THRILLER is the most popular genre. In terms of vari-ability across countries, among the five genres, the pre-
cision of the ROMANCE genre is the lowest (standarddeviation � 15.11), suggesting that intercountry dif-ferences in viewership are most pronounced for thisgenre.
Whereas we report distributions of the posterior pa-rameters across countries in Table 2, in Table 3 weshow how these estimates vary for the countries in oursample. Specifically, we report the country-specific co-efficients bc and cc. Recall from Equation (2) that thesecoefficients relate the movie and country-level covari-ates to the log of the Poissonmodel intensity parameter(wmct). To facilitate interpretation of the intercept termas being unique to each country and to make compar-isons of the relative effects of the other parameters, westandardized the covariates included in the model(Montgomery 1997).
While the posterior means for the country-specificintercepts are positive for all the countries, the size ofthis effect varies across countries. In particular, Japanand Brazil display the largest intercepts, whereas theUnited States has the smallest intercept. This implies

NEELAMEGHAM AND CHINTAGUNTAA Bayesian Model to Forecast New Product Performance
128 Marketing Science/Vol. 18, No. 2, 1999
Table 3 Proposed Model Stage 2 Posterior Parameter Estimates
Intercept SCREENS TREND CUM VIEWERS STARS DIST THRILL ACTION ROM DRAMA
Australia 3.80 2.61 �0.49 �0.18 0.01* 0.10 0.01* 0.08 �0.02* 0.03†(0.02) (0.07) (0.03) (0.01) (0.01) (0.01) (0.02) (0.02) (0.02) (0.02)
Brazil 4.17 1.69 �0.61 �0.09 0.03† 0.19 0.03* 0.03* 0.07* �0.01*(0.03) (0.05) (0.04) (0.02) (0.01) (0.07) (0.08) (0.07) (0.06) (0.05)
Canada 3.87 1.18 �0.67 �0.04 0.09 �0.05* 0.14† 0.26 0.03* �0.003*(0.03) (0.04) (0.03) (0.01) (0.01) (0.07) (0.08) (0.07) (0.06) (0.05)
France 3.42 1.59 �1.11 �0.06 0.08 0.04 0.36 0.25 0.30 0.18(0.04) (0.05) (0.03) (0.01) (0.01) (0.01) (0.03) (0.02) (0.02) (0.02)
Germany 3.64 1.79 �0.70 �0.13 0.02 0.07 0.23 0.09 0.27 0.06(0.03) (0.03) (0.01) (0.01) (0.01) (0.01) (0.01) (0.01) (0.01) (0.01)
Holland 3.67 1.15 �0.61 �0.01* 0.02* �0.03* 0.14 �0.05* 0.08 �0.20(0.04) (0.06) (0.03) (0.03) (0.02) (0.02) (0.04) (0.04) (0.03) (0.05)
Italy 4.60 1.42 �0.64 0.03* �0.01* 0.10 0.09 0.12 �0.06 �0.21(0.04) (0.07) (0.07) (0.02) (0.01) (0.02) (0.02) (0.02) (0.02) (0.02)
Japan 7.74 2.94 �0.33 �0.12 0.20 0.23 0.27 �0.14* 0.16† �0.02(0.10) (0.08) (0.02) (0.01) (0.02) (0.02) (0.10) (0.09) (0.08) (0.05)
Mexico 3.18 0.97 �0.94 0.02* �0.05* 0.02* 0.23 0.08† �0.11† �0.05*(0.07) (0.06) (0.11) (0.05) (0.03) (0.03) (0.05) (0.05) (0.06) (0.06)
Spain 2.99 1.89 �0.55 �0.27 0.09 0.10 �0.03* 0.02* �0.05* 0.004*(0.13) (0.18) (0.08) (0.05) (0.04) (0.03) (0.05) (0.05) (0.07) (0.04)
South Africa 3.70 0.43 �0.72 0.14 0.20 0.03* 0.25 0.24 0.39 �0.07*(0.06) (0.03) (0.05) (0.03) (0.02) (0.02) (0.05) (0.05) (0.04) (0.05)
Sweden 3.25 1.63 �0.50 �0.26 0.17 0.03* 0.09† 0.11 0.27 0.16(0.08) (0.13) (0.03) (0.03) (0.02) (0.03) (0.05) (0.05) (0.04) (0.03)
U.K. 3.81 1.76 �0.60 �0.18 0.09 0.01† 0.03 0.18 �0.08 0.03*(0.02) (0.03) (0.02) (0.01) (0.01) (0.01) (0.02) (0.01) (0.01) (0.07)
U.S. 1.72 1.88 �0.43 �0.19 0.25 — 0.02 0.12 0.16 �0.1(0.02) (0.01) (0.004) (0.002) (0.002) (0.004) (0.004) (0.00) (0.01)
†Significant at the 10% level.
*Not significantly different from zero.
that the observed covariates (screens, trend, cumula-tive viewers, movie attributes) play a larger role in de-termining viewership in the United States as comparedto the international markets. Consistent with results inTable 2, the number of screens on which a movie isreleased is the most critical element of the marketingmix in all countries. Screens have the largest impact onviewership in Japan and Australia and the least inSouth Africa and Mexico. These findings have face va-lidity in that while the Japanese market is one of thelargest international markets, it lags substantially be-hind the European and North Americanmarkets in thenumber of screens and theatrical infrastructure devel-opment (Jaeger II 1997). In the mid-1990s, increased
market development activities in Australia boosted thetheatrical market in that region (Jaeger II 1997). Thisprovides an explanation for the relative importance ofscreens in that country. Both South Africa and Mexicoare developing countries with very poor market infra-structure for movies (Squire 1992).
Means of the coefficients for TREND and CUM-VIEWERS are negative for most countries. The coeffi-cient for TREND is most negative for France, suggest-ing that the drop off rates are sharpest in that country.In contrast, movie releases in Japan tend to have themost gradual drop off. The posterior means for thepresence of stars is either positive or zero for the coun-tries in our sample. The United States has the largest

NEELAMEGHAM AND CHINTAGUNTAA Bayesian Model to Forecast New Product Performance
Marketing Science/Vol. 18, No. 2, 1999 129
posterior mean for the presence of stars, followed byJapan and South Africa. The lack of effect of this vari-able in some of the other countries might be due to thelack of recognition of all the stars in these markets (Va-riety 1996). The positive posterior means for the DISTvariable highlights an interesting institutional detail ininternational movie marketing. All the movies in-cluded in the sample had a major distributor in theUnited States. Industry experts note that the powerand financial muscle of major studios boosts viewer-ship of movies distributed by them in the domesticmarket (Ornstein 1998). Internationally, however, wefind that the reverse holds. Local distributors, by pro-viding greater attention and support, ensure increasedviewership in their own markets.
In terms of genre preference, we find that countriesin the British Commonwealth (U.K., Canada, and Aus-tralia) and Italy prefer action movies the most. Consis-tent with industry wisdom, Japanese and Mexican au-diences are partial to thrillers (Variety 1994a). Bycontrast, romance is the most preferred genre in theUnited States, Sweden, Germany, and South Africa.These results suggest that it is possible to create non-geographic groupings of countries for movie market-ing based on their relative genre preferences.
In summary, we find that screens are the most im-portant influence on movie viewership in internationalmarkets. Local distribution improves movie sales in-ternationally in contrast to the domestic market. Wealso find evidence of similar genre preferences in geo-graphically disparate countries.
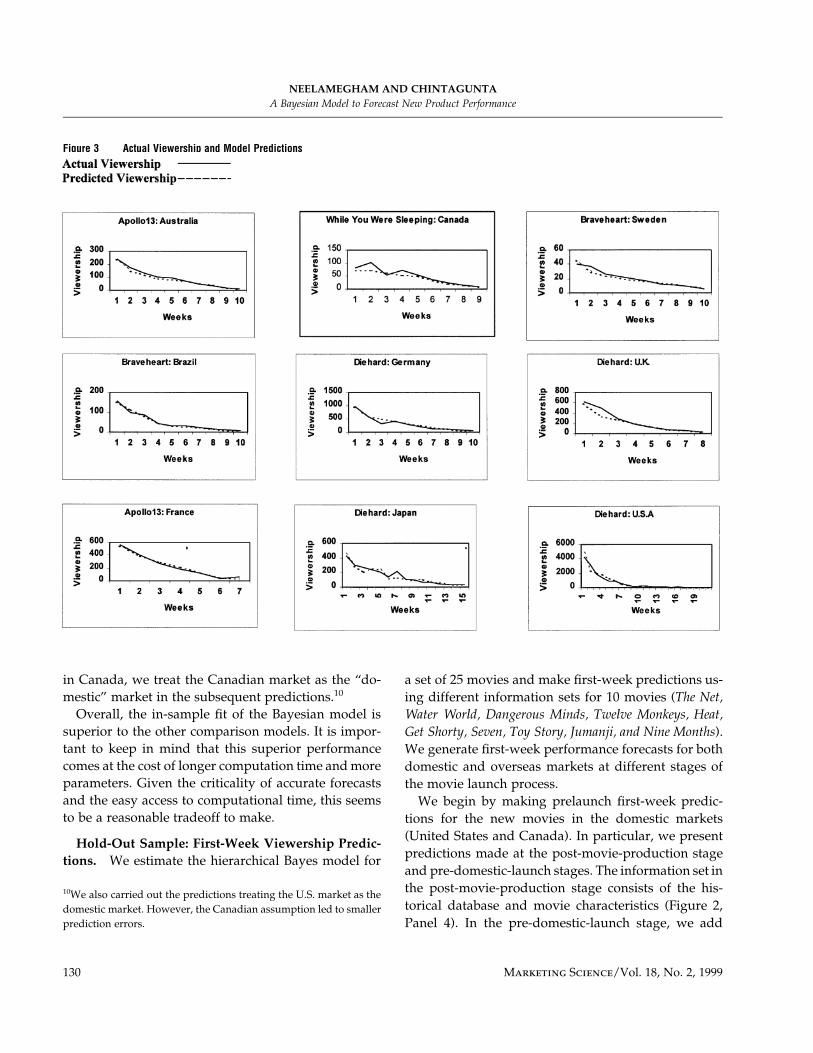
Model AssessmentTo assess the fit of the model we calculate the meanpredictions of viewership made by the model for eachof the countries. This prediction along with actualviewership is presented in Figure 3 for several movie–country pairs. The figure indicates that predicted andactual values are very close. These results generalizeto all movie–country pairs in the estimation sample.
In-Sample Fit Measures. While existing models inthe marketing literature have been proposed at themovie-country level (i.e., these models are estimatedseparately for each movie in each country), the pro-posed model uses the complete estimation sample (i.e.,
merges data across movies and countries). Hence, weconduct model comparisons with just movie–countrydata (separate-data analysis) as well as with the entireestimation sample data (merge-data analysis). Wecompare the following models with a comparable for-mulation of the proposed hierarchical Bayes model: (a)the early sales forecasting model for motion picturesdeveloped by Sawhney and Eliashberg (1996); (b) theFourt and Woodlock (1960) model for predicting salesof new products (Figure 3 shows that the pattern ofmovie sales tend to follow the patterns used in the de-velopment of this model, hence making this model anatural alternative to the proposed Bayesian model);(c) naive (logged) OLS model, which is an ordinaryleast-squares formulation of the proposed model; and(d) a Poisson maximum likelihood model that has thesame set of exogenous variables as the proposedBayesian model.
In Table 4 Panel A, we compare the performance ofthe different models on two criteria: RootMean SquareError (RMSE) and Mean Absolute Error (MAE). Thetable reveals that on both criteria the hierarchical Bayesmodel has the smallest errors, followed by the PoissonMaximum Likelihood model and the Sawhney andEliashberg (1996) specification. The naı̈ve OLS modeldisplays the poorest performance.
In Table 4, Panel B, we compare the proposed hier-archical Bayes model with two other models estimatedwith all the data available in the estimation sample.These models are the Poisson maximum likelihoodand naı̈ve OLS models. The covariates included inthese models were identical to those included in thehierarchical Bayes model. We also included country-level dummies in both the comparison models. Bothcriteria of RMSE and MAE provide evidence of the su-perior in-sample fit of the proposed model.
Table 4, Panel C shows the root mean square errorfor each country across the 25 movies in the estimationdatabase. This panel reiterates the superior perfor-mance of the hierarchical Bayes model at the level ofeach country. We find that the errors in model fit arethe largest for the United States, in contrast to low er-rors for Canada. Given the better fit of the hierarchicalBayes model to the Canadian data, as compared to thefit for the U.S. market, and the early release of movies
NEELAMEGHAM AND CHINTAGUNTAA Bayesian Model to Forecast New Product Performance
130 Marketing Science/Vol. 18, No. 2, 1999
Figure 3 Actual Viewership and Model Predictions
in Canada, we treat the Canadian market as the “do-mestic” market in the subsequent predictions.10
Overall, the in-sample fit of the Bayesian model issuperior to the other comparison models. It is impor-tant to keep in mind that this superior performancecomes at the cost of longer computation time andmoreparameters. Given the criticality of accurate forecastsand the easy access to computational time, this seemsto be a reasonable tradeoff to make.
Hold-Out Sample: First-Week Viewership Predic-tions. We estimate the hierarchical Bayes model for
10We also carried out the predictions treating the U.S. market as thedomestic market. However, the Canadian assumption led to smallerprediction errors.
a set of 25 movies and make first-week predictions us-ing different information sets for 10 movies (The Net,Water World, Dangerous Minds, Twelve Monkeys, Heat,Get Shorty, Seven, Toy Story, Jumanji, and Nine Months).We generate first-week performance forecasts for bothdomestic and overseas markets at different stages ofthe movie launch process.
We begin by making prelaunch first-week predic-tions for the new movies in the domestic markets(United States and Canada). In particular, we presentpredictions made at the post-movie-production stageand pre-domestic-launch stages. The information set inthe post-movie-production stage consists of the his-torical database and movie characteristics (Figure 2,Panel 4). In the pre-domestic-launch stage, we add

NEELAMEGHAM AND CHINTAGUNTAA Bayesian Model to Forecast New Product Performance
Marketing Science/Vol. 18, No. 2, 1999 131
Table 4 In-Sample Fit
Panel A: Separate-Data Analysis: Model Comparisons
ModelsSawhney and
Eliashberg (1996)Fourt and
Woodlock (1960) Naı̈ve OLSPoisson Maximum
LikelihoodSeparate-data
Hierarchical Bayes ModelRoot Mean Square Error 33.33 35.98 41.21 27.87 27.05Mean Absolute Error 22.52 23.82 29.47 16.70 16.20
Panel B: Merged-Data Analysis: Model ComparisonsModels Naı̈ve OLS Poisson Maximum Likelihood Proposed Hierarchical Bayes Model
Root Mean Square Error 460.83 345.10 339.10Mean Absolute Error 193.01 79.60 72.30
Panel C: Model Comparisons of RMSE by CountryCountry Naı̈ve OLS Poisson Maximum Likelihood Proposed Hierarchical Bayes Model
Australia 33.68 11.11 6.90Brazil 52.51 6.60 5.44Canada 34.19 29.81 12.66France 22.88 17.79 13.71Germany 34.90 27.01 21.80Holland 52.87 3.42 2.66Italy 30.57 10.58 5.48Japan 33.47 11.93 6.21Mexico 55.57 2.71 1.47South Africa 34.95 1.31 1.16Spain 51.60 43.98 3.19Sweden 40.56 2.67 2.58U.K. 40.92 31.08 24.10U.S. 436.37 337.30 336.73
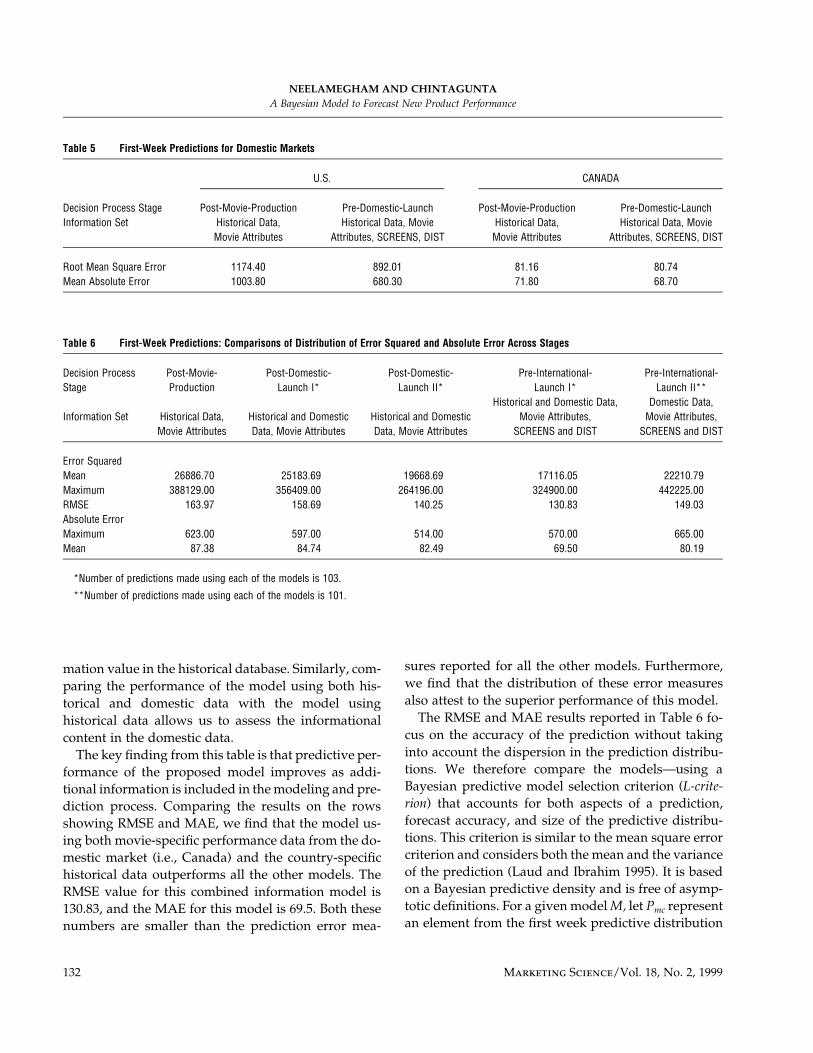
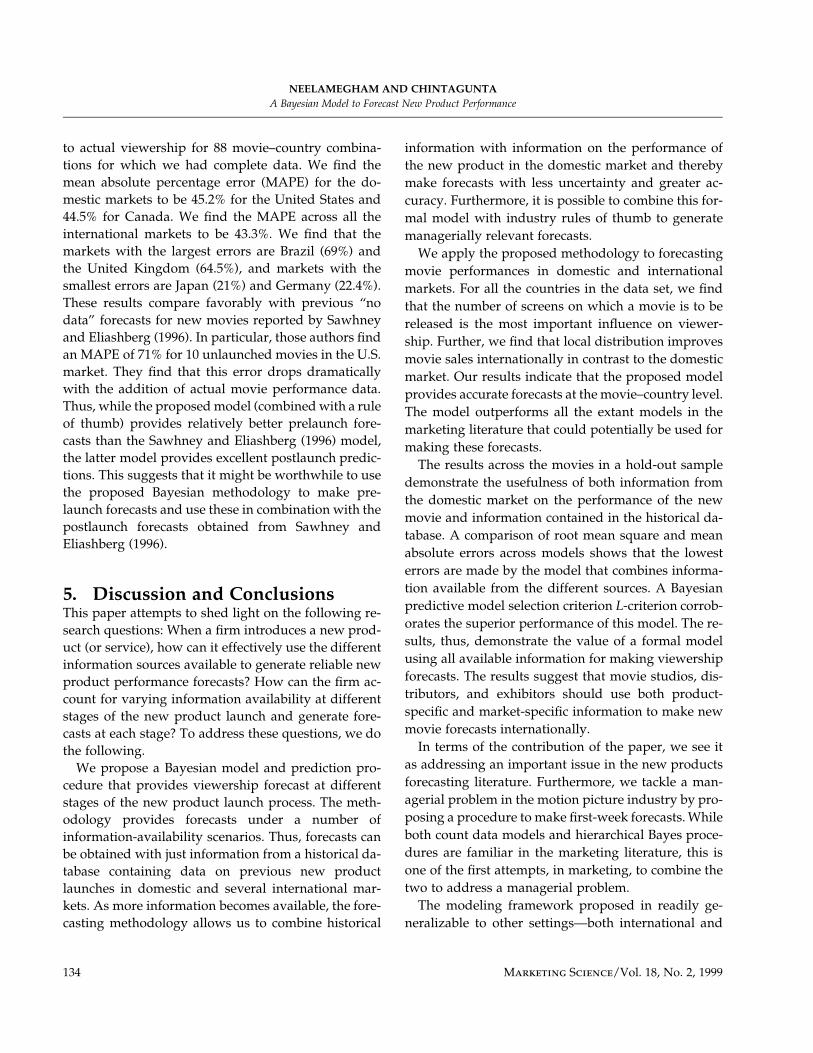
information on SCREENS and DIST in the domesticmarket to the information set (Figure 2, Panel 3). Table5 presents the aggregate results from 10 predictionsmade for the United States and Canada. The errormea-sures reported in the table indicate that for both coun-tries, there is a reduction in error when informationabout SCREENS and DIST is added. Furthermore, thisinformation is relatively more relevant to the U.S. mar-ket. Later in this section we compare our model’s per-formance to prelaunch predictions reported for theU.S. market in the extant literature.
In Table 6 we show the aggregate results from pre-dictions made to forecast first-week sales in each of theinternational markets. Because all 10 movies were notlaunched in all 12 international markets (giving 10*12� 120 predictions), we make 103 first-week predic-tions. In addition to comparing the performance of the
hierarchical Bayes models using different informationsets, we also compare the performance of thesemodelswith a Pre-International-Launch II model. This modelemploys only domestic market performance data andinformation on movie attributes, distribution, andscreens in international markets (i.e., without infor-mation from the historical database).11 We conduct thiscomparison because this model utilizes only the dataavailable at the movie–country level and hence is sim-pler to estimate. Furthermore, comparison of the fit ofthis model with that of the model using both domesticand historical database allows us to assess the infor-
11For the International Launch II model we make 101 instead of 103predictions, because in two cases we had access to only one datapoint for the domestic market making the estimation of this modelinfeasible.
NEELAMEGHAM AND CHINTAGUNTAA Bayesian Model to Forecast New Product Performance
132 Marketing Science/Vol. 18, No. 2, 1999
Table 5 First-Week Predictions for Domestic Markets
U.S. CANADA
Decision Process Stage Post-Movie-Production Pre-Domestic-Launch Post-Movie-Production Pre-Domestic-LaunchInformation Set Historical Data,
Movie AttributesHistorical Data, Movie
Attributes, SCREENS, DISTHistorical Data,Movie Attributes
Historical Data, MovieAttributes, SCREENS, DIST
Root Mean Square Error 1174.40 892.01 81.16 80.74Mean Absolute Error 1003.80 680.30 71.80 68.70
Table 6 First-Week Predictions: Comparisons of Distribution of Error Squared and Absolute Error Across Stages
Decision ProcessStage
Post-Movie-Production
Post-Domestic-Launch I*
Post-Domestic-Launch II*
Pre-International-Launch I*
Pre-International-Launch II**
Information Set Historical Data,Movie Attributes
Historical and DomesticData, Movie Attributes
Historical and DomesticData, Movie Attributes
Historical and Domestic Data,Movie Attributes,
SCREENS and DIST
Domestic Data,Movie Attributes,
SCREENS and DIST
Error SquaredMean 26886.70 25183.69 19668.69 17116.05 22210.79Maximum 388129.00 356409.00 264196.00 324900.00 442225.00RMSE 163.97 158.69 140.25 130.83 149.03Absolute ErrorMaximum 623.00 597.00 514.00 570.00 665.00Mean 87.38 84.74 82.49 69.50 80.19
*Number of predictions made using each of the models is 103.
**Number of predictions made using each of the models is 101.
mation value in the historical database. Similarly, com-paring the performance of the model using both his-torical and domestic data with the model usinghistorical data allows us to assess the informationalcontent in the domestic data.
The key finding from this table is that predictive per-formance of the proposed model improves as addi-tional information is included in themodeling and pre-diction process. Comparing the results on the rowsshowing RMSE and MAE, we find that the model us-ing both movie-specific performance data from the do-mestic market (i.e., Canada) and the country-specifichistorical data outperforms all the other models. TheRMSE value for this combined information model is130.83, and the MAE for this model is 69.5. Both thesenumbers are smaller than the prediction error mea-
sures reported for all the other models. Furthermore,we find that the distribution of these error measuresalso attest to the superior performance of this model.
The RMSE and MAE results reported in Table 6 fo-cus on the accuracy of the prediction without takinginto account the dispersion in the prediction distribu-tions. We therefore compare the models—using aBayesian predictive model selection criterion (L-crite-rion) that accounts for both aspects of a prediction,forecast accuracy, and size of the predictive distribu-tions. This criterion is similar to the mean square errorcriterion and considers both the mean and the varianceof the prediction (Laud and Ibrahim 1995). It is basedon a Bayesian predictive density and is free of asymp-totic definitions. For a given modelM, let Pmc representan element from the first week predictive distribution

NEELAMEGHAM AND CHINTAGUNTAA Bayesian Model to Forecast New Product Performance
Marketing Science/Vol. 18, No. 2, 1999 133
for movie m in country c. The actual first-week view-ership is denoted by Vmc. The L-criterion is given by:
2L � E(P � V )�(P � V ) �M mc mc mc mc
1032[{E(P ) � V } � var(P )].� mc mc mc
mc�1
This criterion therefore implies that a performanceof a model is measured by a combination of how closeits predictions are to the observed data and the vari-ability of the predictions. Typically, the square root ofL2
M is employed, and this is denoted by LM. We foundthe values for LM for the four models post-movie-production, post-domestic-launch I and II, and pre-international-launch I to be 1917.49, 1900.90, 1420.63,and 1325.44, respectively. For the pre-international-launch II model (i.e., the domestic-data model), wefound the value of this measure to be 1340.68. Themodel using both domestic and historical data (pre-international-launch I) thus has the lowest LM measureand hence is superior to all the other models.
Comparison of the models in Table 6 provides thefollowing insights. First, consider the relative perfor-mance of the pre-international-launch I model and thepost-domestic-launch I model. We find that the lack ofexact information on SCREENS and DIST creates ad-ditional uncertainty in the latter model. This uncer-tainty increases both the variance of the predictive dis-tribution as well as the accuracy to the extent that theSCREENS and DIST selected for the new movies differfrom the past empirical distributions. Next, comparethe two models estimated with the same informationavailability at the post-domestic launch stage. We findthat there is a decrease in both prediction errors andL-criterion when we use the post-domestic launch IImodel. This result clearly demonstrates the benefits ofusing available information more intensively withinthe proposed Bayesian framework. Finally, compari-sons of the results of the Post-Domestic-Launch I andPost-Movie-Production models indicate that with theaddition of domestic data the percentage reduction inRMSE and MAE are 3.2% and 3%, respectively. Anal-ogously, when we compare the Pre-International-Launch models II and I, we find that the percentagereduction in RMSE and MAE are 12.2% and 13.3%, re-spectively, with the addition of historical data. These
comparisons suggest that while both movie-specificdomestic data and country-specific historical infor-mation are important, the historical information is rela-tively more valuable.
In sum, all these results underscore the theme thateach movie and each country are unique—and view-ership results from an interaction of the product andthe market. Hence, while making forecasts it is impor-tant to use both historical data about the market anddata on product performance in the domestic market.
Combining Proposed Model with a Rule of ThumbMovie producers typically employ a number of rulesof thumb to make forecast predictions (Squire 1992).Below, we illustrate how one such rule of thumb canbe combined with the formal Bayesian model to makepredictions of cumulative viewership for new unlaun-ched movies.
In interviews with managers in the motion pictureindustry, we were told that managers used the follow-ing rule-of-thumb to obtain cumulative movie perfor-mance forecasts. Managers used their understandingof the movie market and the strengths of a particularmovie, to estimate the proportion of total box officethat will be accounted for by the first-week box office.For the U.S. market, this proportion tended to be be-tween 30% and 50%. We use a variant of this rule-of-thumb to generate cumulative viewership forecasts forour hold-out sample in domestic and internationalmarkets.
Because we do not have access to market-specific es-timates made by managers for the movies in our hold-out sample, we calculate the average proportion offirst-week viewership to total viewership for the mov-ies in the historical database in each of the countries inour sample. We use this measure as a “managerial es-timate” for the movies in our hold-out sample. Specif-ically, we use this proportion and the first-week fore-casts estimated at the pre-international-launch stage tocalculate cumulative viewership for each movie in thehold-out sample in the international markets. For ex-ample, the mean proportion for Germany is 0.25 andthe first-week forecast for The Net (in thousands) inGermany is 337, giving us a cumulative viewershipforecast (in thousands) of 1348.
We compare our forecasts of cumulative viewership
NEELAMEGHAM AND CHINTAGUNTAA Bayesian Model to Forecast New Product Performance
134 Marketing Science/Vol. 18, No. 2, 1999
to actual viewership for 88 movie–country combina-tions for which we had complete data. We find themean absolute percentage error (MAPE) for the do-mestic markets to be 45.2% for the United States and44.5% for Canada. We find the MAPE across all theinternational markets to be 43.3%. We find that themarkets with the largest errors are Brazil (69%) andthe United Kingdom (64.5%), and markets with thesmallest errors are Japan (21%) and Germany (22.4%).These results compare favorably with previous “nodata” forecasts for new movies reported by Sawhneyand Eliashberg (1996). In particular, those authors findan MAPE of 71% for 10 unlaunched movies in the U.S.market. They find that this error drops dramaticallywith the addition of actual movie performance data.Thus, while the proposedmodel (combinedwith a ruleof thumb) provides relatively better prelaunch fore-casts than the Sawhney and Eliashberg (1996) model,the latter model provides excellent postlaunch predic-tions. This suggests that it might be worthwhile to usethe proposed Bayesian methodology to make pre-launch forecasts and use these in combination with thepostlaunch forecasts obtained from Sawhney andEliashberg (1996).
5. Discussion and ConclusionsThis paper attempts to shed light on the following re-search questions: When a firm introduces a new prod-uct (or service), how can it effectively use the differentinformation sources available to generate reliable newproduct performance forecasts? How can the firm ac-count for varying information availability at differentstages of the new product launch and generate fore-casts at each stage? To address these questions, we dothe following.
We propose a Bayesian model and prediction pro-cedure that provides viewership forecast at differentstages of the new product launch process. The meth-odology provides forecasts under a number ofinformation-availability scenarios. Thus, forecasts canbe obtained with just information from a historical da-tabase containing data on previous new productlaunches in domestic and several international mar-kets. As more information becomes available, the fore-casting methodology allows us to combine historical
information with information on the performance ofthe new product in the domestic market and therebymake forecasts with less uncertainty and greater ac-curacy. Furthermore, it is possible to combine this for-mal model with industry rules of thumb to generatemanagerially relevant forecasts.
We apply the proposed methodology to forecastingmovie performances in domestic and internationalmarkets. For all the countries in the data set, we findthat the number of screens on which a movie is to bereleased is the most important influence on viewer-ship. Further, we find that local distribution improvesmovie sales internationally in contrast to the domesticmarket. Our results indicate that the proposed modelprovides accurate forecasts at the movie–country level.The model outperforms all the extant models in themarketing literature that could potentially be used formaking these forecasts.
The results across the movies in a hold-out sampledemonstrate the usefulness of both information fromthe domestic market on the performance of the newmovie and information contained in the historical da-tabase. A comparison of root mean square and meanabsolute errors across models shows that the lowesterrors are made by the model that combines informa-tion available from the different sources. A Bayesianpredictive model selection criterion L-criterion corrob-orates the superior performance of this model. The re-sults, thus, demonstrate the value of a formal modelusing all available information for making viewershipforecasts. The results suggest that movie studios, dis-tributors, and exhibitors should use both product-specific and market-specific information to make newmovie forecasts internationally.
In terms of the contribution of the paper, we see itas addressing an important issue in the new productsforecasting literature. Furthermore, we tackle a man-agerial problem in the motion picture industry by pro-posing a procedure to make first-week forecasts.Whileboth count data models and hierarchical Bayes proce-dures are familiar in the marketing literature, this isone of the first attempts, in marketing, to combine thetwo to address a managerial problem.
The modeling framework proposed in readily ge-neralizable to other settings—both international and

NEELAMEGHAM AND CHINTAGUNTAA Bayesian Model to Forecast New Product Performance
Marketing Science/Vol. 18, No. 2, 1999 135
domestic. In the international context, this methodol-ogy can be used in any product category where thereis a sequential launch. Such a product introductionstrategy is very common in international markets.Some examples of such a product introduction strategyare Citibank’s sequential launch of credit cards in AsiaPacific, the launch of the nicotine patch first in Irelandand subsequently in the United States, and Toshiba’sintroduction of the Libretto subnotebook computerfirst in Asia and then in the U.S. market. In the do-mestic context, the proposed methodology can be usedto predict both sequential launches in different states/areas and also different types of markets. For example,this methodology can be used to predict video sales ofa movie using data from the theatrical performance.
Clearly, there is still room for improvement in themodel forecasts obtained. One of the reasons for thecurrent performance levels is that we do not have ac-cess to information on other variables influencingmovie viewership, such as advertising, productionbudgets, and release schedule (Krider and Weinberg1998, Eliashberg and Shugan 1997). Furthermore, nu-merous other factors impact international adoption,and it is impossible to account for all of them—by us-ing a distribution for the intercept parameter in thecount data model, we are capturing some of these vari-ables such as weather, local cinema activities, etc.
One avenue for future research is to extend the fore-casting horizon and generate week-by-week forecasts.While the motion picture industry is most interestedin first-week forecasts, it may be useful to forecast per-formance over time when assessing launch profitabil-ity in a particular country. This brings up the issue ofthe number of screens. The evolution of the number ofscreens over time will depend, in part, on the perfor-mance of the movie. Consequently, a complete fore-casting model (for long horizons) will entail modelingnot just the number of viewers but also the number ofscreens, with some dependence across these measuresover time.12
12The authors would like to thank the editor, area editor and tworeviewers for their comments and suggestions. They are also gratefulto Reinhard Angelmar, Neeraj Arora, Markus Christen, VrindaKadiyali, and Alan Montgomery and seminar participants at ESSEC,INSEAD, University of Colorado, Boulder, and University of Cali-fornia, Berkeley and Davis, for comments, and they thank PaulineWagenaar for excellent research assistance.
ReferencesAllenby, Greg M., James L. Ginter. 1995. Using extremes to design
products and segment markets. J. Marketing Res. 32 392–403.——, Peter E. Rossi. 1999. Marketing models of consumer hetero-
geneity. J. Econometrics, 89 (112) 57–78.Austin, Bruce A., T. F. Gordon. 1987. Movie genres: toward a con-
ceptualized model and standardized definitions. Bruce A.Austin, ed. Current Research in Film: Audiences, Economics andLaw: Vol 3. Ablex Publishing Corporation, Norwood, NJ.
Best, N. G., M. K. Cowles, S. K. Vines. 1995. CODA: Convergence Di-agnosis and Output Analysis Software for Gibbs Sampler Output:Version 0.3. Cambridge Medical Research Council BiostatisticsUnit, Cambridge, MA.
Cinemania: Interactive Movie Guide. 1996. Microsoft Corporation.Clayton, D, J. Kaldor. 1987. Empirical Bayes estimates of age-
standardized relative risks for use in disease mapping. Biomet-rics 43 671–681.
Eliashberg, Jehoshua, Steven M. Shugan. 1997. Film critics: influenc-ers or predictors? J. Marketing 61 68–78.
Fourt, L. A., J. W. Woodlock. 1960. Early prediction of market suc-cess for grocery products. J. Marketing 25 31–38.
Gatignon, H., J. Eliashberg, T. S. Robertson. 1989. Modeling multi-national diffusion patterns: an efficientmethodology.MarketingSci. 8 231–247.
Gelfand, Alan E., Adrian F. M. Smith. 1990. Sample-based ap-proaches to calculating marginal densities. J. Amer. Statist. As-soc. 85 398–409.
Gelman, A, J. B. Carlin, H. S. Stern, D. B. Rubin. 1995. Bayesian DataAnalysis. Chapman and Hall, London, UK.
——, D. B. Rubin. 1992. Inference from iterative simulation usingmultiple sequences. Statist. Sci. 7 457–511.
Gilks, W. R., S. Richardson, D. J. Spiegelhalter. 1996. Markov ChainMonte Carlo in Practice. Chapman and Hall, London, UK.
Ghosh, M., K. Natarajan, T. W. F. Stroud, B. P. Carlin. 1998. Gener-alized linear models for small-area estimation. J. Amer. Statist.Assoc. 93 (441) 273–282.
Helson, K., K. Jedidi, W. S. DeSarbo. 1993. A new approach to coun-try segmentation utilizing multinational diffusion patterns. J.Marketing 57 60–71.
Jaeger II, James R. 1997. The Independent Producer’s Manual. MatrixxEntertainment, PA.
Jones, M. J., C. J. Ritz. 1991. Incorporating distribution into newproduct diffusion models. Internat. J. Res. Marketing 8 91–112.
King, Gary. 1988. Statistical models for political science event counts:bias in conventional procedures and evidence for the exponen-tial Poisson regression model. Amer. J. Polit. Sci. 32 839–863.
Krider, Robert E., Charles B. Weinberg. 1998. Competitive dynamicsand the introduction of new products: the motion picture tim-ing game. J. Marketing Res. 35 (1) 1–15.
Laud, Purushottam W., Joseph G. Ibrahim. 1995. Predictive modelselection. J. Royal Statist. Soc. B 57 247–262.
Lauritzen, S. L., D. J. Spiegelhalter. 1988. Local computation withprobabilities on graphical structures and their application toexpert systems (with discussion). J. Royal Statist. Soc. B 50 157–224.

NEELAMEGHAM AND CHINTAGUNTAA Bayesian Model to Forecast New Product Performance
136 Marketing Science/Vol. 18, No. 2, 1999
Lenk, P. J., W. S. DeSarbo, P. E. Green, M. R. Young. 1996. Hierar-chical Bayes conjoint analysis: recovery of partworth hetero-geneity from reduced experimental designs. Marketing Sci. 15(2) 173–191.
——, A. G. Rao. 1990. New models from old: forecasting productadoption by hierarchical Bayes procedures.Marketing Sci. 9 42–57.
Mahajan, Vijay, Eitan Muller, Roger Kerin. 1984. Introduction strat-egy for new products with positive and negative word ofmouth. Management Sci. 30 1389–1404.
Mizerski, R. W. 1982. An attribution explanation of the dispropor-tionate influence of unfavorable information. J. Consumer Res.9 (3) 301–310.
Mood, Alexander M., Franklin A. Graybill, Duane C. Boes. 1974.Introduction to the Theory of Statistics. Mc-Graw-Hill Interna-tional Editions, Singapore.
Montgomery, Alan L. 1997. Creating micro-marketing pricing strat-egies using supermarket scanner data.Marketing Sci. 16 (4) 315–337.
Neelamegham, Ramya, Dipak Jain. 1999. A multi-stage model ofconsumer choice processes for experience goods: an econo-metric analysis. J. Marketing Res. forthcoming.
Ornstein, S. L. 1998. Motion pictures: competition, distribution andefficiencies. Larry L. Duetsch ed. Industry Studies 2. M. E.Sharpe, New York. 292–316.
Putsis, W. P., S. Balasubramanian, E. H. Kaplan, S. K. Sen. 1997. Mix-ing behavior in cross-country diffusion. Marketing Sci. 16 (4)354–369.
Rossi, Peter E., R. E. McCulloch, Greg M. Allenby. 1996. The valueof purchase history data in target marketing. Marketing Sci. 15(4) 321–340.
Sawhney, M. S., J. Eliashberg. 1996. A parsimonious model for fore-casting gross box office revenues of motion pictures. MarketingSci. 15 (2) 113–131.
Spiegelhalter, D. J., A. Thomas, N. G. Best, W. R. Gilks. 1994. BUGS:Bayesian Inference Using Gibbs Sampling, Version 30. CambridgeMedical Research Council Biostatistics Unit, Cambridge, MA.
Squire, J. E. 1992. The Movie Business Book. Simon and Shuster, NewYork.
Tanner, M., W. Wong. 1987. The calculation of posterior distribu-tions by data augmentation. J. Amer. Statist. Assoc. 82 528–49.
Variety. 1994a. Exceptions are the rule in foreign B.O. May 16–22.——. 1994c. Bizarre patterns in cinema bazaar. November 14–20.——. 1994b. Star power still fuels Hollywood hits, Gallup sez. July 25–
31.——. 1996. Overseas B.O—all the world’s a screen. January 15–21.Vogel, H. L. 1998. Entertainment Industry Economics: A Guide for Fi-
nancial Analysis. 4th ed. Cambridge University Press, Cam-bridge, England.
Waller, L. A., B. P. Carlin, H. Xia, A. E. Gelfand. 1997. Hierarchicalspatio-temporal mapping of disease rates. J. Amer. Statist. Assoc.92 (438) 607–617.
World Trade. 1996. International movie market makes for buffo bankbiz. 9(9) 11.
Zetlin, M. 1993. Hollywood looks for marketing cues in Europe. J.European Bus. 4(5) 28–33.
This paper was received February 17, 1998, and has been with the authors 9 months for 2 revisions; processed by Greg Allenby.