abb - credit suisse
TRANSCRIPT

DISCLOSURE APPENDIX CONTAINS ANALYST CERTIFICATIONS AND THE STATUS OF NON US ANALYSTS. FOR OTHER IMPORTANT DISCLOSURES, visit www.credit-suisse.com/researchdisclosures or call +1 (877) 291-2683 US Disclosure: Credit Suisse does and seeks to do business with companies covered in its research reports. As a result, investors should be aware that the Firm may have a conflict of interest that could affect the objectivity of this report. Investors should consider this report as only a single factor in making their investment decision.
CREDIT SUISSE SECURITIES RESEARCH & ANALYTICS BEYOND INFORMATION®
Client-Driven Solutions, Insights, and Access
20 February 2013
Europe/Switzerland
Equity Research
Electrical Equipment (Capital goods - Engineering (Europe))
ABB (ABBN.VX) INITIATION FOCUS LIST STOCK
A transforming business
We initiate on ABB with an Outperform rating and add it to Credit Suisse’s European Focus List (TP of SFr26, 24% potential upside): We forecast 15% avg. EPS growth in FY13-15E versus 7% for ABB’s peers, while our blue-sky scenario indicates 25% growth. Our estimates are 7% ahead of consensus.
■ Consensus underestimating Automation growth potential: Driven by
cyclical recovery (China) and strong structural growth drivers in EM, we think
ABB’s Automation business will grow 6% organically in FY13/14 (cons. 3%).
In addition, a strong market position, acquisition capacity, barriers to entry
and a concentrated market should allow further market share gains.
■ Margin recovery in PP: We expect a stronger EBIT margin recovery than
consensus (13.8% vs. 12.9% in FY14) due to improved new order pricing
and cost savings. We see solid medium-term growth potential in the US due
to the age of the installed base, new energy sources, equipment monitoring,
stricter regulation and the housing recovery driving T&D investment.
Stimulus in China’s rail and wind markets could boost growth further.
■ Strong acquisition capacity: ABB’s target range of 1.5-2x ND/EBITDA
could provide $12-18bn of excess cash in FY13E (17-25% potential EPS
accretion). Re-levering up to 0.5x (FY12: 0.0x) could lift earnings by 8%.
■ Underappreciated returns profile: ABB generates the highest CFROI® in
our Electricals coverage yet is priced for CFROI to fade to 10% with margins
falling to 9% over the next 10 years. This compares with the HOLT® DCF
(using the mid-range of ABB’s targets) deriving a CFROI of c16% over the
next 5 years and CS estimates of 16.9% operating margins in FY15E.
■ Valuation: After a 15% underperformance vs. peers (12 months), ABB
trades on FY14E 12.4x / 8.5x PE / EV/EBITA (9% / 8% sector discount).
■ Catalysts: Automation and Power World, Orlando (FL), 25 March.
Share price performance
15
20
Feb-11 Jun-11 Oct-11 Feb-12 Jun-12 Oct-12
Price Price relative
The price relative chart measures performance against the SMI
PRICE which closed at 7530.69 on 15/02/13
On 15/02/13 the spot exchange rate was SFr1.23/Eu 1. -
Eu .75/US$1
Performance Over 1M 3M 12M Absolute (%) 6.6 25.6 9.2 Relative (%) 3.9 10.3 -11.4
Financial and valuation metrics
Year 12/12A 12/13E 12/14E 12/15E Revenue (US$ m) 39,336.0 42,827.4 45,663.8 48,486.1 EBITDA (US$ m) 5,240.20 6,727.32 7,536.29 8,092.52 Adjusted Net Income (US$ m) 2,987.8 3,731.0 4,212.1 4,568.4 CS adj. EPS (US$) 1.30 1.62 1.83 1.99 ROIC (%) 14.25 18.86 21.04 21.95 P/E (adj., x) 17.49 14.02 12.42 11.45 P/E rel. (%) 111.8 97.8 96.1 99.1 EV/EBITDA 10.7 8.1 7.0 6.3
Dividend (12/13E, US$) 0.81 IC (12/13E, US$ m) 21,033.54 Dividend yield (%) 3.6 EV/IC 2.6 Net debt (12/13E, US$ m) 1,783.8 Current WACC 9.0 Net debt/equity (12/13E, %) 9.3 Free float (%) 100.0 BV/share (12/13E, US$) 8.1 Number of shares (m) 2,314.74
Source: FTI, Company data, Thomson Reuters, Credit Suisse Securities (EUROPE) LTD. Estimates.
Rating OUTPERFORM* Price (15 Feb 13, SFr) 20.97 Target price (SFr) 26.00¹ Market cap. (SFr m) 48,540.17 Enterprise value (US$ m) 54,487.5
*Stock ratings are relative to the coverage universe in each
analyst's or each team's respective sector.
¹Target price is for 12 months.
Research Analysts
Simon Toennessen
44 20 7883 6893
Andre Kukhnin CFA
44 20 7888 0350
Max Yates
44 20 7883 8501
Jonathan Hurn, CFA
44 20 7883 4532
Specialist Sales: David Arnold
44 20 7883 3549
Credit Suisse HOLT®: Ian Gray
44 20 7883 6116

20 February 2013
ABB (ABBN.VX) 2
Picturing the story Figure 1: Consensus is underestimating the growth potential in Automation in FY13/14E…
Figure 2: …despite a pick-up in IP growth historically resulting in even stronger Automation growth globally
-4%
-2%
0%
2%
4%
6%
8%
10%
12%
2008 2009 2010 2011 2012 2013E 2014E
Org
an
ic g
row
th (
%)
ABB Automation - Organic growth (incl. CSe)
Org. growth forecasts (Cons)
Industrial production Process Factory
Year EM Developed Global Global Global
2003 8.4% 1.0% 3.7% -0.3% 11.3%
2004 10.6% 2.4% 5.4% 5.1% 13.0%
2005 8.3% 2.1% 4.4% 8.4% 9.1%
2006 9.5% 2.9% 5.5% 11.4% 11.4%
2007 10.0% 2.8% 5.7% 8.8% 11.5%
2008 5.0% -2.7% 0.5% 10.6% 2.4%
2009 0.8% -13.4% -7.2% -5.1% -19.5%
2010 12.6% 7.1% 9.6% -3.3% 20.6%
2011 7.6% 2.8% 5.0% 9.7% 13.8%
2012E 5.1% 0.7% 2.8% 3.1% 4.2%
2013E 6.8% 1.3% 4.0% 4.4% 6.0%
2014E 7.3% 2.4% 4.8% 5.2% 7.1%
Historic avg 8.1% 0.6% 3.6% 5.0% 8.2%
vs Global IP * 1.5x 2.0x Source: Company data, SME, Credit Suisse estimates Source: Thomson Reuters, Credit Suisse estimates
Figure 3: Market seems to be solely focussing on the margin development of the Power Products business…
Figure 4: …while ignoring that 68% of ABB’s profits are derived from its more attractive Automation business
12
14
16
18
20
22
24
10%
11%
12%
13%
14%
15%
16%
Q1
11
Q2
11
Q3
11
Q4
11
Q1
12
Q2
12
Q3
12
Q4
12
Sh
are
pri
ce (
SF
r)
EB
IT m
arg
in (
%)
Power Product - EBIT margin ABB share price
Power32%
Automation68%
Source: SME, Credit Suisse estimates Source: Company data
Figure 5: Compared to consensus we forecast a stronger margin improvement in PP…
Figure 6: …at times when the top-line could be supported by higher transmission investment in the US
12%
13%
14%
15%
16%
17%
18%
19%
2007 2008 2009 2010 2011 2012 2013E 2014E
Marg
in (
%)
EBIT margin - Power Products (CSe) Consensus estimates
8.6 8.9 9.5 10.3 10.211.1
13.5
16.0
0
5
10
15
20
2006 2008 2010 2012E 2011-16E
Inv
estm
en
t (U
SD
bn
) avg. annual expected spend
Source: Company data, SME, Credit Suisse estimates Source: EEI, Business Information Group, Quanta Services
Figure 7: Due to the focus on PP margins we think ABB has underperformed its peers by 15% over the last 12m
Figure 8: We highlight that ABB generates the second highest CFROI®s within the wider Electrical Eng. universe
-25%
-20%
-15%
-10%
-5%
0%
5%
Fe
b-1
2
Mar-1
2
Ap
r-12
May-1
2
Jun
-12
Jul-1
2
Au
g-1
2
Se
p-1
2
Oct-1
2
No
v-1
2
De
c-1
2
Jan
-13
Fe
b-1
3
Rela
tive p
erf
orm
an
ce (
%)
ABB share performance spread vs. Electricals (ex ABB)
-5%
0%
5%
10%
15%
20%
So
mfy
AB
B
Le
gra
nd
Schne
ider
Va
con
Als
tom
Sa
ft
Ph
oen
ix M
eca
no
PK
C G
rou
p
Mers
en
Pysm
ian
Hu
ber &
Suhn
er
Gam
esa
SG
L C
arb
on
Zu
mto
bel
Ve
sta
s
Vo
n R
oll
Ne
xan
s
CF
RO
I (%
)
CFROI LFY CFROI - 12mth fwd
Source: the BLOOMBERG PROFESSIONAL™ service Source: Credit Suisse HOLT®

20 February 2013
ABB (ABBN.VX) 3
Table of contents Picturing the story 2 Investment summary 4 ABB ABBN.VX 7 Automation 8
Glance at ABB’s market position in Automation 9 Solid sales growth potential in Automation in 2013/14 11 ABB should benefit from Robotics and Oil & Gas / Petrochemicals 16 Consensus underestimates ABB’s growth potential in Automation 20 Higher Service sales could trigger higher valuation 21
Power 24 Glance at ABB’s market position in Power 25 Drivers for higher US T&D spend going forward 26 Benefits from Chinese government stimulus 29 Stronger margin upside potential in Power Products 32
Scope for acquisitions 36 Inorganic sales growth target could imply $8-12bn acquisition spend (FY13-15E) 37 Acquisition focus should continue to be on faster growing Automation markets 38 Potential large Automation deals that might make strategic sense 40
Valuation 44 Sum of the parts 44 Discounted cash-flow 45 ABB through the Credit Suisse HOLT lens 46 ABB’s share price has lagged the sector 50 Credit Suisse versus consensus estimates 51 Multiple comparisons 52
Divisional analysis 53 Discrete Automation & Motion 54 Low Voltage Products 56 Process Automation 57 Power Products 60 Power Systems 62
Financial statements 64 Appendix 68
Company targets (2011–15) 68 Acquisition history 69 ABB’s cost savings programme in detail 70 Description of companies used in SOTP 71 Vendor data—Automation & Power 73 PEERs map 75

20 February 2013
ABB (ABBN.VX) 4
Investment summary We initiate on ABB with an Outperform rating and a TP of SFr26 (24% potential
upside). We add ABB to the Credit Suisse European Focus List.
In our view ABB shares offer an attractive investment opportunity owing to a combination
of strong medium term growth potential within the company’s Automation division (68% of
group profits), margin recovery within ABB’s Power Products business, sizable acquisition
potential and strong return generation. We derive EPS growth of 15% over the next three
years compared to 7% for its Electrical peers while our blue-sky scenario offers 25%
earnings growth. We focus on the following:
■ Consensus underestimating the growth potential in Automation
■ Margin recovery and medium term growth potential in Power Products
■ Acquisition capacity of $12-18bn could lead to 17-25% EPS accretion
■ Market materially underestimating ABB’s strong returns profile
Consensus underestimating the growth potential in Automation
■ ABB’s strong market position in Automation – We view Industrial Automation as
one of the most attractive end-markets within Capital Goods in the medium to long
term due to its potential for cyclical recovery (correlation to industrial production) yet
more importantly, in our view, strong structural growth drivers particularly in emerging
markets. Given ABB generates 68% of its group profits from products and services
exposed to Automation end-markets, we believe the company is well positioned to
benefit from this trend.
■ Attractive structural growth drivers – We are forecasting ABB’s Automation
business to grow revenues on average by 6% organically over the next two years
compared to consensus forecasts of 3%. In our view, consensus is underestimating
structural growth drivers such as high wage inflation in emerging markets based on a
strongly growing middle-class and government efforts to push up wages (c.10% in
China) as well as low penetration rates (see Figure 10), which should trigger higher
Automation investment in the medium term. In addition, we believe that ABB’s leading
market position in several product areas, its acquisition capacity, geographical
diversity, limited threat from new entrants, a high degree of market consolidation and
limited capacity additions by incumbents should allow the company to gain market
share. Near-term, we think that leading indicators improving in China, strong
Automation potential in the US and Europe possibly stabilising should boost organic
growth to higher levels seen last fiscal year.
Figure 9: Automation markets have structurally outgrown industrial production in the past in x, unless otherwise stated
Figure 10: One key structural growth driver is a low penetration rate in emerging markets Robot density=Number of robots per 10k manufacturing employees
Industrial production Process Factory
Year EM Developed Global Global Global
2003 8.4% 1.0% 3.7% -0.3% 11.3%
2004 10.6% 2.4% 5.4% 5.1% 13.0%
2005 8.3% 2.1% 4.4% 8.4% 9.1%
2006 9.5% 2.9% 5.5% 11.4% 11.4%
2007 10.0% 2.8% 5.7% 8.8% 11.5%
2008 5.0% -2.7% 0.5% 10.6% 2.4%
2009 0.8% -13.4% -7.2% -5.1% -19.5%
2010 12.6% 7.1% 9.6% -3.3% 20.6%
2011 7.6% 2.8% 5.0% 9.7% 13.8%
2012E 5.1% 0.7% 2.8% 3.1% 4.2%
2013E 6.8% 1.3% 4.0% 4.4% 6.0%
2014E 7.3% 2.4% 4.8% 5.2% 7.1%
Historic avg 8.1% 0.6% 3.6% 5.0% 8.2%
vs Global IP * 1.5x 2.0x
0
50
100
150
200
250
300
350
Japan
Kore
a
Germ
any
Italy
US
Spain
Taiw
an
Fra
nce
Sw
itzerl…
Austra
lia
UK
Chin
a
Bra
zil
Russia
India
Ro
bo
t d
en
sit
y (
x)
Robot density Global average
Source: Thomson Reuters, Credit Suisse estimates Source: World Bank, IFR, United Nations, BLS

20 February 2013
ABB (ABBN.VX) 5
Margin recovery and medium term growth potential in Power Products
■ Improved pricing to benefit margins – ABB’s margin erosion within its Power
Products division had been a key area of market concern for a prolonged period of
time. Fuelled by material price discounts of up to 30% by Korean transformer
manufacturers in the US, ABB’s profitability in this business declined sharply (see
Figure 11). Yet, following the US antidumping ruling in mid 2012 pricing pressure has
abated and ABB’s operating margins have stabilised for five quarters in a row.
Contrary to consensus estimates, we believe that ABB’s PP division will see a
stronger margin recovery towards the end of FY13 and in FY14 from improved pricing
momentum on new orders last fiscal year (average lead time 12-18 months in PP).
While the pricing pressure is unlikely to fully disappear, we believe that utilities, which
are typically very conservative, might prefer well established, technologically advanced
players such as ABB given pricing will be a less critical factor going forward (versus
the period 2009-10). In addition, we think ABB will continue to focus strictly on its cost
savings programme (3-5% of cost of sales annually) biased towards the Power
division (60% of total savings in Power in FY12).
Figure 11: Improved new order pricing last year should lead to a stronger recovery in PP margins…
Figure 12: …while ABB continues to focus on cost savings, particularly within its Power division
12%
13%
14%
15%
16%
17%
18%
19%
2007 2008 2009 2010 2011 2012 2013E 2014E
Ma
rgin
(%
)
EBIT margin - Power Products (CSe) Consensus estimates
-50
0
50
100
150
200
250
300
-1.0%
0.0%
1.0%
2.0%
3.0%
4.0%
5.0%
6.0%
1Q
10
2Q
10
3Q
10
4Q
10
1Q
11
2Q
11
3Q
11
4Q
11
1Q
12
2Q
12
3Q
12
4Q
12
Ne
t s
av
ing
s (
US
Dm
)
Sa
vin
gs
/ P
ric
e e
ros
ion
(%
)
Productivity savings Product price erosion (negative)
Net savings (Savings - Price erosion)
Source: Company data, SME, Credit Suisse estimates Source: Company data
■ Medium-term growth potential from higher US and Chinese Transmission and
Distribution spend – Our channel checks have highlighted the potential for improved
pricing in the US based on a pick-up in transmission and distribution (T&D) investment
spend. Driven by rising reliability issues due to the age of the installed base (>30
years or more for transformers), on-going economic growth, new energy sources such
as renewables, increased equipment monitoring, harsher regulation and a continuous
recovery of the housing market (3-year lag to distribution investment), US utilities
appear likely increase their investment spend in the transmission and distribution
market. Following improved power order momentum in China (+13% in Q412), we
think ABB will increasingly benefit from higher government stimulus particularly related
to offshore wind and infrastructure investments such as rail.
Acquisition capacity of $12-18bn could lead to 17-25% EPS accretion
Due to an explicit target of 3-4% inorganic sales CAGR, we expect ABB to continue to use
its balance sheet mainly for acquisition purposes rather than share buybacks or special
dividends. Following 75% of acquisition spend in Automation (FY08-H112), we believe that
strong structural growth opportunities mean most of the spending will continue to be in
Automation. More precisely, we believe that ABB will expand its market position further in
PLC’s and attractive end-markets such as Oil & Gas as well as growing its Service
business via strategically sensible deals. While management recently flagged that ABB
does not target large deals in the short term, we believe that size will be a less critical
issue if a potential deal makes strategic sense. We highlight potential larger acquisition
targets in this report and estimate that based on ABB’s leverage target range of 1.5-2x net
debt / EBITDA management has $12-18bn of acquisition capacity in FY13.

20 February 2013
ABB (ABBN.VX) 6
Market materially underestimating ABB’s strong returns profile
■ Limited volatility in cash return despite competitive and cyclical pressure – ABB
has maintained its CFROI within a range of 14-16% over the last five years. Achieving
this level of returns is impressive and puts ABB firmly within the top decile of Global
Capital Goods companies and at the top end of the Electrical Equipment industry in
Europe. The company’s ability to maintain high and stable cash returns has resulted in
qualifying for a HOLT eCap (extended fade window of 10 years instead of 5 years) – a
distinction which only 7% of companies in the HOLT database qualify for.
■ ABB priced for CFROI to fade to 10% and margins to 9% – The market is currently
pricing ABB’s CFROI to fade to 10% over the next 10 years which, should this happen,
will represent an 8 year low (see Figure 13). If we use the HOLT DCF model using the
mid-range of ABB’s group targets on sales and margins we derive a CFROI of c16%
over the next five years translating into a share price of SFr27.50 (30% potential
upside). If we use the 10 year fade window, ABB’s EBITDA margins are priced to
deteriorate down to 9% by 2021 (CSe 16.9% in FY15), which represents nearly a
600bps decline from the 14.8% margins ABB generated in FY12. In addition to rising
PP margins, group margins should benefit from stronger Power Systems margins due
to management’s decision to exit EPC contracts as well as targeting a higher share of
group Service sales (20-25% target by FY15 from 17% in FY12).
■ Shares underperformed by 15% over last 12 months / 2014 valuation attractive –
We derive a TP of SFr26 by using an average of our SOTP, DCF and Credit Suisse
HOLT analysis. Following an underperformance of 15% (12 months), ABB trades on
FY14E 12.4x / 8.5x PE / EV/EBITA, implying a 9% and 8% peer discount, respectively.
Figure 13: ABB is currently priced for CFROI to fade to 10%
Figure 14: ABB has significantly underperformed its Electrical peers over the last 12 months
-25%
-20%
-15%
-10%
-5%
0%
Feb-1
2
Ma
r-12
Apr-1
2
May-1
2
Jun-1
2
Jul-1
2
Aug-1
2
Sep-1
2
Oct-1
2
Nov-1
2
Dec-1
2
Jan-1
3
Feb-1
3
Rela
tive p
erf
orm
an
ce (
%)
ABB share performance spread vs. Electricals (ex ABB) Source: Credit Suisse HOLT Source: the BLOOMBERG PROFESSIONAL™ service
Blue-sky scenario suggesting 25% annual earnings growth potential in FY13-15E
Figure 15: Blue-sky scenario – Impact on earnings forecasts Blue sky scenarios FY13E FY14E FY15E Avg. Description
CS EPS forecasts (base) 1.62 1.83 1.99
Growth 25% 13% 8% 15%
EPS accretion
Stronger Automation sales growth 2% 6% 11%
Faster top-line growth assumption particularly in China/Europe
leading to double digit organic sales growth in FY14/15E with
margins closer to the top end of ABB's guidance range in FY15
Faster margin re-acceleration in Power
Products1% 3% 4%
Our current forecasts reflect a margin re-acceleration in PP from
14.8% in FY12 to 15.5%/15.9% in FY13/14 (cons 15.1%/15.4%).
In our blue-sky scenario we estimate margins of 16.5% in FY14
(still >200bps off FY09) mainly due to improved pricing.
Use of excess cash 5% 8% 11%
Based on financial headroom targets (1.5-2x) ABB has
acquisition firepower of $12-18bn in FY13. We use a leverage of
0.5x in our blue-sky scenario as we find this more realistic.
CS EPS forecasts (blue-sky) 1.75 2.16 2.53
Growth 35% 23% 17% 25% median multiple (2009-2012)
PE multiple 15.3x discounted back, FX adjusted to SFr
Potential target price (blue-sky) 30 Source: Company data, the BLOOMBERG PROFESSIONAL™ service, Credit Suisse estimates

20 February 2013
ABB (ABBN.VX) 7
ABB ABBN.VX Price (15 Feb 13): SFr20.97, Rating: OUTPERFORM, Target Price: SFr26.00
Income statement (US$ m) 12/12A 12/13E 12/14E 12/15E
Sales revenue 39,336 42,827 45,664 48,486 EBITDA 5,240 6,727 7,536 8,093 Depr. & amort. (1,486) (1,444) (1,489) (1,574) EBIT (CS) 4,058 5,435 6,158 6,629 Net interest exp. (220) (244) (261) (236) Associates — — — — Other adj, 435 76 36 36 PBT (CS) 4,274 5,266 5,933 6,429 Income taxes (1,030) (1,401) (1,592) (1,726) Profit after tax 3,244 3,865 4,341 4,703 Minorities (108) (113) (119) (125) Preferred dividends — — — — Associates & other (148) (21) (10) (10) Net profit (CS) 2,988 3,731 4,212 4,568 Other NPAT adjustments (284) (55) (26) (26) Reported net income 2,704 3,675 4,186 4,542
Cash flow (US$) 12/12A 12/13E 12/14E 12/15E
EBIT 4,058 5,435 6,158 6,629 Net interest (220) (244) (261) (236) Cash taxes paid — — — — Change in working capital (411) (233) (366) (726) Other cash & non-cash items 352 (109) (214) (263) Cash flow from operations 3,779 4,849 5,317 5,405 CAPEX (1,230) (1,293) (1,430) (1,502) Free cash flow to the firm 2,549 3,556 3,887 3,902 Acquisitions (3,694) — — — Divestments — — — — Other investment/(outflows) (588) — — — Cash flow from investments (5,575) (1,257) (1,340) (1,422) Net share issue/(repurchase) 90 — — — Dividends paid (1,747) (1,985) (2,122) (2,267) Issuance (retirement) of debt 5,452 — — — Other (6,250) — — — Cash flow from financing activities
(2,455) (1,985) (2,122) (2,267) Effect of exchange rates 90 — — — Changes in Net Cash/Debt (4,161) 1,606 1,855 1,715 . Net debt at start (771) 3,390 1,784 (71) Change in net debt 4,161 (1,606) (1,855) (1,715) Net debt at end 3,390 1,784 (71) (1,786)
Balance sheet (US$ m) 12/12A 12/13E 12/14E 12/15E
Assets Cash and cash equivalents 6,875 8,481 10,336 12,051 Accounts receivable 11,575 11,778 12,558 13,576 Inventory 6,182 6,731 7,176 7,620 Other current assets 3,370 3,370 3,370 3,370 Total current assets 28,002 30,359 33,440 36,617 Total fixed assets 5,947 6,419 6,921 7,455 Intangible assets and goodwill 13,727 13,220 12,680 12,105 Investment securities — — — — Other assets 1,394 1,394 1,394 1,394 Total assets 49,070 51,392 54,435 57,571 Liabilities Accounts payable 6,441 6,802 7,385 7,752 Short-term debt 2,537 2,537 2,537 2,537 Other short term liabilities 9,996 10,153 10,430 10,799 Total current liabilities 18,974 19,492 20,352 21,088 Long-term debt 7,534 7,534 7,534 7,534 Other liabilities 5,116 5,116 5,116 5,116 Total liabilities 31,624 32,142 33,002 33,738 Shareholders' equity 16,906 18,723 20,921 23,336 Minority interest 540 526 512 497 Total equity & liabilities 49,070 51,392 54,435 57,571 Net debt (US$ m) 3,390 1,784 (71) (1,786)
Per share data 12/12A 12/13E 12/14E 12/15E
No. of shares (wtd avg) 2,295 2,298 2,297 2,297 CS adj. EPS (US$) 1.30 1.62 1.83 1.99 Dividend (US$) 0.73 0.81 0.87 0.93 Dividend payout ratio 55.81 49.80 47.20 46.56 Free cash flow per share (US$)
1.11 1.55 1.69 1.70
Key ratios and valuation
12/12A 12/13E 12/14E 12/15E
Growth(%) Sales 3.5 8.9 6.6 6.2 EBIT (13.0) 33.9 13.3 7.7 Net profit (13.1) 24.9 12.9 8.5 EPS (9.9) 17.8 11.4 8.2 Margins (%) EBITDA margin 13.3 15.7 16.5 16.7 EBIT margin 10.3 12.7 13.5 13.7 Pretax margin 10.9 12.3 13.0 13.3 Net margin 7.6 8.7 9.2 9.4 Valuation metrics (x) EV/sales 1.4 1.3 1.1 1.0 EV/EBITDA 10.7 8.1 7.0 6.3 EV/EBIT 13.8 10.0 8.5 7.6 P/E 17.4 14.0 12.4 11.4 P/B 3.1 2.8 2.5 2.2 Asset turnover 0.80 0.83 0.84 0.84 ROE analysis (%) ROE stated-return on equity
16.5 20.6 21.1 20.5 ROIC 14.3 18.9 21.0 22.0 Interest burden 1.1 1.0 1.0 1.0 Tax rate 26.8 27.0 27.0 27.0 Financial leverage 0.60 0.54 0.48 0.43 Credit ratios (%) Net debt/equity 19.4 9.3 (0.3) (7.5) Net debt/EBITDA 0.65 0.27 (0.01) (0.22) Interest coverage ratio 18.4 22.2 23.6 28.1
Source: FTI, Company data, Thomson Reuters, Credit Suisse Securities
(EUROPE) LTD. Estimates.
15
20
Feb-11 Jun-11 Oct-11 Feb-12 Jun-12 Oct-12
Price Price relative
The price relative chart measures performance against the SMI PRICE which
closed at 7487.13 on 15/02/13
On 15/02/13 the spot exchange rate was SFr1.23/Eu 1. - Eu .75/US$1

20 February 2013
ABB (ABBN.VX) 8
Automation ABB’s Automation division generates more than two thirds of group profits – a share which
has risen from c50% in 2008. We believe the market is underestimating the expansion
potential in Automation supported by two sizable, well integrated acquisitions in the US
and the scope for further deals going forward. Driven by strong structural growth drivers
particularly in emerging markets, we think Automation is one of the most attractive end-
markets within Capital Goods in the medium term. Although most industrial end-markets in
EM (such as China) are likely to grow at a slower pace going forward, we think Automation
will be an exception. ABB has a strong market position to benefit from these trends.
Within this section, we focus on the following topics:
■ Glance at ABB’s market position in Automation – ABB’s breadth of automation
products and services offerings, its diversity and market leading position in several
areas within Automation (e.g. Distributed Control Systems (DCS)) puts ABB into a
sweet spot to benefit from the growth potential within an attractive end-market, in our
view. We believe ABB offers the opportunity to invest into above average growth
markets such as Oil & Gas, Petrochemicals, Transport, Power Generation and
Automotive equipment (particularly in emerging countries) and to benefit from strong
underlying growth and in addition structurally driven Automation expansion within
those markets.
■ Solid sales growth potential in Automation in 2013/14E – The global Automation
market should grow at around 6% in the medium term, hence its historic trend of IP+
(industrial production) growth should continue. Driven by structural growth drivers in
emerging markets such as demographic shifts (growing middle class) and government
efforts to push up wages we expect the global industrial automation market to grow at
~1.5x global IP over the next cycle versus ~1.3x during the last cycle. ABB’s strong
market position, the limited threat from new entrants, a high degree of market
consolidation and limited capacity additions by incumbents should allow ABB to gain
market share. We forecast average organic growth for ABB over the next two years of
6%.
■ Consensus underestimates ABB’s potential in Automation – We think consensus
growth estimates (organically) over the next two years are too conservative,
particularly in FY13 (consensus 0% vs. CS 5%). With Chinese leading indicators
improving, Europe potentially stabilising throughout the year and a more positive
development in the US (note that other automation players such as Rockwell surprised
positively in the US last quarter), we believe ABB’s organic growth in Automation has
seen its trough last year. We believe consensus estimates are too bearish, particularly
for Discrete Automation & Motion (DA&M), where our sales forecasts are 7-10%
ahead of the Street in FY13/14. Our analysis indicates that at times of elevated
economic activity consensus estimates have often been too bearish over the past five
years (see Figure 56).
■ Higher Service sales could trigger higher valuation – ABB aims to increase the
revenues portion from Services from 17% in FY12 to 20-25% by 2015. Given the
significantly higher levels of profitability from Service contracts we believe this will be
margin supportive medium term. Following the company’s successful acquisitions of
Baldor and Thomas & Betts, ABB has considerably improved its installed base
particularly in North America, which in our view should lead to higher Service business
over time. We note that ABB’s target will put the company on a similar Service level to
its peers (on average; ex Legrand). Due to the fact that in our view higher Service
contribution has been a driver for higher valuation in the past we believe the market
might also acknowledge this improvement with a higher valuation for ABB. Currently
ABB’s peers trade at an 8% premium on FY14 EV/EBITA estimates.

20 February 2013
ABB (ABBN.VX) 9
Glance at ABB’s market position in Automation
Compared to its peers, ABB has one of the broadest product offerings in Automation,
ranging from a variety of plant level controls to a raft of plant instrumentation products
such as sensors, drives or motion control products such as motors. ABB represents one of
the few Automation companies that generates a sizable revenue portion from both discrete
and process automation. As we highlight further below in this report, this is relatively rare
in the industry given limited synergy potential between products used: for example, in an
oil refinery (process) and an automotive production facility (discrete). Yet, ABB has
managed to build strong market positions within respective product areas in both process
and discrete automation markets such as a market leading position in DCS within process
as well as a strong robotics and motors market position in factory automation.
Figure 16: ABB’s position in the Automation value chain
Major players
PLM: Autodesk, Dassault, Siemens
ERP: Oracle, SAP
MES: Aspen, CDC Software, Invensys, Siemens
SCADA: ABB, Invensys, Siemens
DCS: ABB, Honeywell, Siemens, Yokogawa
PLC: ABB, Omron, Mitsubishi, Rockwell,
Schneider, Siemens
V ^ V ^
Computerized Numerical
Control (CNC)CNC: Fanuc, Siemens
V ^ V ^ V
V ^ V ^ Human Machine Interface (HMI)
Drives Sensors
Robots
MotorsMachine
Vision
HMI: ABB, Invensys, Mitsubishi, Siemens,
Schneider
Plant
InstrumentationValves Sensors Machine Tools
Sensors: ABB, Eaton, Honeywell, Omron
Machine Vision: Cognex, Teledyne
Drives: ABB, Danaher Mitsubishi
Robots: ABB, Fanuc, Kuka
Machine Tools: Gildemeister, Mori Seiki
Motors: ABB, Emerson, GE, Regal Beloit,
Rockwell, Schneider, Siemens, Weg,
Yaskawa
Plant Level
Controls
Supervisory Control and Data Analysis (SCADA)
Process Factory
Distributed Control
System (DCS)
Programmable Logic
Controller (PLC)
Enterprise Level
Controls
Product Lifecycle Management (PLM)
Enterprise Resource Planning (ERP)
Manufacturing Execution System (MES)
Source: Credit Suisse research
While ABB’s Automation business generated around half of group sales in FY09, stronger
organic growth and falling profitability in the company’s Power division has meant that
Automation became an even more important contributor to the company’s group
performance over time. Today, Automation generates the majority of group sales and due
to a stronger margin profile more than two-thirds of group profits. We note that the
business shift towards a higher Automation exposure has been even more pronounced in
emerging countries such as China. In FY08 ABB’s Automation business generated 45% of
sales in China while in H112 this division already contributed 58% to total Chinese sales.

20 February 2013
ABB (ABBN.VX) 10
Figure 17: Automation generates 58% of group sales… Figure 18: …and 66% of group EBITDA in FY13 on CSe
Discrete Automation &
Motion22%
Low Voltage17%
Process Automation
19%
Power42%
Discrete Automation &
Motion28%
Low Voltage21%
Process Automation
17%
Power34%
Source: Credit Suisse estimates Source: Credit Suisse estimates
We show ABB’s Automation business split in Figure 19. Across its three subdivisions, ABB
generates the majority of its revenues from motors and generators, supported by the
acquisition of Baldor in the US, followed by low voltage drives and products related to oil,
gas and petrochemical end-markets.
Figure 19: ABB’s total Automation business split Figure 20: ABB has a market leading position in DCS
0%2%4%6%8%
10%12%14%16%18%20%
% o
f A
uto
mati
on
sale
s
ABB
0%
5%
10%
15%
20%
25%
1999 2001 2003 2005 2007 2009 2011
Ma
rket
sh
are
(%
)
Main competitors: Emerson, Honeywell, Invensys, Siemens, Yokogawa (alphabetical order)
Source: Company data, Credit Suisse estimates Source: Company data, ARC DCS Worldwide Outlook
In both figures below we go into more detail as to which end-markets ABB is most
exposed to as well as outlining the company’s main customers. While in Automation ABB
tends to work closer together with industrial-related customers (60% of group customers),
the company’s Power business naturally builds a closer relationship to utility companies
offering products such as transformers, circuit breakers or gas-insulated switchgears. If we
split up ABB’s industrial customers amongst their respective end-markets we note that the
company has the most significant end-market exposure to minerals and metals as well as
to oil, gas and petrochemicals, both accounting for 15% and 10%, respectively.
Figure 21: ABB’s customers split (2011) 3-year rolling average
Figure 22: ABB’s end-market split (2011) in US$ millions, circled = Industrial customers
Industrial customers
(direct / indirect)
60%
Utlity customers
(direct)40%
Power Transmission
20%
Minerals & metals15%
Oil, gas & petrochemicals
10%
Power generation
10%
Power distribution
10%
Marine5%
Pulp & paper5%
Discrete manufacturing, automotive &
transport5%
Buildings5%
Other15%
Source: Company data Source: Company data

20 February 2013
ABB (ABBN.VX) 11
Solid sales growth potential in Automation in 2013/14
We believe that Automation will be one of the most attractive end-markets in Capital
Goods in the medium term backed by solid sales growth potential due to a combination of
strong structural drivers in emerging markets (high wage inflation, low penetration rates)
and the potential for a cyclical rebound in more developed markets such as Europe and
the US if economic data continues to improve (see more details in the note from our
Global Cap Goods team, Global Industrial Automation – The next growth phase, 14th
August 2012)
Underpinned by industry data and the historic correlation with industrial production the
global Automation market looks set to grow at around 6% over the next three years with
growth economies outpacing more mature markets and factory automation outgrowing
process automation (see Figure 28). In both figures below we show the difference in size
between the total automation market and the industrial automation market. Due to ABB’s
customer exposure, the latter should be more relevant.
Figure 23: Total automation market size / growth estimate Figure 24: Industrial automation market split
2010 2015E
$285bn
$380bn
6% CAGR
Discrete manufacturing
25%
Process manufacturing
25%Oil & Gas
20%
Mining & minerals
10%
Utilities10%
Hybrid manufacturing
10%
$180bn market size (2012)
Source: Company data Source: Company data, ARC DCS Worldwide Outlook
We highlight historic Automation sector spend in Figure 25, which shows a pick-up in
growth particularly in emerging markets, which expanded at c.8% on average between
2000 and 2010. We view the growth forecasts for developed markets as too conservative
if the European economy begins to improve and capital restraints in the US resulting from
the ‘fiscal cliff’ do not significantly impact manufacturing growth over the next two years.
Figure 25: Automation sector spend in $tr, spend by oil & gas, mining, iron & steel, electricity, gas & steam, basic industrial chemicals, pulp & paper, infrastructure construction sectors
0
1
2
3
4
5
199
0
199
1
199
2
199
3
199
4
199
5
199
6
199
7
199
8
199
9
200
0
200
1
200
2
200
3
200
4
200
5
200
6
200
7
200
8
200
9
201
0
201
1
201
2
201
3
201
4
201
5
201
6
201
7
201
8
Au
tom
ati
on s
ecto
r sp
end
($tr
)
Developed markets Emerging markets
1990-2000
3.3% pa
2000-2005
7.4% pa
2005-2010
8.8% pa
2010-2015
6.9% pa
1990-2000
0.9% pa
2000-2005
1.0% pa
2005-20103.2% pa
2010-2015
2.1% pa
Source: Company data, Global Insight, Credit Suisse research

20 February 2013
ABB (ABBN.VX) 12
ABB should outgrow Automation markets
Owing to ABB’s strong market position, the limited threat from new entrants, a high degree
of market consolidation and limited capacity additions by incumbents we believe ABB has
the potential to grow at a faster pace than the global automation market (note that we
forecast average organic growth of 7% for ABB between 2013-15E) driven by ABB’s
excellent market position within the Automation value chain (as highlighted above in
Figure 16), which should for example enable the company to win a greater amount of large
integrated automation projects.
We think that market-leading players such as ABB are not under imminent threat from new
market entrants in emerging markets. During our last field trip China in November 2012
Rockwell’s China head emphasised that it would likely take new market participants a
minimum of ten years to replicate the technology of market leading Western players. While
he admitted that it might be quicker for instrumentation products such as drives and
motors, the minimum time of ten years was particularly pertinent for plant level controls
products such as DCS’s where ABB holds a market leading position. Furthermore, we
believe that ABB should continue to gain market share on the back of
1) a significant focus on product quality given controls products are often a very critical
component within the Automation process and 2) ABB’s potential to use its strong cash-
flow generation for selective M&A deals.
According to ABB the key growth drivers in Automation are:
■ Factory Automation
■ User of energy (Oil & Gas)
■ Transportation and mobility
■ Energy efficiency
■ Commodity demand
For obvious reasons order growth in ABB’s Automation tends to follow trends in industrial
production (in developed markets) pretty well. We note that macro forecasts are becoming
increasingly more optimistic for 2013 and beyond (see Figure 27). History suggests that
this should lead to stronger investment particularly in the areas of manufacturing.
Following a year of weaker GDP growth especially in Europe and China we expect more
automation investment to come through and improved growth rates for Automation players
such as ABB (see Figure 26).
Within the divisional section at the back of this report we go into further detail around the
cyclicality of ABB’s specific divisions. While the company’s Power business in particular
Power Systems is clearly more exposed to customers operating in late cyclical end-
markets we note that due to the high Process Automation exposure (customers: e.g. oil &
gas, petrochemical companies) ABB’s total automation business tends to be less short-
cycle than one might assume. ABB’s only pure short-cycle division is Low Voltage
Products, which accounts for roughly 20% of ABB’s group sales. Figure 26 demonstrates
the impact from the later cyclical process business particularly throughout the last
downturn.

20 February 2013
ABB (ABBN.VX) 13
Figure 26: ABB Automation order growth vs industrial production growth
Figure 27: CS macro forecasts – More positive trends in China and Europe
-20%
-15%
-10%
-5%
0%
5%
10%
15%
20%
-40%
-30%
-20%
-10%
0%
10%
20%
30%
40%
Q10
9
Q20
9
Q30
9
Q40
9
Q11
0
Q21
0
Q31
0
Q41
0
Q11
1
Q21
1
Q31
1
Q41
1
Q11
2
Q21
2
Q31
2
Q41
2E
Q11
3E
Q21
3E
Q31
3E
Q41
3E
IP g
row
th (
%)
Org
. g
row
th (
%)
ABB Automation - Org. order growth IP - Eurozone
IP - US IP - China
Macro forecasts 2012E 2013E 2014E Trend for 2013/14
Global Real IP 3.1% 3.5% 4.0%
IP 2.8% 4.0%
US Real IP 2.3% 1.9% 2.5%
Euro Area Real IP -0.4% 0.5% 1.5%
NJA Real IP 6.3% 6.8% 7.0%
China Real IP 7.7% 8.0% 8.2%
IP 10.0% 10.9% 11.4%
Source: The BLOOMBERG PROFESSIONAL™ service, Company
data, Credit Suisse estimates
Source: Credit Suisse estimates
We believe industrial automation will continue to outgrow industrial production. Automation
relative to IP could potentially see higher growth this cycle compared with the previous
one, given the emergence of several new growth themes.
■ Much of China’s recent output growth has been driven by construction and
infrastructure build-outs. Industrial vendors supplying these markets will likely see
lower trend growth going forward. Automation however will likely benefit from two
emerging trends in China: (1) wage inflation is accelerating; and (2) the increased
government emphasis on consumption;
■ The global capex outlook for key automation end-markets such as Petrochemicals is
stronger today in our view compared to last cycle;
■ The efficacy of discrete automation is becoming increasingly apparent, yet penetration
remains low in many markets, offering scope for increased penetration to drive growth.
Below, we show bottom-up Process and Factory Automation market growth (generated by
a wide sample of automation vendors that we track), in the context of Industrial Production.
Figure 28: Automation market growth forecasts in x, unless otherwise stated; * excluding outliners
Figure 29: ABB – CS org. sales forecasts by subdivision in US$ millions, unless otherwise stated
Industrial production Process FactoryYear EM Developed Global Global Global2003 8.4% 1.0% 3.7% -0.3% 11.3%2004 10.6% 2.4% 5.4% 5.1% 13.0%2005 8.3% 2.1% 4.4% 8.4% 9.1%2006 9.5% 2.9% 5.5% 11.4% 11.4%2007 10.0% 2.8% 5.7% 8.8% 11.5%2008 5.0% -2.7% 0.5% 10.6% 2.4%2009 0.8% -13.4% -7.2% -5.1% -19.5%2010 12.6% 7.1% 9.6% -3.3% 20.6%2011 7.6% 2.8% 5.0% 9.7% 13.8%2012E 5.1% 0.7% 2.8% 3.1% 4.2%2013E 6.8% 1.3% 4.0% 4.4% 6.0%2014E 7.3% 2.4% 4.8% 5.2% 7.1%Historic avg 8.1% 0.6% 3.6% 5.0% 8.2%vs Global IP * 1.5x 2.0x
-15%
-10%
-5%
0%
5%
10%
15%
20%
2008 2009 2010 2011 2012 2013E 2014E
Org
an
ic g
row
th (
%)
Organic growth - DA&M Organic growth - Process
Organic growth - LV
Source: Thomson Reuters, Credit Suisse estimates Source: Thomson Reuters, Credit Suisse estimates
In order to derive a clearer picture of how ABB’s respective Automation markets are
expected to grow, we have created Figure 30, in which we specifically list growth
expectations for a variety of Automation markets in which ABB operates. Our conclusion
from Figure 30 is that ABB’s markets should grow close to 6% on average over the next
three years. As mentioned above, we believe that ABB has the potential to outgrow its
respective markets due to a strong competitive position in a raft of its marketplaces.

20 February 2013
ABB (ABBN.VX) 14
Figure 30: Growth estimates in ABB’s Automation markets and regions in millions, unless otherwise stated
Growth estimates ABB's Automation markets 2011 2012E 2013E 2014E 2015E
Industrial Control Systems (ICS) 7.3% 6.6% 5.0% 6.4% 6.2%
SCADA 7.2% 4.3% 4.5% 5.3% 6.0%
DCS 7.3% 8.3% 5.0% 6.7% 6.2%
PLC 7.6% 6.2% 6.5% 8.1% 6.9%
Field Devices 5.9% 4.1% 5.3% 5.3% 5.5%
Robotics 6.6% 7.5% 8.5% 7.5% 7.5%
Sensors 5.6% 3.6% 3.6% 4.2% 4.2%
Motion & Drives 4.9% 1.5% 3.7% 4.3% 4.4%
Others 6.5% 6.0% 6.0% 6.0% 6.0%
Total 6.9% 5.9% 5.0% 6.1% 6.0%
ABB's Automation market growth by region 2011 2012E 2013E 2014E 2015E
Americas 6.6% 7.5% 6.1% 6.3% 5.5%
Europe 6.5% 3.3% 2.0% 3.8% 3.9%
APAC 7.4% 7.0% 7.2% 8.5% 8.8%
ROW 8.7% 7.8% 7.0% 6.9% 6.9%
Total 6.9% 5.9% 5.0% 6.1% 6.0% Source: Markets and Markets, Credit Suisse estimates
Structural growth drivers such as high wage inflation and rising penetration rates in
emerging markets will force Automation investment
We believe on-going high wage inflation (c.10%) in emerging markets such as in China will
continue to pressurise corporate profitability levels, putting China’s cost competitive
manufacturing at risk. In order for China to remain a manufacturing powerhouse it is vital
in our view to significantly invest into Automation. For us to exactly pinpoint the time of
higher investment coming through is difficult yet we believe that turning economic
momentum can certainly be one important trigger point.
Although Chinese companies are likely to have little choice in upgrading their automation
investment / manufacturing technology, one could argue that multi-national companies
could simply move their production to countries with cheaper labour costs. We note though
that many other emerging markets are also seeing a substantial increase in wages, and
their base level today is not substantially lower than China’s.
Figure 31: Wage growth CAGR (2007-2011) in US$, unless otherwise stated
Figure 32: Hourly manufacturing costs (2011) in US$, unless otherwise stated
3%2%
8%
10%
9%
4%
Developed Developed(Ex Japan)
EmergingMkts Total
NJAEmerging
LatAmEmerging
EMEAEmerging
$39 $39
$10 $8
$10 $12
Developed Developed(ex Japan)
Emergingmarkets
NJAemerging
LatAmemerging
EMEAemerging
Source: BLS Source: BLS
We think Non-Japan Asia has the largest growth opportunity for investments as this region
accounts for 35% of the world’s manufacturing output, but has a robot density of only 11
per 10,000 manufacturing employees (Figure 33) compared with developed markets which
produce 50% of manufacturing output and yet have a significantly higher robot density of
149. In Figure 33 we show the robot density, which we use a proxy to quantify the level of

20 February 2013
ABB (ABBN.VX) 15
automation, by country, clearly demonstrating that countries such as China or India
currently have considerably lower penetration levels compared to more developed markets
such as Japan, the US or Germany.
Figure 33: % of global output and robots per employee in x, unless otherwise stated
Figure 34: Robot density for select countries (2011) Robots per 10,000 manufacturing employees, unless otherwise stated
50%41%
50%
7%
35%
8%
149
88
11 711
6
Developed Developed(ex Japan)
EmergingMarkets Total
EMEAEmerging
NJAEmerging
LatAmEmerging
% of Global Manufacturing Output
Number of Robots per 10,000 Manufacturing Employees
0
50
100
150
200
250
300
350
Japan
Kore
a
Germ
any
Italy
US
Spain
Taiw
an
Fra
nce
Sw
itzerla
nd
Austra
lia
UK
Chin
a
Bra
zil
Russia
India
Ro
bo
t d
en
sit
y (
x)
Robot density Global average
Source: World Bank, IFR, United Nations Source: World Bank, IFR, United Nations, BLS
Potential pick-up in China could boost organic growth for Automation players
Recent momentum in Chinese indicators (manufacturing PMIs, consumer confidence) and
the new leadership appear likely to spur increased economic activity. If this holds true then
we believe this should bode well for stronger Automation investment going forward.
We show recent corporate momentum in Figure 35 below. Despite a more stable trend
compared to H112, we continue to see earnings volatility as seen in Rockwell’s operating
performance over the last two quarters. Following strong organic sales growth of 11%
during the company’s Q4 (Jul-Sep12) management stated that growth rates in China fell
by more than 9% (seen in the total Asian region) during Q113 (Sep-Dec12). On the
earnings call management continued to cite tight credit availability (similar reason heard
for H112) and delayed order momentum as key explanations why growth in China has not
yet consistently picked up. On a more positive note Rockwell cited better order than sales
performance which might indicate a turning point in momentum starting to kick-in.
We believe there is upside risk to our organic growth forecasts in Automation if there is a
more pronounced pick-up in Chinese Automation investment than we currently assume.
Figure 35: Growth momentum in China/Asia Growth rate specification for included companies: ABB=Asia; Emerson=China; GE=China; GEA=China; Hollysys=China; Omron=China; Rockwell=China; Schneider=Asia; Siemens=China; Yokogawa=Asia
-20%
-10%
0%
10%
20%
30%
40%
50%
Ma
r-09
Jun
-09
Se
p-0
9
De
c-0
9
Ma
r-10
Jun
-10
Se
p-1
0
De
c-1
0
Ma
r-11
Jun
-11
Se
p-1
1
De
c-1
1
Ma
r-12
Jun
-12
Se
p-1
2
De
c-1
2
Sa
les
gro
wth
(%
)
ABB Emerson Rockwell Automation Average (all companies)
Source: Company data, Credit Suisse estimates

20 February 2013
ABB (ABBN.VX) 16
ABB should benefit from Robotics and Oil & Gas /
Petrochemicals
As we highlighted further above ABB has quite a diverse end-market exposure, yet oil &
gas and petrochemical companies represent one of the most important end-markets
accounting for roughly 10% of ABB’s customer base. In addition, we believe that product
areas in factory automation such as Robotics or Motors should continue to generate solid
growth rates in the medium term. We focus on the following:
■ Oil & Gas / Petrochemicals (see points 1 and 2 below) – Strong underlying growth
in Oil & Gas, refining capacity growth in emerging markets and a better outlook for
developed markets, particularly the US
■ Robotics – Above average growth potential within Automation Instrumentation
Oil & Gas / Petrochemicals (1) – Strong underlying growth in Oil & Gas and refining
capacity growth in emerging markets
Oil & Gas represents an important end-market within global industrial automation
(accounting for 20% of the total market; see Figure 24) and strong growth drivers explain
why Automation players such as ABB aim to further expand in this market. ABB operates
mainly in the upstream market (exploration and production) and sells control systems,
drives, cables or electrical solutions to its customers.
Figure 36: ABB’s end-market split in Process Automation Figure 37: ABB’s end-market split in DA&M
Chemical, Oil & Gas35%
Metals & Mining25%
Marine15%
Pulp & Paper10%
Power Generation
5%
Other10%
Discrete
Manufact.20%
Power Generation
10%
Buildings5%
Oil & Gas, Petrochemical
10%
Minerals & Metals25%
Transport10%
Water5%
Other15%
Source: BP Stats, OGJ, Credit Suisse estimates Source: OGJ, Credit Suisse estimates
In order to provide an indication of the growth potential in this market we have highlighted
expectations for offshore rig counts and tubulars in the figures below.
Figure 38: Growth expectations for offshore rig count in x, unless otherwise stated
Figure 39: Growth expectations for tubulars in x, unless otherwise stated
Source: IHS Petrodata Source: IHS Petrodata

20 February 2013
ABB (ABBN.VX) 17
We see two distinct drivers for higher automation investment by the Petrochemical
industry in this cycle compared with prior cycles: (1) increased efforts by emerging Asian
countries to develop domestic refinery / chemical processing capacity; (2) low gas prices
stimulating increased petrochemical plant investments in the US.
After declines in global refining capacity in 2011 and 2012, we are likely to see strong
capacity additions growth over the coming years. On a quarterly basis, refining capacity
additions are set to peak around Q314 / Q115.
We note that at the last Capital Markets Day in September 2012 ABB outlined its plans to
increase its relevance particularly in the oil & gas market. ABB aims to become the
preferred partner for the oil & gas industry supported by an expanding product portfolio.
Figure 40: Addition to global refining capacities in mbopd, unless otherwise stated
Figure 41: Quarterly capacity addition forecasts in mbopd, unless otherwise stated
(1.0)
(0.5)
-
0.5
1.0
1.5
2.0
2.5
3.0
199
51996
199
71
99
81
99
92
00
02001
200
22
00
32
00
42
00
52
00
62
00
72
00
82
00
92
01
02
01
12
01
2E
201
3E
201
4E
201
5E
mb
op
d
(400)
(200)
-
200
400
600
800
1,000
1,200
1,400
Q1
12
Q2
12
Q3
12
Q4
12
Q1
13
Q2
13
Q3
13
Q4
13
Q1
14
Q2
14
Q3
14
Q4
14
Q1
15
Q2
15
mb
op
d
Source: BP Stats, OGJ, Credit Suisse estimates Source: OGJ, Credit Suisse estimates
A large portion of the capacity growth is due to new refineries in China (27% / 49% of
global additions in 2012 / 2013 respectively – Figure 42 and Figure 43) and India (33% /
12% of additions in 2012 / 2013 respectively). In China, our Asia O&G team believes that
key drivers of growth are domestic demand and the desire to reduce the dependence on
imports.
In India, public sector companies are building more capacity – this is potentially because
they are looking to reduce the country’s dependence on private sector refiners.
Figure 42: Refining capacity additions (2012E) Figure 43: Refining capacity additions (2013E)
China
India
Rest of Asia
Middle East
North America
South America
Others
(0.8) (0.6) (0.4) (0.2) - 0.2 0.4 0.6mbopd
China60%
India12%
Middle East12%
North America11%
Rest of Asia3%
South America
1%
Others1%
Source: OGJ, Credit Suisse estimates Source: OGJ, Credit Suisse estimates

20 February 2013
ABB (ABBN.VX) 18
Petrochemicals/Oil & Gas (2) – Better outlook for developed markets, particularly
the US
The recent history of downstream petrochemical investment in the US and Western
Europe has been fairly poor. However, this is changing in the US, given technology
changes in extraction, in particular around hydraulic fracturing technology, which is leading
to substantial production increases in natural gas. The effect on natural gas prices has
been particularly evident over the past 12 months; our Energy Team expects this to persist.
Figure 44: US natural gas reserve/production change Figure 45: US natural gas price
-6%
-4%
-2%
0%
2%
4%
6%
8%
10%
12%
14%
20
02
20
03
20
04
20
05
20
06
20
07
20
08
20
09
20
10
20
11
Gro
wth
yo
y (
%)
US Dry Natural Gas Production US Dry Natural Gas Reserves
0
2
4
6
8
10
12
14
Feb-0
8
May-0
8
Aug-0
8
Nov-0
8
Feb-0
9
May-0
9
Aug-0
9
Nov-0
9
Feb-1
0
May-1
0
Aug-1
0
Nov-1
0
Feb-1
1
May-1
1
Aug-1
1
Nov-1
1
Feb-1
2
May-1
2
Aug-1
2
Nov-1
2
Feb-1
3
Pri
ce (
US
D p
er
MM
Btu
)
US Natural Gas Price Source: The BLOOMBERG PROFESSIONAL™ service Source: The BLOOMBERG PROFESSIONAL™ service
Low gas prices are positive for process automation investment because the cheap
feedstock is resulting in improved economics for companies to invest in US petrochemical
capacity, potentially with a view to increasing exports. According to ICIS, for instance,
currently planned US ethylene capacity additions total 32% of existing capacity.
Figure 46: Announced ethylene capacity expansions in US$bn, unless otherwise stated
Company Project Capacity (tonnes) Location Cost ($bn) Start-up
ExxonMobil Chemical New cracker 1.5mn Baytow n, Texas NA 2016
Chevron Phillips Chemical New cracker 1.5mn Cedar Bayou, Texas NA Q1 2017
Dow Chemical New cracker w orld-scale US Gulf Coast NA 2016-17
Shell New cracker w orld-scale US Northeast NA 2016-17
Formosa Plastics New cracker 800000 Point Comfort, Texas 1.7 2016
Dow Chemical Restart 390000 St. Charles, Louisiana NA end 2012
Westlake Chemical Expansion 108863 Lake Charles, Louisiana NA H2 2012
Williams Expansion 272158 Geismar, Louisiana .35-.40 Q3 2013
INEOS Debottleneck 115000 Chocolate Bayou, Texas NA end 2013
Westlake Chemical Expansion 113399 Lake Charles, Louisiana NA 2014
LyondellBasell Expansion 386000 La Porte, Texas NA 2014
Considered expansions
Sasol New cracker 1.0-1.4m Lake Charles, Louisiana 3.5-4.5 NA
Indorama Ventures New cracker 1.3m NA NA 2018
LyondellBasell Expansion NA Channelview , Texas NA NA
SABIC New cracker w orld-scale US NA NA
Braskem New cracker NA US NA NA
Occidental Chemical New cracker NA Ingleside, Texas NA NA
Aither Chemicals New cracker NA US Northeast 0.75 2016
PTT Global Chemical New cracker NA NA NA NA Source: ICIS
Robotics – Above-average growth potential within Automation Instrumentation
We believe the global robotics market will grow at c.8% on average over the next three
years compared to the total automation instrumentation sector expanding at c.5%. Given
ABB’s top 5 market share position (see Figure 47), we think the company should be a
major beneficiary from this trend. Robotics accounts for 15% of DA&M revenues yet due to
a stronger growth profile we believe that the sales contribution from Robots will surge

20 February 2013
ABB (ABBN.VX) 19
closer to 20% over the next few years. In the most recent quarter management noted a
very strong performance of the company’s Robotics division.
Figure 47: Industrial robot market share Figure 48: Automation Instrumentation market split by revenues
Yaskawa23%
Fanuc22%
Kuka15%
ABB13%
Fujikoshi8%
Kawasaki8%
Other11%
Sensors
30%
Machine Vision20%
Robotics17%
Relays & Switches
16%
Motion Drives12%
Others5%
Source: Credit Suisse research Source: Credit Suisse research
In Figure 49 we have shown growth expectations for the robotics market by region. While
the Americas was forecasted to grow very strongly in 2012, current expectations imply that
growth will level out around 6% by 2015E. In 2013 the APAC region should continue
outgrowing other regions and account for more than 60% of generated Robotics revenues.
Figure 49: Robotics market growth forecasts by region Figure 50: Robotics sales generation by region (2013E)
-1.0%
1.0%
3.0%
5.0%
7.0%
9.0%
11.0%
13.0%
2011 2012E 2013E 2014E 2015E
Gro
wth
(%
)
Americas Europe APAC ROW Total
Americas15%
Europe17%
APAC61%
ROW7%
Source: Markets and Markets, Credit Suisse estimates Source: Markets and Markets, Credit Suisse estimates
The example of Japan from the 1970s and 1980s, and the growth trend in China in recent
years, suggest that China is now entering its inflection point, with discrete automation
investment set to accelerate (see Figure 51). As highlighted further above in this report,
the robot density in emerging markets still falls significantly behind that in developed
regions, particularly relative to hourly wage costs.
Figure 51: Robot stock (base year = 1974 for Japan, 1999 for China) Robot stock in units, unless otherwise stated
Figure 52: Robot density relative to hourly wage cost in different regions in US$, robot density per 10,000 manufacturing employees
0
50,000
100,000
150,000
200,000
250,000
300,000
350,000
400,000
450,000
T+0 T+5 T+10 T+15 T+20 T+25 T+30
Japan
China
$39 $39
$10 $8 $10 $12
149
88
11 7 116
Developed Developed(Ex Japan)
EmergingMkts Total
NJAEmerging
LatAmEmerging
EMEAEmerging
Hourly Cost (USD) Robot Density
Source: IFR, Credit Suisse estimates Source: IFR, Credit Suisse estimates

20 February 2013
ABB (ABBN.VX) 20
We note that Robotics peer company Kuka reported preliminary FY12 results at the
beginning of February highlighting a strong order backlog in Robotics, which has grown
35% in the last fiscal year driven by “considerable demand in China”. The company
expects strong demand in the coming years and consequently is building a new plant for
robot assembly in China.
Consensus underestimates ABB’s growth potential
in Automation
We believe consensus estimates for ABB’s Automation business are too bearish. The
Street currently forecasts flat organic growth in this division in 2013 compared to our
forecasts of 5% organic growth.
Figure 53: Consensus expects org. growth in Automation to be lower than in 2012 despite signs of Chinese leading indicators improving, Europe returning to GDP growth and positive Automation momentum in the US
-4%
-2%
0%
2%
4%
6%
8%
10%
12%
2008 2009 2010 2011 2012 2013E 2014E
Org
an
ic g
row
th (
%)
ABB Automation - Organic growth (incl. CSe) Org. growth forecasts (Cons)
Source: SME, Credit Suisse estimates
In our view consensus expectations, particularly for ABB’s DA&M business, are too
conservative. As described in our top down section on growth drivers above we think that
due to a potential pick-up in shorter-cycle end-markets mainly in emerging markets (and
the US) factory automation will outgrow Process over the next two years. We forecast ABB
to grow DA&M revenues at around 6% (medium term market growth expectations) in
FY13, accelerating to 8% thereafter. Our reported EBIT forecasts in Automation are 8-10%
ahead of consensus over the next two years (see Figure 54).
Figure 54: We are more optimistic about sales and profits in Automation in 2013/14E in USD millions, unless otherwise stated
CS forecasts 2013E 2014E Consensus 2013E 2014E CS vs. cons 2013E 2014E
Sales Sales Sales
DA&M 10,193 11,009 DA&M 9,559 10,046 DA&M 6.6% 9.6%
Process 8,606 9,209 Process 8,439 8,850 Process 2.0% 4.1%
LP 8,017 8,498 LP 7,714 8,118 LP 3.9% 4.7%
Total 26,816 28,715 Total 25,713 27,013 Total 4.3% 6.3%
Reported EBIT Reported EBIT Reported EBIT
DA&M 1,651 1,816 DA&M 1,503 1,647 DA&M 9.9% 10.2%
Process 1,001 1,104 Process 978 1,053 Process 2.4% 4.8%
LP 1,278 1,467 LP 1,145 1,275 LP 11.7% 15.1%
Total 3,930 4,387 Total 3,625 3,975 Total 8.4% 10.4%
Source: Vara Research consensus, Credit Suisse estimates

20 February 2013
ABB (ABBN.VX) 21
Figure 55: ABB’s current cons. EPS growth forecasts are lagging the correlation to US/EU IP seen historically
Figure 56: At times of elevated economic activity, ABB has beaten consensus earnings estimates
-70%
-45%
-20%
5%
30%
55%
80%
-20%
-15%
-10%
-5%
0%
5%
10%
Ja
n-0
5
Ju
l-05
Ja
n-0
6
Ju
l-06
Ja
n-0
7
Ju
l-07
Jan-0
8
Ju
l-08
Ja
n-0
9
Ju
l-09
Ja
n-1
0
Ju
l-10
Ja
n-1
1
Ju
l-11
Ja
n-1
2
Ju
l-12
EP
S g
row
th, ro
llin
g (
%)
IP g
row
tht
(%)
IP - US IP - EU ABB - Consensus EPS (1yr rolling fw)
-20%
-15%
-10%
-5%
0%
5%
10%
0.0
0.2
0.4
0.6
0.8
1.0
1.2
1.4
1.6
1.8
2007 2008 2009 2010 2011 2012
EP
S (
US
D)
EPS estimates (1 year prior to reporting) EPS reported by ABB IP - US
Source: the BLOOMBERG PROFESSIONAL™ service Source: the BLOOMBERG PROFESSIONAL™ service
Higher Service sales could trigger higher valuation
By 2015 ABB aims to raise its group sales contribution from Services to 20-25% from 17%
last year. As we highlight in Figure 57 ABB has over time gradually improved its revenue
share from its Service business from around 15% five years ago.
Figure 57: ABB targets 20-25% of group sales from Service revenues by 2015E
15% 15% 16% 17% 16% 17%
20-25%
0%
5%
10%
15%
20%
25%
30%
2007 2008 2009 2010 2011 2012 2015E
Reven
ue s
pli
t (%
)
Service Product/Systems
Source: Company data, Credit Suisse research
Although ABB does not split out margins from its Service and Products/Systems business,
we believe that based on disclosures from other Capital Goods companies it is fair to
assume that its aftermarket revenues will generate a significantly higher profitability. Due
to ABB’s increasing contribution from Service revenues over the last few years ABB
should have seen a positive margin effect from a better Service/Product mix.
We note that ABB lagged its peers with respect to its revenue contribution from Services
(see Figure 59) in the past and won’t reach the Service revenue averages of the
Electricals and Mechanicals sector even if we take ABB’s new target of 20-25% into
account. However, this is mainly due to the following reasons:
■ The Mechanicals generally tend to have a stronger contribution from Aftermarket
revenues on the back of a market-leading position in often less penetrated markets.
■ The Services share of the Electricals (31%) is mainly boosted by Legrand (c60% of
group sales from Service). If we exclude Legrand from the Electricals group, we derive
an average of 24% which falls within ABB’s target range of 20-25%, hence does not
put ABB at a disadvantage.

20 February 2013
ABB (ABBN.VX) 22
Acquisitions of Baldor and Thomas and Betts should drive higher Service demand
We highlight in Figure 58 ABB’s split between Service and Product/Systems revenues for
each of the company’s divisions. As the graph demonstrates the company has the most
significant Service offering in its Process Automation business due to:
■ Selling of a service package often in combination with original equipment such as a
control system
■ Solid 10% exposure to turbochargers which have a high service business
■ Stronger software business in Process than in Discrete Automation
Although customers in DA&M often tend to maintain the product themselves, we believe
that both DA&M and Low Voltage have good potential to grow their Service business.
While in DA&M only the Robotics business currently has a strong service business
(c.35%) we think that due to the two sizable acquisitions in Automation (Baldor in DA&M
and Thomas and Betts in LV) ABB has significantly expanded its installed base (+10,000
distributors split between Baldor 4,000 and T&B >6,000) in the North American market,
which over time should lead to an increase in Service demand. While the T&B does not
have a Service business and won’t develop one in our view, we think that Baldor has good
potential to build an aftermarket business from currently using third-party providers.
Figure 58: Split between Service and Products/Systems revenues per division
85%
60%
95% 90% 85%
15%
40%
5% 10% 15%
0%
25%
50%
75%
100%
DA&M PA LV PP PS
Reven
ue s
pli
t (%
)
Products/Systems Service
Source: Company data

20 February 2013
ABB (ABBN.VX) 23
Companies on a higher valuation multiple tend to have a stronger Service offering
We believe that ABB’s target of 20-25% could be conservative given the company’s
installed base in some of its end-markets and a focus on raising the Service share via
acquisitions. While it might seem too optimistic to assume ABB will increase its Service
share to average levels of the Mechanicals, we think that a share beyond 25% could be
achievable. We highlight in Figure 59 that higher margin companies often trade on a
higher valuation multiple and conclude that if ABB successfully raises its share of more
profitable Service revenues the market might reflect this in form of a higher valuation.
Figure 59: A higher Service revenue contribution suggests a higher valuation multiple for Capital Goods companies
% of Group revenues
from Service
EBITA margin
(FY13E)
EBITA margin
(FY14E)
EV/Sales
(FY13E)
EV/Sales
(FY14E)
EV/EBITA
(FY13E)
EV/EBITA
(FY14E)
ELECTRICALS
Alstom 30% 7.0% 7.2% 0.64 0.59 9.1 8.2
Legrand 60% 19.5% 19.6% 2.17 2.06 11.1 10.5
Philips 10% 10.2% 10.3% 0.96 0.89 9.3 8.6
Schneider 37% 14.0% 14.3% 1.48 1.39 10.6 9.7
Siemens 20% 12.4% 12.6% 1.06 0.97 8.5 7.7
MECHANICALS
Alfra Laval 26% 17.3% 18.0% 1.96 1.80 11.3 10.0
Assa Abloy 67% 16.8% 17.0% 2.13 1.95 12.6 11.4
Atlas Copco 41% 21.4% 21.8% 2.34 2.08 10.9 9.6
Electrolux 15% 6.4% 6.5% 0.46 0.42 7.2 6.5
Kone 54% 14.5% 15.0% 2.24 2.06 15.5 13.7
Metso 45% 9.4% 9.7% 0.76 0.71 8.1 7.4
Sandvik 28% 15.0% 15.9% 1.64 1.48 10.9 9.3
Schindler 61% 12.9% 13.6% 1.63 1.49 12.6 11.0
SKF 18% 12.0% 13.6% 1.39 1.28 11.6 9.4
Average Electricals 31% 12.6% 12.8% 1.26x 1.18x 9.8x 8.9x
Average Mechanicals 39% 14.0% 14.6% 1.62x 1.47x 11.2x 9.8x
Average Total 37% 13.5% 13.9% 1.49x 1.37x 10.7x 9.5x
ABB 18% 12.7% 13.5% 1.28x 1.15x 9.9x 8.5x Source: Company data, Credit Suisse estimates
In Figure 60 we provide a sample of ABB’s service offering across its divisions.
Figure 60: ABB’s Service offering across its divisions
ABB's Service portfolio
Service agreements Maintenance Extensions upgrades & retrofits
Installation & commissioning Repairs End of life services
Training Engineering & consulting Replacement
Spares & consumables Advanced services
Source: Company data

20 February 2013
ABB (ABBN.VX) 24
Power ABB’s Power division is the primary reason why ABB’s shares continue to lag the
performance of the wider Capital Goods sector as well as its direct Electrical peers in our
view. It seems as if the market ignores the potential within the company’s Automation
division and despite margin stabilisation in Power Products for several quarters awaits
further evidence that the deterioration in profitability caused by emerging market
competition won’t repeat itself. While we think it would be wrong to rule this out
completely, we would argue that the main transformer costs (raw materials: copper &
steel, labour, shipping) are easily traceable, hence the US Department of Commerce will
likely monitor the development carefully in order to protect local manufacturing going
forward. Contrary to consensus expectations, we believe that ABB’s Power Product
margin has stronger upside potential based on better pricing trends and a strict, on-going
cost savings focus. We have backed up our argument with channel checks, which have
flagged the potential for improved pricing as well as higher US T&D spending in the
medium term benefiting players with a strong market position such as ABB.
Within this section we focus on the following topics:
■ Glance at ABB’s market position in Power – Similar to the company’s Automation
division ABB’s geographical balance, well established market leading position in
several products categories and long lasting experience and expertise should serve
the company well to benefit from structural growth trends in emerging (e.g. strong
electricity consumption) as well as in developed markets (e.g. energy efficiency focus).
ABB generates more than 70% of its Power revenues from transformers, substations
systems and high/medium voltage products such as gas insulated switchgears, circuit
breakers or protection systems.
■ Drivers for higher US T&D spend going forward – While strongly growing electricity
consumption will be a much more significant driver in emerging markets than in
developed regions, we believe various growth drivers will force utilities to increase
their capex spend in countries such as the US in the medium term. Given that the age
of the installed base tends to be on average more than 30 years old, utilities will in our
view either upgrade their equipment over time or install back-up equipment to avoid
blackouts. Our channel checks indicate that the reliability factor accounts for roughly
50% of new investment spend. Furthermore, we think that drivers such as on-going
economic growth, new energy sources (e.g. renewables), monitoring, regulation and a
recovery of the housing market could further boost T&D spending.
■ Benefits from Chinese government stimulus – China accounts for c11% of ABB’s
group revenues of which the company generates c42% from its Power divisions. With
a strong exposure to high and medium voltage products (c.80% of Chinese sales) we
believe ABB is well positioned to benefit from a re-accelerated government stimulus in
several key end markets such as rail and wind. Given the huge focus on energy
efficiency going forward, China targets 100GW of installed wind capacity by 2015,
implying an increase of 15GW per year. Following a two-year setback due to
corruption allegations and the fatal accident in Wenzhou, leading to a more cautious
approach by the government, the Ministry of Rail has recently indicated that the
railway programme, targeting a doubling in spend between 2011-15, remains
unchanged. Due to the fact that ABB manufactures various products such as MV
switch gears for the rail industry (one of the higher margin products within Power), we
think ABB should benefit from a re-focus on economic stimulus by the government.
■ Margin upside potential in Power Products – Contrary to consensus estimates we
believe that ABB’s Power Products division has stronger margin upside potential
towards the end of FY13 and in FY14 due to better pricing momentum on new orders
last fiscal year (average lead time 12-18 months) and an on-going focus on cost
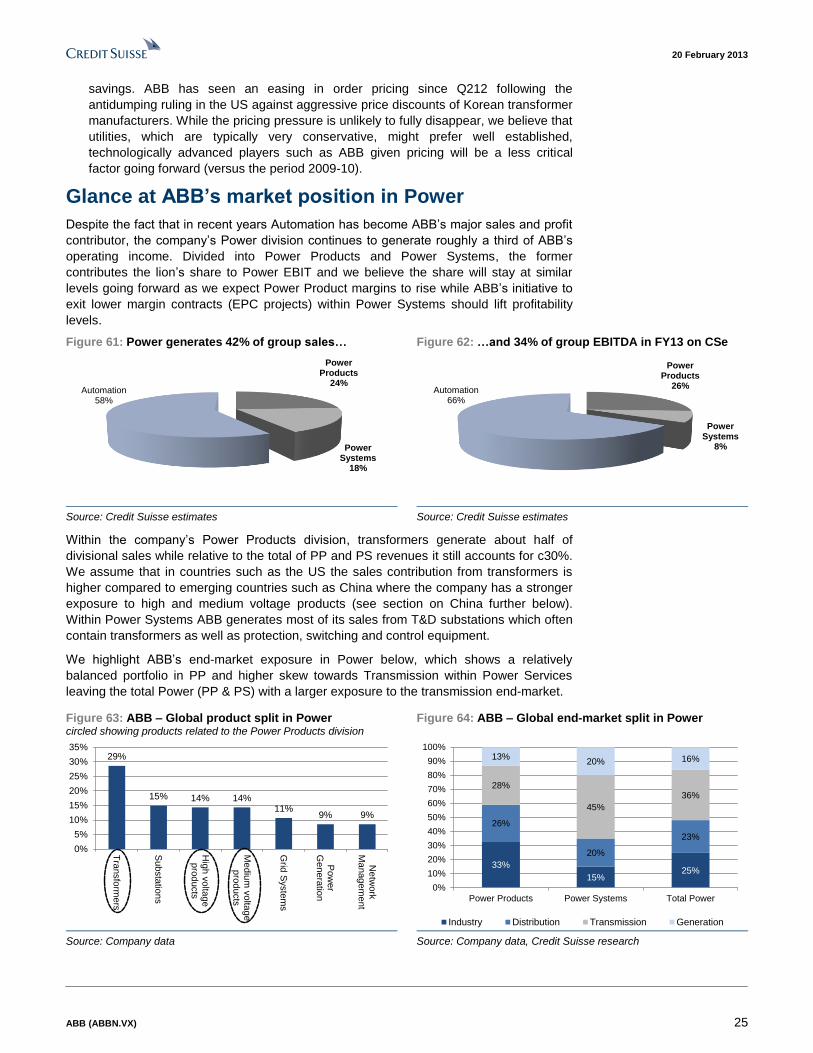
20 February 2013
ABB (ABBN.VX) 25
savings. ABB has seen an easing in order pricing since Q212 following the
antidumping ruling in the US against aggressive price discounts of Korean transformer
manufacturers. While the pricing pressure is unlikely to fully disappear, we believe that
utilities, which are typically very conservative, might prefer well established,
technologically advanced players such as ABB given pricing will be a less critical
factor going forward (versus the period 2009-10).
Glance at ABB’s market position in Power
Despite the fact that in recent years Automation has become ABB’s major sales and profit
contributor, the company’s Power division continues to generate roughly a third of ABB’s
operating income. Divided into Power Products and Power Systems, the former
contributes the lion’s share to Power EBIT and we believe the share will stay at similar
levels going forward as we expect Power Product margins to rise while ABB’s initiative to
exit lower margin contracts (EPC projects) within Power Systems should lift profitability
levels.
Figure 61: Power generates 42% of group sales… Figure 62: …and 34% of group EBITDA in FY13 on CSe
Power Products
24%
Power Systems
18%
Automation58%
Power Products
26%
Power Systems
8%
Automation66%
Source: Credit Suisse estimates Source: Credit Suisse estimates
Within the company’s Power Products division, transformers generate about half of
divisional sales while relative to the total of PP and PS revenues it still accounts for c30%.
We assume that in countries such as the US the sales contribution from transformers is
higher compared to emerging countries such as China where the company has a stronger
exposure to high and medium voltage products (see section on China further below).
Within Power Systems ABB generates most of its sales from T&D substations which often
contain transformers as well as protection, switching and control equipment.
We highlight ABB’s end-market exposure in Power below, which shows a relatively
balanced portfolio in PP and higher skew towards Transmission within Power Services
leaving the total Power (PP & PS) with a larger exposure to the transmission end-market.
Figure 63: ABB – Global product split in Power circled showing products related to the Power Products division
Figure 64: ABB – Global end-market split in Power
29%
15% 14% 14%11%
9% 9%
0%
5%
10%
15%
20%
25%
30%
35%
Tra
nsfo
rmers
Substa
tion
s
Hig
h v
olta
ge
pro
ducts
Me
diu
m v
olta
ge
pro
ducts
Grid
Syste
ms
Pow
er
Gen
era
tion
Ne
twork
Ma
nag
em
ent
33%
15%25%
26%
20%
23%
28%
45%
36%
13%20% 16%
0%
10%
20%
30%
40%
50%
60%
70%
80%
90%
100%
Power Products Power Systems Total Power
Industry Distribution Transmission Generation Source: Company data Source: Company data, Credit Suisse research

20 February 2013
ABB (ABBN.VX) 26
Similar to the split by end-markets, ABB’s geographical split shows a higher dependence
on one market, i.e. Europe, and a pretty balanced split between the Americas and Asia.
The stronger exposure to Europe derives from an over proportionally higher Systems
business (40% in Europe). Given the superior growth potential in emerging markets,
particularly Asia, in the medium term we believe it is fair to assume that the revenue
contribution will rise from currently around 25% at the expense of developed markets,
particularly Europe.
Figure 65: ABB – Geographical sales split in Power Figure 66: Org. growth and margin development in Power
34%40% 37%
27% 20% 24%
30%
18%25%
9%22%
15%
0%
10%
20%
30%
40%
50%
60%
70%
80%
90%
100%
Power Products Power Systems Total Power
Europe Americas Asia MEA
-15%
-10%
-5%
0%
5%
10%
15%
20%
25%
2006 2007 2008 2009 2010 2011 2012
Gro
wth
& M
arg
ins
(%
)
EBIT margins - Power Products EBIT margins - Power Systems
Organic growth - Power Products Organic growth - Power Systems
Source: Company data Source: Company data
Drivers for higher US T&D spend going forward
While strongly growing electricity consumption in emerging countries continues to be a
material driver for higher T&D investment, the growth rates in developed markets have
slowed down over the past decade. Irrespectively of lower consumption levels we believe
there are various growth drivers, which will force utilities to increase their capex spend in
the medium term.
Figure 67: Electricity consumption in developed countries Figure 68: Electricity consumption in emerging countries
2009 2012E 2015E
Other Commercial sector Residential sector
Transport sector Industry sector
+1.2% p.a.
8.5tr GWh 8.9tr GWh 9.2tr GWh
2009 2012E 2015E
Other Commercial sector Residential sector
Transport sector Industry sector
+7.1% p.a.
9.0tr GWh
11.2tr GWh
13.6tr GWh
Source: EIU, Credit Suisse research Source: EIU, Credit Suisse research
Key growth drivers of T&D investment going forward
■ Reliability/age of the infrastructure – Based on our channel checks, we think the
main driver accounting for the majority of T&D investment going forward will be
reliability and age of the infrastructure. Given US T&D build had its biggest push in the
1960s, the average T&D equipment is over 30 years old with a number of transformers
even reaching a lifetime of more than 50 years. Industry experts describe the overall

20 February 2013
ABB (ABBN.VX) 27
T&D system as weak, hence the age of the installed base is likely to become more of
an issue going forward. History suggests that if utilities upgrade their equipment they
tend to upgrade the grid as well. As a result of severe blackouts in the past, utilities
also aim for a back-up of the largest transformer or transmission line. This often
triggers upgrades to the existing equipment as utilities aim to use more powerful
transformers to better absorb the electricity loss if equipment fails.
Figure 69: Age of installed capacity (OECD) Figure 70: US coal plant vintage
0 100 200 300 400 500 600
0 to 10 years
10 to 20years
20 to 30years
30 to 40years
40 to 50years
50+ years
GWCoal Gas Oil Nuclear
0
10
20
30
40
50
60
70
1940-1
944
1945-1
949
1950-1
954
1956-1
959
1960-1
964
1965-1
969
1970-1
974
1975-1
979
1980-1
984
1985-1
989
1990-1
994
1995-1
999
2000-2
004
2005-2
009
2010
GW
No Emission Control FGD&S CR FGD Only SCR Only
Source: Energy Information Administration Source: Energy Velocity, Company data, Credit Suisse estimates
■ Economic growth – While not as material for utilities to make an investment decision,
economic growth still has an influence of c30% on whether utilities upgrade their T&D
equipment, based on our channel checks. Given that GDP growth in the US is
currently forecasted to expand by 2% and 2.5% respectively over the next two years
(by our CS Economics team) we believe that economic growth will be supportive for
an investment decision yet not as significant as structural growth drivers (age of the
installed base; new energy sources). We would highlight that GDP growth tends to be
a more important driver for distribution investment given the closeness to the actual
consumer while transmission investment is mainly driven by utilities’ capex spend.
■ New energy sources – Given the shift towards more renewable energy usage
targeting lower carbon emissions, we believe that this could trigger a significant
investment into T&D equipment. Owing to the fact that power needs to be shifted into
other parts of the country, transmission and distribution equipment often needs to be
upgraded as well. The US currently targets to reduce carbon emission by 17% from
2005 levels by 2020, which could force higher T&D capex spend.
■ Monitoring – Utility companies have increasingly invested in equipment monitoring in
order to avoid system failures. Key monitoring items are the temperature and the load
of equipment such as transformers. In line with utilities aiming to improve the reliability
and efficiency, an increased investment into more intelligent equipment (e.g.
transformers) will play a major role to enable smarter grid applications such as better
outage detection, volt control or quality monitoring.
■ Regulation – The US Department of Energy released a new standard effective at the
beginning of 2010 which targets significantly higher energy efficiency of transformers.
The standard forces an energy reduction of approximately 30% which environmental
interest groups didn’t consider sufficient enough. We believe that the reduction of
carbon emissions and that new potential regulations will continue to be a key topic that
can drive higher T&D investment spend.

20 February 2013
ABB (ABBN.VX) 28
■ Recovery in the housing market – We believe that an on-going recovery in the
housing market could lead to higher investment in the distribution equipment market
as systems might need to be upgraded. Owing to the fact that transmission and
distribution spend tend to lag each other depending on which kicks off first, we believe
that a housing recovery could also trigger stronger transmission investment. The
distribution market appears to follow the housing market with roughly an approximately
three-year lag. Given the continued US housing recovery for the last 12 months we
think the distribution market could see investments kicking in throughout 2014.
Figure 71: Planned US transmission investment expected to accelerate in 2013
Figure 72: North American Electrical Infrastructure Investment estimates
8.6 8.99.5
10.3 10.211.1
13.5
0
2
4
6
8
10
12
14
16
2006 2007 2008 2009 2010 2011 2012E
Inv
estm
en
t (U
SD
bn
)
North American Electrical Infrastructure Investment Est.
• 260,000 miles of transmission in planning in North
America
• US annual transmission spending will average $12-16bn
between 2011 and 2015E vs. average annual spend of
$7.8bn from 2004-2009
• US annual distribution spending will average approx.
$29bn per year between 2010 and 2030 versus average
annual spend of approx. $26bn between 2000 and 2008
• Canadian utilities conservatively estimated to spend more
than $36bn in transmission over the next 20 years; $62bn
on distribution
Source: Edison Electric Institute, Business Information Group Source: Quanta Services, Platts, Wires & Brattle Group, EEI
ABB’s management has flagged in the past that order momentum in the US tends to follow
GDP growth quite well. We show the correlation in Figure 73 and argue that if industrial
production momentum should develop as forecast by our CS Economics team, then ABB
should continue to see strong order momentum within its US Power division.
Figure 73: Solid IP growth should continue to trigger strong order growth in US Power
5%
12%
18%
25%
32%
38%
45%
-1%
0%
1%
2%
3%
4%
5%
Q3
10
Q41
0
Q1
11
Q2
11
Q3
11
Q4
11
Q1
12
Q2
12
Q3
12
Q4
12
Q1
13E
Q2
13E
Q31
3E
Q4
13E
AB
B U
S o
rde
r g
row
th (
%)
US
rea
l G
DP
gro
wth
(q
oq
%)
US GDP growth ABB Power order growth - US Source: Company data, Credit Suisse estimates

20 February 2013
ABB (ABBN.VX) 29
Benefits from Chinese government stimulus
Improved order momentum should start contributing to sales growth
Accounting for c11% of group revenues, ABB’s China business does not provide investors
with the most significant Chinese exposure across the Capital Goods universe, yet China
plays a more important role for ABB than for its Electrical peers on average (c.7% of group
sales). Similar to the average on a group revenue level ABB’s Chinese business
generates more top line from its Automation business than from its Power division (see
Figure 75).
Figure 74: China accounts for c.11% of group revenues Figure 75: ABB’s sales split in China across the divisions
Europe38%
Americas27%
MEA11%
China11%
RoA13%
Automation58%
Power42%
Source: Company data, Credit Suisse estimates Source: Company data, Credit Suisse estimates
As we mentioned at the introductory part of this section, China has a different product
proposition than the Power division on average. ABB generates the majority of its Chinese
Power revenues from high and medium voltage products and not from transformers, which
account for c.50% of Power sales at group level.
Since the middle of 2011, ABB has seen a pick-up in order momentum, with growth rates
accelerating at a double digit rate since Q212. Given an average lead time of roughly 12
months for Power products, we think that ABB could see the positive sales impact
throughout 2013.
Figure 76: ABB generates the majority of Chinese sales in HV and MV rather than transformers in Power
Figure 77: Order growth in ABB’s Power division in China has accelerated
High voltage50%
Medium voltage
30%
Transformers20%
-80%
-60%
-40%
-20%
0%
20%
40%
Q11
0
Q21
0
Q31
0
Q41
0
Q11
1
Q21
1
Q31
1
Q41
1
Q11
2
Q21
2
Q31
2
Q41
2
Ord
er
gro
wth
(%
)
ABB Power order growth - China Linear trendline
Source: Credit Suisse estimates Source: Company data
Focus on energy efficiency / higher rail investment should support top-line growth
We believe that China’s focus on energy efficiency will be a significant driver of T&D
investment going forward. We note that as part of the 12th five-year plan the Chinese
government aims to reduce carbon emission standards by 17% relative to GDP between
2010 and 2015. This implies material investment into renewable energy sources such as
wind and less installation of new coal-fired power plants. We think that new energy
sources such as wind energy will lead to sizable investment into new grid connections,
which should allow China to transfer the energy captured to other regions within the

20 February 2013
ABB (ABBN.VX) 30
country. We think that this is particularly relevant for wind energy as the location of new
wind farms is dependent on optimal wind conditions rather than closeness to the
consumer.
We have highlighted several key topics from China’s 12th five-year plan in Figure 78 that
emphasise the potentially positive impact for ABB.
Figure 78: Key points of the Chinese 12th
five year plan most likely relevant for ABB Relevant topics in China's 12th five year plan
Topic Implications for ABB
Targeting 100GW installed wind power capacity
by 2015 implying 15GW of new capacity installed
each year; 200GW by 2020 (of which 30GW
offshore)
Higher government/utlity spending to improve grid connections and to drive
enhanced equipment performance. Conecting offshore wind farms to the grid
will be a key focus where China could rely on foreign technology
Limit installation of new coal fired power plants &
boost share of wind, solar and nuclear
A higher share of new energy sources often implies installations/upgrades to
the grid as energy needs to be transferred into different regions
Plan expects a doubling in consumer power
consumption per capita
Upgrades to the distribution system implying demand for transformers, circuit
breakers, switches, protection systems
Government aiming to cap electricity
consumption at 8% per year until 2015
Positive: Controlled consumption could make utility spending more
predictable hence easier to forecast for suppliers such as ABB
Negative: Limits the opportunity to grow for suppliers
Stengthen the construction of grid-connections More investment likely as well as potential upgrades to the current T&D
system
Innovation and development of new strategic
industries
Triggering more energy usage which will lead to an expansion of
transmission lines, distribution lines and power products in general
Source: International Energy Agency, China’s National Energy Administration, The BLOOMBERG
PROFESSIONAL™ service
Given the expected rise in government spend in a variety of end-markets particularly in
areas such as infrastructure (rail) and power generation (wind) we believe ABB is well
positioned to benefit from this uptick in spending levels. At this point we believe it is worth
mentioning that during our China industrial trip in November last year we had the
impression that companies that depended on government spending in the
abovementioned end-markets were talking much more positively about business
momentum.
Figure 79: ABB’s medium voltage business should benefit from higher rail investment in RMB millions, unless otherwise stated
-
100,000
200,000
300,000
400,000
500,000
600,000
700,000
800,000
900,000
2003 2004 2005 2006 2007 2008 2009 2010 2011 2012E 2013E
Inve
stm
en
t s
pe
nt
(Rm
b m
n)
Rail Equipment Rail Infrastructure
Source: Ministry of Rail, Credit Suisse estimates
While the investment in the rail sector has dropped significantly in 2011 following record
levels in 2010, the spending levels seem to have improved in 2012 and look set to expand
further in the current fiscal year.

20 February 2013
ABB (ABBN.VX) 31
ABB serves the railway sector across its divisions. From infrastructure investing, which
involves AC/DC substations or distribution transformers, to rolling stock such as traction
motors or turbo chargers, ABB provides a wide variety to its rail customers.
We believe it is worth pointing out that higher government investment in high-speed rail
could lead to margin expansion potential for ABB given its DC circuit breakers, which the
company produces for the high speed rail sector, account for one of the highest margin
businesses within Power Products.
Although the Chinese high-speed rail sector had a two-year setback following corruption
allegations and the fatal accident in Wenzhou triggering a more cautious approach by the
government, according to latest indications by the Ministry of Rail, China’s 2011-15 railway
programme will remain unchanged. The programme implies a doubling in the high-speed
network, reaching 18,000km by 2015.
Pricing trends for major projects have stabilised
Following a significant drop in pricing in 2010 in all major product categories, we believe
the pricing trends for major projects have stabilised over the last two years. A pick-up in
economic and industrial production momentum in the medium term (as expected by our
economists) should be supportive for pricing as it limits the drive for market share gain.
Figure 80: Pricing trend of major projects in HVAC
Price trend of major projects in HVAC (220-500kv)
Transformers (Rmb/kva) 2009 2010 2011 2012
220kv 45 33 35 35
500kv 36 22 23 24
GIS (Rmb'000/set) 2009 2010 2011 2012
220kv NA NA 1450 1480
GCB (Rmb'000/set) 2009 2010 2011 2012
220kv 350 220 205 210
500kv 1030 760 765 750 Source: Credit Suisse research
We show market share trends in China for major product categories in Figure 81 below
and as we can see the T&D product market is quite fragmented. While ABB seems to
have lost market share in gas insulated switchgear and generator circuit breakers last
year, most likely at the cost of local competitors, its transformer market share has
remained stable. We believe that part of the market share loss can be explained by
weaker economic momentum in FY12, where customers might have chosen a cheaper
potentially lower quality local product rather than a technology-advanced foreign product.
Figure 81: Market share trends amongst different product categories in Power Products GIS=Gas insulated switchgear; GCB=Generator circuit breakers
Market share in China
Transformers 2010 2011 2012 GIS 2010 2011 2012 GCB 2010 2011 2012
TBEA 27% 26% 25% China XD 23% 18% 24% Alstom 19% 18% 20%
China XD 15% 13% 14% Shandong Taikai 15% 19% 16% Shangdong Taikai 10% 12% 18%
Tianwei Baobian 7% 11% 8% Pinggao Electric 17% 22% 14% ABB 18% 20% 15%
ABB 4% 6% 6% Shenyang Electric 14% 14% 11% Siemens 15% 15% 14%
Siemens 5% 3% 6% Beijing Switchgear 6% 5% 8% Pinggao Electric 5% 8% 10%
Changzhou Toshiba 6% 10% 2% ABB 5% 6% 1% China XD 15% 13% 8%
Others 36% 31% 39% Pinggao Toshiba 4% 2% 1% Others 18% 14% 15%
Others 16% 14% 25% Source: Credit Suisse research

20 February 2013
ABB (ABBN.VX) 32
Stronger margin upside potential in Power Products
We believe that ABB could see an even stronger increase in its Power Products margin
than consensus estimates are currently implying. We argue as follows:
(1) There should be a positive margin impact towards the end of FY13E and in FY14E
from better pricing on new orders mid FY12, particularly following the antidumping
ruling in the US last July; and
(2) The on-going cost savings priority in Power should support profitability levels.
Positive margin impact towards the end of FY13E and in FY14E from better pricing
on new orders mid-2012, particularly following the antidumping ruling in the US
Following negative transformer pricing of c6-7% for new PP orders in 2010, we have seen
an improved pricing development in the range of negative 2-3% on orders in the recent
quarter. Given the lead time of roughly 12-18 months for Power Products equipment, sales
were still impacted from negative 5-6% in the last quarter but the positive order pricing
since the middle of last year will in our view start to have a positive impact on margin
towards the end of FY13 and in FY14. We think that consensus is currently not reflecting
the combination of an on-going strong cost savings focus and positive margin impact from
less pricing pressure in 2012.
Figure 82: Illustration of the lag between order and sales pricing pressure in PP
2010 2011 Q112 Q212 Q312 Q412
ABB pricing pressure on PP Orders (CSe) ABB pricing pressure on PP Sales (CSe)
Source: Credit Suisse estimates
The following key factors will be margin-supportive, in our view:
■ Antidumping ruling (July 2012) – Driven by sizable transformer price discounts by
Korean producers, the profitability of ABB’s Power Products business deteriorated
between 2009 and 2012 (see Figure 83). The US Department of Commerce has
argued that Korean producers/exporters Hyosung Corporation and Hyundai Heavy
Industries have sold large power transformers in the US at dumping margins between
14.95% and 29.04% vs. an average of 22% for all other Korean producers. As a result,
imports of liquid dielectric large power transformers from South Korea had been
required to deposit dumping duties since February 2012. The ruling will hold for a
minimum of five years.
While the antidumping ruling only affects the Korean companies, we don’t see a
significant risk that other foreign players will flood the market with materially
discounted equipment. Given that the manufacturing costs of transformers such as

20 February 2013
ABB (ABBN.VX) 33
raw materials (copper, steel) as well as labour and shipping costs are relatively easy
to track, we think that the Department of Commerce will monitor the pricing situation
closely to protect local manufacturers.
Figure 83: ABB’s Power Product EBIT margin (CS and consensus) vs. SPX’s medium transformers margins
0%
4%
8%
12%
16%
20%
24%
28%
12%
13%
14%
15%
16%
17%
18%
19%
2007 2008 2009 2010 2011 2012 2013E 2014E
SP
X m
arg
in (
%)
AB
B m
arg
in (
%)
EBIT margin - SPX Medium Transformers (CSe)
EBIT margin - ABB PP (CSe)
EBIT margin - ABB PP (Cons) Source: Company data, SME, Credit Suisse estimates
■ Technological advantage/importance of delivery – Following the antidumping
ruling, we believe that criteria such as technological advantage, quality and service will
play a more important role going forward. According to our channel checks,
companies such as ABB seem to have a competitive advantage with respect to
perceived reliability or lower electricity loss ratios compared to Asian players. As a
lower loss ratio saves costs, the pricing argument becomes less of an issue if there is
a clear technological advantage. We believe this could improve ABB’s pricing
development going forward.
In addition, the dependence on exact delivery of the equipment pays a major role in
the supplier decision-making by utilities. Given that players such as ABB have a long
and established manufacturing base in the US, we think utilities might be more prone
to pick them in this respect over new competition entering the market.
■ Utility conservatism – Utilities tend to be very conservative in their decision-making,
not least in their choice of supplier. When price discounts in the range of c.15-30%
enter the market, we think that even the most conservative company might consider
changing supplier. However, given that price is much less of an incentive in the current
market, this is another reason we would expect utilities to opt for established players
such as ABB.
■ US equipment/systems very customised – Industry experts describe the US T&D
systems being used as more customised compared to the equipment/systems used in
Europe. We believe that this materially limits the threat from new entrants as products
need to be much more specialised depending on the customers.
■ IP momentum could keep raw material prices at ease – History indicates that raw
material prices tend to correlate well with industrial production momentum. Given the
fact that our economists expects industrial production to improve yet not rise
materially, we could see a more stable raw materials development going forward
which should also lead to more stable transformer pricing.

20 February 2013
ABB (ABBN.VX) 34
Figure 84: US transformer prices move in line with prices of its underlying commodities
-70%
-35%
0%
35%
70%
105%
140%
-10%
-5%
0%
5%
10%
15%
20%
Jun
-08
Oct-
08
Fe
b-0
9
Jun
-09
Oct-
09
Fe
b-1
0
Jun
-10
Oct-
10
Fe
b-1
1
Jun
-11
Oct-
11
Fe
b-1
2
Jun
-12
Oct-
12
Fe
b-1
3
Infl
ati
on
(%
yo
y)
PP
I (%
yo
y)
US PPI - Transformers and Power Regulators CS Raw Material Inflation Index
Stabilisation
Source: Thomson Reuters, The BLOOMBERG PROFESSIONAL™ service, Credit Suisse estimates
On-going cost savings priority in Power should support profitability levels
We believe that ABB will continue to focus the majority of its cost savings on its Power
division, similar to what we have seen in 2012. We think that the market is questioning
whether ABB will be able to cut costs to a similar degree to what we have seen since 2009
($4.1bn in 2009-11, $1.1bn in 2012). Yet, we argue that in addition to the annual target of
c.$1bn savings per annum related to global sourcing, footprint adjustments and
operational efficiency improvement, ABB detected a further $2bn of opex cost savings
opportunities in 2011 ($550m saved at the time) and has said it expects more than $300m
opex savings in FY13. We believe this should support margin levels going forward.
Figure 85: ABB – Cost savings evolution Cost savings as a percentage of cost of sales
Figure 86: Cost savings split in 2012
3.50%2.70% 2.30% 2.30%
1.70%2.70%
0.20% 0.20%
1.30%1.40%
1.60% 1.60%
0%
1%
2%
3%
4%
5%
6%
7%
8%
2009 2010 2011 H1 2012
Sourcing Global Footprint OPEX
tTarget range: 3-5%
Automation35%
Power58%
Indirect sourcing
7%
Source: Company data, Credit Suisse estimates Source: Company data
We highlight ABB’s cost savings by type and value in Figure 87 below.
Figure 87: Cost savings by type and value
Professional SCM 15-20% > 3,000 buyers active
Re-sourcing 10-15% Emerging market, best cost sourcing
Collaboration & consolidation 15-20% Steel procurement and indirect materials
Global footprint Restructuring 5-15% Self-sufficient trading zones
Operational excellence OPEX projects 40-50% Design-to-cost
3-5% COS
Supply chain
Total
Savings
Source: Company data, Credit Suisse research

20 February 2013
ABB (ABBN.VX) 35
In Figure 88 we show the quarterly impact of pricing and cost savings as a percentage of
sales, as provided in ABB’s profit bridge. In 2010 when the pricing impact from orders
taken in 2009 hit the income statement, pricing pressure was c.4-5% of sales. If we look at
the 2011/12 period, the range of pricing pressure has been between 2-3%.
Figure 88: Pricing impact relative to cost savings in USD millions, unless otherwise stated
-50
0
50
100
150
200
250
300
-1.0%
0.0%
1.0%
2.0%
3.0%
4.0%
5.0%
6.0%
1Q
10
2Q
10
3Q
10
4Q
10
1Q
11
2Q
11
3Q
11
4Q
11
1Q
12
2Q
12
3Q
12
4Q
12
Net
sav
ing
s (
US
Dm
)
Sav
ing
s /
Pri
ce e
rosio
n (
%)
Productivity savings Product price erosion (negative)
Net savings (Savings - Price erosion)
Source: Company data

20 February 2013
ABB (ABBN.VX) 36
Scope for acquisitions Following ABB’s acquisitions of Baldor for $4.2bn in FY11 and Thomas and Betts for
$3.9bn in FY12, the company’s strong net cash position in 2009/10 has shifted to a net
debt position of $1.6bn (on simple net debt) by the end of FY12 (see Figure 89). As a
result, we believe that acquisitions of a similar size to Baldor and T&B are less likely in the
short term. We also note that management recently flagged on the Q4 earnings call that
ABB does not target large deals in the short term. However, we view size as a less critical
issue if a potential deal makes strategic sense. In terms of potential uses for cash, we
believe a continued focus on expanding market share in selected areas (PLC’s, Oil & Gas,
Service) via targeted M&A would generally be more attractive than share buybacks or
special dividends.
ABB has an official net debt/EBITDA target range of 1.5-2.0x. Despite more limited
balance sheet strength at present, we estimate that if it were to use its leverage potential
(within guidance range) it would have capacity for $10-14bn of acquisitions in FY13 (see
Figure 89).
Figure 89: ABB – Excess capital from re-leveraging in USD millions, unless otherwise stated
Excess capital from re-leveraging 2010A 2011A 2012A 2013E 2014E 2015E
Total cash and equivalents 8,610 5,767 8,481 10,087 11,942 13,657
Total debt 2,182 3,996 10,071 10,071 10,071 10,071
Simple net debt (cash) excl. minorities (ABB calc.) -6,428 -1,771 1,590 -16 -1,871 -3,586
Net debt/EBITDA -1.3x -0.3x 0.3x 0.0x -0.2x -0.4x
Pension underfunding 700 1,000 1,800 1,800 1,800 1,800
Net debt (cash) incl. pensions excl. minorities -5,728 -771 3,390 1,784 -71 -1,786
EBITDA 4,824 6,014 5,555 6,832 7,636 8,193
Financial headroom
@ 1.5x 10,265 13,326 15,875
@ 2.0x 13,681 17,144 19,971 Source: Company data, Credit Suisse estimates
If we pencil in the financials from a theoretical acquisition into our scenario, and assume
management leverages the business to the top end of its target (2.0x), we calculate $18bn
of capacity in 2013E. Assuming ABB paid 9x for an acquired business (against ABB
trading on 8.5x 2014E EV/EBITDA currently) and was charged interest equivalent to 4% of
incremental gross debt would imply around 30% earnings uplift to our forecasts. Given
ABB’s strong commitment to maintaining its ‘single A’ credit rating, we view any deals
larger than this as unlikely.
Figure 90: M&A scenarios in USD millions, unless otherwise stated
Base case pre-M&A 2013E 2013E 2013E
Net debt -16 -16 -16
EBITDA 6,832 6,832 6,832
Net debt / EBITDA ratio 0.0x 0.0x 0.0x
Acquisition strategy
Extra debt 3,500 12,000 18,000
Incremental EBITDA (assuming 9x multiple paid) 389 1,333 2,000
Cost of deals (4% interest rate on extra debt) 140 480 720
Incremental net income (assuming tax rate of 27%) 182 623 934
Scenario post-M&A
Net debt 3,484 11,984 17,984
EBITDA 7,221 8,166 8,832
Net debt / EBITDA ratio 0.5x 1.5x 2.0x
Incremental Net income uplift 5% 17% 25% Source: Credit Suisse estimates

20 February 2013
ABB (ABBN.VX) 37
Inorganic sales growth target could imply $8-12bn
acquisition spend (FY13-15E)
Having discussed ABB’s potential for re-leveraging its business, we want to take a closer
look in this section at the implications of management’s revenue growth targets to 2015. In
addition to an organic sales growth target (7-10% CAGR), ABB has said it aims for 3-4%
inorganic revenue growth per year from 2010 until 2015. We have applied ABB’s growth
rate targets from 2010 onwards (ignoring the reported figures in 2011 and 2012 and
acquisitions such as Baldor and T&B) to get a sense of the annual acquisition potential
implied by the company’s targets. If we apply an EV/Sales multiple of 2.2x (paid on
average for Baldor and T&B), this would imply potential acquisition spend of $8-12bn over
the next three years.
Figure 91: ABB’s stated target for inorganic revenue CAGR from 2010 until 2015E
Figure 92: ABB’s financial acquisition criteria
$32bn
$38bn
2010 2011 2015EOrganic growth Inorganic growth
Organic
3 - 4%potential impact
7 - 10%CAGR
Inorganic
• Cash returns at or above WACC within 3 years
• NPV positive (DCF at WACC + internal hurdles)
• Conservative net debt/EBITDA and gearing ratios
• Maintain single A credit rating
Source: Company data Source: Company data
We highlight our analysis below, estimating the impact from ABB’s inorganic sales growth
target on earnings as well as the potential sales contribution. We calculate a revenue
contribution in the range of $3.8-5.6bn over the next three years.
Figure 93: Potential EPS accretion if ABB meets its own top-line growth targets – we believe consensus does not model future inorganic growth, hence ours and street numbers could turn out to be quite conservative in US$ millions, unless otherwise stated
Revenues 2013E 2014E 2015E
Consensus (IBES) 39,336 41,495 43,474 46,316
Absolute change 2,159 1,979 2,842
Growth (yoy) 5% 5% 7%
Lower guidance range
CAGR: 7% organic; 3% inorganic
Revenues 31,589 42,045 46,249 50,874
Organic change 2,676 2,943 3,237
Inorganic change 1,147 1,261 1,387 3,796
EPS accretion potential to CS numbers -2% 1% 5%
Mid guidance range
CAGR: 8.5% organic; 3.5% inorganic
Revenues 31,589 44,380 49,706 55,671
Organic change 3,368 3,772 4,225
Inorganic change 1,387 1,553 1,740 4,680
EPS accretion potential to CS numbers 3% 10% 16%
Upper guidance range
CAGR: 10% organic; 4% inorganic
Revenues 31,589 46,800 53,353 60,822
Organic change 4,105 4,680 5,335
Inorganic change 1,642 1,872 2,134 5,648
EPS accretion potential to CS numbers 9% 18% 27%
2010 2013E 2014E 2015EAcq.
potential
Acq.
potential2010 2013E 2014E 2015E
2010 2013E 2014E 2015EAcq.
potential
Source: Credit Suisse estimates

20 February 2013
ABB (ABBN.VX) 38
Below we show ABB’s low leverage ratio, which should allow sufficient balance sheet
capacity in the event of acquisitions.
Figure 94: ABB has a low leverage ratio versus its peers in x, unless otherwise stated
-2.0
-1.5
-1.0
-0.5
0.0
0.5
1.0
1.5
Assa
Ablo
y
Sie
me
ns
Als
tom
Schn
eid
er
Leg
ran
d
Sa
nd
vik
Me
tso
Ph
ilips
SK
F
Ele
ctr
olu
x
Atlas C
op
co
AB
B
Alfa L
ava
l
Ge
beri
t
Ko
ne
Schin
dle
r
Ge
ari
ng
ra
tio
, 2
01
3E
(x
)
Source: Company data, Credit Suisse estimates
Acquisition focus should continue to be on faster
growing Automation markets In terms of end-markets, we believe that ABB will focus mainly on its faster growing
Automation division to support the shift away from more price-competitive Power markets
– a scenario we have already seen in recent years as highlighted in Figure 95, which
shows that ABB has spent around 75% of its acquisition spend on its Automation
business. We highlight potential Automation targets later in this report.
Figure 95: Between 2008 and H112 the majority of M&A spend was concentrated on the Automation business…
Figure 96: …with a strong regional focus on the Americas due to the sizable Baldor and Thomas & Betts deals
40%35%
25%
0%
5%
10%
15%
20%
25%
30%
35%
40%
45%
DM & PA LP Power
Sp
lit
of
ac
qu
isit
ion
sp
en
d (
%)
Automation: 75%
0%
10%
20%
30%
40%
50%
60%
70%
80%
90%
Americas Europe Asia MEA
Sp
lit
of
ac
qu
isit
ion
sp
en
d (
%)
Source: Company data Source: Company data
ABB’s unique market position in Automation
In Figure 97 we show ABB’s global market position in Automation with respect to size
(revenues) and profitability (EBIT margin) versus other Automation players. The graph in
our view demonstrates the rarity of size in this market, with only three players (Siemens,
ABB and Emerson) reaching significant scale. While companies naturally tend to aim for
the top right corner of the graph (higher sales, higher margins) this becomes increasingly
difficult once companies have reached the size of ABB. As a result, we believe the key
focus will tend to be on market share gains without losing profitability.

20 February 2013
ABB (ABBN.VX) 39
Figure 97: Automation Sales vs. EBIT Margin (2012) %, unless otherwise stated
Ametek
Emerson
SMC
Kennametal
Rockwell Automation
ABB
Alfa Laval
GEA
IMI Plc
Rotork
Sulzer
Airtac
Fanuc
Hiwin
Keyence
Siemens
0%
5%
10%
15%
20%
25%
30%
35%
40%
45%
50%
- 5,000.0 10,000.0 15,000.0 20,000.0 25,000.0
Automation Sales (USDm)
EB
IT M
arg
in, 2
01
2 (
%)
Source: Thomson Reuters, Credit Suisse research
ABB will likely focus on vertical convergence
Automation vendors have typically focused on one type of control product or one type of
instrument in either discrete or process automation, hence the concentration of companies
of a similar size in Figure 97. We think industrial automation will see an increase in both
horizontal and vertical integration. By horizontally integrated, we mean they compete
globally in both the discrete and process automation markets and by vertically integrated,
we mean a broad offering of instruments and control solutions (high-level enterprise
control systems, low-level instruments, and products in between). Given ABB is already
operating in both discrete and process automation, we believe management will focus on
vertical integration in both markets.
Figure 98: Automation convergence axes
Our view how convergence will take place
Enterprise-level controls
Factory instrumentation
Process Automation Factory Automation
Source: Credit Suisse research
Figure 99: M&A relating to vertical convergence in the Automation market Date Company Target Description
Nov-12 Siemens LMS International PLM
Jun-12 Honeywell INNCOM Software-based energy management solutions
Jan-12 Siemens Ruggedcom Ethernet
Jan-12 Misubishi Messung PLC, HMI
Nov-11 Siemens Vistagy CAD software
Oct-11 Misubishi ICONICS SCADA (20% equity stake)
Sep-11 Siemeens Active SA MES
Jan-11 Rockwell Hiprom Integration software and consulting design
Apr-10 Invensys Skelta Software Business process management software
Jan-07 Siemens UGS PLM Source: Company data, Credit Suisse research

20 February 2013
ABB (ABBN.VX) 40
Figure 100: Discrete Automation players Figure 101: Process Automation players
DHR
EMR
ROK
WEG
ABB
Schneider
Kuka
Siemens (D)
Siemens (IA)
Krones
Fanuc
Keyence
Mitsu Elec
Omron
SMC
THK
Yaskawa
-
2,000
4,000
6,000
8,000
10,000
12,000
14,000
0% 10% 20% 30% 40% 50%
Reven
ues,
2011
($m
)
2011 EBIT Margin (%)
ABB
Alfa Laval
Emerson
Gea
HOLI
Invensys
SPX Corp
Yokogawa
E+H
-
1,000
2,000
3,000
4,000
5,000
6,000
7,000
8,000
9,000
4% 6% 8% 10% 12% 14% 16% 18% 20% 22% 24%
Reven
ues,
201
1 (
$m
)
2011 EBIT Margin (%)
Source: Company data Source: Company data
Potential large Automation deals that might make
strategic sense
Although ABB’s CFO made clear in an investor meeting last December in Zurich that
management would not target sizable deals in the short term, we think that if the right deal
makes strategic sense that size will be a less critical issue. We would expect ABB to take
a closer look at financial metrics such as return generation (as part of the company’s
strategy to lift cash returns), potential market-share gains and/or geographic
additions/expansions to complement product offerings.
ABB has mentioned in previous presentations that it wants to expand further into the
globally faster growing discrete automation end-markets (particularly PLC’s); however, we
wouldn’t rule out further deals within process automation, particularly related to the Oil &
Gas end-markets.
We see three main reasons why ABB might consider a large deal in Automation in the
medium term:
(1) The global Automation market (process and discrete) is not overly fragmented, with
the top five players already accounting for a combined 56% and 83% market share in
process and discrete automation, respectively. Consequently, we believe sizable
players like ABB might consider a larger acquisition particularly in business areas the
company could not historically establish a sizable market position in, such as certain
subsectors of factory automation. We believe the company might specifically target
inorganic growth in factory automation; as highlighted above, market shares are
materially higher than in process automation, making it a harder task to gain market
share.
(2) We believe further convergence across automation will continue (seen recently with
Siemens buying LMS). As we highlight in this report, we think that vertical
convergence tends to be more challenging given the limited synergy overlap between
process and factory automation. We think, however, that players (such as ABB) which
already have a product offering in areas such as discrete automation might consider
buying a larger player in order to more quickly ramp up market share and enhance the
solutions offering for the client. As shown above in Figure 99, we have already seen
several examples of horizontal convergence over the last few months/years.
(3) Lastly, we think that large players such as ABB might try to defend their strong market
position given that the limited fragmentation compared to other industries could allow
smaller players such as Emerson (number two market share in DCS) to significantly
enhance their product offering and become a much bigger threat to ABB.

20 February 2013
ABB (ABBN.VX) 41
Assuming that ABB did decide to undertake another sizable deal, we think it might find
these companies attractive: Invensys (OM), Rotork or Rockwell Automation.
■ Invensys’ Operations Management (OM): We believe that Emerson’s highly
preliminary takeover approach last summer (see Invensys’ statement on 21 June
announcing that discussions with Emerson were no longer ongoing) means that peers
such as ABB will have also taken a closer look at this business. While the statement
didn’t disclose which part of Invensys Emerson was interested in, we would expect it
to have been Operations Management rather than the Controls or the Rail business.
Furthermore, we note that the acquisition of Invensys’ Rail business by Siemens in
November 2012 eliminated the pension liability, which could make Invensys OM more
attractive to Automation players. In our view, the strategic rationale for such a deal
could come from ABB’s greater exposure to software components, which would seem
to complement Invensys’ large installed base well. Figure 102: Invensys Operations Management – End-market split (FY12) in %, unless otherwise stated
Figure 103: Invensys Operations Management – Sales by type (FY12) in %, unless otherwise stated
Oil & Gas33%
General Industrial
27%
Utility14%
Discrete Manufacturing
7%
Petrochemical5%
Other14%
Systems60%
Equipment22%
Software18%
Source: Company data Source: Company data
We show below a summary of Invensys’ Operations Management business.
Figure 104: Invensys Operations Management summary Control & Safety Advanced Applications Equipment
Portion of IOM Sales 62% 21% 17%
Route to market Direct salesDirect/indirect sales & via
distributors/systems integrators
Direct/indirect sales & via
distributors
Competitors
Honeywell, Emerson,
Yokogawa, ABB, Areva
(nuclear), Rockwell, Siemens
Siemens, Rockwell, Honeywell,
AspenTech
Endress & Hauser, Emerson,
Yokogawa, ABB
Current OP BT MarginBrownfield generally higher
than greenfield
Higher - driving margin
expansion with mix shift
Volume dependend -
recovered in FY2010/11
IOM Relative Market Position
Leader in specific industries
(e.g. oil & gas, power) and
solutions (e.g. Triconex)
Strong leader in specific
industries/solutions (e.g.
Mobility; SmiSci-Esscor;
Wonderware)
Niche positions in some
industries
Key Product/ Brand NamesFoxboro I/A Series DCS,
Triconex
Avantis; IMServ; Intela Trac;
SmiSci-Esscor; Skelta;
Wonderware
Eurotherm; Foxboro
Source: Invensys CMD Feb’11
Figure 105 shows how the profitability for companies that equip plants with products such
as a Distributed Control Systems (DCS) increases each year due to stronger service
requirements. Controls products such as a DCS are vital for the plant’s operation and the
shift to a different provider can often be complex, hence plant operators tend to invest in
servicing critical parts.

20 February 2013
ABB (ABBN.VX) 42
Figure 105: The value of replacement profitability in process automation – importance of servicing the installed base in %, unless otherwise stated
0
2
4
6
8
10
12
14
16
18
20
1 2 3 4 5 6 7 8 9 10 11
Pro
fita
bil
ity (
%)
Period
Initial Investment Additional Investment Life-cycle profit %
Source: Company data Credit Suisse research
■ Rockwell Automation: In line with our expectation of more vertical convergence
within Automation, particularly related to players such as ABB, our US Capital Goods
team has highlighted that companies such as Rockwell Automation look increasingly
attractive (see Global Industrial Automation – The next growth phase, 14th August
2012). We note that ABB’s management has expressed interest in further expanding
its PLC product offering and that Rockwell has the second highest PLC market share
with 22% after Siemens. We also note that the PLC market is highly concentrated,
with the top five players owning c83% market share which could make it difficult for
ABB to grow this business organically.
Rockwell operates in the discrete and process automation markets, competing with
players such as Siemens, ABB, Schneider, Honeywell or Emerson. The company has
a high exposure to heavy industries which includes end-markets such as oil and gas,
metals and mining or pulp and paper. Its consumer business is exposed to food and
beverage markets as well as home and personal care and transportation markets
including automotive and tire manufacturing. Rockwell operates globally, yet more
than half of revenues are derived from its home market in North America and c.20%
and c.15% are generated in Europe and Asia, respectively.
Figure 106: Rockwell Automation–End-market split (FY12) in %, unless otherwise stated
Figure 107: Rockwell Automation–Sales by type (FY12) in %, unless otherwise stated
Control Products & Solutions
57%
Architecture & Software
43%
Heavy Industry50%
Consumer32%
Transportation13%
Other5%
Source: Company data Source: Company data

20 February 2013
ABB (ABBN.VX) 43
■ Rotork: In our note, Negative uncertain times, 1st October 2012, we analysed potential
M&A opportunities within the UK Capital Goods sector based on criteria such as
market-implied CFROI. One of our main conclusions was that Rotork screened
particularly well as a potential M&A candidate. Similar to Invensys, Rotork operates
within the process automation market, servicing oil and gas, power, water, marine and
mining companies with flow control products such as electric, pneumatic and hydraulic
valve actuators, gearboxes and precision control instruments. Rotork generates more
than a third of its revenues each from Europe (ex UK) and rest of the world, around
20% from the US and the remaining 20% almost equally split between the UK and
Americas (ex US). Owing to the sizable exposure to the US and ABB’s stating in
presentations its desire to expand its Oil & Gas exposure, we believe that Rotork could
be attractive for Automation players such as ABB, fuelled by the potential benefit from
the shale gas boom in the US (see the Credit Suisse Connection Series report “The
Shale Revolution”, 13 December 2012).
Figure 108: Rotork– End-market split (FY11) in %, unless otherwise stated
Figure 109: Rotork– Sales by type (FY11) in %, unless otherwise stated
Oil & Gas53%
Power20%
Water18%
General industrial
9%
Controls63%
Fluid Systems27%
Gears10%
Source: Company data Source: Company data

20 February 2013
ABB (ABBN.VX) 44
Valuation We value ABB using an average of our SOTP, DCF and Credit Suisse HOLT analysis and
derive a target price of SFr26. We believe the market is materially underestimating the
company’s strong return profile, particularly compared to the rest of the sector. If we use
the HOLT DCF based on the mid-range of ABB’s group targets for sales growth and
profitability, we derive a CFROI of 16% over the next five years, translating into a share
price of SFr27.50 (30% upside potential). We note that the market is currently pricing
ABB’s CFROI to fade to 10% over the next ten years which, should this happen,
represents an 8-year low.
Figure 110: Valuation summary in SFr, unless otherwise stated
Valuation summary
Sum of the parts 25
Discounted cash flow 26
Credit Suisse HOLT 26
Average 26
Current price 21.0
Upside potential 24% Note: the Credit Suisse HOLT figure of SFr 26 is based on our ABB estimates
Source: Credit Suisse estimates, Credit Suisse HOLT
Sum of the parts
In our sum of the parts valuation we use competitors’ multiples based on EV/EBITA. We
prefer EV/EBIT to a PE multiple due to the different taxation and balance sheet qualities of
the individual businesses. Our peer companies are mainly globally operating based in
various countries across Asia, Europe and the US. We provide a description of the
companies we used per division in the Appendix of this note in Figure 183.
Figure 111: Sum of the parts (SOTP) in USD millions, unless otherwise stated
SOTP (FY13E)
US$m EBITA Multiple Fair value
Discrete Automation & Motion 1,751 11.2 19,685
Process Automation 1,011 10.1 10,252
Low Voltage Products 1,343 11.5 15,500
Power Products 1,559 11.5 17,989
Power Systems 529 10.5 5,579
Corporate, Eliminations -503 9.5 -4,779
Firm value of continuing operations 5,691 64,226
Simple net debt -16
Other items -3,331
Net debt + other EV components -3,347
Equity value 60,878
Number of shares 2,295
Equity value per share in US$ 27
Equity value per share in SFr 25 Source: Thomson Reuters, Credit Suisse estimates

20 February 2013
ABB (ABBN.VX) 45
Discounted cash-flow
We use an EVA-based discounted cash flow model to derive ABB’s fair value. The model
is mainly driven by capital growth (based on expected sales growth and turns) and
expected return on invested capital (ROIC). We apply a WACC of 9% and a terminal
growth of 2% consistent across our coverage.
Figure 112: EVA ®-based DCF model in USD millions, unless otherwise stated
EVA® DCF MODEL 2011A 2012 2013E 2014E 2015E 2016E 2017E 2018E 2019E 2020E 2021E
Sales 37,990 39,336 42,827 45,664 48,860 52,280 55,940 59,856 64,046 68,529 73,326
Growth 20.3% 3.5% 8.9% 6.6% 7.0% 7.0% 7.0% 7.0% 7.0% 7.0% 7.0%
CS Adjusted EBITA 5,310 4,754 5,771 6,454 5,739 6,177 6,649 7,157 7,704 8,294 8,929
Margin 14.0% 12.1% 13.5% 14.1% 11.7% 11.8% 11.9% 12.0% 12.0% 12.1% 12.2%
Tax rate 27.5% 27.0% 27.0% 27.0% 27.4% 27.9% 28.3% 28.7% 29.1% 29.6% 30.0%
NOPAT 3,849 3,470 4,213 4,711 4,165 4,456 4,768 5,102 5,459 5,841 6,250
ROIC 23.2% 15.5% 16.6% 21.0% 21.0% 21.0% 21.0% 21.0% 21.0% 21.0% 21.0%
Capital charge @ 9% 1,212 1,752 2,252 2,296 1,715 1,835 1,963 2,101 2,248 2,405 2,574
EVA 2,637 1,718 1,960 2,416 2,450 2,621 2,805 3,001 3,211 3,436 3,676
Discounted EVA 25,166 1,799 2,035 1,894 1,860 1,827 1,794 1,762 1,731 26,799
NPV 64,546
Shares in issue 2,295
Net Debt 3,347
Equity Value 63,321
Share Valuation (USD) 28
Share Valuation (SFr) 26 Source: Company data, Credit Suisse estimates
Figure 113: ABB has historically generated above-average returns as well as non-acquired IC growth between 2004 and 2011
Alfa Laval
Assa Abloy
Atlas Copco
Electrolux
Geberit
Kone
Metso
Sandvik
Schindler
SKFABB
Alstom
LegrandPhilips
Schneider
Siemens
Sector average
-6%
-3%
0%
3%
6%
9%
12%
15%
18%
6% 8% 10% 12% 14% 16% 18% 20% 22% 24% 26% 28%
No
n-a
cq
uir
ed
IC
gro
wth
(2004
-11)
Average ROIC (2004-11)
Source: Company data, Credit Suisse research
Partly driven by a low starting base on invested capital, ABB delivered a combination of
above-sector-average ROIC as well as strong invested capital growth between 2004 and
2011. We believe it might be quite difficult for ABB to repeat the peak ROIC levels seen
between 2007 and 2009.

20 February 2013
ABB (ABBN.VX) 46
Figure 114: NOPAT and sales 2004-2011 CAGR by company
Figure 115: ABB has seen the second highest peak returns historically in the sector
-5%
0%
5%
10%
15%
20%
25%
30%A
lsto
m
AB
B
Ko
ne
Leg
ran
d
Alfa L
ava
l
Ele
ctr
ica
ls
Atlas C
op
co
Me
tso
Schn
eid
er
Se
cto
r avg
Me
cha
nic
als
Assa
Ablo
y
Sie
me
ns
SK
F
Sa
nd
vik
Ge
beri
t
Schin
dle
r
Ph
ilips
Ele
ctr
olu
x
CA
GR
(%
)
NOPAT CAGR (2004-11)
Sales CAGR (2004-11)
0%
5%
10%
15%
20%
25%
30%
35%
40%
AB
B
Alfa L
ava
l
Als
tom
Assa
Ablo
y
Atlas C
op
co
Ele
ctr
olu
x
Ge
beri
t
Ko
ne
Leg
ran
d
Me
tso
Ph
ilips
Sa
nd
vik
Schin
dle
r
Schn
eid
er
Sie
me
ns
SK
F
Se
cto
r ave
Me
cha
nic
…
Ele
ctr
ica
ls
RO
IC (
%)
2012E-2021E Priced In
2004-2011 Historic Average
Peak
Source: Company data, Credit Suisse research Source: Company data, Credit Suisse estimates
ABB through the Credit Suisse HOLT lens
ABB screens as a contrarian in HOLT as (i) it continues to deliver high cash flow returns
(CFROI) and (ii) its valuation shows upside potential on the HOLT default DCF but (iii) its
CFROI revisions remain negative.
Operations/corporate performance
Despite competitive and cyclical pressures, ABB remains a relatively well-run business,
with low year-over-year CFROI volatility as both its margins and asset turns have been
largely rangebound since 2007. This has allowed ABB to maintain its CFROI within the
14-16% range for the past five years (Figure 116). Achieving this level of returns is
impressive and puts ABB firmly within the top decile of Global Capital Goods companies
and at the top end of the Electrical Equipment industry in Europe (Figure 117).
With management using a HOLT-friendly CROI (Cash Return on Invested Capital) and
continuing to focus on maintaining its EBITDA margins, ABB is forecast to deliver a CFROI
of c16% for the next two years. The company is targeting CROI exceeding 20% by 2015.
Figure 116: ABB’s HOLT Relative Wealth Chart Figure 117: ABB CFROI vs. European Electrical Equipment
Source: Credit Suisse HOLT
https://holtlens.credit-suisse.com/dal/LNNBBKQ
Source: Credit Suisse HOLT
https://holtlens.credit-suisse.com/dal/LO5IRTT

20 February 2013
ABB (ABBN.VX) 47
ABB’s ability to maintain high and stable CFROI levels has resulted in it qualifying for a
HOLT eCap (empirical competitive advantage period) which extends the fade window in
HOLT from the standard 5 years out to 10 years. eCaps are awarded to companies that
have historically earned CFROI levels well above the cost of capital and whose returns
have faded more slowly than those of the average company. Globally, only 7% of
companies in the HOLT database qualify for this quantitatively driven award.
Valuation
On the HOLT default DCF, ABB shares show just over 40% upside potential, with the
market pricing ABB’s CFROI to fade to 10% over the next 10 years which, should this
happen, represents an 8-year low. Alternatively, using the HOLT DCF to model in the mid-
range of ABB’s group targets for sales growth of 8.5% p.a. and for operational EBITDA of
16% (September 2012 – Capital Markets Day) results in a CFROI of c16% over the next 5
years. This translates into a share price of nearly 27.50 SFr/share, or 30% upside potential.
Figure 118: Relative Wealth Chart (10yr fade window) Figure 119: ABB’s 2015 Targets: 30% upside in HOLT
Source: Credit Suisse HOLT Source: Credit Suisse HOLT, Credit Suisse estimates
Using the HOLT DCF to instead solve for the sales growth and EBITDA margins implied
by the current share price of SFr21 results in a 5% p.a. sales growth rate and a 60bps
deterioration in margins every year out to 2016. This assumes a conservative 5-year
competitive advantage period and stable asset turns. Using instead the default 10-year
fade window, EBITDA margins are priced to deteriorate down to 9% by 2021 (CSe 16.5%
in FY15), which represents nearly a 600bps decline from the 14.8% margins ABB
generated in FY12.
The market expectations for ABB’s CFROI differ materially from what is currently being
forecasted. Although the market-implied CFROI has increased from the June 2012 low,
the gap with the corresponding forecasts is now at the highest level since early 2009. This
gap, when compared to the European Capital Goods (ex-A&D) sector, is at an extreme
level as ABB is being priced to see the largest percentage decline in its CFROI.

20 February 2013
ABB (ABBN.VX) 48
Figure 120: Forecasted and Market Implied CFROI levels Figure 121: Market Implied CFROI vs. Forecasted CFROI
Source: Credit Suisse HOLT Source: Credit Suisse HOLT

20 February 2013
ABB (ABBN.VX) 49
Figure 122: ABB – HOLT summary page in x, unless otherwise stated
Current Price: USD 22.76 Warranted Price: USD 28.18 Valuation date: 18-Feb-13
Sales Growth (parallel % point change to forecasts) Dec-11A Dec-12A Dec-13E Dec-14E Dec-15E
-2.0% -1.0% 0.0% 1.0% 2.0% Sales Growth, % 20.3 3.5 9.1 6.6 6.2
EBITDA Mgn, % 15.9 13.3 15.7 16.5 16.7
Asset Turns, x 1.05 0.94 0.94 0.91 0.88
CFROI®, % 16.6 12.2 14.0 14.1 13.3
Disc Rate, % 5.7 5.3 4.9 4.9 4.9
Asset Grth, % 1.1 15.3 9.4 9.1 8.4
Value/Cost, x 2.3 5.3 2.2 2.0 1.8
Economic PE, x 13.9 43.7 15.9 14.3 13.7
Leverage, % 16.2 27.3 26.2 26.4 26.8
HO
LT
-
C
red
it S
uis
se
An
aly
st
Sc
en
ari
o D
ata
ABB LIMITED (ABBN)
EB
ITD
A M
arg
in (
pa
rall
el
% p
oin
t
ch
an
ge
to
fo
rec
as
ts)
-2.0% -29% -17% -4%
0.0% -6% 8%
11% 28%
-1.0% -17% -4% 10% 26% 45%
93%
24% 41% 61%
77%1.0% 6% 21% 38% 56%
2.0% 18% 33% 51% 71%
More than
10%
downside
Within 10%More than
10% upside
Source: Credit Suisse HOLT®. CFROI, HOLT, and ValueSearch are trademarks or registered trademarks of Credit Suisse Group AG or its affiliates in the United States and other countries.
* Operating margin (yellow) is EBITDA (grey) plus rental expense and R&D expense
-30.00
-25.00
-20.00
-15.00
-10.00
-5.00
0.00
5.00
10.00
15.00
20.00
25.00
2002 2004 2006 2008 2010 2012 2014 2016 2018 2020 2022
Sales Growth (in %)
0.00
5.00
10.00
15.00
20.00
25.00
2002 2004 2006 2008 2010 2012 2014 2016 2018 2020 2022
Operating Margin and EBITDA (in %) - see note*
0.00
0.20
0.40
0.60
0.80
1.00
1.20
2002 2004 2006 2008 2010 2012 2014 2016 2018 2020 2022
Asset Turns (x)
0.00
2.00
4.00
6.00
8.00
10.00
12.00
14.00
16.00
18.00
20022004200620082010201220142016201820202022
Historical CFROI
HistoricalTransaction CFROI
Forecast CFROI
ForecastTransaction CFROI
Discount Rate
CFROI & Discount Rate (in %)
-25.00
-20.00
-15.00
-10.00
-5.00
0.00
5.00
10.00
15.00
20.00
25.00
20022004200620082010201220142016201820202022
Historical AssetGrowth Rate
Historical GrowthIncl Intang
Forecast Growth
Forecast GrowthIncl Intang
Normalised GrowthRate
Asset Growth (in %)
Source: Company data, Credit Suisse HOLT

20 February 2013
ABB (ABBN.VX) 50
ABB’s share price has lagged behind the sector
Valuation multiples trading at a discount relative to the sector and the Electricals
Figure 123: ABB trades at a 10% EV/EBIT discount to the sector…
Figure 124: …and has underperformed its Electrical peers by 15% over the last 12 months
7.5
8.0
8.5
9.0
9.5
10.0
10.5
11.0
11.5
12.0
Jan-1
0
Apr-1
0
Jul-1
0
Oct-1
0
Jan-1
1
Apr-1
1
Jul-1
1
Oct-1
1
Jan
-12
Apr-1
2
Jul-1
2
Oct-1
2
Jan-1
3
EV
/EB
IT (
x)
ABB - EV/EBIT (12m forward) Sector Average
-25%
-20%
-15%
-10%
-5%
0%
5%
Feb-1
2
Mar-1
2
Apr-1
2
May-1
2
Jun-1
2
Jul-1
2
Aug-1
2
Sep-1
2
Oct-1
2
Nov-1
2
Dec-1
2
Jan-1
3
Feb-1
3
Re
lati
ve
pe
rfo
rma
nc
e (
%)
ABB share performance spread vs. Electricals (ex ABB)
Source: Thomson Reuters Source: Thomson Reuters
Figure 125: ABB generates consistently higher returns (ROIC) than Schneider…
Figure 126: …yet trades at a discount in x, unless otherwise stated
0%
5%
10%
15%
20%
25%
30%
35%
40%
20
04
20
05
20
06
20
07
20
08
20
09
20
10
20
11
20
12
20
13E
20
14E
RO
IC (
%)
ABB Schneider
4
5
6
7
8
9
10
11
12
13
14
Dec-06 Oct-07 Aug-08 Jun-09 Apr-10 Feb-11 Dec-11 Oct-12
EV
/EB
IT (
12
m fo
rwa
rd)
ABB - EV/EBIT (12m fw) Schneider - EV/EBIT (12m fw)
Source: Company data, Credit Suisse estimates Source: Thomson Reuters
Figure 127: ABB trades on 1.2x EV/Sales FY14 while generating a 14% EBITA margin on our estimates.
-40%
-30%
-20%
-10%
0%
10%
20%
30%
40%
50%
60%
70%S
iem
ens
Mets
o
Ele
ctro
lux
AB
B
Ph
ilips
Als
tom
Sa
ndvik
Atla
s C
opco
SK
F
Schne
ider
Alfra
Lava
l
Le
gra
nd
Schin
dle
r
Assa A
blo
y
Ko
ne
EV/Sales 2014E (%) minus EV/EBITA margin 2014E (%)
More attractive Less attractive
Source: Company data, Credit Suisse research

20 February 2013
ABB (ABBN.VX) 51
Credit Suisse versus consensus estimates Figure 128: Credit Suisse versus consensus forecasts in USD millions, unless otherwise stated; consensus prior to Q412 results
2013E 2013E CS 2014E 2014E CS
Forecast C'sus vs C'sus Forecast C'sus vs C'sus
Orders received 43,995 41,696 5.5% 47,463 43,893 8.1%
Power Products 11,740 11,257 4.3% 12,562 11,819 6.3%
Power Systems 8,183 8,347 -2.0% 8,838 8,786 0.6%
Discrete Automation & Motion 10,481 9,831 6.6% 11,425 10,348 10.4%
Low Voltage Products 8,225 7,691 6.9% 8,883 8,085 9.9%
Process Automation 9,090 8,471 7.3% 9,726 8,902 9.3%
Total Revenue 42,827 41,408 3.4% 45,664 43,480 5.0%
Organic Growth yoy, % 4.1% 6.6%
Power Products 11,279 10,964 2.9% 11,956 11,473 4.2%
Organic Growth yoy, % 3.5% 6.0%
Power Systems 8,456 8,266 2.3% 8,964 8,681 3.3%
Organic Growth yoy, % 5.0% 6.0%
Discrete Automation & Motion 10,193 9,559 6.6% 11,009 10,046 9.6%
Organic Growth yoy, % 6.3% 8.0%
Low Voltage Products 8,017 7,714 3.9% 8,498 8,118 4.7%
Organic Growth yoy, % 4.1% 6.0%
Process Automation 8,606 8,439 2.0% 9,209 8,850 4.1%
Organic Growth yoy, % 3.3% 7.0%
EBIT 5,435 5,019 8.3% 6,158 5,590 10.2%
Operating margin, % 12.7% 12.1% 13.5% 12.9%
Power Products 1,509 1,401 7.7% 1,648 1,483 11.1%
Operating margin, % 13.4% 12.8% 13.8% 12.9%
Power Systems 498 450 10.7% 641 584 9.9%
Operating margin, % 5.9% 5.4% 7.2% 6.7%
Discrete Automation & Motion 1,651 1,503 9.9% 1,816 1,647 10.2%
Operating margin, % 16.2% 15.7% 16.5% 16.4%
Low Voltage Products 1,278 1,145 11.7% 1,467 1,275 15.1%
Operating margin, % 15.9% 14.8% 17.3% 15.7%
Process Automation 1,001 978 2.4% 1,104 1,053 4.8%
Operating margin, % 11.6% 11.6% 12.0% 11.9%
Underlying EBITA 5,691 6,369
Operating margin, % 13.3% 13.9%
Power Products 1,559 1,698
Operating margin, % 13.8% 14.2%
Power Systems 529 672
Operating margin, % 6.3% 7.5%
Discrete Automation & Motion 1,751 1,916
Operating margin, % 17.2% 17.4%
Low Voltage Products 1,343 1,487
Operating margin, % 16.8% 17.5%
Process Automation 1,011 1,114
Operating margin, % 11.7% 12.1%
Net interest (244) (261)
PBT 5,190 5,897
Tax (1,401) (1,592)
Minority (113) (119)
Income from Disc. Op. - 0
Reported net Income 3,675 3,348 9.8% 4,186 3,799 10.2%
CS operating EPS, US$ 1.62 1.53 6.5% 1.83 1.72 6.6% Source: SME consensus, Credit Suisse estimates

20 February 2013
ABB (ABBN.VX) 52
Multiple comparisons
Figure 129: Multiple comparison Multiple analysis 2008A 2009A 2010A 2011A 2012A 2013E 2014E 2015E
Share Price (USD):
Average 23.1 17.3 20.5 22.3 18.8 22.7 22.7 22.7
High 32.7 22.2 23.2 27.5 21.9
Low 9.7 10.9 18.0 16.3 15.4
Year End 15.6 19.7 20.8 18.9 20.5
PE:
Average 14.8 15.2 17.6 14.8 14.4 14.0 12.4 11.4
High 21.0 19.6 20.0 18.3 16.8
Low 6.2 9.6 15.4 10.9 11.8
Year End 10.0 17.4 17.9 12.6 15.7
EV/Sales:
Average 1.5 1.1 1.4 1.4 1.2 1.3 1.2 1.1
High 2.1 1.5 1.6 1.7 1.4
Low 0.6 0.7 1.2 1.0 1.0
Year End 1.0 1.3 1.4 1.2 1.3
EV/EBIT:
Average 11.5 8.9 11.6 11.2 11.8 10.2 8.7 7.8
High 16.3 11.6 13.2 13.8 13.5
Low 4.7 5.3 10.1 8.3 9.9
Year End 7.7 10.2 11.8 9.6 12.7
Recurring EV/EBIT:
Average 10.1 9.3 11.1 10.4 10.6 10.1 8.6 7.8
High 14.4 12.2 12.7 12.8 12.2
Low 4.2 5.6 9.7 7.7 8.9
Year End 6.8 10.8 11.3 8.9 11.5
Recurring EBIT margin 14.8% 12.3% 12.6% 13.3% 11.4% 12.9% 13.6% 13.7%
EV/EBITDA:
Average 10.0 7.6 9.8 9.3 9.1 8.1 7.0 6.3
High 14.2 10.0 11.2 11.4 10.5
Low 4.1 4.6 8.5 6.8 7.6
Year End 6.7 8.8 10.0 7.9 9.9
Dividend Yield
Average 1.8% 2.9% 3.1% 3.1% 3.9% 3.6% 3.8% 4.1%
High 1.3% 2.3% 2.7% 2.5% 3.3%
Low 4.2% 4.6% 3.5% 4.3% 4.7%
Year End 2.6% 2.6% 3.0% 3.7% 3.5%
FCF Yield (based on EV)
Average 5.4% 8.4% 7.8% 5.2% 5.7% 6.9% 7.9% 8.2%
High 3.8% 6.4% 6.8% 4.2% 4.9%
Low 13.1% 13.9% 8.9% 7.0% 6.8%
Year End 8.1% 7.3% 7.6% 6.1% 5.2% Source: Thomson Reuters, Company data, Credit Suisse estimates

20 February 2013
ABB (ABBN.VX) 53
Divisional analysis ABB: Company description
ABB is a global provider of Power Transmission & Distribution products and Automation technologies to utility and industry
customers. The automation technologies division delivers products and services for industrial control and plant and process
automation across all major industry sectors. The company operates in five divisions:
Discrete Automation & Motion: manufactures a range of LV and MV motors and drives, and production robots. Includes the
newly acquired Baldor operations. Competitors include: Siemens, Rockwell, WEG
Low Voltage Products: manufactures low-voltage circuit breakers, switches, control products, wiring accessories, enclosures
and cable systems to protect people, installations and electronic equipment from electrical overload. Competitors include: Schneider,
Eaton, Siemens, Legrand
Process Automation: provides customers with process automation solutions and instrumentation and manufactures
turbochargers. Competitors include: Emerson, Honeywell, Siemens
Power Products: incorporates ABB’s manufacturing network for transformers, switchgear, circuit breakers and associated
equipment. Competitors include: Siemens, Alstom, Schneider, TBEA, Hyundai Heavy, Cooper.
Power Systems: offers turnkey systems and services for power transmission and distribution grids and power plants, and
manufactures submarine cables. Competitors include: Siemens, Alstom, Toshiba/Mitsubishi, GE.
Figure 130: Sales by division (2012) Figure 131: Sales by underlying EBIT (2012)
Power Products
25%
Power Systems
19%
Discrete Automation
& Motion22%
Low-Voltage
Products15%
Process Automation
19%
Power
Products 25%
Power Systems 8%
Discrete Automation & Motion 30%
Low-Voltage
Products 16%
Process Automation
18%
Source: Company data Source: Company data
Figure 132: Sales by geography (2011) Figure 133: Key management
Europe38%
Asia24%
Americas27% Middle
East & Africa11%
Chairman Hubertus von Grünberg
CEO Joe Hogan
CFO Eric Elzvik
Investor Relations Alanna Abrahamson
Head Office Affolternstrasse 44
P.O. BOX 8131
CH-8050, Zurich
www.abb.com
Tel: +41 43 317 3808
Fax: +41 44 311 9817
Source: Company data Source: Company data

20 February 2013
ABB (ABBN.VX) 54
Discrete Automation & Motion
The Discrete Automation & Motion Division provides a comprehensive range of products
and services, including motors, generators, drives, programmable logic controllers (PLCs),
power electronics and robotics, that help customers improve productivity and save energy.
It also offers complete product life cycle services including energy appraisals and
preventive maintenance services.
ABB has a global presence in the Discrete Automation & Motion market and operates in
more than 50 countries. In 2011, due to the Baldor acquisition, orders from Americas
increased sizably in this division. Since this acquisition, ABB has built its position in the
North American industrial automation market, but from a geographic standpoint, Europe is
the most important region, accounting for 38% of revenues in 2011. However, due to the
financial turbulence in the eurozone, ABB expects demand to grow stronger in emerging
markets such as Asia and South America versus mature markets.
ABB targets growth in its Discrete Automation at 12-15% between 2011 and 2015
compared with 7% globally, which suggests ABB is expecting to gain market share.
Figure 134: Orders by geography (2011) Figure 135: Orders by type (2011)
Europe37%
Asia28%
Americas32%
Middle East & Asia
3%
Products85%
Service15%
Source: Company data Source: Company data
Rising awareness of energy costs and increasing commodity prices, environmental
regulations, rapid industrialisation, and a shortage of skilled labour are the major growth
drivers for the automation division. Its major end markets are Metals & Minerals, Transport,
Oil, Gas, Power Generation, and Discrete Manufacturing.
Figure 136: Sales by geography (2011) Figure 137: End-market split (2011)
Europe 38%
Americas32%
Asia27%
Middle East & Africa
3%
Discrete Manufact.
20%
Power Generation
10%
Buildings5%
Oil & Gas10%
Minerals & Metals25%
Transport10%
Water5%
Other15%
Source: Company data Source: Company data

20 February 2013
ABB (ABBN.VX) 55
ABB’s Discrete Automation & Motion division has a large and fast-growing installed base
of approximately $50bn, which is growing at 10% per annum. Its major competitors are
Emerson, Rockwell Automation, General Electric, Schneider, Siemens and Yaskawa.
Figure 138: Competitive landscape within Discrete Automation & Motion
Discrete Automation Industrial Motion Renewable Power Control and Quality Transport
Fanuc GE/ Converteam Enercon Areva Alstom
Kuka Hyundai GE/ Converteam Eaton Bombardier
Mitsubishi Rockwell PowerOne Emerson Siemens
Siemens Siemens Siemens Friem
Rockwell Schneider SMA GE/ Converteam
Yaskawa Weg Vestas Siemens
Schneider Source: Company data
Discrete Automation & Motion is divided in four separate businesses—Robotics, Motors
and generators, Low Voltage Drives and Power Electronics & Medium Voltage Drives. We
highlighted the sales split in Figure 139. Motors & Generators is the largest market for
ABB, accounting for 46% of sales in 2011.
Figure 139: Sales by business mix (2010) outer circle includes Baldor acquisition
Figure 140: Sales channels
33%
33%
17%
17% 26%
47%
14%
13%
Low Voltage Drives Motors & Generators
Power Electronics & MV Drives Robotics
Distributors/ Wholesalers
20%
OEMs/ System
integrators45%
EPCs5%
Direct20%
ABB internal10%
Source: Company data Source: Company data
The division procures the majority of its revenues from mature markets. However, rapid
industrialisation in emerging markets and the need for improved productivity and energy
efficiency should generate more demand.
Figure 141: Discrete Automation generates the highest share of divisional revenues from mature markets (2011)
65%55% 50% 50% 50%
35%45% 50% 50% 50%
0%
25%
50%
75%
100%
DiscreteAutomation and
Motion
ProcessAutomation
Low Voltage Power Products Power Systems
Mature markets Emerging markets
Source: Company data, Credit Suisse estimates

20 February 2013
ABB (ABBN.VX) 56
Low Voltage Products
The Low Voltage Products division provides products and systems to protect, control and
measure electrical installations, enclosures, switchboards, electronics and
electromechanical devices for industrial machines, plants and related services. Its offering
also includes intelligent control systems, KNX systems that integrate and automate
buildings’ electrical installations, ventilation systems and security and data communication
networks.
ABB estimates the total market size for Low Voltage Products at $70bn and expects it to
grow by 4% globally. It targets 8–11% growth for its Low Voltage Products division
between 2011 and 2015, via accessing markets in key geographies such as North
America and the BRIC countries, broadening its product scope to include security, lifestyle
and energy efficiency, and developing additional channels to market.
Figure 142: Orders by geography (2011) Figure 143: Orders by type (2011)
Europe55%
Americas9%
Asia28%
MEA8%
Products80%
Service5%
Systems15%
Source: Company data Source: Company data
ABB has a global presence in Low Voltage Products with maximum exposure in Europe
accounting for 56% of divisional sales. The key market drivers for Low Voltage Products
are renewable energy, energy efficiency applications and data centres, and residential and
commercial construction.
Figure 144: Sales by geography (2011) Figure 145: End-market split (2010)
Europe 56%
Americas9%
Asia28%
Middle East & Africa
7%
Utility35%Construction
30%
Oil & Gas5%
Metals & Mining10%
Rail 5% Other
15%
Source: Company data Source: Company data

20 February 2013
ABB (ABBN.VX) 57
ABB’s key competitors in Low Voltage Products are GE, Legrand, Eaton, Schneider and
Siemens. ABB is at an advantage to its competitors in that its products are recognised
based on operational excellence in production, distribution and response time.
Figure 146: Competitive landscape within Low Voltage Products
Wiring Accessories LV systems Enclosures & Rail Control Products LV Breakers and Switches
Legrand Eaton Eaton Phoenix Contact Eaton
Leviton GE Hager Rockwell Mitsubishi
Schneider Schneider Schneider Schneider Schneider
Siemens Siemens Siemens Siemens Source: Company data
The division caters equally to mature and emerging markets and derives 50% of its
revenue from sales through distributors and wholesalers.
Figure 147: Sales by business mix (2011) Figure 148: Sales channels
LV Breakers & Switches
30%
Enclosures & DIN Rails
25%
Control Products
20%
Wiring Accessories
10%
LV Systems15%
Distributors/ Wholesalers
50%OEMs10%
Panel Builders
15%
Contractors10%
End Users5%
ABB internal10%
Source: Company data Source: Company data
Process Automation
The Process Automation division offers fully engineered solutions and products for
process control, safety, instrumentation, plant electrification and energy management. In
2011, it accounted for approximately 24% of ABB’s large orders, with Europe the major
contributor to the order intake.
ABB estimates the market opportunity for the Process Automation division at $120bn and
expects it to grow by 6% globally, versus its target for its own division of 6–9% between
2011 and 2015. It plans to achieve this through continued market and technology
leadership in control platform and instrumentation, increasing its relevance in the oil and
gas industry and increasing domain-specific products in its portfolio to complement its
automation and electrical offering, helping to meet customer-specific needs.

20 February 2013
ABB (ABBN.VX) 58
Figure 149: Orders by geography (2011) Figure 150: Orders by type (2011)
Europe39%
Asia30%
Americas23%
Middle East & Africa
8%
Products25%
Service40%
Systems35%
Source: Company data Source: Company data
The division serves key industries such as oil, gas and petrochemicals, marine, mining
and minerals, metals, pulp and paper. The economic uncertainties of 2011 had limited
effect on the division, as it depends more on large capital expenditure by utility and
industrial customers. In 2011, orders in the Process Automation division were 12% higher
(6% in local currencies), driven by solid orders received in minerals, pulp and paper, turbo
chargers and oil and gas businesses.
Figure 151: Sales by geography (2011) Figure 152: End-market split (2011)
Europe39%
Asia27%
Americas22%
Middle East & Africa
12%
Chemical, Oil & Gas
35%
Metals & Mining25%
Marine15%
Pulp & Paper10%
Power Generation
5%
Other10%
Source: Company data Source: Company data
Its major competitors are Emerson, Honeywell, Invensys, Metso, Siemens and Yokogawa.
Figure 153: Competitive landscape within Process Automation
Oil & Gas Metals & Minerals Marine Pulp & Paper Turbocharging
Emerson FLS Converteam Andritz MAN
Honeywell Emerson Siemens Metso Mitsubishi
Invensys Siemens Wartsilla Siemens
Rockwell SMS
Yokogawa TMEIC Source: Company data
The division’s offerings are sold as separate products and as part of total automation
systems, with the majority of the division’s revenues coming from direct sales to end
users.

20 February 2013
ABB (ABBN.VX) 59
Figure 154: Sales by business mix (2011) Figure 155: Sales channels
Oil & Gas25%
Minerals20%
Pulp & Paper5%
Marine10%
Measurement Products
15%
Turbocharging15%
Performance Services
10%
Direct55%
OEM/ System
Intergrators30%
EPCs15%
Source: Company data Source: Company data
Services form the major revenue component in Process Automation division, with service
orders growing in double digits in 2011.
Figure 156: Process Automation has the highest service
component (2011)
85%
25%
80%90%
55%
35%
15%
85%
30%
15%
40%
5% 10% 15% 15%
0%
25%
50%
75%
100%
DiscreteAutomationand Motion
ProcessAutomation
Low Voltage PowerProducts
PowerSystems
Total
Products Systems Service
Source: Company data

20 February 2013
ABB (ABBN.VX) 60
Figure 157: End-market split of the Global Automation market with an estimated size of $180bn
Figure 158: Business overview with respect to business mix, markets, cycles and industries in %, unless otherwise stated
Discrete Manufacturing
25%
Hybrid Manufacturing
10%
Utilities10%
Mining and Minerals
10%
Oil and Gas20%
Process Manufacturing
25%
Early
Oil & GasProducts
Emerging
Mid
Mining & Minerals
System
Marine
Services
MatureLate
Pulp & Paper
Metals
Chemicals
Power Gen
Others
0
10
20
30
40
50
60
70
80
90
100
Business Mix Markets Cycles Industries
Source: Company data Source: Company data
Power Products
The Power Products division portfolio includes high and medium voltage switchgears,
power, distribution and speciality transformers for power generation, transmission and
distribution. It has geographically balanced global production and an R&D footprint with
presence in more than 100 countries.
ABB estimates the total market size for power products t $60bn, with emerging markets,
driven by infrastructure development, growing faster than mature markets. ABB targets 5–
7% growth in its Power Products between 2011 and 2015, compared with 4% globally;
suggesting it is expecting to gain market share.
Figure 159: Orders by geography (2011) Figure 160: Orders by type (2011)
Europe32%
Asia33%
Americas26%
Middle East & Asia
9%
Products90%
Service10%
Source: Company data Source: Company data
Urbanisation, energy-intensive industries, remote bulk generation from renewables, cost
pressure and aging infrastructure are driving the market for ABB’s Power Products
division. This division primarily serves electric utilities, including gas and water utilities and
industrial and commercial customers. ABB is well positioned in its key geographies of
Europe, the Americas and Asia.

20 February 2013
ABB (ABBN.VX) 61
Figure 161: Sales by geography (2011) Figure 162: End-market split (2011)
Europe34%
Asia30%
Americas27%
Middle East & Asia
9%
Utility Transmissio
n28%
Industries33%
Utility Distribution
26%
Power Generation
13%
Source: Company data Source: Company data
ABB’s major competitors in Power Products division are Alstom, Schneider, Siemens and
Hyundai. It plans to secure market leadership and improve its cost position by expanding
coverage in key markets, strengthening channels to increase penetration, enhancing its
product portfolio to realise growth from megatrends and growing its service business faster
than its core business in order to achieve its 5–7% growth target in 2011–15.
Figure 163: Competitive landscape within Power Products
Transformers Medium Voltage Products High Votage Products
Alstom Schneider Alstom
Hyundai Siemens Siemens
Siemens Source: Company data
The Power Products division is broadly divided in three separate products— Transformers,
High voltage products and Medium voltage products. We show the sales split in Figure
164. Transformer is the largest market for ABB, accounting for 45% of sales in 2011.
Figure 165 shows that direct sales account for the majority of the division’s total sales, with
the remainder from external channel networks such as wholesalers, distributors and
original equipment manufacturers (OEMs).
Figure 164: Sales by business mix (2011) Figure 165: Sales channels
Transformers45%
High Voltage products
25%
Medium Voltage products
30%
Indirect 40%
Direct
60%
Source: Company data Source: Company data

20 February 2013
ABB (ABBN.VX) 62
Power Systems
Power Systems provides systems and solutions for integration of renewables into grid and
network management solutions. Strong political commitment in Europe to increasing the
share of renewables in the energy mix contributed to order growth.
ABB estimates the total market size for Power Systems at $80bn and its growth target for
its division is 7-11% between 2011 and 2015. This compares with 6% growth globally—
suggesting it expects to gain market share. ABB plans to tap into the opportunities in
renewables such as hydro, wind and solar, to expand its software solutions business and
to drive service and consulting growth above the divisional average.
Figure 166: Orders by geography (2011) Figure 167: Order by type (2011)
Europe40%
Asia27%
Americas17%
Middle East & Asia16%
Systems85%
Service15%
Source: Company data Source: Company data
The fundamental market drivers for Power Systems include investments in power
infrastructure in emerging markets, upgrade of aging infrastructure in mature markets,
increasing demand for renewables, energy efficiency and more reliable, flexible and
smarter grids. The key end markets for Power Systems are utilities, industrial and
commercial customers.
Figure 168: Sales by geography (2011) Figure 169: End-market split (2011)
Europe40%
Asia18%
Americas20%
Middle East & Asia22%
Power Generation
20%
Utility distribution
20%Utility
transmission45%
Industry15%
Source: Company data Source: Company data
ABB’s major competitors in Power Systems division are Alstom, Emerson, GE, Nexans
and Siemens.

20 February 2013
ABB (ABBN.VX) 63
Figure 170: Competitive landscape within Power Systems
Grid systems Network Management Substations Power Generation
Alstom Alstom Alstom Alstom
Nexans GE Siemens Emerson
Prymian Siemens GE
Siemens Siemens Source: Company data
The Power system division delivers systems in four areas: Substations, Grid Systems,
Network Management, and Power Generation, with Substations the major contributor to
sales in 2011. Power Systems derives the majority of its sales through direct sales to end
users.
Figure 171: Sales by business mix (2011) Figure 172: Sales channels
Substation35%
Grid System25%
Power System
20%
Network Management
20%
Indirect15%
Direct85%
Source: Company data Source: Company data
In Figure 173 we show further detail about the cyclicality of ABB’s divisions. We conclude
that almost half of ABB’s business is related to late-cyclical end-markets due to its Power
divisions—in particular Power Systems—and also parts of Process Automation. Within
Automation Low Voltage, products fall into the early cycle bracket whereas discrete yet
predominantly Process Automation operates with customers in later cyclical markets. With
the overall business shifting further towards Automation, the end-market exposure
generally moves more to early and mid-cycle end-markets.
Figure 173: Power Systems is the most late cycle business amongst ABB’s five divisions in %, unless otherwise stated
Early Cycle 20%
Mid Cycle 32%
Late Cycle 48%
Construction, early-cycle
industry (GDP)
Industrial production
(machinery, electronics)
Demand for commodities,
industrial capex
Utility (T&D) and industry
capex, renewables
Low-Voltage Products
Discrete Automation and
Motion
Process Automation
Power Products
Power Systems
Share of orders 2011 Key macro drivers
Source: Company data

20 February 2013
ABB (ABBN.VX) 64
Financial statements Figure 174: ABB – Divisional P&L in USD millions, unless otherwise stated
Divisional P&L 2008A 2009A 2010A 2011A 2012A 2013E 2014E 2015E
Orders
Power Products 13,627 10,940 9,778 11,068 11,040 11,740 12,562 13,315
Power Systems 7,408 7,830 7,896 9,278 7,973 8,183 8,838 9,545
Discrete Automation & Motion 7,129 4,702 5,862 9,566 9,625 10,481 11,425 12,567
Low-Voltage Products 4,865 4,079 4,686 5,364 6,720 8,225 8,883 9,505
Process Automation 9,244 6,684 7,383 8,726 8,704 9,090 9,726 10,504
Group orders 42,273 34,235 35,605 44,002 44,062 47,720 51,434 55,437
Organic growth 6% -13% 3% 13% 1% 5% 8% 8%
Sales & Organic Growth
Power Products 11,890 11,239 10,199 10,869 10,717 11,279 11,956 12,673
Organic growth 18% -1% -11% 2% 2% 4% 6% 6%
Power Systems 6,912 6,549 6,786 8,101 7,852 8,456 8,964 9,591
Organic growth 16% 1% 2% 14% 2% 5% 6% 7%
Discrete Automation & Motion 6,588 5,405 5,617 8,806 9,405 10,193 11,009 11,669
Organic growth 0% 0% 3% 17% 10% 6% 8% 6%
Low-Voltage Products 4,747 4,071 4,554 5,304 6,638 8,017 8,498 9,008
Organic growth 0% 0% 13% 11% 0% 4% 6% 6%
Process Automation 8,397 7,839 7,432 8,300 8,156 8,606 9,209 9,761
Organic growth 0% 0% -6% 6% 3% 3% 7% 6%
Group sales 34,912 31,795 31,589 37,990 39,336 42,827 45,664 48,486
Organic growth 15% -4% -2% 9% 4% 4% 7% 6%
Operational EBITDA
Power Products 1,854 1,782 1,585 1,747 1,898 2,013
Margin 18.2% 16.4% 14.8% 15.5% 15.9% 15.9%
Power Systems 297 743 290 696 849 956
Margin 4.4% 9.2% 3.7% 8.2% 9.5% 10.0%
Discrete Automation & Motion 1,033 1,664 1,735 1,942 2,130 2,275
Margin 18.4% 18.9% 18.4% 19.1% 19.3% 19.5%
Low-Voltage Products 934 1,059 1,219 1,622 1,825 1,917
Margin 20.5% 20.0% 18.4% 20.2% 21.5% 21.3%
Process Automation 926 1,028 1,003 1,101 1,211 1,293
Margin 12.5% 12.4% 12.3% 12.8% 13.2% 13.3%
Holding -220 -262 -277 -276 -276 -261
Group Underlying EBIT 4,824 6,014 5,555 6,832 7,636 8,193
Margin 15.3% 15.8% 14.1% 16.0% 16.7% 16.9%
Reported EBIT & Margins
Power Products 2,100 1,969 1,629 1,476 1,328 1,509 1,648 1,750
Margin 17.7% 17.5% 16.0% 13.6% 12.4% 13.4% 13.8% 13.8%
Power Systems 592 388 107 548 7 498 641 736
Margin 8.6% 5.9% 1.6% 6.8% 0.1% 5.9% 7.2% 7.7%
Discrete Automation & Motion 1,066 557 918 1,294 1,469 1,651 1,816 1,942
Margin 16.2% 10.3% 16.3% 14.7% 15.6% 16.2% 16.5% 16.6%
Low-Voltage Products 819 519 796 904 856 1,278 1,467 1,538
Margin 17.3% 12.7% 17.5% 17.0% 12.9% 15.9% 17.3% 17.1%
Process Automation 958 643 760 963 912 1,001 1,104 1,181
Margin 11.4% 8.2% 10.2% 11.6% 11.2% 11.6% 12.0% 12.1%
Holding -983 50 -392 -518 -514 -503 -518 -518
Group EBIT 3,594 3,483 3,058 3,704 3,146 4,434 5,054 5,448
Margin 10.3% 11.0% 9.7% 9.7% 8.0% 10.4% 11.1% 11.2% Source: Company data, Credit Suisse estimates

20 February 2013
ABB (ABBN.VX) 65
Figure 175: ABB – P&L in USD millions, unless otherwise stated
P&L 2008A 2009A 2010A 2011A 2012A 2013E 2014E 2015E
Sales 34,912 31,795 31,589 37,990 39,336 42,827 45,664 48,486
Sales Growth 19.6% -8.9% -0.6% 20.3% 3.5% 8.9% 6.6% 6.2%
Cost of Sales -23,972 -22,470 -22,060 -26,556 -27,958 -29,758 -31,423 -33,275
Gross Profit 10,940 9,325 9,529 11,434 11,378 13,069 14,240 15,211
Gross Margin 31.3% 29.3% 30.2% 30.1% 28.9% 30.5% 31.2% 31.4%
S,G&A -4,795 -4,491 -4,615 -5,373 -5,756 -6,007 -6,302 -6,643
% of sales 13.7% 14.1% 14.6% 14.1% 14.6% 14.0% 13.8% 13.7%
R&D -1,027 -1,037 -1,082 -1,371 -1,464 -1,627 -1,781 -1,939
% of sales 2.9% 3.3% 3.4% 3.6% 3.7% 3.8% 3.9% 4.0%
Other Income (Expense) -566 329 -14 -23 -100 0 0 0
Reported EBIT 4,552 4,126 3,818 4,667 4,058 5,435 6,158 6,629
Underlying EBITA 5,343 4,189 4,145 5,230 4,674 5,691 6,374 6,845
Margin 15.3% 13.2% 13.1% 13.8% 11.9% 13.3% 14.0% 14.1%
Net Financial Income -34 -6 -78 -117 -220 -244 -261 -236
CS EBIT 5,163 3,909 3,965 5,050 4,494 5,511 6,194 6,665
Clean PBT 5,129 3,803 3,887 4,933 4,274 5,266 5,933 6,429
PBT 4,518 4,120 3,740 4,550 3,838 5,190 5,897 6,393
Provision for taxes -1,119 -1,001 -1,018 -1,244 -1,030 -1,401 -1,592 -1,726
CS tax adjustment 151 -83 40 113 152 21 10 10
Underlying tax -1,270 -991 -1,058 -1,357 -1,182 -1,422 -1,602 -1,736
Underlying tax rate 25% 26% 27% 28% 27% 27% 27% 27%
Extraordinary Items (post tax) -21 17 10 9 4 0 0 0
Minority -260 -235 -171 -147 -108 -113 -119 -125
Net Income from continuing ops 3,399 3,119 2,722 3,306 2,808 3,789 4,305 4,667
Net Income (Loss) 3,118 2,901 2,561 3,168 2,704 3,675 4,186 4,542
CS Net Income 3,578 2,594 2,668 3,438 2,988 3,731 4,212 4,568
Basic EPS (continuing, USD per share) 1.49 1.37 1.19 1.45 1.22 1.65 1.88 2.03
Diluted EPS (continuing, USD per share) 1.48 1.36 1.19 1.44 1.22 1.65 1.87 2.03
CS EPS (diluted, USD per share) 1.56 1.13 1.16 1.50 1.30 1.62 1.83 1.99
Dividend per share (CHF per share) 0.48 0.51 0.60 0.65 0.68 0.75 0.80 0.86
Weighted Average Shares (m) 2,296 2,288 2,291 2,291 2,295 2,298 2,297 2,297 Source: Company data, Credit Suisse estimates

20 February 2013
ABB (ABBN.VX) 66
Figure 176: ABB – Balance sheet in USD millions, unless otherwise stated
Balance sheet 2008A 2009A 2010A 2011A 2012A 2013E 2014E 2015E
Goodwill 2,817 3,026 4,085 7,269 10,226 10,226 10,226 10,226
Other intangible assets 411 443 701 2,253 3,501 2,994 2,454 1,879
Intangible assets 3,228 3,469 4,786 9,522 13,727 13,220 12,680 12,105
Tangible assets 3,562 4,072 4,356 4,922 5,947 6,419 6,921 7,455
Investments 68 49 19 156 213 213 213 213
Deferred Tax 1,190 1,052 846 318 334 334 334 334
Prepaid pension and other employee benefits 73 112 173 139 71 71 71 71
Other Assets 268 293 347 804 776 776 776 776
Financial assets 445 452 420 0 0 0 0 0
Total Long term assets 8,834 9,499 10,947 15,861 21,068 21,033 20,995 20,954
Inventories 5,306 4,550 4,878 5,737 6,182 6,731 7,176 7,620
Trade accounts and receivables 9,245 9,451 9,970 10,773 11,575 11,778 12,558 13,576
Other receivables 237 236 193 227 311 311 311 311
Deferred taxes 1,020 900 896 932 869 869 869 869
Marketable securities 1,407 2,433 2,713 948 1,606 1,606 1,606 1,606
Cash and cash equivalents 6,399 7,119 5,897 4,819 6,875 8,481 10,336 12,051
Other current assets 733 540 801 351 584 584 584 584
Total current assets 24,347 25,229 25,348 23,787 28,002 30,359 33,440 36,617
Total assets 33,181 34,728 36,295 39,648 49,070 51,392 54,435 57,571
Shareholders equity 11,158 13,790 14,885 15,777 16,906 18,723 20,921 23,336
Minority interests 612 683 573 559 540 526 512 497
Long term financial debt 2,009 2,172 1,139 3,231 7,534 7,534 7,534 7,534
Pension and other employee benefits 1,071 1,179 831 1,487 2,290 2,290 2,290 2,290
Deferred taxes 425 328 411 537 1,260 1,260 1,260 1,260
Other liabilities 1,902 1,997 1,718 1,496 1,566 1,566 1,566 1,566
Total financial debt 5,407 5,676 4,099 6,751 12,650 12,650 12,650 12,650
Trade accounts and payables 4,451 3,853 4,555 4,789 4,992 5,353 5,936 6,303
Other Payable 2,516 2,949 3,256 3,180 3,484 3,665 3,811 3,957
Advances from customers 2,014 1,806 1,764 1,757 1,937 1,963 2,143 2,417
Short term financial debt 354 161 1,043 765 2,537 2,537 2,537 2,537
Provision and other 4,572 3,883 4,119 3,943 3,658 3,608 3,558 3,508
Deferred taxes 528 327 357 305 270 270 270 270
Accrued liabilities 1,569 1,600 1,644 1,822 2,096 2,096 2,096 2,096
Total current liabilities 16,004 14,579 16,738 16,561 18,974 19,492 20,352 21,088
Total liabilities and shareholders equity 33,181 34,728 36,295 39,648 49,070 51,392 54,435 57,571 Source: Company data, Credit Suisse estimates

20 February 2013
ABB (ABBN.VX) 67
Figure 177: ABB – Cash flow in USD millions, unless otherwise stated
Cash flow 2008A 2009A 2010A 2011A 2012A 2013E 2014E 2015E
Net income 3,118 2,901 2,561 3,168 2,704 3,675 4,186 4,542
Minority Interest 261 235 171 147 108 113 119 125
Depreciation + amortisation 661 655 702 995 1,182 1,293 1,378 1,463
Pension & Post retirement benefits 43 -28 -51 -49 -13 0 0 0
Deferred taxes -199 -56 151 -34 64 0 0 0
Net gain from sale of plant property & equipment -49 -15 -39 -47 -26 0 0 0
Income from equity accounted companies -15 2 -3 -4 -1 0 0 0
Others 232 -6 106 111 172 0 0 0
Trade receivables -1,266 256 -407 -731 -310 -203 -780 -1,019
Inventories -800 1,130 -264 -600 61 -549 -446 -444
Trade Payables 522 -718 678 213 -57 361 583 367
Billings in excess of sales 539 295 89 150 152 181 147 146
Provisions 677 -241 -69 -391 -109 -50 -50 -50
Advances from customers 130 -316 -25 47 181 26 180 273
Other assets & liabilities 104 -67 597 637 -329 0 0 0
Net cash provided by operating activities 3,958 4,027 4,197 3,612 3,779 4,849 5,317 5,405
Change in Financing receivables 7 -7 -7 -55 85 0 0 0
Purchases of Marketable securities -3,626 -4,985 -5,621 -2,951 -2,355 0 0 0
Purchases of plant, property & equipment -1,171 -967 -840 -1,021 -1,293 -1,257 -1,340 -1,422
Acquisition of business -653 -209 -2,269 -4,020 -3,694 0 0 0
Proceeds from sale of marketable securities 5,417 3,896 4,904 4,729 1,682 0 0 0
Sale of Plant, property & equipment 94 36 47 57 0 0 0 0
Proceeds of sale of business & equity accounted companies 46 16 83 8 0 0 0 0
Net cash used by investing activities 114 -2,220 -3,703 -3,253 -5,575 -1,257 -1,340 -1,422
Net changes in debt with maturities of 90 days or less -10 -59 52 450 570 0 0 0
Increase in debt 458 586 277 2,580 5,986 0 0 0
Repayment of debt -786 -705 -497 -2,576 -1,104 0 0 0
Issue of shares 49 89 16 105 90 0 0 0
Purchase of treasury shares -621 0 -166 5 0 0 0 0
Dividends paid -1,060 -1,027 -1,112 -1,569 -1,626 -1,858 -1,988 -2,127
Dividend paid to minority share holders -152 -193 -193 -157 -121 -127 -133 -140
Others 3 8 49 -46 -33 0 0 0
Net cash provided (used) by financing activities -2,119 -1,301 -1,574 -1,208 3,762 -1,985 -2,122 -2,267
Effect of exchange rates and others -230 214 -142 -229 90 0 0 0
Net increase (decrease) in cash 1,723 720 -1,222 -1,078 2,056 1,606 1,855 1,715 Source: Company data, Credit Suisse estimates
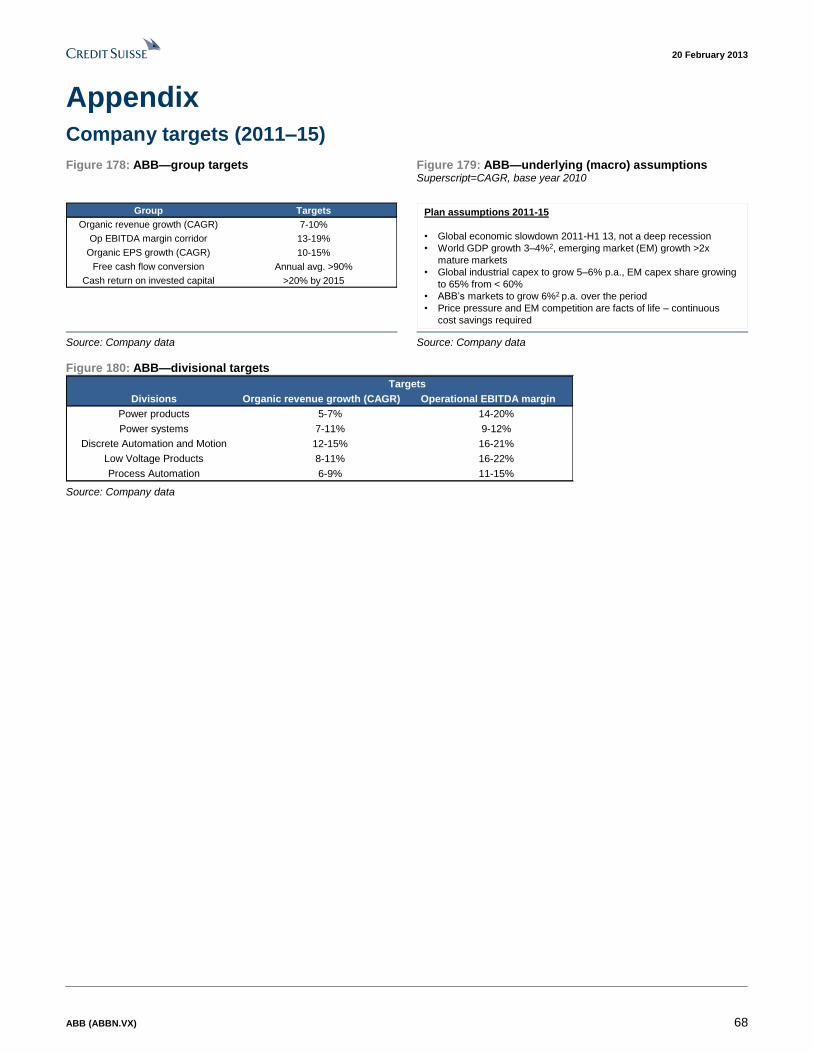
20 February 2013
ABB (ABBN.VX) 68
Appendix Company targets (2011–15)
Figure 178: ABB—group targets Figure 179: ABB—underlying (macro) assumptions Superscript=CAGR, base year 2010
Group Targets
Organic revenue growth (CAGR) 7-10%
Op EBITDA margin corridor 13-19%
Organic EPS growth (CAGR) 10-15%
Free cash flow conversion Annual avg. >90%
Cash return on invested capital >20% by 2015
Plan assumptions 2011-15
• Global economic slowdown 2011-H1 13, not a deep recession
• World GDP growth 3–4%2, emerging market (EM) growth >2x
mature markets
• Global industrial capex to grow 5–6% p.a., EM capex share growing
to 65% from < 60%
• ABB’s markets to grow 6%2 p.a. over the period
• Price pressure and EM competition are facts of life – continuous
cost savings required
Source: Company data Source: Company data
Figure 180: ABB—divisional targets
Divisions Organic revenue growth (CAGR) Operational EBITDA margin
Power products 5-7% 14-20%
Power systems 7-11% 9-12%
Discrete Automation and Motion 12-15% 16-21%
Low Voltage Products 8-11% 16-22%
Process Automation 6-9% 11-15%
Targets
Source: Company data

20 February 2013
ABB (ABBN.VX) 69
Acquisition history
Figure 181: ABB—acquisition history in USD millions, unless otherwise stated
Company name Date Cost Sales EV/Sales Business division
Gresin Grupo Estudios Industriales, S.A.L. Dec-12 NA NA NA Discrete Automation and Motion
Amarcon BV Sep-12 NA NA NA Process Automation
Newave Energy Holding SA Aug-12 173 NA NA Discrete Automation and Motion
Tropos Networks Inc Jun-12 NA NA NA Power System
Thomas & Betts May-12 3900 2300 1.70 Low Voltage products
Envitech Energy Dec-11 NA NA NA Discrete Automation and Motion
Powercorp Dec-11 NA NA NA Discrete Automation and Motion
Trasfor Group Oct-11 NA 130 NA Power Products
Lorentzen & Wettre Oct-11 119 49 2.43 Process Automation
Mincom Jul-11 NA 200 NA Software business
Epyon B.V. Jul-11 NA NA NA Discrete Automation and Motion
Novatec Solar GmbH Mar-11 NA NA NA Power Systems
Baldor Electric Company Jan-11 4200 1520 2.76 Discrete Automation and Motion
Obvient Strategies Inc Jan-11 NA NA NA Power Systems
Insert Key Solutions Dec-10 NA NA NA Power Systems
K-TEK Jul-10 NA NA NA Process Automation
Ventyx May-10 >1000 NA NA Power Systems
Jokab Safety Apr-10 NA NA NA Low Voltage Products
Sinai Engineering Corporation Oct-09 NA NA NA Power
Comem SpA Jun-09 70 NA NA Power products
Westingcorp Pty Ltd Jun-09 NA NA NA Power products
Ensto Busch-Jaeger Oy Jan-09 NA 55 NA Automation Products
Ber-Mac Electrical and Instrumentation Ltd Dec-08 NA 100 NA Process Automation
Kuhlman Electric Corporation Jul-08 NA 250 NA Power products
Vectek Electronics May-08 NA NA NA Automation Products
PowerTran Company Ltd Oct-07 NA NA NA Power Product
Raffin Electric Company Ltd Aug-06 NA NA NA Power Products
Entrelec Sep-01 431 NA NA Automation Products
Eutech Engineering Solutions Ltd Jan-01 NA 80 NA Automation Products
Cellier Group S. A Sep-00 NA NA NA Automation segment
Energy Interactive Inc. (EI) Aug-00 NA NA NA ABB’s Energy Information Systems business
Umoe ASA Jun-00 NA 300 NA NA
MEGA Transformadores S.A May-00 NA NA NA Power
East Midlands Electricity Contracting Feb-00 NA 60 NA Power products Source: Company data, Credit Suisse research

20 February 2013
ABB (ABBN.VX) 70
ABB’s cost savings programme in detail
Figure 182: ABB—quarterly overview of the cost saving programme until 2011 Quarter Plan Achieved
Q408 $1.3bn cost take-out prgroamme by 2010 -
Half of cost savings to be realised in 2009
EBIT margin target of 11-16% between 2009-11
Focus on Global sourcing, Operational excellence, Footprint, G&A
- reduction in high labour cost components
- 40%+ of total sourcing from EM by 2010
- expand manufacturing and engineering capacity in EM
- all Capex for new capicity only in EM
- more manufacutring employees in EM (already >45%)
Q109 Cost take-out programme expanded to $2bn -
- Robotics production, engineering and research moved to China
Q209 Further focus on G&A (savings in finance, HR, country overheads) $500m+ cost savings
Primary focus on high-cost countries - $50m from 15% lower G&A costs ($300m target)
Footprint: Capacity adjustments and plant closures - $70m from global footprint adjustment ($300m target)
Focus on warranty costs, supplier quality, manufacturing processes - $100m from operat. efficiency improvement ($400m target)
- $300m from global sourcing optimisation ($1bn target)
Q309 $2bn+ cost savings from current programme $1bn cost savings YTD (targeting now $1.3bn in 2009)
Additional measures in place to meet difficult year 2010 if necessary - $80m from lower G&A costs ($300m target)
- $150m from global footprint adjustment ($300m target)
- $200m from operat. efficiency improvement ($400m target)
- $600m from global sourcing optimisation ($1bn target)
Q409 Increased cost savings target to $3bn (from $2bn) $1.5bn cost savings in FY09
Further supply optimisation globally and locally - $100m from lower G&A costs ($330m target)
Hundreds of operational excellence programmes - $300m from global footprint adjustment ($700m target)
- $300m from operat. efficiency improvement ($500m target)
- $800m from global sourcing optimisation ($1.5bn target)
Q110 Continued focus on operational execution with respect to costs $1.8bn+ cost savings (2009-Q110)
Start growth opportunities to leverage improved cost base - $120m from lower G&A costs ($330m target)
- $470m from global footprint adjustment ($700m target)
- $390m from operat. efficiency improvement ($500m target)
- $950m from global sourcing optimisation ($1.5bn target)
Q210 Cost take-out programme 77% complete; continued focus on cost savings $2.3bn cost savings (2009-Q210)
- $170m from lower G&A costs ($330m target)
- $570m from global footprint adjustment ($700m target)
- $490m from operat. efficiency improvement ($500m target)
- $1.1bn from global sourcing optimisation ($1.5bn target)
Q310 $2.65bn cost savings (2009-Q310)
- $220m from lower G&A costs ($330m target)
- $670m from global footprint adjustment ($700m target)
- $570m from operat. efficiency improvement ($500m target)
- $1.22bn from global sourcing optimisation ($1.5bn target)
Q410 Targeting further $1bn in savings in 2011 $3bn cost savings achieved (2009-Q410)
- $300m in global footprint - $250m from lower G&A costs ($330m target)
- $300m in operational excellence - $750m from global footprint adjustment ($700m target)
- $400m in global sourcing - $600m from operat. efficiency improvement ($500m target)
- $1.4bn from global sourcing optimisation ($1.5bn target)
Q111 Speed-up localised Power R&D and design $215m cost savings
Order selectively to secure margins - c.$11m from global footprint adjustment ($300m target)
- c.$75m from operat. efficiency improvement ($300m target)
- c.$129m from global sourcing optimisation ($400m target)
Q211 $480m cost savings YTD
- c.$25m from global footprint adjustment ($300m target)
- c.$178m from operat. efficiency improvement ($300m target)
- c.$277m from global sourcing optimisation ($400m target)
Q311 $750m cost savings YTD
- c.$38m from global footprint adjustment ($300m target)
- c.$300m from operat. efficiency improvement ($300m target)
- c.$412m from global sourcing optimisation ($400m target)
Q411 Launched 2011-15 targets $1.1bn cost savings achieved (2011)
- c.$55m from global footprint adjustment ($300m target)
- c.$440m from operat. efficiency improvement ($300m target)
- c.$605m from global sourcing optimisation ($400m target)
Source: Company data

20 February 2013
ABB (ABBN.VX) 71
Description of companies used in SOTP
Figure 183: Description of companies used in SOTP Competitor Companies Description
DAM
Fanuc ■ Fanuc manufactures factory automation systems & equipments, and robots.
Emerson
■ Emerson is a diversified global technology company. It is engaged in designing and supplying product technology and
delivering engineering services and solutions in a range of industrial, commercial and consumer markets around the world.
■ Emerson Industrial Automation provides motion control systems and components, plastics joining and precision cleaning and
processing equipment, and materials testing equipment and supplies, for numerous and diverse industries worldwide.
GE■ GE has a global infrastructure producing products ranging from light bulbs, fuel cell to technology,cleaner,more efficient jet engines.
■ GE Intelligent Platforms designs, manufactures, and supplies hardware and software products for industrial control and automation.
Omron■ Omron Corporation manufactures automation components, equipment and systems.
■ Omron Industrial Automation division offers various control components and systems for factory automation.
Regal Beloit■ Regal Beloit Corporation offers electric motors and controls, electric generators and controls, and mechanical motion control products.
■ Regal Beloit Mechanical division offers various motion control products.
Rockwell■ Rockwell Automation is a global provider of industrial automation power, control and information solutions.
■ Rockwell Control Systems division offers wide range of machine control solutions.
Schneider
■ Schneider is a France-based company that specializes in electricity distribution and automation management. The
Company has eight divisions and operates in Europe, the United States, the Middle East, Asia and Africa.
■ Schneider Industry division provides various control systems and process automation.
Siemens
■ Siemens is engaged in electronics and electrical engineering. The Company is an integrated technology company with activities in
the fields of industry, energy and healthcare.
■ Siemens Drive technology offers various products like converters, motores etc.
WEG■ Weg is a Brazil-based company principally involved in the production of electric motors.
■ WEG Automation division manufactures industrial electric motors.
Yasakawa
■ Yasakawa Electric Corporation manufactures and markets servomotors, controllers, inverters, and industrial robots. The Company's
products include spindle controllers, computerized numerical control (CNC) systems, and system engineering.
■ Yaskawa Drives & Motion Division provides Industrial Control and Automation products.
LV
GE■ GE has a global infrastructure producing products ranging from light bulbs, fuel cell to technology,cleaner,more efficient jet engines.
■ GE Indutrial Solutions manufactures low voltage switchgears, circuit breakers products.
Legrand■ Legrand is a France-based company that specializes in the design, manufacture and distribution of products and systems for
electrical installations and information networks.
Eaton
■ Eaton is a diversified power management company, engaged in the manufacturing of electrical components & systems;
hydraulics components; aerospace fuel, hydraulics & pneumatic systems & truck & automotive drivetrain & powertrain.
■ Eaton Electrical division provides various low voltage products like circuit breakers, switchgear, UPS systems, power distribution
units,panelboards, loadcenters, motor controls, meters etc.
Hubbell
■ Hubbell manufactures electrical an delectronic products for a broad range of non residential and residential construction, industrial
and utility applications.
■ Hubbell Electrical division provides wide range of electrical and electronic wiring devices, wire management systems and specialized
wiring products.
Schneider■ Schneider Electric is a France-based company that specializes in electricity distribution and automation management.
■ Schneider power division offers various low voltage products and systems.
Siemens
■ Siemens is engaged in electronics and electrical engineering. The Company is an integrated technology company with activities in the
fields of industry, energy and healthcare.
■ Siemens Building Technologies and Powe Grid division manufactures various low voltage products.
Process Automation
Emerson
■ Emerson is a diversified global technology company. It is engaged in designing and supplying product technology and
delivering engineering services and solutions in a range of industrial, commercial and consumer markets around the world.
■ Emerson Process Mgmt provides product technology as well as engineering and project management services for utilities, food and
beverage, pulp and paper, pharmaceuticals and municipal water and wastewater systems.
Honeywell
■ Honeywell is a diversified technology and manufacturing company, serving customers worldwide through its 4 business segments:
Aerospace, Automation and Control Solutions, Specialty Materials and Transportation Systems.
■ Honeywell Automation and Control solutions division provides various enviornmental controls and process solutions to oil & gas and
utilities.
Invensys
■ Invensys develops & applies advanced technologies that enable the world''s manufacturing & energy generating facilities, mainline &
mass transit rail networks.
■ Invensys Control division is a provider various control products for esidential and commercial market.
Metso
■ Metso is a global supplier of technology & services, which helps its customers to process natural resources and recycle materials
into valuable products.
■ Metso Automation provides various automation product and services.
Siemens
■ Siemens is engaged in electronics and electrical engineering. The Company is an integrated technology company with activities in
the fields of industry, energy and healthcare.
■ Siemens Industry automation division manufactures various automation products and provide solutions.
Yokogawa
■ Yokogawa Electric Corporation provides various products based on its measurement, control, and information technologies in Japan,
Asia, Europe, North America, the Middle East, and internationally.
■ Yokogawa Industrial Automation and Control division develops distributed control systems for the monitoring and control of
processes in production facility. Source: Company data, Credit Suisse research

20 February 2013
ABB (ABBN.VX) 72
Figure 184: Description of companies used in SOTP
Power Product
Alstom
■ Alstom specializes in the manufacture and supply of transport and energy infrastructure. It designs, supplies and maintains a range
of high technology products used for power generation sector and industrial mark.
■ Alstom Grid division makes various high voltage products for transmission of electricity.
Crompton greaves
■ CG is engineering conglomerate and has a diverse portfolio of products, solutions and services ranging from high-end power and
industrial equipments and solutions, to consumer products and home appliances.
■ CG Power System division designs and manufactures wide range of transformers, switch gears, circuit breakers, vacuum
interrupters, network production and control gears.
Eaton
■ Eaton is a diversified power management company, engaged in the manufacturing of electrical components & systems;
hydraulics components; aerospace fuel, hydraulics & pneumatic systems & truck & automotive drivetrain & powertrain.
■ Eaton Electrical division is into electrical distribution and power control product and services.
Schneider
■ Schneider Electric is a France-based company that specializes in electricity distribution and automation management. The Company
has eight divisions and operates in Europe, the United States, the Middle East, Asia and Africa.
■ Schneider Infrastructure division manufactures various products like disconnectors, circuit breakers and transformers.
Hyundai Heavy
■ Hyundai Heavy Industries is the world's largest shipbuilder & among the top 5 manufacturers in other heavy industries. Its mainly
engaged in the ship building business.
■ HHI Electro Electric system division manufactures and supplies various products like transformers, circuit breakers etc.
Siemens
■ Siemens is engaged in electronics and electrical engineering. The Company is an integrated technology company with activities in
the fields of industry, energy and healthcare.
■ Siemens Power Transmission division comprises of high voltage power transmission products.
SPX
■ SPX Corporation is a global, multi-industry manufacturer of highly specialized, engineered solutions. The Company serves three global
markets: infrastructure, process equipment and diagnostic tools.
■ SPX Power and Energy division manufactures various transformers and HAV products for electrical grid.
XD
■ China XIAN group manufactures high and ultra-high voltage AC/DC transmission and distribution equipment and other electrical
products in China.
■ XIAN substation division is into HV products.
Power System
Alstom■ Alstom specializes in the manufacture and supply of transport and energy infrastructure. It designs, supplies and maintains a range
of high technology products used for power generation sector and industrial mark.
■ Alstom Grid division provides integration of renewables into the grid and netwok management solutions.
Emerson
■ Emerson is a diversified global technology company. It is engaged in designing and supplying product technology and
delivering engineering services and solutions in a range of industrial, commercial and consumer markets around the world.
■ Emerson Network Power provides innovative solutions and expertise in areas including AC and DC power and precision cooling
systems, embedded computing and power, integrated racks and enclosures, power switching and controls, monitoring, and
connectivity.
GE
■ GE Smart Grid software and hardware technologies and strategic partnerships provide meters and metering services, AMI, meter
data management, pre-payment Outage Management System (OMS), Interactive Voice Response (IVR) and Geospatial Information
System (GIS).
Nexans■ Nexans produces power transmission and distribution cables, wire rods, copper, fire optic telecommuncation cables.
■ Nexans' Transmission,Distributors and Operators division produces cables and wires for transmisson and distribution of electricity.
Siemens
■ Siemens is engaged in electronics and electrical engineering. The Company is an integrated technology company with activities in
the fields of industry, energy and healthcare.
■ Siemens Power Transmission division offers solutions toward renewable energy, the expansion and interconnection of grid
infrastructures. Source: Company data, Credit Suisse research

20 February 2013
ABB (ABBN.VX) 73
Vendor data—Automation & Power
Figure 185: Factory Automation Brackets showing the company’s division,*=organic
Order Growth (YoY%) Geo Mar-10 Jun-10 Sep-10 Dec-10 Mar-11 Jun-11 Sep-11 Dec-11 Mar-12 Jun-12 Sep-12 Dec-12
Americas
Emerson (IA)* US 9% 45% 40% 30% 27% 12% 2% 3% 3% -7% -6% -6%
Europe
ABB (DA&M)* EU 2% 24% 39% 34% 34% 25% 15% 11% 9% -2% 1% 3%
Krones EU 33% 21% -5% 15% 14% 25% 11% 8% 5% -4% 12%
Kuka EU 23% 12% 52% 22% 60% 55% 20% 20% 52% 15% 0% 20%
Siemens (D)* EU 12% 35% 15% 48% 23% 17% 32% -12% -1% -11% -7% -3%
Siemens (IA)* EU 14% 27% 20% 24% 20% 7% 11% 13% 6% -5% 2% -12%
Asia
Fanuc JP 475% 208% 172% 68% 33% 31% 11% 7% -2% -14% -4% -8%
Mitsubishi Electric (FA) JP 7% 2% -1% 3% 9% -8% -5% 6% 2% 3% 2%
THK JP 185% 243% 140% 61% 25% -9% -29% -29% -23% -11% -6% 5%
Yaskawa JP 120% 198% 58% 12% 15% 12% -8% -8% -2% -16% 0% 12% Source: Company data
Figure 186: Factory Automation Brackets showing the company’s division,*=organic
Sales Change(YoY%) Geo Mar-10 Jun-10 Sep-10 Dec-10 Mar-11 Jun-11 Sep-11 Dec-11 Mar-12 Jun-12 Sep-12 Dec-12
Americas
Danaher (IT)* US 6% 18% 17% 16% 19% 15% 10% 3% 0% 1% 2% 3%
Emerson (IA)* US -12% 19% 25% 23% 30% 18% 15% 2% -1% 3% -1% -6%
GE (Intelligent Platform) US 0% 0% 0% 0% 0% 0% 0% 0% 0% 0% 0%
PTC US 3% 8% 11% 4% 11% 13% 20% 18% 12% 10% -5% 2%
Rockwell Automation* US 5% 25% 27% 28% 24% 14% 17% 8% 7% 7% 5% 2%
WEG(Industrial/Elec Equip) BR -22% 4% 44% 32% 32% 26% 7% 28% 27% 27% 20%
Europe
ABB (DA&M)* EU -13% -5% 16% 14% 21% 25% 15% 11% 15% 11% 5% 7%
Dassault Systems* EU 7% 16% 25% 26% 29% 15% 9% 9% 10% 10% 10% 8%
Krones EU 11% 23% 15% -2% 14% 20% 10% 13% 7% -1% 9%
Kuka EU -8% 29% 26% 32% 56% 24% 35% 24% 12% 33% 33% 7%
Schneider (I)* EU 19% 27% 28% 21% 22% 14% 7% 1% -7% -6% -3%
Siemens (D)* EU -17% 3% 6% 15% 20% 18% 26% 5% 8% -1% -1% -5%
Siemens (IA)* EU 4% 19% 16% 20% 19% 19% 14% 4% 9% 0% 1% -3%
Asia
Airtac TW 0% 0% 0% 0% 45% 22% 13% 10% -5% 1% 7% 13%
Fanuc JP 97% 118% 156% 125% 6% 32% 23% 16% 14% 5% -7% -11%
Hiwin TW 204% 141% 145% 126% 95% 92% 76% 42% -22% -13% -21% -34%
Keyence JP 48% 63% 45% 34% 14% 17% 6% 4% 6% 7% 10% 9%
Mitsubishi Electric (FA) JP 31% 60% 52% 37% 27% 25% 13% -1% 6% -4% -6% -6%
Omron (IA) JP 35% 62% 42% 25% 14% 9% 1% -7% -5% -12% -6% 0%
Siasun CH 21% -6% 0% 60% 22% 88% 35% 35% 48% 38% 31%
SMC JP 61% 88% 64% 34% 22% 14% 2% -4% 8% -6% -8%
THK JP 31% 101% 89% 59% 36% 17% 8% -2% -10% -12% -18%
Yaskawa JP -5% 37% 46% 40% 14% 21% 7% -7% -11% -5% -5% 1% Source: Company data
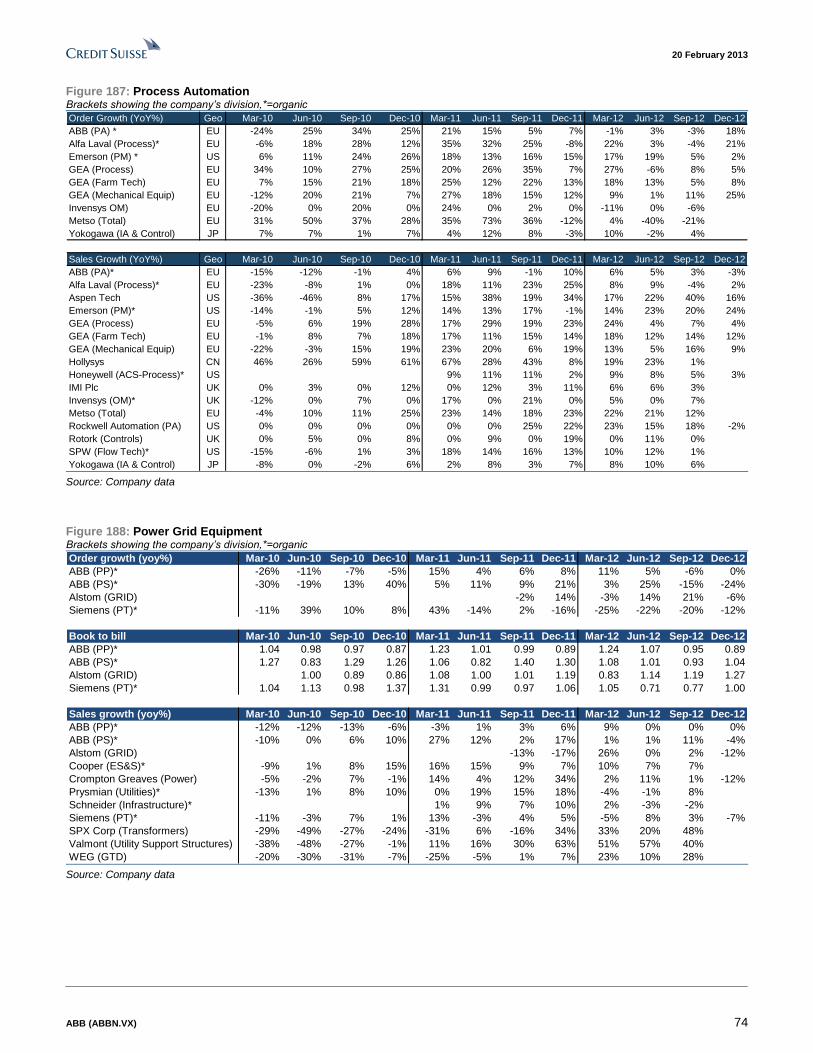
20 February 2013
ABB (ABBN.VX) 74
Figure 187: Process Automation Brackets showing the company’s division,*=organic
Order Growth (YoY%) Geo Mar-10 Jun-10 Sep-10 Dec-10 Mar-11 Jun-11 Sep-11 Dec-11 Mar-12 Jun-12 Sep-12 Dec-12
ABB (PA) * EU -24% 25% 34% 25% 21% 15% 5% 7% -1% 3% -3% 18%
Alfa Laval (Process)* EU -6% 18% 28% 12% 35% 32% 25% -8% 22% 3% -4% 21%
Emerson (PM) * US 6% 11% 24% 26% 18% 13% 16% 15% 17% 19% 5% 2%
GEA (Process) EU 34% 10% 27% 25% 20% 26% 35% 7% 27% -6% 8% 5%
GEA (Farm Tech) EU 7% 15% 21% 18% 25% 12% 22% 13% 18% 13% 5% 8%
GEA (Mechanical Equip) EU -12% 20% 21% 7% 27% 18% 15% 12% 9% 1% 11% 25%
Invensys OM) EU -20% 0% 20% 0% 24% 0% 2% 0% -11% 0% -6%
Metso (Total) EU 31% 50% 37% 28% 35% 73% 36% -12% 4% -40% -21%
Yokogawa (IA & Control) JP 7% 7% 1% 7% 4% 12% 8% -3% 10% -2% 4%
Sales Growth (YoY%) Geo Mar-10 Jun-10 Sep-10 Dec-10 Mar-11 Jun-11 Sep-11 Dec-11 Mar-12 Jun-12 Sep-12 Dec-12
ABB (PA)* EU -15% -12% -1% 4% 6% 9% -1% 10% 6% 5% 3% -3%
Alfa Laval (Process)* EU -23% -8% 1% 0% 18% 11% 23% 25% 8% 9% -4% 2%
Aspen Tech US -36% -46% 8% 17% 15% 38% 19% 34% 17% 22% 40% 16%
Emerson (PM)* US -14% -1% 5% 12% 14% 13% 17% -1% 14% 23% 20% 24%
GEA (Process) EU -5% 6% 19% 28% 17% 29% 19% 23% 24% 4% 7% 4%
GEA (Farm Tech) EU -1% 8% 7% 18% 17% 11% 15% 14% 18% 12% 14% 12%
GEA (Mechanical Equip) EU -22% -3% 15% 19% 23% 20% 6% 19% 13% 5% 16% 9%
Hollysys CN 46% 26% 59% 61% 67% 28% 43% 8% 19% 23% 1%
Honeywell (ACS-Process)* US 9% 11% 11% 2% 9% 8% 5% 3%
IMI Plc UK 0% 3% 0% 12% 0% 12% 3% 11% 6% 6% 3%
Invensys (OM)* UK -12% 0% 7% 0% 17% 0% 21% 0% 5% 0% 7%
Metso (Total) EU -4% 10% 11% 25% 23% 14% 18% 23% 22% 21% 12%
Rockwell Automation (PA) US 0% 0% 0% 0% 0% 0% 25% 22% 23% 15% 18% -2%
Rotork (Controls) UK 0% 5% 0% 8% 0% 9% 0% 19% 0% 11% 0%
SPW (Flow Tech)* US -15% -6% 1% 3% 18% 14% 16% 13% 10% 12% 1%
Yokogawa (IA & Control) JP -8% 0% -2% 6% 2% 8% 3% 7% 8% 10% 6% Source: Company data
Figure 188: Power Grid Equipment Brackets showing the company’s division,*=organic
Order growth (yoy%) Mar-10 Jun-10 Sep-10 Dec-10 Mar-11 Jun-11 Sep-11 Dec-11 Mar-12 Jun-12 Sep-12 Dec-12
ABB (PP)* -26% -11% -7% -5% 15% 4% 6% 8% 11% 5% -6% 0%
ABB (PS)* -30% -19% 13% 40% 5% 11% 9% 21% 3% 25% -15% -24%
Alstom (GRID) -2% 14% -3% 14% 21% -6%
Siemens (PT)* -11% 39% 10% 8% 43% -14% 2% -16% -25% -22% -20% -12%
Book to bill Mar-10 Jun-10 Sep-10 Dec-10 Mar-11 Jun-11 Sep-11 Dec-11 Mar-12 Jun-12 Sep-12 Dec-12
ABB (PP)* 1.04 0.98 0.97 0.87 1.23 1.01 0.99 0.89 1.24 1.07 0.95 0.89
ABB (PS)* 1.27 0.83 1.29 1.26 1.06 0.82 1.40 1.30 1.08 1.01 0.93 1.04
Alstom (GRID) 1.00 0.89 0.86 1.08 1.00 1.01 1.19 0.83 1.14 1.19 1.27
Siemens (PT)* 1.04 1.13 0.98 1.37 1.31 0.99 0.97 1.06 1.05 0.71 0.77 1.00
Sales growth (yoy%) Mar-10 Jun-10 Sep-10 Dec-10 Mar-11 Jun-11 Sep-11 Dec-11 Mar-12 Jun-12 Sep-12 Dec-12
ABB (PP)* -12% -12% -13% -6% -3% 1% 3% 6% 9% 0% 0% 0%
ABB (PS)* -10% 0% 6% 10% 27% 12% 2% 17% 1% 1% 11% -4%
Alstom (GRID) -13% -17% 26% 0% 2% -12%
Cooper (ES&S)* -9% 1% 8% 15% 16% 15% 9% 7% 10% 7% 7%
Crompton Greaves (Power) -5% -2% 7% -1% 14% 4% 12% 34% 2% 11% 1% -12%
Prysmian (Utilities)* -13% 1% 8% 10% 0% 19% 15% 18% -4% -1% 8%
Schneider (Infrastructure)* 1% 9% 7% 10% 2% -3% -2%
Siemens (PT)* -11% -3% 7% 1% 13% -3% 4% 5% -5% 8% 3% -7%
SPX Corp (Transformers) -29% -49% -27% -24% -31% 6% -16% 34% 33% 20% 48%
Valmont (Utility Support Structures) -38% -48% -27% -1% 11% 16% 30% 63% 51% 57% 40%
WEG (GTD) -20% -30% -31% -7% -25% -5% 1% 7% 23% 10% 28% Source: Company data

20 February 2013
ABB (ABBN.VX) 75
PEERs map
Figure 189: ABB – PEERs map
Source: Credit Suisse PEERS
We show in Figure 189 the PEERs map for ABB.
PEERs is a global database that captures unique information about companies within the
Credit Suisse coverage universe based on their relationships with other companies – their
customers, suppliers and competitors. The database is built from our research analysts’
insight regarding these relationships. Credit Suisse covers over 3,000 companies globally.
These companies form the core of the PEERs database, but it also includes relationships
on stocks that are not under coverage.

20 February 2013
ABB (ABBN.VX) 76
Companies Mentioned (Price as of 15-Feb-2013)
Hyundai Heavy Industries (009540.KS, W211,500) Airtac (1590.TW, NT$170.0) Hiwin (2049.TW, NT$228.5) Mori Seiki (6141.OS, ¥959) SMC (6273.T, ¥15,900) Mitsubishi Electric (6503.T, ¥770) Yaskawa Electric Corporation (6506.T, ¥846) Keyence (6861.T, ¥26,200) Fanuc (6954.T, ¥14,840) ABB (ABBN.VX, SFr20.97, OUTPERFORM, TP SFr26.0) Autodesk Inc. (ADSK.OQ, $39.0) Alfa Laval (ALFA.ST, Skr145.4) Alstom (ALSO.PA, €33.4) Assa Abloy (ASSAb.ST, Skr249.3) Atlas Copco (ATCOa.ST, Skr185.8) Dassault Systemes (DAST.PA, €84.06) Danaher Corporation (DHR.N, $61.68) Electrolux (ELUXb.ST, Skr162.0) Emerson (EMR.N, $58.29) Gamesa (GAM.MC, €2.25) General Electric (GE.N, $23.29) Geberit (GEBN.VX, SFr223.2) Honeywell International Inc. (HON.N, $70.11) IMI Plc (IMI.L, 1160.0p) Invensys (ISYS.L, 351.6p) Kennametal Inc. (KMT.N, $41.86) Kone Corporation (KNEBV.HE, €64.7) Legrand SA (LEGD.PA, €33.92) Metso (MEO1V.HE, €33.76) Nexans (NEXS.PA, €39.38) Oracle Corporation (ORCL.OQ, $34.81) Philips (PHG.AS, €21.94) Prysmian (PRY.MI, €15.74) Regal Entertainment Group (RGC.N, $15.33) Rockwell Automation (ROK.N, $90.76) Rotork plc (ROR.L, 2914.0p) Sandvik (SAND.ST, Skr106.1) SAP (SAPG.F, €59.98) Schneider (SCHN.PA, €54.49) Schindler-Holding AG (SCHP.VX, SFr140.8) SGL Carbon SE (SGCG.DE, €32.68) Siemens (SIEGn.DE, €78.11) SKF (SKFb.ST, Skr158.0) SPX (SPW.N, $79.37) Vestas (VWS.CO, Dkr40.22) WEG (WEGE3.SA, R$25.4)
Disclosure Appendix
Important Global Disclosures
The analysts identified in this report each certify, with respect to the companies or securities that the individual analyzes, that (1) the views expressed in this report accurately reflect his or her personal views about all of the subject companies and securities and (2) no part of his or her compensation was, is or will be directly or indirectly related to the specific recommendations or views expressed in this report.
Price and Rating History for ABB (ABBN.VX)
ABBN.VX Closing Price Target Price
Date (SFr) (SFr) Rating
19-Feb-10 20.79 20.00 U
01-Jun-10 19.28 20.00 N
08-Jun-10 18.76 R
08-Sep-10 20.50 21.00 N
21-Feb-11 22.60 24.00
28-Apr-11 23.86 26.00 O
22-Jul-11 20.10 24.00
09-Aug-11 15.72 19.50
22-Sep-11 15.40 19.00
08-Dec-11 17.10 22.00
30-Jan-12 19.04 R
06-Feb-12 19.96 22.00 O
17-Feb-12 19.32 R
* Asterisk signifies initiation or assumption of coverage.
U N D ERPERFO RM
N EU T RA L
REST RICT ED
O U T PERFO RM

20 February 2013
ABB (ABBN.VX) 77
The analyst(s) responsible for preparing this research report received Compensation that is based upon various factors including Credit Suisse's total revenues, a portion of which are generated by Credit Suisse's investment banking activities
As of December 10, 2012 Analysts’ stock rating are defined as follows:
Outperform (O) : The stock’s total return is expected to outperform the relevant benchmark*over the next 12 months.
Neutral (N) : The stock’s total return is expected to be in line with the relevant benchmark* over the next 12 months.
Underperform (U) : The stock’s total return is expected to underperform the relevant benchmark* over the next 12 months.
*Relevant benchmark by region: As of 10th December 2012, Japanese ratings are based on a stock’s total return relative to the analyst's coverage universe which consists of all companies covered by the analyst within the relevant sector, with Outperforms representing the most attractive, Neut rals the less attractive, and Underperforms the least attractive investment opportunities. As of 2nd October 2012, U.S. and Canadian as well as European ratings are based on a stock’s total return relative to the analyst's coverage universe which consists of all companies covered by the analyst within the relevant sector, with Outperforms representing the most attractive, Neutrals the less attractive, and Underperforms the least attractive investment opportunities. For Latin American and non -Japan Asia stocks, ratings are based on a stock’s total return relative to the average total return of the relevant country or regional benchmark; Australia, New Zealand are, and prior to 2nd October 2012 U.S. and Canadian ratings were based on (1) a stock’s absolute total return potential to its current share price and (2) the relative attractiveness of a stock’s total return potential within an analyst’s coverage universe. For Australian and New Zealand stocks, 12 -month rolling yield is incorporated in the absolute total return calculation and a 15% and a 7.5% threshold replace the 10-15% level in the Outperform and Underperform stock rating defini tions, respectively. The 15% and 7.5% thresholds replace the +10-15% and -10-15% levels in the Neutral stock rating definition, respectively. Prior to 10th December 2012, Japanese ratings were based on a stock’s total return relative to the average total return of the relevant country or regional benchmark.
Restricted (R) : In certain circumstances, Credit Suisse policy and/or applicable law and regulations preclude certain types of communications, including an investment recommendation, during the course of Credit Suisse's engagement in an investment banking transaction and in certain other circumstances.
Volatility Indicator [V] : A stock is defined as volatile if the stock price has moved up or down by 20% or more in a month in at least 8 of the past 24 months or the analyst expects significant volatility going forward.
Analysts’ sector weightings are distinct from analysts’ stock ratings and are based on the analyst’s expectations for the fundamentals and/or valuation of the sector* relative to the group’s historic fundamentals and/or valuation:
Overweight : The analyst’s expectation for the sector’s fundamentals and/or valuation is favorable over the next 12 months.
Market Weight : The analyst’s expectation for the sector’s fundamentals and/or valuation is neutral over the next 12 months.
Underweight : The analyst’s expectation for the sector’s fundamentals and/or valuation is cautious over the next 12 months.
*An analyst’s coverage sector consists of all companies covered by the analyst within the relevant sector. An analyst may cover multiple sectors.
Credit Suisse's distribution of stock ratings (and banking clients) is:
Global Ratings Distribution
Rating Versus universe (%) Of which banking clients (%)
Outperform/Buy* 42% (54% banking clients)
Neutral/Hold* 38% (46% banking clients)
Underperform/Sell* 16% (40% banking clients)
Restricted 3%
*For purposes of the NYSE and NASD ratings distribution disclosure requirements, our stock ratings of Outperform, Neutral, an d Underperform most closely correspond to Buy, Hold, and Sell, respectively; however, the meanings are not the same, as our stock ratings are determined on a relative basis. (Please refer to definitions above.) An investor's decision to buy or sell a security should be based on investment objectives, current holdings, and other individual factors.
Credit Suisse’s policy is to update research reports as it deems appropriate, based on developments with the subject company, the sector or the market that may have a material impact on the research views or opinions stated herein.
Credit Suisse's policy is only to publish investment research that is impartial, independent, clear, fair and not misleading. For more detail please refer to Credit Suisse's Policies for Managing Conflicts of Interest in connection with Investment Research: http://www.csfb.com/research and analytics/disclaimer/managing_conflicts_disclaimer.html
Credit Suisse does not provide any tax advice. Any statement herein regarding any US federal tax is not intended or written to be used, and cannot be used, by any taxpayer for the purposes of avoiding any penalties.
Price Target: (12 months) for ABB (ABBN.VX)
Method: We use a combination of SOTP, DCF and HOLT to derive our target price of SFr26. Our SOTP take peers of ABB amongst its five divisions. We have used EV/EBITA mutliples for fiscal year 2013. Our DCF analysis is EVA based and takes a WACC of 9% and terminal growth of 2% into account. Our HOLT analysis derives a fair value of SFr26 based on CS expectations.
Risk: There is risk to our target price if underlying end markets worsen, sizable contracts get lost or economic growth turns out to be weaker than we are currently assuming. In addition, ABB has to deal with emerging market competition particularly from Asian companies which

20 February 2013
ABB (ABBN.VX) 78
has impacted margins within ABB's Power Products business in the past. Furthermore, we believe there is risk to our target price if ABB undertake sizable acquisition at high multiples which could impact their financial position.
Please refer to the firm's disclosure website at www.credit-suisse.com/researchdisclosures for the definitions of abbreviations typically used in the target price method and risk sections.
See the Companies Mentioned section for full company names
The subject company (ABBN.VX, PHG.AS, SKFb.ST, ALFA.ST, ATCOa.ST, GEBN.VX, MEO1V.HE, SAND.ST, SCHP.VX, SIEGn.DE, KMT.N, 6273.T, 6861.T, IMI.L, EMR.N, GE.N, HON.N, 009540.KS, SCHN.PA, SGCG.DE, ALSO.PA, GAM.MC, NEXS.PA, ADSK.OQ, ORCL.OQ, SAPG.F, DHR.N, RGC.N, SPW.N) currently is, or was during the 12-month period preceding the date of distribution of this report, a client of Credit Suisse.
Credit Suisse provided investment banking services to the subject company (ABBN.VX, PHG.AS, MEO1V.HE, SAND.ST, SCHP.VX, SIEGn.DE, GE.N, 009540.KS, SCHN.PA, ORCL.OQ, RGC.N, SPW.N) within the past 12 months.
Credit Suisse provided non-investment banking services to the subject company (ABBN.VX, SKFb.ST, ATCOa.ST, GEBN.VX, SCHP.VX, SIEGn.DE, 6273.T, 6861.T, IMI.L, EMR.N, GE.N, HON.N, 009540.KS, SGCG.DE, ALSO.PA, ADSK.OQ, RGC.N) within the past 12 months
Credit Suisse has managed or co-managed a public offering of securities for the subject company (ABBN.VX, PHG.AS, SCHP.VX, GE.N, 009540.KS, ORCL.OQ, RGC.N) within the past 12 months.
Credit Suisse has received investment banking related compensation from the subject company (ABBN.VX, PHG.AS, MEO1V.HE, SAND.ST, SCHP.VX, SIEGn.DE, GE.N, 009540.KS, SCHN.PA, ORCL.OQ, RGC.N, SPW.N) within the past 12 months
Credit Suisse expects to receive or intends to seek investment banking related compensation from the subject company (ABBN.VX, PHG.AS, ALFA.ST, MEO1V.HE, SAND.ST, SCHP.VX, SIEGn.DE, KMT.N, 6273.T, IMI.L, EMR.N, GE.N, HON.N, 009540.KS, SCHN.PA, SGCG.DE, GAM.MC, NEXS.PA, 6503.T, ADSK.OQ, ORCL.OQ, SAPG.F, DHR.N, RGC.N, WEGE3.SA, SPW.N) within the next 3 months.
Credit Suisse has received compensation for products and services other than investment banking services from the subject company (ABBN.VX, SKFb.ST, ATCOa.ST, GEBN.VX, SCHP.VX, SIEGn.DE, 6273.T, 6861.T, IMI.L, EMR.N, GE.N, HON.N, 009540.KS, SGCG.DE, ALSO.PA, ADSK.OQ, RGC.N) within the past 12 months
As of the date of this report, Credit Suisse makes a market in the following subject companies (KMT.N, EMR.N, ROK.N, GE.N, HON.N, ADSK.OQ, ORCL.OQ, DHR.N, RGC.N, SPW.N).
As of the end of the preceding month, Credit Suisse beneficially own 1% or more of a class of common equity securities of (ABBN.VX, PHG.AS, GEBN.VX, SIEGn.DE, 2049.TW, 1590.TW, SCHN.PA, SAPG.F, PRY.MI).
Credit Suisse has a material conflict of interest with the subject company (PHG.AS). Credit Suisse is financial advisor to Philips Electronics NV in the sale of its Lifestyle Entertainment business to Funai Electric Co.
Credit Suisse has a material conflict of interest with the subject company (GAM.MC). Credit Suisse is acting as exclusive financial advisor to Gamesa in the potential sale of 183MW of its project pipeline in Germany to Impax Asset Management.
Credit Suisse has a material conflict of interest with the subject company (SPW.N). Credit Suisse Securities USA LLC acted as financial advisor to SPX Corp in the sale of its Service Solutions business to Robert Bosch GmbBH.
Important Regional Disclosures
Singapore recipients should contact Credit Suisse AG, Singapore Branch for any matters arising from this research report.
The analyst(s) involved in the preparation of this report have not visited the material operations of the subject company (ABBN.VX, PHG.AS, SKFb.ST, ALFA.ST, ATCOa.ST, ELUXb.ST, GEBN.VX, KNEBV.HE, MEO1V.HE, SAND.ST, SCHP.VX, SIEGn.DE, ASSAb.ST, KMT.N, 2049.TW, 1590.TW, 6273.T, 6861.T, 6954.T, IMI.L, EMR.N, ROR.L, ROK.N, GE.N, HON.N, ISYS.L, LEGD.PA, 009540.KS, SCHN.PA, SGCG.DE, ALSO.PA, GAM.MC, NEXS.PA, VWS.CO, 6503.T, ADSK.OQ, DAST.PA, ORCL.OQ, SAPG.F, DHR.N, 6141.OS, RGC.N, WEGE3.SA, 6506.T, SPW.N, PRY.MI) within the past 12 months
Restrictions on certain Canadian securities are indicated by the following abbreviations: NVS--Non-Voting shares; RVS--Restricted Voting Shares; SVS--Subordinate Voting Shares.
Individuals receiving this report from a Canadian investment dealer that is not affiliated with Credit Suisse should be advised that this report may not contain regulatory disclosures the non-affiliated Canadian investment dealer would be required to make if this were its own report.
For Credit Suisse Securities (Canada), Inc.'s policies and procedures regarding the dissemination of equity research, please visit http://www.csfb.com/legal_terms/canada_research_policy.shtml.
The following disclosed European company/ies have estimates that comply with IFRS: (ABBN.VX, PHG.AS, SKFb.ST, ALFA.ST, ATCOa.ST, ELUXb.ST, GEBN.VX, MEO1V.HE, SAND.ST, SCHP.VX, SIEGn.DE, ASSAb.ST, IMI.L, ISYS.L, LEGD.PA, SCHN.PA, ALSO.PA, DAST.PA, SAPG.F, 6141.OS).
Credit Suisse has sent extracts of this research report to the subject company (ABBN.VX) prior to publication for the purpose of verifying factual accuracy. Based on information provided by the subject company, factual changes have been made as a result.
As of the date of this report, Credit Suisse acts as a market maker or liquidity provider in the equities securities that are the subject of this report.

20 February 2013
ABB (ABBN.VX) 79
Principal is not guaranteed in the case of equities because equity prices are variable.
Commission is the commission rate or the amount agreed with a customer when setting up an account or at any time after that.
To the extent this is a report authored in whole or in part by a non-U.S. analyst and is made available in the U.S., the following are important disclosures regarding any non-U.S. analyst contributors: The non-U.S. research analysts listed below (if any) are not registered/qualified as research analysts with FINRA. The non-U.S. research analysts listed below may not be associated persons of CSSU and therefore may not be subject to the NASD Rule 2711 and NYSE Rule 472 restrictions on communications with a subject company, public appearances and trading securities held by a research analyst account.
Credit Suisse Securities (Europe) Limited...................................... Simon Toennessen ; Andre Kukhnin CFA ; Max Yates ; Jonathan Hurn, CFA
Important Credit Suisse HOLT Disclosures
With respect to the analysis in this report based on the Credit Suisse HOLT methodology, Credit Suisse certifies that (1) the views expressed in this report accurately reflect the Credit Suisse HOLT methodology and (2) no part of the Firm’s compensation was, is, or will be directly related to the specific views disclosed in this report
The Credit Suisse HOLT methodology does not assign ratings to a security. It is an analytical tool that involves use of a set of proprietary quantitative algorithms and warranted value calculations, collectively called the Credit Suisse HOLT valuation model, that are consistently applied to all the companies included in its database. Third-part data (including consensus earnings estimates) are systematically translated into a number of default algorithms available in the Credit Suisse HOLT valuation model. The source financial statement, pricing, and earnings data provided by outside data vendors are subject to quality control and may also be adjusted to more closely measure the underlying economics of firm performance. The adjustments provide consistency when analyzing a single company across time, or analyzing multiple companies across industries or national borders. The default scenario that is produced by the Credit Suisse HOLT valuation model establishes the baseline valuation for a security, and a user then may adjust the default variables to produce alternative scenarios, any of which could occur.
Additional information about the Credit Suisse HOLT methodology is available on request.
The Credit Suisse HOLT methodology does not assign a price target to a security. The default scenario that is produced by the Credit Suisse HOLT valuation model establishes a warranted price for a security, and as the third-party data are updated, the warranted price may also change. The default variable may also be adjusted to produce alternative warranted prices, any of which could occur.
CFROI®, HOLT, HOLTfolio, ValueSearch, AggreGator, Signal Flag and “Powered by HOLT” are trademarks or service marks or registered trademarks or registered service marks of Credit Suisse or its affiliates in the United States and other countries. HOLT is a corporate performance and valuation advisory service of Credit Suisse.
For Credit Suisse disclosure information on other companies mentioned in this report, please visit the website at www.credit-suisse.com/researchdisclosures or call +1 (877) 291-2683.

20 February 2013
ABB (ABBN.VX) 80
References in this report to Credit Suisse include all of the subsidiaries and affiliates of Credit Suisse operating under its investment banking division. For more information on our structure, please use the following link: https://www.credit-suisse.com/who_we_are/en/.This report may contain material that is not directed to, or intended for distribution to or use by, any person or entity who is a citizen or resident of or located in any locality, state, country or other jurisdiction where such distribution, publication, availability or use would be contrary to law or regulation or which would subject Credit Suisse AG or its affiliates ("CS") to any registration or licensing requirement within such jurisdiction. All material presented in this report, unless specifically indicated otherwise, is under copyright to CS. None of the material, nor its content, nor any copy of it, may be altered in any way, transmitted to, copied or distributed to any other party, without the prior express written permission of CS. All trademarks, service marks and logos used in this report are trademarks or service marks or registered trademarks or service marks of CS or its affiliates. The information, tools and material presented in this report are provided to you for information purposes only and are not to be used or considered as an offer or the solicitation of an offer to sell or to buy or subscribe for securities or other financial instruments. CS may not have taken any steps to ensure that the securities referred to in this report are suitable for any particular investor. CS will not treat recipients of this report as its customers by virtue of their receiving this report. The investments and services contained or referred to in this report may not be suitable for you and it is recommended that you consult an independent investment advisor if you are in doubt about such investments or investment services. Nothing in this report constitutes investment, legal, accounting or tax advice, or a representation that any investment or strategy is suitable or appropriate to your individual circumstances, or otherwise constitutes a personal recommendation to you. CS does not advise on the tax consequences of investments and you are advised to contact an independent tax adviser. Please note in particular that the bases and levels of taxation may change. Information and opinions presented in this report have been obtained or derived from sources believed by CS to be reliable, but CS makes no representation as to their accuracy or completeness. CS accepts no liability for loss arising from the use of the material presented in this report, except that this exclusion of liability does not apply to the extent that such liability arises under specific statutes or regulations applicable to CS. This report is not to be relied upon in substitution for the exercise of independent judgment. CS may have issued, and may in the future issue, other communications that are inconsistent with, and reach different conclusions from, the information presented in this report. Those communications reflect the different assumptions, views and analytical methods of the analysts who prepared them and CS is under no obligation to ensure that such other communications are brought to the attention of any recipient of this report. CS may, to the extent permitted by law, participate or invest in financing transactions with the issuer(s) of the securities referred to in this report, perform services for or solicit business from such issuers, and/or have a position or holding, or other material interest, or effect transactions, in such securities or options thereon, or other investments related thereto. In addition, it may make markets in the securities mentioned in the material presented in this report. CS may have, within the last three years, served as manager or co-manager of a public offering of securities for, or currently may make a primary market in issues of, any or all of the entities mentioned in this report or may be providing, or have provided within the previous 12 months, significant advice or investment services in relation to the investment concerned or a related investment. Additional information is, subject to duties of confidentiality, available on request. Some investments referred to in this report will be offered solely by a single entity and in the case of some investments solely by CS, or an associate of CS or CS may be the only market maker in such investments. Past performance should not be taken as an indication or guarantee of future performance, and no representation or warranty, express or implied, is made regarding future performance. Information, opinions and estimates contained in this report reflect a judgment at its original date of publication by CS and are subject to change without notice. The price, value of and income from any of the securities or financial instruments mentioned in this report can fall as well as rise. The value of securities and financial instruments is subject to exchange rate fluctuation that may have a positive or adverse effect on the price or income of such securities or financial instruments. Investors in securities such as ADR's, the values of which are influenced by currency volatility, effectively assume this risk. Structured securities are complex instruments, typically involve a high degree of risk and are intended for sale only to sophisticated investors who are capable of understanding and assuming the risks involved. The market value of any structured security may be affected by changes in economic, financial and political factors (including, but not limited to, spot and forward interest and exchange rates), time to maturity, market conditions and volatility, and the credit quality of any issuer or reference issuer. Any investor interested in purchasing a structured product should conduct their own investigation and analysis of the product and consult with their own professional advisers as to the risks involved in making such a purchase. Some investments discussed in this report may have a high level of volatility. High volatility investments may experience sudden and large falls in their value causing losses when that investment is realised. Those losses may equal your original investment. Indeed, in the case of some investments the potential losses may exceed the amount of initial investment and, in such circumstances, you may be required to pay more money to support those losses. Income yields from investments may fluctuate and, in consequence, initial capital paid to make the investment may be used as part of that income yield. Some investments may not be readily realisable and it may be difficult to sell or realise those investments, similarly it may prove difficult for you to obtain reliable information about the value, or risks, to which such an investment is exposed. This report may provide the addresses of, or contain hyperlinks to, websites. Except to the extent to which the report refers to website material of CS, CS has not reviewed any such site and takes no responsibility for the content contained therein. Such address or hyperlink (including addresses or hyperlinks to CS's own website material) is provided solely for your convenience and information and the content of any such website does not in any way form part of this document. Accessing such website or following such link through this report or CS's website shall be at your own risk. This report is issued and distributed in Europe (except Switzerland) by Credit Suisse Securities (Europe) Limited, One Cabot Square, London E14 4QJ, England, which is regulated in the United Kingdom by The Financial Services Authority ("FSA"). This report is being distributed in Germany by Credit Suisse Securities (Europe) This report is being distributed in the United States and Canada by Credit Suisse Securities (USA) LLC; in Switzerland by Credit Suisse AG; in Brazil by Banco de Investimentos Credit Suisse (Brasil) S.A or its affiliates; in Mexico by Banco Credit Suisse (México), S.A. (transactions related to the securities mentioned in this report will only be effected in compliance with applicable regulation); in Japan by Credit Suisse Securities (Japan) Limited, Financial Instruments Firm, Director-General of Kanto Local Finance Bureau (Kinsho) No. 66, a member of Japan Securities Dealers Association, The Financial Futures Association of Japan, Japan Investment Advisers Association, Type II Financial Instruments Firms Association; elsewhere in Asia/ Pacific by whichever of the following is the appropriately authorised entity in the relevant jurisdiction: Credit Suisse (Hong Kong) Limited, Credit Suisse Equities (Australia) Limited, Credit Suisse Securities (Thailand) Limited, Credit Suisse Securities (Malaysia) Sdn Bhd, Credit Suisse AG, Singapore Branch, Credit Suisse Securities (India) Private Limited regulated by the Securities and Exchange Board of India (registration Nos. INB230970637; INF230970637; INB010970631; INF010970631), having registered address at 9th Floor, Ceejay House, Dr.A.B. Road, Worli, Mumbai - 18, India, T- +91-22 6777 3777, Credit Suisse Securities (Europe) Limited, Seoul Branch, Credit Suisse AG, Taipei Securities Branch, PT Credit Suisse Securities Indonesia, Credit Suisse Securities (Philippines ) Inc., and elsewhere in the world by the relevant authorised affiliate of the above. Research on Taiwanese securities produced by Credit Suisse AG, Taipei Securities Branch has been prepared by a registered Senior Business Person. Research provided to residents of Malaysia is authorised by the Head of Research for Credit Suisse Securities (Malaysia) Sdn Bhd, to whom they should direct any queries on +603 2723 2020. This research may not conform to Canadian disclosure requirements. In jurisdictions where CS is not already registered or licensed to trade in securities, transactions will only be effected in accordance with applicable securities legislation, which will vary from jurisdiction to jurisdiction and may require that the trade be made in accordance with applicable exemptions from registration or licensing requirements. Non-U.S. customers wishing to effect a transaction should contact a CS entity in their local jurisdiction unless governing law permits otherwise. U.S. customers wishing to effect a transaction should do so only by contacting a representative at Credit Suisse Securities (USA) LLC in the U.S. Please note that this research was originally prepared and issued by CS for distribution to their market professional and institutional investor customers. Recipients who are not market professional or institutional investor customers of CS should seek the advice of their independent financial advisor prior to taking any investment decision based on this report or for any necessary explanation of its contents. This research may relate to investments or services of a person outside of the UK or to other matters which are not regulated by the FSA or in respect of which the protections of the FSA for private customers and/or the UK compensation scheme may not be available, and further details as to where this may be the case are available upon request in respect of this report. CS may provide various services to US municipal entities or obligated persons ("municipalities"), including suggesting individual transactions or trades and entering into such transactions. Any services CS provides to municipalities are not viewed as "advice" within the meaning of Section 975 of the Dodd-Frank Wall Street Reform and Consumer Protection Act. CS is providing any such services and related information solely on an arm's length basis and not as an advisor or fiduciary to the municipality. In connection with the provision of the any such services, there is no agreement, direct or indirect, between any municipality (including the officials, management, employees or agents thereof) and CS for CS to provide advice to the municipality. Municipalities should consult with their financial, accounting and legal advisors regarding any such services provided by CS. In addition, CS is not acting for direct or indirect compensation to solicit the municipality on behalf of an unaffiliated broker, dealer, municipal securities dealer, municipal advisor, or investment adviser for the purpose of obtaining or retaining an engagement by the municipality for or in connection with Municipal Financial Products, the issuance of municipal securities, or of an investment adviser to provide investment advisory services to or on behalf of the municipality. If this report is being distributed by a financial institution other than Credit Suisse AG, or its affiliates, that financial institution is solely responsible for distribution. Clients of that institution should contact that institution to effect a transaction in the securities mentioned in this report or require further information. This report does not constitute investment advice by Credit Suisse to the clients of the distributing financial institution, and neither Credit Suisse AG, its affiliates, and their respective officers, directors and employees accept any liability whatsoever for any direct or consequential loss arising from their use of this report or its content. Principal is not guaranteed. Commission is the commission rate or the amount agreed with a customer when setting up an account or at any time after that.
Copyright © 2013 CREDIT SUISSE AG and/or its affiliates. All rights reserved.
Investment principal on bonds can be eroded depending on sale price or market price. In addition, there are bonds on which investment principal can be eroded due to changes in redemption amounts. Care is required when investing in such instruments.
When you purchase non-listed Japanese fixed income securities (Japanese government bonds, Japanese municipal bonds, Japanese government guaranteed bonds, Japanese corporate bonds) from CS as a seller, you will be requested to pay the purchase price only.
XX5686EU.doc