abbreviations - jqa · environmental protection co., ltd. the boilers will be supplied by wuxi...
TRANSCRIPT

PROJECT DESIGN DOCUMENT FORM (CDM PDD) - Version 03 CDM – Executive Board page 1
CLEAN DEVELOPMENT MECHANISM PROJECT DESIGN DOCUMENT FORM (CDM-PDD)
Version 03 - in effect as of: 28 July 2006
CONTENTS A. General description of project activity B. Application of a baseline and monitoring methodology C. Duration of the project activity / crediting period D. Environmental impacts E. Stakeholders’ comments
Annexes Annex 1: Contact information on participants in the project activity Annex 2: Information regarding public funding Annex 3: Baseline information
Annex 4: Monitoring plan

PROJECT DESIGN DOCUMENT FORM (CDM PDD) - Version 03 CDM – Executive Board page 2 SECTION A. General description of project activity A.1 Title of the project activity:
Controlled combustion of municipal solid waste (MSW) and energy generation in Linyi City, Shandong, China (the Project activity or the Project) (Version 3.0, 27/05/2008) A.2. Description of the project activity:
The Project activity involves the controlled combustion of municipal solid waste (MSW) to generate electricity and heat in Linyi City, Shandong Province, China. Linyi City disposes of its MSW at the Linyi Landfill Site, a managed anaerobic solid waste disposal site. Under the Project activity, Linyi National Environmental New Energy Co., Ltd., installed two waste-combustion fluidized-bed boilers with rated steam capacities of 75t/hour, and each able to deal with 400t/day of MSW. The MSW combusted in the Project would have been disposed of at the Linyi Landfill Site for MSW Sanitation Treatment, which was built in 1999, and is capable of dealing with 900 tons/day of MSW over its projected 22-year lifespan. The Linyi Landfill Site does not currently have a gas capture system installed, as it is not required by the Chinese regulatory authorities.1 Furthermore, disposing of all MSW at landfill is acceptable according to the waste disposal guidelines.
The waste will be co-combusted with coal in order to ensure complete firing of the waste in two
circularized fluidized bed boilers that were constructed under the project activity. Steam produced by the boilers feeds into a 25MW steam turbine-generator and steam containing excess thermal energy will be exported via a pipeline to customers in a nearby wood-processing industrial park. The electricity produced by the Project activity will displace electricity generated by power plants connected to the regional North China Grid. The nearby industrial park currently meets its thermal energy needs through on-site coal-fired boilers, and would continue to do so in the absence of a supply of thermal energy from the Project activity.
When fully operational, the Project is expected to generate a total of 168,300MWh/yr of
electricity and to be providing customers at the industrial park with 912,000GJ/year of energy. Parasitic use of electricity is expected to be approximately 22%, therefore, the total electricity exported to the North China Power Grid is estimated as 131,274MWh/yr. The Project activity will be brought up to full operational capacity in a number of stages as time is required to complete testing and bring equipment fully online. The first year sees only one boiler in operation, with the second boiler coming online from the second year. Furthermore, for the export of thermal energy the Project proponent will have to develop the necessary infrastructure and is expecting to have to overcome technical difficulties; therefore, the implementation of this part of the Project has been planned in four stages: 0% of full capacity (i.e. 0% of 912,000GJ) in the first year, 33% in the second year, 66% in the third year and 100% from the fourth year onwards.
The project achieves GHG emission reductions by avoiding CH4 emissions that would have
occurred as a result of landfilling of the MSW. It also leads to emission reductions through the
1 Landfill Technology Codes for MSW, enforced on January 15, 1999, Chinese regulation reference no. CJJ17-88
PROJECT DESIGN DOCUMENT FORM (CDM PDD) - Version 03 CDM – Executive Board page 3 displacement of grid electricity and of thermal energy currently produced by coal-fired boilers at a nearby industrial park.
Total emission reductions over the 7-year crediting period are expected to be in the region of 466,893 tCO2e. The project contributes to sustainable development in the local area in a number of ways: Avoided MSW dumping: In the absence of the Project activity the MSW would be landfilled and left to decay in anaerobic conditions, resulting in the release of methane, a potent GHG, and putrid odours. Job creation: This project creates a significant number of jobs for local people for the construction, operation and maintenance stages. These staff will receive comprehensive training as necessary in the technology to be used by the Project activity. Renewable energy production, reducing consumption of fossil fuels: The Project will lead to lower emissions of SOx and NOx as the activity reduces the use of fossil fuels used in electricity generation. This also contributes to national goals of greater energy security as it reduces the country’s need to rely on imports of fossil fuels.
A.3. Project participants:
Name of Party involved(*) ((host) indicates a host
Party)
Private and/ or Public entity(ies) Project participants(*)
(as applicable)
Kindly indicate if the Party involved wishes to be
considered a project participant(Yes/ No)
China (host) Linyi National Environmental New Energy Co., Ltd(**)
No
Portugal LUSO Carbon Fund No (*) In accordance with the CDM modalities and procedures, at the time of making the PDD public at the stage of validation, a Party involved may or may not have provided its approval. At the time of requesting registration, the approval by the Party(ies) involved is required. (**) A private entity 60% owned by China National Environmental Protection Corporation, and 40% owned by Eden Investment Co., Ltd. (Hong Kong). The CDM aspects of the Project will be managed by staff at CECIC Blue-Sky Investment Consulting & Manage ment Co., Ltd, a subsidiary of China National Environmental Protection Corporation. A.4. Technical description of the project activity: A.4.1. Location of the project activity: A.4.1.1. Host Party(ies):
China A.4.1.2. Region/State/Province etc.: Shandong Province A.4.1.3. City/Town/Community etc:

PROJECT DESIGN DOCUMENT FORM (CDM PDD) - Version 03 CDM – Executive Board page 4 Hengyuan, Linyi City A.4.1.4. Detail of physical location, including information allowing the unique identification of this project activity (maximum one page): Linyi City, situated in the southeast of Shandong Province in P.R. China, covering an area of 409km2, and with a population of 10 million, is the largest administrative division in the province. The Project activity is located in the northwest of Linyi City. The co-ordinates of the site are: 118º13`46˝E, and 35º06`37˝N. To the east of the Project site is the Jinghu highway, to the south is the Jucai road, and to the west is an industrial park.
Figure 1. Location of site of Project activity
Linyi in Shandong Province, China Map of China
Project site Project site

PROJECT DESIGN DOCUMENT FORM (CDM PDD) - Version 03 CDM – Executive Board page 5 A.4.2. Category(ies) of project activity:
The Project comes under the following category: Sectoral Scope 1: Energy industry Sectoral Scope 13: Waste handling and disposal
A.4.3. Technology to be employed by the project activity: The Project will employ two waste-combustion fluid-bed boilers with rated steam capacities of
75t/hour, and each able to deal with 400t/day of MSW. The steam produced by the boilers will feed into a 25MW steam turbine-generator co-designed by the Chinese Academy of Science and Zhonglian Environmental Protection Co., Ltd. The boilers will be supplied by Wuxi Huaguang Boiler Plant, a boiler supplier with some of the most advanced domestically produced technology. Turbine (1 set) Data Item Value Model C25-4.9/0.98 Rated steam pressure inflow 4.9 (4.60~5.10) MPa(a)Rated power 25 MW Maximum power 30 MW Rated steam extraction pressure 0.98 MPa(a)/300ºC Steam extraction pressure (scope) 0.785~1.275 MPa(a) Rated steam extraction volume 70 t/h Maximum steam extraction volume 130 t/h Steam flow pressure in rated operating mode 4.194 KPa(a) Steam consumption in rated operating mode (guarantee value) 6.17 kg/kw.h Heat consumption in rated operating mode (guarantee value) 8949 kJ/kw.h Steam flow pressure in condensing operating mode 4.194~4.334 KPa(a) Steam consumption in condensing operating mode (guarantee value) 4.113 kg/kw.h Heat consumption in condensing operating mode (guarantee value) 11165 kJ/kw.h Temperature of fed-in water 153ºC Rated rotation speed 3000 r/min Generator (1 set)Data Item Value Model QFW-30-2 Rated voltage 10.5KV Rated flow 2062A Rated power 30MW Power factor 0.8 Rated rotation speed 3000r/min Frequency 50Hz States 3 Efficiency 97.4%

PROJECT DESIGN DOCUMENT FORM (CDM PDD) - Version 03 CDM – Executive Board page 6 Maximum working pressure 0.196 MPa Temperature of fed-in water ≤ 33ºC Temperature of air used for cooling ≤ 40ºC Noise (1 meter from the equipment) ≤ 90dB(A)
CFB boilers (2 sets)
Data Item Value Model UG-75/5.29-MT MSW disposal capacity 400t/d Maximum capacity 500t/d Rated steam capacity 75t/h Flue gas temperature 150ºC Rated steam temperature 485ºC Efficiency 81% Rated steam pressure 5.29MPa Combustion mode CFB Temperature of fed-in water 150ºC Height of operation layer 7m Coal 0~10mm Load range 50~110% Temperature of air used for cooling 30ºC Boiler installation Semi-outdoor
Pollution control equipment and measures, flue gas filtration and other waste disposal MSW will be mixed with coal in a 4:1 ratio by weight. The boilers are designed to allow
combustion at 860ºC, which will improve the efficiency of MSW combustion, destroy organic pollutants, and limit the production of toxic substances such as dioxins.
The flue gas of this system contains SO2 and HCl, therefore, an MHGT gas-filtering system will be installed to remove more than 90% of the SO2, more than 95% of the HCl, and more than 99% of the particulate matter, thereby meeting the Chinese MSW Combustion Pollution Control Code. In addition to this, activated carbon will be used to extract dioxins and heavy metals, and bag filters will be used to remove particulate matter.
Sewage and residue will be treated in order to bring it to within national standards before release into the municipal sewage system.
Leachate from the MSW waiting to be incinerated will be collected and added to the boilers by means of sewage pumps. The energy required to power the pumps will be included in the energy balance of the plant.
An automatic control system (DCS), comprising of a control system, operation system, engineering system, communication network, remote I/O, and spot meters, will be installed to monitor particulate matter, SO2, HCl, NOx, O2, CO, and CO2 emissions in the flue gas in order to ensure they meet national standards.
The National Emissions Index limits are shown in the following table:

PROJECT DESIGN DOCUMENT FORM (CDM PDD) - Version 03 CDM – Executive Board page 7
Pollutant Emission intensity (mg/m3, unless otherwise stated) Predicted emission
value National limit
SO2 160 260 HCl 30 75 Flue gas particulate matter 40 80 Dioxin 0.1ng/m3 1ng/m3 (TEQ)
A.4.4 Estimated amount of emission reductions over the chosen crediting period:
Years Annual estimation of emission reductionsin tonnes CO2e
Year 1 (2009) (-14,937) 0* Year 2 (2010) (30,347) 15,411* Year 3 ( 2011) 76,289 Year 4 ( 2012) 83,693 Year 5 ( 2013) 90,685 Year 6 ( 2014) 97,289 Year 7 ( 2015) 103,526
Total estimated reductions (tonnes CO2) 466,893 Total number of crediting years 7
Annual average over the crediting period of estimated reductions (tonnes of CO2e) 66,699
* The Project emissions are negative in the first year; therefore, the amount is deducted from the emission reductions achieved in the second year. NB: The earliest the Project is expected to gain registration is in December 2008, therefore, for simplicity’s sake the CERs estimations begin from the beginning of 2009.. A.4.5. Public funding of the project activity:
The financial plans for the Project activity do not involve any public funding from Annex 1
countries.

PROJECT DESIGN DOCUMENT FORM (CDM PDD) - Version 03 CDM – Executive Board page 8 SECTION B. Application of a baseline and monitoring methodology B.1. Title and reference of the approved baseline and monitoring methodology applied to the project activity:
This section was prepared using AM0025 version 10, “Avoided emissions from organic waste
through alternative waste treatment processes”; and referring to the Tool to calculate the emission factor of an electricity system (Version 1); the Tool for the demonstration and assessment of additionality (Version 4); and the Tool to determine methane emissions avoided from dumping waste at a solid waste disposal site (Version 2). B.2 Justification of the choice of the methodology and why it is applicable to the project activity:
AM0025 is applicable to projects which involve the combustion of fresh waste which would
otherwise be landfilled, to generate electricity and heat. Specific details as to how the Project meets the applicability of AM0025 are given below:
• The project activity involves one of the following waste treatment options for the fresh waste
that in a given year would have otherwise been disposed of in a landfill: a) a composting process in aerobic conditions; b) gasification to produce syngas and its use; c) anaerobic digestion with biogas collection and flaring and/or its use; d) mechanical/thermal treatment process to produce refuse-derived fuel /stabilized biomass and its use; e) incineration of fresh waste for energy generation, electricity and/or heat. The thermal energy generated is either consumed on-site and/or exported to a nearby facility. Electricity generated is either consumed on-site , exported to the grid or exported to a nearby facility. The incinerator is rotating fluidized bed or hearth or grate type;
Fresh waste will be incinerated in a circulating fluidized bed-type incinerator to produce thermal and electrical energy. The thermal energy will be exported to a nearby industrial park, and the electrical energy remaining after meeting the plants own needs will be exported to the grid. In the absence of the Project activity, the waste would be delivered to a landfill and allowed to decompose under anaerobic conditions.
• In the case of incineration of the waste, the waste should not be stored longer than 10 days. The
waste should not be stored in conditions that would lead to anaerobic decomposition and, hence, generation of CH4.
The waste will be stockpiled before combustion for no longer than 10 days. The capacity of
the holding facility for the waste is 5000 tonnes; less than 10 days’ worth of MSW for the 800 tonnes/day plant. Therefore, MSW will not be held for a long enough period for anaerobic breakdown to occur to a significant degree. During the first year, when the plant will only be combusting 400 tonnes per day of MSW, the amount of waste delivered to the plant, and

PROJECT DESIGN DOCUMENT FORM (CDM PDD) - Version 03 CDM – Executive Board page 9
therefore held in the holding facility, will be reduced to meet the requirements of this applicability condition.
• The proportions and characteristics of different types of organic waste processed in the project
activity can be determined, in order to apply a multiphase landfill gas generation model to estimate the quantity of landfill gas that would have been generated in the absence of the project activity.
Detailed information on the proportions and characteristics of the MSW is included in this
CDM PDD. The information was gathered through actual sampling and analysis over the period 2003-2005 of waste from the same sources as are to supply the Project activity. • The project activity may include electricity generation and/or thermal energy generation from
the biogas, syngas captured, RDF processed or fresh waste, respectively, from the anaerobic digester, the gasifier, RDF combustor and fresh waste combustor. The electricity can be exported to the grid and/or used internally at the project site.
The Project activity involves the generation of electricity and thermal energy using fresh waste
combustors (special purpose boilers). The combustors will consume waste in the form of MSW. The electricity produced will be used to supply the site and the remainder will be exported to the local grid. Excess thermal energy will be exported to factories at a nearby industrial park. • The residual waste from the incinerator does not contain more than 1% residual carbon.
According to the feasibility study, the residual waste from the incinerator will contain less
than 1% residual carbon.
• The compliance rate of the environmental regulations during (part of) the crediting period is below 50%; if monitored compliance with the MSW rules exceeds 50%, the project activity shall receive no further credit, since the assumption that the policy is not enforced is no longer tenable.
There are currently no regulations requiring that MSW be disposed of by any of methods a) to
e) above. The situation will be monitored every year to ensure compliance. The Project activity involves the incineration of municipal solid waste originally intended for
landfill. By diverting the MSW from disposal at a landfill, the methane emissions that would have been caused by the anaerobic breakdown of the MSW in the landfill will be avoided. Furthermore, combusting the waste to produce electricity to meet the needs of the site and for export to the local grid, and the sale of thermal energy to a nearby industrial site to replace thermal energy previously supplied by coal boilers, will replace energy production by more fossil fuel-intensive methods, leading to additional emission reductions. The above factors are all in accordance with the requirements of the methodology, and this PDD calculates carbon emission reductions accordingly. B.3. Description of the sources and gases included in the project boundary
The spatial extent of the Project boundary is shown in the figure below, and includes: the site of
the Project activity where the waste is to be treated, including the facilities for processing the waste, on-site electricity generation and consumption, onsite fuel use, thermal energy generation and the wastewater

PROJECT DESIGN DOCUMENT FORM (CDM PDD) - Version 03 CDM – Executive Board page 10 treatment facility; the Linyi Landfill Site; the boilers at the nearby industrial park that supply the thermal energy that is to be displaced in the Project activity; and the electricity generation plants connected to the North China Grid.
MSW Production
Collection and transportation
Figure 2: Project boundary
Emission sources and gases included in or excluded from the Project boundary are listed in the following table:
Emissions sources included in or excluded from the Project boundary
Source Gas Included? Justification / Explanation CO2 Included Electricity is provided to the site mainly by
coal-fired power stations on the North China Grid. The Project activity will generate enough electricity to export to the grid.
CH4 Excluded Excluded for simplification. This is conservative.
Emissions from electricity consumption
N2O Excluded Excluded for simplification. This is conservative.
Bas
elin
e
Emissions from
CO2 Excluded CO2 emissions from the decomposition of organic waste are not counted.
Storage
Boiler
Incinerator
Residual waste
Generator
Stack gas emissions
North China Grid (Electricity)
Raw material for cement
Coal
Landfill Industrial park (Thermal energy)
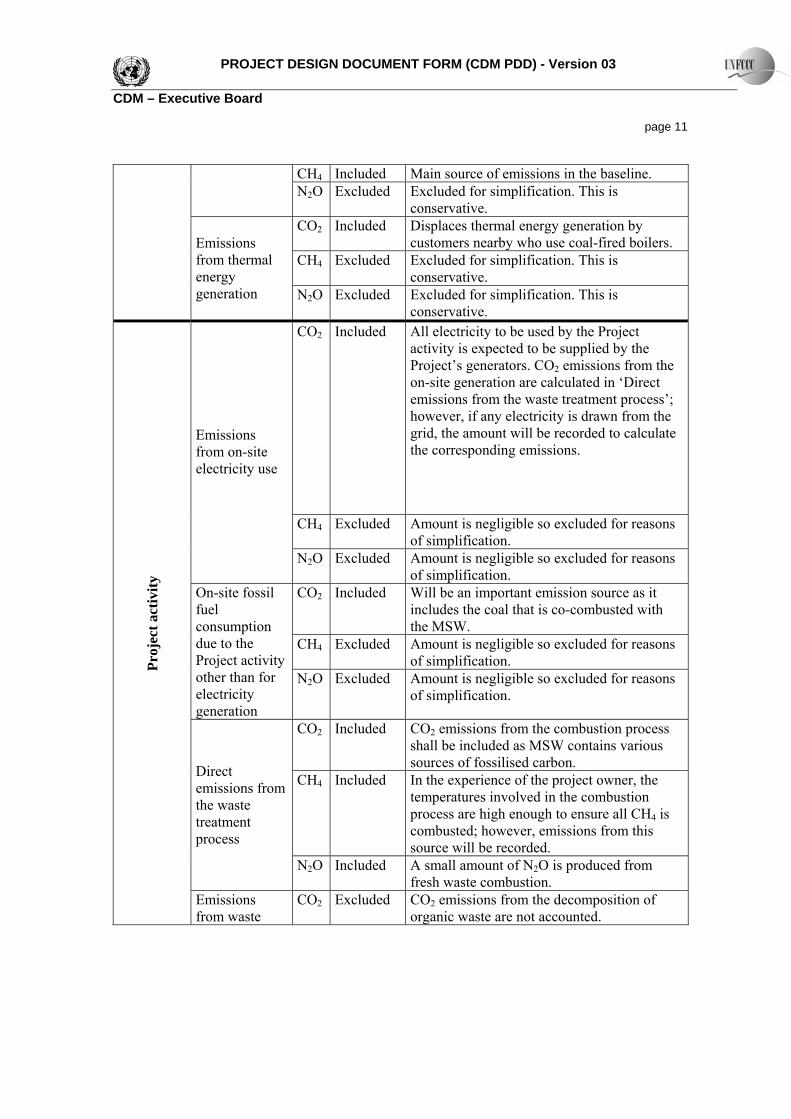
PROJECT DESIGN DOCUMENT FORM (CDM PDD) - Version 03 CDM – Executive Board page 11
CH4 Included Main source of emissions in the baseline. N2O Excluded Excluded for simplification. This is
conservative. CO2 Included Displaces thermal energy generation by
customers nearby who use coal-fired boilers. CH4 Excluded Excluded for simplification. This is
conservative.
Emissions from thermal energy generation N2O Excluded Excluded for simplification. This is
conservative. CO2 Included All electricity to be used by the Project
activity is expected to be supplied by the Project’s generators. CO2 emissions from the on-site generation are calculated in ‘Direct emissions from the waste treatment process’; however, if any electricity is drawn from the grid, the amount will be recorded to calculate the corresponding emissions.
CH4 Excluded Amount is negligible so excluded for reasons of simplification.
Emissions from on-site electricity use
N2O Excluded Amount is negligible so excluded for reasons of simplification.
CO2 Included Will be an important emission source as it includes the coal that is co-combusted with the MSW.
CH4 Excluded Amount is negligible so excluded for reasons of simplification.
On-site fossil fuel consumption due to the Project activity other than for electricity generation
N2O Excluded Amount is negligible so excluded for reasons of simplification.
CO2 Included CO2 emissions from the combustion process shall be included as MSW contains various sources of fossilised carbon.
CH4 Included In the experience of the project owner, the temperatures involved in the combustion process are high enough to ensure all CH4 is combusted; however, emissions from this source will be recorded.
Direct emissions from the waste treatment process
N2O Included A small amount of N2O is produced from fresh waste combustion.
Proj
ect a
ctiv
ity
Emissions from waste
CO2 Excluded CO2 emissions from the decomposition of organic waste are not accounted.

PROJECT DESIGN DOCUMENT FORM (CDM PDD) - Version 03 CDM – Executive Board page 12
CH4 Included The wastewater treatment should not result in CH4 emissions, such as in anaerobic treatment; otherwise accounting for these emissions should be done.
water treatment
N2O Excluded Excluded for simplification. This emission source is assumed to be very small.
B.4. Description of how the baseline scenario is identified and description of the identified baseline scenario:
The selection of the most plausible baseline scenario is performed as directed in the methodology. Step 1: Identification of alternative scenarios. The following credible alternatives are analyzed:
For MSW management, the alternatives considered are as follows:
M1 The project activity (i.e. incineration of waste) not implemented as a CDM project. M2 Disposal of the waste at a landfill where landfill gas captured is flared M3 Disposal of the waste on a landfill without the capture of landfill gas. For electricity generation, the alternatives considered are as follows: P1 Power generated from by-product of one of the options of waste treatment as listed in M1 above, not undertaken as a CDM project activity. P2 Construction of a new on-site or off-site fossil fuel fired cogeneration plant. P3 Construction of a new on-site or off-site renewable based captive power plant. P4 Construction of a new on-site or off-site fossil fuel fired captive power plant. P5 Construction of a new on-site or off-site renewable based captive power plant. P6 Existing and/or new grid-connected power plants. For heat generation, the alternatives considered are as follows: H1 Heat generated from by-product of one of the options of waste treatment as listed in M1 above, not undertaken as a CDM project activity. H2 Existing or Construction of a new on-site or off-site fossil fuel fired cogeneration plant. H3 Existing or Construction of a new on-site or off-site renewable based cogeneration plant. H4 Existing or new construction of on-site or off-site fossil fuel fired boilers. H5 Existing or new construction of on-site or off-site renewable energy based boilers. H6 Any other source such as district heat. H7 Other heat generation technologies. Step 2: Identify the fuel for the baseline choice of energy source taking into account the national and sectoral policies as applicable.
As described in further detail in section B.5 below, M1 is not a realistic scenario because an incineration plant would not be a viable option for a company in the region. The revenue available for the

PROJECT DESIGN DOCUMENT FORM (CDM PDD) - Version 03 CDM – Executive Board page 13 disposal of the waste is relatively low when compared to the high initial capital costs required for such a project, meaning that such a project would have difficulty completing financial closure without significant public assistance. The fact that only around 3.72% of waste in China is disposed of by incineration2 clearly supports this view.
In the case of M2, there is no alternative landfill in the region with methane capture and
destruction facilities and the capacity to handle the extra waste. Given the costs associated with the installation and operation of landfill gas capture facilities, and the absence of regulations requiring them, installation is not likely. In the absence of CDM-revenue or some other subsidy program to provide an incentive, the waste would have been disposed of at the Linyi Landfill Site and the capture and destruction of landfill gas would not occur. Therefore, the most likely scenario for the waste is M3: the continued disposal of MSW at Linyi Landfill Site for MSW Sanitation Treatment.
In the case of P1, according to a review of waste-handling practice in China performed by
Shanghai JEC Environmental Consultant Co., Ltd., at the end of 2003 there were 457 landfills serving the 660 major Chinese cities included in the review3. Apart from simple safety control systems to prevent explosions, the overwhelming majority vent LFG directly into the atmosphere. The few that do utilize the LFG are all demonstration projects or receive additional funding from development organisations4.
P2 would not be feasible as the construction and operation of a fossil fuel fired power plant below
135 MW in capacity is not permitted under current Chinese regulations. There is no alternative cogeneration plant in the area.
P3 would not be feasible because of the high investment costs and the relative lack of a suitable
renewable energy source in the area. P4 and P5 do not apply to this project as the MSW incineration plant is seeking to generate
electricity primarily for sale to the local grid, rather than to meet existing energy requirements. In the absence of the project activity; therefore, P6 is the most likely scenario for the supply of electricity to the North China Power Grid: existing and new grid-connected power plants would supply electricity.
In the case of H1, financial closure would be difficult because the gas produced would need to be
transported over 20km (to the region of the proposed incinerator) in order to reach industrial operations of a big enough scale to meet the supply. This would require a prohibitively large initial investment in pipelines and the installation of boilers able to burn the gas, as well as increased operation and maintenance costs. The returns of such projects are not high enough to justify large-scale implementation on income from energy alone. Furthermore, financial closure would only be possible under exceptional circumstances.
3
2 The current situation of solid waste management in China, Qifei Huang et al., Journal of Material Cycles and Waste Management (2006)
http://www.shjec.cn/new/article.asp?articleid=17#top 4 Environmental and Health Challenges of Municipal Solid Waste in China, SL Jones, China Environment Forum (2007) http://www.wilsoncenter.org/INDEX.CFM?TOPIC_ID=1421&FUSEACTION=TOPICS.ITEM&NEWS_ID=218565

PROJECT DESIGN DOCUMENT FORM (CDM PDD) - Version 03 CDM – Executive Board page 14
H2 and H3 would not be possible as the thermal energy requirements of the companies to be supplied under the project activity are currently met by existing coal-fired boilers. Investment in a cogeneration or thermal energy plant by the companies would not be feasible given that they have existing boiler equipment and the high investment costs and risks of a new purpose-built facility.
In the case of H4, as in the case of H2 and H3 above, the companies to be supplied by the project
activity already have fossil fuel fired boilers installed, therefore, the continued use of these boilers is the most likely scenario in the absence of the project activity given there are no regulations prohibiting their use.
In the case of H5, there is no local supply of a renewable energy resource that could be used in
place of the anthracite without incurring prohibitive costs or supply risks, furthermore, the investment required to adapt the existing boilers to use a renewable resource would not be economical without an additional income stream such as that obtained through CDM.
In the case of H6 and H7, no other alternative thermal energy source is available, and alternative
heat generation technologies such as heat pumps or solar energy would either not be economical to install given that boilers are already in place, or they would not supply sufficient heat to meet requirements.
Therefore, the most realistic and credible baseline scenario is H4, “disposal of waste at a landfill
without the capture of landfill gas”. As described above, the Project activity requires supplementary income from the CDM in order
to be implemented. The Project participant proceeded with the implementation of this Project with the expectation that it would be registered as a CDM project activity and issued with CERs in the future. In the absence of the Project activity, the most likely scenario is, as described above, as follows: • M3 Disposal of the waste on a landfill without the capture of landfill gas. • P6 Existing and/or new grid-connected power plants. • H4 Existing or new construction of on-site or off-site fossil fuel fired boilers.
The Project therefore corresponds to Scenario 1 in the methodology. Step 3 and Step 4 of the methodology are described in section B.5. below
B.5. Description of how the anthropogenic emissions of GHG by sources are reduced below those that would have occurred in the absence of the registered CDM project activity (assessment and demonstration of additionality):
Additionality is assessed and demonstrated using the latest version of the Tool for the demonstration and assessment of additionality (Version 4).
The feasibility study was completed in 2002, and clearly referred to the advice from the Chinese
government regarding the contribution that the CDM could make to various comprehensive resource-utilization projects, such as MSW combustion for heat and power generation. Between the completion of the feasibility study and the initiation of construction, the Project costs significantly increased, consequently, CDM revenue progressively became a more significant source of income for the Project. Permission to begin construction of the plant was received on the 19th of October 2006. A formal agreement was signed between the CDM consultant and the Project developer on the 12th of October 2006 and this was instrumental in obtaining permission to initiate construction.
PROJECT DESIGN DOCUMENT FORM (CDM PDD) - Version 03 CDM – Executive Board page 15
Prohibitive barriers that the Project activity faces are clearly identified using the Tool for the
demonstration and assessment of additionality. The following steps from the additionality tool are completed below: STEP 1 – Identification of alternatives to the project activity consistent with current laws and regulations STEP 2 – Investment analysis STEP 4 – Common practice analysis Step 1 - Identification of alternatives to the project activity consistent with current laws and regulations. Sub-step 1a. Define alternatives to the project activity
As described above, the Project developer had the following alternatives to the Project activity: • The proposed project activity not undertaken as a CDM project • Continuation of current practice (no project activity or other alternative undertaken) Sub-step 1b. Enforcement of applicable laws and regulations
All scenarios are in compliance with applicable laws and regulations5. Step 2 - Investment Analysis
Sub-step 2a. Determine appropriate analysis method
In order to determine whether the proposed Project is financially attractive without revenue from the sale of CERs, Option III – “Apply benchmark analysis”, is completed below. As suggested in the Tool for the demonstration and assessment of additionality, Project IRR will be used in the investment analysis.
Sub-step 2b. – Option III. Apply benchmark analysis
Project IRR is deemed the most suitable financial indicator for the Project and, in line with the guidance in this sub-step in the additionality tool, is compared to a national benchmark for energy generation (electricity and thermal) projects of 8% (after tax).6
Sub-step 2c – Calculation and comparison of financial indicators
Due to high initial costs associated with the planning, engineering, and construction of the Project,
it does not represent an attractive investment opportunity in the absence of additional revenue from the sale of CERs. As can be seen from the financial data displayed below, the Project IRR is not high enough to justify investment, considering the risks involved. With the CER revenue incorporated into the IRR 5 (as footnote 3 above) Landfill Technology Codes for MSW, enforced on January 15, 1999, Chinese regulation reference no. CJJ17-88 6 Methodology and Parameter of Economic Evaluation of Construction Projects, 2006, third edition, edited by NDRC and the Ministry of Construction. Published by China Planning Publish Co., Ltd.

PROJECT DESIGN DOCUMENT FORM (CDM PDD) - Version 03 CDM – Executive Board page 16 calculation, the additional, relatively reliable revenue stream provides enough of an incentive for the Project developer to proceed.
Item Assumptions/Sources Value Financial Details Costs
Initial capital cost Supplied by Project developer based on quotes and current prices (equipment and plant cost 146,120,000 Yuan)
278 million Yuan
Fuel cost/year (coal) Based on the cost estimated in the feasibility study: 480 Yuan/tonne
25.3 million Yuan/year
O&M cost/yr Estimated as 3% of the cost of the initial capital cost (278,000,000 Yuan)
8.3 million Yuan/yr
Revenues Electricity tariff Average local price (including VAT
of 17%) 0.36 Yuan/kWh
Electricity sales Assuming the generator is in operation 330 days in a year, a load factor of 85%, and that 22% of the electricity is used on-site (131,274 MWh/year)
47.3 million Yuan/year
Thermal energy tariff Average local price (including VAT of 13%)
19 Yuan/GJ
Thermal energy sales (year 2) Assuming capacity factor of 912,000 GJ/y, and 33% exported in year 2. .
5.7 million Yuan/year
Thermal energy sales (year 3) Assuming capacity factor of 912,000 GJ/y, and 66% exported in year 3. .
11.4 million Yuan/year
Thermal energy sales (year 4 onwards)
Assuming capacity factor of 912,000 GJ/y, and 100% exported from year 4.
17.3 million Yuan/year
Other income Waste disposal fee MSW disposal fee (at 30 Yuan/ton),
for 264,000 t/yr 7.9 million Yuan/year
Raw material sales (ash sold to cement plants)
Supplied by Project developer based on current price agreements
400,000 Yuan/year
Income tax 25% Project life Minimum projected life 22 years Project IRR for operations 5.25%
Project IRR including CER revenue (assuming 8EUR/CER) 10.72%
The Project’s IRR is estimated to be 5.25%, which is much lower than the Project’s benchmark of 8% (after tax). The low IRR, compared to the hurdle rate, indicates that the Project is not financially attractive without an additional revenue stream, such as that obtained through the CDM. In the absence of CDM-derived revenue, the relatively low return does not justify the risks associated with implementing this new waste-incineration power project.

PROJECT DESIGN DOCUMENT FORM (CDM PDD) - Version 03 CDM – Executive Board page 17
Sub-step 2d –Sensitivity Analysis
The following sensitivity analysis is performed to confirm the conclusion regarding the financial attractiveness of the Project is robust: 1) The average tariff for electricity 2) The average tariff for thermal energy 3) The costs for equipment and plant 4) Fuel costs 5) O&M costs The following table and diagram give the results of the sensitivity analysis for each scenario Summary of SA
Changes -10% -5% 0 +5 +10%
Electricity tariffs 3.30% 4.30% 5.25% 6.16% 7.04% Thermal energy tarrifs 4.60% 4.93% 5.25% 5.57% 5.88% Equipment and plant costs 6.40% 5.81% 5.25% 4.74% 4.26% Fuel costs 6.42% 5.85% 5.25% 4.64% 4.01% O&M costs 5.66% 5.46% 5.25% 5.05% 4.84%
Sensitivity Analysis
0.00%
1.00%
2.00%
3.00%
4.00%
5.00%
6.00%
7.00%
8.00%
-10% -5% 0 +5 +10%
Change in parameter
IRR
Electricity tariffs
Thermal energy tarrifs
Equipment and plant costs
Fuel costs
O&M costs
The Project IRR did not surpass the benchmark even after applying the different favourable conditions to the financial analysis. The sensitivity analysis confirms the fact that the Project is unlikely to be financially attractive and successful implementation is dependent upon CDM assistance.

PROJECT DESIGN DOCUMENT FORM (CDM PDD) - Version 03 CDM – Executive Board page 18 STEP 4 – Common Practice Analysis
Sub-step 4a – Analyse other activities similar to the proposed project activity
Projects in which fresh waste is combusted to produce energy are still very rare in China. In fact,
waste incineration (most of which does not involve energy generation projects) accounts for less than 3.72% of all MSW disposal. Within Shandong Province the following MSW combustion power plants are in operation, or are under construction:
No. Name of Project
Waste handling capacity
Run-time Technology/remarks
1 Heze7 2 × 200 t/d 2001.4In operation.
MSW incineration technology with fluidized bed for power generation, by Zhejiang University
2 Zaozhuang7 1 × 150 t/d 2003.6 In operation.
MSW incineration technology with fluidized bed for power generation, by Zhejiang University
3 Jinan8 Expected to be 1000 t/d 2004 Experiencing operation problems.
4 Zibo9 Expected to be 1000 t/d at full operation 2007.8 Currently testing operation.
The ratio of waste to coal is 4:1
5 Taian10 Expected to be 800 t/d N/A Under construction 6 Weifang11 Expected to be 600 t/d N/A Ready to build
Sub-step 4b –Discuss any similar options that are occurring
The plant in Jinan City opened in 2004, and has been experiencing problems with the combustion
of MSW, preventing it from generating a supply of steam that can drive the steam turbine. The plant is still performing test procedures.
The Zaozhuang project involved the conversion of a coal-fired boiler into a waste boiler; however,
because of the low NCV of the waste, for each tonne of MSW, approximately one tonne of quality coal needs to be co-fired.
The Heze waste combustion power plant is the first waste combustion power plant to be built in
Shandong exclusively using domestic technology and equipment. It is also the only purpose-built waste
7 http://www.zjbestee.com/pages/msw.asp
8 http://www.eedu.org.cn/news/etech/home/200605/7935.html9 http://www.china5e.com/www/dev/newsinfo/newsview/viewnews-200708100099.html10 http://www.projectbidding.cn/gcxx/show_gcxx.jsp?leixing=gcdt&id=6248811 http://www.wfmarine.gov.cn/zhongwen/bhzs/ye.asp?newsid=288
PROJECT DESIGN DOCUMENT FORM (CDM PDD) - Version 03 CDM – Executive Board page 19 combustion power plant in operation in Shandong now; however, its total loss to the end of year 2004 was 12.5 million Yuan, and for the first half of 2005, the loss was 3.16 million Yuan.
There are two main reasons as to why the above projects did not apply for the CDM: 1) Existing methodologies were not suitable for some projects; 2) Raw material issues: e.g. the coal consumption in the Zaozhuang project is too high.
Nationally, very few similar activities are being carried out by enterprises in China at present.
Private project developers are reluctant to invest in this technology because in their view the high risks do not justify the low returns.
Despite the financial and technological difficulties faced by the Project, the Project developer for
the Linyi MSW cogeneration plant, with CDM in its plans, decided to proceed with implementation. Given the above-mentioned prevalent practices for MSW treatment in China, and the barriers the project faces, it is clear that the Project fulfils the requirements of additionality.

PROJECT DESIGN DOCUMENT FORM (CDM PDD) - Version 03 CDM – Executive Board page 20
B.6. Emission reductions: B.6.1. Explanation of methodological choices:
Project emissions As per the guidelines in AM0025 (Version 10), project emissions are calculated as follows: PEy = PEelec,y + PEfuel,on-site,y + PEi,y + PEw,y where: PEy Project emissions during the year y (tCO2e) PEelec,y Emissions from electricity consumption on-site due to the project activity in year y
(tCO2e) PEfuel,on-site,y Emissions from fossil fuel consumption on-site due to the project activity in year y
(tCO2e) PEi,y Emissions from waste incineration in year y (tCO2e) PEw,y Emissions from waste water treatment in year y (tCO2e)
There are no emissions from a composting process, an anaerobic digestion process, a gasification process or combustion of RDF/stabilized biomass since the Project activity only involves the incineration of waste.
Emissions from electricity use (PEelec,y) In the event that the Project activity involves electricity consumption, CO2 emissions are calculated as follows: PEelec,y = EGPJ,FF,y * CEFelec where: EGPJ,FF,y Amount of electricity generated in an on-site fossil fuel power plant or consumed from
the grid as a result of the Project activity, measured using an electricity meter (MWh) CEFelec Carbon emission factor for electricity generation in the Project activity (tCO2/MWh)
The electricity consumed at the Project site will be generated by the Project activity. The Project emissions related to the auxiliary fossil fuels used to increase the temperature of the incinerator and fossil-based waste are, respectively, calculated in under, “Emissions from fuel use on-site”, and, “Emissions from fossil-based waste”, below. In the event that electricity is imported from the grid, the emission factor will be calculated according to the Tool to calculate the emission factor for an electricity system.
Emissions from fuel use on-site (PEfuel,on-site,y)

PROJECT DESIGN DOCUMENT FORM (CDM PDD) - Version 03 CDM – Executive Board page 21 Emissions from on-site fuel consumption (other than electricity generation, e.g., vehicles used on-site, auxiliary fossil fuels added to the incinerator to increase the temperature of the incinerator, etc) are calculated as follows: PEfuel, on-site,y = Fcons,y * NCV * EFfuel fuel where: PEfuel, on-site,y CO emissions due to on-site fuel combustion in year y (tCO ) 2 2Fcons,y fuel consumption on site in year y (kg)
net caloric value of the fuel (MJ/kg) NCVfuel CO emissions factor of the fuel (tCO /MJ) EFfuel 2 2
Local values are preferred as defaults for net calorific values and CO2 emission factors. If local values are not available, IPCC default values may be used.
Emissions from waste incineration (PEi,y) Emissions from waste incineration are calculated as follows: PEi,y = PEi,f,y + PEi,s,y where: PEi,f,y fossil-based waste CO emissions from waste incineration in year y (tCO e) 2 2PEi,s,y N O and CH emissions from the final stacks from waste incineration in year y (tCO e) 2 4 2 Emissions from fossil-based waste (PEi,f,y) The CO2 emissions are calculated based on the monitored amount of fossil-based waste fed into the waste incineration plant, fossil-derived carbon content and combustion efficiency.
∑ ××××i
iiii EFFCFCCWA1244
PEi,f,y =
where:
Amount of waste type i fed into the waste incineration plant (t/yr) Ai Fraction of carbon content in waste type i (fraction) CCWi
Fraction of fossil carbon in waste type i (fraction) FCFi Combustion efficiency for waste type i (fraction) EFi
/tC) 44/12 Conversion factor (tCO2 N O and CH emissions from the stacks due to waste incineration (PE2 4 i,s,y)
O and CHFrom the two options in AM0025, option 2 is chosen to calculate N2 4 emissions from the final stack due to waste incineration.

PROJECT DESIGN DOCUMENT FORM (CDM PDD) - Version 03 CDM – Executive Board page 22 PEi,s,y = Qbiomass,y*(EFN2O * GWPN2O + EFCH4 * GWPCH4) * 10-3
Where: Qbiomass,y Amount of waste incinerated in year y (tonnes/year) EFN2O Aggregate N2O emission factor for waste combustion (kgN2O/tonne of waste) EFCH4 Aggregate CH4 emission factor for waste combustion (kgCH4/tonne of waste) According to the methodology, if IPCC default emission factors are used, a conservativeness factor must be applied given their inherent uncertainty. This PDD selects the most conservative factor of 1.37. Emissions from wastewater treatment (PEw,y) Wastewater generated by the Project activity will be treated using a chemical treatment method that does not result in any methane emissions (PEw,y = 0). Parameters for this source of emissions are, therefore, not monitored; however, in the event that wastewater is treated anaerobically or released untreated, the necessary parameters will be monitored and CH4 emissions will be estimated as follows: PECH4,w,y = QCOD,y * PCOD,y * B0 * MCFp where: PECH4,w,y Methane emissions from the wastewater treatment in year y (tCH4/y) QCOD,y Amount of wastewater treated anaerobically or released untreated from the Project
activity in year y (m3/yr), which shall be measured monthly and aggregated annually PCOD,y Chemical Oxygen Demand (COD) of wastewater (tCOD/m3), which will be measured
monthly and averaged annually BB0 Maximum methane producing capacity (tCH4/tCOD) MCFp Methane conversion factor (fraction), preferably local specific value should be used. In
the absence of local values, default MCFp values can be obtained from table 6.3, chapter 6, volume 4 of the 2006 IPCC Guidelines.
The 2006 IPCC Guidelines specify 0.25 kgCH4/kg COD as a value for B0. Taking into account the uncertainty of this estimate, a value of 0.265 kg CH4/kg COD as a conservative assumption for B0 will be used. In the event that all the CH4 is emitted into air directly, then PEw,y = PECH4,w,y * GWPCH4 If flaring occurs, the Tool to determine project emissions from flaring gases containing methane will be used to estimate methane emissions. Baseline emissions Baseline emissions are calculated as follows: BEy = (MBy – MDreg,y) × GWPCH4 + BEEN,y
PROJECT DESIGN DOCUMENT FORM (CDM PDD) - Version 03 CDM – Executive Board page 23 where: BEy baseline emissions in year y (tCO2e) MBy methane produced in the landfill in the absence of the Project activity in year y (tCH4) MDreg,y methane that would be destroyed in the absence of the Project activity in year y (tCH4) BEEN,y baseline emissions from generation of energy displaced by the Project activity in year y
(tCO2e) Adjustment Factor (AF) MDreg,y = MBy * AF where: AF Adjustment Factor for MBy (%) The ‘Adjustment Factor’ will be revised at the start of each new crediting period taking into account the amount of GHG flaring that occurs as part of common industry practice and/or regulation at that point in time. This PDD assumes the adjustment factor to be 0% given that the Linyi Landfill Site does not currently capture and destroy any of the methane emissions that are derived therefrom. Rate of compliance (RATECompliance
y) In case where there are regulations that mandate the use of one of the project activity treatment options and which is not being enforced, the baseline scenario is identified as a gradual improvement of waste management practices to the acceptable technical options expected over a period of time to comply with the MSW Management Rules. The adjusted baseline emissions (BEy,a) are calculated as follows: BEy,a = BEy * ( 1 – RATECompliance
y) where: RATECompliance
y State-level compliance rate of the MSW Management Rules in that year y. The compliance rate shall be lower than 50% if it exceeds 50% the Project activity shall receive no further credit.
In such cases BEy,a will replace BEy to estimate emission reductions. No applicable regulations are currently in place that require the rate of compliance to be incorporated into the calculations. The regulatory situation and the compliance ratio RATECompliance
y will be monitored ex post based on the official reports for instance annual reports provided by the municipal bodies. Methane generation from the landfill in the absence of the project activity (MBy) The amount of methane that is generated each year (MBy) is calculated as follows:
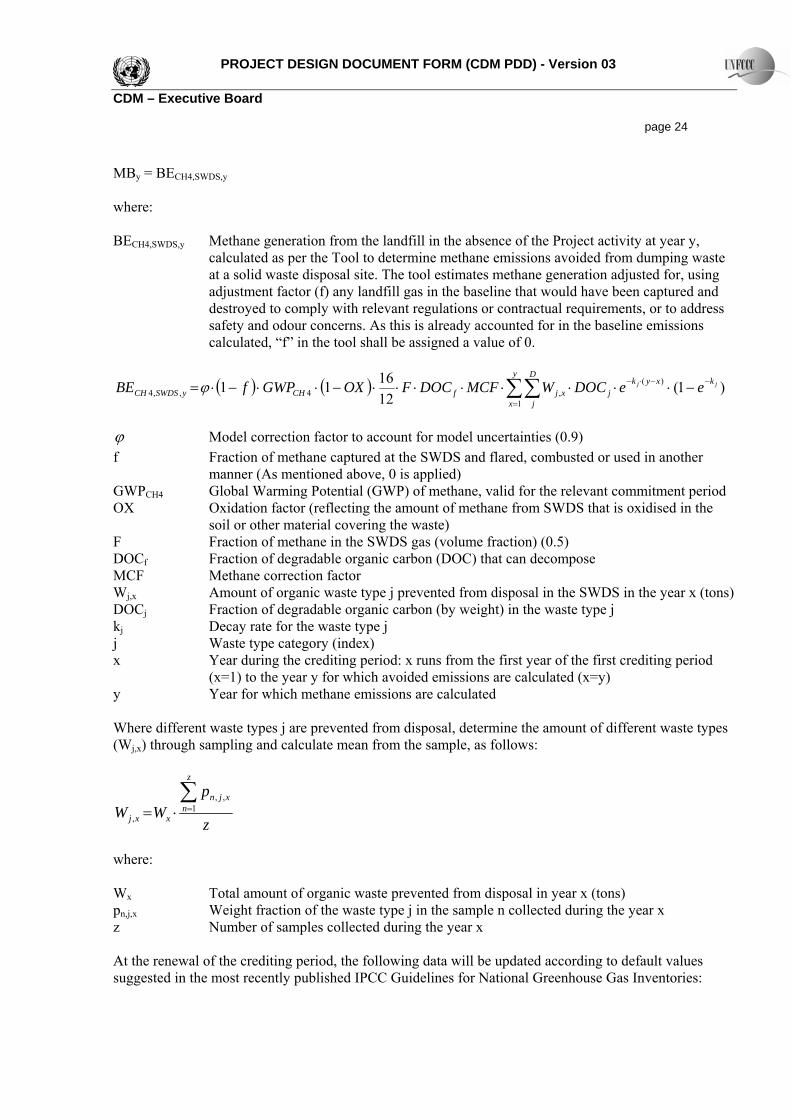
PROJECT DESIGN DOCUMENT FORM (CDM PDD) - Version 03 CDM – Executive Board page 24 MBy = BECH4,SWDS,y where: BECH4,SWDS,y Methane generation from the landfill in the absence of the Project activity at year y,
calculated as per the Tool to determine methane emissions avoided from dumping waste at a solid waste disposal site. The tool estimates methane generation adjusted for, using adjustment factor (f) any landfill gas in the baseline that would have been captured and destroyed to comply with relevant regulations or contractual requirements, or to address safety and odour concerns. As this is already accounted for in the baseline emissions calculated, “f” in the tool shall be assigned a value of 0.
( ) ( ) )1(121611
1
)(,4,,4
jj ky
x
xykD
jjxjfCHySWDSCH eeDOCWMCFDOCFOXGWPfBE −
=
−⋅− −⋅⋅⋅⋅⋅⋅⋅⋅−⋅⋅−⋅= ∑∑ϕ
ϕ Model correction factor to account for model uncertainties (0.9) f Fraction of methane captured at the SWDS and flared, combusted or used in another
manner (As mentioned above, 0 is applied) Global Warming Potential (GWP) of methane, valid for the relevant commitment period GWPCH4
OX Oxidation factor (reflecting the amount of methane from SWDS that is oxidised in the soil or other material covering the waste)
F Fraction of methane in the SWDS gas (volume fraction) (0.5) Fraction of degradable organic carbon (DOC) that can decompose DOCf
MCF Methane correction factor Amount of organic waste type j prevented from disposal in the SWDS in the year x (tons) Wj,x
DOCj Fraction of degradable organic carbon (by weight) in the waste type j kj Decay rate for the waste type j j Waste type category (index) x Year during the crediting period: x runs from the first year of the first crediting period
(x=1) to the year y for which avoided emissions are calculated (x=y) y Year for which methane emissions are calculated Where different waste types j are prevented from disposal, determine the amount of different waste types (W ) through sampling and calculate mean from the sample, as follows: j,x
z
pWW
z
nxjn
xxj
∑=⋅= 1
,,
,
where:
Total amount of organic waste prevented from disposal in year x (tons) Wxpn,j,x Weight fraction of the waste type j in the sample n collected during the year x z Number of samples collected during the year x At the renewal of the crediting period, the following data will be updated according to default values suggested in the most recently published IPCC Guidelines for National Greenhouse Gas Inventories:

PROJECT DESIGN DOCUMENT FORM (CDM PDD) - Version 03 CDM – Executive Board page 25
• Oxidation factor (OX) • Fraction of methane in the SWDS gas (F) • Fraction of degradable organic carbon (DOC) that can decompose (DOC ) f
• Methane correction factor (MCF) • Fraction of degradable organic carbon (by weight) in each waste type j (DOCj) • Decay rate for the waste type j (kj)
Note: Where for a particular year it cannot be demonstrated that the waste would have been disposed of in the landfill, the waste quantities prevented from disposal (wj,x) in the tool should be assigned a value of 0 (zero).
) Baseline emissions from generation of energy displaced by the project activity (BEEN,y The Project activity corresponds to scenario 1 described in AM0025. BEEN,y = BEelec,y + BEthermal,y where: BEelec,y baseline emissions from electricity generated utilizing the combustion heat from
incineration in the Project activity and exported to the grid (tCO e) 2BEthermal,y baseline emissions from thermal energy produced utilizing the combustion heat from
incineration in the Project activity displacing thermal energy from onsite/offsite fossil fuelled boilers (tCO e) 2
And, BEelec,y = EGd,y * CEFd where: EGd,y Amount of electricity generated utilizing the combustion heat from incineration in the
Project activity and exported to the grid during the year y (MWh) Carbon emissions factor for the displaced electricity source in the project scenario
(tCOCEFd
/MWh) 2 And,
bfuelfuelboiler
yythermal EF
NCVQ
BE ,, ⋅⋅
=ε
where: Qy Quantity of thermal energy produced utilizing the combustion heat from incineration in
the Project activity displacing thermal energy from onsite/offsite fossil fuelled boilers during the year y in GJ
PROJECT DESIGN DOCUMENT FORM (CDM PDD) - Version 03 CDM – Executive Board page 26
boilerε Energy efficiency of the boiler used in the absence of the Project activity to generate the thermal energy
Net calorific value of fuel, as identified through the baseline identification procedure, used in the boiler to generate the thermal energy in the absence of the Project activity in GJ per unit of volume or mass
NCVfuel
Emission factor of the fuel, as identified through the baseline identification procedure, used in the boiler to generate the thermal energy in the absence of the Project activity in tons CO
EFfuel,b
per unit of volume or mass of the fuel 2 This PDD makes a conservative estimation of boiler efficiency using Option A of the methodology on the basis of the results of a survey of coal-fired industrial boilers in operation in China12. The report found that the actual obtained efficiency of boilers is within the range 60-65%, whereas the efficiency according to the specifications provided by the manufacturer is within the range 72-80%. Option A in the methodology requires the use of the highest value among the following three values:
1. Measured efficiency prior to project implementation; 2. Measured efficiency during monitoring; 3. Manufacturer’s information on the boiler efficiency. Under option 3 then, the PDD assumes the most conservative of these ranges of figures, i.e. an
efficiency in the baseline of 80%. Baseline emissions from electricity generated As per AM0025, CEFd is calculated according to the Tool to calculate the emission factor for an electricity system since the generated electricity from combustion heat from incineration will displace the electricity that would have been generated by other power plants connected to the baseline grid. The procedure for calculating CEF is as follows: d STEP 1. Identify the relevant electric power system The Chinese DNA - Office of Climate Change under the National Development and Reform Commission - has published a delineation of the project electricity system and connected electricity system13. According to the delineation, the local grid to which the Project activity is connected is the North China Power Grid. STEP 2. Select an operating margin (OM) method Dispatch data is unavailable for the North China Power Grid; therefore, this PDD selects option (a), the Simple OM method, to calculate this parameter. As shown in the table below, low-cost/must-run resources constitute less than 1% of total North China Power Grid generation in each of the five most recent years for which data is available. Therefore, it is clear that the average over those years meets the requirement of being less than 50%.
12 Resource Conservation and Environmental Protection Department of National Development and Reform Commission “Implementation Guide to 10-Key Energy Conservation Programs”, Page 7, China Development Press, February 2007. 13 http://cdm.ccchina.gov.cn/web/index.asp

PROJECT DESIGN DOCUMENT FORM (CDM PDD) - Version 03 CDM – Executive Board page 27
Low-cost/must-run Total Generation Year % generation (108 kWh) 8 (10 kWh) 2001 29.27 3611.19 0.81 2002 36.25 4075.45 0.89 2003 39.79 4616.53 0.86 2004 40.32 5308.04 0.76 2005 30.41 5148.15 0.59
Source: China Electric Power Yearbooks 2002, 2003, 2004, 2005 and 2006 In calculating the simple OM, the ex-ante option of a 3-year generation-weighted average is
chosen, and is based on the most recent data available at the time of submission of the CDM-PDD to the DOE for validation, thus removing the requirement to monitor and recalculate the emissions factor during the crediting period. For the calculation, 2003, 2004 and 2005 are chosen as the data for these is the most recent. STEP 3. Calculate the operating margin emission factor according to the selected method The simple OM emission factor is calculated as the generation-weighted average CO2 emissions per unit net electricity generation (tCO2/MWh) of all generation power plants serving the system, not including low-cost/must-run power plants/units. It is calculated based on data on the total net electricity generation of all power plants serving the system and the fuel types and total fuel consumption of the project electricity system (option C) because the necessary data for option A or option B is not available, nuclear and renewable power generation are considered as low-cost/ must-run power sources and the quantity of electricity supplied to the grid by these sources is known. Electricity imports are treated as one power plant.
ygrid
iyiCOyiyi
yOMsimplegrid EG
EFNCVFCEF
,
,,2,,
,,
∑ ××=
Where: EFgrid,OMsimple,y Simple operating margin CO emission factor in year y (tCO /MWh) 2 2FCi,y Amount of fossil fuel type i consumed in the project electricity system in year y (mass or
volume unit) NCVi,y Net calorific value (energy content) of fossil fuel type i in year y (GJ/mass or volume
unit) EFCO2,i,y CO2 emission factor of fossil fuel type i in year y (tCO /GJ) 2EGgrid,y Net electricity generated and delivered to the grid by all power sources serving the
system, not including low-cost/must-run power plants/units in year y (MWh) i All fossil fuel types combusted in power sources in the project electricity system in year
y y The three most recent years for which data is available at the time of submission of the
CDM-PDD to the DOE for validation (ex-ante option) STEP 4. Identify the cohort of power units to be included in the build margin
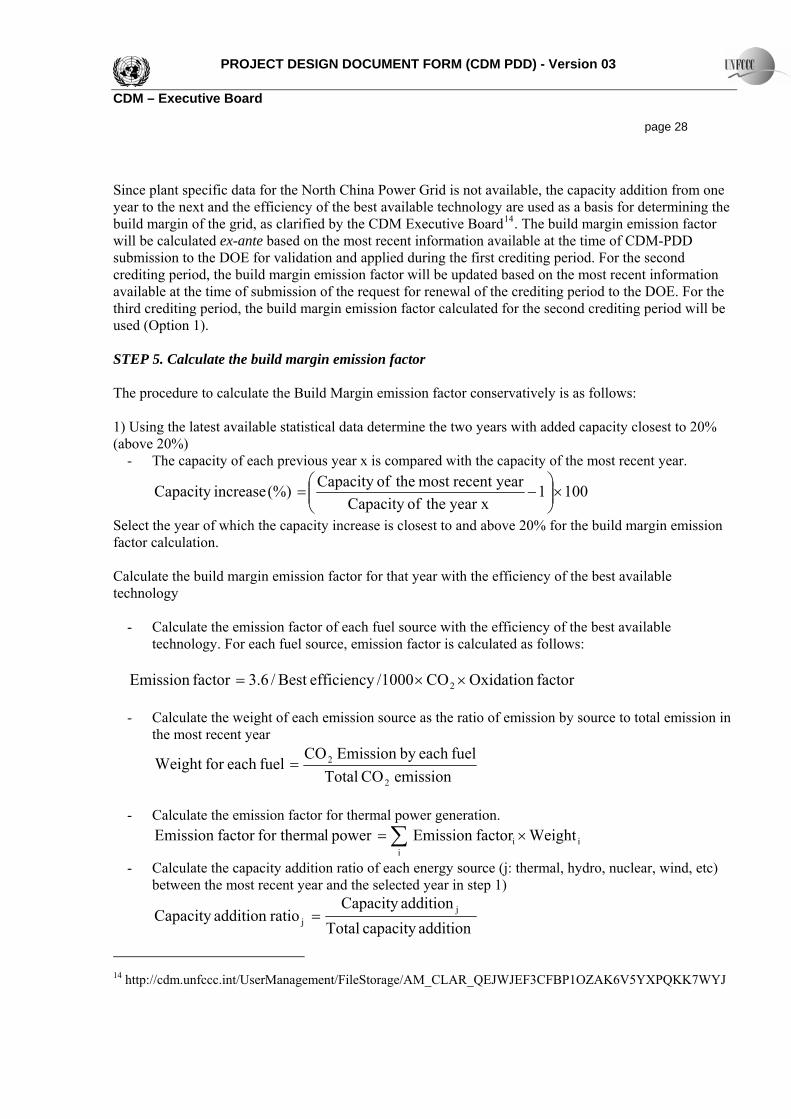
PROJECT DESIGN DOCUMENT FORM (CDM PDD) - Version 03 CDM – Executive Board page 28 Since plant specific data for the North China Power Grid is not available, the capacity addition from one year to the next and the efficiency of the best available technology are used as a basis for determining the build margin of the grid, as clarified by the CDM Executive Board14. The build margin emission factor will be calculated ex-ante based on the most recent information available at the time of CDM-PDD submission to the DOE for validation and applied during the first crediting period. For the second crediting period, the build margin emission factor will be updated based on the most recent information available at the time of submission of the request for renewal of the crediting period to the DOE. For the third crediting period, the build margin emission factor calculated for the second crediting period will be used (Option 1). STEP 5. Calculate the build margin emission factor The procedure to calculate the Build Margin emission factor conservatively is as follows: 1) Using the latest available statistical data determine the two years with added capacity closest to 20% (above 20%)
- The capacity of each previous year x is compared with the capacity of the most recent year.
1001year x theofCapacity
yearrecent most theofCapacity (%)increaseCapacity ×⎟⎟⎠
⎞⎜⎜⎝
⎛−=
Select the year of which the capacity increase is closest to and above 20% for the build margin emission factor calculation. Calculate the build margin emission factor for that year with the efficiency of the best available technology
- Calculate the emission factor of each fuel source with the efficiency of the best available technology. For each fuel source, emission factor is calculated as follows:
factor Oxidation CO /1000efficiencyBest /6.3factor Emission 2 ××=
- Calculate the weight of each emission source as the ratio of emission by source to total emission in
the most recent year
emission CO Totalfueleach by Emission CO fueleach for Weight
2
2=
- Calculate the emission factor for thermal power generation.
ii
i WeightfactorEmission power lfor thermafactor Emission ∑ ×=
- Calculate the capacity addition ratio of each energy source (j: thermal, hydro, nuclear, wind, etc) between the most recent year and the selected year in step 1)
addition capacity TotaladditionCapacity
ratioaddition Capacity jj =
14 http://cdm.unfccc.int/UserManagement/FileStorage/AM_CLAR_QEJWJEF3CFBP1OZAK6V5YXPQKK7WYJ

PROJECT DESIGN DOCUMENT FORM (CDM PDD) - Version 03 CDM – Executive Board page 29
jjj selectedyear theofcapacity - yearrecent most theofcapacity additionCapacity = - Calculate the Build Margin emission factor
∑ ×= jjBM ratioaddition Capacity factorEmission EF
* Emission factor of 0 will be applied for the emission factors other than thermal power generation. STEP 6. Calculate the combined margin emission factor The combined margin emission factor is calculated as follows:
BMyBMgridOMyOMgridyCMgrid wEFwEFEF ×+×= ,,,,,, Where: EFgrid,BM,y Build margin CO emission factor in year y (tCO /MWh) 2 2EFgrid,OM,y Operating margin CO emission factor in year y (tCO /MWh) 2 2
Weighting of operating margin emissions factor (%) wOMwBM Weighting of build margin emissions factor (%)
and wThe following default values will be applied for wOM BM:
= 0.5 and w- wOM BM = 0.5 for the first crediting period, and w = 0.25 and wOM BM = 0.75 for the second and third crediting period. Leakage The sources of leakage considered are CO2 emission from off-site transportation of MSW. There is no leakage to be considered from the residual waste from anaerobic digester, the gasifier, the processing/combustion of RDF/stabilized biomass, or compost in the event that it is disposed of in landfill, or leakage emissions from end use of stabilized biomass since the Project activity only involves the incineration of MSW. Ly = Lt,y where: Ly Leakage emissions in year y (tCO e) 2Lt,y Leakage emissions from increased transport in year y (tCO e) 2 Emissions from transportation (Lt,y) The Project site is 23km closer than the Linyi Landfill Site is to the source of the MSW, Linyi City; therefore, the Project activity will not result in an increase in transport emissions from this source. As regards the transport of the residual waste from the incinerator, it is to be sold as a raw material in the cement industry and therefore needs to be transported to the cement plants. The cement plants to be supplied are located within a 6km radius of the Project activity. These cement plants previously sourced the raw material that is to be replaced from suppliers in Fei County and Cangshan County, which are

PROJECT DESIGN DOCUMENT FORM (CDM PDD) - Version 03 CDM – Executive Board page 30 between 20 and 30 km away; therefore, the Project will not result in an increase in transport emissions from this source. In the event that transport emissions do increase, such emissions will be incorporated as leakage and calculated as follows:
∑ ×××××=n
ifuelfuelfueliconsyiyivehicleyt EFDNCVVFDTNOL ,,,,,
where: NOvehicles,i,y Number of vehicles for transport with similar loading capacity DTi,y Average additional distance travelled by vehicle type i compared to baseline in year y
(km) Vehicle fuel consumption in litres per kilometre for vehicle type i (l/km) VFcons
Calorific value of the fuel (MJ/Kg or other unit) NCVfuel Fuel density (kg/l), if necessary Dfuel Emission factor of the fuel (tCO /MJ) EFfuel 2
Emissions Reductions Emissions reductions will be calculated as follows: ERy = BEy – PEy – Ly where: ERy Emission reduction in year y (tCO e) 2BEy Emissions in the baseline scenario in year y (tCO e) 2PEy Emissions in the project scenario in year y (tCO e) 2Ly Leakage in year y (tCO e) 2 If the sum of PEy and Ly is smaller than 1% of BEy in the first full operation year of a crediting period, a fixed percentage of 1% for PEy and Ly combined can be applied for the remaining years of the crediting period.
B.6.2. Data and parameters that are available at validation:
Data / Parameter: GWPCH4
Data unit: tCO e/tCH2 4
Description: Global warming potential of CH4
Source of data used: IPCC Value applied: 21 Justification of the 21 for the first commitment period. Shall be updated according to any future
COP/MOP decisions. choice of data or description of measurement methods

PROJECT DESIGN DOCUMENT FORM (CDM PDD) - Version 03 CDM – Executive Board page 31 and procedures actually applied: Any comment: -
Data / Parameter: GWPN2O
Data unit: tCO2e/tN2O Description: Global warming potential of N2O Source of data used: IPCC Value applied: 310 Justification of the choice of data or description of measurement methods and procedures actually applied:
310 for the first commitment period. Shall be updated according to any future COP/MOP decisions.
Any comment: -
Data / Parameter: Φ Data unit: - Description: Model correction factor to account for model uncertainties Source of data used: Tool to determine methane emissions avoided from dumping waste at a solid
waste disposal site Value applied: 0.9 Justification of the choice of data or description of measurement methods and procedures actually applied:
Default value suggested in the tool.
Any comment: -
Data / Parameter: OX Data unit: - Description: Oxidation factor Source of data used: 2006 IPCC Guidelines for National Greenhouse Gas Inventories Value applied: 0.1 Justification of the choice of data or description of measurement methods and procedures actually applied:
The value for managed landfills is used, as directed by the Tool to determine methane emissions avoided from dumping waste at a solid waste disposal site.
Any comment: -
Data / Parameter: F Data unit: - Description: Fraction of methane in the SWDS gas (volume fraction)

PROJECT DESIGN DOCUMENT FORM (CDM PDD) - Version 03 CDM – Executive Board page 32 Source of data used: 2006 IPCC Guidelines for National Greenhouse Gas Inventories Value applied: 0.5 Justification of the choice of data or description of measurement methods and procedures actually applied:
-
Any comment: -
Data / Parameter: DOCf
Data unit: - Description: Fraction of degradable organic carbon (DOC) that can decompose Source of data used: 2006 IPCC Guidelines for National Greenhouse Gas Inventories Value applied: 0.5 Justification of the choice of data or description of measurement methods and procedures actually applied:
-
Any comment: -
Data / Parameter: MCF Data unit: - Description: Methane correction factor Source of data used: 2006 IPCC Guidelines for National Greenhouse Gas Inventories Value applied: 1 Justification of the choice of data or description of measurement methods and procedures actually applied:
Value given for anaerobic managed solid waste disposal sites
Any comment: -

PROJECT DESIGN DOCUMENT FORM (CDM PDD) - Version 03 CDM – Executive Board page 33
Data / Parameter: DOCj
Data unit: - Description: Fraction of degradable organic carbon (by weight) in waste type j Source of data used: Tool to determine methane emissions avoided from dumping waste at a solid
waste disposal site Value applied: See baseline data Justification of the choice of data or description of measurement methods and procedures actually applied:
Values for wet waste chosen, based on IPCC defaults.
Any comment: - Data / Parameter: EFi
Data unit: fraction Description: Combustion efficiency for waste type i Source of data used: IPCC Value applied: 1.0 for all waste types Justification of the choice of data or description of measurement methods and procedures actually applied:
From IPCC guidelines.
Any comment: - Data / Parameter: NCVfuel
Data unit: MJ/tonne Description: NCV of the fossil fuel Source of data used: Official data for coal Value applied: 20,908
Data / Parameter: kj
Data unit: - Description: Decay rate for waste type j Source of data used: Tool to determine methane emissions avoided from dumping waste at a solid
waste disposal site Value applied: See baseline data. Justification of the Mean Annual Temperature (MAT) = 13.2ºC (1958 – 2001) choice of data or Mean Annual Precipitation (MAP) = 855.8mm (1992 – 2001) description of Potential Evotranspiration (PET) = 1359.74mm measurement methods MAP/PET < 1 and procedures actually Based on this data, the climate is classed as: Boreal and Temperate, Dry applied: Any comment:

PROJECT DESIGN DOCUMENT FORM (CDM PDD) - Version 03 CDM – Executive Board page 34 Justification of the choice of data or description of measurement methods and procedures actually applied :
Since project specific data is not available, country specific value obtained from the Chinese DNA website is used.
Any comment:
Data / Parameter: EFfuel
Data unit: tCO2/TJ Description: CO2 emission factor of fuel Source of data used: IPCC default used since more localised data is not available. Value applied: 98.3 Justification of the choice of data or description of measurement methods and procedures actually applied :
Since the project specific data and country specific data is not available, IPCC default values are used.
Any comment: Data / Parameter: EFOM
Data unit: tCO2/MWh Description: Operating margin for the North China Power Grid Source of data used: Chinese DNA Value applied: 1.0425 tCO2/MWh Justification of the choice of data or description of measurement methods and procedures actually applied:
Calculated as directed in B.6.1. Calculations are shown in Annex 3.
Any comment: To be updated at the start of each new crediting period. Data / Parameter: EFBM
Data unit: tCO2/MWh Description: Operating margin for the North China Power Grid Source of data used: Chinese DNA Value applied: 0.8899 tCO2/MWh Justification of the choice of data or description of measurement methods and procedures actually applied:
Calculated as directed in B.6.1. Calculations are shown in Annex 3
Any comment: To be updated at the start of each new crediting period.
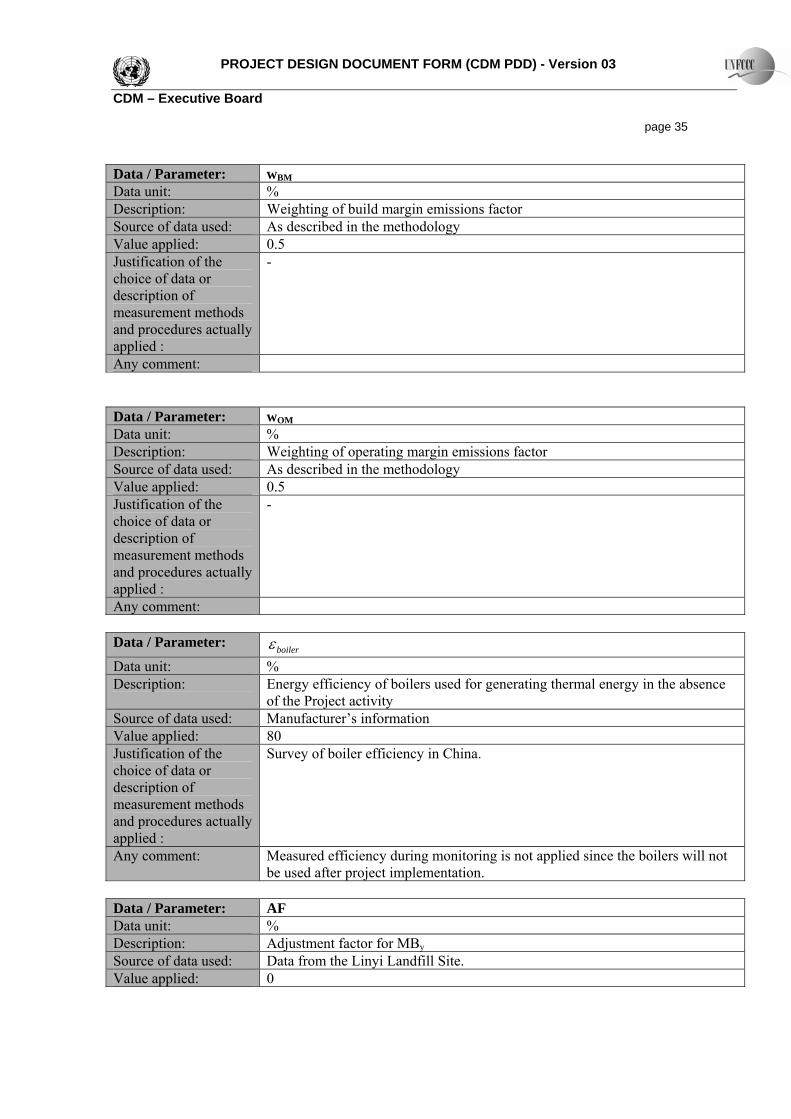
PROJECT DESIGN DOCUMENT FORM (CDM PDD) - Version 03 CDM – Executive Board page 35 Data / Parameter: wBM
Data unit: % Description: Weighting of build margin emissions factor Source of data used: As described in the methodology Value applied: 0.5 Justification of the - choice of data or description of measurement methods and procedures actually applied : Any comment:
Data / Parameter: wOM
Data unit: % Description: Weighting of operating margin emissions factor Source of data used: As described in the methodology Value applied: 0.5
- Justification of the choice of data or description of measurement methods and procedures actually applied : Any comment:
Data / Parameter: boilerε Data unit: % Description: Energy efficiency of boilers used for generating thermal energy in the absence
of the Project activity Source of data used: Manufacturer’s information Value applied: 80 Justification of the Survey of boiler efficiency in China. choice of data or description of measurement methods and procedures actually applied : Any comment: Measured efficiency during monitoring is not applied since the boilers will not
be used after project implementation.
Data / Parameter: AF Data unit: % Description: Adjustment factor for MBy
Source of data used: Data from the Linyi Landfill Site. Value applied: 0
PROJECT DESIGN DOCUMENT FORM (CDM PDD) - Version 03 CDM – Executive Board page 36
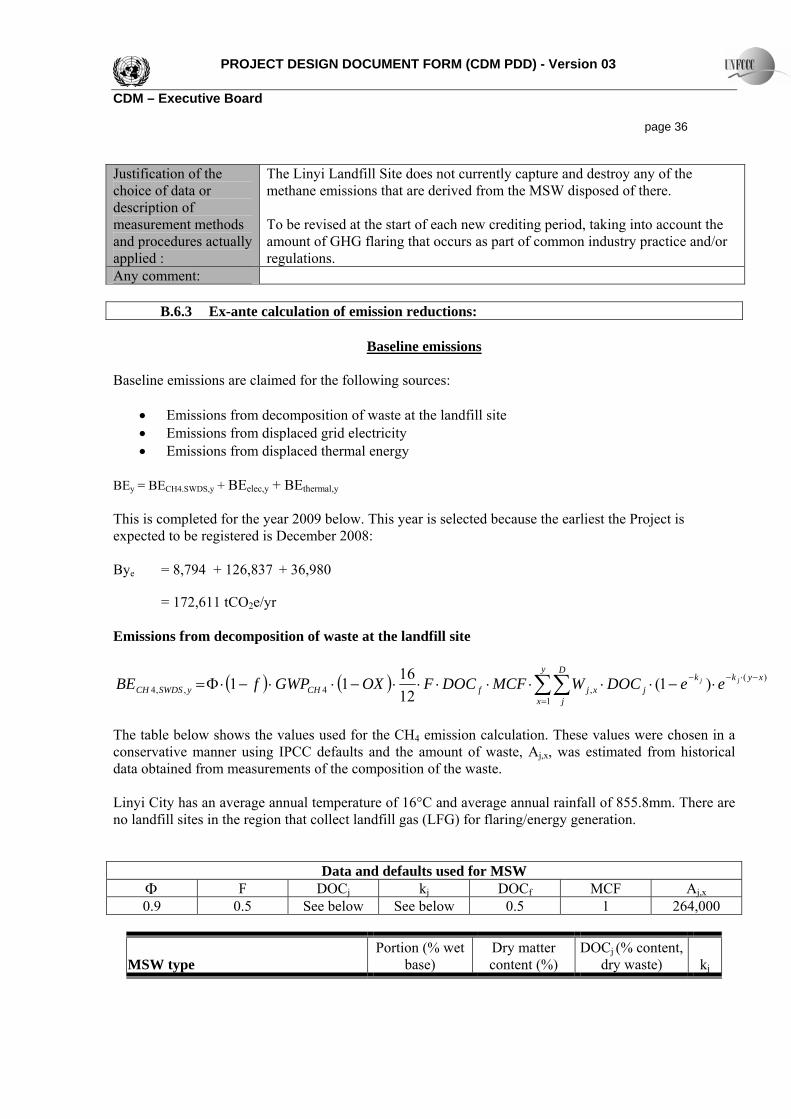
The Linyi Landfill Site does not currently capture and destroy any of the methane emissions that are derived from the MSW disposed of there.
Justification of the choice of data or description of measurement methods To be revised at the start of each new crediting period, taking into account the
amount of GHG flaring that occurs as part of common industry practice and/or regulations.
and procedures actually applied : Any comment:
B.6.3 Ex-ante calculation of emission reductions:
Baseline emissions
Baseline emissions are claimed for the following sources:
• Emissions from decomposition of waste at the landfill site • Emissions from displaced grid electricity • Emissions from displaced thermal energy
BEy = BECH4.SWDS,y + BEelec,y + BEthermal,y This is completed for the year 2009 below. This year is selected because the earliest the Project is expected to be registered is December 2008: Bye = 8,794 + 126,837 + 36,980 = 172,611 tCO e/yr 2 Emissions from decomposition of waste at the landfill site
( ) ( ) ∑∑=
−⋅−− ⋅−⋅⋅⋅⋅⋅⋅⋅−⋅⋅−⋅Φ=y
x
xykD
j
kjxjfCHySWDSCH
jj eeDOCWMCFDOCFOXGWPfBE1
)(,4,,4 )1(
121611
The table below shows the values used for the CH4 emission calculation. These values were chosen in a conservative manner using IPCC defaults and the amount of waste, Aj,x, was estimated from historical data obtained from measurements of the composition of the waste. Linyi City has an average annual temperature of 16°C and average annual rainfall of 855.8mm. There are no landfill sites in the region that collect landfill gas (LFG) for flaring/energy generation.
Data and defaults used for MSW Φ k DOC MCF AF DOC j j f j,x
0.9 0.5 See below See below 0.5 1 264,000
MSW type Portion (% wet
base) Dry matter content (%)
DOCj (% content, dry waste) kj
PROJECT DESIGN DOCUMENT FORM (CDM PDD) - Version 03 CDM – Executive Board page 37
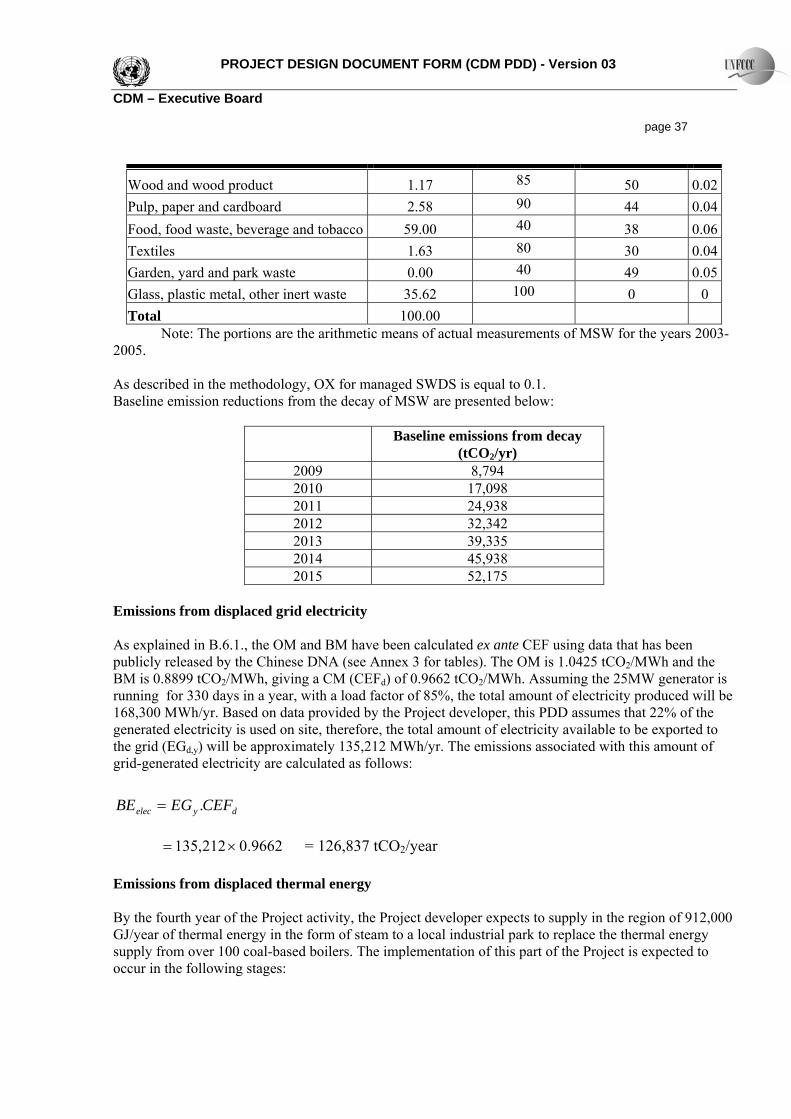
85 Wood and wood product 1.17 50 0.0290 Pulp, paper and cardboard 2.58 44 0.0440 Food, food waste, beverage and tobacco 59.00 38 0.06
Textiles 1.63 80 30 0.0440 Garden, yard and park waste 0.00 49 0.05
100 Glass, plastic metal, other inert waste 35.62 0 0 Total 100.00
Note: The portions are the arithmetic means of actual measurements of MSW for the years 2003-2005.
As described in the methodology, OX for managed SWDS is equal to 0.1. Baseline emission reductions from the decay of MSW are presented below:
Baseline emissions from decay /yr) (tCO2
2009 8,794 2010 17,098 2011 24,938 2012 32,342 2013 39,335 2014 45,938 2015 52,175
Emissions from displaced grid electricity As explained in B.6.1., the OM and BM have been calculated ex ante CEF using data that has been publicly released by the Chinese DNA (see Annex 3 for tables). The OM is 1.0425 tCO2/MWh and the BM is 0.8899 tCO /MWh, giving a CM (CEF ) of 0.9662 tCO2 d 2/MWh. Assuming the 25MW generator is running for 330 days in a year, with a load factor of 85%, the total amount of electricity produced will be 168,300 MWh/yr. Based on data provided by the Project developer, this PDD assumes that 22% of the generated electricity is used on site, therefore, the total amount of electricity available to be exported to the grid (EGd,y) will be approximately 135,212 MWh/yr. The emissions associated with this amount of grid-generated electricity are calculated as follows:
dyelec CEFEGBE .=
= 126,837 tCO /year 9662.0212,135 ×= 2
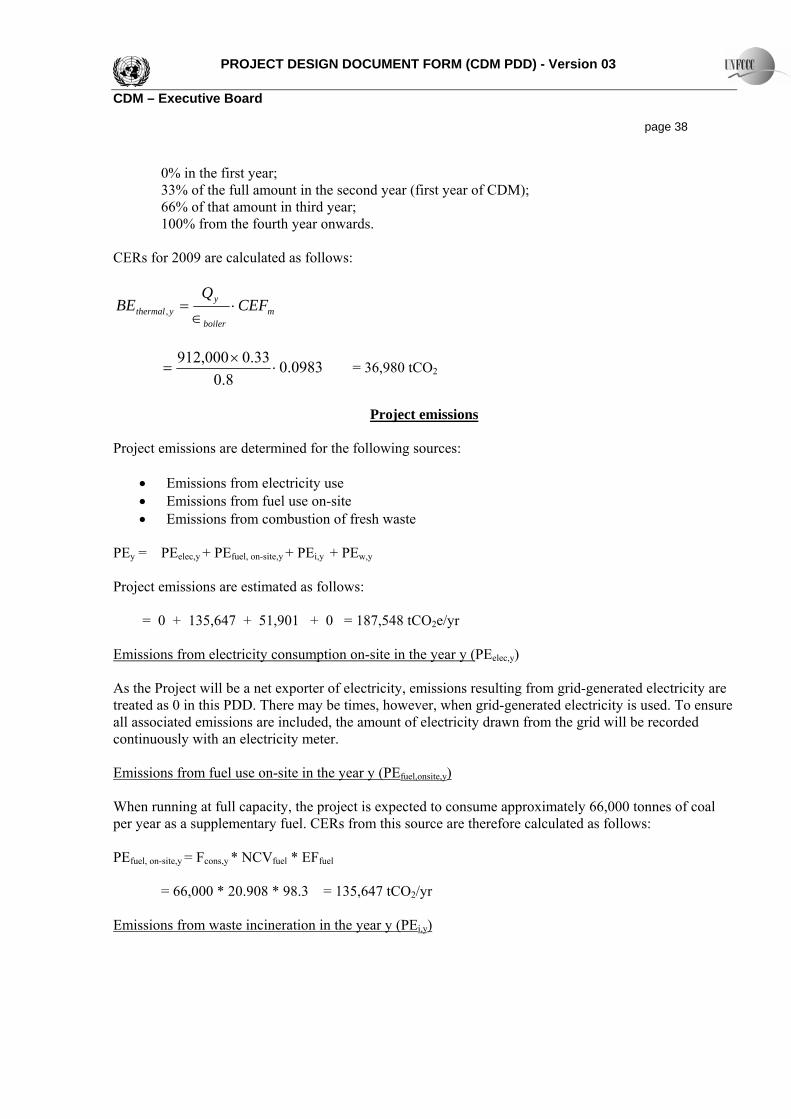
Emissions from displaced thermal energy By the fourth year of the Project activity, the Project developer expects to supply in the region of 912,000 GJ/year of thermal energy in the form of steam to a local industrial park to replace the thermal energy supply from over 100 coal-based boilers. The implementation of this part of the Project is expected to occur in the following stages:
PROJECT DESIGN DOCUMENT FORM (CDM PDD) - Version 03 CDM – Executive Board page 38
0% in the first year; 33% of the full amount in the second year (first year of CDM); 66% of that amount in third year; 100% from the fourth year onwards.
CERs for 2009 are calculated as follows:
mboiler
yythermal CEF
QBE ⋅
∈=,
0983.08.0
33.0000,912⋅
×= = 36,980 tCO2
Project emissions
Project emissions are determined for the following sources:
• Emissions from electricity use • Emissions from fuel use on-site • Emissions from combustion of fresh waste
PEy = PEelec,y + PE + PEfuel, on-site,y i,y + PEw,y Project emissions are estimated as follows:
e/yr = 0 + 135,647 + 51,901 + 0 = 187,548 tCO2 Emissions from electricity consumption on-site in the year y (PEelec,y) As the Project will be a net exporter of electricity, emissions resulting from grid-generated electricity are treated as 0 in this PDD. There may be times, however, when grid-generated electricity is used. To ensure all associated emissions are included, the amount of electricity drawn from the grid will be recorded continuously with an electricity meter. Emissions from fuel use on-site in the year y (PEfuel,onsite,y) When running at full capacity, the project is expected to consume approximately 66,000 tonnes of coal per year as a supplementary fuel. CERs from this source are therefore calculated as follows:
= FPEfuel, on-site,y cons,y * NCV * EFfuel fuel
/yr = 66,000 * 20.908 * 98.3 = 135,647 tCO2 Emissions from waste incineration in the year y (PEi,y)

PROJECT DESIGN DOCUMENT FORM (CDM PDD) - Version 03 CDM – Executive Board page 39 GHG emissions are determined from fossil-based waste within the MSW as well as from the boiler stacks. For the first year, this is estimated assuming approximately 800t/day of MSW will be combusted in the boiler, and the boiler will be in operation for 330 full days:
= PEPEi,y i,f,y + PEi,s,y
e/yr = 44,389 + 7,512 = 51,901 tCO2 Emissions from fossil-based waste in the year y (PEi,f,y)
1244
,, ⋅⋅⋅⋅= ∑ iiii
iyfi EFFCFCCWAP
The amounts of each waste type as a proportion of the predicted 800t/day that the plant will be combusting when at capacity, and their respective CCWs, FCFs and combustion efficiencies are shown in the table below:
Waste type Amount (t/yr)
% Dry matter
CCW FCF Combustion factor
Wood and wood products 3,416 85 0.5 0 1 Pulp, paper and cardboard 7,534 90 0.46 0.01 1 Food, food waste, beverage and tobacco 172,280 40 0.38 0 1 Textiles 4,769 80 0.5 0.2 1 Garden, yard and park waste 0 40 0.49 0 1 Plastic 14,396 100 0.75 1 1 Ash 80,787 100 0.03 1 1 Glass, metal and other inert waste 8,789 100 0 0 1 The emissions from fossil based waste from the plant when operating at capacity (800t/day) are therefore calculated for four categories: pulp, paper and cardboard, textiles, plastic and ash, as follows:
tCO2e/yr44,389 12441)]103.0180787()175.0114396()2.05.08.04769()01.046.09.07534[(
=
⋅⋅×××+×××+×××+×××=
Emissions from waste incineration in the year y (PEi,s,y) The Project will combust approximately 264,000 tonnes of MSW per year when fully operational. Emissions from this source are therefore calculated as follows:
-3 = QPEi,s,y biomass,y*(EF * GWP + EF * GWP ) * 10N2O N2O CH4 CH4 PEi,s,y = 264,000 * (91.79 * 310 + 0 * 21)
e/year = 7,512 tCO2

PROJECT DESIGN DOCUMENT FORM (CDM PDD) - Version 03 CDM – Executive Board page 40 Emissions from waste water treatment in the year y (PEw,y) Wastewater will not be treated anaerobically, but will be treated using a chemical treatment method which is not expected to result in greenhouse gas emissions. Emissions from this source are therefore assumed to be zero.
Leakage Leakage emissions from increased transport in year y (tCO2e)
As described in section B.6.1., the leakage emissions for the Project are considered to be zero.
The necessary parameters will be monitored and if any leakage is found to occur, the corresponding amount of emissions will be calculated as directed in B.6.1..
B.6.4 Summary of the ex-ante estimation of emission reductions:
Year Estimation of baseline emissions
(tCO2e)
Estimation of project emissions
(tCO2e)
Estimation of leakage
(tCO2e)
Estimation of emission
reductions (tCO2e)
Year 1 (2009) 172,612 187,548 0 0* Year 2 (2010) 217,896 187,548 0 15,411* Year 3 (2011) 263,837 187,548 0 76,289 Year 4 (2012) 271,241 187,548 0 83,693 Year 5 (2013) 278,234 187,548 0 90,685 Year 6 (2014) 284,837 187,548 0 97,289 Year 7 (2015) 291,074 187,548 0 103,526
TOTAL 1,779,731 1,312,838 0 466,893
* In the first year, actual emission reductions are negative. The equivalent amount is deducted from the emission reductions achieved in the following year.
Average annual emission reductions for the first crediting period are 66,699 tCO2e. B.7 Application of the monitoring methodology and description of the monitoring plan:
B.7.1 Data and parameters monitored:
Data / Parameter: Fcons
Data unit: Mass or volume unit per year Description: Quantity of fossil waste type i combusted in the Project activity during year y Source of data to be used:
On-site measurements
Value of data applied for the purpose of calculating expected
66,000 tonnes
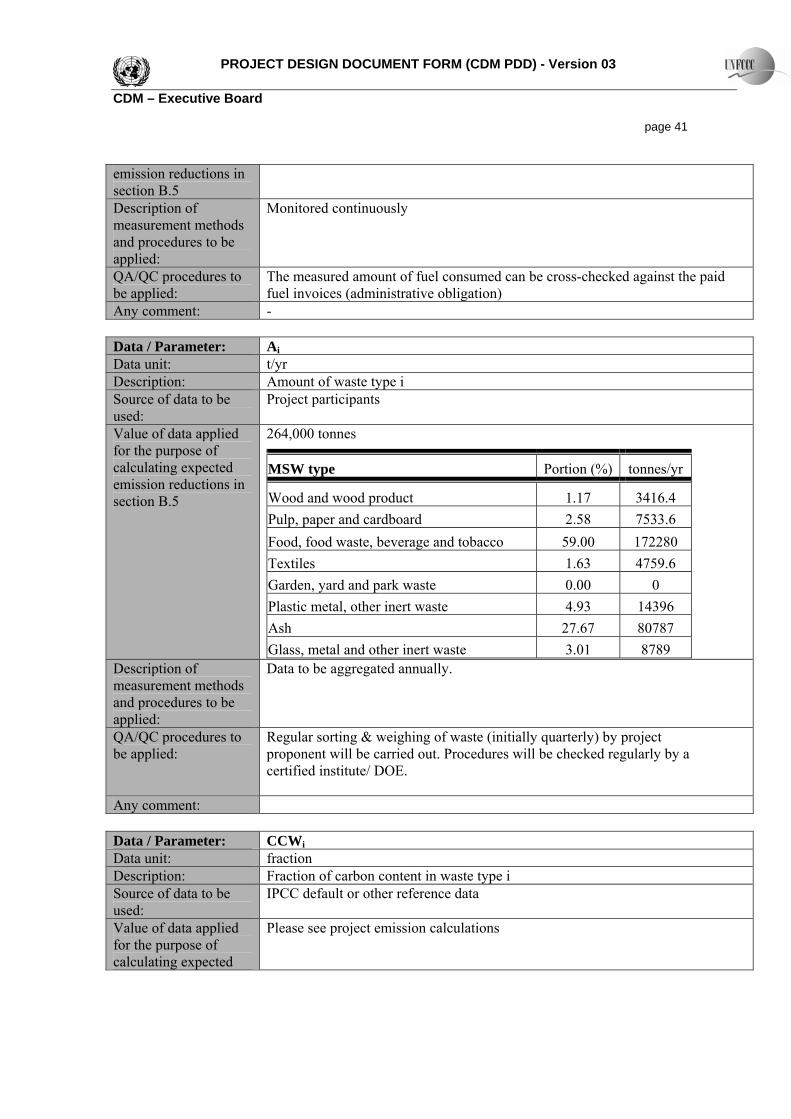
PROJECT DESIGN DOCUMENT FORM (CDM PDD) - Version 03 CDM – Executive Board page 41 emission reductions in section B.5 Description of measurement methods and procedures to be applied:
Monitored continuously
QA/QC procedures to be applied:
The measured amount of fuel consumed can be cross-checked against the paid fuel invoices (administrative obligation)
Any comment: - Data / Parameter: Ai
Data unit: t/yr Description: Amount of waste type i Source of data to be used:
Project participants
Value of data applied for the purpose of calculating expected emission reductions in section B.5
264,000 tonnes
MSW type Portion (%) tonnes/yr
Wood and wood product 1.17 3416.4 Pulp, paper and cardboard 2.58 7533.6 Food, food waste, beverage and tobacco 59.00 172280 Textiles 1.63 4759.6 Garden, yard and park waste 0.00 0 Plastic metal, other inert waste 4.93 14396 Ash 27.67 80787 Glass, metal and other inert waste 3.01 8789
Description of measurement methods and procedures to be applied:
Data to be aggregated annually.
QA/QC procedures to be applied:
Regular sorting & weighing of waste (initially quarterly) by project proponent will be carried out. Procedures will be checked regularly by a certified institute/ DOE.
Any comment:
Data / Parameter: CCWi
Data unit: fraction Description: Fraction of carbon content in waste type i Source of data to be used:
IPCC default or other reference data
Value of data applied for the purpose of calculating expected
Please see project emission calculations

PROJECT DESIGN DOCUMENT FORM (CDM PDD) - Version 03 CDM – Executive Board page 42 emission reductions in section B.5 Description of measurement methods and procedures to be applied:
-
QA/QC procedures to be applied:
From IPCC guidelines. QA/QC procedures not applicable.
Any comment: -
Data / Parameter: FCFi
Data unit: fraction Description: Fraction of fossil carbon in waste type i Source of data to be used:
IPCC default or other reference data
Value of data applied for the purpose of calculating expected emission reductions in section B.5
Please see project emission calculations
Description of measurement methods and procedures to be applied:
-
QA/QC procedures to be applied:
From IPCC guidelines. QA/QC procedures not applicable.
Any comment: This is a conservative assumption.
Data / Parameter: f Data unit: fraction Description: Fraction of methane captured at the SWDS and flared, combusted or used in
another manner Source of data to be used:
Written information from the operator of the solid waste disposal site and/or site visits at the solid waste disposal site
Value of data applied for the purpose of calculating expected emission reductions in section B.5
0
Description of measurement methods and procedures to be applied:
To be carried out annually
QA/QC procedures to be applied:
Data to be made available to DOE at verification.
Any comment: -
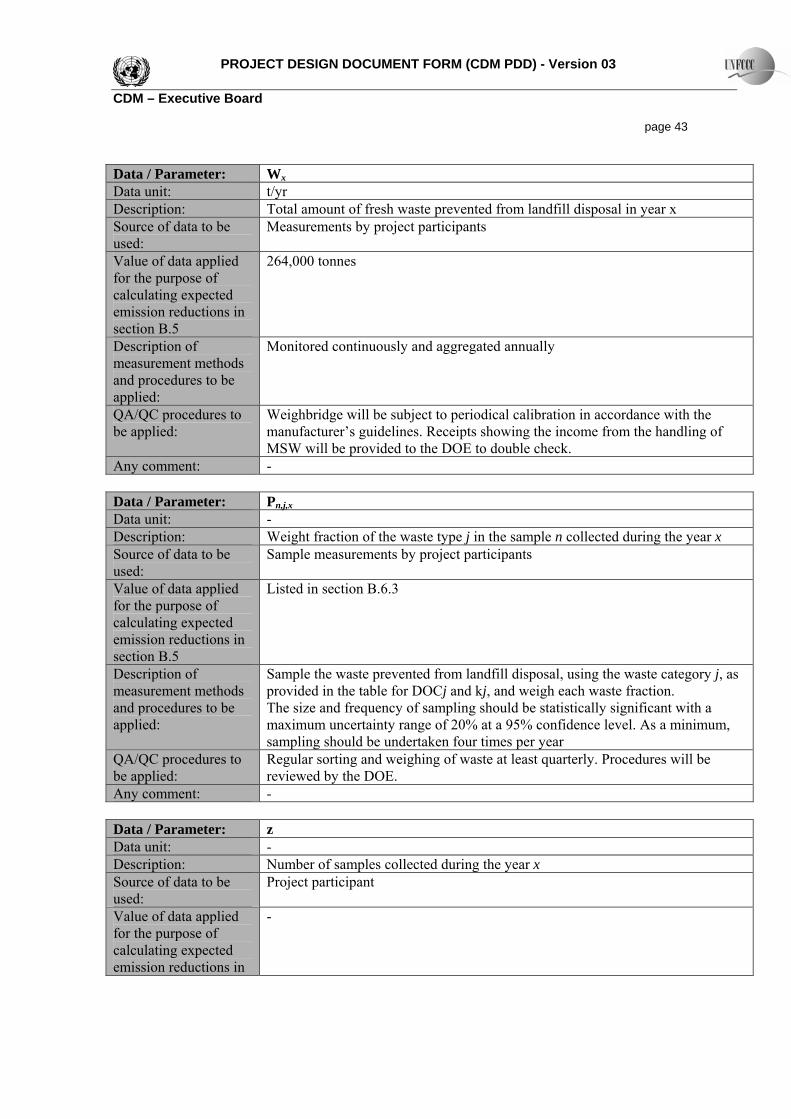
PROJECT DESIGN DOCUMENT FORM (CDM PDD) - Version 03 CDM – Executive Board page 43 Data / Parameter: Wx
Data unit: t/yr Description: Total amount of fresh waste prevented from landfill disposal in year x Source of data to be used:
Measurements by project participants
Value of data applied for the purpose of calculating expected emission reductions in section B.5
264,000 tonnes
Description of measurement methods and procedures to be applied:
Monitored continuously and aggregated annually
QA/QC procedures to be applied:
Weighbridge will be subject to periodical calibration in accordance with the manufacturer’s guidelines. Receipts showing the income from the handling of MSW will be provided to the DOE to double check.
Any comment: -
Data / Parameter: Pn,j,x
Data unit: - Description: Weight fraction of the waste type j in the sample n collected during the year x Source of data to be used:
Sample measurements by project participants
Value of data applied for the purpose of calculating expected emission reductions in section B.5
Listed in section B.6.3
Description of measurement methods and procedures to be applied:
Sample the waste prevented from landfill disposal, using the waste category j, as provided in the table for DOCj and kj, and weigh each waste fraction. The size and frequency of sampling should be statistically significant with a maximum uncertainty range of 20% at a 95% confidence level. As a minimum, sampling should be undertaken four times per year
QA/QC procedures to be applied:
Regular sorting and weighing of waste at least quarterly. Procedures will be reviewed by the DOE.
Any comment: -
Data / Parameter: z Data unit: - Description: Number of samples collected during the year x Source of data to be used:
Project participant
Value of data applied for the purpose of calculating expected emission reductions in
-

PROJECT DESIGN DOCUMENT FORM (CDM PDD) - Version 03 CDM – Executive Board page 44 section B.5 Description of measurement methods and procedures to be applied:
QA/QC procedures to be applied:
Implemented by the project participant, validated by the DOE.
Any comment: -
Data / Parameter: EGd
Data unit: MWh/yr Description: Electricity generation of project using fresh waste Source of data to be used:
Electricity meter
Value of data applied for the purpose of calculating expected emission reductions in section B.5
131,274 MWh/yr
Description of measurement methods and procedures to be applied:
Exported electricity continuously measured via a meter. According to the Project developer, 22% of electricity will be used on site. Gross electricity output and the electricity consumed on-site will also be monitored to provide an alternative means of verifying the exported amount.
QA/QC procedures to be applied:
Maintenance and calibration of equipment will be carried out according to internationally recognised procedures. Third parties will be able to verify.
Any comment: Electricity generated from the use of fresh waste and exported to the grid Data / Parameter: HGm,y
Data unit: GJ/yr Description: Quantity of thermal energy produced by the project using fresh waste Source of data to be used:
Device measuring quantity and temperature of steam
Value of data applied for the purpose of calculating expected emission reductions in section B.5
Maximum estimated capacity: 912,000 GJ/yr; Exported in year 1 (0%): 300,960 GJ/yr; Exported in year 2 (33%): 300,960 GJ/yr (first year of CDM); Exported in year 3 (66%): 601,920 GJ/yr; Exported from year 4 (100%): 912,000 GJ/yr;
Description of measurement methods and procedures to be applied:
Based on the properties of steam / water supplied and recorded annually
QA/QC procedures to be applied:
Maintenance and calibration of equipment will be carried out according to internationally recognised procedures. Third parties will be able to verify.
Any comment: Thermal energy generated from the use of fresh waste and exported to customers. An estimated 300,000 tonnes of steam at 0.981Mpa and 296ºC will be supplied annually.
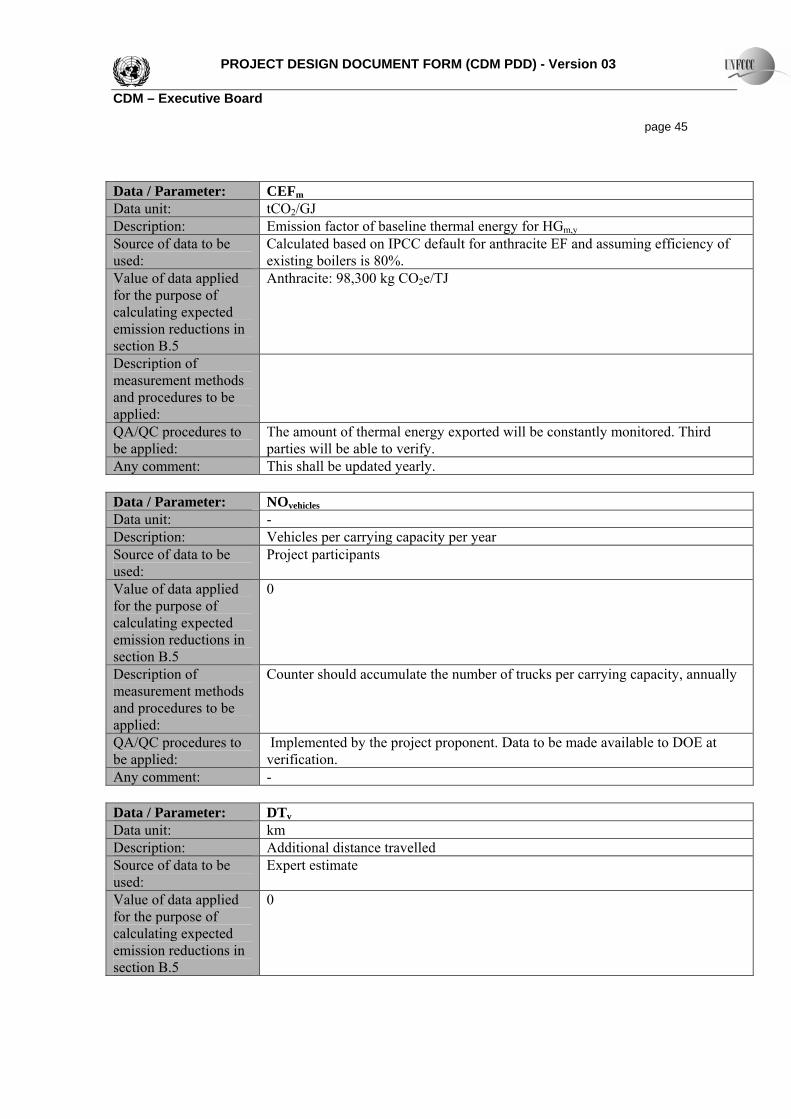
PROJECT DESIGN DOCUMENT FORM (CDM PDD) - Version 03 CDM – Executive Board page 45
Data / Parameter: CEFm
Data unit: tCO2/GJ Description: Emission factor of baseline thermal energy for HGm,y
Source of data to be used:
Calculated based on IPCC default for anthracite EF and assuming efficiency of existing boilers is 80%.
Value of data applied for the purpose of calculating expected emission reductions in section B.5
Anthracite: 98,300 kg CO2e/TJ
Description of measurement methods and procedures to be applied:
QA/QC procedures to be applied:
The amount of thermal energy exported will be constantly monitored. Third parties will be able to verify.
Any comment: This shall be updated yearly.
Data / Parameter: NOvehicles
Data unit: - Description: Vehicles per carrying capacity per year Source of data to be used:
Project participants
Value of data applied for the purpose of calculating expected emission reductions in section B.5
0
Description of measurement methods and procedures to be applied:
Counter should accumulate the number of trucks per carrying capacity, annually
QA/QC procedures to be applied:
Implemented by the project proponent. Data to be made available to DOE at verification.
Any comment: -
Data / Parameter: DTv
Data unit: km Description: Additional distance travelled Source of data to be used:
Expert estimate
Value of data applied for the purpose of calculating expected emission reductions in section B.5
0
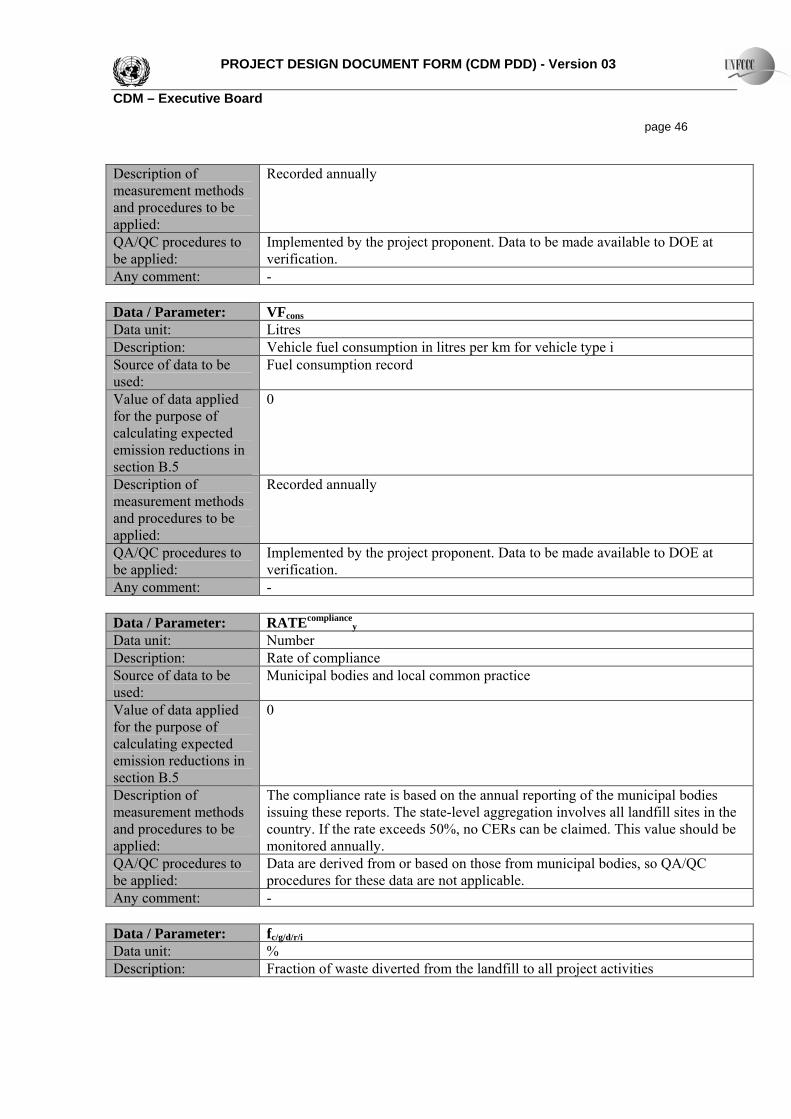
PROJECT DESIGN DOCUMENT FORM (CDM PDD) - Version 03 CDM – Executive Board page 46 Description of measurement methods and procedures to be applied:
Recorded annually
QA/QC procedures to be applied:
Implemented by the project proponent. Data to be made available to DOE at verification.
Any comment: -
Data / Parameter: VFcons
Data unit: Litres Description: Vehicle fuel consumption in litres per km for vehicle type i Source of data to be used:
Fuel consumption record
Value of data applied for the purpose of calculating expected emission reductions in section B.5
0
Description of measurement methods and procedures to be applied:
Recorded annually
QA/QC procedures to be applied:
Implemented by the project proponent. Data to be made available to DOE at verification.
Any comment: - Data / Parameter: RATEcompliance
y
Data unit: Number Description: Rate of compliance Source of data to be used:
Municipal bodies and local common practice
Value of data applied for the purpose of calculating expected emission reductions in section B.5
0
Description of measurement methods and procedures to be applied:
The compliance rate is based on the annual reporting of the municipal bodies issuing these reports. The state-level aggregation involves all landfill sites in the country. If the rate exceeds 50%, no CERs can be claimed. This value should be monitored annually.
QA/QC procedures to be applied:
Data are derived from or based on those from municipal bodies, so QA/QC procedures for these data are not applicable.
Any comment: - Data / Parameter: fc/g/d/r/i
Data unit: % Description: Fraction of waste diverted from the landfill to all project activities

PROJECT DESIGN DOCUMENT FORM (CDM PDD) - Version 03 CDM – Executive Board page 47 Source of data to be used:
Plant records, or local authority records
Value of data applied for the purpose of calculating expected emission reductions in section B.5
Description of measurement methods and procedures to be applied:
Monthly
QA/QC procedures to be applied:
-
Any comment: -
Data / Parameter: QCOD,y
Data unit: m3/yr Description: Amount of wastewater treated anaerobically or released untreated from the
Project activity in year y Source of data to be used:
Measured value by flow meter
Value of data applied for the purpose of calculating expected emission reductions in section B.5
0
Description of measurement methods and procedures to be applied:
This parameter will be measured monthly and aggregated annually.
QA/QC procedures to be applied:
The monitoring instrument will be subject to regular maintenance and testing to ensure accuracy.
Any comment: Only in case the wastewater is treated anaerobically or released untreated, this parameter will be monitored. If the wastewater is treated aerobically, emissions are assumed to be zero and this parameter does not need to be monitored.
B.7.2 Description of the monitoring plan: Purpose The monitoring plan is designed to monitor parameters listed in B.7.1, which are required for
calculation of the actual GHG emission reduction achieved by the Project. Monitoring framework
Figure 3 below outlines the operational and management structure that CECIC will implement to monitor emission reductions and any leakage effects generated by the Project activity. CECIC will form an

PROJECT DESIGN DOCUMENT FORM (CDM PDD) - Version 03 CDM – Executive Board page 48 operational and management team, which will be responsible for monitoring of all the aforementioned monitoring parameters. This team will compose of a general manager and a group of operators. The group of operators, under the supervision of the general manager, will be assigned for monitoring of different parameters on a timely basis and will perform the recording and archiving of data in an orderly manner. Monitoring reports will be forwarded to and reviewed by the general manager on a monthly basis in order to ensure the Project follows the requirements of the monitoring plan. The performance of the Project will be reviewed and analyzed by the consultants on a regular basis.
Figure 3. Operational and management structure for monitoring the Project activity. Monitoring equipment and installation
The Project activity requires the monitoring of the following items: • Electricity generation by the Project activity (the total amount, the amount used by the project
activity, and the amount exported to the grid); • Thermal generation from the Project activity (the amount exported to customers) • The amount of waste consumed by the Project; • The NCV of the waste; • Waste fraction of the different waste types; • Data on the relative amounts of MSW and coal combusted in the incinerator; • Data needed to calculate CO emissions from combustion of fossil-based waste; 2
• Data needed to calculate CO emissions from the transportation of waste to the Project plant; 2
• Data needed to calculate CO emissions from on-site consumption of fossil fuels; 2
• Data needed to calculate CH and N O emissions from the boiler stacks; 4 2
• Rate of compliance by landfills in China with the national regulations regarding methane capture. • Fraction of waste diverted from the landfill to all project activities. The monitoring methodologies for each are stated in the respective sections of B.7.2. Data collection

PROJECT DESIGN DOCUMENT FORM (CDM PDD) - Version 03 CDM – Executive Board page 49 This monitoring plan includes MSW composition analysis, MSW properties analysis, and measuring of the quantity of MSW, electricity, and fuel consumption. Additionally, monitoring of laws and regulations, as well as compliance are included in this monitoring plan. The data to be collected is listed below: (1) The MSW composition analysis, waste type by weight, and analysis of MSW properties. (2) Electricity consumption, import and export will be recorded continuously and aggregated
monthly. The time and date each monitoring period starts and ends will be recorded. (3) The project proponent will keep all relevant receipts for electricity sales and receipts for the
income from MSW handling, as well as all relevant receipts for the purchase of electricity and fuel. These receipts (or photocopies) will be made available to the auditor at verification.
(4) Annual fossil fuel consumption will be monitored from the fuel purchase invoices. (5) The administration department will monitor MSW treatment laws, regulatory information and
compliance statistics, as well as national and international publications (such as the IPCC guidelines). Administration will submit an annual report on the above to the general manager.
Calibration Regular calibration will be necessary for the monitoring equipment. The necessary calibration will be performed according to the manufacturer’s guidelines, or according to the applicable regulations, by a suitably skilled technician at the required frequency (at least once a year). A certificate of calibration will be provided for each piece of equipment after completion. Data management All data collected as part of monitoring plan should be archived electronically and be kept for at least 2 years after the end of the crediting period. Monitoring report A monitoring report in line with CDM regulations and the requirements of this monitoring methodology will be issued annually by the general manager. The monitoring report will contain a summary of the whole monitoring plan, and will describe the implementation of the monitoring plan in that particular year, present the relevant results and data, and calculate emission reductions for the period. The report will include:
• Quality assurance reports for the monitoring equipment; • Calibration reports for the monitoring equipment (including relevant standards and
regulations); • Any maintenance and repair of monitoring equipment; • The qualifications of the persons responsible for the monitoring and calculations; • The tests performed and data obtained; • Emission reduction calculations; • A summary of the monitoring plan in that particular year; • Any other information relevant to the monitoring plan.

PROJECT DESIGN DOCUMENT FORM (CDM PDD) - Version 03 CDM – Executive Board page 50 B.8 Date of completion of the application of the baseline study and monitoring methodology and the name of the responsible person(s)/entity(ies) The baseline study was completed on 27/05/2008 by: Joseph Cairnes/Matthew Setterfield
Clean Energy Finance Committee Mitsubishi UFJ Securities (MUS) 8th Floor, Mitsubishi Building, 2-5-2 Marunouchi, Chiyoda-ku,
Tokyo, 100-0005, Japan
Tel: +81-3-6213-6302 Fax: +81-3-6213-6175 E-mail: [email protected] CECIC Blue-Sky Investment Consulting & Management Co., Ltd Beijing Image, No.1 Building, Unit 2, 10th Floor No.15 Fucheng Road Haidian District Beijing Tel: (8610) 62268849 Fax: (8610) 62261552
SECTION C. Duration of the project activity / crediting period C.1 Duration of the project activity: C.1.1. Starting date of the project activity: 19/10/2006 C.1.2. Expected operational lifetime of the project activity:
22 years
C.2 Choice of the crediting period and related information: C.2.1. Renewable crediting period C.2.1.1. Starting date of the first crediting period:
01/12/2008 C.2.1.2. Length of the first crediting period:
Seven (7) years

PROJECT DESIGN DOCUMENT FORM (CDM PDD) - Version 03 CDM – Executive Board page 51 C.2.2. Fixed crediting period: C.2.2.1. Starting date:
Not applicable. C.2.2.2. Length:
Not applicable. SECTION D. Environmental impacts >> D.1. Documentation on the analysis of the environmental impacts, including transboundary impacts:
An environmental impact report for the Project was completed in accordance with the relevant laws and regulations. The report has been approved by the Environment Protection Bureau of Shandong Province. D.2. If environmental impacts are considered significant by the project participants or the host Party, please provide conclusions and all references to support documentation of an environmental impact assessment undertaken in accordance with the procedures as required by the host Party:
The main requirements that the above-mentioned report placed on the Project are as follows: 1) The percentage of bituminous coal will not exceed 20% of the total fuel. An automatic
monitoring device is included in the feeder to measure the relative amounts of MSW and bituminous coal. In addition, a device which separates alkali metals and discarded batteries will be installed.
2) The MSW storage pool will be non-permeable and a wastewater capture device will also be installed. Any leachate from the MSW will be combusted in the boiler.
3) The sulphur (S) content of bituminous coal is to be below 1.52% (0.46% of mixed fuels), desulphurization of the waste gases will result in the removal of at least 90% of the sulphur, and an additional filtration process will remove at least 99.8% of the dust from the waste gases. Stack gas emissions will meet MSW Combustion Emission Standard GB18484-2001, and stench emissions will meet Stench Emission Standard GB 14554-93. The chimney will be at least 120 m tall.
4) The wastewater will be separated into two waste streams: sanitary wastewater and industrial wastewater. The wastewater shall be recycled as much as possible, and any that is released will have been treated to meet the highest level of Integrated Wastewater Emission Standard GB8978-1996.
5) Anti-noise measures will be taken to ensure that the noise at the plant boundary meets the second level of Industrial Enterprise Boundary Noise Standard GB12348-90; the noise during project construction shall meet Construction Boundary Noise Limitation GB12523-90.
6) Residual waste from the incinerator will be sold as a replacement for clinker in cement manufacture. Any waste that is not utilized will be treated as hazardous waste.
7) A stack gas emission monitoring device will be installed according to national requirements, as stated in Technical Guideline of Stack Gas Emission Monitoring in Coal/Oil-Fired Power Plant.
The Project will meet all of the above requirements, and in response to a requirement of GB 18485-2001, the content of the waste will be monitored and a report submitted periodically to the local Environmental Protection Department.

PROJECT DESIGN DOCUMENT FORM (CDM PDD) - Version 03 CDM – Executive Board page 52
The Project activity will lead to significant reductions in greenhouse gas emissions, when compared with the baseline scenario of coal-based generation and environmentally harsh methods of waste disposal. Additionally, the Project activity will significantly reduce harmful emissions (including SO2, NOx and particulate matter) and lead to less tangible benefits for the local community such as improvements in the area’s scenery and the reduction of noxious smells from the waste. SECTION E. Stakeholders’ comments E.1. Brief description how comments by local stakeholders have been invited and compiled:
Survey questionnaires on the implementation of the Project were sent to the local residents, and
the results compiled and reviewed by the project developer. A stakeholder consultancy meeting was organised, with announcements made in a local daily newspaper (Linyi Daily), on the internet at the site below and through posters placed at key transportation points and in nearby residential areas. A total of 37 people attended the stakeholders’ meeting.
www.cecic-consulting.com.cn E.2. Summary of the comments received:
Support for the Project was given from the local deputy mayor, on the grounds that it will bring
an efficient method of dealing with increasing levels of waste being produced by the rapidly developing city of Linyi. Waste that would otherwise be disposed of at landfill, producing methane and polluting the local environment in the process. In addition to this, Linyi’s wood-processing industry, the fourth largest in China, requires a large amount of heat to be supplied through small, inefficient boilers. Large efficiency gains and CO2 emission reductions can be achieved by replacing the thermal energy supplied by these boilers with that produced by the Project activity.
The development of the Project is in line with local and national industrial policies, and it is undertaken using advanced equipment and technology developed within the country, leading to development gains within the country’s industrial R&D sector.
The concerns raised in the answers to the questionnaires and at the stakeholders’ meeting were as follows:
1) The production of dioxins during the combustion process, 2) Whether the Project activity’s handling process for MSW would lead to any pollution of
the local environment, and 3) Whether the proportion of MSW to coal would meet the national standards.
E.3. Report on how due account was taken of any comments received:
The owner addressed the above three concerns as follows: 1) The amount of dioxin produced in the combustion process will be much lower than the
national standard (0.1Ng). Through control of the temperature in the furnace and filtration of the flue gas, levels of 0.01Ng (90% lower than the required standard) are expected to be achieved.
2) Leachate released from the MSW during the handling process will be collected and fed back into the boiler. The Project meets both national and EU standards. No new pollution will be produced.
3) The ratio of MSW to coal will be 8:2 by weight, in line with the national standards.

PROJECT DESIGN DOCUMENT FORM (CDM PDD) - Version 03 CDM – Executive Board page 53
Annex 1
CONTACT INFORMATION ON PARTICIPANTS IN THE PROJECT ACTIVITY Organization: Linyi National Environmental New Energy Co., Ltd. Street/P.O.Box: No.15 Fucheng Road, Haidian District, Beijing Building: 10th Floor, Unit 2, No.1 Building, Beijing Image City: Beijing State/Region: Postfix/ZIP: 100036 Country: China Telephone: (8610) 62268849 FAX: (8610) 62261552 E-Mail: URL: www.cecic-consulting.com.cn Represented by: Hang Ding Title: Salutation: Ms. Last Name: Hang Middle Name: First Name: Ding Department: Mobile: Direct FAX: (8610) 88142004 Direct tel: (8610) 88142010 Personal E-Mail: [email protected]

PROJECT DESIGN DOCUMENT FORM (CDM PDD) - Version 03 CDM – Executive Board page 54 Organization: LUSO Carbon Fund, Ecoprogresso Consultrores Street/P.O.Box: Av.da Igreja Building: 42 – 10º Dto City: Lisboa State/Region: Postfix/ZIP: 1700-239 Country: Portugal Telephone: +(351) 217 981 210 FAX: +(351) 217 981 219 E-Mail: URL: www.ecoprogresso.ptRepresented by: Pedro Mateus Title: Salutation: Mr. Last Name: Mateus Middle Name: First Name: Pedro Department: Mobile: Direct FAX: Direct tel: Personal E-Mail: [email protected]
PROJECT DESIGN DOCUMENT FORM (CDM PDD) - Version 03 CDM – Executive Board page 55
Annex 2
INFORMATION REGARDING PUBLIC FUNDING
The financial plans for the Project do not involve any public funding from Annex 1 countries.
Annex 3
BASELINE INFORMATION
Baseline data and information can be found in B.6. TABLES OF OPERATING MARGING AND BUILD MARGIN CALCULATIONS
(i) Operating Margin:
OM = Total emissions 2003, 2004, 2005/Total power output 2002, 2003, 2004
1.0425
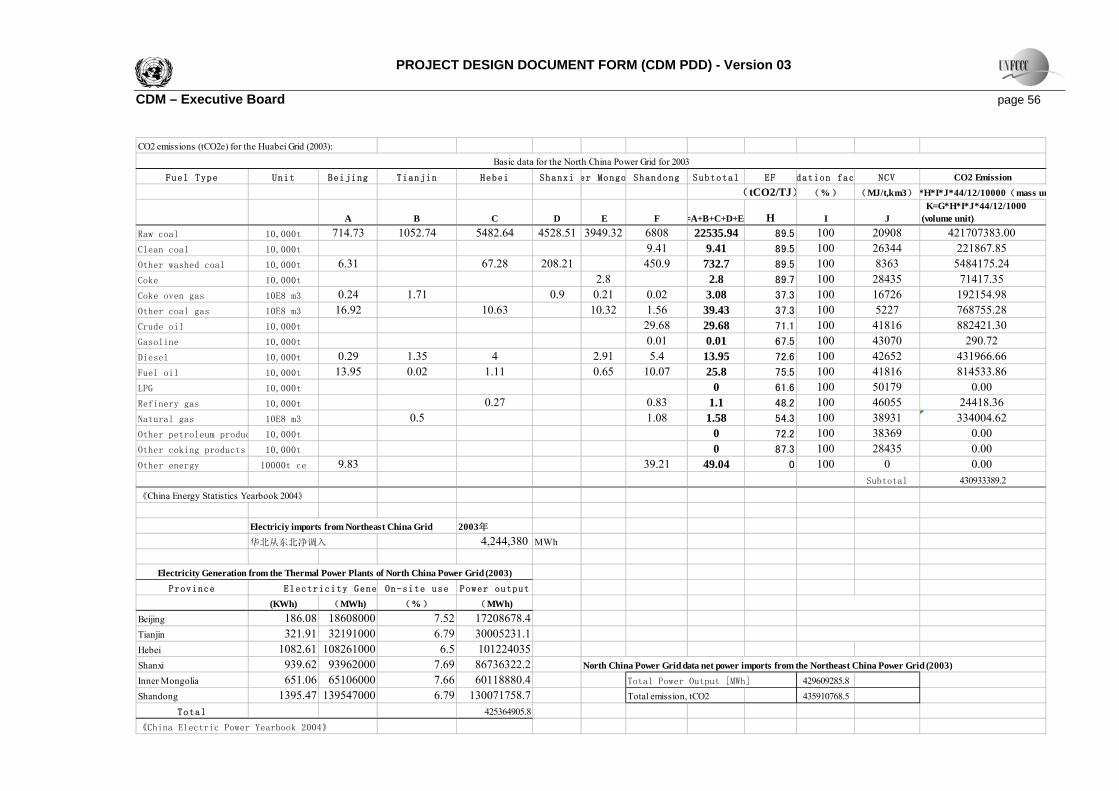
PROJECT DESIGN DOCUMENT FORM (CDM PDD) - Version 03 CDM – Executive Board page 56 CO2 emissions (tCO2e) for the Huabei Grid (2003):
Fuel Type Unit Beijing Tianjin Hebei Shanxi er Mongo Shandong Subtotal EF dation fac NCV CO2 Emission(tCO2/TJ) (%) (MJ/t,km3) *H*I*J*44/12/10000(mass un
A B C D E F =A+B+C+D+E+ H I J K=G*H*I*J*44/12/1000(volume unit)
Raw coal 10,000t 714.73 1052.74 5482.64 4528.51 3949.32 6808 22535.94 89.5 100 20908 421707383.00Clean coal 10,000t 9.41 9.41 89.5 100 26344 221867.85Other washed coal 10,000t 6.31 67.28 208.21 450.9 732.7 89.5 100 8363 5484175.24Coke 10,000t 2.8 2.8 89.7 100 28435 71417.35Coke oven gas 10E8 m3 0.24 1.71 0.9 0.21 0.02 3.08 37.3 100 16726 192154.98Other coal gas 10E8 m3 16.92 10.63 10.32 1.56 39.43 37.3 100 5227 768755.28Crude oil 10,000t 29.68 29.68 71.1 100 41816 882421.30Gasoline 10,000t 0.01 0.01 67.5 100 43070 290.72Diesel 10,000t 0.29 1.35 4 2.91 5.4 13.95 72.6 100 42652 431966.66Fuel oil 10,000t 13.95 0.02 1.11 0.65 10.07 25.8 75.5 100 41816 814533.86LPG 10,000t 0 61.6 100 50179 0.00Refinery gas 10,000t 0.27 0.83 1.1 48.2 100 46055 24418.36Natural gas 10E8 m3 0.5 1.08 1.58 54.3 100 38931 334004.62Other petroleum produc 10,000t 0 72.2 100 38369 0.00Other coking products 10,000t 0 87.3 100 28435 0.00Other energy 10000t ce 9.83 39.21 49.04 0 100 0 0.00
Subtotal 430933389.2
《China Energy Statistics Yearbook 2004》
Electriciy imports from Northeast China Grid 2003年华北从东北净调入 4,244,380 MWh
Province Electricity Gene On-site use Power output
(KWh) (MWh) (%) (MWh)Beijing 186.08 18608000 7.52 17208678.4Tianjin 321.91 32191000 6.79 30005231.1Hebei 1082.61 108261000 6.5 101224035Shanxi 939.62 93962000 7.69 86736322.2 North China Power Grid data net power imports from the Northeast China Power Grid (2003)Inner Mongolia 651.06 65106000 7.66 60118880.4 Total Power Output [MWh] 429609285.8Shandong 1395.47 139547000 6.79 130071758.7 Total emission, tCO2 435910768.5
Total 425364905.8
《China Electric Power Yearbook 2004》
Basic data for the North China Power Grid for 2003
Electricity Generation from the Thermal Power Plants of North China Power Grid (2003)

PROJECT DESIGN DOCUMENT FORM (CDM PDD) - Version 03 CDM – Executive Board page 57 CO2 emissions (tCO2e) for the Huabei Grid (2004):
Fuel Type Unit Beijing Tianjin Hebei Shanxi er Mongo Shandong Subtotal EF dation fac NCV CO2 Emission(tCO2/TJ) (%) (MJ/t,km3) *H*I*J*44/12/10000(mass un
A B C D E F =A+B+C+D+E+ H I J K=G*H*I*J*44/12/1000(volume unit)
Raw coal 10,000t 823.09 1410 6299.8 5213.2 4932.2 8550 27228.29 89.5 100 20908 509513733.2Clean coal 10,000t 40 40 89.5 100 26344 943115.2Other washed coal 10,000t 6.48 101.04 354.17 284.22 745.91 89.5 100 8363 5583050.57Coke 10,000t 0.22 0.22 89.7 100 28435 5611.3629Coke oven gas 10E8 m3 0.55 0.54 5.32 0.4 8.73 15.54 37.3 100 16726 969509.2092Other coal gas 10E8 m3 17.74 24.25 8.2 16.47 1.41 68.07 37.3 100 5227 1327141.05Crude oil 10,000t 0 71.1 100 41816 0Gasoline 10,000t 67.5 100 43070 0Diesel 10,000t 0.39 0.84 4.66 5.89 72.6 100 42652 182385.9233Fuel oil 10,000t 14.66 0.16 14.82 75.5 100 41816 467883.4056LPG 10,000t 0 61.6 100 50179 0Refinery gas 10,000t 0.55 1.42 1.97 48.2 100 46055 43731.0647Natural gas 10E8 m3 0.37 0.19 0.56 54.3 100 38931 118381.3848Other petroleum produc 10,000t 0 72.2 100 38369 0Other coking products 10,000t 0 87.3 100 28435 0Other energy 10000t ce 9.41 34.64 109.73 4.48 158.26 0 100 0 0
Subtotal 519154542.3
《China Energy Statistics Yearbook 2005》Electriciy imports from Northeast China Grid 2004年华北从东北净调入 4,514,550
Province 发电量 icity Gene On-site use Power output
(亿kWh) (MWh) (%) (MWh)Beijing 185.79 18579000 7.94 17,103,827Tianjin 339.52 33952000 6.35 31,796,048Hebei 1249.7 124970000 6.5 116,846,950 North China Power Grid data net power imports from the Northeast China Power Grid (2004)Shanxi 1049.26 104926000 7.7 96,846,698 Total Power Output [MWh] 493687659.9Inner Mongolia 804.27 80427000 7.17 74,660,384 Total emission, tCO2 524448749.7Shandong 1639.18 163918000 7.32 151,919,202
Total 489,173,110《China Electric Power Yearbook 2005》
Basic data for the North China Power Grid for 2004
Electricity Generation from the Thermal Power Plants of North China Power Grid (2004)
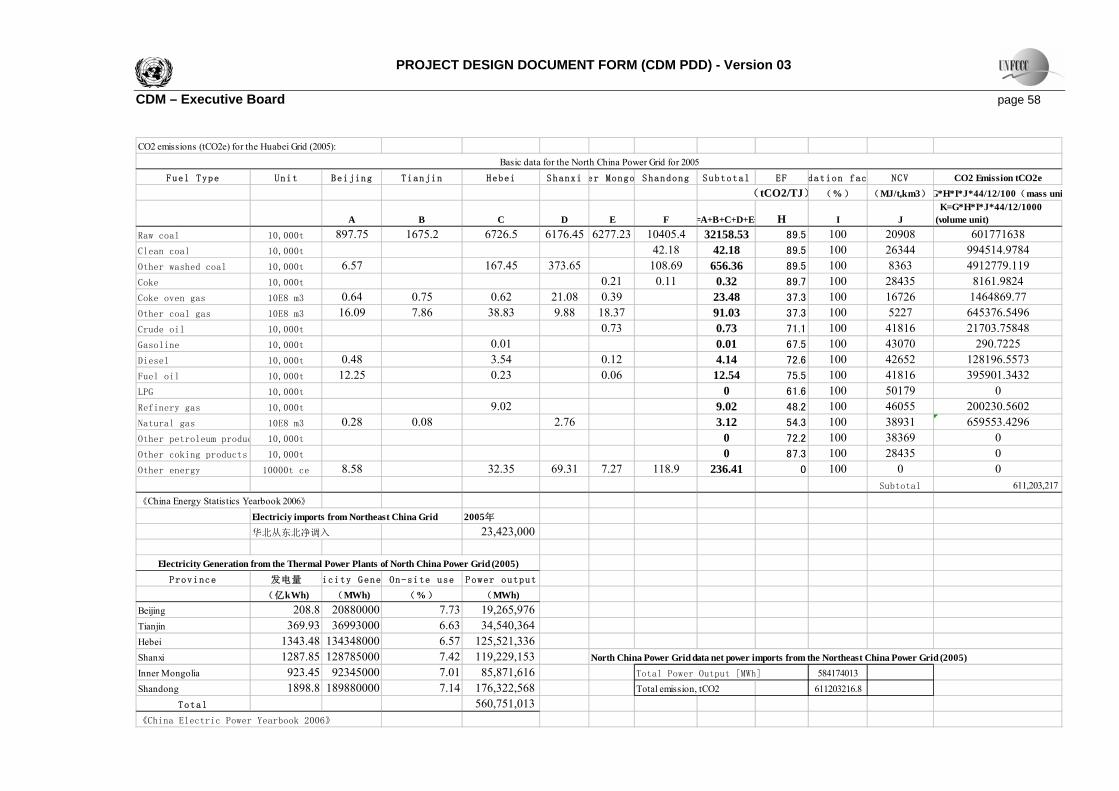
PROJECT DESIGN DOCUMENT FORM (CDM PDD) - Version 03 CDM – Executive Board page 58 CO2 emissions (tCO2e) for the Huabei Grid (2005):
Fuel Type Unit Beijing Tianjin Hebei Shanxi er Mongo Shandong Subtotal EF dation fac NCV CO2 Emission tCO2e(tCO2/TJ) (%) (MJ/t,km3)G*H*I*J*44/12/100(mass uni
A B C D E F =A+B+C+D+E+ H I J K=G*H*I*J*44/12/1000(volume unit)
Raw coal 10,000t 897.75 1675.2 6726.5 6176.45 6277.23 10405.4 32158.53 89.5 100 20908 601771638Clean coal 10,000t 42.18 42.18 89.5 100 26344 994514.9784Other washed coal 10,000t 6.57 167.45 373.65 108.69 656.36 89.5 100 8363 4912779.119Coke 10,000t 0.21 0.11 0.32 89.7 100 28435 8161.9824Coke oven gas 10E8 m3 0.64 0.75 0.62 21.08 0.39 23.48 37.3 100 16726 1464869.77Other coal gas 10E8 m3 16.09 7.86 38.83 9.88 18.37 91.03 37.3 100 5227 645376.5496Crude oil 10,000t 0.73 0.73 71.1 100 41816 21703.75848Gasoline 10,000t 0.01 0.01 67.5 100 43070 290.7225Diesel 10,000t 0.48 3.54 0.12 4.14 72.6 100 42652 128196.5573Fuel oil 10,000t 12.25 0.23 0.06 12.54 75.5 100 41816 395901.3432LPG 10,000t 0 61.6 100 50179 0Refinery gas 10,000t 9.02 9.02 48.2 100 46055 200230.5602Natural gas 10E8 m3 0.28 0.08 2.76 3.12 54.3 100 38931 659553.4296Other petroleum produc 10,000t 0 72.2 100 38369 0Other coking products 10,000t 0 87.3 100 28435 0Other energy 10000t ce 8.58 32.35 69.31 7.27 118.9 236.41 0 100 0 0
Subtotal 611,203,217
《China Energy Statistics Yearbook 2006》Electriciy imports from Northeast China Grid 2005年华北从东北净调入 23,423,000
Province 发电量 icity Gene On-site use Power output
(亿kWh) (MWh) (%) (MWh)Beijing 208.8 20880000 7.73 19,265,976Tianjin 369.93 36993000 6.63 34,540,364Hebei 1343.48 134348000 6.57 125,521,336Shanxi 1287.85 128785000 7.42 119,229,153 North China Power Grid data net power imports from the Northeast China Power Grid (2005)Inner Mongolia 923.45 92345000 7.01 85,871,616 Total Power Output [MWh] 584174013Shandong 1898.8 189880000 7.14 176,322,568 Total emission, tCO2 611203216.8
Total 560,751,013《China Electric Power Yearbook 2006》
Electricity Generation from the Thermal Power Plants of North China Power Grid (2005)
Basic data for the North China Power Grid for 2005
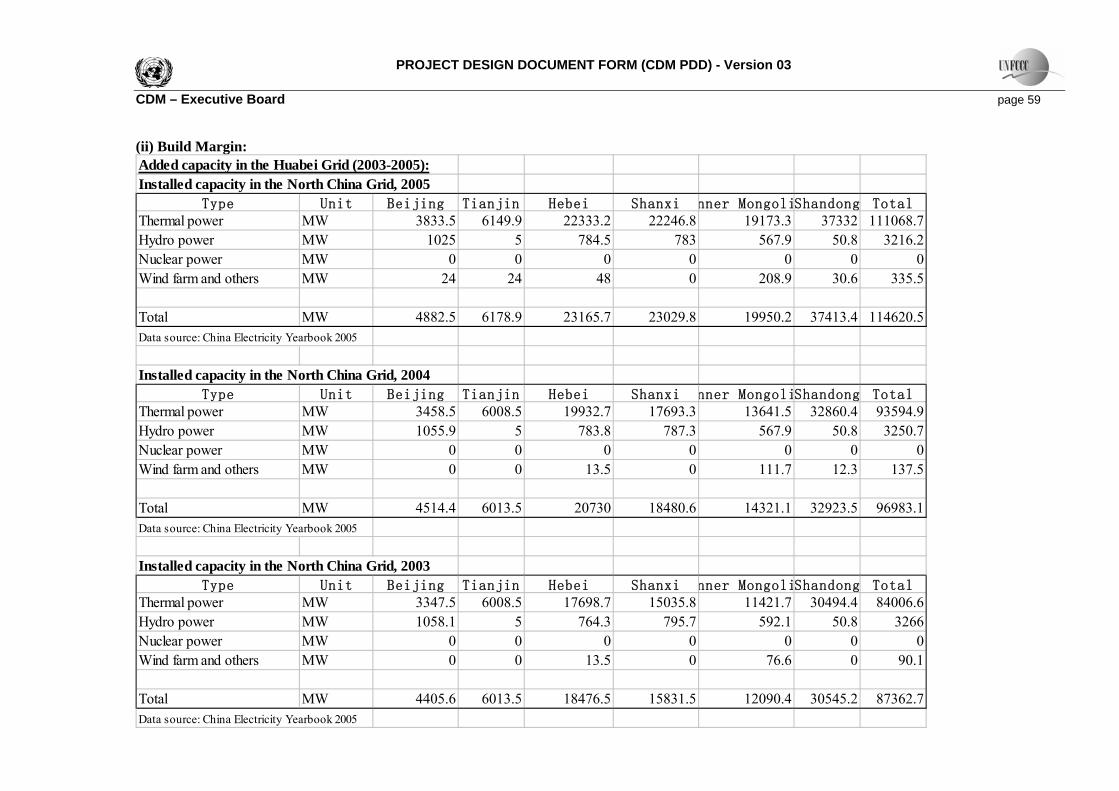
PROJECT DESIGN DOCUMENT FORM (CDM PDD) - Version 03 CDM – Executive Board page 59 (ii) Build Margin: Added capacity in the Huabei Grid (2003-2005):Installed capacity in the North China Grid, 2005
Type Unit Beijing Tianjin Hebei Shanxi nner MongoliShandong TotalThermal power MW 3833.5 6149.9 22333.2 22246.8 19173.3 37332 111068.7Hydro power MW 1025 5 784.5 783 567.9 50.8 3216.2Nuclear power MW 0 0 0 0 0 0 0Wind farm and others MW 24 24 48 0 208.9 30.6 335.5
Total MW 4882.5 6178.9 23165.7 23029.8 19950.2 37413.4 114620.5Data source: China Electricity Yearbook 2005
Installed capacity in the North China Grid, 2004Type Unit Beijing Tianjin Hebei Shanxi nner MongoliShandong Total
Thermal power MW 3458.5 6008.5 19932.7 17693.3 13641.5 32860.4 93594.9Hydro power MW 1055.9 5 783.8 787.3 567.9 50.8 3250.7Nuclear power MW 0 0 0 0 0 0 0Wind farm and others MW 0 0 13.5 0 111.7 12.3 137.5
Total MW 4514.4 6013.5 20730 18480.6 14321.1 32923.5 96983.1Data source: China Electricity Yearbook 2005
Installed capacity in the North China Grid, 2003Type Unit Beijing Tianjin Hebei Shanxi nner MongoliShandong Total
Thermal power MW 3347.5 6008.5 17698.7 15035.8 11421.7 30494.4 84006.6Hydro power MW 1058.1 5 764.3 795.7 592.1 50.8 3266Nuclear power MW 0 0 0 0 0 0 0Wind farm and others MW 0 0 13.5 0 76.6 0 90.1
Total MW 4405.6 6013.5 18476.5 15831.5 12090.4 30545.2 87362.7Data source: China Electricity Yearbook 2005
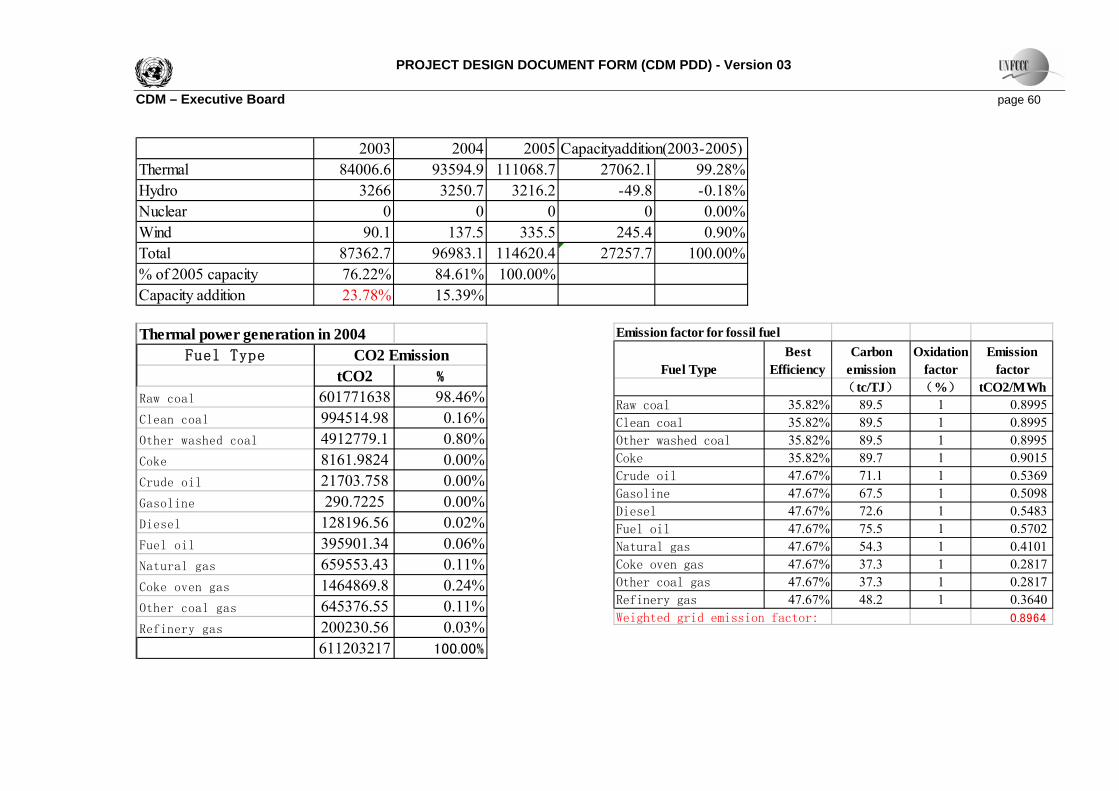
PROJECT DESIGN DOCUMENT FORM (CDM PDD) - Version 03 CDM – Executive Board page 60
2003 2004 2005 Capacityaddition(2003-2005)Thermal 84006.6 93594.9 111068.7 27062.1 99.28%Hydro 3266 3250.7 3216.2 -49.8 -0.18%Nuclear 0 0 0 0 0.00%Wind 90.1 137.5 335.5 245.4 0.90%Total 87362.7 96983.1 114620.4 27257.7 100.00%% of 2005 capacity 76.22% 84.61% 100.00%Capacity addition 23.78% 15.39% Thermal power generation in 2004
Fuel Type
tCO2 %
Raw coal 601771638 98.46%Clean coal 994514.98 0.16%Other washed coal 4912779.1 0.80%Coke 8161.9824 0.00%Crude oil 21703.758 0.00%Gasoline 290.7225 0.00%Diesel 128196.56 0.02%Fuel oil 395901.34 0.06%Natural gas 659553.43 0.11%Coke oven gas 1464869.8 0.24%Other coal gas 645376.55 0.11%Refinery gas 200230.56 0.03%
611203217 100.00%
CO2 EmissionEmission factor for fossil fuel
Fuel TypeBest
EfficiencyCarbon
emissionOxidation
factorEmission
factor(tc/TJ) (%) tCO2/MWh
Raw coal 35.82% 89.5 1 0.8995Clean coal 35.82% 89.5 1 0.8995Other washed coal 35.82% 89.5 1 0.8995Coke 35.82% 89.7 1 0.9015Crude oil 47.67% 71.1 1 0.5369Gasoline 47.67% 67.5 1 0.5098Diesel 47.67% 72.6 1 0.5483Fuel oil 47.67% 75.5 1 0.5702Natural gas 47.67% 54.3 1 0.4101Coke oven gas 47.67% 37.3 1 0.2817Other coal gas 47.67% 37.3 1 0.2817Refinery gas 47.67% 48.2 1 0.3640
Weighted grid emission factor: 0.8964

PROJECT DESIGN DOCUMENT FORM (CDM PDD) - Version 03 CDM – Executive Board page 61
2003
Newaddedcapacity 2004 2005
87362.7 27257.8 96983.1 114620.584006.6 27062.1 93594.9 111068.73266 -49.8 3250.7 3216.223.78% 15.39%
99.28%
Total installed capacityThermal power installed capacity
0.8964
Hydro power installed capacityTotal change
Thermal split of new capacity Weighted emission factor (tCO2/MWh)
Build margin emission factor 0.8899
This has been completed in section B.7.
Annex 4
MONITORING INFORMATION
- - - - -