aberdeen breakfast briefing – cost efficiency - oil & gas...
TRANSCRIPT

Aberdeen Breakfast Briefing – Cost Efficiency

Aberdeen Breakfast Briefing - Cost Efficiency
Oonagh Werngren MBE Operations Directorate
Oil & Gas UK

Scale of issues
• Over 4,400 UK jobs lost – 30 Companies • 40,000 global jobs lost – Operators and Tier 1 Contractors
- (100,000 global jobs estimated by Douglas-Westwood)
• £1.9bn reduction in spend by UK Operators • £20.5bn cuts globally by Majors will impact UK • Offshore rotas – move to 3:3 by 6 UK Operators • UK Contractor Rate cuts 10 - 20% • UK staff salary cut -5% • 10 rigs stacked in the UK • 34 rigs to be scrapped globally • UK projects being stalled • Company mergers

Aberdeen Breakfast Briefing - Cost Efficiency
Chaired by Oonagh Werngren, Oil & Gas UK
This morning’s speakers are …
Dan Cole, Mckinsey & Company
Gordon Ballard, Schlumberger UK
Paul Warwick, Talisman Energy Inc.

The scale of the challenge
Dan Cole Mckinsey & Company

Cost efficiency: the scale of the challenge Oil & Gas UK – breakfast briefing
Aberdeen 6 May 2015
CONFIDENTIAL AND PROPRIETARY Any use of this material without specific permission of McKinsey & Company is strictly prohibited

McKinsey & Company | McKinsey & Company 7 7 | McKinsey & Company
The cost challenge in the UKCS
21
18
12
2.5
Percent Annual inflation rates, 2000–14
Big Mac
North Sea platform lifting costs1
UK lifting cost per barrel of oil equivalent (2004–14)2
UK development cost per barrel of oil equivalent (2004–13)2
SOURCE: McKinsey’s Energy Insight Offshore Operations Benchmarking Database; Oil & Gas UK Activity Surveys
1 Unweighted average of total lifting cost for 17 UKCS North Sea platforms (total cost, not cost per barrel) 2 Weighted average

McKinsey & Company | McKinsey & Company 8 8 | McKinsey & Company
The increase was largely unforeseen
SOURCE: Oil & Gas UK 2012 Economic Reports and 2015 Activity Survey
Growth in operating cost forecast from UKCS operators GBP billions
9.0
8.0
7.0
6.0
5.0
4.0
3.0
2.0
1.0
0.0
2013 actual (8.9) 2014 actual (9.6)
01 2003 2005 2007 2009 2011 2013 2015 2017 2019

McKinsey & Company | McKinsey & Company 9 9 | McKinsey & Company
The fall in oil price has made the North Sea a lot less profitable
USD 99 bbl 88
54 USD 55 bbl
SOURCE: WoodMac GEM (2015); McKinsey analysis
1 Price below which NPV of the remaining reserves of the field will be zero based on end 2014 cost and production forecast.
Share of UKCS production that breaks even1 Oil price

McKinsey & Company | McKinsey & Company 10 10 | McKinsey & Company
- 4.0%
Cost increase not due to increased activity …
Helicopter hours Hours
Wells drilled Number
+1.5%
SOURCE: McKinsey Energy Insights
Deck cargo shipped Tonnes
+2.0%
McKinsey & Company | McKinsey & Company 11 11 | McKinsey & Company
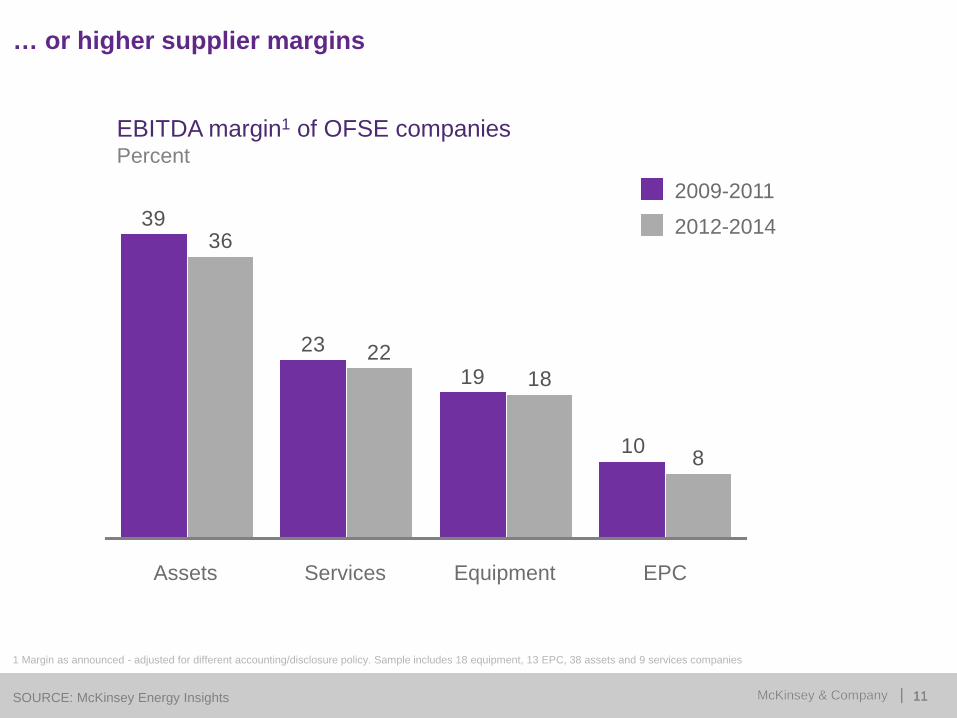
… or higher supplier margins
1 Margin as announced - adjusted for different accounting/disclosure policy. Sample includes 18 equipment, 13 EPC, 38 assets and 9 services companies
SOURCE: McKinsey Energy Insights
EBITDA margin1 of OFSE companies Percent
10
1923
39
8
1822
36
Assets EPC Services Equipment
2012-2014
2009-2011
McKinsey & Company | McKinsey & Company 12 12 | McKinsey & Company
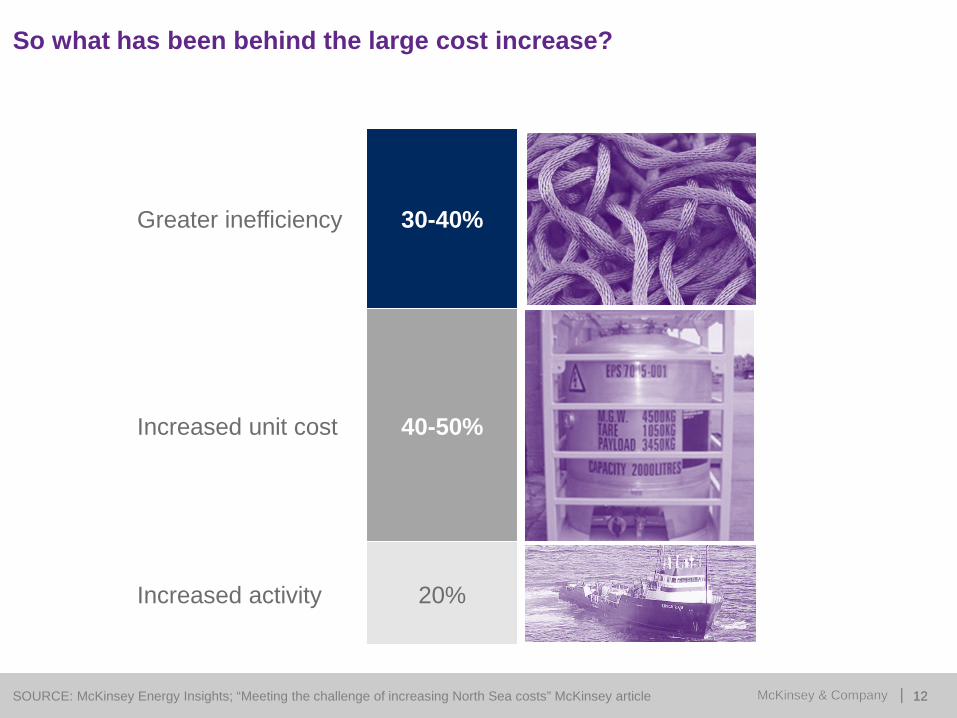
So what has been behind the large cost increase?
Increased unit cost
Increased activity
Greater inefficiency
20%
40-50%
30-40%
SOURCE: McKinsey Energy Insights; “Meeting the challenge of increasing North Sea costs” McKinsey article

McKinsey & Company | McKinsey & Company 13 13 | McKinsey & Company
Opex example: integrity inspections cost
SOURCE: Sanitised client example
Comparison of topsides integrity inspection costs per asset GBP thousands per installation, gross
McKinsey & Company | McKinsey & Company 14 14 | McKinsey & Company
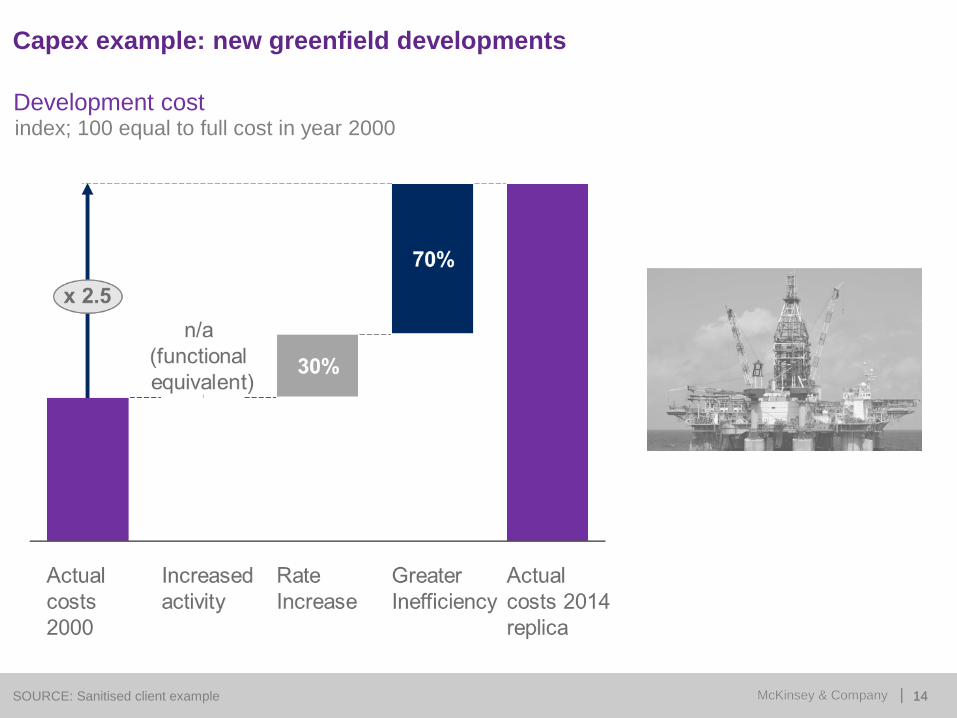
Capex example: new greenfield developments
SOURCE: Sanitised client example
Development cost index; 100 equal to full cost in year 2000

McKinsey & Company | McKinsey & Company 15 15 | McKinsey & Company
This is something other highly technical industries appear to have avoided
Nominal price inflation for a new commercial airliner
Nominal price inflation for a new 5-door hatchback in Western Europe
+ 0.2 – 1.5% + 1.0%
SOURCE: A2Mac1; manufacturer’s public data; Airline Monitor: McKinsey analysis

McKinsey & Company | McKinsey & Company 16 16 | McKinsey & Company
Recap
Industry Efficiency
Gordon Ballard Chairman
Schlumberger UK

Industry Efficiency Gordon Ballard Schlumberger 6 May 2015

This industry is a national asset
20
It’s worth fighting for!

Where we are……
Production Exploration Wells
OPEX CAPEX

No other basin in the world has seen such rapid cost inflation
22

It’s more than just production at risk – the supply chain is too
Billions in income tax and national insurance

Bold and immediate action is required
• Unless the UKCS adapts rapidly to the prevailing business environment, it will be a much smaller and greatly diminished industry by 2020
• Action now will ensure that the UKCS is as active in 2020 as it has been over the last decade
• The 2020 vision
- Actively exploring and maximising recovery of oil and gas - A supply chain providing a strong engine for growth - Lifting costs contained at around $20 per barrel

Ongoing Actions

Other Industry Initiatives
• Energy Jobs Taskforce - Scottish Enterprise, Highland & Island Enterprise - practical support & advice; promoting & defining good practice - Scottish Manufacturing Advisory Service (SMAS) - Working with Scottish industrial sector to drive efficiency and productivity
• Step Change in Safety - Safety standardisation – challenge the multiplicity of different safety schemes and initiatives
• The Oil & Gas Industry Council - PWC x-Industry Study - project to identify pragmatic lessons in
improving operations efficiency from across relevant industry sectors.

Cost Efficiency - Schlumberger
Cost Base Management: Manage Cost vs Operating Activity
Inventory & Asset Management
Facility Rationalisation
Sourcing and Distribution
Workforce Utilisation
41% Improvement

Distribution - Schlumberger
DSC provides a replenishment centre closer to point of use
At a local level • Single point of contacts
• Delivery KPI on E2E performance
• Logistics and Materials consolidation
DSC Functions: • Centralised Stock
• Inventory Control
• Network Optimisation
• Order Tracking and Expediting
• Global Traceability
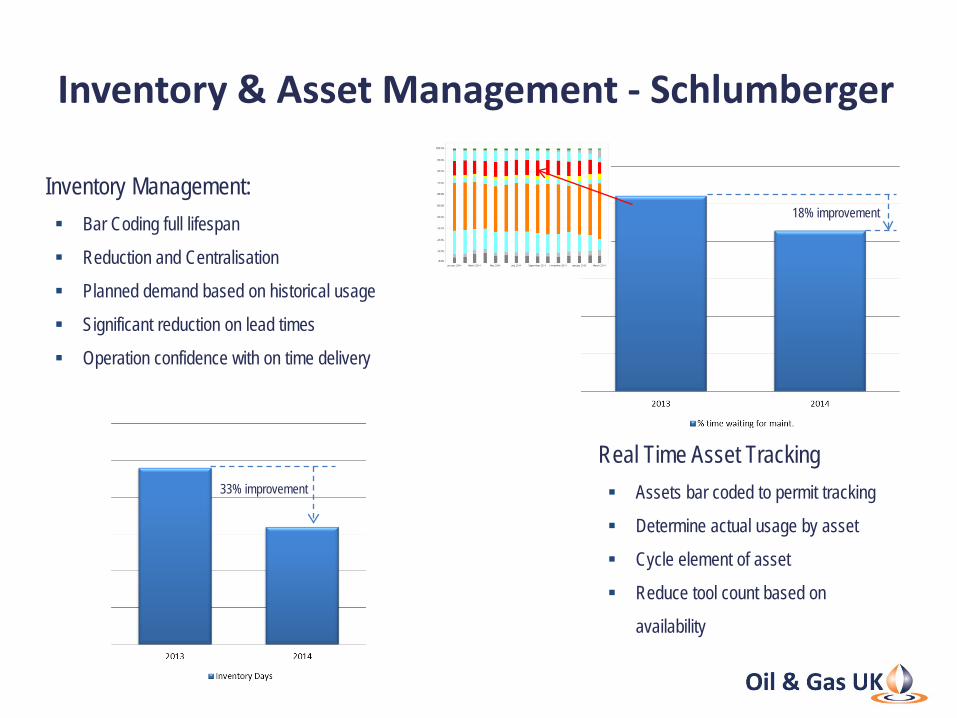
Inventory & Asset Management - Schlumberger
Inventory Management: Bar Coding full lifespan
Reduction and Centralisation
Planned demand based on historical usage
Significant reduction on lead times
Operation confidence with on time delivery
Real Time Asset Tracking Assets bar coded to permit tracking
Determine actual usage by asset
Cycle element of asset
Reduce tool count based on
availability
18% improvement
33% improvement
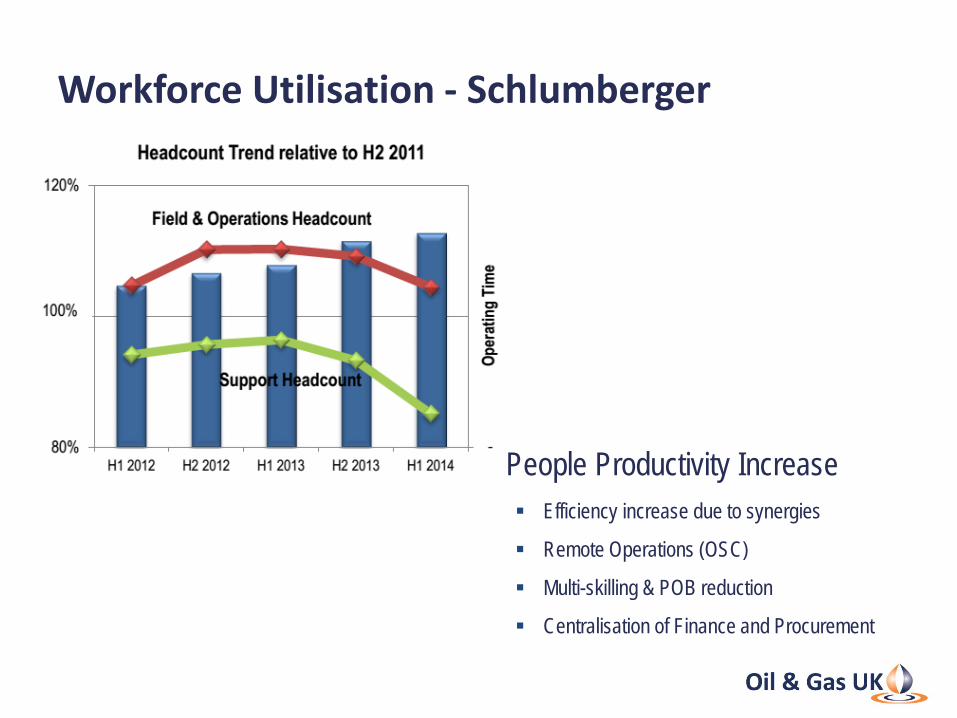
Workforce Utilisation - Schlumberger
People Productivity Increase Efficiency increase due to synergies
Remote Operations (OSC)
Multi-skilling & POB reduction
Centralisation of Finance and Procurement
Everyone has a part to play.
We need to: Re-create a competitive basin and industry
Learn from other Industries
Initiate structural and sustainable change Challenge behaviours

Cost Efficiency in a complex basin - An Operator in action
Paul Warwick
Executive Vice President Europe-Atlantic Talisman Energy Inc.
Cost Efficiency in a complex basin
April 2015

34 NYSE : TLM | TSX : TLM www.talisman-energy.com
Complex late life assets
▪ The case for change is very strong
▪ Aim high: wholesale transformation
▪ Intensively manage the changes
▪ Make change sustainable
35 NYSE : TLM | TSX : TLM www.talisman-energy.com
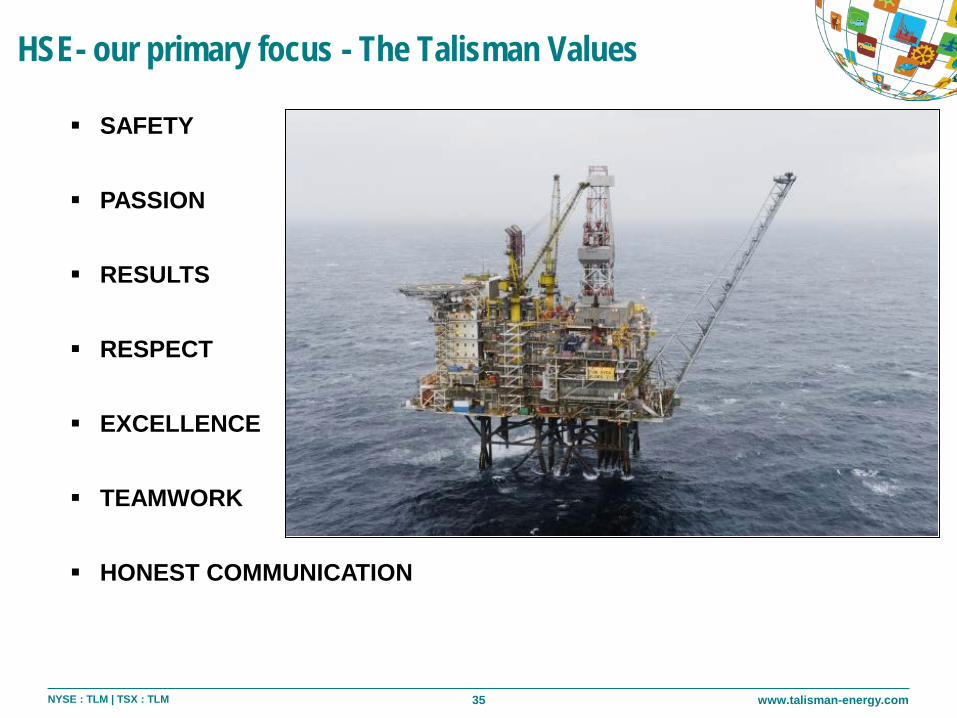
HSE- our primary focus - The Talisman Values
SAFETY
PASSION
RESULTS
RESPECT
EXCELLENCE
TEAMWORK
HONEST COMMUNICATION

36 NYSE : TLM | TSX : TLM www.talisman-energy.com
Gyda Process Systems & Surrounding Infrastructure
M
M
M M
GYDA GAS PIPELINE (TALISMAN)
EKOFISK PLATFORM
(CONOCO PHILLIPS)
GYDA RESERVOIR
(TALISMAN)
GYDA WELLS
ULA PLATFORM (BP) UGIP PIPELINE (BP)
GYDA OIL PIPELINE
(BP)
TAMBAR PLATFORM
(BP)
BLANE FIELD
(TALISMAN)
OSELVAR FIELD (DONG)
ULA OIL PIPELINE (BP)
HP SEPARATOR
LP SEPARATOR
GYDA PROCESS FACILITIES
(TALISMAN)
M
M
FUEL GAS
TEST SEPARATOR
GAS DEHYDRATION & COMPRESSION
GAS LIFT COMPRESSORS
PRODUCED WATER TREATMENT &
DISPOSAL
SEAWATER LIFT, FILTRATION & DEAERATION
WATER INJECTION PUMPS
MOL PUMPS & METERING
GAS EXPORT METERING
TO COOLING MEDIUM & UTILITIES
37 NYSE : TLM | TSX : TLM www.talisman-energy.com
The Talisman approach to improvements made Strong Leadership and Focus
Engage and enable the organisation
Ensure sustainability: HSE – Cost – Regularity
Continual challenge:
Reward Achievements
Contractor improvements must be addressed
Break down barriers and be flexible on use of resources
Fix the Basics
Establish standards
Regenerate critical infrastructure

38 NYSE : TLM | TSX : TLM www.talisman-energy.com
0
5
10
15
20
25
30
35
2008 2010 2011 (Q1) 2011 2012
21
Gyda offshore manning levels
32
19
24 22
Asset OPEX Budget [mm$]
Gyda 70
Brage 1.484
Veslefrikk 141.6

39 NYSE : TLM | TSX : TLM www.talisman-energy.com
Gyda – “The Best Place To Be” For our Employees
For our Suppliers
For a future Tie-In customer
The Gyda Experience
Sustainable, Safe and Efficient Operations
Prudent Hub, focused on delivering results and driving change
Co-operative and proficient approach in daily follow-through of activities
Strong HSE focus
High Facility uptime
Cost conscious approach

40 NYSE : TLM | TSX : TLM www.talisman-energy.com
-Minimum manning spec -New criticality assessment
-New maintenance strategy
-Reduced Manning -PM reduction -Cost reduction
-Total mhr reduction -Improved backlog
-Legislated Classification -Steady low mhr consumption -Zero safety critical backlog
Implementation and Opex reduction
29
33
30
32
20
26
31 29
15
17
19
21
23
25
27
29
31
33
35
2007 2008 2009 2010 2011 2012 2013 2014
Mill
ions
$

41 NYSE : TLM | TSX : TLM www.talisman-energy.com
AE country averages by year % estimated production potential
Average estimated inflation rate % 2003-2013
Brent, WTI prices and futures US$
Asset Efficiency is dropping Costs have soared Oil price looks set to remain low
70
75
80
85
90
95
0 5 10 15 20 25
NCS (Year 0 = 2003)
UKCS (Year 0 = 1993)
2.71.8
North Sea CAPEX
16-20
North Sea OPEX
10-12
UK CPI
Norway CPI
The case for change is very strong: Our industry in the North Sea faces a real challenge
130
90
120 110 100
80 70 60 0 2012 2020
42 NYSE : TLM | TSX : TLM www.talisman-energy.com
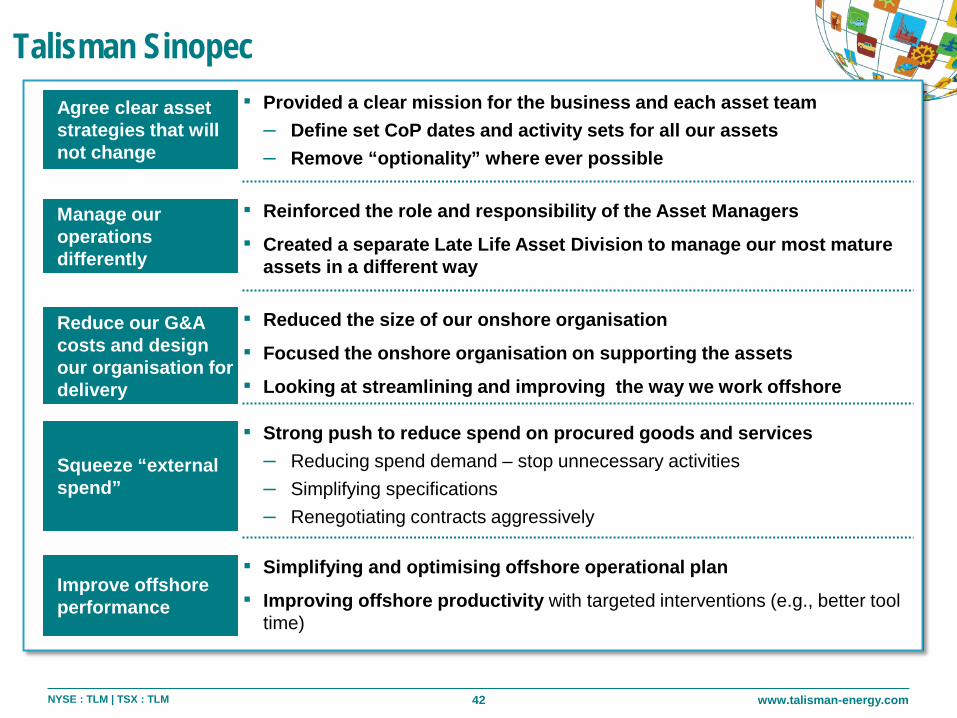
Talisman Sinopec Agree clear asset strategies that will not change
▪ Provided a clear mission for the business and each asset team – Define set CoP dates and activity sets for all our assets – Remove “optionality” where ever possible
Manage our operations differently
▪ Reinforced the role and responsibility of the Asset Managers
▪ Created a separate Late Life Asset Division to manage our most mature assets in a different way
Reduce our G&A costs and design our organisation for delivery
▪ Reduced the size of our onshore organisation
▪ Focused the onshore organisation on supporting the assets
▪ Looking at streamlining and improving the way we work offshore
Squeeze “external spend”
▪ Strong push to reduce spend on procured goods and services – Reducing spend demand – stop unnecessary activities – Simplifying specifications – Renegotiating contracts aggressively
Improve offshore performance
▪ Simplifying and optimising offshore operational plan
▪ Improving offshore productivity with targeted interventions (e.g., better tool time)

43 NYSE : TLM | TSX : TLM www.talisman-energy.com
We are managing the change rigorously
Defined stage gates to collect and work up interventions
L2 L3
L4 L5
L1
Impact accrued
Impact accruing
Initiatives being
planned and
prepared for approval
Initiatives in imple-
mentation
Ideas being
turned into initiatives
Major activities completed
Fully realized
Approved for implementation
Prioritised for plan-ning
Idea sized
Core meetings
Workstream check-in (as needed, multiple times a week)
Cross-cutting check-in (30mins)
TO with Workstreams (90 mins per workstream)
MD catch-up (30 minutes)
Core Group1 meeting (~2 hours)
Board update (30 mins)
Mon Tue Wed Thu Fri
An aggressive, weekly schedule to monitor progress
44 NYSE : TLM | TSX : TLM www.talisman-energy.com
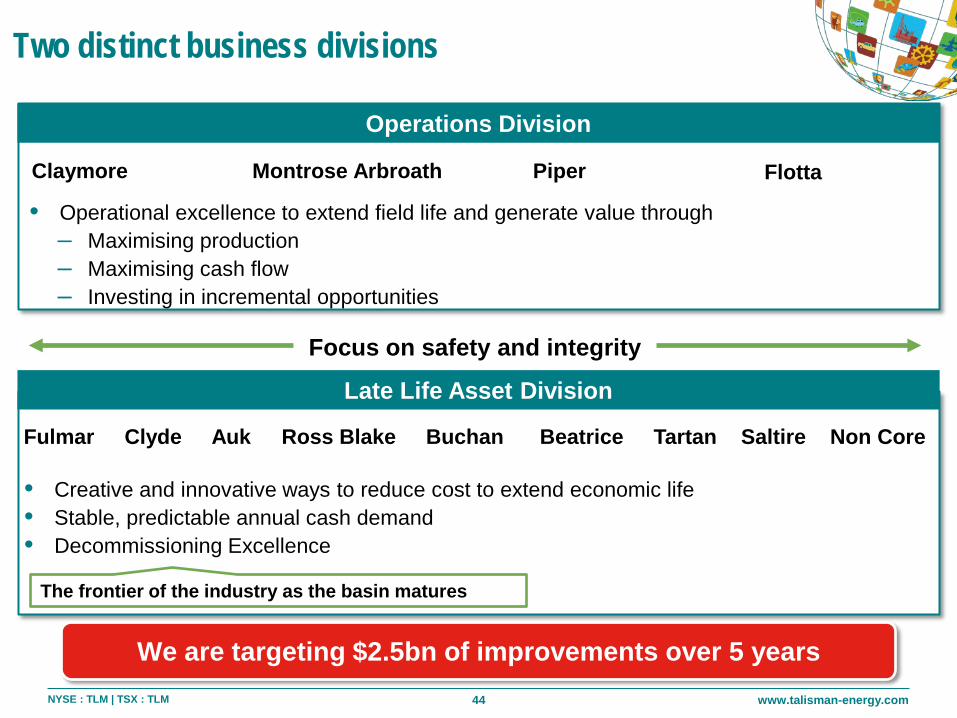
Focus on safety and integrity
Two distinct business divisions
Montrose Arbroath Claymore Piper Flotta
• Creative and innovative ways to reduce cost to extend economic life • Stable, predictable annual cash demand • Decommissioning Excellence
• Operational excellence to extend field life and generate value through – Maximising production – Maximising cash flow – Investing in incremental opportunities
The frontier of the industry as the basin matures
Late Life Asset Division
Fulmar Clyde Auk Ross Blake Buchan Beatrice Tartan Saltire Non Core
Operations Division
We are targeting $2.5bn of improvements over 5 years

45 NYSE : TLM | TSX : TLM www.talisman-energy.com
Aberdeen Breakfast Briefing – Cost Efficiency

Aberdeen Breakfast Briefing - Cost Efficiency
Chaired by Oonagh Werngren, Oil & Gas UK
This morning’s panelists are …
Dan Cole, Mckinsey & Company
Gordon Ballard, Schlumberger UK
Paul Warwick, Talisman Energy Inc.
Colette Cohen, Centrica E&P

Forthcoming Events – 2015 • 19 May Breakfast Briefing - Cost Efficiency (London) • 19 May EU Directive Seminar (Aberdeen)
• 21 May Training Course: Supply Chain Solutions (Aberdeen)
• 02 June Aviation Seminar (Aberdeen)
• 17- 18 June The Oil and Gas Industry Conference (Aberdeen)
• 30 June Oil & Gas UK Members Speed Networking (London)
• 30 June Supply Chain Seminar (Aberdeen)
Visit: www.oilandgasuk.co.uk
