aberforth uk small companies fund objective of aberforth uk small companies fund ... manager’s...
TRANSCRIPT

Aberforth UK Small Companies Fund
Annual Report and Financial Statements31 December 2015
130928 AFUND AR Cov PRINT_130928 AFUND Cov V9 28/01/2016 13:35 Page 1

12 13 14 15111009080706
Cancella on Price to Cancella on Price v Benchmark
80
85
90
95
100
105
12 13 14 15111009080706
Cancella on Price to Cancella on Price Benchmark
50
100
150
200
250
300
350
Investment Objective & Policy
The objective of Aberforth UK Small Companies Fund (the “Fund”) is to achieve a total return(with income reinvested) greater than on the Numis Smaller Companies Index (excludingInvestment Companies) over the long term by investing in a diversified portfolio of small UKquoted companies.
Ten Year Investment Record
Absolute Performance(figures are total returns and have been rebased to 100 at 31 Dec 2005)
Relative Performance(figures are total returns and have been rebased to 100 at 31 Dec 2005)
ContentsInvestment Record 1
Manager’s Report 2
Summary of Material Portfolio Changes 7
Portfolio Statement 8
Comparative Tables 11
Information on Aberforth Unit Trust Managers Limited 12
Statement of Manager’s Responsibilities 13
Statement of Trustee's Responsibilities 13
Independent Auditors’ Report 14
Financial Statements 16
Notes to the Financial Statements 18
Distribution Table 24
Management and Administration inside back cover
Data has been sourced from Aberforth Partners LLP unless otherwise stated.
130928 AFUND AR Cov PRINT_130928 AFUND Cov V9 28/01/2016 13:35 Page 2
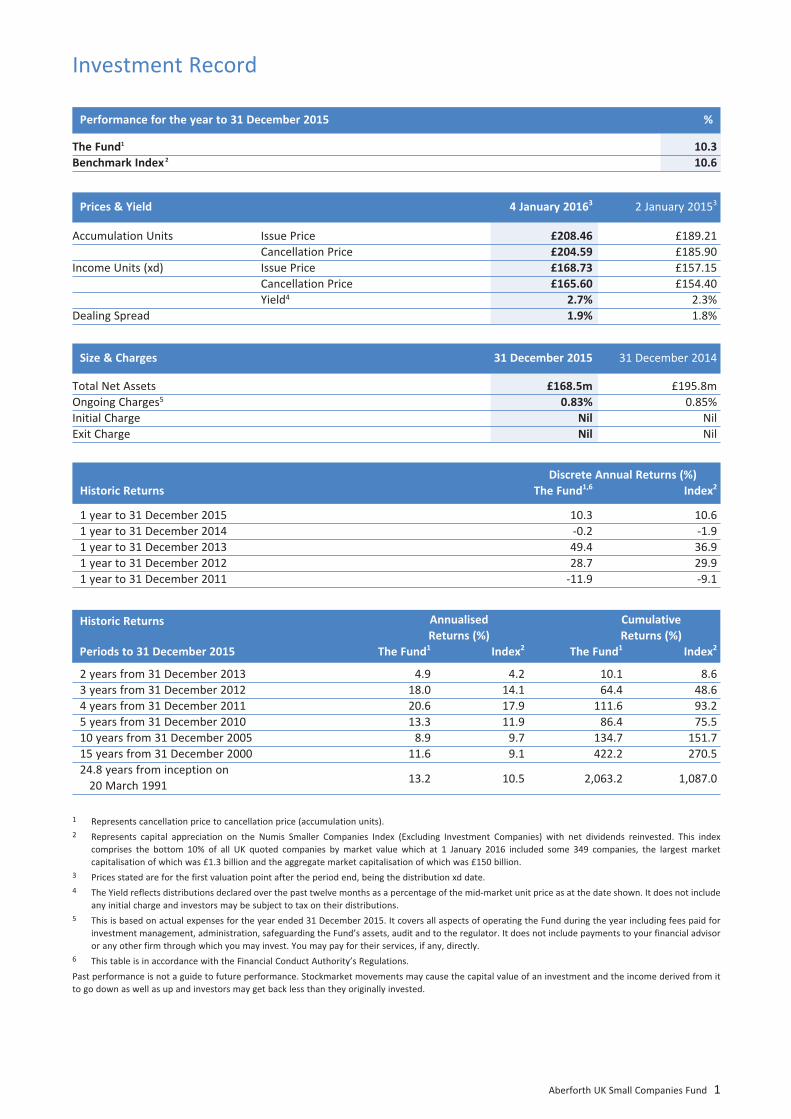
Aberforth UK Small Companies Fund 1
Discrete Annual Returns (%)Historic Returns The Fund1,6 Index2
1 year to 31 December 2015 10.3 10.61 year to 31 December 2014 -0.2 -1.91 year to 31 December 2013 49.4 36.91 year to 31 December 2012 28.7 29.91 year to 31 December 2011 -11.9 -9.1
Annualised CumulativeReturns (%) Returns (%)
Periods to 31 December 2015 The Fund1 Index2 The Fund1 Index2
2 years from 31 December 2013 4.9 4.2 10.1 8.63 years from 31 December 2012 18.0 14.1 64.4 48.64 years from 31 December 2011 20.6 17.9 111.6 93.25 years from 31 December 2010 13.3 11.9 86.4 75.510 years from 31 December 2005 8.9 9.7 134.7 151.715 years from 31 December 2000 11.6 9.1 422.2 270.524.8 years from inception on
13.2 10.5 2,063.2 1,087.020 March 1991
1 Represents cancellation price to cancellation price (accumulation units).2 Represents capital appreciation on the Numis Smaller Companies Index (Excluding Investment Companies) with net dividends reinvested. This index
comprises the bottom 10% of all UK quoted companies by market value which at 1 January 2016 included some 349 companies, the largest marketcapitalisation of which was £1.3 billion and the aggregate market capitalisation of which was £150 billion.
3 Prices stated are for the first valuation point after the period end, being the distribution xd date.4 The Yield reflects distributions declared over the past twelve months as a percentage of the mid-market unit price as at the date shown. It does not include
any initial charge and investors may be subject to tax on their distributions.5 This is based on actual expenses for the year ended 31 December 2015. It covers all aspects of operating the Fund during the year including fees paid for
investment management, administration, safeguarding the Fund’s assets, audit and to the regulator. It does not include payments to your financial advisoror any other firm through which you may invest. You may pay for their services, if any, directly.
6 This table is in accordance with the Financial Conduct Authority’s Regulations.Past performance is not a guide to future performance. Stockmarket movements may cause the capital value of an investment and the income derived from itto go down as well as up and investors may get back less than they originally invested.
Performance for the year to 31 December 2015 %
The Fund1 10.3Benchmark Index2 10.6
Investment Record
Prices & Yield 4 January 20163 2 January 20153
Accumulation Units Issue Price £208.46 £189.21Cancellation Price £204.59 £185.90
Income Units (xd) Issue Price £168.73 £157.15Cancellation Price £165.60 £154.40Yield4 2.7% 2.3%
Dealing Spread 1.9% 1.8%
Size & Charges 31 December 2015 31 December 2014
Total Net Assets £168.5m £195.8mOngoing Charges5 0.83% 0.85%Initial Charge Nil NilExit Charge Nil Nil
Historic Returns
130928 AFUND AR Txt PRINT_130928 AFUND Txt V9 28/01/2016 13:47 Page 1

2 Annual Report and Financial Statements 2015
Manager’s Report
This report has been prepared in accordance with the requirements of the Collective Investment Schemes Sourcebook asissued and amended by the Financial Conduct Authority.
StatusAberforth UK Small Companies Fund (the “Fund”) was constituted by a Trust Deed dated 17 December 1990 and is anauthorised unit trust scheme under the Financial Services & Markets Act 2000 (the “Act”). The Fund is a UCITS scheme asdefined by the Collective Investment Schemes Sourcebook.
Changes to ProspectusDuring the year, the Prospectus was updated:-1. in May to note that, with effect from 1 July 2015, the Manager’s periodic charge was being reduced to 0.75%; and2. in August to note that, with effect from 5 October 2015, the due date for payment of proceeds for subscriptions and
redemptions of units in the Fund had been reduced to three business days after the date the trade took place.
IntroductionBenefiting from a resilient domestic economy and its low exposure to the struggling resources industries, the Numis SmallerCompanies Index (excluding investment companies) ("NSCI (XIC)") performed well in 2015, securing a total return of 10.6%.This was well ahead of the FTSE All-Share’s 1.0% and, indeed, compared well with the results for many major stockmarkets,particularly when assessed in sterling. The Fund’s total return was 10.3%. While acceptable in the broader context of 2015,this outcome is below that of the benchmark. Reasons for this are set out in the Performance section of this report.Returning, for the time being, to the broader investment environment, risk assets tended to struggle in 2015, especially in thesecond half. Uncertainty continued as to the strength of recovery in the Eurozone, notwithstanding the introduction ofquantitative easing long promised by Mario Draghi. Meanwhile, the pace of growth in the US ebbed even as speculation aboutthe first rise in interest rates in the present cycle mounted. Adding to these undercurrents came the Autumn’s tide of concernabout China and the emerging markets in general. Uncertainty rose as to the rate of deceleration in the Chinese economyfollowing a loosening of its currency peg with the strong dollar, which fuelled recurrent fears about years of investmentfinanced by unsustainable levels of debt. The slowdown in China’s rate of growth added to pressure on the resources industry,as diminishing demand met still rising supply, a legacy of the boom years. In turn, plummeting commodity prices and a strongerdollar intensified the woes of emerging markets, several of which have relied on dollar denominated debt to fund their growth.The UK has proved a haven of comparative tranquillity: domestic demand has been boosted by wages rising above the rate ofinflation and has offset austerity policies, which have in any case been watered down. However, the FTSE All-Share, which isdominated by large companies, has been weighed down by its significant exposure to the resources industries. This factorhelps explain the out-performance of smaller companies in 2015: the NSCI (XIC) has a relatively low exposure to resourcescompanies and a much greater exposure to sectors, such as retailing, that address the domestic economy. That said, overseas-facing companies within the NSCI (XIC) are showing signs of stress as patchy demand growth in other economies combines withthe lagged effects of sterling’s revaluation over the past four years.Against this backdrop of modest economic growth and mounting pessimism, government bond yields ended 2015 littlechanged from the levels at which they started the year. These are very low in a long term historical context and are alsoinfluenced by the prevailing monetary regime of zero interest rate policy and quantitative easing. The impact of bond yieldson a portfolio of small UK quoted companies constructed in accordance with a value investment discipline is twofold.• First, as already implied, bond yields are a gauge of underlying economic activity: yields tend to rise to reflect and compete
with the returns available from a stronger economy and vice versa. In an environment of low growth across the economy,secular growth companies stand out and can be rewarded by the stockmarket with higher than normal valuations. A risingtide of improving prospects for the general economy should erode that growth premium.
• Second, value stocks may be considered “short duration” equities, which means that more of their worth is determined bynear term cash flows from the underlying businesses. In contrast, growth stocks tend to be “long duration” equities, witha greater portion of their value derived from cash flows that are forecast to grow often over many years into the future. Assuch, the valuation of a growth company is more sensitive to the rate at which the cash flows are discounted to arrive atthe business’s present value. To this extent, the present climate of very low interest rates and bond yields is likely to resultin valuations for growth companies that are even higher than normal.
The theory has translated into practice since the global financial crisis: the value investment style has fared well in years suchas 2013 when bond yields rose, but has faced a challenge over the period as a whole as yields have declined. This report’s initialfocus on the big picture should not be mistaken for a change in the Manager’s investment approach: the portfolio remains acollection of individual businesses selected for their attractive valuations and prospects. However, it is clear that theperformance of the portfolio, whether Aberforth likes it or not, is influenced by factors beyond its control. Some of this is bydesign: the Fund ought to benefit from the value premium, which is the out-performance that value stocks have enjoyed overgrowth stocks over the long term both in the NSCI (XIC) and in equity markets around the world.
130928 AFUND AR Txt PRINT_130928 AFUND Txt V9 28/01/2016 13:47 Page 2

Aberforth UK Small Companies Fund 3
Manager’s Report
Investment performanceTo recap, the Fund’s total return in 2015 was 10.3%, which compares with 10.6% from the NSCI (XIC). This section of the reportanalyses some of the factors behind the relative performance.
Style & sizeWith government bond yields remaining at very low levels over the year, the value investment style under-performed in 2015.An additional handicap came from the rebalancing of the NSCI (XIC) on 1 January 2015: this saw the admission of severalresources companies, whose share prices had fallen steeply in 2014. According to the price-to-book methodology employedby the London Business School, which maintains the NSCI (XIC), these were classified as value companies. Their continuedstruggles in 2015 therefore represented a headwind to the value style. As explained in the Sectors paragraph below, theManager is not a slave to third party definitions of what makes a value investment and chooses to avoid many of these troubledresources businesses.The Manager’s consistent application of the value style has led to a significantly larger exposure than that of the NSCI (XIC) tothe smaller constituents of the index. One way to illustrate this is to focus on the NSCI (XIC)’s overlap with the FTSE 250. Thisoverlap accounts for 63% of the NSCI (XIC) but for just 39% of the portfolio. This under-weight position in “larger small”companies and the accompanying over-weight position in “smaller small” companies reflects the strong performance of midcaps over the past 15 years. Consequently, the more attractive valuations are now on offer down the scale of marketcapitalisations, often irrespective of an individual company’s prospects. In part, this state of affairs is a result of the globalfinancial crisis: fears of illiquidity have remained exaggerated and deterred many market participants from venturing below theFTSE 250. With little to choose between the returns from the FTSE 250 and the FTSE SmallCap in 2015, size was not a significantinfluence on the Fund’s relative performance.
SectorsThe resources sectors represent a conundrum for the value investor. Their constituents often look very cheap on metrics suchas price-to-book, but their prospects are clouded by macro economic and political influences on underlying commodity prices.The Manager has differentiated between the oil companies and the miners, adopting a higher weight than the index in theformer – for the first time in a decade – and remaining under-weight in the latter. An important means of differentiation is thebalance sheet: the oil companies in the NSCI (XIC) tend to have stronger balance sheets, with net cash, modest debt or longterm borrowing arrangements. In contrast, the miners’ balance sheets tend to be stretched. As a consequence, the miners inmany cases require higher commodity prices sooner rather than later in order to survive, whereas it is possible to adopt alonger term investment horizon with the oil companies, most of which remain cash flow positive with the oil price at today’sdepressed levels. On a one year view, the decision to add to the portfolio’s position in oil was unhelpful. However, this wasout-weighed by the benefit of avoiding the worst of the miners.Elsewhere, it has been challenging to find value in the healthcare sectors. Healthcare companies offer the benefits of seculargrowth dynamics and are able to stand apart from concerns about the economic cycle that afflict the majority of stockmarketsectors. As a consequence, they have attracted large amounts of capital, as resources companies were able to do a decadeago, and their valuations have risen to high levels. Another buoyant area of the small cap universe in recent years has beenthose sectors addressing the domestic UK economy. Housebuilders and retailers have tended to perform well and the Fundhas benefited from significant exposure to those industries. However, it would appear that the good news about the UK’srecovery is now fully reflected in the valuations of several domestic cyclicals. As a consequence, the portfolio’s exposure hasfallen as valuation targets have been achieved.
For the 12 months ended 31 December 2015 Basis points
Stock selection (31)Sector selection 30
Attributable to the portfolio of investments, based on mid prices (1)Movement in mid to bid price spread 8Cash/overdraft 46Management fee (78)Other expenses (6)
Total attribution based on bid prices (31)
Note: 100 basis points = 1%. Total Attribution is the difference between the total return of the Fund and the Benchmark Index (i.e. the Fund =10.30%; Benchmark Index = 10.61%; difference is -0.31% being -31 basis points).
130928 AFUND AR Txt PRINT_130928 AFUND Txt V9 28/01/2016 13:47 Page 3

4 Annual Report and Financial Statements 2015
Manager’s Report
Corporate activityM&A staged a substantial recovery in 2015. Bids for 27 members of the NSCI (XIC) were completed in the year, against 12 in2014 and just 5 in 2013. On top of the completed deals, approaches for another 8 companies were outstanding at the yearend. Acquirers were predominantly other corporates rather than private equity and takeover premiums were generally fair.Of the 27 completed deals, the Fund held 8. The net effect of the takeover premiums collected by the Fund less those missedwas positive, though amounted to less than 100 basis points of relative performance.The year under review was also noteworthy for the refreshment of the NSCI (XIC): the initial public offerings of 29 companieseligible for inclusion in the index were completed. This compares with 27 in 2014. As at 31 December 2015, the Fund held fourof 2015’s IPOs. It would appear that the pipeline of potential future IPOs is full, though its realisation clearly relies onacceptable price expectations on the part of the vendors and on general stockmarket conditions – neither of which is a given.
IncomeThe dividend performance of small companies in recent years has been very strong. In an investment world starved of incomeby zero interest rate policies, the dividend characteristics offered by the constituents of the NSCI (XIC) have been increasinglysought after. It is scarcely necessary to look further when attempting to understand the good share price performance of theasset class since the global financial crisis. The same logic applies when assessing the performance of small companies againstlarge. Double digit per annum dividend growth and numerous special dividends from the NSCI (XIC) since 2009 contrast withthe fortunes of the FTSE All-Share, which is dominated by large sectors, such as the banks and resources companies, whosedividends have been under considerable pressure.The Fund continues to benefit from this favourable backdrop. Its investment income rose by 25% in 2015, boosted by sevenspecial dividends and also by the impact of companies resuming dividend payments after having suspended them during the2009 recession. Given this performance, the general craving for income and the higher than average yields of the portfolio’sinvestee companies, it would seem likely that the Fund’s income characteristics have been beneficial to both its total returnand capital NAV performance in recent years. This would have mitigated to an extent the broader headwinds facing the valuestyle that are associated with low interest rates and bond yields. It is worth reiterating the caveats about income made in previous reports. First, the double digit growth in small companydividends since 2009 is unsustainable: the long term average is 2.5% per annum adjusted for inflation and there is little reasonto believe that the future average should be any higher. Second, the Manager detects an element of faddishness to therediscovered fondness for dividends: at the risk of too much cynicism, it may be the case that certain dividend decisions arebeing made with an eye to the shorter term fillip they might afford to a share price rather than to the longer term good of thecompany. Such situations may only be revealed when the next recession hits. Third, if interest rates and bond yields can begina journey of normalisation, income becomes less scarce and the income characteristics of small companies become less soughtafter. This, though, should be a price worth paying by a value investor.
Significant stakesThroughout the Fund’s history, the Manager has been prepared to take large stakes in investee companies across Aberforth’sclient base. These stakes can rise as high as around 25% of a company’s outstanding share capital. The primary motivationrelates to the value investment philosophy: the Manager wants valuation to be the main determinant of a company’s positionin the portfolio. A 25% ownership limit offers flexibility in this regard, though stakes of this size are a relatively small part ofthe portfolio and are usually amassed slowly, taking advantage of share price weakness. Clearly, significant stakes can bring additional opportunities and responsibilities. The Manager has an established means ofengagement with investee companies that focuses on the role of the chairman, which is the most important position in theUK’s corporate governance structure. The Manager may have a view on dividend policy or balance sheet structure, but, withthe right person in the chair, it is generally happy to let the board run the company. Engagement is frequently time consuming,but the Manager is well resourced and believes that the investment of time provides a good payback. Significant stakes, withthe inevitable mix of successes and failures, have made a net positive contribution to the Fund’s returns over the years.
TurnoverDefined as the lower of purchases and sales divided by average month end net asset value over the past twelve months,turnover was 34% over the twelve months to 31 December 2015, which compares with 36% in 2014. In both years, turnoverwas boosted by situations in which the Fund is in effect a forced seller but which represent good outcomes for shareholders.First, companies that have grown too large to remain in the NSCI (XIC) on its annual 1 January rebalancing are sold in an orderlyfashion. Second, companies subject to takeover bids are sold to the acquirer. The turnover figure of 34% implies an averageholding period of roughly three years, though the portfolio contains many holdings that have been there for much longer.
130928 AFUND AR Txt PRINT_130928 AFUND Txt V9 28/01/2016 13:48 Page 4

Aberforth UK Small Companies Fund 5
Manager’s Report
Active shareActive share† is a gauge of how different a portfolio is from an index. A higher active share ratio indicates a greater differenceand increases the probability that the portfolio’s performance will diverge from that of the index. That divergence could bepositive or negative. The Manager monitors active share to ensure that the Fund’s portfolio does not inadvertently becometoo similar to the NSCI (XIC). It targets a ratio of at least 70%, though will tolerate a temporarily depressed number. The targetis assessed without the benefit of holdings that are not constituents of the index – such holdings flatter active share. At 31December 2015, the ratio stood at 77%.
Valuations
The table above contains historic valuation data for the Fund’s portfolio and for the NSCI (XIC). The portfolio’s historic PE fellover the course of 2015, while the NSCI (XIC)’s rose. This is consistent with the style dynamics already described: the small capuniverse was led higher by the growth stocks, while value stocks performed less well. Meanwhile, the PE of large companies,represented by the FTSE All-Share, rose from 13.8x to 16.6x over the year. As a consequence, small companies ended the year12% cheaper than large in terms of PE, which compares with a 4% discount twelve months earlier. As recently as September2012, small companies were 24% more expensive than large on the basis of PEs.
The average portfolio yield rose in 2015, while the dividend cover dropped. An important influence on these movements is theimpact of previously nil yielding companies resuming or starting dividends payments. At 2.6x, cover is now back closer to thelong term average of 2.5x, having spent the years since the global financial crisis at above 3.0x.
2016 enterprise value / earnings before interest, tax and amortisation
43 growth companies 244 other companies Tracked Universe* The Fund’s portfolio16.0x 11.1x 11.8x 9.8x
* Companies followed closely by the Manager accounting for 96% by value of the NSCI (XIC).
The table above sets out the forward EV/EBITA ratio for the portfolio, the tracked universe and two subdivisions of the trackeduniverse, 43 growth companies and the 244 other companies. EV/EBITA is the Manager’s favoured valuation metric. It isunaffected by how a company is funded, whether through equity or debt, and it is closer to how a corporate acquirer values atarget business. This latter point may explain the important contribution to the Fund’s performance over the years from M&A.
Consistent with the Manager’s value investment style, the portfolio is valued on a large discount to the tracked universe as awhole. This discount to the growth companies is wider, at 39%. A corollary of growth’s leadership in 2015 is that the populationof potential investments for the Fund has increased. It is the value investor’s contention that discounts will narrow over time tothe benefit of the relative returns of portfolios managed in accordance with the style.
31 December 2015 31 December 2014Characteristics The Fund NSCI (XIC) The Fund NSCI (XIC)
Number of companies 86 349 88 369
Weighted average market capitalisation £564m £750m £614m £754m
Price earnings ratio or PE (historic) 12.5x 14.6x 13.0x 13.2x
Dividend yield (historic) 3.1% 2.7% 2.5% 2.5%
Dividend cover 2.6x 2.5x 3.0x 3.0x
130928 AFUND AR Txt PRINT_130928 AFUND Txt V9 28/01/2016 13:48 Page 5
6 Annual Report and Financial Statements 2015
Manager’s Report
Outlook & conclusionAlthough the Manager’s day-to-day focus is on individual businesses and their valuations, it is likely that the performance ofthe Fund over the coming year will be significantly influenced by developments on a larger scale. If the recent interest rateincrease in the US heralds a gradual normalisation of monetary conditions around the world and bond yields are higher intwelve months’ time, it is probable that the Fund will have benefited from tailwinds for the value investment style. If, however,the rate increase proves more than the economy can take and bond yields stay the same or decline, then the Fund will probablyface headwinds similar to those of 2015. The outcome is not one that the Manager is able to call. However, the challenge thatthe interest rate rise in the US represents to the broader investment world’s safe and consensual preference for growth stocksis intriguing.
Closer to home, the outlook for the UK’s corporate sector is undeniably cloudy. Demand is challenged by the uncertain paceof growth in much of the world, while costs are, at last, coming under pressure from wages rising above the rate of inflation.Sliding commodity prices – particularly that of oil – offer some mitigation, but a squeeze on margins is plausible. It should notcome as a surprise if the profit growth expected by the market for small companies in 2016 – currently around 9% – once againproves too ambitious. In mitigation, balance sheets do not appear stretched across the portfolio and the investment universein general. Moreover, another year of above average dividend growth from small companies looks likely.
For the Manager, the most encouraging factor is that of valuation. The investment universe continues to offer up numerousattractively valued investment opportunities. Indeed, the consolation of a year in which growth stocks have led the NSCI (XIC)higher is that the valuation gap between growth and value has widened and the number of candidates for inclusion in theportfolio has risen. It is plausible that elements of the undoubted top-down risks are already discounted in valuations oftoday’s portfolio. Accordingly, without becoming hostage to the vagaries of equity returns over one year, the Manager looksto the future with confidence and believes that the Fund can continue to benefit from careful stock selection and exploitationof the value premium.
K F Muir, DirectorE R Macdonald, DirectorAberforth Unit Trust Managers Limited29 January 2016
† Active Share is addressed by Antti Petajisto and Martijn Cremers in a 2009 publication from the Yale School of Management: How Active Is Your FundManager? A New Measure That Predicts Performance. The active share ratio is calculated by summing the absolute differences between a portfolio’sweight in a stock and an index’s weight in a stock for all the stocks in the portfolio or index. The total is then divided by two to give a ratio between0% and 100%.
130928 AFUND AR Txt PRINT_130928 AFUND Txt V9 28/01/2016 13:48 Page 6

Aberforth UK Small Companies Fund 7
ProceedsSales £’000
JD Sports Fashion 12,356RPC Group 5,980St. Modwen Properties 5,503QinetiQ Group 5,479Tullett Prebon 4,647Optos 4,636Spirit Pub Company 4,234Mecom Group 3,738Anite 3,703Card Factory 3,081Synthomer 3,028Chime Communications 2,710Phoenix IT Group 2,446Novae Group 1,732e2v technologies 1,714Colt Group 1,660Just Retirement Group 1,652Acal 1,650Spire Healthcare Group 1,454Promethean World 1,378 Other sales 20,538
Total Proceed of Sales 93,319
Paragon Group 3,592International Personal Finance 3,124Nostrum Oil & Gas 2,481Ladbrokes 2,375Pendragon 2,233De La Rue 1,936Senior 1,821Carpetright 1,598Home Retail Group 1,548Spirent Communications 1,444Just Retirement Group 1,434Coats Group 1,419Brewin Dolphin Holdings 1,354SDL 1,353Eurocell 1,349Findel 1,259Northgate 1,229Keller 1,142Bodycote 1,123Colt Group 1,114Other purchases 27,014
Total Cost of Purchases 61,942
Summary of Material Portfolio Changes
For the year ended 31 December 2015Cost
Purchases £’000
130928 AFUND AR Txt PRINT_130928 AFUND Txt V9 28/01/2016 13:48 Page 7

8 Annual Report and Financial Statements 2015
Portfolio StatementAs at 31 December 2015
31 December 2015 31 December 2014% of % of
Value Total Net % of Total Net % ofHolding Security £’000 Assets Index1 Assets Index
Oil & Gas Producers 4,429 2.7 3.0 3.1 4.6
4,092,251 EnQuest 777 0.51,200,287 Hardy Oil & Gas 198 0.1
432,800 Nostrum Oil & Gas 1,747 1.01,357,196 Petroceltic International 275 0.3
980,640 SOCO International 1,432 0.8
Oil Equipment, Services & Distribution 1,955 1.2 1.0 0.6 1.2
1,955,200 Gulf Marine Services 1,955 1.2
Alternative Energy – – 0.1 – 0.2
Chemicals 1,075 0.6 1.7 1.1 2.0
846,300 Carclo 1,075 0.6
Industrial Metals & Mining – – 0.8 0.1 0.2
9,832,752 International Ferro Metals2 – –
Mining 3,083 1.8 2.9 1.4 3.9
1,565,708 Anglo Pacific Group 900 0.53,389,910 Centamin 2,183 1.3
543,440 Kenmare Resources Warrants 20193 – –
Construction & Materials 4,325 2.6 3.6 0.9 2.8
733,676 Eurocell 1,394 0.8279,800 Keller 2,314 1.4 949,145 Low & Bonar 617 0.4
Aerospace & Defence 3,059 1.8 1 .1 3.0 2.8
679,464 Chemring Group 1,240 0.7 793,390 Senior 1,819 1.1
General Industrials 5,254 3.1 1.0 4.8 1.7
5,004,254 Coats Group 1,201 0.71,217,572 Vesuvius 4,053 2.4
Electronic & Electrical Equipment 10,531 6.2 1.8 5.6 2.9
2,180,217 e2v technologies 4,873 2.91,171,988 Morgan Advanced Materials 2,899 1.71,763,170 TT Electronics 2,759 1.6
Industrial Engineering 7,000 4.1 2.1 3.3 2.1
450,086 Bodycote 2,559 1.5403,190 Castings 1,875 1.1 431,216 Vitec Group 2,566 1.5
Industrial Transportation 2,885 1.7 1.9 1.2 1.6
1,494,873 Wincanton 2,885 1.7
Support Services 25,740 15.3 12.1 13.8 9.9
63,534 Acal 175 0.1924,485 Capital Drilling 208 0.2
1,711,411 Connect Group 2,879 1.7547,600 De La Rue 2,411 1.4
4,877,377 Hogg Robinson Group 3,426 2.04,891,177 Management Consulting Group 721 0.4
837,921 Northgate 3,293 2.0 1,283,600 Premier Farnell 1,248 0.7
130928 AFUND AR Txt PRINT_130928 AFUND Txt V9 28/01/2016 13:48 Page 8

Aberforth UK Small Companies Fund 9
Portfolio StatementAs at 31 December 2015
31 December 2015 31 December 2014% of % of
Value Total Net % of Total Net % ofHolding Security £’000 Assets Index1 Assets Index
Support Services (continued)
738,027 Robert Walters 2,620 1.61,190,462 RPS Group 2,800 1.74,101,296 Shanks Group 3,958 2.34,880,913 Speedy Hire 2,001 1.2
Automobiles & Parts – – – – –
Beverages – – 0.6 – 0.7
Food Producers 4,490 2.7 2.8 2.0 3.3
802,968 Hilton Food Group 4,232 2.5100,900 R.E.A. Holdings 258 0.2
Household Goods & Home Construction 4,615 2.7 1.8 2.4 3.2
456,007 Bovis Homes Group 4,615 2.7
Leisure Goods 1,571 0.9 0.5 0.6 0.5
268,549 Games Workshop Group 1,571 0.9
Personal Goods – – 2.1 – 1.5
Health Care Equipment & Services – – 2.8 2.5 3.3
Pharmaceuticals & Biotechnology 2,730 1.6 2.8 1.1 2.7
1,550,953 Vectura Group 2,730 1.6
Food & Drug Retailers 1,214 0.7 1.0 0.7 0.6
934,200 McColl's Retail Group 1,214 0.7
General Retailers 12,148 7.1 7.7 6.7 7.7
26,100 N Brown Group 81 –285,300 Carpetright 1,355 0.8386,700 DFS Furniture 1,285 0.8622,600 Findel 1,245 0.7
59,300 Halfords Group 199 0.11,236,400 Home Retail Group 1,231 0.7
13,601 JD Sports Fashion 141 0.11,788,735 Mothercare 3,935 2.3 5,754,400 Pendragon 2,676 1.6
Media 9,410 5.7 3.8 6.7 3.9
1,930,849 Centaur Media 1,352 0.89,364,667 Future 960 0.65,350,981 Huntsworth 2,087 1.2
286,500 ITE Group 450 0.42,237,207 Trinity Mirror 3,714 2.2
483,790 UTV Media 847 0.5
Travel & Leisure 17,666 10.5 8.1 8.7 7.6
105,309 Air Partner 432 0.34,089,008 FirstGroup 4,388 2.63,936,266 Flybe Group 3,533 2.1
149,484 Go-Ahead Group 3,978 2.42,291,900 Ladbrokes 2,741 1.6
871,597 Punch Taverns 1,079 0.6241,800 Rank Group 689 0.4 472,200 Revolution Bars Group 826 0.5
Fixed Line Telecommunications 2,715 1.6 1.0 1.2 1.7
2,360,534 KCOM Group 2,715 1.6
130928 AFUND AR Txt PRINT_130928 AFUND Txt V9 28/01/2016 13:48 Page 9

10 Annual Report and Financial Statements 2015
Portfolio StatementAs at 31 December 2015
31 December 2015 31 December 2014% of % of
Value Total Net % of Total Net % ofHolding Security £’000 Assets Index1 Assets Index
Electricity – – 0.7 – 0.5
Gas, Water & Multiutilities – – – – –
Banks – – 1.6 – 0.5
Nonlife Insurance 2,650 1.6 2.7 1.5 2.1
297,036 Novae Group 2,650 1.6
Life Insurance 1,276 0.8 1.4 0.5 1.2
1,160,024 Hansard Global 1,276 0.8
Real Estate Investment & Services 9,326 5.5 6.3 6.3 6.4
483,980 Countrywide 1,933 1.11,618,788 Grainger 3,769 2.2 1,298,800 Urban&Civic 3,624 2.2
Real Estate Investment Trusts 5,135 3.1 4.8 2.4 4.7
2,609,144 Hansteen Holdings 3,003 1.8820,015 McKay Securities 2,132 1.3
Financial Services 13,231 7.8 7.9 5.6 6.4
1,337,254 Brewin Dolphin Holdings 4,147 2.5415,931 Charles Stanley Group 1,373 0.8
1,328,953 International Personal Finance 3,841 2.330,500 John Laing Group 64 –
1,021,519 Paragon Group 3,611 2.1 75,200 River & Mercantile Group 195 0.1
Software & Computer Services 8,861 5.3 4.9 6.4 3.4
358,663 Computacenter 3,056 1.8898,033 Microgen 961 0.6
1,371,168 RM 2,194 1.3641,753 SDL 2,650 1.6
Technology Hardware & Equipment 1,627 1.0 1.6 0.9 2.2
5,455,941 Filtronic 273 0.2 1,893,200 Spirent Communications 1,354 0.8
Investments as shown in the Balance Sheet 168,001 99.7 100.0 95.1 100.0Net Current Assets 480 0.3 – 4.9 –
Total Net Assets 168,481 100.0 100.0 100.0 100.0
All investments are listed on the London Stock Exchange unless otherwise stated.
1 Reflects the rebalanced index as at 1 January 20162 Suspended security3 Unquoted security
130928 AFUND AR Txt PRINT_130928 AFUND Txt V9 28/01/2016 13:48 Page 10

Aberforth UK Small Companies Fund 11
Comparative Tables
2015 2014 2013Income Unit £/unit £/unit £/unit
Change in net assets per unitOpening net asset value per unit 154.50 158.32 108.71Return before operating charges* 17.54 1.05 54.25Operating charges (1.42) (1.36) (1.18)Return after operating charges* 16.12 (0.31) 53.07Distributions on income units (4.53) (3.51) (3.46)Closing net asset value per unit 166.09 154.50 158.32*after direct portfolio transaction costs of: (0.55) (0.60) (0.84)
PerformanceTotal return after charges1 10.4% (0.2)% 48.8%
Other informationClosing net asset value (£'000) 62,511 82,549 57,331Closing number of units 376,364.352 534,302.352 362,124.095Operating charges 0.83% 0.85% 0.84%Direct portfolio transaction costs 0.32% 0.38% 0.60%
PricesHighest issue price (£) 183.70 174.54 162.38Lowest cancellation price (£) 153.12 145.61 110.25
2015 2014 2013Accumulation Unit £/unit £/unit £/unit
Accumulation Unit 2015 2014 2013
Income Unit 2015 2014 2013
Change in net assets per unitOpening net asset value per unit 186.02 186.48 124.92Return before operating charges* 20.90 1.15 62.84Operating charges (1.72) (1.61) (1.28)Return after operating charges* 19.18 (0.46) 61.56Closing net asset value per unit 205.20 186.02 186.48Retained distributions on accumulation units 5.49 4.16 4.00* after direct portfolio transaction costs of: (0.66) (0.71) (0.91)
PerformanceTotal return after charges 10.3% (0.2)% 49.3%
Other informationClosing net asset value (£'000) 105,970 113,262 111,465Closing number of units 516,414.412 608,875.844 597,739.561Operating charges 0.83% 0.85% 0.84%Direct portfolio transaction costs 0.32% 0.38% 0.60%
PricesHighest issue price (£) 221.18 205.58 189.46Lowest cancellation price (£) 184.36 173.42 126.70
1 Does not assume reinvestment of the interim distribution.
130928 AFUND AR Txt PRINT_130928 AFUND Txt V9 28/01/2016 13:48 Page 11

12 Annual Report and Financial Statements 2015
Information on Aberforth Unit Trust Managers Limited
The Manager is wholly owned by Aberforth Partners LLP (the “firm”). The predecessor business of the firm, Aberforth Partners,was established in 1990 to provide institutional and wholesale investors with a high level of resources focused exclusively onsmall UK quoted companies. Since then funds under management have grown to £2.1 billion (as at 31 December 2015). The firmis wholly owned by five partners – four investment managers, and Alan Waite, who is responsible for the firm’s administration.Five investment managers work as a team managing the Fund’s portfolio on a collegiate basis. The biographical details of theinvestment managers are as follows:
Euan R Macdonald BA (Hons)Euan joined Aberforth Partners in May 2001, became a partner in May 2004, and is responsible for investment research andstock selection in the following areas – Automobiles & Parts; Industrial Engineering; Industrial Transportation; Insurance;Leisure Goods; Software & Computer Services; Support Services; Technology Hardware & Equipment; Telecommunications;and Utilities. Previously he was with Baillie Gifford for 10 years where he managed portfolios invested in small companies bothin Continental Europe and in the UK.
Keith F Muir BEng (Hons), CFAKeith joined Aberforth Partners in March 2011, became partner in May 2014, and is responsible for investment research andstock selection in the following areas – Construction & Materials; Household Goods & Home Construction; Industrial Metals &Mining; Mining; and Real Estate. Previously Keith was an Investment Director with Standard Life Investments for 13 years andspent the last 9 years as a senior member of the Smaller Companies team with associated portfolio managementresponsibilities. Prior to that he gained experience with Southpac, Scottish Equitable and Murray Johnstone.
Richard M J Newbery BA (Hons)Richard was a founding partner in May 1990 and is responsible for investment research and stock selection in the followingareas – Alternative Energy; Electronic & Electrical Equipment; Food & Beverage; Forestry & Paper; General Industrials; PersonalGoods; and Retailers. Previously he was with Ivory & Sime for 9 years where he managed international portfolios for a rangeof clients including those with a small company specialisation.
Alistair J WhyteAlistair was a founding partner in May 1990 and is responsible for investment research and stock selection in the followingareas – Aerospace & Defence; Health Care; Media; Oil & Gas Producers; and Oil Equipment, Services and Distribution.Previously he was with Ivory & Sime for 11 years where latterly he managed portfolios in Asia. Prior to that he managedportfolios with the objective of capital growth from smaller companies in the UK and internationally.
Mark R WilliamsonMark joined Aberforth in October 2014 and is responsible for investment research and stock selection in the following areas –Banks; Chemicals; Financial Services; and Travel & Leisure. He joined from Peel Hunt, where he spent five years as an analyston the Financials sector. Prior to that he gained experience with several broking houses, having commenced his career in 1992with Albert E Sharp as a buy-side analyst.
Further information on Aberforth Partners LLP and its clients is available on its website – www.aberforth.co.uk
130928 AFUND AR Txt PRINT_130928 AFUND Txt V9 28/01/2016 13:48 Page 12

Aberforth UK Small Companies Fund 13
Responsibility Statements
STATEMENT OF THE MANAGER’S RESPONSIBILITIES IN RELATION TO THE REPORT AND ACCOUNTS OF THESCHEMEThe Financial Conduct Authority’s Collective Investment Schemes Sourcebook, as amended, ("the Regulations") requires theManager to prepare accounts for each annual accounting period which give a true and fair view of the financial position of thescheme and of its net revenue and capital gains for the period. In preparing the accounts the Manager is required to:
• select suitable accounting policies and then apply them consistently;
• comply with the disclosure requirements of the Statement of Recommended Practice relating to Authorised Funds;
• follow United Kingdom accounting standards;
• keep proper accounting records which enable it to demonstrate that the accounts as prepared comply with the aboverequirements;
• take reasonable steps for the prevention and detection of fraud and non-compliance with laws and regulations; and
• prepare the financial statements on a going concern basis unless it is considered inappropriate.
The Manager is responsible for the management of the scheme in accordance with its trust deed, prospectus and theRegulations.
This report has been prepared in accordance with the requirements of the Collective Investment Schemes Sourcebook asissued and amended by the Financial Conduct Authority.
K F Muir, DirectorE R Macdonald, DirectorAberforth Unit Trust Managers Limited
29 January 2016
STATEMENT OF THE TRUSTEE’S RESPONSIBILITIES AND REPORT OF THE TRUSTEE TO THE UNITHOLDERS OFABERFORTH UK SMALL COMPANIES FUND FOR THE YEAR ENDED 31 DECEMBER 2015The trustee is responsible for the safekeeping of all the property of the scheme (other than tangible moveable property) whichis entrusted to it and for the collection of income that arises from that property.
It is the duty of the trustee to take reasonable care to ensure that the scheme is managed in accordance with the FinancialConduct Authority’s Collective Investment Scheme Sourcebook ("the Regulations"), the scheme’s trust deed and prospectus,in relation to the pricing of, and dealings in, units in the scheme; the application of income of the scheme; and the investmentand borrowing powers of the scheme.
Having carried out such procedures as we considered necessary to discharge our responsibilities as trustee of the scheme, it isour opinion, based on the information available to us and the explanations provided, that in all material respects, the Manager:
(i) has carried out the issue, sale, redemption and cancellation, and calculation of the price of the scheme’s units and theapplication of the scheme’s income in accordance with the Regulations, the trust deed and prospectus, and
(ii) has observed the investment and borrowing powers and restrictions applicable to the scheme.
National Westminster Bank plc Corporate Banking 3 Redheughs AvenueEdinburgh EH12 9RH
29 January 2016
130928 AFUND AR Txt PRINT_130928 AFUND Txt V9 28/01/2016 13:48 Page 13

14 Annual Report and Financial Statements 2015
Reports on the financial statements
Our opinion
In our opinion the financial statements, defined below:
• give a true and fair view of the financial position of the Fund as at 31 December 2015 and of the net revenue and the netcapital gains of the scheme property of the Fund for the year then ended; and
• have been properly prepared in accordance with United Kingdom Generally Accepted Accounting Practice, the Statementof Recommended Practice for Authorised Funds, the Collective Investment Schemes sourcebook and the Trust Deed.
This opinion is to be read in the context of what we say in the remainder of this report.
What we have audited
The financial statements of Aberforth UK Small Companies Fund (the “Fund”), which are prepared by Aberforth Unit TrustManagers Limited (the “Authorised Fund Manager”), comprise :
• the balance sheet of the Fund as at 31 December 2015;
• the statement of total return of the Fund for the year then ended;
• the cash flow statement for the year then ended;
• the statement of change in unitholders’ net assets of the Fund for the year then ended;
• the notes to the Fund’s financial statements, which include a summary of significant accounting policies and otherexplanatory information; and
• the distribution table.
The financial reporting framework that has been applied in their preparation is applicable law and United Kingdom AccountingStandards (United Kingdom Generally Accepted Accounting Practice), the Statement of Recommended Practice ‘FinancialStatements of UK Authorised Funds’ issued by The Investment Management Association (the “Statement of RecommendedPractice for UK Authorised Funds”), the Collective Investment Schemes sourcebook and the Trust Deed.
In applying the financial reporting framework, the Authorised Fund Manager has made a number of subjective judgements, forexample in respect of significant accounting estimates. In making such estimates, they have made assumptions and consideredfuture events.
What an audit of financial statements involves
We conducted our audit in accordance with International Standards on Auditing (UK and Ireland) (“ISAs (UK & Ireland)”). Anaudit involves obtaining evidence about the amounts and disclosures in the financial statements sufficient to give reasonableassurance that the financial statements are free from material misstatement, whether caused by fraud or error. This includesan assessment of:
• whether the accounting policies are appropriate to the Fund’s circumstances and have been consistently applied andadequately disclosed;
• the reasonableness of significant accounting estimates made by the Authorised Fund Manager; and
• the overall presentation of the financial statements.
In addition, we read all the financial and non-financial information in the Annual Report and Accounts (the “Annual Report”)to identify material inconsistencies with the audited financial statements and to identify any information that is apparentlymaterially incorrect based on, or materially inconsistent with, the knowledge acquired by us in the course of performing theaudit. If we become aware of any apparent material misstatements or inconsistencies we consider the implications for ourreport.
Opinions on matters prescribed by the Collective Investment Schemes sourcebook
In our opinion:
• we have obtained all the information and explanations we consider necessary for the purposes of the audit; and
• the information given in the Authorised Fund Manager’s Report for the financial year for which the financial statementsare prepared is consistent with the financial statements.
Independent Auditors’ Report to the Unitholders of Aberforth UKSmall Companies Fund
130928 AFUND AR Txt PRINT_130928 AFUND Txt V9 28/01/2016 13:48 Page 14

Aberforth UK Small Companies Fund 15
Other matters on which we are required to report by exception
Propriety of accounting records and information and explanations received
Under the Collective Investment Schemes sourcebook we are required to report to you if, in our opinion:
• proper accounting records have not been kept; or
• the financial statements are not in agreement with the accounting records and returns.
We have no exceptions to report arising from this responsibility.
Responsibilities for the financial statements and the audit
Our responsibilities and those of the Authorised Fund Manager
As explained more fully in the Authorised Fund Manager’s Responsibilities Statement set out on page 13, the Authorised FundManager is responsible for the preparation of the financial statements and for being satisfied that they give a true and fair view.
Our responsibility is to audit and express an opinion on the financial statements in accordance with applicable law and ISAs (UK& Ireland). Those standards require us to comply with the Auditing Practices Board’s Ethical Standards for Auditors.
This report, including the opinions, has been prepared for and only for the Fund’s unitholders as a body in accordance withparagraph 4.5.12 of the Collective Investment Schemes sourcebook and for no other purpose.
We do not, in giving these opinions, accept or assume responsibility for any other purpose or to any other person to whom thisreport is shown or into whose hands it may come save where expressly agreed by our prior consent in writing.
PricewaterhouseCoopers LLPChartered Accountants and Statutory AuditorsEdinburgh29 January 2016
(a) The maintenance and integrity of the Authorised Fund Manager’s website is its responsibility; the work carried out by theauditors does not involve consideration of these matters and, accordingly, the auditors accept no responsibility for anychanges that may have occurred to the financial statements since they were initially presented on the website.
(b) Legislation in the United Kingdom governing the preparation and dissemination of financial statements may differ fromlegislation in other jurisdictions.
Independent Auditors’ Report to the Unitholders of Aberforth UKSmall Companies Fund
130928 AFUND AR Txt PRINT_130928 AFUND Txt V9 28/01/2016 13:48 Page 15
16 Annual Report and Financial Statements 2015
Financial StatementsFor the year ended 31 December 2015
Statement of Change in net assets attributable to unitholders
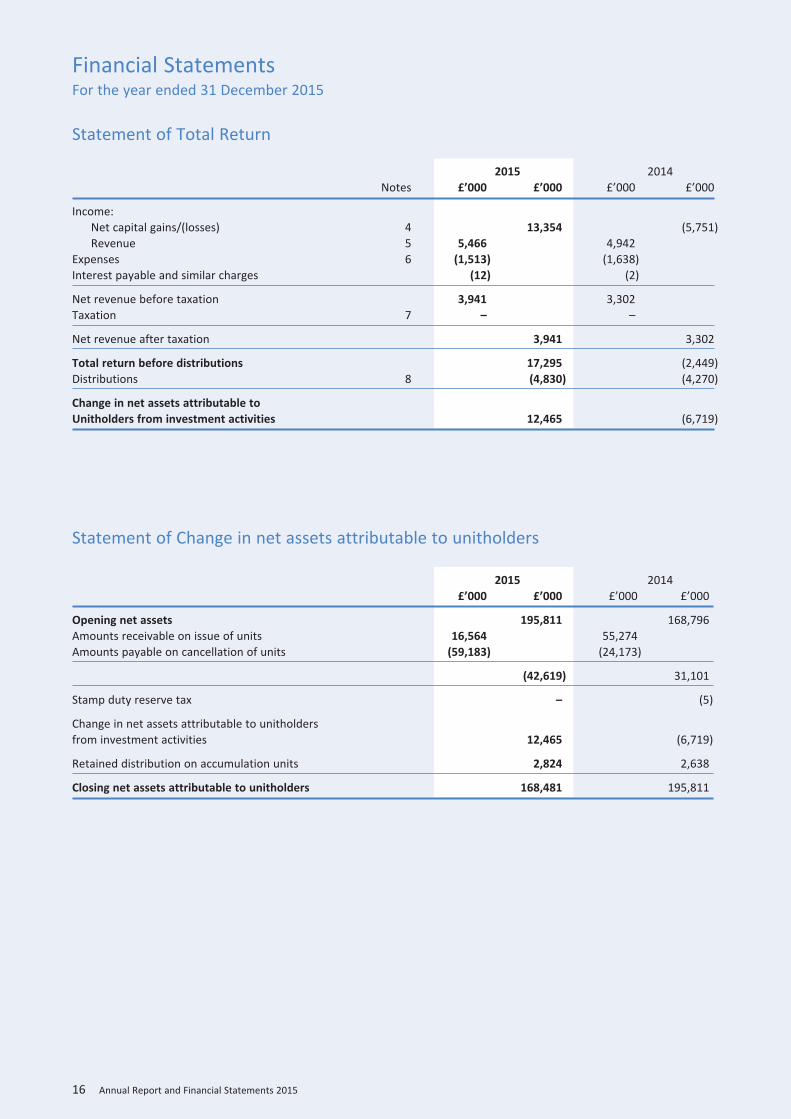
2015 2014Notes £’000 £’000 £’000 £’000
Income:Net capital gains/(losses) 4 13,354 (5,751)Revenue 5 5,466 4,942
Expenses 6 (1,513) (1,638)Interest payable and similar charges (12) (2)
Net revenue before taxation 3,941 3,302Taxation 7 – –
Net revenue after taxation 3,941 3,302
Total return before distributions 17,295 (2,449)Distributions 8 (4,830) (4,270)
Change in net assets attributable toUnitholders from investment activities 12,465 (6,719)
2015 2014£’000 £’000 £’000 £’000
Opening net assets 195,811 168,796Amounts receivable on issue of units 16,564 55,274Amounts payable on cancellation of units (59,183) (24,173)
(42,619) 31,101
Stamp duty reserve tax – (5)
Change in net assets attributable to unitholdersfrom investment activities 12,465 (6,719)
Retained distribution on accumulation units 2,824 2,638
Closing net assets attributable to unitholders 168,481 195,811
Statement of Total Return
130928 AFUND AR Txt PRINT_130928 AFUND Txt V9 28/01/2016 13:48 Page 16

Aberforth UK Small Companies Fund 17
Cash Flow Statement
Net cash inflow from operating activities 11 4,142 3,302
Investing activitiesPurchases of investments (62,813) (93,140)Sales of investments 93,387 67,808
Cash inflow/(outflow) from investing activities 30,574 (25,332)
Financing activitiesAmounts received from issue of units 25,452 47,063Amounts paid on cancellation of units (59,850) (23,819)SDRT paid – (5)Distributions paid (2,122) (1,441)Interest paid (12) (2)
Cash (outflow)/inflow from financing activities (36,532) 21,796
Decrease in cash and cash equivalents (1,816) (234)
Cash and cash equivalents at the start of the year 1,866 2,100Cash and cash equivalents at the end of the year 50 1,866
2015 2014Notes £’000 £’000
Financial StatementsAs at 31 December 2015
2015 2014Notes £’000 £’000 £’000 £’000
ASSETSFixed assets:Investments assets 168,001 186,258
Current assets:Debtors 9 1,292 10,143Cash and bank balances 50 1,866
Total other assets 1,342 12,009
Total assets 169,343 198,267
LIABILITIESCreditors:Other creditors 10 (195) (1,534)Distribution payable on income units (667) (922)
Total liabilities (862) (2,456)
Net assets attributable to unitholders 168,481 195,811
Balance Sheet
130928 AFUND AR Txt PRINT_130928 AFUND Txt V9 28/01/2016 13:48 Page 17
18 Annual Report and Financial Statements 2015
Notes to the Financial Statements
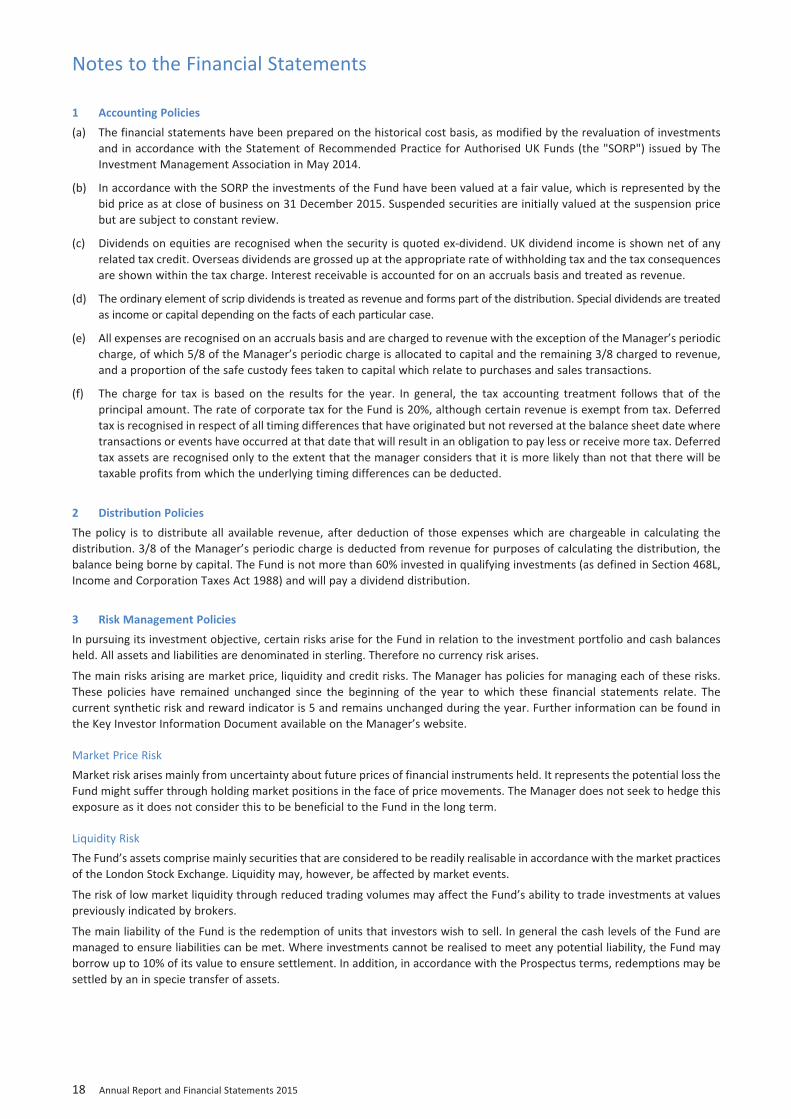
1 Accounting Policies(a) The financial statements have been prepared on the historical cost basis, as modified by the revaluation of investments
and in accordance with the Statement of Recommended Practice for Authorised UK Funds (the "SORP") issued by TheInvestment Management Association in May 2014.
(b) In accordance with the SORP the investments of the Fund have been valued at a fair value, which is represented by thebid price as at close of business on 31 December 2015. Suspended securities are initially valued at the suspension pricebut are subject to constant review.
(c) Dividends on equities are recognised when the security is quoted ex-dividend. UK dividend income is shown net of anyrelated tax credit. Overseas dividends are grossed up at the appropriate rate of withholding tax and the tax consequencesare shown within the tax charge. Interest receivable is accounted for on an accruals basis and treated as revenue.
(d) The ordinary element of scrip dividends is treated as revenue and forms part of the distribution. Special dividends are treatedas income or capital depending on the facts of each particular case.
(e) All expenses are recognised on an accruals basis and are charged to revenue with the exception of the Manager’s periodiccharge, of which 5/8 of the Manager’s periodic charge is allocated to capital and the remaining 3/8 charged to revenue,and a proportion of the safe custody fees taken to capital which relate to purchases and sales transactions.
(f) The charge for tax is based on the results for the year. In general, the tax accounting treatment follows that of theprincipal amount. The rate of corporate tax for the Fund is 20%, although certain revenue is exempt from tax. Deferredtax is recognised in respect of all timing differences that have originated but not reversed at the balance sheet date wheretransactions or events have occurred at that date that will result in an obligation to pay less or receive more tax. Deferredtax assets are recognised only to the extent that the manager considers that it is more likely than not that there will betaxable profits from which the underlying timing differences can be deducted.
2 Distribution PoliciesThe policy is to distribute all available revenue, after deduction of those expenses which are chargeable in calculating thedistribution. 3/8 of the Manager’s periodic charge is deducted from revenue for purposes of calculating the distribution, thebalance being borne by capital. The Fund is not more than 60% invested in qualifying investments (as defined in Section 468L,Income and Corporation Taxes Act 1988) and will pay a dividend distribution.
3 Risk Management PoliciesIn pursuing its investment objective, certain risks arise for the Fund in relation to the investment portfolio and cash balancesheld. All assets and liabilities are denominated in sterling. Therefore no currency risk arises.
The main risks arising are market price, liquidity and credit risks. The Manager has policies for managing each of these risks.These policies have remained unchanged since the beginning of the year to which these financial statements relate. Thecurrent synthetic risk and reward indicator is 5 and remains unchanged during the year. Further information can be found inthe Key Investor Information Document available on the Manager’s website.
Market Price RiskMarket risk arises mainly from uncertainty about future prices of financial instruments held. It represents the potential loss theFund might suffer through holding market positions in the face of price movements. The Manager does not seek to hedge thisexposure as it does not consider this to be beneficial to the Fund in the long term.
Liquidity RiskThe Fund’s assets comprise mainly securities that are considered to be readily realisable in accordance with the market practicesof the London Stock Exchange. Liquidity may, however, be affected by market events.
The risk of low market liquidity through reduced trading volumes may affect the Fund’s ability to trade investments at valuespreviously indicated by brokers.
The main liability of the Fund is the redemption of units that investors wish to sell. In general the cash levels of the Fund aremanaged to ensure liabilities can be met. Where investments cannot be realised to meet any potential liability, the Fund mayborrow up to 10% of its value to ensure settlement. In addition, in accordance with the Prospectus terms, redemptions may besettled by an in specie transfer of assets.
130928 AFUND AR Txt PRINT_130928 AFUND Txt V9 28/01/2016 13:48 Page 18

Aberforth UK Small Companies Fund 19
Credit RiskCertain transactions in securities that the Fund enters into expose it to the risk that the counter-party will not deliver theinvestment (purchase) or cash (sale) after the Fund has fulfilled its responsibilities.
The investment transactions of the Fund are generally undertaken on a delivery versus payment basis. In addition, the Manageronly buys and sells investments through brokers who are authorised and regulated by the Financial Conduct Authority, whohave formally agreed terms of business with the Manager, and who are considered to have execution arrangements thatenable the Manager to comply with its obligation to obtain the best possible result for the Fund. The Manager closely monitorsmarket developments that may impact a broker’s creditworthiness, market reputation and expectations of future financialperformance. A range of brokers is utilised by the Manager.
Cash balances are placed with a selection of banking institutions. The Manager reviews the banking partners and the depositlevels on a periodic basis. The Manager aims to have the Fund fully invested.
Interest Rate RiskThe majority of the Fund’s financial assets are equity shares, which do not pay interest or have a maturity date. The Fund’sexposure to interest rate risk is therefore insignificant.
4 Net Capital Gains/(Losses)
The gains/(losses) on investments during the year comprise:Equity investments 13,354 (5,751)
5 Revenue
UK dividends 5,169 4,707Property income distributions 74 55Overseas dividends 220 172Bank interest 3 8
Total income 5,466 4,942
6 Expenses
Payable to the Manager or associate of the Manager:Manager’s periodic fee 1,413 1,549
Payable to the Trustee or associate of the TrusteeTrustee’s fees 46 47
Other expenses:Audit fee 12 8Safe custody fees 16 14Registration fees 14 10Printing fees 9 10Taxation services 3 –
54 42
Total expenses 1,513 1,638
With effect from 1 July 2015, the manager’s periodic fee is 0.75% per annum of the valuation of the Fund’s property whichaccrues and is paid monthly in arrears (previously 0.80% per annum). Included within this fee is £883,000 borne by the capitalof the Fund (2014: £968,000). Further details of the management fees, Trustee’s fees and other expenses of the Fund areavailable in the Fund’s Prospectus.
Notes to the Financial Statements
2015 2014£’000 £’000
2015 2014£’000 £’000
2015 2014£’000 £’000
130928 AFUND AR Txt PRINT_130928 AFUND Txt V9 28/01/2016 13:48 Page 19
20 Annual Report and Financial Statements 2015
Notes to the Financial Statements
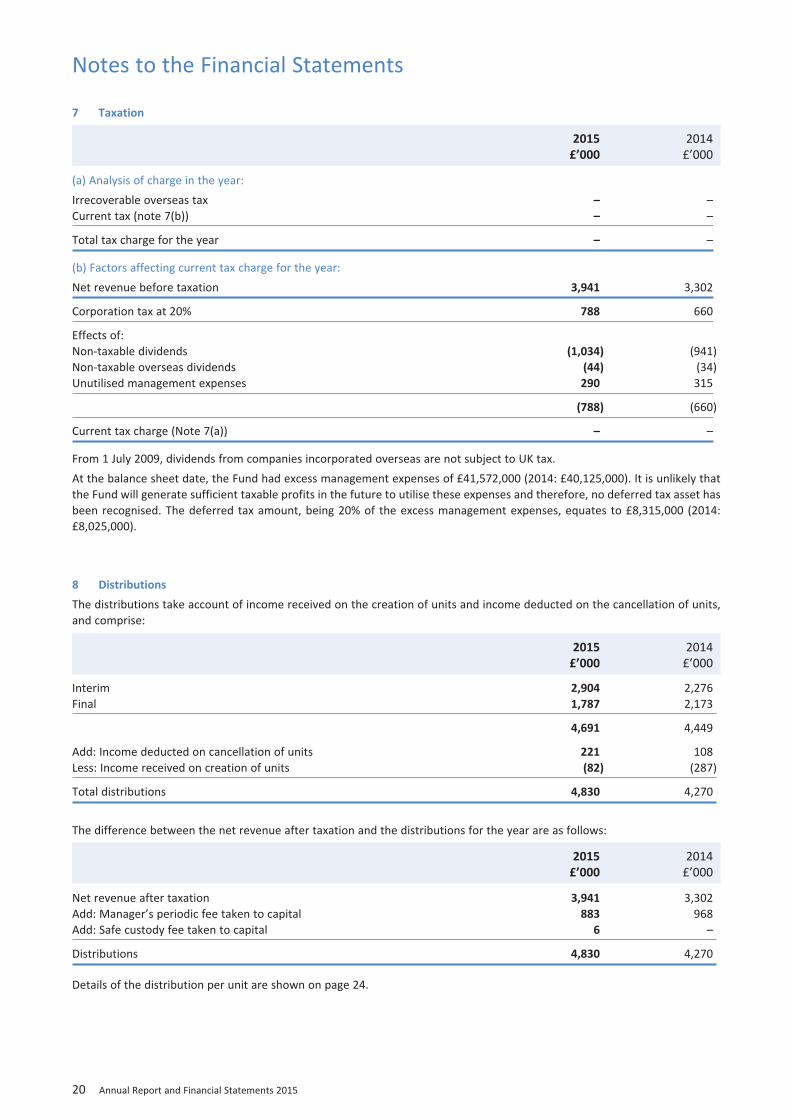
7 Taxation
(a) Analysis of charge in the year:Irrecoverable overseas tax – –Current tax (note 7(b)) – –
Total tax charge for the year – –
(b) Factors affecting current tax charge for the year:Net revenue before taxation 3,941 3,302
Corporation tax at 20% 788 660
Effects of:Non-taxable dividends (1,034) (941)Non-taxable overseas dividends (44) (34)Unutilised management expenses 290 315
(788) (660)
Current tax charge (Note 7(a)) – –
From 1 July 2009, dividends from companies incorporated overseas are not subject to UK tax.At the balance sheet date, the Fund had excess management expenses of £41,572,000 (2014: £40,125,000). It is unlikely thatthe Fund will generate sufficient taxable profits in the future to utilise these expenses and therefore, no deferred tax asset hasbeen recognised. The deferred tax amount, being 20% of the excess management expenses, equates to £8,315,000 (2014:£8,025,000).
8 DistributionsThe distributions take account of income received on the creation of units and income deducted on the cancellation of units,and comprise:
Interim 2,904 2,276Final 1,787 2,173
4,691 4,449
Add: Income deducted on cancellation of units 221 108Less: Income received on creation of units (82) (287)
Total distributions 4,830 4,270
The difference between the net revenue after taxation and the distributions for the year are as follows:
Net revenue after taxation 3,941 3,302Add: Manager’s periodic fee taken to capital 883 968Add: Safe custody fee taken to capital 6 –
Distributions 4,830 4,270
Details of the distribution per unit are shown on page 24.
2015 2014£’000 £’000
2015 2014£’000 £’000
2015 2014£’000 £’000
130928 AFUND AR Txt PRINT_130928 AFUND Txt V9 28/01/2016 13:48 Page 20

Aberforth UK Small Companies Fund 21
Notes to the Financial Statements
9 Debtors
Amounts receivable for creation of units 910 9,716Sales awaiting settlement – 68Accrued income 374 354Other debtors 8 5
Total debtors 1,292 10,143
10 Other Creditors
Amounts payable for cancellation of units 16 462Purchases awaiting settlement 44 915Accrued management fee 108 126Other accrued expenses 27 31
Total creditors 195 1,534
11 Reconciliation of net revenue before taxation to net cash flow from operating activities
Net revenue before taxation 3,941 3,302Adjusted for:Interest payable and similar charges 12 2Debtors:
(Increase) in accrued income (20) (73)(Increase)/decrease in other debtors (3) 5
Creditors:(Decrease)/increase in accrued management fee (18) 21(Decrease)/increase in accrued other expenses (4) 4(Decrease) in stamp duty reserve tax – (5)
Special dividends taken to capital 234 46
Net cash flow from operating activities 4,142 3,302
2015 2014£’000 £’000
2015 2014£’000 £’000
2015 2014£’000 £’000
130928 AFUND AR Txt PRINT_130928 AFUND Txt V9 28/01/2016 13:48 Page 21

22 Annual Report and Financial Statements 2015
Notes to the Financial Statements
12 Portfolio Transaction Costs
Equity purchases in period beforetransaction costs 60,820 90,875Commissions 128 0.21 0.07 188 0.20 0.10Taxes 283 0.46 0.16 387 0.42 0.20
Total equity purchases costs 411 0.67 0.23 575 0.62 0.30
Rights issues taken up during the period 711 2,103
Total purchase consideration after directtransaction costs 61,942 93,553
Gross equity sales in period beforetransaction costs 84,154 67,851Commissions (172) (0.18) (0.09) (151) (0.22) (0.08)
Total equity sales costs (172) (0.18) (0.09) (151) (0.22) (0.08)
Takeovers completed during the period 9,337 176
Total sales in the period after transaction costs 93,319 67,876
The Fund incurs commissions and taxes on buying and selling investment securities in pursuance of the investment objective.Over the last three financial years, commissions have averaged 0.19% per annum (2014: 0.21% per annum) of the Fund’saverage net asset value and taxes have averaged 0.23% per annum (2014: 0.21% per annum) over the same period.
Share dealing generally incurs broker commissions and stamp duty and these are paid by the Fund on each transaction whereappropriate. In addition there is a dealing spread between the buying and selling prices of the underlying investments. As at31 December 2015, the average dealing spread for the underlying Fund investments is 1.54% (2014: 1.32%).
Comparing portfolio transaction costs for a range of funds may give a misleading impression of the relative costs of investingin those funds for the following reasons:
• Historic transaction costs are not an effective indicator of the future impact on performance
• Transactions costs for buying and selling investments due to other investors joining or leaving the fund are recovered fromthose investors.
• Transaction costs vary depending on the types of investment in which a fund invests.
2015 % Average 2014 % Average% of Net Asset % of Net Asset
£’000 sales Value £’000 sales Value
2015 % Average 2014 % Average% of Net Asset % of Net Asset
£’000 purchases Value £’000 purchases Value
130928 AFUND AR Txt PRINT_130928 AFUND Txt V9 28/01/2016 13:48 Page 22

23
13 Unitholders’ Funds
The Fund has income and accumulation units. The net asset value per unit; the number of units and the accumulation/distribution per unit are shown on page 11. All units, adjusted for the current accumulation factor, have the same rights onwinding-up.
Accumulation 608,875.844 66,281.790 (150,097.326) (8,645.896) 516,414.412Income 534,302.352 97,448.201 (265,827.031) 10,440.830 376,364.352
14 Related Party TransactionsManagement fees paid to Aberforth Unit Trust Managers Limited are shown in note 6 and details of units created and cancelledare shown in the Statement of Change in Unitholders’ Net Assets. The balance due from Aberforth Unit Trust Managers Limitedat the year end in respect of these transactions was £786,000 (31 December 2014: £9,128,000). Trustee fees paid are shownin note 6. The balance due to National Westminster Bank plc at the year end in respect of these fees was £4,000 (31 December2014: £4,000).
15 Contingencies, financial commitments and contingent assetsThe Fund had no financial commitments, contingent assets or liabilities as at 31 December 2015 (2014: nil).
16 Fair value
All investments are valued using prices for identical instruments in active markets under the definition of the SORP, with theexception of two investments valued at £nil, namely Kenmare Resources Warrants and International Ferro Metals(31 December 2014: All investments were valued at quoted prices for identical instruments in active markets, other thanKenmare Resources Warrants valued at £nil). The four levels of fair value hierarchy per the SORP are:
(1) Quoted prices for identical instruments in active markets
(2) Prices of recent transactions for identical instrument
(3) Valuation techniques using observable market data
(4) Valuation techniques using non-observable data
Notes to the Financial Statements
Number of units Opening Issued Redeemed Converted Closing
130928 AFUND AR Txt PRINT_130928 AFUND Txt V9 28/01/2016 13:48 Page 23

24 Annual Report and Financial Statements 2015
Distributions
Income units
Group 1: Units purchased prior to 1 July 2015 177.3464p – 177.3464p 172.5395p
Group 2: Units purchased on or after 1 July 2015 49.7681p 127.5783p 177.3464p 172.5395p
Accumulation units
Group 1: Units purchased prior to 1 July 2015 216.8436p – 216.8436p 205.4882p
Group 2: Units purchased on or after 1 July 2015 60.8521p 155.9915p 216.8436p 205.4882p
† When buyers purchase units, the purchase price includes the value of securities and revenue up to the date of purchase. All unitholdersreceive the same distribution, in pence per unit, however equalisation applies only to units purchased during the distribution period (Group 2units). Equalisation is the average amount of income included in the purchase of all Group 2 units and is refunded to holders of these units asa return of capital. Being capital, it is not liable to income tax but must be deducted from the cost of units for capital gains tax purposes.
Distribution TableFor the period 1 July to 31 December 2015
Net Distribution/ Distribution/Income Equalisation† Accumulation Accumulation
Dec 2015 Dec 2015 Dec 2015 Dec 2014
Distribution RecordAccumulation Units Income Units
Net income Net incomeper Unit per Unit
Year to (p) (p)
31 December 2011 298.9537 274.504231 December 2012 377.5214 336.438231 December 2013 399.7750 345.545331 December 2014 416.0784 351.332031 December 2015 548.9197 453.1564
Notes
The annual income accumulation and distribution date is 28 February in each year. The interim income accumulation and distribution date is 31 August relatingto the period to 30 June.
130928 AFUND AR Txt PRINT_130928 AFUND Txt V9 28/01/2016 13:48 Page 24
Management and Administration
ManagerAberforth Unit Trust Managers Limited*14 Melville StreetEdinburgh EH3 7NSTelephone – Dealing: 0345 608 0940Telephone – Enquiries: 0131 220 0733Email: [email protected] (email): [email protected] Website: www.aberforth.co.uk
TrusteeNational Westminster Bank plc*Trustee & Depositary ServicesThe Younger Building1st Floor3 Redheughs AvenueEdinburgh EH12 9RH
Investment AdviserAberforth Partners LLP*14 Melville StreetEdinburgh EH3 7NS
RegistrarCapita Financial Administrators Limited* 2 The BoulevardCity West One Office ParkGelderd RoadLeeds LS12 6NTTelephone: 0345 608 0940
CustodianThe Northern Trust Company* 50 Bank StreetCanary WharfLondon E14 5NT
AuditorsPricewaterhouseCoopers LLPAtria One144 Morrison StreetEdinburgh EH3 8EX
J. Thomson Colour Printers
*Authorised and regulated by the Financial Conduct Authority
Buying and SellingThe terms on which units can be bought and sold are set out in the Prospectus, Supplementary Information Document andApplication Pack that are all available on the Manager’s website www.aberforth.co.uk. These documents provide the most upto date terms on which Units are issued and redeemed, how and when money is held in a client money account and the risksrelating to that.
Units may be bought and sold by contacting the Manager by telephone using the dealing number shown above. Alternatively,please contact Capita, the Registrar, using the address above or by email ([email protected]). In addition, orderscan be placed electronically via various transaction networks including EMX and Calastone. Valuation of the Fund takes placeeach business day at 4.30 pm on a forward pricing basis.
Regulatory DevelopmentsDue to further changes being implemented across Europe to gather more information about investments being made byoverseas investors, the Manager is required to submit a report to HMRC on an annual basis to provide details of all investmentsheld and dividends received by overseas investors. Further information is available on the Manager’s website.
Changes were also made by the Financial Conduct Authority in relation to their Rules on how client money and assets handledwith effect from 1 June 2015. For further information, please refer to the current version of the Supplementary InformationDocument for the Fund which is also available on the Manager’s website.
130928 AFUND AR Cov PRINT_130928 AFUND Cov V9 28/01/2016 13:35 Page 3

130928 AFUND AR Cov PRINT_130928 AFUND Cov V9 28/01/2016 13:35 Page 4