ability of a minimum microbial food web model to reproduce
TRANSCRIPT
s 64 (2007) 15–34www.elsevier.com/locate/jmarsys
Journal of Marine System
Ability of a “minimum” microbial food web model to reproduceresponse patterns observed in mesocosms manipulated
with N and P, glucose, and Si
T. Frede Thingstad a,⁎, Harry Havskum b, Ulla Li Zweifel c, Elisa Berdalet d,M. Montserrat Sala d, Francesc Peters d, Miquel Alcaraz d, Renate Scharek d,
Maite Perez e, Stéphan Jacquet f,1, Gro Anita Fonnes Flaten a, John R. Dolan e,Celia Marrasé d, Fereidoun Rassoulzadegan e, Åke Hagstrøm c, Daniel Vaulot f
a Department of Biology, University of Bergen, Jahnebakken 5, N-5020 Bergen, Norwayb Marine Biological Laboratory, University of Copenhagen, Strandpromenaden 5, DK-3000 Helsingør, Denmark
c Kalmar University, Department of Natural Sciences, Smålandsgatan 24, Norra Vägen P.O. Box 905, S-39129 Kalmar, Swedend Institut de Ciències del Mar, CMIMA (CSIC), Passeig Marítim de la Barceloneta 37-49, E-08003 Barcelona, Catalunya, Spain
e Université Paris6, Laboratoire d'Océanographie de Villefranche UMR CNRS 7093, Marine Microbial Ecology Group,Station Zoologique, BP 28, F-06230 Villefranche-sur-Mer, France
f Station Biologique, Université Pierre et Marie Curie (Paris VI), BP 74, F-29682 Roscoff Cx, France
Received 1 September 2005; received in revised form 1 February 2006; accepted 10 February 2006Available online 22 June 2006
Abstract
We compared an idealised mathematical model of the lower part of the pelagic food web to experimental data from a mesocosmexperiment in which the supplies of mineral nutrients (nitrogen and phosphorous), bioavailable dissolved organic carbon (BDOC,as glucose), and silicate were manipulated. The central hypothesis of the experiment was that bacterial consumption of BDOCdepends on whether the growth rate of heterotrophic bacteria is limited by organic-C or by mineral nutrients. In previous work, thishypothesis was examined qualitatively using a conceptual food web model. Here we explore the extent to which a “simplestpossible” mathematical version of this conceptual model can reproduce the observed dynamics. The model combines algal–bacterial competition for mineral nutrients (phosphorous) and accounts for alternative limitation of bacterial and diatom growthrates by organic carbon and by silicate, respectively. Due to a slower succession in the diatom–copepod, compared to theflagellate–ciliate link, silicate availability increases the magnitude and extends the duration of phytoplankton blooms induced bymineral nutrient addition. As a result, Si interferes negatively with bacterial consumption of BDOC consumption by increasing andprolonging algal–bacterial competition for mineral nutrients. In order to reproduce the difference in primary production between Siand non-Si amended treatments, we had to assume a carbon overflow mechanism in diatom C-fixation. This model satisfactorilyreproduced central features observed in the mesocosm experiment, including the dynamics of glucose consumption, algal, bacterial,and mesozooplankton biomass. While the parameter set chosen allows the model to reproduce the pattern seen in bacterialproduction, we were not able to find a single set of parameters that simultaneously reproduces both the level and the patternobserved for bacterial production. Profound changes in bacterial morphology and stoichiometry were reported in glucose-amended
⁎ Corresponding author.E-mail address: [email protected] (T.F. Thingstad).
1 Present address: Station INRA d'Hydrobiologie Lacustre, UMR CARRTEL, BP 511, 74203 Thonon, France.
0924-7963/$ - see front matter © 2006 Elsevier B.V. All rights reserved.doi:10.1016/j.jmarsys.2006.02.009

16 T.F. Thingstad et al. / Journal of Marine Systems 64 (2007) 15–34
mesocosms. Our “simplest possible” model with one bacterial population with fixed stoichiometry cannot reproduce this, and wesuggest that a more elaborate representation of the bacterial community is required for more accurate reproduction of bacterialproduction.© 2006 Elsevier B.V. All rights reserved.
Keywords: Food webs; Growth regulators; Models; Microbiology; Mesocosms
1. Introduction
Relatively simple models with a linear nutrient–phytoplankton–zooplankton food chain reflect manyessential aspects of the pelagic ecosystem. Such linearfood chain models, however, do not exploit the insightgained over the last two decades concerning the activitiesand importance of marine microbes. Attempts have beenmade to account for small organisms by arranginggroups of phytoplankton and zooplankton according tosize (Moloney and Field, 1991) but these neglectheterotrophic bacteria. These organisms have longbeen recognised as playing a central role in the pelagiccarbon cycle (Pomeroy, 1974; Williams, 1981; Azam etal., 1983) and need also to be included in such structures,in particular if the aim is an understanding of the pelagicC-cycle. Over 20 years ago, in the description of themicrobial loop (Azam et al., 1983), bacterial carbondemand was recognised as potentially controlled byinteractions between distinct factors such as bacterialphysiology, predation, nutrient competition, and autoch-thonous release of dissolved organic matter from thefood web.
Fig. 1. Flow structure for mineral nutrient (phosphorous used in model descripof osmotrophic organisms compete for the common mineral nutrient, three fuThe partitioning of flows is potentially influenced by BDOC and silicate, alloand diatom growth rates, respectively. The shaded area, containing a total phopart of the system” in the text. This part is assumed to be in internal steady
The importance of heterotrophic bacteria in marinefood webs is today generally accepted and it is recognisedthat a substantial fraction of the flowof inorganic nutrientsmay enter the particulate food web via heterotrophicbacteria (Rigler, 1956; Harrison et al., 1977; Wheeler andKirchman, 1986; Suttle et al., 1990; Kirchman, 1994).More recently, experimental evidence has also accumu-lated for a widespread occurrence of situations wherebacterial growth may be limited by mineral nutrients (e.g.N or P) rather than by organic carbon (Pomeroy et al.,1995; Rivkin and Anderson, 1997; Zohary and Robarts,1998; Sala et al., 2002; Van Wambeke et al., 2002).
As one tool in the search for a deeper understanding ofthe nature of the microbial part of the pelagic food web,many authors have used mathematical models that focuson various aspects of bacterial growth and transformationof matter (Billen and Servais, 1989; Fasham et al., 1990;Taylor and Joint, 1990; Baretta-Bekker et al., 1995;Vallino et al., 1996; Baretta-Bekker et al., 1997; Thingstadet al., 1999a,b; Van den Meersche et al., 2004). Since wenow know that bacterial growth in natural communitiescan be limited alternatively by mineral nutrients or byorganic carbon (Thingstad and Lignell, 1997), a
tion) through the “minimum”model food web. Three functional groupsnctional groups of phagotrophs prey selectively on these competitors.wing for the possibilities of C-limitation and Si-limitation of bacterialsphorous concentration Pt, corresponds to what is termed “the microbialstate at time=0.
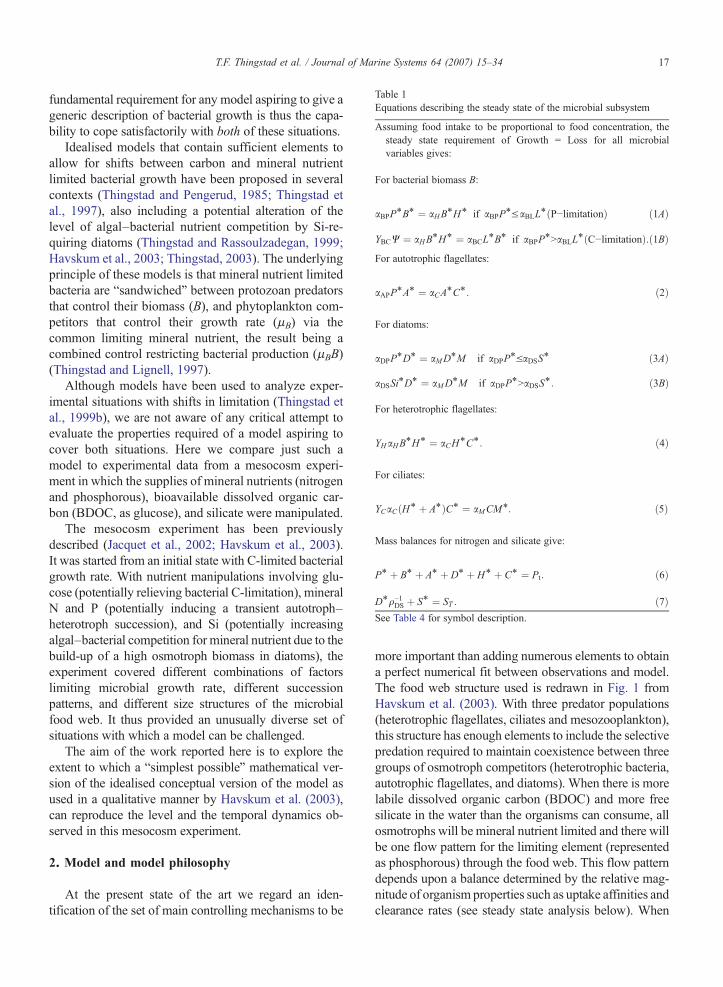
Table 1Equations describing the steady state of the microbial subsystem
Assuming food intake to be proportional to food concentration, thesteady state requirement of Growth = Loss for all microbialvariables gives:
For bacterial biomass B:
aBPP⁎B⁎ ¼ aHB
⁎H⁎ if aBPP⁎V aBLL⁎ðP−limitationÞ ð1AÞ
YBCW ¼ aHB⁎H⁎ ¼ aBCL
⁎B⁎ if aBPP⁎NaBLL
⁎ðC−limitationÞ:ð1BÞFor autotrophic flagellates:
aAPP⁎A⁎ ¼ aCA
⁎C⁎: ð2Þ
For diatoms:
aDPP⁎D⁎ ¼ aMD
⁎M if aDPP⁎VaDSS⁎ ð3AÞ
aDSSi⁎D⁎ ¼ aMD
⁎M if aDPP⁎NaDSS
⁎: ð3BÞ
For heterotrophic flagellates:
YHaHB⁎H⁎ ¼ aCH
⁎C⁎: ð4Þ
For ciliates:
YCaCðH⁎ þ A⁎ÞC⁎ ¼ aMCM⁎: ð5Þ
Mass balances for nitrogen and silicate give:
P⁎ þ B⁎ þ A⁎ þ D⁎ þ H⁎ þ C⁎ ¼ Pt: ð6Þ
D⁎q−1DS þ S⁎ ¼ ST : ð7ÞSee Table 4 for symbol description.
17T.F. Thingstad et al. / Journal of Marine Systems 64 (2007) 15–34
fundamental requirement for any model aspiring to give ageneric description of bacterial growth is thus the capa-bility to cope satisfactorily with both of these situations.
Idealised models that contain sufficient elements toallow for shifts between carbon and mineral nutrientlimited bacterial growth have been proposed in severalcontexts (Thingstad and Pengerud, 1985; Thingstad etal., 1997), also including a potential alteration of thelevel of algal–bacterial nutrient competition by Si-re-quiring diatoms (Thingstad and Rassoulzadegan, 1999;Havskum et al., 2003; Thingstad, 2003). The underlyingprinciple of these models is that mineral nutrient limitedbacteria are “sandwiched” between protozoan predatorsthat control their biomass (B), and phytoplankton com-petitors that control their growth rate (μB) via thecommon limiting mineral nutrient, the result being acombined control restricting bacterial production (μBB)(Thingstad and Lignell, 1997).
Although models have been used to analyze exper-imental situations with shifts in limitation (Thingstad etal., 1999b), we are not aware of any critical attempt toevaluate the properties required of a model aspiring tocover both situations. Here we compare just such amodel to experimental data from a mesocosm experi-ment in which the supplies of mineral nutrients (nitrogenand phosphorous), bioavailable dissolved organic car-bon (BDOC, as glucose), and silicate were manipulated.
The mesocosm experiment has been previouslydescribed (Jacquet et al., 2002; Havskum et al., 2003).It was started from an initial state with C-limited bacterialgrowth rate. With nutrient manipulations involving glu-cose (potentially relieving bacterial C-limitation), mineralN and P (potentially inducing a transient autotroph–heterotroph succession), and Si (potentially increasingalgal–bacterial competition for mineral nutrient due to thebuild-up of a high osmotroph biomass in diatoms), theexperiment covered different combinations of factorslimiting microbial growth rate, different successionpatterns, and different size structures of the microbialfood web. It thus provided an unusually diverse set ofsituations with which a model can be challenged.
The aim of the work reported here is to explore theextent to which a “simplest possible” mathematical ver-sion of the idealised conceptual version of the model asused in a qualitative manner by Havskum et al. (2003),can reproduce the level and the temporal dynamics ob-served in this mesocosm experiment.
2. Model and model philosophy
At the present state of the art we regard an iden-tification of the set of main controlling mechanisms to be
more important than adding numerous elements to obtaina perfect numerical fit between observations and model.The food web structure used is redrawn in Fig. 1 fromHavskum et al. (2003). With three predator populations(heterotrophic flagellates, ciliates and mesozooplankton),this structure has enough elements to include the selectivepredation required to maintain coexistence between threegroups of osmotroph competitors (heterotrophic bacteria,autotrophic flagellates, and diatoms). When there is morelabile dissolved organic carbon (BDOC) and more freesilicate in the water than the organisms can consume, allosmotrophs will be mineral nutrient limited and there willbe one flow pattern for the limiting element (representedas phosphorous) through the food web. This flow patterndepends upon a balance determined by the relative mag-nitude of organism properties such as uptake affinities andclearance rates (see steady state analysis below). When

Table 2Some properties of the steady state when all osmotrophs are P-limited
As long as ciliates are present (C⁎N0), the sum of flagellates (H⁎+A⁎)is always proportional to ciliate loss rate σαMM (from Eq. (5)):
H⁎ þ A⁎ ¼ raMYCaC
M : ð8Þ
As long as heterotrophic flagellates are present (H⁎N0), bacterial biomassis always proportional to the biomass of ciliates (from Eq. (4)),
B⁎ ¼ aCC⁎
YHaH: ð9Þ
As long as autotrophic flagellates are present, ciliates (C⁎) and freemineral nutrients (P⁎) are proportional (from Eq. (2)).
C⁎ ¼ aAPaC
P⁎ ð10Þ
A similar argument relates heterotrophic flagellates (H⁎) to freemineral nutrients (P⁎) (from Eq. (1A)):
H⁎ ¼ aBPaH
P⁎ ð11Þ
When diatoms are present (D⁎N0) and P-limited, Eq. (3A) is valid,and:
P⁎ ¼ aMaDP
M : ð12Þ
Eqs. (11) and (12) can be inserted into Eq. (8) to give A⁎:
A⁎ ¼ rYCaC
−aBP
aHaDP
� �aMM : ð13Þ
In the case of diatoms present and all osmotrophs N-limited, all statevariables P⁎, B⁎, A⁎, H⁎, and C⁎, become proportional tomesozooplankton biomass M. Insertion of this into the massbalance requirement Eq. (6), steady state diatom biomass becomes alinear function of total nutrient content Pt and M:
D⁎ ¼ Pt−raC
− 1þ 1þ aCYHaH
� �aAPaC
� �1aDP
� �aMM : ð14Þ
Since both B⁎ and P⁎ are proportional to M when both diatoms (Eq.(3A) valid) and bacteria (Eq. (1A) valid) are P-limited, bacterialproduction (BPP) become proportional to the 2nd power of M:
BP⁎P ¼ aBPP⁎B⁎ ¼ Y−1
HaBPaAPaHa2DP
a2MM2: ð15Þ
Using Eq. (14), we see that the possibility for diatoms to establish inthe system (D⁎N0) depends on the partitioning of the limitingelement between the microbial part of the system (Pt) andmesozooplankton (M). The critical value for this ratio, belowwhich diatoms disappear from the system is (obtained by settingD⁎=0 in Eq. (14)) :
ðPt=MÞcrit ¼ raC
− 1þ 1þ aCYHaH
� �aAPaC
� �1aDP
� �aM ð16Þ
Table 3Steady state when bacteria are C-limited
Carbon-limited bacterial production BPC is given by (from Eq. (1B)):
BP⁎C ¼ YBCW: ð17ÞBacterial production realised at steady state must be the smallest of thetwo values BPC
⁎ and BPP⁎. This can be summarised in a
dimensionless limitation index g ¼ BP⁎P =BP⁎C . Bacteria will be
carbon-limited if ηN1, P-limited if ηb1. Combining Eqs. (15) and(17) gives:
g ¼ Y−1BCY
−1H
aBPaAPaHa2DP
a2MW
M2 for D⁎N0 and S⁎NaDPaDS
P⁎: ð18Þ
The same type of arguments can be used to derive a somewhat morecomplex expression for η in cases with diatoms present but Si-limited, or when diatoms are absent (not shown).
Carbon limited bacterial growth rate combined with diatoms presentand P-limited imply that (from Eq. (1B))
H⁎ ¼ YBCWaHB⁎
¼ YBCYHaDPaAP
WaMM
ð19Þ
H⁎ in this case thus increases in proportion to organic supply Ψ anddecreases with mesozooplankton predation pressure. Increases/decreases in H⁎ will have corresponding decreases/increases in A⁎
as determined by Eq. (13).When bacterial growth rate is C-limited, there is also a steady statecondition for the BDOC pool:
L⁎ ¼ YBCWaBCB
ð20Þ
18 T.F. Thingstad et al. / Journal of Marine Systems 64 (2007) 15–34
heterotrophic bacteria become C-limited or diatoms Si-limited, flow into the food web's left “bacterial” or itsright “classical” side, respectively, will be restricted. Thisproposed idealisation of the food web thus bestows asomewhat symmetric role to BDOC and silicate in theircontrol of the food web flow pattern.
Mathematical descriptions basically using Lotka–Volterra type formulations to represent microbial foodwebs have been demonstrated to be powerful enough toexplain some of the essential features of nutrient-manipulated mesocosms (Thingstad et al., 1999a,b)characterised by phosphorous-limited growth rate ofboth phytoplankton and heterotrophic bacteria. Startingwith a combination of C-limited bacteria and the pre-sence of free silicate (Jacquet et al., 2002; Havskum etal., 2003), the initial state of the mesocosm experimentused here for model comparison differed considerablyfrom those previously analysed where bacteria wereinitially P-limited and the models used did not containdiatoms (Thingstad et al., 1999a,b).
A simulation model can be tuned to fit experimentaldata in three ways: 1) by modifying the structure of themodel, 2) by modifying the numerical values of modelparameters, and 3) by modifying the initial values of thestate variables. With so many degrees of freedom, anyonethat has attempted to model natural ecosystems willprobably have experienced the feeling of building castleson a sandy foundation. The degrees of freedom can bereduced considerably if, at the start of the experiment, themicrobial part of the food web (shaded area in Fig. 1) canbe considered to be in internal steady state. In our

Table 4List of symbols
Symbol Meaning Initial/parametervalue
Unit
State variables (superscript “⁎” used to denote steady state values)B Biomass bacteria From Eq. (9) nmol-P L−1
A Biomass autotrophic flagellates From Eq. (13) nmol-P L−1
D Biomass diatoms From Eq. (14) nmol-P L−1
H Biomass heterotrophic flagellates From Eq. (8) nmol-P L−1
C Biomass ciliates From Eq. (10) nmol-P L−1
M Biomass mesozooplankton 40 nmol-P L−1
P Free bioavailable phosphate From Eq. (12) nmol-P L−1
L Bioavailable dissolved organic carbon (BDOC) From Eq. (20) nmol-C L−1
S Free silicate 4000 nmol-Si L−1
Affinities, clearance ratesαBP Bacterial affinity for P 0.08 L nmol-P−1 h−1
αBL Bacterial affinity for L 5.3 10−6 L nmol-P−1 h−1
αAP Autotrophic flagellate affinity of for P 0.04 L nmol-P−1 h−1
αDP Diatom affinity for P 0.03 L nmol-P−1 h−1
αDS Diatom affinity for S 0.0012 L nmol-P−1 h−1
αH Heterotrophic flagellate clearance rate for bacteria 0.0015 L nmol-P−1 h−1
αC Ciliate clearance rate for auto- and heterotrophic flagellates 0.0005 L nmol-P−1 h−1
αM Mesozooplankton clearance rate for diatoms 0.00015 L nmol-P−1 h−1
σ Mesozooplankton selectivity factor for ciliates relative to diatoms 2 Dimensionless
Maximum growth ratesμBm Maximum growth rate B 0.25 h−1
μAm Maximum growth rate A 0.054 h−1
μDm Maximum growth rate D 0.063 h−1
μHm Maximum growth rate H 0.1 h−1
μCm Maximum growth rate C 0.05 h−1
μMm Maximum growth rate M 0.00625 h−1
YieldsYBC Bacterial yield on L 0.004 nmol-P nmol-C−1
YH Heterotrophic flagellate yield on bacteria 0.3 nmol-P nmol-P−1
YC Ciliate yield on auto- and heterotrophic flagellates 0.2 nmol-P nmol-P−1
YM Mesozooplankton yield on ciliates and diatoms 0.15 nmol-P nmol-P−1
Forcing parameters for microbial part of the systemΨ Supply rate of L nmol-C L−1h−1
Pt Total -P in microbial part of the food web 220 nmol-P L−1
St Total bioavailable silicium nmol-Si L−1
Stoichiometric ratios and conversion factors:ρB Molar carbon:phosphorous ratio in bacteria 50 nmol-C nmol-P−1
ρA Molar carbon:phosphorous ratio in phytoplankton 106 nmol-C nmol-P−1
ρDS Molar phosphorous:silicate ratio of diatoms 0.04 nmol-Si nmol-P−1
ρChl Carbon:chlorophyll ratio (w:w) 60
Othersγ Fraction of consumed diatom Si that is remineralised to free Si 0.25 DimensionlessεA Autotrophic flagellate ability to turn off excess C-fixation 1 DimensionlessεD Diatom ability to turn off excess C-fixation 0 Dimensionlessk Proportionality constant between production of L and PT
2 1.1 10−4 nmol-C L−1 h−1
(nmol-P L−1)−2
δM Loss rate of mesozooplankton 0 d−1
η Limitation index (from Eq. (18)) 9.6 DimensionlessELi Experimental input rate of L, i=1…10 for the 10 different mesocosm treatments See Table 5 nmol-C L−1h−1
ESi Experimental input rate of S, i=1…10 for the 10 different mesocosm treatments See Table 5 nmol-Si L−1h−1
EPi Experimental input rate of P, i=1…10 for the 10 different mesocosm treatments See Table 5 nmol-P L−1h−1
19T.F. Thingstad et al. / Journal of Marine Systems 64 (2007) 15–34

Table 5Codes used for the 10 different mesocosm manipulations simulated
Eight mesocosms forming two gradients, parallel in daily glucoseadditions
C-gradientNo Si added
CSi-gradient Si kept replete byadditions starting after 3.5 d
Glucose-C addedμmol m−3 d−1
C0 C0Si 0C1 C1Si 10600C3 C3Si 31800C10 C10Si 106000
Two control mesocosms receiving no mineral nutrients
K 0KC10 106000
Eight of these received a daily dose of 100 μmol PO4–P and1600 μmol NO3–Nm−3 d−1 and was split into two series (C0–C10, andCSi0–CSi10) forming gradients identical in their glucose addition, butdiffering in their Si-addition after day 3.5 by Si being depleted bydiatom growth in the C-series, while Si was kept replete in the CSi-series. The two remaining treatments were one control without anyadditions (K) and one with only the 10× Redfield addition of glucose(KC10).
Table 6Differential equations used for simulating the response to nutrientmanipulations in each mesocosm
dBdt
¼ lBB−Y−1H lHH ð21Þ
dAdt
¼ lAA−A
Aþ HY−1C lCC ð22Þ
dDdt
¼ lDD−D
Dþ rCY−1M lMM ð23Þ
dHdt
¼ lHH−H
Aþ HY−1C lCC ð24Þ
dCdt
¼ lCC−rC
Dþ rCY−1M lMM ð25Þ
dMdt
¼ lMM−dMM ð26Þ
dPdt
¼ð1−YH ÞYH
lHH þ 1−YCYC
lCC þ 1−YMYM
lMM
−lBB−lAA−lDDþ EPi
dLdt
¼ kðPt þMÞ2−Y−1BClBBþ ELi ð28Þ
dSdt
¼ q−1DS Y−1M
DDþ rC
lMM−lDDM� �
þ ESi ð29Þ
lB ¼ minðaBPP; aBLL;lmB Þ ð30Þ
lA ¼ minðaAPP;lmA Þ ð31Þ
lD ¼ minðaDPP; aDSS; lmDÞ ð32Þ
lH ¼ minðYHaHB; lmH Þ ð33Þ
lC ¼ minðYCaCðH þ AÞ;lmC Þ ð34Þ
lm ¼ minðYMaM ðDþ rCÞ;lmM Þ ð35Þ
20 T.F. Thingstad et al. / Journal of Marine Systems 64 (2007) 15–34
mesocosm experiment, temporal changes in the controlmesocosms were small, indicating that such an assump-tion is a valid first approximation. In addition to therequirement that the model should be able to reproducethe response patterns observed to different manipulations,we then also have the condition that it should be able toproduce an initial steady state in reasonable agreementwith observations.
2.1. The initial steady state
If we make the assumption that all populations in themicrobial part of the system are food limited at steadystate, so that food uptake can be considered proportionalto food concentration, the analytical solution to a Lotka–Volterra representation of the system (Table 1) is fairlyeasy to derive (Tables 2 and 3). This solution expresses allstate variables in terms of the two forcing variables: 1)total phosphate in themicrobial part of the system (Pt) and2) phosphate in mesozooplankton (M ). The solutioncontains a set of “physiological parameters” characteris-ing the organisms (symbols and parameter values sum-marised in Table 4). These are the proportionalityconstants between food concentration and food consump-tion (α-parameters), and the yield parameters (Y-para-meters), that represent the fraction of limiting element inprey that is incorporated into the predator. Also, YBC, andρDS represent the stoichiometric coupling betweenconsumption of BDOC and silicate, and the formationof bacterial and diatom biomass, respectively.
The steady state is computed with the supply rate (Ψ )of BDOC as an independent parameter. Note that thesteady state requirements for bacteria (Eqs. (1A) and(1B)) and for diatoms (Eqs. (3A) and (3B)) each lead totwo alternative equations, depending upon the type ofgrowth rate limitations (mineral nutrient (P) or BDOC (L)for bacteria, mineral nutrient (P) or silicate (S) fordiatoms).
Table 2 gives the steady-state solution for the case whenall organism groups are present, and all osmotrophs (bac-teria, autotrophic flagellates, and diatoms) are P-limited.Diatom presence and dominance in the initial communitythen depends on the ratio (Pt:M ) between the two forcingvariables (Table 2 Eqs. (14) and (16)). Relative dominancebetween diatoms and autotrophic flagellates in the initialcommunity is thus an emergent property of the initial value

Table 7Periods with different types of modelled growth rate limitation for bacteria (B) and diatoms (D) in the different mesocosms
C-limitation of bacterial growth rate indicated by hatched, Si-limitation of diatoms by dotted areas. P-limitation indicated by open areas both fordiatoms and bacteria.
21T.F. Thingstad et al. / Journal of Marine Systems 64 (2007) 15–34
of the forcing variables (Pt andM ) and the set of numericalvalues chosen for the physiological parameters.
Since, at steady state, bacteria cannot consume moreBDOC than produced, YBCΨ defines a maximum steadystate bacterial production. Following Thingstad (2003),this can be used to define a dimensionless “limitationindex” η (Eq. (18)) that relates physiological and forcingparameters so that ηN1 and ηb1 correspond to steadystates with carbon- and mineral-nutrient limited bacterialgrowth, respectively (Eq. (18)). For the values used here(Table 4), η=9.6, and the initial state is thus characterisedby a strong carbon-limitation of bacterial growth rate.
With diatoms present and all osmotrophs P-limited,steady state values for all state variables, except diatoms,
in the microbial sub-system (i.e. P⁎, B⁎, A⁎,H⁎, andC⁎)are independent of the total nutrient content Pt, butproportional to diatom loss rate, which again is propor-tional to mesozooplankton biomass (αMM). Diatom bio-mass (D⁎) on the other hand decreases with M, butincreases with Pt (Eq. (14)). High nutrient content in themicrobial part will thus give high diatom biomass, whilea high fraction of total biomass in mesozooplankton willgive a low value for diatoms and high values for all theother state variables in the microbial part. With a suffi-ciently high ratio between biomass in higher predatorsand nutrient content of the microbial system, diatomswill disappear (Eq. (16)). This leads to a different steadystate solution not discussed here.

22 T.F. Thingstad et al. / Journal of Marine Systems 64 (2007) 15–34
The model also contains a selectivity coefficient σfor mesozooplankton predation on ciliates, allowing for apotential difference in mesozooplankton clearance rate of
Fig. 2. Temporal changes in dissolved organic carbon (DOC) modelled (left cRedfield ratio between daily additions of glucose-C and mineral nutrient areadded are marked with solid lines (model) or solid lines and open circles (o(model) or dotted lines and filled circles (observations). Control mesocosmsobservations, respectively) and KC10 (dotted line, dotted line — filled trianglscale on y-axis for modelled and observed results. Observational data from
ciliates and diatoms. Increasing the selectivity σ for ci-liates will increase the steady state concentration ofautotrophic flagellates while diatom concentration
olumn) and observed (right column). Mesocosms with 0, 1, 3 and 10×shown in rows 1,2,3 and 4, respectively. Mesocosms without silicate
bserved). Mesocosms with silicate added are marked with dotted linesKa and Kb (solid line and solid line — open triangles for model andes for model and observations, respectively) are shown in line 5. SameHavskum et al. (2003).

23T.F. Thingstad et al. / Journal of Marine Systems 64 (2007) 15–34
decreases (Eqs. (13) and (14)). Changing σ will thuschange the diatom:flagellate balance in the steady statephytoplankton community.
In this model, diatoms (when present) and autotrophicflagellates compete with bacteria, but alsowith each other,for the limiting mineral nutrient. Interestingly, this givesthe somewhat counterintuitive net effect that mineralnutrient limited bacterial production BPP⁎ increases pro-portionally to autotroph flagellate affinity (αAP) when
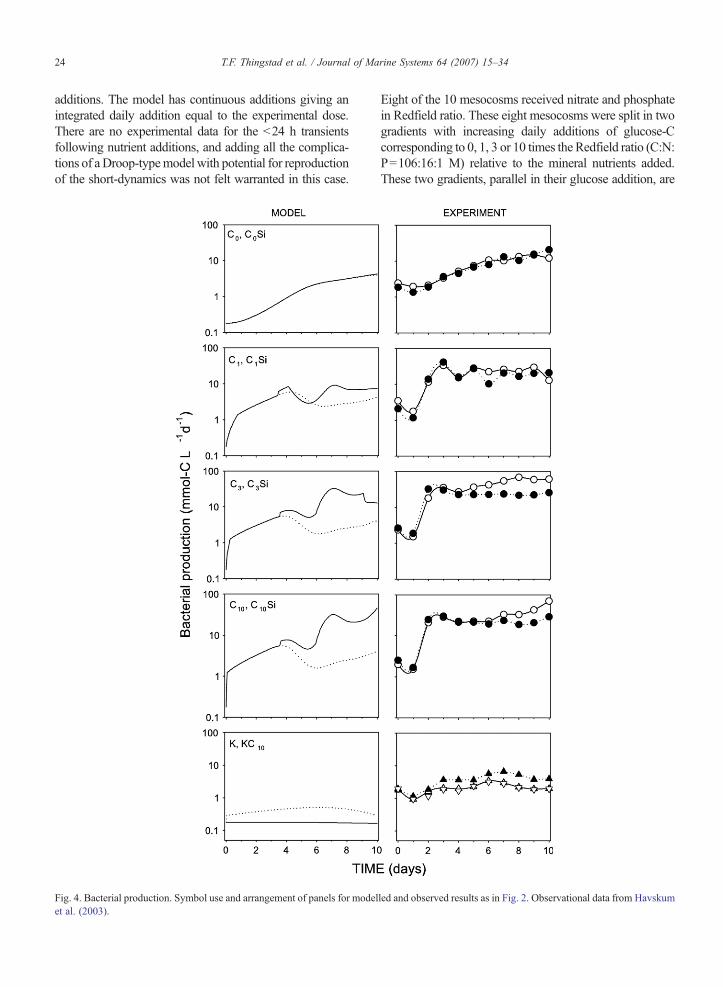
Fig. 3. Turnover-time for glucose. Symbol use and arrangement of panels foHavskum et al. (2003).
diatoms are present. Diatom affinity (αDP), however,exerts a strong negative effect through its squared inverserelationship to BPP⁎ (Eq. (15)).
3. Simulating the response to mesocosmmanipulations
The mesocosm manipulations used are summarised inTable 5 (see Havskum et al. (2003) for further details). Inthe experiment, nutrients were added as single daily
r modelled and observed results as in Fig. 2. Observational data from
24 T.F. Thingstad et al. / Journal of Marine Systems 64 (2007) 15–34
additions. The model has continuous additions giving anintegrated daily addition equal to the experimental dose.There are no experimental data for the b24 h transientsfollowing nutrient additions, and adding all the complica-tions of aDroop-typemodel with potential for reproductionof the short-dynamics was not felt warranted in this case.
Fig. 4. Bacterial production. Symbol use and arrangement of panels for modelet al. (2003).
Eight of the 10 mesocosms received nitrate and phosphatein Redfield ratio. These eight mesocosms were split in twogradients with increasing daily additions of glucose-Ccorresponding to 0, 1, 3 or 10 times the Redfield ratio (C:N:P=106:16:1 M) relative to the mineral nutrients added.These two gradients, parallel in their glucose addition, are
led and observed results as in Fig. 2. Observational data from Havskum

25T.F. Thingstad et al. / Journal of Marine Systems 64 (2007) 15–34
subsequently called the C-series and the CSi-series, anddiffer only in their silicate addition.
In the C-series, the naturally occurring free silicate wasdepleted between day 3 and day 4, while in the CSi-series,silicate was kept replete by daily Si-additions from day 3(from 84 h in the model). Both in the model and in the
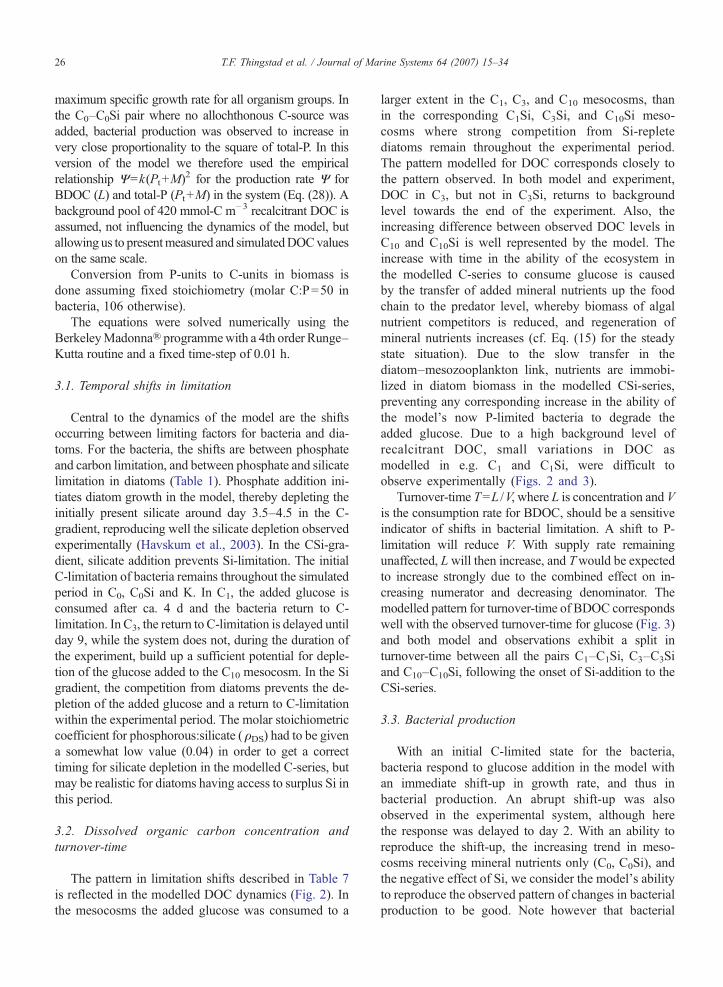
Fig. 5. Bacterial biomass. Symbol use and arrangement of panels for modelledal. (2003).
experiments, the pairs C0–C0Si, C1–C1Si, C3–C3Si andC10–C10Si are thus parallels for the first 3 d of the ex-periment. The dynamic behaviour of the food web modelwas described with the differential equations in Table 6,built on the same growth and loss terms as the steady stateequations in Table 1, but differing in the inclusion of a
and observed results as in Fig. 2. Observational data from Havskum et
26 T.F. Thingstad et al. / Journal of Marine Systems 64 (2007) 15–34
maximum specific growth rate for all organism groups. Inthe C0–C0Si pair where no allochthonous C-source wasadded, bacterial production was observed to increase invery close proportionality to the square of total-P. In thisversion of the model we therefore used the empiricalrelationship Ψ=k(Pt+M)2 for the production rate Ψ forBDOC (L) and total-P (Pt+M) in the system (Eq. (28)). Abackground pool of 420 mmol-C m−3 recalcitrant DOC isassumed, not influencing the dynamics of the model, butallowing us to presentmeasured and simulatedDOCvalueson the same scale.
Conversion from P-units to C-units in biomass isdone assuming fixed stoichiometry (molar C:P=50 inbacteria, 106 otherwise).
The equations were solved numerically using theBerkeleyMadonna® programmewith a 4th order Runge–Kutta routine and a fixed time-step of 0.01 h.
3.1. Temporal shifts in limitation
Central to the dynamics of the model are the shiftsoccurring between limiting factors for bacteria and dia-toms. For the bacteria, the shifts are between phosphateand carbon limitation, and between phosphate and silicatelimitation in diatoms (Table 1). Phosphate addition ini-tiates diatom growth in the model, thereby depleting theinitially present silicate around day 3.5–4.5 in the C-gradient, reproducing well the silicate depletion observedexperimentally (Havskum et al., 2003). In the CSi-gra-dient, silicate addition prevents Si-limitation. The initialC-limitation of bacteria remains throughout the simulatedperiod in C0, C0Si and K. In C1, the added glucose isconsumed after ca. 4 d and the bacteria return to C-limitation. In C3, the return to C-limitation is delayed untilday 9, while the system does not, during the duration ofthe experiment, build up a sufficient potential for deple-tion of the glucose added to the C10 mesocosm. In the Sigradient, the competition from diatoms prevents the de-pletion of the added glucose and a return to C-limitationwithin the experimental period. The molar stoichiometriccoefficient for phosphorous:silicate (ρDS) had to be givena somewhat low value (0.04) in order to get a correcttiming for silicate depletion in the modelled C-series, butmay be realistic for diatoms having access to surplus Si inthis period.
3.2. Dissolved organic carbon concentration andturnover-time
The pattern in limitation shifts described in Table 7is reflected in the modelled DOC dynamics (Fig. 2). Inthe mesocosms the added glucose was consumed to a
larger extent in the C1, C3, and C10 mesocosms, thanin the corresponding C1Si, C3Si, and C10Si meso-cosms where strong competition from Si-repletediatoms remain throughout the experimental period.The pattern modelled for DOC corresponds closely tothe pattern observed. In both model and experiment,DOC in C3, but not in C3Si, returns to backgroundlevel towards the end of the experiment. Also, theincreasing difference between observed DOC levels inC10 and C10Si is well represented by the model. Theincrease with time in the ability of the ecosystem inthe modelled C-series to consume glucose is causedby the transfer of added mineral nutrients up the foodchain to the predator level, whereby biomass of algalnutrient competitors is reduced, and regeneration ofmineral nutrients increases (cf. Eq. (15) for the steadystate situation). Due to the slow transfer in thediatom–mesozooplankton link, nutrients are immobi-lized in diatom biomass in the modelled CSi-series,preventing any corresponding increase in the ability ofthe model's now P-limited bacteria to degrade theadded glucose. Due to a high background level ofrecalcitrant DOC, small variations in DOC asmodelled in e.g. C1 and C1Si, were difficult toobserve experimentally (Figs. 2 and 3).
Turnover-time T=L /V, where L is concentration and Vis the consumption rate for BDOC, should be a sensitiveindicator of shifts in bacterial limitation. A shift to P-limitation will reduce V. With supply rate remainingunaffected, L will then increase, and Twould be expectedto increase strongly due to the combined effect on in-creasing numerator and decreasing denominator. Themodelled pattern for turnover-time of BDOC correspondswell with the observed turnover-time for glucose (Fig. 3)and both model and observations exhibit a split inturnover-time between all the pairs C1–C1Si, C3–C3Siand C10–C10Si, following the onset of Si-addition to theCSi-series.
3.3. Bacterial production
With an initial C-limited state for the bacteria,bacteria respond to glucose addition in the model withan immediate shift-up in growth rate, and thus inbacterial production. An abrupt shift-up was alsoobserved in the experimental system, although herethe response was delayed to day 2. With an ability toreproduce the shift-up, the increasing trend in meso-cosms receiving mineral nutrients only (C0, C0Si), andthe negative effect of Si, we consider the model's abilityto reproduce the observed pattern of changes in bacterialproduction to be good. Note however that bacterial

27T.F. Thingstad et al. / Journal of Marine Systems 64 (2007) 15–34
production in the initial state, in mesocosms suppliedwith mineral nutrients, but not with glucose (C0 andC0Si), and in the control (K), is about one order ofmagnitude lower in the model than in the observations.In the model, bacteria in these mesocosms remain C-limited throughout the simulated period and bacterialproduction is therefore directly proportional to the
Fig. 6. Chlorophyll—a. Symbol use and arrangement of panels for modelled a(2003).
system's production (Ψ ) of BDOC (bacterial yield YBCis a constant in the model). We could easily adjustparameters to fit the level of bacterial production, butfound no way to do this without a simultaneous dete-rioration, either of the simulated patterns of bacterialproduction, or in the model's performance in other res-pects (see Discussion for further details) (Fig. 4).
nd observed results as in Fig. 2. Observational data from Havskum et al.

28 T.F. Thingstad et al. / Journal of Marine Systems 64 (2007) 15–34
3.4. Bacterial biomass
When both mineral nutrients and glucose are added,the model produces predator–prey oscillations in thebacteria–heterotrophic flagellate system. Such oscilla-tions are also visible in the observed bacterial biomass.Bacterial biomass tends to be slightly lower in the modelthan in the observations. Bacterial biomass level in the
Fig. 7. Primary production. Symbol use and arrangement of panels for modellet al. (2003).
model is particularly sensitive to yield (YH) and clearancerate (αH) of heterotrophic flagellates (cf. Eq. (9));lowering of any of these would increase the modelledbacterial biomass. In accordance with reported values(Fagerbakke et al., 1996), we have used a lower C:P ratioin bacteria (ρB=50, M), than in other biomass (106).Removing this difference would obviously also increasebacterial C-biomass (Fig. 5).
ed and observed results as in Fig. 2. Observational data from Havskum

Fig. 8. Modelled heterotrophic flagellate (black) and ciliate (grey). Biomass represented as stacked area plots (upper limit of shaded area representstotal protozoan biomass). Panels in line 1, 2, 3 and 4 correspond to glucose-C additions of 0, 1, 3 and 10× Redfield of daily mineral nutrient additions,respectively. Mesocosms without and with silicate additions in left and right columns, respectively. Control mesocosms in line 5 with K in left andKC10 in right column.
29T.F. Thingstad et al. / Journal of Marine Systems 64 (2007) 15–34
3.5. Chlorophyll and primary production
For both model and observations, the addition ofsilicate to the CSi-series leads to a split in chlorophyll
levels with build-up of high chlorophyll levels in CSi-series, while chlorophyll in the C-series peaks in themiddle of the experimental period. The reduction onemight expect in chl in mesocosms where competition
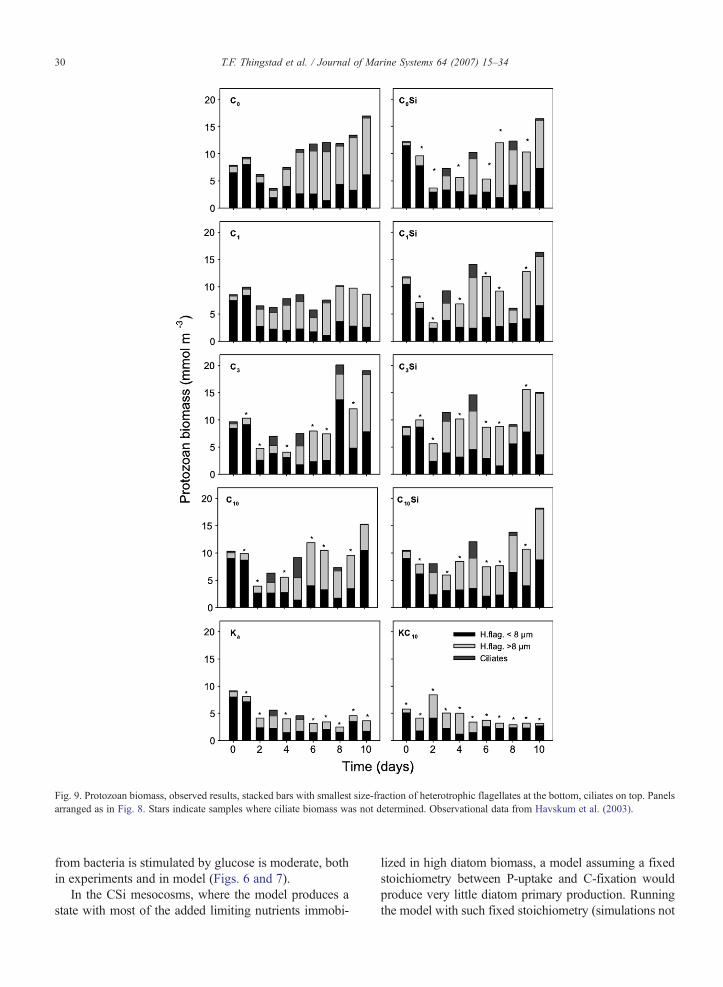
Fig. 9. Protozoan biomass, observed results, stacked bars with smallest size-fraction of heterotrophic flagellates at the bottom, ciliates on top. Panelsarranged as in Fig. 8. Stars indicate samples where ciliate biomass was not determined. Observational data from Havskum et al. (2003).
30 T.F. Thingstad et al. / Journal of Marine Systems 64 (2007) 15–34
from bacteria is stimulated by glucose is moderate, bothin experiments and in model (Figs. 6 and 7).
In the CSi mesocosms, where the model produces astate with most of the added limiting nutrients immobi-
lized in high diatom biomass, a model assuming a fixedstoichiometry between P-uptake and C-fixation wouldproduce very little diatom primary production. Runningthe model with such fixed stoichiometry (simulations not

Fig. 10. Modelled mesozooplankton biomass (upper panel) andobserved mesozooplankton abundance (lower panel). Open circleswith error bars represent mean and standard deviation for mesocosms ingradient C0–C10, open triangles with error bars represent mean andstandard deviation for mesocosms in gradient C0Si–C10Si, open andfilled squares represent K, andKC10 mesocosms, respectively. Note thaterror bars for modelled results (upper panel) represent differencesbetween treatments, in the case of observations (lower panel) theyrepresent the sum of variation due to differences between treatments andmeasurement errors. Observational data from Havskum et al. (2003).
31T.F. Thingstad et al. / Journal of Marine Systems 64 (2007) 15–34
shown) actually gave little difference in primary pro-duction between corresponding mesocosms in the C andCSi series. To be able to simulate the observed differencesin primary production between the C and the CSi series ofmesocosms, we found it necessary to include the potentialfor a C-overflow mechanism in primary production. Thiswas done by calculating diatom carbon fixation (PPD)from diatom biomass (D) and growth rate (μD) accordingto the equation PPD=ρA(μDD+(1−ε)(μDmax−μD)D),where ε represents the ability of nutrient limitedphytoplankton to turn off the part of their photosyntheticcapacity not being stoichiometrically coupled to growth.Themodel runs shown (Fig. 7) are done using the extremecase with ε=0 for diatoms (C-fixation continuesunaffected by mineral nutrient limitation) and ε=1 (noC-overflow) in the corresponding expression for autotro-phic flagellates, and reproduces in a reasonable mannerboth the pattern and the level of observed primaryproduction.
3.6. The protozoa
When bacterial growth rate is C-limited, the steady-state effect in the model is a shift in biomass from hete-rotrophic to autotrophic flagellates (Eq. (8) combined withEq. (11)), relative to the situationwhen bacteria aremineralnutrient limited. With a low bacterial production modelledin mesocosms without glucose addition (K, C0, C0Si),modelled biomass of heterotrophic flagellates is thereforelow, and the model's main response to an addition ofglucose alone (KC10) is an increase in biomass ofheterotrophic flagellates. Adding only mineral nutrients(C0) gives amodel response in autotrophic flagellates and asubsequent succession of ciliates. If Si is kept replete(C0Si), modelled phytoplankton response is shifted fromthose that serve as ciliate prey (autotrophic flagellates)towards those that are not (diatoms), and the ciliateresponse is therefore reduced. When bacterial C-limitationis released by glucose addition, the response in heterotro-phic flagellate biomass increases (C1, C3 and C10 com-pared to C0), while competition from Si-replete diatomsreduces this effect (C1Si, C3Si and C10Si compared to C1,C3 and C10, respectively) (Figs. 8 and 9).
Experimental data are available on biomass estimatesof microscopically observed ciliates, and on colourlessflagellates in different size-classes (Havskum et al., 2003).There is no direct way to compare these data to themodel's two functional groups of “those that eat bacteria”(termed heterotrophic flagellates in the model) and “thosethat eat flagellates” (termed ciliates). Tentatively, flagel-late data are here grouped in b8 μm and N8 μm cells as asomewhat arbitrary classification hoped to separate to
some extent between bacterial predators on one side, andpredators on small phytoplankton and the bacterialpredators on the other. Apart from a higher protozoanbiomass in mesocosms with mineral nutrients added (C-and CSi-series) than in controls without (K and KC10), wefound, however, few convincing trends in the observedresponse patterns of protozoa (Fig. 9).
3.7. Mesozooplankton
The initial value used for the model's mesozooplank-ton compartment M=40 μmol-P m−3 may seem highwhen compared to a total initial phosphorous content ofPt=220 μmol-P m−3 in the microbial part of the foodweb. Converted to biomass-C with a C:P=106:1 M Red-field ratio, modelled mesozooplankton biomass level ishowever in general agreement with the observed level ofmesozooplankton as collected in the N37 μm size fraction

32 T.F. Thingstad et al. / Journal of Marine Systems 64 (2007) 15–34
(Havskum et al., 2003). With its squared effect on η (Eq.(18)), high mesozooplankton biomassM is a strong factorin forcing the initial state of the model towards C-limitedbacterial growth. A high mesozooplankton biomass maythus be a clue to why this Danish fjord ecosystem appa-rently had C-limited bacteria. Adding mineral nutrientsleads to a succession, either via ciliates or via diatoms, tomesozooplankton, and thus to an increase with time inmodelled mesozooplankton biomass in both the C- andthe CSi-series. Neither the differences in organic-C supplyalong the C- and CSi-series, nor the difference in diatomdominance between the C- and CSi-series, lead to largedifferences in the modelled mesozooplankton biomass(Fig. 10d). As for microzooplankton, a large uncertaintyin the observational data, combined with uncertaintiesrelated to the correspondence between observed speciesand the models simple functional group of “mesozoo-plankton”, makes it difficult to make rigorous compar-isons between model and observational data (Fig. 10).
4. Discussion
Accumulation of DOC in the photic zone is currentlybelieved to be a core process in the oceanic C-cycle(Hansell, 2002). Since accumulation is the net result ofproduction, consumption, and export, proper understand-ing of all three mechanisms is a prerequisite for theconstruction ofmodels capable of representing the presentC-cycle and its potential response to climate change. Thework presented here primarily focuses on the consump-tion aspect by exploring the extent to which we couldmodel the consumption of allochthonous, easily bioavail-able DOC, added as glucose in the experimental work.The fundamental hypothesis explored here is that controlof such consumption is closely linked to whether bacterialgrowth is limited by mineral nutrients or by organic-C.
In order to represent the modifying effects of glucoseand Si additions on the flow of phosphorous through thefood web, a minimum of three osmotroph populationsseems to be required. To allow for steady states with allthree osmotroph populations coexisting on the same li-miting nutrient (free phosphate), we need the twoselective protozoan predators. In order to get a dynam-ically changing transfer of the limiting element out of themicrobial part of the food web, we also need mesozoo-plankton as a dynamic variable. The foodweb structure inFig. 1 therefore seems to be as close to our ideal of aminimum model as we could get for a natural systembelieved to contain a vast amount of trophic interactions,physiological mechanisms, and biological diversity. Themodel has two elements in the stoichiometric couplingdeviating from our “simplest possible” ideal. Bacteria
were, based on literature values, given a C:P-stoichiom-etry of 50 (molar), instead of the Redfield value of 106used for all other organisms. Also, based on mesocosmobservations and literature data, diatom C-fixation wasassumed to have a C-overflow mechanism (Engel et al.,2004) that assumed C-fixation to run independently ofdiatom growth rate limitation. This allows continued C-fixation in model states where mineral nutrients wereimmobilized in diatom biomass and was vital to get acorrect simulation of the effect of Si on primary pro-duction. Increased levels of organic-C in diatom-domi-nated communities is well documented experimentally(Egge and Jacobsen, 1997; Engel et al., 2002). Althoughdiverting from our ideal of a “simplest possible” model,the inclusion of a diatom-specific mechanism increasingthe ratio between C-fixation and mineral nutrientsassimilated, thus seems easily justified.
This simple model was exposed to what we consider arather demanding challenge: We wanted one single flowstructure, with one single set of parameters, to reproducenot only a steady state comparable to the observed, butalso to reproduce the dynamic transients resulting from9 different experimental perturbations, all starting fromthe same steady state.
In this perspective, we found it quite satisfactorythat the model had enough elements to reproduce wellthe observed variations in DOC and the turnover-timefor BDOC, meaning that the added glucose wasconsumed in reasonably correct amounts at reasonablycorrect times in the model. Central for the model'sability to do so is an ability to reproduce the timing inshifts in limitation states such as illustrated in Table 7.The model also produces, not only a qualitativelycorrect, but also quantitatively reasonably accurateeffects of Si on most of the observed variables (seeFigs. 2, 5, 6 and 10).
The major problem we could identify for this“minimum” model to reproduce the observations wasfor bacterial production. The parameter set used does areasonable job in reproducing the level of bacterialproduction late in the experiment in glucose-amendedbags, and also reproduces the early phenomenon of anabrupt shift-up in bacterial production in glucose-amended mesocosms. In the model, this abrupt shift-upis caused by the sudden release of C-limitation asglucose is added, and thus requires a parameter set thatgives a steady state characterized by limitation index(see Eq. (18)) η≫1. It is easy to give the model acorrect level of bacterial production in the control bagby increasing the production rate Ψ (e.g. by increasingthe parameter k by a factor of ∼ 10). However; to retainthe pattern with an initial shift-up in bacterial

33T.F. Thingstad et al. / Journal of Marine Systems 64 (2007) 15–34
production, either other parameters, or mesozooplank-ton biomass (M ) would then need to be changed subjectto the constraint that the expression (from Eq. (18))g ¼ Y−1
BCY−1H
aBPaAPaHa2DP
a2MW M 2 must remain ≫1, signifying a
strongly C-limited bacterial growth rate. We have notbeen able to change the model in this manner withoutseriously deteriorating its performance in other respects.Although we cannot from this exclude that such aparameter set exists, we suspect that some of the expla-nation for this problem lies in the profound biologicaleffects of glucose observed by Havskum et al. (2003) onthe bacterial community. If one combines the idea thatglucose addition forces bacteria to mineral nutrient limi-tation, with the prevalent idea that small organisms aresuperior competitors for mineral nutrients, one wouldtend to expect glucose to favour the selection of smallbacteria. Contrary to this theoretical line of argument,glucose addition was found to lead to a bacterialcommunity dominated by large “sausage”-formed bac-teria. Similarly Malits et al. (2004) also found that whenthe addition of organic carbon was unbalanced withrespect to inorganic nutrients, bacteria grew larger.Thingstad et al. (2005b) have recently argued that thismay be a special version of a strategy whereby someosmotroph micro-organisms use a non-limiting substrate(here glucose) to simultaneously increase nutrientaffinity and reduce predation. If such an interpretationis correct, the addition of glucose would change bacterialaffinity (αB), heterotrophic flagellate clearance rate (αH),as well as bacterial yield (YBC), and possibly the yield(YH) of heterotrophic flagellates, thus changing the valueof η (Eq. (18)). This would have profound effects on boththe steady state and the dynamics of transient responses,and we suspect that either a change of the flow structureby introducing an extra bacterial population, and/or achange to a much more flexible physiological control ofbacterial parameters, may be necessary in order toreproduce observed bacterial production under both C-and mineral nutrient limiting conditions. Such additionswould make the model much more complicated and lesstransparent, and have so far not been explored further.
Sharing the view that addition of complexity anddetail to present plankton models needs to be done insmall and well-understood steps (Anderson, 2005) wefeel that understanding the behaviour of “simplest pos-sible” models is a required step before adding moresophisticated biological detail. In light of this we feel theability of the model to quantitatively reproduce so muchof our experiment to be very encouraging, supporting theidea that its flow structure captures a central set of thecontrol mechanisms in the lower part of the pelagic foodweb. The conclusion that more sophisticated biological
detail need to be included in models when trying to re-produce dynamic responses following from drastic shiftsin limitation, is in accordance with recent experiencefrom other nutrient manipulation experiments (Thing-stad et al., 2005a).
Acknowledgements
This work was financed by the EC through contractsEVK3-CT2000-00034 “DOMAINE”, EVK3-CT-2000-00022 “NTAP”, EVK3-CT-2002-0078 “BASICS”, andTMR-Contract MAS3-CT96-5034; and by the ResearchCouncil of Norway project 158936.
References
Anderson, T.R., 2005. Plankton functional type modelling: runningbefore we can walk? J. Plankton Res. 27 (11), 1073–1081.
Azam, F., Fenchel, T., Field, J.G., Gray, J.S., Meyer-Reil, L.A.,Thingstad, T.F., 1983. The ecological role of water-columnmicrobes in the sea. Mar. Ecol., Prog. Ser. 10, 257–263.
Baretta-Bekker, J.G., Baretta, J.W., Koch Rasmussen, E., 1995. Themicrobial food web in the european regional seas ecosystemmodel. Neth. J. Sea Res. 33, 363–379.
Baretta-Bekker, J.G., Baretta, J.W., Ebenhoh, W., 1997. Microbialdynamics in the marine ecosystem model ERSEM II with decoupledcarbon assimilation and nutrient uptake. J. Sea Res. 38, 195–211.
Billen, G., Servais, P., 1989. Modélisation des processus dedégradation bactérienne de la matière organique en milieuaquatique. In: Bianchi, M., Maty, D., Bertrand, J.-C., Caumette,P., Gauthier, M. (Eds.), Micro-organismes dans les écosystèmesocéaniques. Masson, Paris, pp. 219–241.
Egge, J.K., Jacobsen, A., 1997. Influence of silicate on particulate carbonproduction in phytoplankton. Mar. Ecol., Prog. Ser. 147 (1–3),219–230.
Engel, A., Goldthwait, S., Passow, U., Alldredge, A., 2002. Temporaldecoupling of carbon and nitrogen dynamics in a mesocosmdiatom bloom. Limnol. Oceanogr. 47 (3), 753–761.
Engel, A., Delille, B., Jacquet, S., Riebesell, U., Rochelle-Newall, E.,Terbrüggen, A., Zondervan, I., 2004. Transparent exopolymerparticles and dissolved organic carbon production by Emilianiahuxleyi exposed to different CO2 concentrations: a mesocosmexperiment. Aquat. Microb. Ecol. 34, 93–104.
Fagerbakke, K., Heldal, M., Norland, S., 1996. Content of carbon,nitrogen, oxygen, sulfur and phosphorus in native aquatic andcultured bacteria. Aquat. Microb. Ecol. 10, 15–27.
Fasham, M.J.R., Ducklow, H.W., McKelvie, S.M., 1990. A nitrogen-based model of plankton dynamics in the oceanic mixed layer.J. Mar. Res. 48 (3), 591–639.
Hansell, D.A., 2002. DOC in the global ocean carbon cycle. In:Hansell, D.A., Carlson, C.A. (Eds.), Biogeochemsitry of MarineDissolved Organic Matter. Academic Press, pp. 685–711.
Harrison, W.G., Azam, F., Renger, E.H., Eppley, R.W., 1977. Someexperiments on phosphate assimilation by coastal marine plankton.Mar. Biol. 40, 9–18.
Havskum, H., Thingstad, T.F., Scharek, R., Peters, F., Berdalet, E.,Sala, M.M., Alcaraz, M., Bangsholt, J.C., Zweifel, U.L., Hagstrom,A., Perez, M., Dolan, J.R., 2003. Silicate and labile DOC interferein structuring the microbial food web via algal–bacterial

34 T.F. Thingstad et al. / Journal of Marine Systems 64 (2007) 15–34
competition for mineral nutrients: results of a mesocosm experi-ment. Limnol. Oceanogr. 48 (1), 129–140.
Jacquet, S., Havskum, H., Thingstad, T., Vaulot, D., 2002. Effects ofinorganic and organic nutrient addition on a coastal microbialcommunity (Isefjord, Denmark). Mar. Ecol., Prog. Ser. 228,3–14.
Kirchman, D., 1994. The uptake of inorganic nutrients by heterotro-phic bacteria. Microb. Ecol. 28, 255–271.
Malits, A., Peters, F., Bayer-Giraldi, M., Marrase, C., Zoppini, A.,Guadayol, O., Alcaraz, M., 2004. Effects of small-scale turbulenceon bacteria: a matter of size. Microb. Ecol. 48 (3), 287–299.
Moloney, C.L., Field, J.G., 1991. The size-based dynamics of planktonfood webs. 1. A simulation model of carbon and nitrogen flows.J. Plankton Res. 13, 1003–1038.
Pomeroy, L.R., 1974. The ocean's food web: a changing paradigm.Bioscience 24, 499–504.
Pomeroy, L.R., Sheldon, J.E., Sheldon, W.M.J., Peters, F., 1995.Limits to growth and respiration of bacterioplankton in the Gulf ofMexico. Mar. Ecol., Prog. Ser. 117, 259–268.
Rigler, F.H., 1956. A tracer study of the phosphorous cycle in lakewater. Ecology 37, 550–562.
Rivkin, R., Anderson, M., 1997. Inorganic nutrient limitation ofoceanic bacterioplankton. Limnol. Oceanogr. 42, 730–740.
Sala, M.M., Peters, F., Gasol, J.M., Pedros-Alio, C., Marrase, C.,Vaque, D., 2002. Seasonal and spatial variations in the nutrientlimitation of bacterioplankton growth in the northwesternMediterranean. Aquat. Microb. Ecol. 27 (1), 47–56.
Suttle, C., Fuhrman, J., Capone, D., 1990. Rapid ammonium cyclingand concentration-dependent partitioning of ammonium andphosphate: implications for carbon transfer in planktonic commu-nities. Limnol. Oceanogr. 35, 424–433.
Taylor, A.H., Joint, I., 1990. A steady-state analysis of the ‘microbialloop’ in stratified systems. Mar. Ecol., Prog. Ser. 59, 1–17.
Thingstad, T.F., 2003. Physiological models in the context of microbialfood webs. In: Findlay, S., Sinsabaugh, R.L. (Eds.), AquaticEcosystems. Interactivity of Dissolved Organic Matter. AquaticEcology. Academic Press, pp. 383–395.
Thingstad, T.F., Lignell, R., 1997. Theoretical models for the controlof bacterial growth rate, abundance, diversity and carbon demand.Aquat. Microb. Ecol. 13 (1), 19–27.
Thingstad, T.F., Pengerud, B., 1985. Fate and effect of allochthonousorganic material in aquatic microbial ecosystems. An analysisbased on chemostat theory. Mar. Ecol., Prog. Ser. 21, 47–62.
Thingstad, T., Rassoulzadegan, F., 1999. Conceptual models for thebiogeochemical role of the photic zone food web, with
particular reference to the Mediterranean Sea. Prog. Oceanogr.44, 271–286.
Thingstad, T.F., Hagstrom, A., Rassoulzadegan, F., 1997. Accumulationof degradable DOC in surface waters: is it caused by a malfunction-ing microbial loop? Limnol. Oceanogr. 42 (2), 398–404.
Thingstad, T.F., Havskum, H., Kaas, H., Nielsen, T.G., Riemann, B.,Lefevre, D., Williams, P.J.l.B., 1999a. Bacteria–protist interactionsand organic matter degradation under P-limited conditions:analysis of an enclosure experiment using a simple model. Limnol.Oceanogr. 44 (1), 62–79.
Thingstad, T.F., Perez, M., Pelegri, S., Dolan, J., Rassoulzadegan, F.,1999b. Trophic control of bacterial growth in microcosmscontaining a natural community from northwest Mediterraneansurface waters. Aquat. Microb. Ecol. 18 (2), 145–156.
Thingstad, T.F., Krom, M.D., Mantoura, R.F.C., Flaten, G.A.F., Groom,S., Herut, B., Kress, N., Law, C.S., Pasternak, A., Pitta, P., Psarra, S.,Rassoulzadegan, F., Tanaka, T., Tselepides, A., Wassmann, P.,Woodward, E.M.S., Riser, C.W., Zodiatis, G., Zohary, T., 2005a.Nature of phosphorus limitation in the ultraoligotrophic easternMediterranean. Science 309 (5737), 1068–1071.
Thingstad, T.F., Øvreås, L., Løvdal, T., Heldal, M., 2005b. Use of non-limiting substrates to increase size; a generic strategy tosimultaneously optimize uptake and minimize predation in pelagicosmotrophs? Ecol. Lett. 8, 675–682.
Vallino, J.J., Hopkinson, C.S., Hobbie, J.E., 1996. Modelingbacterial utilization of dissolved organic matter: optimizationreplaces Monod growth kinetics. Limnol. Oceanogr. 41 (8),1591–1609.
Van den Meersche, K., Middelburg, J.J., Soetaert, K., van Rijswijk, P.,Boschker, H.T.S., Heip, C.H.R., 2004. Carbon–nitrogen coupling andalgal–bacterial interactions during an experimental bloom: modeling aC-13 tracer experiment. Limnol. Oceanogr. 49 (3), 862–878.
Van Wambeke, F., Christaki, U., Giannokourou, A., Moutin, T.,Souvemerzoglou, K., 2002. Longitudinal and vertical trends ofbacterial limitation by phosphorus and carbon in the MediterraneanSea. Microb. Ecol. 43 (1), 119–133.
Wheeler, P.A., Kirchman, D.L., 1986. Utilization of inorganic andorganic nitrogen by bacteria in marine systems. Limnol. Oceanogr.31, 998–1009.
Williams, P.J.L., 1981. Incorporation of microheterotrophic processesinto the classical paradigm of the planktonic food web. Kiel.Meeresforsch. (S)5, 1–28.
Zohary, T., Robarts, R.D., 1998. Experimental study of microbial Plimitation in the eastern Mediterranean. Limnol. Oceanogr. 43,387–395.