abiotic: non-living parts of the biotic: living parts of
TRANSCRIPT

1
Definition: study of the interactions among livingthings and their surroundings
Key Knowledge:
1.Matter cycles, energy flows
2.Abiotic factors cause changes in biotic factors in aecosystem
Chapters 13-16 in the textbook
Abiotic: Non-living parts of theenvironment
Soil Sunlight Climate Temperature Rainfall Nutrients
Biotic: living parts of theenvironment
Plant Animals Decomposers
(Bacteria and Fungus)
General Organization
Organism= any individual livingthing
Population= Individualorganisms of a single speciesin one area.
Community= more than onepopulation living in the samearea.

2
Example of aCommunity
Differentspecies offish
Differentspecies ofcorals(animals)
Starfish(animal)
Algae
(microscopic plants)
General Organization Ecosystem= All the populations and
abiotic factors in an area. Habitat = the environment that a
particular species prefers within anecosystem
Niche= the role that an organism fills“job”
Biomes= Ecosystems with similarclimate and plants.
Characteristics of a Biome No distinct boundaries Defined by types of plants Similar climate conditions, but may be
located in a totally different part of theworld (Africa and Asia)
Classification of biomes:–land biomes–water biomes (marine or freshwater)
Can make their own food throughenergy from the sun or inorganicsubstances
AKA: Primary Producer

3
Obtains energy by eating otherorganisms,
AKA: Consumers
Types of ConsumersPrimary consumers: eat producers
(herbivores)
Secondary consumers: eats bothproducers & consumers (omnivores)
Tertiary consumers: top predator(carnivore)
Trophic levels are a way of identifyingwhat kinds of food an organism uses.
1st trophic level= primary producers2nd trophic level= primary consumers3rd trophic level= secondary consumers4th trophic level= tertiary
consumer
Decomposers & Scavengers Decomposers feed on wastes & dead
material from all trophic levels Ex: bacteria, fungi
Scavengers are consumers that eatdead animals (like road kill)
Ex: vulture
Energy in an ecosystem istransferred (cycles) through
the trophic levels of thatecosystem
Biomass and Energy Transfer1 hawk
10 snakes100 mice feed
1000 plants feed
Rule of 10****-Only 10% of the energy istransferred to the nextorganism.
Biomass- amount of livingmatter, number oforganisms, or determinesthe amount of energy

4
Very few animals feed on only one foodsource, food webs are a more accurate
picture of how animals feed.
Biological Magnification The build-up of toxins in living organisms
with movement up the trophic levels . Toxins collect in at the top of food web
because top consumers eat so much. Examples:
DDT: Dichlorodiphenyltrichloroethane Developed during WWII as a
pesticide Very high levels of DDT were
found in top consumers. DDT is stored in fat.
Organisms died or hadreproductive problems
Banned in US and Canada duringthe 70’s.
Still found in almost all living things Developing countries are still use DDT

5
Invasive Species A species that is brought by HUMANS into
a new environment and outcompetes theones already there.
They have no competitors, no diseases sothey outgrow other populations
Example: Africanized honey bees,which will take over the hive of thehoney bees.
Example: Zebra mussels attach toboats and cover piers withinmonths
Keystone Species A species that plays a key role in the
ecosystem Increases biodiversity by keeping the
number of each species in balance– Examples
Sea otter in the kelp forests Beavers in rivers
BeaverSea Otter
HUMAN IMPACT
A Sad True Story
An Ecological Mystery Long term study of sea otter population along
the Alaskan and Aleutian Islands 1970: Sea Otters healthy and populations
growing 1990: Sea Otter #’s declining
– Maybe due to emigration, not deaths 1993: 800 km area in Aleutian Islands studied
– Sea Otter #’s reduced by 50%
Vanishing Sea Otters 1997: Study of area repeated Sea Otter pop. had declined by 90%
– 1970: > 53,000 Otters in the study area
– 2012: < 2800
Why?– Reproductive issues– Starvation, pollution, disease?

6
Cause of the Decline 1991: one researcher observed an orca
whale (killer whale) eating a sea otter. Sea lions or seals are the normal prey of
orcas. Decline in usual prey led to feeding shift. Single orca could consume 1,825
otters/year. Clam Lagoon (CONTROL GROUP), which
was not accessible to orcas, had no declinein otter population
No Big Deal.. Right? Declines in ocean fish due to over fishing
and climatic changes led to a reduction infood for sea lions & seals, so their #’sdecreased
This forced the orcas to enter into thecoastal waters where they consumed seaotters.
Sea otters normally feed on sea urchins.As sea otters decreased, the urchinsnumbers increased.
Urchins eat kelp, and the large numbers ofurchins damaged kelp forests.
The decline in the kelp forests has had animpact on many others species because ofthe decrease of oxygen and an increase incarbon dioxide in the water.
Other Species AffectedBald EagleMusselSea StarsSeagulls
All matter essential for life moves incycles between living things & the
environment
Examples of cycles:carbon cyclewater cyclenitrogen cycle
Why is carbon important to us?1) Carbon is used to make hair,
muscle, & skin2) Carbon stores energy so living
things can think, move, etc3) Fossil fuels (gas, coal, oil) are
made from carbon

7
Where is carbon found in the environment?
1. atmospheric gas (CO2)2. rocks (limestone, diamonds)3. fossil fuels (oil, coal, etc.)
How does carbon enter living things?
1) CO2 gas enters plants
2) Photosynthesis allows plants tochange CO2 into a sugar
3) Animals then get carbon by eatingthe sugar found in plants
How does carbon get backinto the environment?
1. Plants & animals release CO2 duringrespiration
2. Burning of wood & fossil fuels
3. Using electricity, (most power plants usefossil fuels)
4. Cow farts (seriously)
5. Decomposition when bacteria and fungusbreak down tissue of dead things
How are fossil fuels formed?1. When living things die & fall to
the bottom of water, they areburied & compressed
2. They eventually form coal,petroleum, or natural gas
So what’s the cycle?
the 2 main steps arephotosynthesis & respiration!
The Carbon CycleThe movement of carbon through the
environment
2 major driving forces1. Photosynthesis- plants and algae take up
CO2 from the air or water to make sugar
2. Cellular Respiration- consumers usesugar for energy and release CO2 into theair or water

8
Future Predictions
Due to humans using more fossilfuels, more CO2 is released each
yearthis may result in global warming since
CO2 traps heat (remember thegreenhouse effect)
What is global warming?
Facts about Nitrogen
78% of air is nitrogen gas (N2)Living things can’t use nitrogen
when it’s a gas (N2)
Why do living things needNitrogen?
To make amino acids & proteins To make DNA
The Nitrogen CycleStep #1
Nitrogen gas (N2) is found in theatmosphere
Step #2”Nitrogen Fixation”: Bacteria
living at the roots changethe N2 gas into a usableform like ammonia ornitrates
Lightning also “fixes” nitrogen

9
Step #3Plants then use the ammonia
or nitrates in the soil
Step #4Animals get nitrogen from
plants by eating them
Step #5When plants & animals die, the nitrogenin them is released back into theatmosphere as a gas (N2) This is done by denitrifying bacteria
Step #6Nitrogen gas is released back into the
atmosphere
What are the two processthat are responsible; forcycling Carbon in theenvironment?
What things add carbon?Which things take it away?Photosynthesis and Cellular RespirationPhotosynthesis : take it awayCellular Respiration, Fossil Fuels andDecaying organisms add it.
Other CyclesHydrologic (water) Cycle
Phosphorus Cycle
10
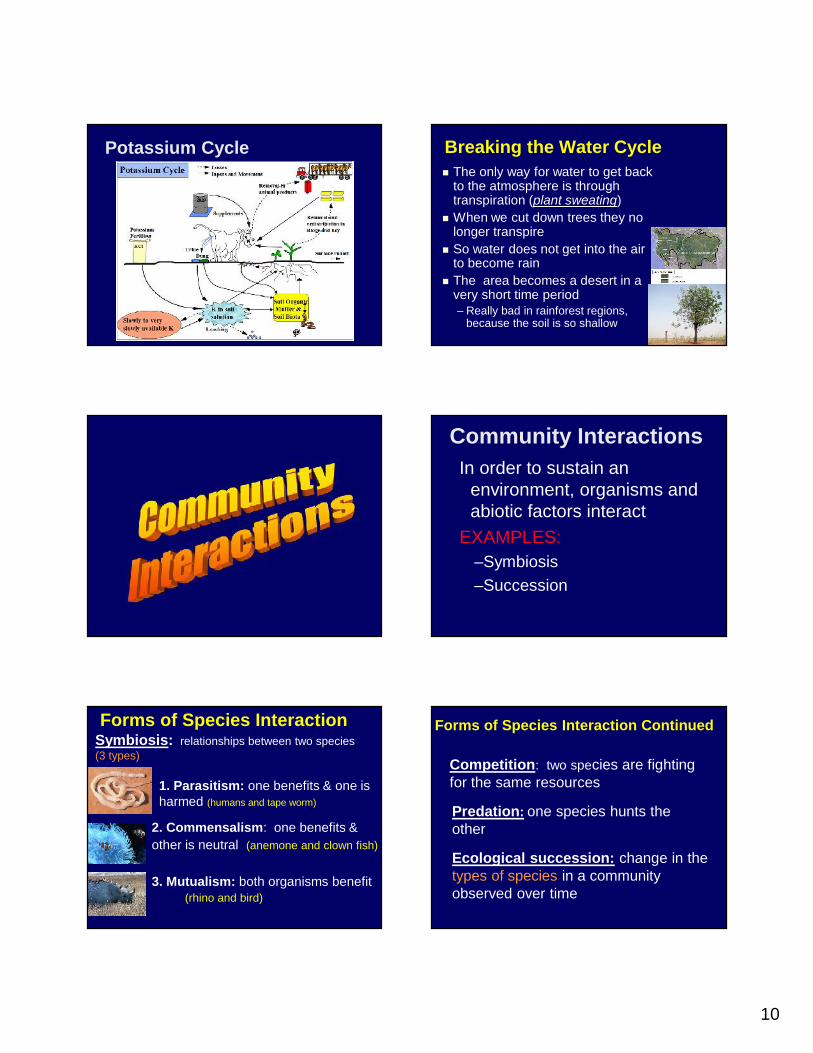
Potassium Cycle Breaking the Water Cycle The only way for water to get back
to the atmosphere is throughtranspiration (plant sweating)
When we cut down trees they nolonger transpire
So water does not get into the airto become rain
The area becomes a desert in avery short time period– Really bad in rainforest regions,
because the soil is so shallow
Community InteractionsIn order to sustain an
environment, organisms andabiotic factors interact
EXAMPLES:–Symbiosis–Succession
Forms of Species Interaction
1. Parasitism: one benefits & one isharmed (humans and tape worm)
2. Commensalism: one benefits &other is neutral (anemone and clown fish)
Symbiosis: relationships between two species(3 types)
3. Mutualism: both organisms benefit(rhino and bird)
Forms of Species Interaction Continued
Competition: two species are fightingfor the same resources
Predation: one species hunts theother
Ecological succession: change in thetypes of species in a communityobserved over time

11
Succession Why does successionhappen?
Communities & environmentschange over time
1) Primary Succession
When communities form in new areas–Ex: volcanoes, rocks, etc
Steps of Primary Succession1. Pioneer species appear lichens
(grow on rock & turn it into soil) Pioneer Species: the first organisms
to occupy an area
2. Grass & small plants appear3. Weeds & shrubs4. Shallow trees (ex: pine trees)5. Climax community stable & final
stage (ex: deciduous trees)
Climax Community
A community thathas achievedstability andspecies diversity
2) Secondary Succession Occurs in areas that were cleared by
disturbance (fire, tornado, floods, etc)– faster than primary (soil already formed)
Same as primary except pioneerspecies are grasses instead of lichens

12
Successionleads to….. 1.Birth Rate
2.Death Rate
3.Immigration (movement into an area)
4.Emigration (Movement, exiting an area)
FACTORS THAT AFFECTPOPULATION GROWTH
Exponential Growth J-shaped curve on a graph Population doubles every generation Humans are reproducing this way!
Humans - Trouble ahead?
Logistic Growth S–shaped curve on graph How real growth looks Populations grow fast early, then slow
down, as we get closer to CARRYINGCAPACITY

13
Biomassand
energy transferat the lowesttrophic leveldetermines the
carrying capacity ofthe ecosystem.
Carrying CapacityMaximum # of individuals a population
can support– Populations will increase to carrying
capacity, and they decrease again oncethey have reached it.
Limits to Pop. Growth1. Density-dependent limiting factors -
reduce population growth with thatdepends on current population size– Affect crowded populationsDiseaseCompetition (for shelter, food, water)Predation (predator eats prey)
How might thebubonic plague
have beendifferent if the
medievalpopulationsdidn’t live soclose to each
other?
2. Density-independent limiting factors– environmental factors affecting apopulation regardless of size– Affect all populations (crowded or not)WeatherNatural disasters (fire, etc)Human activities
Would thephysicaleffects ofhurricaneKatrina be
any differentin a town of
100, then in atown of
100,000?
New Orleans, LA
Gulf Port , MS