able of contents - welcome to aamu · 1909-school's motto, ... 1981-desegregation case began....
TRANSCRIPT
Blueprints to Excellence: Enhancing the Academic Support Services and Campus Culture Alabama A&M University’s Quality Enhancement Plan
It takes a whole university to graduate a student! i
TABLE OF CONTENTS
Page Executive Summary .................................................................................................................... i I. University Overview ......................................................................................................... 1 Historical Facts .................................................................................................................. 1 Mission .............................................................................................................................. 2 Vision ................................................................................................................................ 3 Core Values ....................................................................................................................... 3 II. Structuring the QEP........................................................................................................... 4 III. QEP Descriptive Title........................................................................................................ 8 Chart Outlining the Working Structure for Development of the QEP .............................. 9 IV. Rationale and Justification for the Quality Enhancement Plan ........................................ 10 Growth in Enrollment at Alabama A&M University in the Last Five Years.................... 10 Demographics of Incoming Freshmen .............................................................................. 12 Socioeconomic and Social Characteristics of Incoming Freshmen .................................. 13 Academic Preparation of Incoming Freshmen .................................................................. 17 Placement of Incoming Freshmen using ACT Scores....................................................... 18 Retention and Probation Statistics and Trends .................................................................. 21 Factors Impacting Retention and Probation ...................................................................... 23 Degree Completion Statistics and Trends ......................................................................... 25 Characteristics of Financial Aid Recipients ...................................................................... 29 Factors Affecting Academic Performance ........................................................................ 30 Perceptions of the Student Body Concerning Quality and Safety..................................... 33 Characteristics of the Faculty ............................................................................................ 35 Summary............................................................................................................................ 36 V. Quality Enhancement Plan and Implementation Strategies .............................................. 38 A. QEP Goals and Objectives ........................................................................................... 38 QEP Outcomes ............................................................................................................. 38 Goal A .......................................................................................................................... 39 Goal B........................................................................................................................... 41 B. QEP Implementation Strategies.................................................................................... 44 C. Assessment of Expected Outcomes .............................................................................. 49 D. Project Resources ......................................................................................................... 52 E. QEP Management Plan ................................................................................................. 53

Blueprints to Excellence: Enhancing the Academic Support Services and Campus Culture Alabama A&M University’s Quality Enhancement Plan
It takes a whole university to graduate a student! ii
I. UNIVERSITY OVERVIEW Historical Facts 1873-A bill was approved in the Alabama State Legislature for the establishment of the "Colored Normal School at Huntsville," a school to be devoted to the education of black teachers. 1875-Peyton Finley introduced twin bills in the State Board of Education for the establishment of four "normal" schools for whites and four for blacks. William Hooper Councill became founder of Alabama A&M University. On May 1, the school at Huntsville opened with a state appropriation of $1,000, 61 pupils and two teachers. The school's first location was on Clinton Street. 1878-The state appropriation increased to $2,000. 1881-Moved to first school-owned property on West Clinton Street (the land upon which Von Braun Civic Center is located) known as the "Dement Place." 1882-Shop courses were introduced into the curriculum in the fall (e.g., carpentry, printing, mattress-making, horticulture, sewing, etc.). 1883-Industrial training began. 1884-Property on West Clinton Street was deeded to the State of Alabama by trustees. 1885-Name changed to State Normal and Industrial School of Huntsville; state appropriation increased to $4,000; building erected for industrial training through $1,000 grant from the Slater Fund. 1890-Students numbered 300; teachers, 11. Designated as a Land-Grant College of Alabama. School site became known as Normal, Ala., and a post office was established. Students were called "Normalites." 1891-Designated a land-grant college through legislative enactment February 13. On September 30, the present site was purchased (182.72) acres. The school expanded to include agriculture and home economics; Palmer (named for State Superintendent Solomon Palmer) and (Governor Thomas) Seay Halls were built with student labor. 1893-First night school was held. First alumni meeting held. 1894-Trade education diplomas authorized. First trade certificates were awarded (10). 1896-Name changed to The State Agricultural and Mechanical College for Negroes. 1897-Art Painting Department added to curriculum. 1901-First honorary degree awarded. 1903-Blues great W. C. Handy leaves as band director.
1909-School's motto, "Service is Sovereignty," introduced; Councill died at age 61. Walter Solomon Buchanan became president. Farmers Conference began. 1910-Football began. 1911-McCormick (Hospital) Hall and Councill Domestic Science Building erected. 1912-First baseball game. 1920-President Buchanan resigns, disillusioned with the state's stance toward the overall betterment of the institution. Theophilus Robert Parker became third president. 1927-Joseph Fanning Drake becomes fourth president and institutes a massive building program. 1929-Construction of Bibb Graves Hall. 1939-State Board of Education gives authority to offer course work on the senior college level. 1949-Name changed to Alabama A&M College. 1962-Richard David Morrison became the fifth president. 1963-AAMU becomes fully accredited by the Southern Association of Colleges and Schools. 1965-Intercollegiate soccer began. 1969-State Board of Education adopts a resolution changing the name of the institution to Alabama A&M University. 1970-Office of Alumni Affairs established. Phillip L. Redrick became first director. 1975-University observed Centennial. Elmore Health Sciences Building constructed. 1977-Volleyball for women began. 1981-Desegregation case began. 1984-Dr. Douglas Covington became AAMU's sixth president. 1985-AAMU signs memorandum of understanding with Kansas State University/USAID. 1986-Former Congresswoman Shirley Chisholm addressed "Women's Week" activities. University announced approval of Ph.D. program in physics. Department of Mathematics received NASA research grant. 1987-Dr. Carl Harris Marbury was named interim president. 1989-Carl Harris Marbury becomes seventh president.

Blueprints to Excellence: Enhancing the Academic Support Services and Campus Culture Alabama A&M University’s Quality Enhancement Plan
It takes a whole university to graduate a student! 3
1990-The University holds its first Grand Reunion, initiated by Dr. Carl Harris Marbury and Georgia S. Valrie, Director of Alumni Affairs. 1991-Board of Trustees named Dr. Alan Lee Keyes Interim President. 1992-Dr. David Bernard Henson becomes eighth president. First AAMU Athletic Hall of Fame induction held. 1994-Mamie Labon Foster Student Living/Learning Complex erected. First African-American Ph.D. recipients in physics. University's SACS accreditation reaffirmed. 1995-Groundbreaking held for new School of Business facility; stadium and residence hall construction begins. Master of Social Work Program accepts first students. Dr. Virginia Caples, vice president for academic affairs, becomes the first woman to head (interim) the University in the school's 120-year history. 1996 - Dr. John T. Gibson named ninth president in July. AAMU launches Councill Challenge Campaign. Football returns to campus. 1997-Unified Cooperative Extension System unveils new logo. Patrick Grayson makes USA Today All-USA Academic First Team. Filmmaker Spike Lee visits. AAMU joins Southwestern Athletic Conference (SWAC). 1998-Ryan Swain makes USA Today All-USA Academic First Team. Nobel Laureate series begins under coordination of AAMU physicist Ravi B. Lal.
1999-AAMU Research Institute started. 2000-AAMU observes its 125th anniversary celebration in January. 2001-AAMU’s fundraising efforts earn it the distinction of lead institution in the Tom Joyner Foundation/HBCU program. Accreditation announced and earth work begins on new School of Engineering and Technology; library renovations underway; athletic complex expands. 2002-Learning Resources Center renovations completed. Engineering and Technology building erected. Social Work re-accredited. Forestry gains national accreditation. Normal Hill renovations extensive. Councill Challenge Campaign goal reached. 2003 - New School of Engineering and Technology Building opens for classes in January. Mary Frances Berry addresses Commencement. Fourth doctoral program in Reading/Literacy announced. AAMU researchers study volcanic ash in Montserrat. HSCaRS hosts study on interaction between land surface and the atmosphere. AAMU offers training on multi-million dollar EDS software. Normalite Ruben Studdard named “American Idol.” 2004 - Councill Federal Credit Union celebrates 50th anniversary. Councill Memorial Statue unveiled in October. AAMU welcomes its 7th Nobel Laureate lecturer in physics. Source: Office of Information & Public Relations
Mission Alabama Agricultural and Mechanical University reflects the uniqueness of the traditional land-grant institution combining teaching, research, service, liberal arts, and vocational fields. The University offers baccalaureate, masters, and doctoral level degrees that are compatible with the times to all qualified and capable individuals who are interested in further developing their technical, scientific, professional, and scholastic skills and competencies. The University operates in the three-fold function of teaching, research, extension and other public service. Alabama A&M University, a center of excellence, provides an educational environment for the emergence of scholars, scientists, leaders, critical thinkers, and other contributors to a global society. In cooperation with business, industry, governmental agencies, and other private and community-based institutions, Alabama A&M University provides a laboratory where theory is put into practice globally, and is committed to:
1. Excellence in education and the creation of a scholarly environment in which inquiring and discriminating minds may be nourished;
2. Education of students for effective participation in local, state, regional, national, and international societies;
3. Search for new knowledge through research and its applications;

Blueprints to Excellence: Enhancing the Academic Support Services and Campus Culture Alabama A&M University’s Quality Enhancement Plan
It takes a whole university to graduate a student! ii
4. Provision of a comprehensive outreach program designed to meet the changing needs of the larger community;
5. Programs necessary to address adequately the major needs and problems of capable students who have experienced limited access to education; and
6. Integration of state–of-the-art technology into all aspects of University functions. In cooperation with businesses, industry, governmental agencies, and other private and community-based institutions, Alabama A&M University provides a laboratory where theory is put into practice in a productive environment. VISION Alabama A&M University will continue its quest to be recognized globally as a world-class, land-grant, comprehensive university with a focus on:
Expanding doctoral offerings in education, science and engineering; Increasing research, scholarly publications and other scholarly activities; Enhancing the University’s academic environment; Expanding extension/outreach/public service activities; and, Creating and implementing a national model for student retention/graduation with
emphasis on students with limited educational access.
CORE VALUES Six core values serve as the philosophical underpinning for the University. They provide the foundation for molding and integrating activities of faculty, staff and students in their quest to implement and access programs of instruction, research and extension/outreach. The core values stress inclusiveness, scholarship, diversity, leadership, and service. Leadership – The University will continue to promote a service oriented leadership through involvement in internal University governance by faculty, staff and students; engagement in public policy debates, and assumption of leadership roles by students, faculty and staff. Engagement – The University through its faculty, staff, and students will be involved in meeting the needs of the larger community with special emphasis on serving economically, culturally, and educationally depressed constituencies, thereby ensuring the University’s unmitigated engagement with and commitment to all segments of the community. Access – The University will continue to serve as a beacon for capable students, including those who have had limited access to education and students with disabilities. Access will continue to be a core value that guides the University’s mission. Diversity – The University will continue to view enhancing its diversity as an all-encompassing effort that nurtures and respects a variety of ideas, cultures, ethnicities, programs, processes, and procedures.

Blueprints to Excellence: Enhancing the Academic Support Services and Campus Culture Alabama A&M University’s Quality Enhancement Plan
It takes a whole university to graduate a student! iii
Scholarship – The University will provide an environment focused on excellence in student scholarship, and through its faculty and staff, the creation of new knowledge and means of expression through research and the creative arts. Integrity- The University will maintain high ethical and moral standards in its administrative and academic. II. STRUCTURING THE QEP 1. The SACS Leadership Team initiated its quest for a QEP focus by reviewing data
resulting from the update of the 1996-2000 Strategic Plan (2001 and 2002) and summary findings from focus group discussions held in Spring 2002 at the Faculty/Staff Conference.
2. Early in the Institutional Analysis Process, the SACS Leadership Team approved, Dr. Shirley Houzer, Assistant to the Vice President for Academic Affairs, as the QEP Team Leader. As the possible focus areas were emerging, two additional QEP Team Leaders were selected; Dr. Jerry Shipman, Dean of Arts and Sciences and Dr. Thomas McAlpine, Interim Dean of University College.
3. Using the preliminary data, the QEP Leaders assembled an expanded committee to address twelve (12) focus areas that emerged from the planning process and the initial focus group discussions held at the Spring 2002 Faculty/Staff Conference. The committee as listed below represents broad based participation by faculty, staff and students.
QEP COMMITTEE
AREA NAME E-MAIL ADDRESS Team Leader Dr. Shirley Houzer [email protected] Team Leader Dr. Thomas McAlpine [email protected] Team Leader Dr. Jerry Shipman [email protected] Financial Aid Mrs. Deborah Gordon [email protected] Housing Mrs. Valerie Sykes-Riles [email protected] Security Mr. William Shumate [email protected] Physical Facilities Mr. David Russ [email protected] Business: Cashiers Ms. Bernadette Shipman Retention & Academic Sup Dr. Leatha Bennett [email protected] Retention & Academic Sup Mrs. Carla Draper-
Holloway [email protected]
Collections Mrs. Patricia Bullard [email protected] Admissions Ms. Shirley Jones @aamu.edu International Students Mr. James Garner [email protected] Food Services Ms. Felicia Wilson [email protected] Core Curriculum Council Student Representative (F) Christina Comminey [email protected]

Blueprints to Excellence: Enhancing the Academic Support Services and Campus Culture Alabama A&M University’s Quality Enhancement Plan
It takes a whole university to graduate a student! iv
Student Representative (M) James Kelley [email protected] Student Representative (O) Eboni Gilbert [email protected] Student Representative Amber Majors [email protected] Student Representative David Humphrey [email protected] Graduate Student Graduate Student School of Education Dr. Shirley King [email protected] School of Education Dr. Rena Lott [email protected] School of Arts & Sciences Dr. Jeanette Jones [email protected] School of Arts & Sciences Mrs. Johnnie Hargrove [email protected] School of Business Dr. O. Guy Posey [email protected] School of Business Dr. Uchenna Elike [email protected] School of Agricultural & E S Dr. Edward Williams [email protected] School of Agricultural & E S Dr. Wes Stone [email protected] School of Engineering Dr. Trent Montgomery [email protected] School of Engineering Dr. Reuben Rojas Oviedo [email protected] University College Mrs. Audramae Davis [email protected] Freshman (F) De’Martus Jackson [email protected] Freshman (M) Christopher Free E [email protected] Sophomore (F) Tiffany Brooks [email protected] Sophomore (M) Justin Townsend [email protected] Junior (F) Kimberly Brown [email protected] Senior (M) Robert Howell, III [email protected] International Student (F) Adekunle Lipede [email protected] International Student (M) Adam Promesse [email protected] Advising Coordinator (BUS) Mrs. Renee McCoy [email protected] Advising Coordinator (ENG) Ms. Sadie Pleasure [email protected] Advising Coordinator (AES) Ms. Carol Henderson [email protected] Advising Coordinator (EDU) Ms. Pamela Bridgeforth [email protected] Advising Coordinator (A&S) Diann Anderson [email protected]
4. The twelve focus groups concentrated their efforts as listed below. The details of their
findings are on file and will be available in the workroom for the On-site SACS Team. In summary, the twelve focus groups investigated data relating to the earlier concerns identified during the Faculty Staff Conference and the initial planning process. The results of their efforts served as bases for discussion of the concerns and related findings by the larger University community at a Town Hall Meeting. Attendants at the Town Hall Meeting were provided an opportunity to give verbal and written expressions and responses. Students, faculty, staff and community residents participated in the discussions. Concerned parties were also invited to contact focus group leaders by means of the University’s e-mail if there were additional comments and/or questions.

Blueprints to Excellence: Enhancing the Academic Support Services and Campus Culture Alabama A&M University’s Quality Enhancement Plan
It takes a whole university to graduate a student! v
FOCUS GROUP MEMBERS Team Leader I. Relationship between socio-economics, demographics and academic performance
Carla Draper Co-Chair Dr. Rena Lott Co-Chair Christina Comminey
Houzer
II. The role of University College in the transitioning of students from high schools and from other institutions
Dr. Edward Williams Co-Chair Ms. Pamela Bridgeforth Co-Chair Dr. Mary Brown James Kelley
McAlpine
III. The nature and quality of social experiences inherent in college life
Mrs. Valerie Riles Co-Chair Mr. David Russ Co-Chair Eboni Gilbert
Shipman
IV. The identification of perceived needs of various segments of the student population
Mrs. Patricia Bullard Co-Chair Dr. Trent Montgomery Co-Chair Ms. Shirley Jones Kimberly Brown
McAlpine
V. Academic advising Ms. Carolyn Henderson Co-Chair Dr. Shirley King Co-Chair De’Martus Jackson
Shipman
VI. Student support services: Financial Aid Financial Services
Ms. Deborah Gordon Co-Chair Ms. Diann Anderson Co-Chair Ms. Bernadette Shipman Sabrina Smiley
Houzer
VII. Faculty assigned to provide instruction for freshmen
Mrs. Johnnie Hargrove Co-Chair Dr. Oviedo Rojas Co-Chair Christopher Free
Shipman
VIII. Policies and practices related to academic placement
Dr. Jeanette Jones Co-Chair Mrs. Audramae Davis Co-Chair Tiffany Brooks
Shipman
IX. Class size in relation to student performance
Mrs. Renee McCoy Co-Chair Dr. O. Guy Posey Co-Chair Justin Townsend
Houzer
X. Residence hall policies and procedures
Mr. James Garner Mrs. Felecia Wilson Robert Howell III
McAlpine
XI. Campus safety Dr. Wes Stone Mr. William Shumate Adam Promesse
Houzer
XII. Intervention Strategies Dr. Leatha Bennett Dr. Uchenna Elike Adekunle Lipede
McAlpine
5. Following the activities listed in item four, the QEP Leadership Team and Committee
directed the Office of Planning, Institutional Research, and Planning to conduct analyses in the areas identified by the twelve focus groups.
6. The data contained in Section IV Rationale and Justification for the Quality
Enhancement Plan led to the identification of the following twenty (20) QEP desired outcomes.
Blueprints to Excellence: Enhancing the Academic Support Services and Campus Culture Alabama A&M University’s Quality Enhancement Plan
It takes a whole university to graduate a student! vi
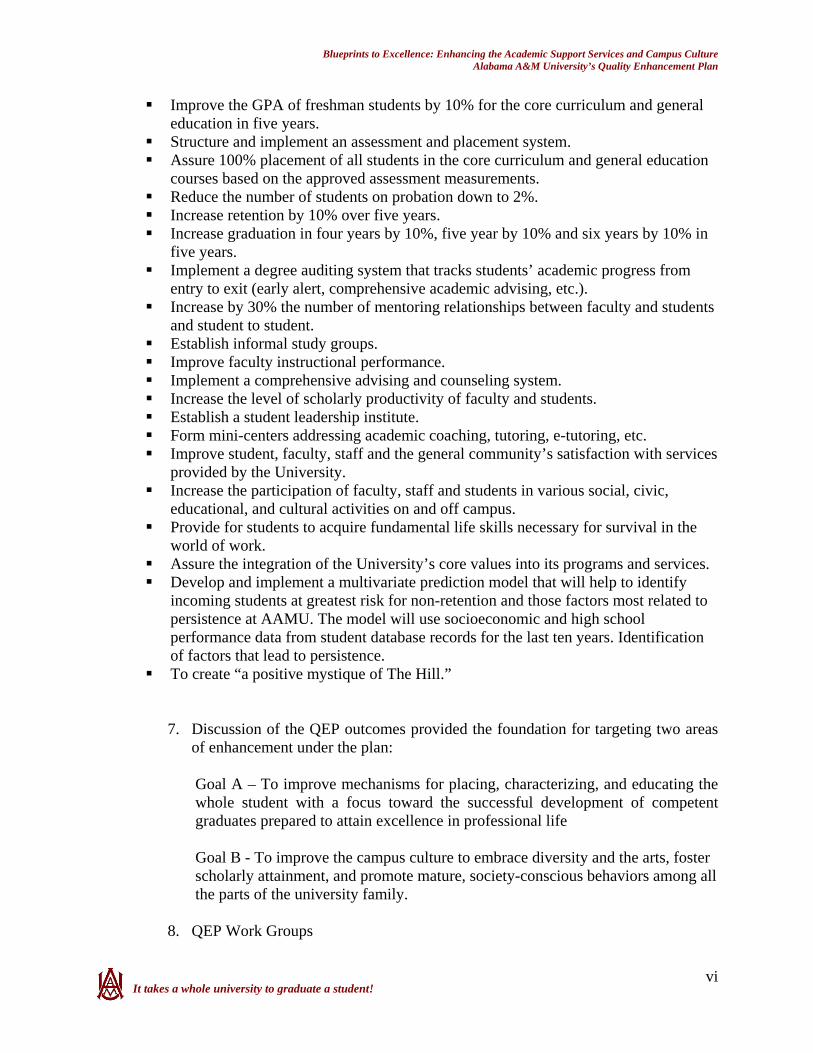
Improve the GPA of freshman students by 10% for the core curriculum and general education in five years.
Structure and implement an assessment and placement system. Assure 100% placement of all students in the core curriculum and general education
courses based on the approved assessment measurements. Reduce the number of students on probation down to 2%. Increase retention by 10% over five years. Increase graduation in four years by 10%, five year by 10% and six years by 10% in
five years. Implement a degree auditing system that tracks students’ academic progress from
entry to exit (early alert, comprehensive academic advising, etc.). Increase by 30% the number of mentoring relationships between faculty and students
and student to student. Establish informal study groups. Improve faculty instructional performance. Implement a comprehensive advising and counseling system. Increase the level of scholarly productivity of faculty and students. Establish a student leadership institute. Form mini-centers addressing academic coaching, tutoring, e-tutoring, etc. Improve student, faculty, staff and the general community’s satisfaction with services
provided by the University. Increase the participation of faculty, staff and students in various social, civic,
educational, and cultural activities on and off campus. Provide for students to acquire fundamental life skills necessary for survival in the
world of work. Assure the integration of the University’s core values into its programs and services. Develop and implement a multivariate prediction model that will help to identify
incoming students at greatest risk for non-retention and those factors most related to persistence at AAMU. The model will use socioeconomic and high school performance data from student database records for the last ten years. Identification of factors that lead to persistence.
To create “a positive mystique of The Hill.”
7. Discussion of the QEP outcomes provided the foundation for targeting two areas of enhancement under the plan:
Goal A – To improve mechanisms for placing, characterizing, and educating the whole student with a focus toward the successful development of competent graduates prepared to attain excellence in professional life Goal B - To improve the campus culture to embrace diversity and the arts, foster scholarly attainment, and promote mature, society-conscious behaviors among all the parts of the university family.
8. QEP Work Groups

Blueprints to Excellence: Enhancing the Academic Support Services and Campus Culture Alabama A&M University’s Quality Enhancement Plan
It takes a whole university to graduate a student! vii
Work Group I Overview and General Rationale Name Unit Virginia Caples Provost and Vice President for Academic Affairs Caula Beyl Director of Institutional Planning, Research & Evaluation Margaret Kelly Director of Title III
Work Group II University College Jerry Shipman Dean of Arts & Sciences Sherrell Price Assessment Coordinator Gerald Wheelock Department of Agribusiness Carlos Clark Office of Financial Aid Leatha Bennett Office of Retention Royer Fraser Department of Plant & Soil Science Sekhar Anantharaman Department of Accounting Audramae Davis Advising Center Johnnie Hargrove Department of English & Foreign Languages Renee McCoy School of Business Eboni Gilbert Student Robert Howell, III Student Mary Brown Community James Hicks Community Shirley King Special Education James Shuford Dean of Agricultural & Environmental Sciences Thoms McAlpine Interim Dean of University College
Work Group III Campus Culture Shirley Houzer Interim Registrar Virginia Gilbert Department of English & Foreign Languages Horace Carney Department of Fine Arts Patricia Wilson Department of Economics, Finance & Office Systems Management Antonio Boyle Office of Admissions William Schumate Department of Public Safety Kimberly Brown Student Alfred Baker Office of Student Activities Valarie Sykes-Ryles Housing Office Patricia Bullard Collections Diane Anderson School of Agricultural & Environmental Sciences Marjorie Battle Department of Elementary and Early Childhood Education Adam Promesse Student Jennifer Vinson Commutative Science and Disorders Stoney Massey Department of Electrical Engineering Bobby Hayden Community James Garner International Students Office
Work Group IV Scholartorium Bernice Richardson, Co-chair Family & Consumer Sciences Mary Spor, Co-chair Reading Constance Wilson Department of Community Planning & Urban Studies Ravinder Lal Department of Physics Cynthia Smith Apparel Merchandising & Design Rena Lott Department of Early and Elementary Childhood Education Christopher Free Student Amber Majors Student Constance Dees Community

Blueprints to Excellence: Enhancing the Academic Support Services and Campus Culture Alabama A&M University’s Quality Enhancement Plan
It takes a whole university to graduate a student! viii
Terrence Mizell Department of Computer Science Rudy Pacumbaba, Jr. Department of Plant & Soil Science Annie Wells Psychology and Counseling Chris Enyinda Business Administration Terry Douglas Teacher Services Center Barbara Jones School of Education Patrick Mallory Student Government Association Adrain Butler Student Government Association 9. The QEP Integration and Writing Team
Name Unit Dr. Virginia Caples Provost and Vice President for Academic Affairs Dr. Shirley Houzer Assistant to the Vice President for Academic Affairs Dr. Caula Beyl Director of Institutional Planning, Research & Evaluation Dr. Bernice Richardson Chair, Department of Family & Consumer Sciences
III. QEP DESCRIPTIVE TITLE The title “Blueprints to Excellence: Enhancing Academic Support Services and the Campus Culture,” derives from the commitment to excellence adopted from the University’s overall planning process. Excellence has been a theme for the past decade and continues with our current strategic plan, Blueprints to Excellence: Focus 2015, which also identified student support services and campus culture as areas of concern. The quality of the experiences provided during the first year of study at Alabama A&M and a comprehensive approach to the management and assessment of general education are both organized through the academic support unit University College. The plan focuses on improved learning through the enhancement of scholarship, civic engagement, and the acquisition of fundamental social, personal and professional skills needed to succeed in the world of work and contribute to the community’s well-being.
The campus culture as defined for the purposes of the QEP is all-encompassing, addressing the way we see ourselves as a university; the expectations of students, faculty, staff, and the general community; the attitudes and behaviors accepted and displayed; the level of scholarship by faculty and students; expectations regarding academic performance and progress; attitudes and behaviors in serving and meeting the needs of students and the general public; and the world view of our students beyond the boundaries that they bring to this “Hill.” While the University has made giant strides in the development and implementation of new programs of study and the integration of new technology, the overall environment needed to produce a well-rounded graduate demands greater attention and enhancement.

Blueprints to Excellence: Enhancing the Academic Support Services and Campus Culture Alabama A&M University’s Quality Enhancement Plan
It takes a whole university to graduate a student! ix
IV. RATIONALE AND JUSTIFICATION FOR THE QUALITY ENHANCEMENT PLAN The direction and focus of this Quality Enhancement Plan (QEP) was developed through broad based input from all levels at the institution, including group discussions during the Spring Faculty/Staff Conference in 2002. It also encompasses input garnered via faculty/staff satisfaction surveys, student satisfaction surveys, the Cooperative Institutional Research Program (CIRP) survey of incoming freshmen, and analyses of institutional data for characteristics and trends relating to admissions, enrollment, probation, grades, incoming freshmen, the general student body, student services, and faculty and staff. These analyses refined the general focus of the QEP into these fundamental areas of attention: reorganization and revitalization of University College, and changing the campus culture to embrace scholarship, appreciation for the larger intellectual world, and the achievement of excellence in professional preparation. Growth in Enrollment at Alabama A&M University in the Last Five Years Freshmen at Alabama A&M University, a historically black college (HBCU), join a student body that is predominately black (89.0%) with whites (8.7%) and other races (2.3%) and has a higher percentage of females (55%) than males. They are also joining a college campus whose student body is growing rapidly. Since 1998-99, enrollment has steadily increased to a peak in Fall 2003 of 6,588, of which 5,326 were undergraduates.
0
1000
2000
3000
4000
5000
6000
Fall
Enro
llmen
t
1984
- 19
85
1985
- 19
86
1986
- 19
87
1987
- 19
88
1988
- 19
89
1989
- 19
90
1990
- 19
91
1991
- 19
92
1992
- 19
93
1993
- 19
94
1994
- 19
95
1995
- 19
96
1996
- 19
97
1997
- 19
98
1998
- 19
99
1999
- 20
00
2000
- 20
01
2001
- 20
02
2002
- 20
03
Academic Year
Total Enrollment Trends
Blueprints to Excellence: Enhancing the Academic Support Services and Campus Culture Alabama A&M University’s Quality Enhancement Plan
It takes a whole university to graduate a student! x
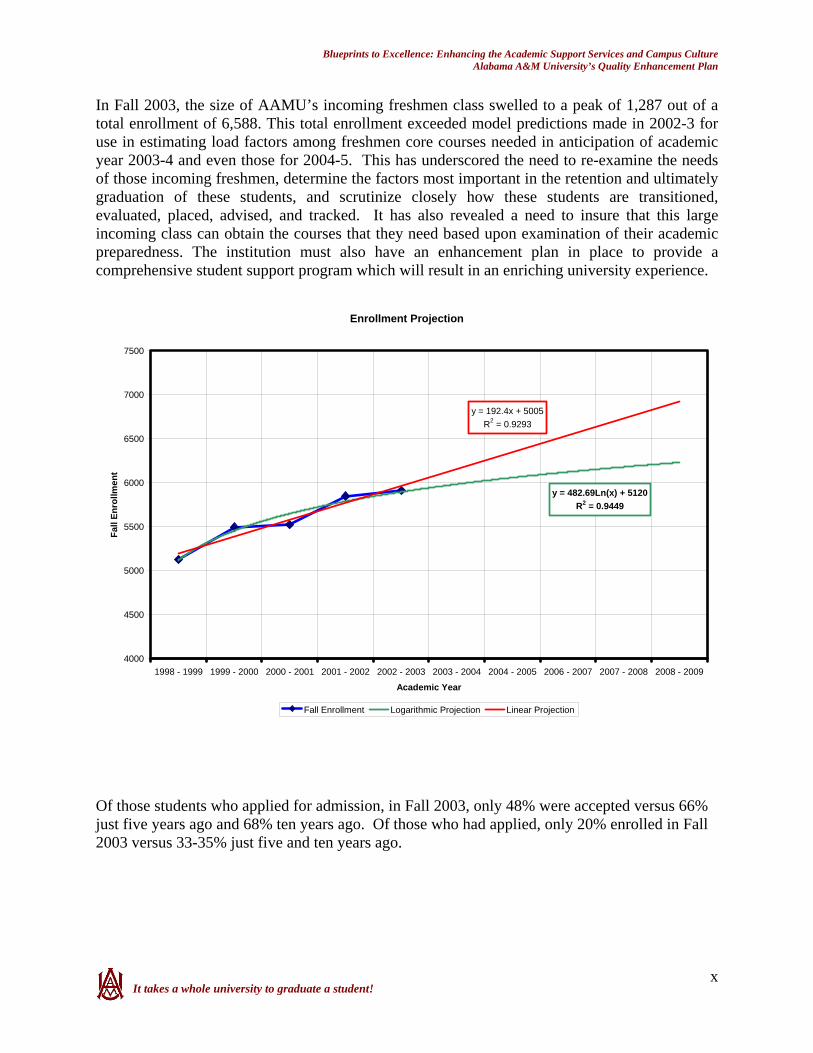
In Fall 2003, the size of AAMU’s incoming freshmen class swelled to a peak of 1,287 out of a total enrollment of 6,588. This total enrollment exceeded model predictions made in 2002-3 for use in estimating load factors among freshmen core courses needed in anticipation of academic year 2003-4 and even those for 2004-5. This has underscored the need to re-examine the needs of those incoming freshmen, determine the factors most important in the retention and ultimately graduation of these students, and scrutinize closely how these students are transitioned, evaluated, placed, advised, and tracked. It has also revealed a need to insure that this large incoming class can obtain the courses that they need based upon examination of their academic preparedness. The institution must also have an enhancement plan in place to provide a comprehensive student support program which will result in an enriching university experience.
Enrollment Projection
y = 482.69Ln(x) + 5120R2 = 0.9449
y = 192.4x + 5005R2 = 0.9293
4000
4500
5000
5500
6000
6500
7000
7500
1998 - 1999 1999 - 2000 2000 - 2001 2001 - 2002 2002 - 2003 2003 - 2004 2004 - 2005 2006 - 2007 2007 - 2008 2008 - 2009
Academic Year
Fall
Enro
llmen
t
Fall Enrollment Logarithmic Projection Linear Projection Of those students who applied for admission, in Fall 2003, only 48% were accepted versus 66% just five years ago and 68% ten years ago. Of those who had applied, only 20% enrolled in Fall 2003 versus 33-35% just five and ten years ago.
Blueprints to Excellence: Enhancing the Academic Support Services and Campus Culture Alabama A&M University’s Quality Enhancement Plan
It takes a whole university to graduate a student! xi
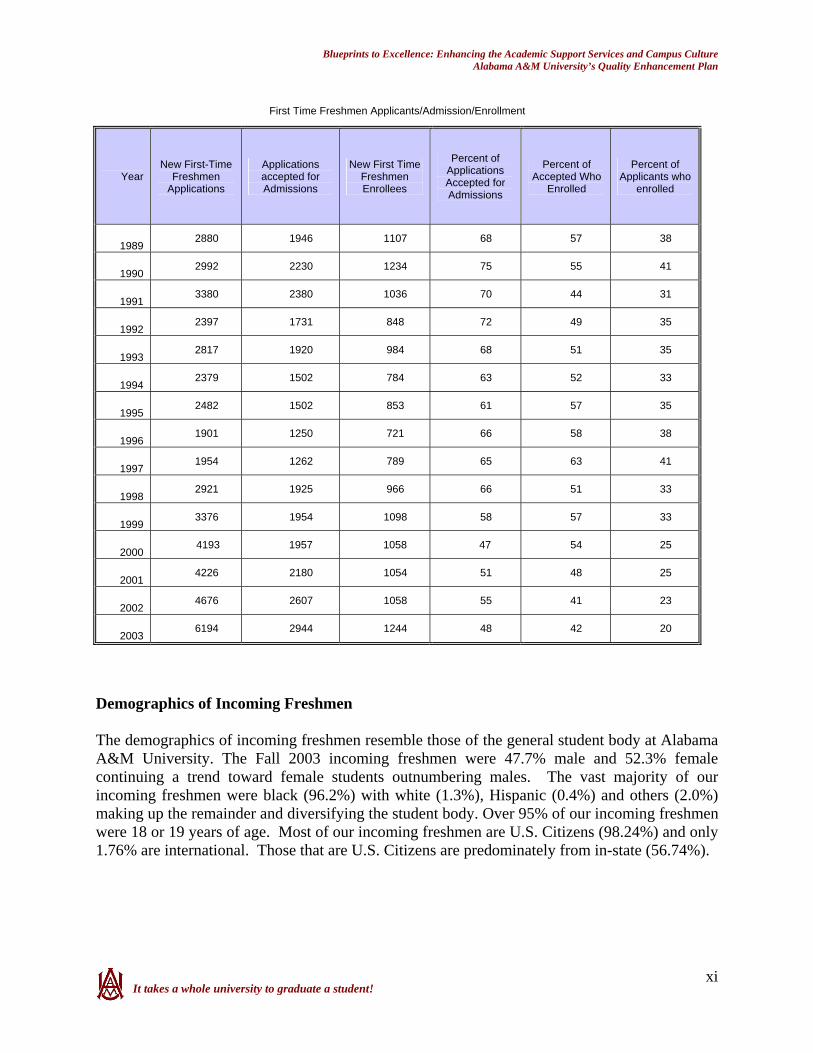
First Time Freshmen Applicants/Admission/Enrollment
Year New First-Time
Freshmen Applications
Applications accepted for Admissions
New First Time Freshmen Enrollees
Percent of Applications Accepted for Admissions
Percent of Accepted Who
Enrolled
Percent of Applicants who
enrolled
1989 2880 1946 1107 68 57 38
1990 2992 2230 1234 75 55 41
1991 3380 2380 1036 70 44 31
1992 2397 1731 848 72 49 35
1993 2817 1920 984 68 51 35
1994 2379 1502 784 63 52 33
1995 2482 1502 853 61 57 35
1996 1901 1250 721 66 58 38
1997 1954 1262 789 65 63 41
1998 2921 1925 966 66 51 33
1999 3376 1954 1098 58 57 33
2000 4193 1957 1058 47 54 25
2001 4226 2180 1054 51 48 25
2002 4676 2607 1058 55 41 23
2003 6194 2944 1244 48 42 20
Demographics of Incoming Freshmen The demographics of incoming freshmen resemble those of the general student body at Alabama A&M University. The Fall 2003 incoming freshmen were 47.7% male and 52.3% female continuing a trend toward female students outnumbering males. The vast majority of our incoming freshmen were black (96.2%) with white (1.3%), Hispanic (0.4%) and others (2.0%) making up the remainder and diversifying the student body. Over 95% of our incoming freshmen were 18 or 19 years of age. Most of our incoming freshmen are U.S. Citizens (98.24%) and only 1.76% are international. Those that are U.S. Citizens are predominately from in-state (56.74%).

Blueprints to Excellence: Enhancing the Academic Support Services and Campus Culture Alabama A&M University’s Quality Enhancement Plan
It takes a whole university to graduate a student! xii
U.S. Citizens and Residents
Year
In-State Out-of-State
International
1999 57.72% 39.43% 2.85%
2000 58.75% 39.14% 2.11%
2001 58.32% 38.88% 2.80%
2002 60.12% 37.97% 1.91%
2003 56.74% 41.50% 1.76%
The majority of our incoming freshmen students come from within the state of Alabama (58.5%) with the top five counties of origin being Madison, Jefferson, Mobile, Montgomery, and Lee, all urban centers. Although the majority of our students come from Alabama, in the last five years, AAMU has accepted students from 41 states with the greatest numbers coming from Georgia, Illinois, Michigan, Missouri, Tennessee, and Ohio in rank order. This pattern reflects both the impacts of the contiguous surrounding states and simultaneously an active nation-wide alumni involvement in recruitment. Socioeconomic and Social Characteristics of Incoming Freshmen The Fall 2003 Freshmen CIRP survey indicated that 74.9% of the freshmen surveyed came from homes over 100 miles from campus. This percentage of students coming a significant distance from home to attend college is larger than that at all HBCUs (43.1%) and at public 4-year colleges nationwide (25.4%). Of the incoming students, 85.3% expected to reside in the college dormitories, a much larger percentage than those at other HBCUs (72.5%) and other four year colleges (52.5%). This large proportion of students who are not proximal to their families and the family emotional support structure may have greater needs for mentorship and transitional support during their first year to adjust to the relative freedoms of their first year away from home. Since 85.38% of our incoming freshmen live on campus, the hub of social life for these students has to be campus activities, providing a unique opportunity to enhance cultural exposure during the critically important first two years when students are most likely to reside on campus.

Blueprints to Excellence: Enhancing the Academic Support Services and Campus Culture Alabama A&M University’s Quality Enhancement Plan
It takes a whole university to graduate a student! xiii
Campus Residence of Freshmen
Live on Campus? Year
Total incoming Freshmen (Fall Term) Yes No
1999 1121 977 (87.15%) 144 (12.85%)
2000 1091 920 (84.33% 171 (15.67%)
2001 1142 951 (83.27%) 191 (16.73%)
2002 1151 976 (84.80%) 175 (15.20%)
2003 1306 1115 (85.38%) 191 (14.62%)
The expectations of our incoming freshmen with respect to standard of living may also be higher. The parental income for our students indicates that fewer of their parents have incomes less than $30,000 (44.8%) than for all black colleges (51.5%) and more have parents with incomes up to $100,000 (47.9%) and above (7.6%) than for all black colleges (43.1% and 5.3%). AAMU’s incoming freshmen are also coming from homes with a relatively high percentage of parents with college degrees, particularly the mothers of whom 25.8% had received a college degree and another 13% had received some graduate training or a graduate degree comparing favorably to other 4-year colleges (24.3% and 13.1%) and exceeding other HBCUs (21.4% and 9.5%). The majority of our freshmen have both parents living (91.2%) with 43.1% of the students coming from homes where both parents are cohabitating. Approximately 67% of our students come from homes in which the religious preference was Baptist compared to ~50% among HBCUs and only ~16% for all 4-year colleges. Both the reasons that incoming students have chosen to attend Alabama A&M University and the motivations for going to college are important to understand, because they shape the expectations of the incoming freshmen for their first year experience. More of AAMU’s incoming freshmen aspire to attain the doctorate or equivalent degrees (39.5%) compared to those entering other HBCUs (32.0%) or other four year colleges (24.5%). The top three motivations for attending college for AAMU incoming freshmen were to be able to get a better job, to be able to make more money, and to get training for a specific career. The pattern for other motivational factors resembled those of students entering other HBCUs including ‘wanting to get away from home’ and ‘my parents wanted me to go’. A majority of 89.1% also indicated that an essential or very important objective for them was to ‘be well off financially.’

Blueprints to Excellence: Enhancing the Academic Support Services and Campus Culture Alabama A&M University’s Quality Enhancement Plan
It takes a whole university to graduate a student! xiv
Alabama A & M University # Resp- Your
Institution
All Pub Black Colls
Public 4yr
Colls-low
First-time Full-time ondents Men Women Total Men Women Total Men Women Total What is your best estimate of your parent’s total income last year? 464 Less than $10,000 11.4 15.0 13.4 13.6 17.1 15.6 4.5 7.5 6.2 $10,000 to $14,999 11.8 9.5 10.6 8.4 9.8 9.2 3.7 5.8 4.8 $15,000 to $19,999 5.7 7.1 6.5 10.0 8.9 9.4 4.3 5.2 4.8 $20,000 to $24,999 7.1 5.5 6.3 9.4 8.5 8.9 5.1 6.1 5.6 $25,000 to $29,999 7.6 8.3 8.0 8.3 8.6 8.4 4.6 5.9 5.3 $30,000 to $39,999 11.8 11.1 11.4 10.9 12.4 11.8 8.3 9.4 8.9 $40,000 to $49,999 9.0 9.1 9.1 9.1 10.4 9.9 8.7 10.2 9.6 $50,000 to $59,999 10.4 9.5 9.9 9.4 7.9 8.5 10.5 9.9 10.2 $60,000 to $74,999 9.5 6.3 7.8 8.4 6.8 7.5 13.4 11.6 12.4 $75,000 to $99,999 9.5 9.9 9.7 5.8 5.2 5.4 15.2 12.1 13.5 $100,000 to $149,999 2.4 5.1 3.9 4.0 3.3 3.6 13.0 9.8 11.2 $150,000 to $199,999 2.4 2.0 2.2 1.1 0.6 0.8 4.3 3.2 3.7 $200,000 to $249,999 0.9 0.4 0.6 0.3 0.2 0.2 1.7 1.4 1.5 $250,000 or more 0.5 1.2 0.9 1.3 0.2 0.7 2.6 1.9 2.2 What is the highest level of formal education obtained by your parents? Father 490 Grammar school or less 3.4 1.2 2.2 3.3 3.9 3.7 4.6 6.3 5.6 Some high school 6.9 11.2 9.2 10.1 12.6 11.6 6.2 7.8 7.1 High school graduate 37.5 36.8 37.1 41.0 40.3 40.6 26.7 28.3 27.6
Postsecondary school other than college 3.4 6.2 4.9 3.7 4.3 4.1 4.2 4.6 4.5
Some college 19.0 20.9 20.0 16.2 18.7 17.6 17.2 19.7 18.6 College degree 22.0 14.0 17.8 18.7 13.4 15.6 25.6 20.5 22.8 Some graduate school 0.9 0.4 0.6 0.5 0.9 0.7 1.3 1.3 1.3 Graduate degree 6.9 9.3 8.2 6.5 5.9 6.2 14.1 11.5 12.6 Mother 511 Grammar school or less 2.5 1.8 2.2 2.5 2.0 2.2 4.2 5.9 5.1 Some high school 5.1 5.5 5.3 6.3 8.9 7.8 4.5 6.4 5.6 High school graduate 26.2 27.4 26.8 31.5 28.0 29.4 26.0 25.1 25.5
Postsecondary school other than college 3.8 5.8 4.9 5.1 6.6 6.0 5.3 5.4 5.3
Some college 21.5 22.6 22.1 21.7 25.1 23.7 19.0 22.7 21.1 College degree 27.8 24.1 25.8 23.2 20.1 21.4 27.0 22.2 24.3 Some graduate school 1.7 2.2 2.0 1.2 1.2 1.2 1.9 1.8 1.9 Graduate degree 11.4 10.6 11.0 8.5 8.1 8.3 12.1 10.5 11.2
How these incoming students reported spending their time also indicates habits and patterns that can affect student learning during the critically important first two years. A much smaller percentage of AAMU incoming freshmen reported socializing with another racial or ethnic group (57.0%) than did those at other HBCUs (72.5%) and four year colleges (71.7%). Freshmen entering Alabama A&M University are underexposed to diversity. Following the same pattern were activities such as discussing politics, visiting an art gallery or museum, or performing volunteer work, which may indicate underexposure to diverse cultural activities, lack of opportunities for such special interactions, and a lack of social maturity. Activities that point out potential difficulties with first year academic success are the larger numbers reporting ‘coming late to class’ (72.8%) and ‘oversleeping and missing class or appointments’ (60.9%) than their counterparts at other HBCUs (67.8% and 45.1%), or those at other four year colleges (64.7% and 34.8%). Another potential area of concern is that the percentages reporting ‘drinking beer’

Blueprints to Excellence: Enhancing the Academic Support Services and Campus Culture Alabama A&M University’s Quality Enhancement Plan
It takes a whole university to graduate a student! xv
(24.7%) and ‘drinking wine or liquor’ (47.5%) more closely resemble percentages found at other four year colleges rather than the lower reported percentages for other HBCUs. Of AAMU’s incoming freshmen, 52.5% also report spending from six to above 20 hours per week watching television and only 21.8% spent equivalent time reading for pleasure. In fact, 30.7% reported spending no time reading for pleasure! AAMU was the first choice for only 40.9% and a second choice for 33.7% of incoming freshmen. This was further confirmed by our on campus survey of student satisfaction conducted in Fall 2003 in which 41.5% of students reported AAMU as their first choice. Other HBCU’s were more often the first choice for their incoming freshmen (45.3%) or other four year colleges (61.3%) per the CIRP. Fewer of AAMU’s incoming freshmen listed ‘the college has a good academic reputation’, the ‘college offers special educational programs’, and ‘the college has low tuition’ than did freshmen entering other HBCU’s or other four year colleges. “I was offered financial assistance” was a very important reason for choosing AAMU for 43.2% of our incoming freshmen. The student body as a whole offered the following factors as important for their choice of Alabama A&M University – low cost (18.7%), location (19.3%), reputation (11.7%), size (9.5%), programs (16.9%), scholarships (15.8%), and other (8.2%) [from the Fall 2003 Student Satisfaction Survey, OIPRE]. How the incoming students perceive themselves also affects their degree of comfort dealing with the realities of college level courses in that first transition year. Those items in which AAMU incoming freshmen rated themselves as higher than those in all public black colleges were artistic ability, mathematical ability, popularity, religiousness, self-confidence (both intellectual and social), and spirituality. Categories in which they rated themselves as lower than those in all public black colleges were drive to achieve and emotional health. With respect to self-perceptions of academic skills and abilities and those related to social and interaction skills, incoming freshmen have strong self-perceptions. When the perception meets the reality of actual academic performance and social interaction, students may have an increased need for mentorship and advisement to help them grapple with those day-to-day realities.
Alabama A&M University CIRP Fall 2003 Survey # resp AAMU All Pub Black Colleges Public 4yr Colleges-Low
First-time, full-time Men Women Total Men Women Total Men Women Total Student rated self "above average" or "highest 10%" as compared with the average person of his/her age in: Academic ability 511 52.3 46.7 49.3 49.3 44.7 46.6 60.8 54.1 57.0 Artistic ability 510 29.4 25.4 27.3 30.5 21.4 25.2 32.5 26.3 29.0 Computer skills 508 46.0 35.4 40.4 44.9 36.7 40.2 50.6 29.7 38.8 Cooperativeness 507 66.7 69.3 68.0 67.2 69.1 68.3 69.7 73.2 71.7 Creativity 508 59.9 53.9 56.7 62.4 54.5 57.8 60.8 55.0 57.5 Drive to achieve 509 67.1 71.7 69.5 71.2 73.9 72.8 64.9 70.1 67.8 Emotional health 507 54.0 43.0 48.1 59.7 47.4 52.5 59.1 46.1 51.7 Leadership ability 507 62.0 60.7 61.3 65.1 58.7 61.3 61.9 54.9 58.0 Mathematical ability 509 40.5 31.3 35.6 36.1 28.7 31.8 43.6 28.4 35.0 Physical health 509 65.8 36.8 50.3 67.1 39.1 50.8 67.2 44.1 54.2 Persistence 508 58.1 52.6 55.1 58.7 53.0 55.4 60.6 55.4 57.7 Popularity 509 46.0 42.6 44.2 48.7 36.9 41.8 45.3 32.3 38.0 Public speaking ability 508 35.9 34.7 35.2 35.6 31.9 33.4 36.0 30.5 32.9 Religiousness 508 39.7 42.4 41.1 33.2 41.8 38.2 25.3 29.6 27.8 Risk-taking 507 48.3 34.3 40.8 50.0 37.2 42.6 52.9 37.4 44.2 Self-confidence (intellectual) 507 73.6 66.9 70.0 72.9 64.3 67.9 66.6 50.0 57.3 Self-confidence (social) 508 66.2 62.7 64.4 68.6 61.9 64.7 57.8 50.0 53.4

Blueprints to Excellence: Enhancing the Academic Support Services and Campus Culture Alabama A&M University’s Quality Enhancement Plan
It takes a whole university to graduate a student! xvi
Self-understanding 507 66.2 64.8 65.5 67.6 61.4 64.0 60.2 52.3 55.7 Spirituality 508 48.1 53.9 51.2 44.5 51.9 48.8 34.1 38.6 36.6 Understanding of others 509 58.2 65.4 62.1 61.8 64.4 63.3 62.4 66.6 64.8 Writing ability 509 39.2 41.9 40.7 40.0 41.4 40.8 39.9 40.5 40.2
Academic Preparation of Incoming Freshmen How strong are these incoming freshmen academically? The average ACT scores for Fall 2003 incoming freshmen were 17.12 (English), 16.97 (Math), 15.36 (Social Studies), 12.67 (Natural Sciences), and 17.70 (Comprehensive). For all ACT scores with the exception of Natural Sciences, the scores for the Fall 2003 incoming freshmen were the highest among the last four years. This year’s incoming freshmen class included 80 valedictorians and salutatorians, and over 150 honor students out of 1,244. The average high school GPA of the Fall 2003 incoming class was 2.75 up from 2.71 of the Fall 2001 incoming class. Expectations for academic achievement of this new crop of freshmen should be high based upon the improvement in incoming freshmen academic credentials. This may require a change in the culture and perceptions of faculty who are teaching the first two years as well.
Average ACT Scores of First-Time Freshmen 1999 - 2003
Year Term Subject
English Mathematics Social Studies Natural Sciences
Comprehensive
1999 FA 16.73 16.76 16.04 16.18 17.10
2000 FA 16.64 16.80 15.05 16.12 17.20
2001 FA 16.45 16.74 14.51 14.30 17.07
2002 FA 16.94 16.81 15.10 11.86 17.46
2003 FA 17.12 16.97 15.36 12.67 17.70
Average High School GPAs of First-Time Freshmen 2001 - 2003
Term & Year English Mathematics Science Social Studies Core Cumulatives
Fall 2001 2.49 2.27 2.41 2.63 2.45 2.71
Fall 2002 2.49 2.26 2.4 2.60 2.44 2.70
Fall 2003 2.52 2.27 2.40 2.64 2.46 2.75
Blueprints to Excellence: Enhancing the Academic Support Services and Campus Culture Alabama A&M University’s Quality Enhancement Plan
It takes a whole university to graduate a student! xvii
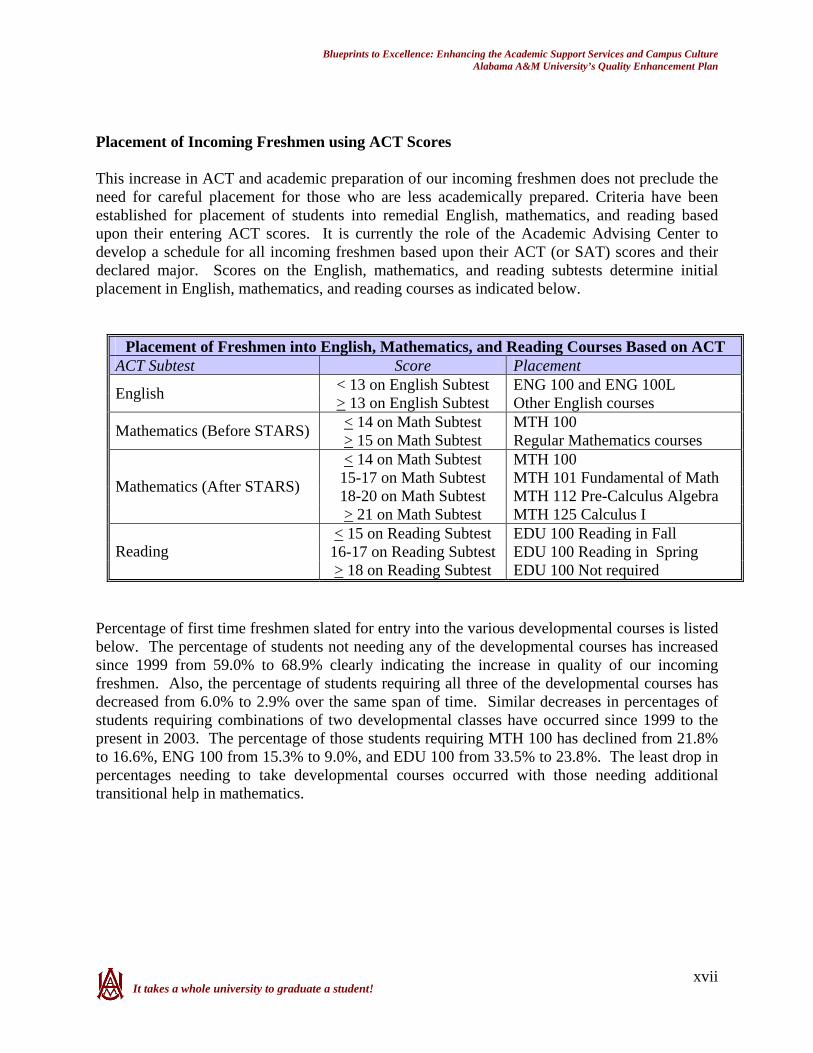
Placement of Incoming Freshmen using ACT Scores This increase in ACT and academic preparation of our incoming freshmen does not preclude the need for careful placement for those who are less academically prepared. Criteria have been established for placement of students into remedial English, mathematics, and reading based upon their entering ACT scores. It is currently the role of the Academic Advising Center to develop a schedule for all incoming freshmen based upon their ACT (or SAT) scores and their declared major. Scores on the English, mathematics, and reading subtests determine initial placement in English, mathematics, and reading courses as indicated below.
Placement of Freshmen into English, Mathematics, and Reading Courses Based on ACT ACT Subtest Score Placement
< 13 on English Subtest ENG 100 and ENG 100L English > 13 on English Subtest Other English courses < 14 on Math Subtest MTH 100 Mathematics (Before STARS) > 15 on Math Subtest Regular Mathematics courses < 14 on Math Subtest MTH 100
15-17 on Math Subtest MTH 101 Fundamental of Math 18-20 on Math Subtest MTH 112 Pre-Calculus Algebra Mathematics (After STARS)
> 21 on Math Subtest MTH 125 Calculus I < 15 on Reading Subtest EDU 100 Reading in Fall
16-17 on Reading Subtest EDU 100 Reading in Spring Reading > 18 on Reading Subtest EDU 100 Not required
Percentage of first time freshmen slated for entry into the various developmental courses is listed below. The percentage of students not needing any of the developmental courses has increased since 1999 from 59.0% to 68.9% clearly indicating the increase in quality of our incoming freshmen. Also, the percentage of students requiring all three of the developmental courses has decreased from 6.0% to 2.9% over the same span of time. Similar decreases in percentages of students requiring combinations of two developmental classes have occurred since 1999 to the present in 2003. The percentage of those students requiring MTH 100 has declined from 21.8% to 16.6%, ENG 100 from 15.3% to 9.0%, and EDU 100 from 33.5% to 23.8%. The least drop in percentages needing to take developmental courses occurred with those needing additional transitional help in mathematics.

Blueprints to Excellence: Enhancing the Academic Support Services and Campus Culture Alabama A&M University’s Quality Enhancement Plan
It takes a whole university to graduate a student! xviii
Placement Requirements Summary for First-Time Freshmen - FALL 1999 - 2003
Count of Students Required to take
Year Term All First-
Time Freshmen MTH
100 ENG 100
EDU 100
MTH +
ENG
ENG +
EDU
EDU +
MTH
ONLY 1
ONLY 2
ALL 3
None of the
3
1999 FA 744 162 114 249 49 99 117 130 130 45 439
2000 FA 903 174 113 275 51 100 122 160 129 48 566
2001 FA 947 181 139 321 49 126 133 163 170 46 568
2002 FA 1039 186 125 280 44 102 122 184 139 43 673
2003 FA 1167 194 105 278 37 84 127 183 146 34 804
Percentage of Students Required to Take Developmental Courses
Year Term All First-
Time Freshmen MTH
100 ENG 100
EDU 100
MTH +
ENG
ENG +
EDU
EDU +
MTH
ONLY 1
ONLY 2
ALL 3
None of the
3
1999 FA 100.0% 21.8% 15.3% 33.5% 6.6% 13.3% 15.7% 17.5% 17.5% 6.0% 59.0%
2000 FA 100.0% 19.3% 12.5% 30.5% 5.6% 11.1% 13.5% 17.7% 14.3% 5.3% 62.7%
2001 FA 100.0% 19.1% 14.7% 33.9% 5.2% 13.3% 14.0% 17.2% 18.0% 4.9% 60.0%
2002 FA 100.0% 17.9% 12.0% 26.9% 4.2% 9.8% 11.7% 17.7% 13.4% 4.1% 64.8%
2003 FA 100.0% 16.6% 9.0% 23.8% 3.2% 7.2% 10.9% 15.7% 12.5% 2.9% 68.9%
Identifying those students needing to take the developmental courses is only the first step in transitioning these students to better handle the regular college-level mathematics, English, and courses requiring satisfactory reading abilities. A key component in assuring that the competencies are met is having the students take the required developmental course early enough in their college career to positively impact later academic performance, ideally in the first semester. From the table below, we can see that only some of the students identified as needing MTH 100, ENG 100, and EDU 100 take the courses in their first semester. The percentage of those taking MTH 100 has increased from only 53.7% of those needing it in 1999 to 67.5% in 2003. A similar pattern occurs for those needing EDU 100. The developmental courses can best be effective if taken in the first semester by incoming freshmen needing them. Clearly, procedures must be implemented to insure that placement is followed by actual registration in the appropriate courses.

Blueprints to Excellence: Enhancing the Academic Support Services and Campus Culture Alabama A&M University’s Quality Enhancement Plan
It takes a whole university to graduate a student! xix
Actual Enrollment of Freshmen Slated for Placement in Developmental Courses
Enrolled First Term
Enrolled in later terms
Total Enrolled (up to FA 2003)
Counts of First Term Enrollees by Grade
Secured
Placement Criteria
with respect to relevant
ACT Score
Course Cohort Year & Term
Required to Enroll
in the course
(**) Count % Count % Count % A B C D F
1999 FA 162 87 53.7% 15 9.3% 102 63.0% 12 28 32 6 9
2000 FA 174 78 44.8% 3 1.7% 81 46.6% 13 27 20 10 8
2001 FA 181 101 55.8% 21 11.6% 122 67.4% 28 32 24 5 12
2002 FA 186 123 66.1% 10 5.4% 133 71.5% 33 36 41 8 5
< 14 MTH 100
2003 FA 194 131 67.5% 131 67.5% 18 25 41 16 31
1999 FA 114 62 54.4% 2 1.8% 64 56.1% 5 13 39 5
2000 FA 113 42 37.2% 1 0.9% 43 38.1% 2 18 20 1 1
2001 FA 139 51 36.7% 10 7.2% 61 43.9% 3 22 23 1 2
2002 FA 125 53 42.4% 4 3.2% 57 45.6% 4 20 29
< 13 ENG 100
2003 FA 105 59 56.2% 59 56.2% 4 27 25 3
1999 FA 114 56 49.1% 0 56 49.1%
2000 FA 113 44 38.9% 3 2.7% 47 41.6%
2001 FA 139 46 33.1% 9 6.5% 55 39.6%
2002 FA 125 57 45.6% 4 3.2% 61 48.8%
< 13 ENG 100 Lab
2003 FA 105 68 64.8% 68 64.8%
1999 FA 249 59 23.7% 37 14.9% 96 38.6% 11 20 20 1 7
2000 FA 275 71 25.8% 16 5.8% 87 31.6%
2001 FA 321 137 42.7% 14 4.4% 151 47.0%
2002 FA 280 120 42.9% 14 5.0% 134 47.9%
< 15 EDU 100
2003 FA 278 110 39.6% 110 39.6%
1999 FA 249 15 6.0% 0 15 6.0%
2000 FA 275 0 0 0
2001 FA 321 0 0 0
2002 FA 280 0 1 0.4% 1 0.4%
< 15 EDU 100 Lab
2003 FA 278 24 8.6% 24 8.6%
There are some consequences to being placed in developmental courses in mathematics, English, and reading. Among those are the longer time until students can begin taking the required

Blueprints to Excellence: Enhancing the Academic Support Services and Campus Culture Alabama A&M University’s Quality Enhancement Plan
It takes a whole university to graduate a student! xx
courses for their declared major, longer time required to graduate, and a stigma attached to those in ‘developmental’ courses. The stigma can be reduced by considering the developmental courses as ‘transitional courses,’ but these are clearly offset by the advantages of being thoroughly prepared for the next level of courses. Retention and Probation Statistics and Trends University College was established in 1991 as an entry point for incoming freshmen to help them achieve academically and to ease the transition to degree granting units. A strong part of its mission was to increase the retention and subsequent graduation rate of these students. The percentage of the incoming freshmen cohort retained to the sophomore year from 1993 to 2001 was, on average, approximately 69%. By the junior year, this cohort was down to 55.8% and by the senior year to 50.1%. In terms of incremental rate of retention, we lose 30% of the freshmen cohort in the first year. Of those retained in the sophomore year, an additional 20% are lost by the junior year, and 10% of those retained in the junior year are lost by the senior year. The year 2002 heralded the first increase in student retention from the previous rate of approximately 69% to 74.13% from freshman to sophomore year.
Freshman Retention Rates (All Students)
Year Initial Cohort of First-Time Freshmen
Number Retained at the Beginning of
Retention Rates (%) Incremental Retention Rate (%)
Year 2 Year 3 Year 4 Two Year Three Year Four Year Second to Third Year
Third to Fourth Year
1992 875 661 475 396 75.54% 54.29% 45.26% 71.86% 83.37%
1993 1019 708 545 505 69.48% 53.48% 49.56% 76.98% 92.66%
1994 775 509 431 383 65.68% 55.61% 49.42% 84.68% 88.86%
1995 849 623 489 448 73.38% 57.60% 52.77% 78.49% 91.62%
1996 716 500 403 378 69.83% 56.28% 52.79% 80.60% 93.80%
1997 789 554 475 422 70.22% 60.20% 53.49% 85.74% 88.84%
1998 998 682 526 484 68.34% 52.71% 48.50% 77.13% 92.02%
1999 1110 772 627 535 69.55% 56.49% 48.20% 81.22% 85.33%
2000 1035 724 573 527 69.95% 55.36% 50.92% 79.14% 91.97%
2001 1129 783 637 69.35% 56.42% 81.35%
2002 1117 828 74.13%
2003 1291
Average retention rate (%) 70.50% 55.84% 50.10% 79.72% 89.83%
This increase in retention for 2002 may be directly linked with a decision made by the University in August of 2001. In response to an unchanging pattern of losing approximately 30% of our incoming freshmen between year one and year two, the University established the Office of

Blueprints to Excellence: Enhancing the Academic Support Services and Campus Culture Alabama A&M University’s Quality Enhancement Plan
It takes a whole university to graduate a student! xxi
Retention and Academic Support (ORAS) as an initiative of the Vice President of Academic Affairs. Its purpose was to implement academic programs or coordinate with then existing programs to increase persistence, retention, and ultimately graduation rates. The initial thrust was a pilot program geared toward providing intrusive academic services to a select group of 93 students who were either on academic probation and/or had been suspended for academic reasons and were being readmitted to the University. In response to this, ORAS offered services that included individualized academic counseling, tutorial services, communication with instructors, learning strategy workshops (study skills, test taking, critical thinking), and student advocacy with other University offices and programs. In Spring 2002, Financial Aid designated ORAS as the official office to provide intrusive services to students on financial aid probation, according to both University and U.S. Dept. of Education federal aid guidelines. Since that time, there has been a decrease in numbers of students on financial aid probation to only 7% of the percentage of the Fall 2003 enrollment, down from levels of 15.9% in Fall 2001 and 13.5% in Fall 2002.
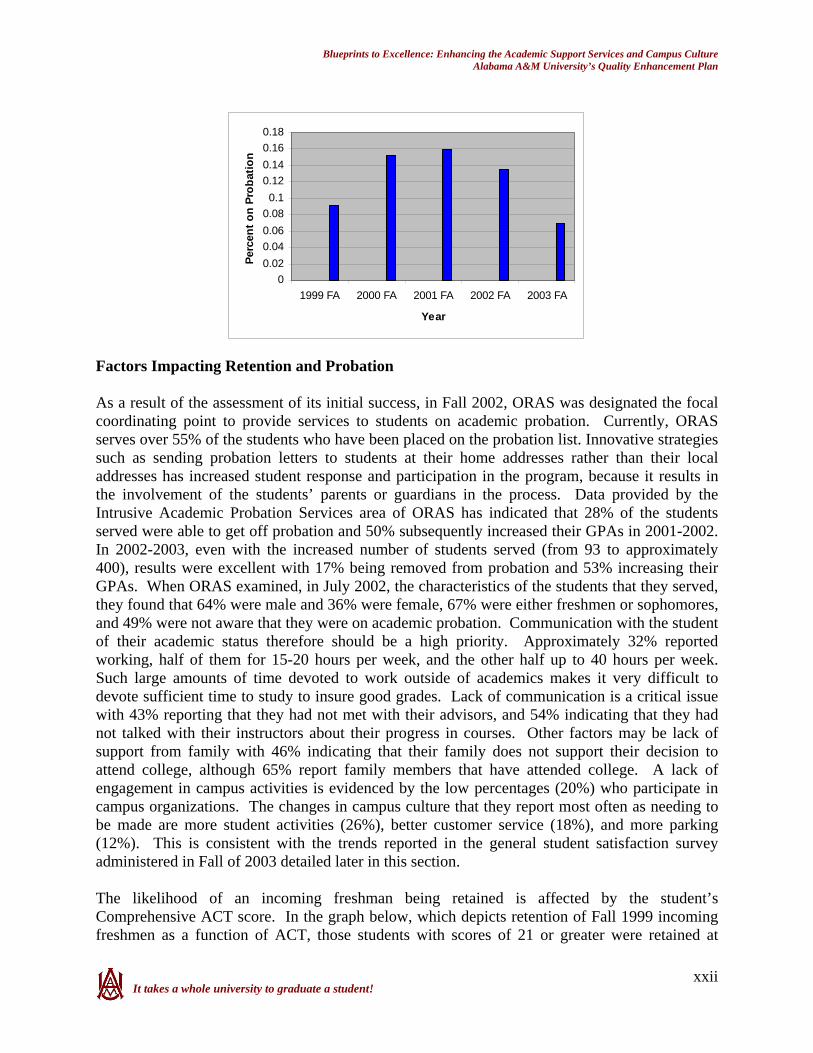
Probation Counts
Description 1999 FA
2000 FA
2001 FA
2002 FA
2003 FA
Continued probation 206 225 184 120 181
Currently on probation 194 410 502 444 177
Indefinite Academic suspension 6 3 1
On probation after being dropped/ suspended 103 2 2 25 100
Temporarily dropped or suspended 182 219 192
Sub-Total on Probation 503 825 910 782 458
Clear after being on probation 35 65 51 47 56
Total Enrollment 5497 5448 5726 5805 6559
Probation Counts as Percent of Total Enrollment
Description 1999 FA
2000 FA
2001 FA
2002 FA
2003 FA
Continued probation 3.7% 4.1% 3.2% 2.1% 2.8%
Currently on probation 3.5% 7.5% 8.8% 7.6% 2.7%
Indefinite Academic suspension 0.1% 0.1% 0.0%
On probation after being dropped/ suspended 1.9% 0.0% 0.0% 0.4% 1.5%
Temporarily dropped or suspended 3.3% 3.8% 3.3%
Sub-Total on Probation 9.2% 15.1% 15.9% 13.5% 7.0%
Clear after being on probation 0.6% 1.2% 0.9% 0.8% 0.9%
Blueprints to Excellence: Enhancing the Academic Support Services and Campus Culture Alabama A&M University’s Quality Enhancement Plan
It takes a whole university to graduate a student! xxii
00.020.040.060.080.1
0.120.140.160.18
1999 FA 2000 FA 2001 FA 2002 FA 2003 FA
Year
Perc
ent o
n Pr
obat
ion
Factors Impacting Retention and Probation As a result of the assessment of its initial success, in Fall 2002, ORAS was designated the focal coordinating point to provide services to students on academic probation. Currently, ORAS serves over 55% of the students who have been placed on the probation list. Innovative strategies such as sending probation letters to students at their home addresses rather than their local addresses has increased student response and participation in the program, because it results in the involvement of the students’ parents or guardians in the process. Data provided by the Intrusive Academic Probation Services area of ORAS has indicated that 28% of the students served were able to get off probation and 50% subsequently increased their GPAs in 2001-2002. In 2002-2003, even with the increased number of students served (from 93 to approximately 400), results were excellent with 17% being removed from probation and 53% increasing their GPAs. When ORAS examined, in July 2002, the characteristics of the students that they served, they found that 64% were male and 36% were female, 67% were either freshmen or sophomores, and 49% were not aware that they were on academic probation. Communication with the student of their academic status therefore should be a high priority. Approximately 32% reported working, half of them for 15-20 hours per week, and the other half up to 40 hours per week. Such large amounts of time devoted to work outside of academics makes it very difficult to devote sufficient time to study to insure good grades. Lack of communication is a critical issue with 43% reporting that they had not met with their advisors, and 54% indicating that they had not talked with their instructors about their progress in courses. Other factors may be lack of support from family with 46% indicating that their family does not support their decision to attend college, although 65% report family members that have attended college. A lack of engagement in campus activities is evidenced by the low percentages (20%) who participate in campus organizations. The changes in campus culture that they report most often as needing to be made are more student activities (26%), better customer service (18%), and more parking (12%). This is consistent with the trends reported in the general student satisfaction survey administered in Fall of 2003 detailed later in this section. The likelihood of an incoming freshman being retained is affected by the student’s Comprehensive ACT score. In the graph below, which depicts retention of Fall 1999 incoming freshmen as a function of ACT, those students with scores of 21 or greater were retained at

Blueprints to Excellence: Enhancing the Academic Support Services and Campus Culture Alabama A&M University’s Quality Enhancement Plan
It takes a whole university to graduate a student! xxiii
greater percentages during the next seven semesters. After their first year, students with ACT scores of 15 to 17 and those with scores below 14 exhibited a lower level of retention over the next five semesters. First year losses were very high and the rate of loss in the following semesters was steeper than that for students with ACT scores greater than 21. Those students with scores of 18 to 20 exhibited retention patterns intermediate between the extremes. Clearly, this indicates that, as a group, those students entering with ACT scores of 17 and below require special attention. This focused attention may be in the form of workshops which focus on issues such as effective studying, time management, listening skills, reading comprehension, and writing skills, or it could utilize an intrusive tutorial assistance approach. They may also benefit more from increased interaction with successful peers, faculty mentors, and advisors/counselors, which depends on an improved socio-cultural environment on campus. Early identification and intervention will be a key to successful retention. Based upon these data, a model to predict those students with the greatest likelihood for non-retention should be developed; and such a model should include ACT data as well as other possible impactive factors such as high school GPA, parental income, educational attainment of parents, working, and being far from home.
Retention of Fall 1999 Freshmen Cohort by ACT Score Ranges 1999-2003
30.0%
40.0%
50.0%
60.0%
70.0%
80.0%
90.0%
100.0%
Year - Term
Perc
ent R
etai
ned
14 and below 100.0% 100.0% 93.4% 71.3% 66.2% 58.1% 52.2% 47.1% 48.5% 42.6%
15 - 17 100.0% 98.8% 90.6% 69.6% 63.1% 55.8% 52.5% 46.9% 48.4% 42.2%
18 - 20 100.0% 97.7% 93.6% 73.4% 68.2% 65.3% 60.1% 57.2% 57.2% 38.7%
21 and above 100.0% 99.0% 91.7% 78.1% 77.1% 71.9% 68.8% 65.6% 63.5% 44.8%
Initial Cohort1999 Fall 2000 Spring2000 Fall 2001 Spring2001 Fall 2002 Spring2002 Fall 2003 Spring2003 Fall
Percent Retained
Retention is only the first step in successfully graduating a student equipped with the educational achievements and skills that he or she needs for later professional life. The rate of graduation within four years has ranged from 10.63% to 21.79%. The higher values reached in 1995 and 1996 were influenced by the increases in retention resulting from the establishment of University College in 1991. According to national trends in graduation statistics, students are taking longer to graduate than ever before with six years being very common. The national average from freshman enrollment to a bachelor's degree is now 5.2 years (NCES). In 1995 and 1996, six year graduation rates reached a high of 40.52% and 40.22%, respectively at AAMU. Since 1997, the
Blueprints to Excellence: Enhancing the Academic Support Services and Campus Culture Alabama A&M University’s Quality Enhancement Plan
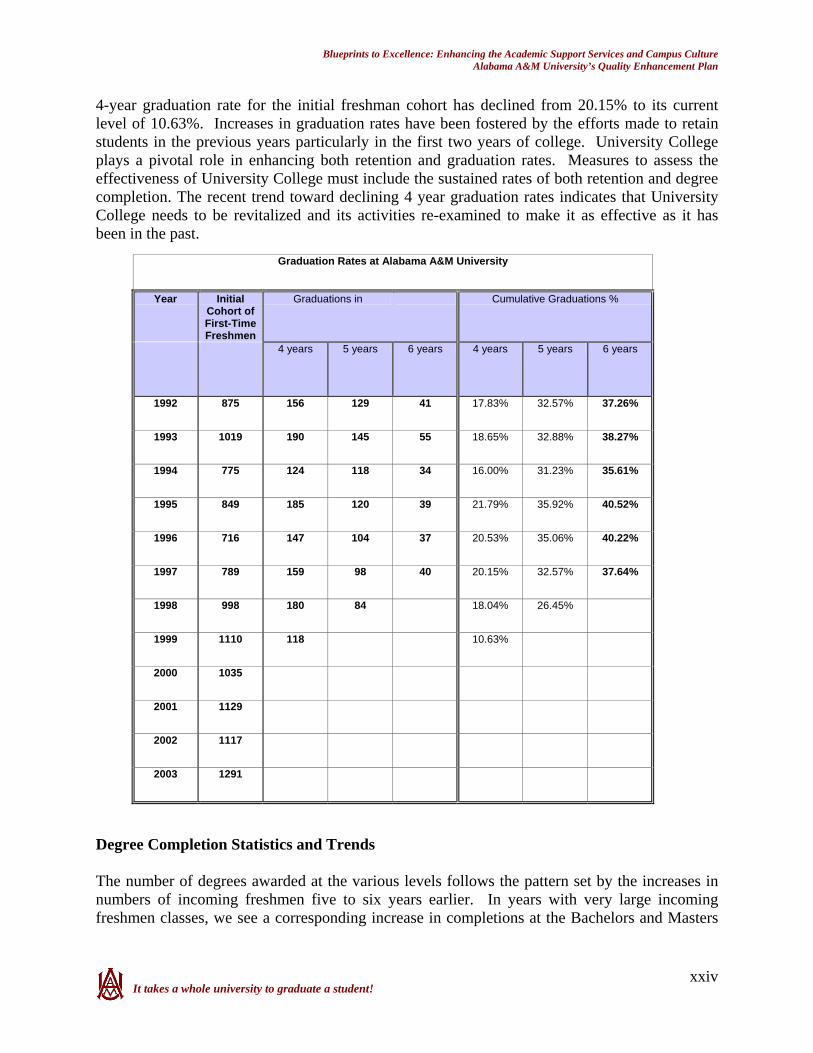
It takes a whole university to graduate a student! xxiv
4-year graduation rate for the initial freshman cohort has declined from 20.15% to its current level of 10.63%. Increases in graduation rates have been fostered by the efforts made to retain students in the previous years particularly in the first two years of college. University College plays a pivotal role in enhancing both retention and graduation rates. Measures to assess the effectiveness of University College must include the sustained rates of both retention and degree completion. The recent trend toward declining 4 year graduation rates indicates that University College needs to be revitalized and its activities re-examined to make it as effective as it has been in the past.
Graduation Rates at Alabama A&M University
Year Initial Cohort of First-Time Freshmen
Graduations in Cumulative Graduations %
4 years 5 years 6 years 4 years 5 years 6 years
1992 875 156 129 41 17.83% 32.57% 37.26%
1993 1019 190 145 55 18.65% 32.88% 38.27%
1994 775 124 118 34 16.00% 31.23% 35.61%
1995 849 185 120 39 21.79% 35.92% 40.52%
1996 716 147 104 37 20.53% 35.06% 40.22%
1997 789 159 98 40 20.15% 32.57% 37.64%
1998 998 180 84 18.04% 26.45%
1999 1110 118 10.63%
2000 1035
2001 1129
2002 1117
2003 1291
Degree Completion Statistics and Trends The number of degrees awarded at the various levels follows the pattern set by the increases in numbers of incoming freshmen five to six years earlier. In years with very large incoming freshmen classes, we see a corresponding increase in completions at the Bachelors and Masters

Blueprints to Excellence: Enhancing the Academic Support Services and Campus Culture Alabama A&M University’s Quality Enhancement Plan
It takes a whole university to graduate a student! xxv
degree levels approximately 5-7 years later. The number of degrees awarded by level and year are presented in the table below.
Degrees Awarded by Year and Degree Level
Year AA Certification
Associate Bacca-laurate
Masters Education Specialist
Doctoral Total Degrees awarded
1992 1 47 22 1 71
1993 15 2 431 285 1 734
1994 14 1 508 267 2 792
1995 20 2 578 383 4 6 993
1996 29 599 383 1 8 1020
1997 25 4 608 417 1 17 1072
1998 24 563 350 7 9 953
1999 31 536 303 6 8 884
2000 21 1 569 379 1 8 979
2001 10 543 307 3 15 878
2002 13 523 293 4 10 843
2003 3 475 300 18 4 800
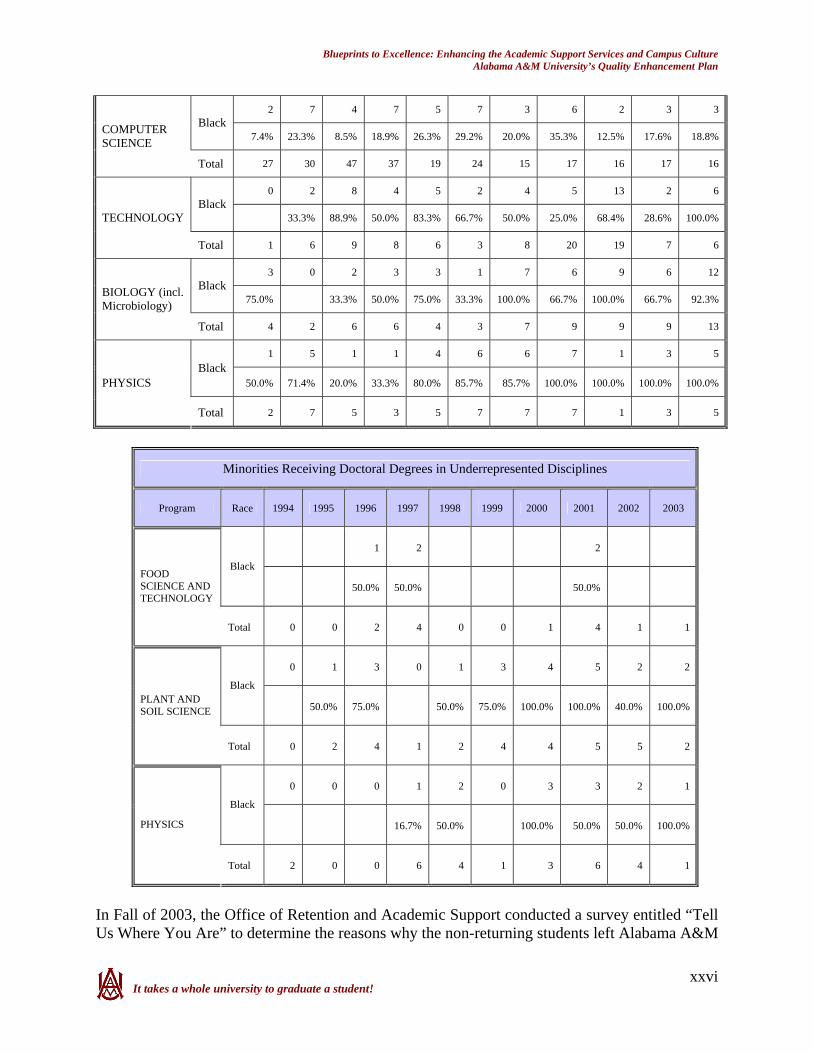
Alabama A&M University graduates a significant number of minority students with Masters degrees in underrepresented disciplines which include food science and technology, plant and soil science, computer science, technology, biology, and physics. At the doctoral levels, AAMU provides minority students with doctoral degrees in food science, plant and soil science, and physics. In fact, Alabama A&M University has been the number one source of minority PhDs in plant and soil science for the last three years. A new doctoral degree offering was approved in 2003 by the Alabama Commission on Higher Education in the area of Reading.
Minorities Receiving Masters Degrees in Underrepresented Disciplines
Program Race 1993 1994 1995 1996 1997 1998 1999 2000 2001 2002 2003
1 1 1 1 1 5 3 2 1 3 Black
100.0% 33.3% 25.0% 20.0% 20.0% 71.4% 75.0% 100.0% 33.3% 100.0% FOOD SCIENCE AND TECHNOLOGY
Total 1 3 4 5 5 7 2 4 2 3 3
6 5 4 2 8 1 6 3 4 6 7 Black
85.7% 50.0% 33.3% 40.0% 80.0% 50.0% 85.7% 100.0% 100.0% 100.0% 87.5% PLANT AND SOIL SCIENCE
Total 7 10 12 5 10 2 7 3 4 6 8
Blueprints to Excellence: Enhancing the Academic Support Services and Campus Culture Alabama A&M University’s Quality Enhancement Plan
It takes a whole university to graduate a student! xxvi
2 7 4 7 5 7 3 6 2 3 3 Black
7.4% 23.3% 8.5% 18.9% 26.3% 29.2% 20.0% 35.3% 12.5% 17.6% 18.8% COMPUTER SCIENCE
Total 27 30 47 37 19 24 15 17 16 17 16
0 2 8 4 5 2 4 5 13 2 6 Black
33.3% 88.9% 50.0% 83.3% 66.7% 50.0% 25.0% 68.4% 28.6% 100.0% TECHNOLOGY
Total 1 6 9 8 6 3 8 20 19 7 6
3 0 2 3 3 1 7 6 9 6 12 Black
75.0% 33.3% 50.0% 75.0% 33.3% 100.0% 66.7% 100.0% 66.7% 92.3% BIOLOGY (incl. Microbiology)
Total 4 2 6 6 4 3 7 9 9 9 13
1 5 1 1 4 6 6 7 1 3 5 Black
50.0% 71.4% 20.0% 33.3% 80.0% 85.7% 85.7% 100.0% 100.0% 100.0% 100.0% PHYSICS
Total 2 7 5 3 5 7 7 7 1 3 5
Minorities Receiving Doctoral Degrees in Underrepresented Disciplines
Program Race 1994 1995 1996 1997 1998 1999 2000 2001 2002 2003
1 2 2
Black
50.0% 50.0% 50.0% FOOD SCIENCE AND TECHNOLOGY
Total 0 0 2 4 0 0 1 4 1 1
0 1 3 0 1 3 4 5 2 2
Black
50.0% 75.0% 50.0% 75.0% 100.0% 100.0% 40.0% 100.0% PLANT AND SOIL SCIENCE
Total 0 2 4 1 2 4 4 5 5 2
0 0 0 1 2 0 3 3 2 1
Black
16.7% 50.0% 100.0% 50.0% 50.0% 100.0% PHYSICS
Total 2 0 0 6 4 1 3 6 4 1
In Fall of 2003, the Office of Retention and Academic Support conducted a survey entitled “Tell Us Where You Are” to determine the reasons why the non-returning students left Alabama A&M

Blueprints to Excellence: Enhancing the Academic Support Services and Campus Culture Alabama A&M University’s Quality Enhancement Plan
It takes a whole university to graduate a student! xxvii
University. The reasons stated were financial (50.0%), personal (13.6%), transferred out (9.1%) and other (18.2%). Of the respondents, 97.4% were freshmen, 54.6% indicated that they intended to return to AAMU, and they were evenly divided between out of state and in state. The least percentage of students (7.3%) came from the School of Agriculture and the highest from Education (21.3%) with the other schools represented equally (Arts and Sciences 17.3%, Business 17.3%, Engineering 18.7%). This distribution of non-returning students with respect to discipline area is consistent with the distribution of students among the five schools for student majors during the period of 1998 to 2002.
Enrollment by Schools - Fall 1998-2002
School of 1998 1999 2000 2001 2002Agricultural & Environmental Sciencs
630 621 655 709 685
Arts and Sciences 791 1011 1147 1225 1251
Business 857 851 794 1036 983
Education 1558 1560 1639 1706 1773
Engineering & Technology 731 928 993 1075 1103
Others (Unassigned majors) 465 511 324 124 197
Total* 5032 5482 5552 5875 5992
Percent Enrollment by Schools - Fall 1998-2002
School of 1998 1999 2000 2001 2002
Agricultural & Environmental Sciences
12.5% 11.3% 11.8% 12.1% 11.4%
Arts and Sciences 15.7% 18.4% 20.7% 20.9% 20.9%
Business 17.0% 15.5% 14.3% 17.6% 16.4%
Education 31.0% 28.5% 29.5% 29.0% 29.6%
Engineering & Technology 14.5% 16.9% 17.9% 18.3% 18.4%
Others (Unassigned majors) 9.2% 9.3% 5.8% 2.1% 3.3%
Total 100.0% 100.0% 100.0% 100.0% 100.0%
* These totals are end-of-term values and may be different from IPEDS enrollment numbers presented elsewhere.
Blueprints to Excellence: Enhancing the Academic Support Services and Campus Culture Alabama A&M University’s Quality Enhancement Plan
It takes a whole university to graduate a student! xxviii
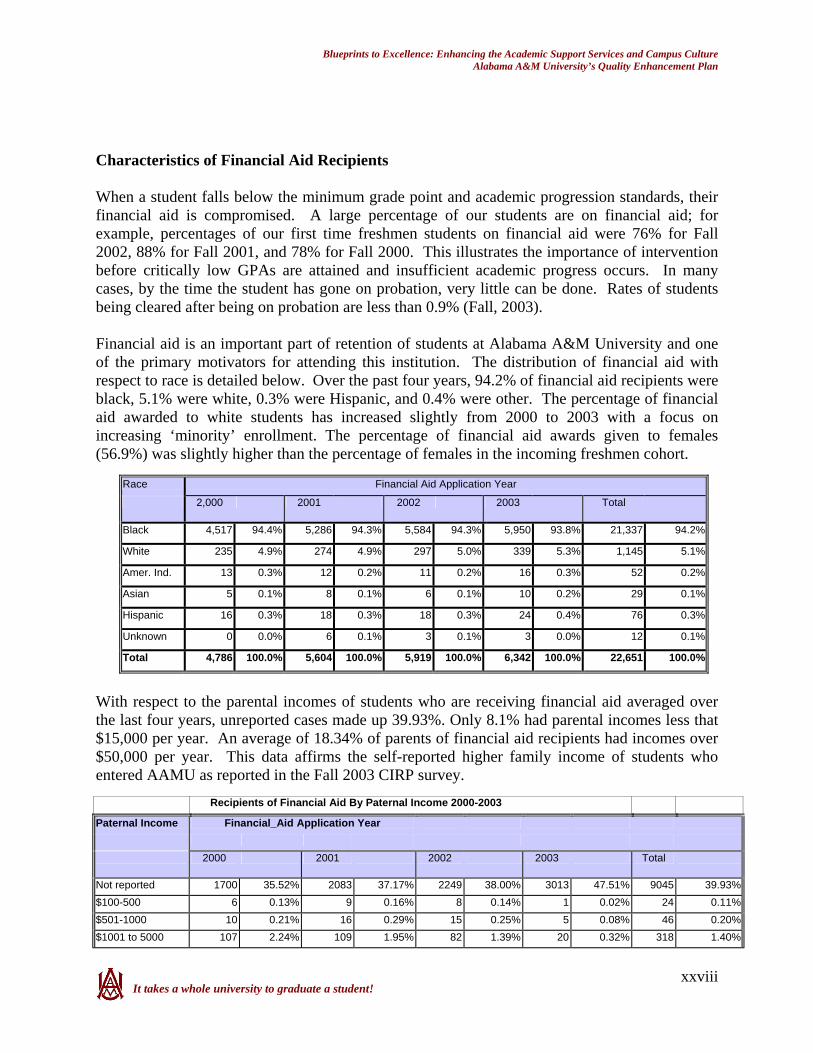
Characteristics of Financial Aid Recipients When a student falls below the minimum grade point and academic progression standards, their financial aid is compromised. A large percentage of our students are on financial aid; for example, percentages of our first time freshmen students on financial aid were 76% for Fall 2002, 88% for Fall 2001, and 78% for Fall 2000. This illustrates the importance of intervention before critically low GPAs are attained and insufficient academic progress occurs. In many cases, by the time the student has gone on probation, very little can be done. Rates of students being cleared after being on probation are less than 0.9% (Fall, 2003). Financial aid is an important part of retention of students at Alabama A&M University and one of the primary motivators for attending this institution. The distribution of financial aid with respect to race is detailed below. Over the past four years, 94.2% of financial aid recipients were black, 5.1% were white, 0.3% were Hispanic, and 0.4% were other. The percentage of financial aid awarded to white students has increased slightly from 2000 to 2003 with a focus on increasing ‘minority’ enrollment. The percentage of financial aid awards given to females (56.9%) was slightly higher than the percentage of females in the incoming freshmen cohort.
Race Financial Aid Application Year
2,000 2001 2002 2003 Total
Black 4,517 94.4% 5,286 94.3% 5,584 94.3% 5,950 93.8% 21,337 94.2%
White 235 4.9% 274 4.9% 297 5.0% 339 5.3% 1,145 5.1%
Amer. Ind. 13 0.3% 12 0.2% 11 0.2% 16 0.3% 52 0.2%
Asian 5 0.1% 8 0.1% 6 0.1% 10 0.2% 29 0.1%
Hispanic 16 0.3% 18 0.3% 18 0.3% 24 0.4% 76 0.3%
Unknown 0 0.0% 6 0.1% 3 0.1% 3 0.0% 12 0.1%
Total 4,786 100.0% 5,604 100.0% 5,919 100.0% 6,342 100.0% 22,651 100.0%
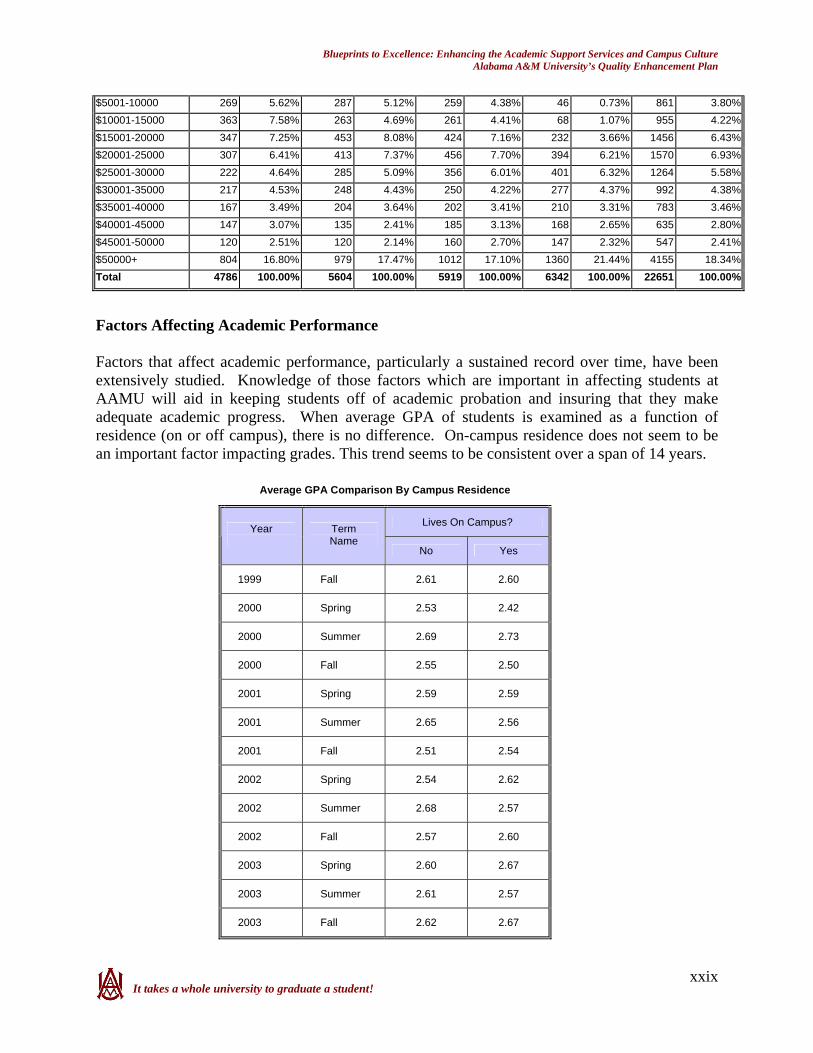
With respect to the parental incomes of students who are receiving financial aid averaged over the last four years, unreported cases made up 39.93%. Only 8.1% had parental incomes less that $15,000 per year. An average of 18.34% of parents of financial aid recipients had incomes over $50,000 per year. This data affirms the self-reported higher family income of students who entered AAMU as reported in the Fall 2003 CIRP survey.
Recipients of Financial Aid By Paternal Income 2000-2003
Paternal Income Financial_Aid Application Year 2000 2001 2002 2003 Total
Not reported 1700 35.52% 2083 37.17% 2249 38.00% 3013 47.51% 9045 39.93%$100-500 6 0.13% 9 0.16% 8 0.14% 1 0.02% 24 0.11%$501-1000 10 0.21% 16 0.29% 15 0.25% 5 0.08% 46 0.20%$1001 to 5000 107 2.24% 109 1.95% 82 1.39% 20 0.32% 318 1.40%
Blueprints to Excellence: Enhancing the Academic Support Services and Campus Culture Alabama A&M University’s Quality Enhancement Plan
It takes a whole university to graduate a student! xxix
$5001-10000 269 5.62% 287 5.12% 259 4.38% 46 0.73% 861 3.80%$10001-15000 363 7.58% 263 4.69% 261 4.41% 68 1.07% 955 4.22%$15001-20000 347 7.25% 453 8.08% 424 7.16% 232 3.66% 1456 6.43%$20001-25000 307 6.41% 413 7.37% 456 7.70% 394 6.21% 1570 6.93%$25001-30000 222 4.64% 285 5.09% 356 6.01% 401 6.32% 1264 5.58%$30001-35000 217 4.53% 248 4.43% 250 4.22% 277 4.37% 992 4.38%$35001-40000 167 3.49% 204 3.64% 202 3.41% 210 3.31% 783 3.46%$40001-45000 147 3.07% 135 2.41% 185 3.13% 168 2.65% 635 2.80%$45001-50000 120 2.51% 120 2.14% 160 2.70% 147 2.32% 547 2.41%$50000+ 804 16.80% 979 17.47% 1012 17.10% 1360 21.44% 4155 18.34%Total 4786 100.00% 5604 100.00% 5919 100.00% 6342 100.00% 22651 100.00%
Factors Affecting Academic Performance Factors that affect academic performance, particularly a sustained record over time, have been extensively studied. Knowledge of those factors which are important in affecting students at AAMU will aid in keeping students off of academic probation and insuring that they make adequate academic progress. When average GPA of students is examined as a function of residence (on or off campus), there is no difference. On-campus residence does not seem to be an important factor impacting grades. This trend seems to be consistent over a span of 14 years.
Average GPA Comparison By Campus Residence
Lives On Campus? Year
Term Name
No Yes
1999 Fall 2.61 2.60
2000 Spring 2.53 2.42
2000 Summer 2.69 2.73
2000 Fall 2.55 2.50
2001 Spring 2.59 2.59
2001 Summer 2.65 2.56
2001 Fall 2.51 2.54
2002 Spring 2.54 2.62
2002 Summer 2.68 2.57
2002 Fall 2.57 2.60
2003 Spring 2.60 2.67
2003 Summer 2.61 2.57
2003 Fall 2.62 2.67

Blueprints to Excellence: Enhancing the Academic Support Services and Campus Culture Alabama A&M University’s Quality Enhancement Plan
It takes a whole university to graduate a student! xxx
Another way to approach student success is by examining the average course grades earned in the general education core. Those courses which reflect primary competencies that had average grades of 2.3 and below were those in the general education core with prefixes of CHE (chemistry), ECO (economics), ENG (English), GEO (geography), HIS (history), MTH (mathematics), PHL (philosophy), and PSY (psychology). These courses have commonalities with respect to the greater need for reading and reading comprehension, use of mathematics and understanding of mathematical principles, or the need to communicate effectively in writing. Students who are having difficulties with these courses may need additional tutoring or even remediation work.
Course Prefix
Percent of Grade Distribution Average Grade
A B C D F Primary competencies
BIO 34.45 28.11 23.21 7.95 6.28 (2.8) CHE 23.04 25.33 25.73 14.37 11.54 (2.3) ECO 15.99 23.79 34.76 12.90 12.55 (2.2) EDU 18.46 48.05 18.51 2.21 12.76 (2.6) ENG 21.38 28.15 27.51 9.68 13.29 (2.3) GEO 21.39 20.32 31.02 17.65 9.63 (2.3) HIS 15.79 21.07 27.43 15.24 20.47 (2.0) MTH 20.74 20.17 26.21 14.29 18.59 (2.1) PHL 12.99 26.02 32.46 15.04 13.48 (2.1) PSY 17.11 27.37 30.25 13.91 11.36 (2.2) SOC 25.41 28.35 27.43 9.74 9.07 (2.5)
Secondary competencies AGB 48.57 24.80 12.50 3.48 10.66 (3.0) ART 29.57 24.31 18.93 10.63 16.56 (2.4) CMP 28.68 26.44 21.61 8.70 14.57 (2.5) FRE 54.46 22.96 9.93 6.38 6.27 (3.1) GER 11.11 22.22 18.52 37.04 11.11 (1.9) HED 28.31 32.55 25.38 5.06 8.71 (2.7) MGT 25.85 26.26 22.20 8.75 16.94 (2.4) MUS 51.74 23.06 12.20 4.23 8.77 (3.0) NHM 34.63 35.92 22.33 1.94 5.18 (2.9) ORI 65.69 19.39 7.23 2.18 5.51 (3.4) PED 53.48 26.53 10.57 2.15 7.28 (3.2) PHY 19.18 30.22 33.57 10.01 7.01 (2.4) SOC 25.41 28.35 27.43 9.74 9.07 (2.5) SPA 30.36 24.20 23.01 11.54 10.90 (2.5) SWK 66.67 30.48 1.90 0.00 0.95 (3.6) Total 27.94 25.86 24.11 9.70 12.38 (2.5)
It had been the policy to administer the Freshmen Core Test Battery to freshmen as a part of the services provided by Testing within University College. Since the 1998-1999 academic year, there has been a decline in both the total numbers of students and the percentage of freshmen taking the test. Clearly, administration of this test is not serving any effective purpose at this time.

Blueprints to Excellence: Enhancing the Academic Support Services and Campus Culture Alabama A&M University’s Quality Enhancement Plan
It takes a whole university to graduate a student! xxxi
Number and Percentage of Freshmen Taking the Freshman Core Test Battery 1998-99 1999-00 2000-01 2001-02 2002-03 Number 495 324 320 91 57 Freshmen percentage 27% 12% 8% 13% 0%
Assessing student competencies upon entry into University College is important for proper placement. Just as important is testing and evaluation to assess the proficiency levels of students who have completed the general education core before they leave University College to determine if the general education curriculum is achieving its learning outcomes. Much has been said about the size of classes impacting student performance and grades in those classes. When “101” courses are examined irrespective of discipline area, increasing the class size from 3 to 30 tends to decrease the average grade. Another general trend in decreasing GPA occurs as class sizes increase beyond 60. Although these are trends occurring within specific ranges and tend to be confounded to some extent by discipline area, a generalization may be made that the larger the class, the lower the average grade. For more effective learning, it is important to keep class sizes small. Although the study below reflects only “101” courses, this same generalization could probably be made for the remedial “100” level courses as well.
Average Grades for 101 Courses
y = -4E-09x5 + 1E-06x4 - 0.0002x3 + 0.0101x2 - 0.2254x + 4.1061R2 = 0.3799
0
0.5
1
1.5
2
2.5
3
3.5
4
0 20 40 60 80 100 120 140
Class Size
Ave
rage
Gra
de
The trend in average grade attained in “100” level developmental courses has remained relatively constant since 1997 with grades ranging from a low of 2.4 to a high of 2.6. There have been no dramatic changes in the academic performance of those students enrolled in the developmental courses as a whole.
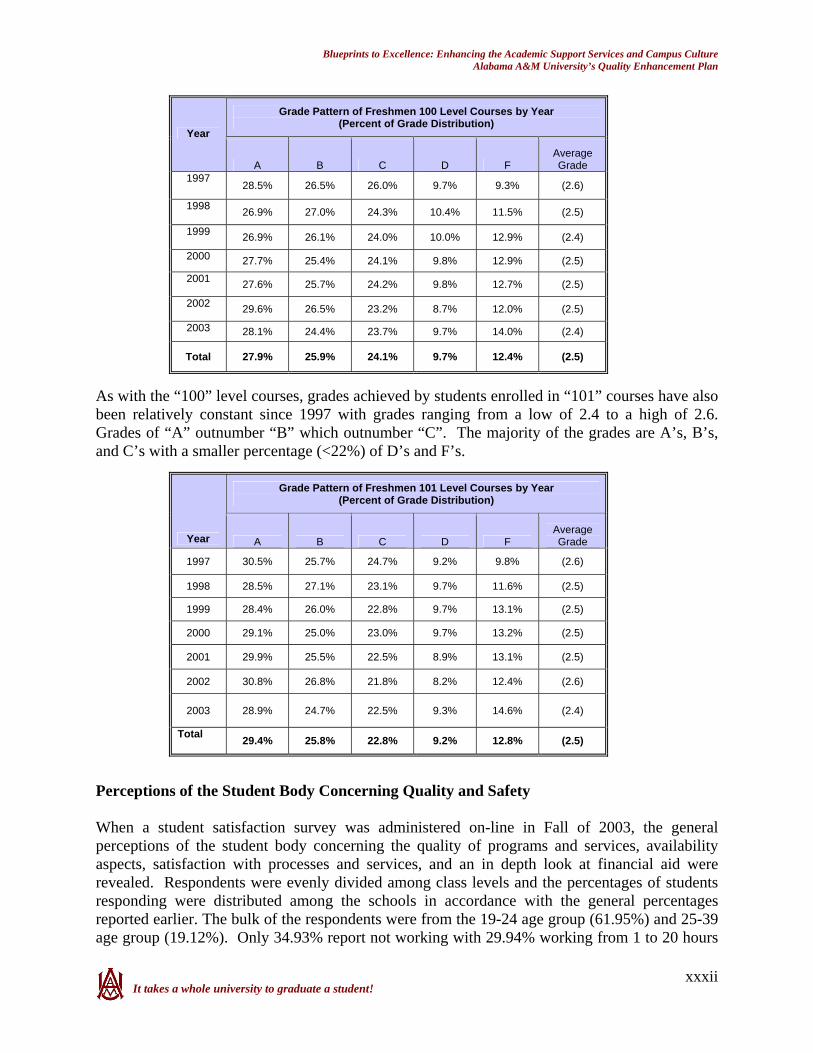
Blueprints to Excellence: Enhancing the Academic Support Services and Campus Culture Alabama A&M University’s Quality Enhancement Plan
It takes a whole university to graduate a student! xxxii
Grade Pattern of Freshmen 100 Level Courses by Year (Percent of Grade Distribution)
Year
A B C D F Average Grade
1997 28.5% 26.5% 26.0% 9.7% 9.3% (2.6)
1998 26.9% 27.0% 24.3% 10.4% 11.5% (2.5)
1999 26.9% 26.1% 24.0% 10.0% 12.9% (2.4)
2000 27.7% 25.4% 24.1% 9.8% 12.9% (2.5)
2001 27.6% 25.7% 24.2% 9.8% 12.7% (2.5)
2002 29.6% 26.5% 23.2% 8.7% 12.0% (2.5)
2003 28.1% 24.4% 23.7% 9.7% 14.0% (2.4)
Total 27.9% 25.9% 24.1% 9.7% 12.4% (2.5)
As with the “100” level courses, grades achieved by students enrolled in “101” courses have also been relatively constant since 1997 with grades ranging from a low of 2.4 to a high of 2.6. Grades of “A” outnumber “B” which outnumber “C”. The majority of the grades are A’s, B’s, and C’s with a smaller percentage (<22%) of D’s and F’s.
Grade Pattern of Freshmen 101 Level Courses by Year (Percent of Grade Distribution)
Year A B C D F Average Grade
1997 30.5% 25.7% 24.7% 9.2% 9.8% (2.6)
1998 28.5% 27.1% 23.1% 9.7% 11.6% (2.5)
1999 28.4% 26.0% 22.8% 9.7% 13.1% (2.5)
2000 29.1% 25.0% 23.0% 9.7% 13.2% (2.5)
2001 29.9% 25.5% 22.5% 8.9% 13.1% (2.5)
2002 30.8% 26.8% 21.8% 8.2% 12.4% (2.6)
2003 28.9% 24.7% 22.5% 9.3% 14.6% (2.4)
Total 29.4% 25.8% 22.8% 9.2% 12.8% (2.5)
Perceptions of the Student Body Concerning Quality and Safety When a student satisfaction survey was administered on-line in Fall of 2003, the general perceptions of the student body concerning the quality of programs and services, availability aspects, satisfaction with processes and services, and an in depth look at financial aid were revealed. Respondents were evenly divided among class levels and the percentages of students responding were distributed among the schools in accordance with the general percentages reported earlier. The bulk of the respondents were from the 19-24 age group (61.95%) and 25-39 age group (19.12%). Only 34.93% report not working with 29.94% working from 1 to 20 hours

Blueprints to Excellence: Enhancing the Academic Support Services and Campus Culture Alabama A&M University’s Quality Enhancement Plan
It takes a whole university to graduate a student! xxxiii
per week and the remaining third evenly divided between working 21-29 hours per week and 40 hours or more. This survey revealed that working may pose competition for the time needed to study and complete assignments for effective learning. In general, students reported excellent to good quality for courses (70.3%), instructors (60.9%), and advising (51.0%) in their degree programs. Lower percentages of quality were reported for services such as career development (40.7%), on-campus housing (20.4%), and tutoring services (44.1%). Library Services received a 54.6% approval rating for quality. On the issue of availability students responded with scores of excellent and good for courses in their degree program (50.2%), instructors in their degree program (57.4%), advising (53.0%), honors courses (21.0%), and places to study (43%). Services, processes, and factors which received the highest amount of dissatisfaction relative to satisfaction were parking on campus, weekend activities, timeliness of financial aid processing, the purpose of the activity fee, residence halls rules and regulations, and living conditions on campus. Those factors receiving the greatest ratio of satisfaction to dissatisfaction were class size, information about AAMU on the web, instructor’s concern for the student, the telephone registration system, availability of instructors, probation and suspension policies, application and admission procedures, hours campus offices are open, and student government. Students were evenly divided on friendliness of campus staff and general class registration procedures. Other aspects of campus life can affect the well-being and learning of students, such as perceptions of safety on campus. In the Fall 2003 Student Satisfaction Survey, 41.9% indicated that they were dissatisfied or very dissatisfied with ‘the feeling of safety on campus’. In 2003, two categories of criminal incident have increased. From 1995 to 2002, the number of aggravated assaults ranged from 1 to 8; in 2003, this number increased to 17. From 1995 to 2000, the number of burglaries was relatively stable, ranging from 24 to 51, but in 2001 it increased to 100 and has been at 129 in 2002 and 2003. This increased number of crimes in these two categories may be contributing to a feeling or perception about safety on campus although other categories potentially more serious (murders, manslaughter, weapons possession, and sexual offenses) have remained at very low rates. This illustrates the need to focus on campus safety, perceptions of safety, and the visibility and responsiveness of campus security.
Criminal Incidents by Year
Criminal Incidents 1995 1996 1997 1998 1999 2000 2001 2002 2003
Murder 0 0 0 0 1 0 0 0 0
Sexual Offenses(Forcible) 0 1 0 0 1 2 4 0 1
Robbery 3 3 4 - - 1 5 2 2
Aggravated Assault 8 4 4 7 6 5 4 1 17
Burglary 32 20 24 33 51 35 100 129 129
Motor Vehicle Theft 3 3 2 3 1 0 4 3 2
Arson - - - - - 1 2 1 1
Negligent Manslaughter 0 0 0 0 0 0 0 0 0
Illegal Weapons Possession 1 2 1 1 2 2 7 3 -
Source: AAMU Police Department Crime Statistics

Blueprints to Excellence: Enhancing the Academic Support Services and Campus Culture Alabama A&M University’s Quality Enhancement Plan
It takes a whole university to graduate a student! xxxiv
Characteristics of the Faculty The campus culture is determined in part by the faculty who set the tenor and tone for scholarship and pursuit of academic excellence. Fully 73% of our faculty holds the doctoral degree, and 33.6% hold master’s degrees, of which many are terminal degrees for their discipline, such as the Master’s degree in Fine Arts. Although many faculty are predominately teaching faculty, those in disciplines which offer master’s and doctoral degrees generally have appointments split between teaching and research, which affords our students exposure to cutting edge technologies and sciences as well as opportunities for integrating research into the classroom. Our faculty is 50% Black, 28.8% White, and 13% Asian, with American Indian, Hispanic, and Non-resident Alien making up the remainder. Clearly, our faculty represents not only diversity in disciplines, but are a rich source of cultural, ethnic, and religious diversity. Establishing an environment which encourages interaction between faculty and the students and providing an appropriate setting outside of the classroom for that informal interaction will be vitally important to changing the culture on campus.
Full-Time Faculty By Degree, Race and Gender
Headcounts
Bla
ck,
Non
-H
ispa
nic
Whi
te,
Non
-H
ispa
nic
Am
eric
an
Indi
an/
Ala
skan
N
ativ
e
Asi
an,
Pac.
Is
land
er
His
pani
c
Non
-re
side
nt
Alie
n
Tot
al
Degree Level
F M F M F M F M F M F M F M
Doctorate 17 63 14 40 9 25 16 40 144
Masters 34 28 14 13 3 1 1 4 49 49
Others 3 2 2 1 1 1 5 5Total For Gender 54 93 30 54 0 1 9 29 0 1 1 20 94 198
Total For Race 147 84 1 38 1 21 292
Percentages (All numbers are in %)
Doctorate 31.5 67.7 46.7 74.1 100.0 86.2 80.0 42.6 72.7
Masters 63.0 30.1 46.7 24.1 10.3 100.0 100.0 20.0 52.1 24.7
Others 5.6 2.2 6.7 1.9 100.0 3.4 5.3 2.5
Gender as % of Race 36.7 63.3 35.7 64.3 0.0 100.0 23.7 76.3 0.0 100.0 4.8 95.2 32.2 67.8
Race as % of Total 50.3 28.8 0.3 13.0 0.3 7.2 100.0

Blueprints to Excellence: Enhancing the Academic Support Services and Campus Culture Alabama A&M University’s Quality Enhancement Plan
It takes a whole university to graduate a student! xxxv
Male faculty (67.81%) still outnumber female faculty (32.19%) on campus, consistent with national trends. The ratio is even more in favor of male gender at the rank of Associate Professor. At the rank of Full Professor, the percentages closely resemble the total, but at the rank of Instructor, the percentage of females (56.82%) is larger than of males (43.18%).
Headcounts Percentages Rank
Female Male Total Female Male
Professor 15 33 48 31.25% 68.75%
Associate Professor 13 57 70 18.57% 81.43%
Assistant Professor 38 89 127 29.92% 70.08%
Instructor 25 19 44 56.82% 43.18%
Others 3 3 100.00%
Total 94 198 292 32.19% 67.81%
Summary Students entering Alabama A&M University are predominately black and come from homes which lie over 100 miles away from campus. Over 85% of these students will live on campus, but in some ways, students entering Alabama A&M University are different from those who are entering other HBCUs. These differences will affect their expectations and perceptions of campus life and ultimately whether they are retained and successfully graduated. Their parents are more affluent and better educated than those of students entering other HBCUs which may increase their expectations for quality of living. Relative to incoming freshmen at other HBCUs, AAMU’s incoming students are less exposed to diversity of racial and ethnic backgrounds and may be socially or politically immature. Alabama A&M University can overcome this apparent deficiency by enriching the campus environment and culture to celebrate diversity, explore culture and the arts, and expose students to higher values of scholarship. These freshmen also come with some habits which could pose problems for academic success such as studying less time for class, spending large amounts of time watching television, and missing class or coming late to class. In other ways, our incoming freshmen Fall 2003 class is better prepared for the academic challenges that they face since this class contained a large number of valedictorians, salutatorians, and honor students. This class also has higher ACT scores and GPAs than previous years’ classes. Changing the campus culture to one which expects strong academic achievement, successful education of the whole student, and pursuit of scholarly activity then becomes a keystone to integration of the goals of the QEP. Changing policy with respect to minimum academic performance will also help to set the tone. Establishment of a “warning” status (GPA<2.5) in addition to the usual “probation” grouping (GPA <2.0) would help to identify students who may need to refine study skills, to avail themselves of tutors, or to develop better time management skills and could prevent students from being placed on the more severe probation list, and retain more of them with the goal of improving retention. Raising the

Blueprints to Excellence: Enhancing the Academic Support Services and Campus Culture Alabama A&M University’s Quality Enhancement Plan
It takes a whole university to graduate a student! xxxvi
minimum grade required to pass successfully to the next level of mathematics or English to a “C” in both cases would also change the culture on campus to a more academic one. The first two years are crucial to retaining and ultimately graduating these students successfully. Proper placement of the students into classes, active mentoring and advisement, and early intervention with high risk students is essential. The success of intrusive academic services in reducing the number of students on probation is clear evidence of the potential of this approach in a reactive mode. This same approach could be equally if not more effective if extended to a proactive mode where at risk students are identified before they are placed on probation and educated in living and learning skills so essential for a successful college career. University College, as the entry point for all freshmen, has a vital role in insuring a smooth transition into college academic life and for determining proper placement of students into the appropriate levels of mathematics and English courses. Not only this, it also serves as an in loco parentis for students who are quite a distance away from home and whose social support system has been shifted to AAMU. As such, its services should be expanded to include identification of high risk students, proactive life and learning skills enhancement, identification of learning styles, pairing with mentors/advisors in their major, and assessment to determine effectiveness of approaches. Once a major is chosen, early sustained contact with the discipline advisor will build a strong sense of connection.

Blueprints to Excellence: Enhancing the Academic Support Services and Campus Culture Alabama A&M University’s Quality Enhancement Plan
It takes a whole university to graduate a student! xxxvii
V. QUALITY ENHANCEMENT PLAN AND IMPLEMENTATION STRATEGIES
A. QEP GOALS AND OBJECTIVES
As outlined in Section III: Structuring the QEP, the summary of the analyses for the strategic plan update, faculty/staff conference focus group summaries, the QEP focus group summaries, town hall meetings and the institutional data analysis led to the identification of the proposed QEP Outcomes that were accepted by the SACS Leadership Team and the QEP Leadership Team and Committee. The QEP outcomes as listed below, provided the foundation for the development of two main goals as the focus of our proposed Quality Enhancement Plan. Each goal has several objectives which address specific QEP outcomes that were revealed in the institutional analyses presented earlier. QEP Outcomes
Improve the GPA of freshman students by 10% for the core curriculum and general education in five years.
Structure and implement an assessment and placement system. Assure 100% placement of all students in the core curriculum and general
education courses based on the approved assessment measurements. Reduce the number of students on probation down to 2%. Increase retention by 10% over five years. Increase graduation in four years by 10%, five year by 10% and six years by 10%
in five years. Implement a degree auditing system that tracks students’ academic progress from
entry to exit (early alert, comprehensive academic advising, etc.). Increase by 30% the number of mentoring relationships between faculty and
students and student to student. Establish informal study groups. Improve faculty instructional performance. Implement a comprehensive advising and counseling system. Increase the level of scholarly productivity of faculty and students. Establish a student leadership institute. Form mini-centers addressing academic coaching, tutoring, e-tutoring, etc. Improve student, faculty, staff and the general community’s satisfaction with
services provided by the University. Increase the participation of faculty, staff and students in various social, civic,
educational, and cultural activities on and off campus. Provide for students to acquire fundamental life skills necessary for survival in the
world of work. Assure the integration of the University’s core values into its programs and
services. Develop and implement a multivariate prediction model that will help to identify
incoming students at greatest risk for non-retention and those factors most related to persistence at AAMU. The model will use socioeconomic and high school performance data from student database records for the last ten years. Identification of factors that lead to persistence.
Blueprints to Excellence: Enhancing the Academic Support Services and Campus Culture Alabama A&M University’s Quality Enhancement Plan
It takes a whole university to graduate a student! xxxviii
To create “a positive mystique of The Hill.” Close scrutiny of the consistency in which we handle incoming freshmen, the retention and graduation rates, and the paucity of data in some arenas of chronicling the freshman experience have indicated that this whole plethora of events and processes should be a major focus of the QEP. Therefore, the first primary goal of the QEP is to improve mechanisms for placing, characterizing, and educating the whole student with a focus toward the successful development of competent graduates prepared to attain excellence in professional life. University College is the entity whose mission centers on incoming students, the freshmen core of courses, and the general education core. Because of this a close examination of the functions of University College, its effectiveness, and the degree to which it coordinates with other vital entities in the process must be an objective under this goal. University College does not stand alone as the sole participant in the process of integrating the new incoming student into mainstream campus culture. Many student service units play a vital part such as Admissions, Financial Aid, Registrar’s Office, Financial Services, Student Affairs, and the academic program areas with the recognition that “it takes a whole University to graduate one student”. As such, each and every unit on campus has a role to play in each student’s successful degree attainment. Goal A: To improve mechanisms for placing, characterizing, and educating the whole student with a focus toward the successful development of competent graduates prepared to attain excellence in professional life.
• Objective 1 - Restructure University College with a view toward a) better integration of its multiple functions, b) amalgamation of all tutoring services under one leadership, c) revision of the survival skills courses, d) examination, assessment, development, and placement of incoming freshmen, e) comprehensive and integrated academic advising system, f) an early alert system and g) expansion of the intrusive retention service to a more proactive preventative stance than its current reactive approach to students on probation. In addition, under the revised structure, University College in concert with the academic program units and the assessment personnel of OIPRE will be responsible for developing a comprehensive plan for assessing general education competencies. A key component of achieving success will be to develop a comprehensive plan for student advising which begins in University College and transitions to the advisors in each program area. This advising plan and its process flow model will integrate the use of the “Academic Auditing System”. University College would also manage the tutoring center (to be located in the Scholartorium), which would strengthen academic performance in the classroom and provide a variety of assistance to students who are experiencing difficulty in performing in a specific subject or understanding a learning concept. Tutoring, which will be offered in a variety of forms to meet the schedule and problems of the student, may be scheduled at a regular time, by appointment, drop-in, or on-line. This center would also provide a venue for the existing tutorial network that already exists on campus. Regardless of the form selected, students would be matched with individual tutors.

Blueprints to Excellence: Enhancing the Academic Support Services and Campus Culture Alabama A&M University’s Quality Enhancement Plan
It takes a whole university to graduate a student! xxxix
Objective 2 – Integrate the University student databases to insure accuracy and consistency and for use in development of a model capable of identifying students who are most at risk of non-retention. This multivariate model will use academic variables obtained from admissions data supplemented by additional socioeconomic data obtained from financial aid. This will require upgrading to a common database system for both admissions and financial aid.
Objective 3 – Develop an “Academic Auditing System”. The registrar’s office plays a vital role
in the maintenance of student records and in registration, and completion processes. Recent advances in the procedures in the registrar’s office have enabled the implementation of web registration and computer generated transcripts. This implementation of technology can be used to enhance student learning by development of an “Academic Auditing System” which would function to track each student to insure that a) the student is appropriately advised or counseled before registering for classes, b) the student enrolls classes that are appropriate for his or her placement level, and c) the student takes prerequisite classes before taking more advanced classes. This will enhance the likelihood of student success.
Because the social, philosophical, and scholarly environment which surrounds the student has a critical impact on the way the University shapes the student’s mind, attitude, and drive, the second major goal of the QEP is to improve the campus culture to embrace diversity, enhance opportunities for creative and artistic expressions, foster scholarly attainment and leadership, and promote mature, society-conscious behaviors among all the parts of the university family. There are three pivotal points where application of change is likely to impact culture in the most efficient manner – incoming students, teaching faculty, and student services staff. Incoming students can be indoctrinated in the survival skills class, through more structured and expansive advising, and through more proactive mentoring/tutoring. Teaching faculty must be more informed about the better academic potential and characteristics of the incoming freshmen class so that their expectations (and hence student performance) will be greater. Opportunities for increased student-faculty contact in environments outside of the classroom must be fostered by providing a setting conducive to that exchange. There must be increased exposure to a variety of cultures, and to scholarly activities by providing a better network of information publicizing these events and by providing a place where both spontaneous expression of the arts can develop and where student and faculty artistic enterprises can be showcased. Attitude of students also is influenced by each interaction with faculty and staff, particularly those in student services. All faculty and staff must be inculcated with the principle that the student is family and that every contact has an impact. Goal B: Improve the campus culture to embrace diversity and the arts, foster scholarly attainment, and promote mature, socially-conscious behaviors among all the parts of the university family. Objective 1 - Establishment of a “Scholartorium” where students, faculty, and staff engage in scholarly activities in an informal setting. This structure is designed to enhance student performance, using the center approach. While some centers will provide settings and opportunities to engage in self-directed learning activities, others will be designed to facilitate student-faculty-staff interactions outside of classrooms and offices. The centers will provide a

Blueprints to Excellence: Enhancing the Academic Support Services and Campus Culture Alabama A&M University’s Quality Enhancement Plan
It takes a whole university to graduate a student! xl
variety of services, designed to empower students to achieve high levels of academic success. This comprehensive approach includes mini-centers that are guided by related objectives. These mini-centers include mentoring/coaching, professional development, course support, student leadership, foundations for success, technology, current affairs, and the “Bulldog Den” which is described in more detail in Objective 2. Further description of some of the mini-centers follows:
• The mentoring/coaching center would help develop enthusiastic, self-directed learners and guide students in mastering the requisite fundamentals needed for academic, personal, and professional success. It would offer individualized support for students who desire this type of involvement. Through informal conversations with faculty, staff, and peers, students will develop confidence in their ability to achieve. While the mentor may be a peer or faculty member, academic coaching is conducted by a professional who provides assessment, suggestions, and guidance. The academic coach will focus on the difficulty of course material, adapting to teaching styles of professors, assessing students’ strengths and weaknesses, plans for improvement of listening and note taking skills, test preparation and taking skills, and time management strategies. Although the mentoring/coaching center is designed to facilitate and enhance performance related to learning strategies, plans for the future may be addressed as well, including career direction, applications for graduate or advanced study, scholarships, etc.
• The professional development center will promote professional development in faculty, staff, and students, serve as a forum for enhancing both teaching and learning effectiveness, and promote scholarly activity in students, staff, and faculty. The center will promote involvement in professional meetings, conduct workshops and other scholarly endeavors, and help to build competencies in teaching effectiveness and adapting to different learning styles. The professional development center will be a hub for activities undertaken by the “eminent teachers” that make up the Teaching Center of Excellence.
• The course support center will make use of small study groups to aid in acquiring learning outcomes for difficult-to-master courses. Study groups will be facilitated by advanced students having proficiency in the identified courses.
• The student leadership center will provide a place for students to acquire skills which enhance leadership; learn about characteristics of good leaders; discover more about self, group, and community roles; and put into practice what they have learned to improve the campus and community environment.
• Others center concepts that may be explored for addition as the QEP is refined will be foundations for success, technology, undergraduate research, and current affairs.
Scholartorium is an originally coined term that combines two familiar English words – scholar (defined as a erudite person, a specialist in humanities, a student who is apt at learning, and one who has scholarship) and auditorium (a room or building to accommodate a large audience, public meetings, competitions, or artistic performances. Hence, the Scholartorium would be a physical as well as a virtual site/facility where students, faculty, and staff can engage in social and scholarly activities in an informal setting that embraces an optimal mix of learning, comfort, and leisure. The facility that houses the Scholartorium could include game rooms, video arcade equipment, production/theatre stage with retractable movie screen to seat 100-150 persons, and a

Blueprints to Excellence: Enhancing the Academic Support Services and Campus Culture Alabama A&M University’s Quality Enhancement Plan
It takes a whole university to graduate a student! xli
television lounge. Also housed within the structure would be office space, meeting/conference rooms, reading/study rooms, and various mini-center offices. Objective 2 - Design and create a “Bulldog Den” as center for dialog, communication, sharing, good fellowship, and scholarly exchange within the Scholartorium. This facility will be conducive to the informal interchange among faculty, staff, and students and will encompass an eatery/coffee shop. A central location on campus would facilitate its use by a maximum number of people. It incorporates an area which can be used for the expression of the arts, literary efforts, and personal expression and will have exhibit space integrally weaved into the setting and environment so that the achievements and artistic creations of faculty and staff may be highlighted. This is the place where a visitor can go to sample the best that “Bulldog Spirit” can offer and absorb the essence of what makes Alabama A&M University extraordinary. Objective 3 – Establish an Eminent Teaching Roundtable to foster an environment where innovations in teaching are recognized and rewarded. Admission into the Roundtable will require presentation before a review panel or a comprehensive teaching portfolio, including examples of innovations, use of technology, samples of syllabi and teaching plans, course evaluations, student testimonials, and a video tape of instructor performance in the classroom. Each School will present up to two candidates to be considered for this prestigious nomination. The review panel consisting of students and faculty will select the final candidates for induction into the Teaching Center of Excellence, and the new inductees will be presented during the Fall Faculty/Staff Conference as exemplifying teaching excellence. In addition to the appointment, these “eminent teachers” will meet once a month to develop approaches for improving teaching practices overall on campus, develop workshops on their effective methodology, foster discussion of what constitutes excellence in teaching, and share methodologies. The University will reward the attainment of the eminent teachers with an increase in salary of two percent in their induction year, and the establishment of a $1,500 discretionary teaching budget for each successful inductee. Each “eminent teacher” can choose to use these funds for teaching materials and/or for attendance to one professional meeting devoted to teaching excellence, acquiring new technology skills, or nurturing leadership in the teaching profession. Objective 4 – Develop and construct of actual and virtual “events kiosk” as a means of enhancing communication on campus. Communication about events, changes, and achievements on campus is not systematic throughout the entire campus. The University needs a common forum for interchange of information in a virtual and real location on campus. The virtual approach can be enhanced with the aid of EITS by the development of a virtual kiosk for notices of events, notification of policy or procedural changes, highlighting of university achievements, and establishment of university faculty with student chat rooms which provide an informal setting for the exchange of ideas, beliefs, ideals, and values. Objective 5 – Enhancing perceived friendliness and helpfulness of student services, financial services, research and development, and academic affairs staff via customer service workshops. The face and demeanor which greets students as they access various financial, administrative, and student services greatly impacts how the student perceives his institution. A student who is a valued member of the institutional family is greeted with warmth and courtesy, service is offered

Blueprints to Excellence: Enhancing the Academic Support Services and Campus Culture Alabama A&M University’s Quality Enhancement Plan
It takes a whole university to graduate a student! xlii
willingly and promptly, and students are referred not arbitrarily but specifically to those offices on campus that can provide solutions to his or her problems. Objective 6 – Fostering a campus “ethos” which promotes student learning by creating a safe environment with respect to security and management of pedestrian and vehicular traffic and furthermore, fosters an ethical sense of campus ownership by students that does not tolerate violence, theft, and abuse of the facilities.
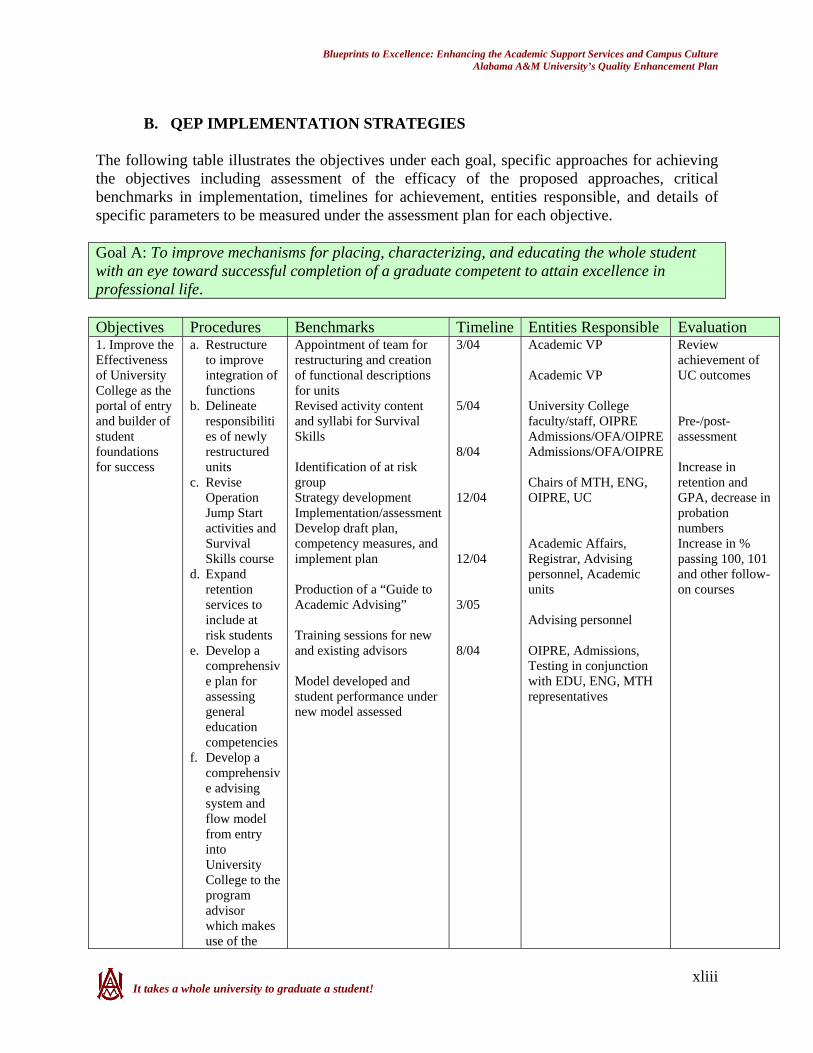
Blueprints to Excellence: Enhancing the Academic Support Services and Campus Culture Alabama A&M University’s Quality Enhancement Plan
It takes a whole university to graduate a student! xliii
B. QEP IMPLEMENTATION STRATEGIES
The following table illustrates the objectives under each goal, specific approaches for achieving the objectives including assessment of the efficacy of the proposed approaches, critical benchmarks in implementation, timelines for achievement, entities responsible, and details of specific parameters to be measured under the assessment plan for each objective. Goal A: To improve mechanisms for placing, characterizing, and educating the whole student with an eye toward successful completion of a graduate competent to attain excellence in professional life. Objectives Procedures Benchmarks Timeline Entities Responsible Evaluation 1. Improve the Effectiveness of University College as the portal of entry and builder of student foundations for success
a. Restructure to improve integration of functions
b. Delineate responsibilities of newly restructured units
c. Revise Operation Jump Start activities and Survival Skills course
d. Expand retention services to include at risk students
e. Develop a comprehensive plan for assessing general education competencies
f. Develop a comprehensive advising system and flow model from entry into University College to the program advisor which makes use of the
Appointment of team for restructuring and creation of functional descriptions for units Revised activity content and syllabi for Survival Skills Identification of at risk group Strategy development Implementation/assessment Develop draft plan, competency measures, and implement plan Production of a “Guide to Academic Advising” Training sessions for new and existing advisors Model developed and student performance under new model assessed
3/04 5/04 8/04 12/04 12/04 3/05 8/04
Academic VP Academic VP University College faculty/staff, OIPRE Admissions/OFA/OIPRE Admissions/OFA/OIPRE Chairs of MTH, ENG, OIPRE, UC Academic Affairs, Registrar, Advising personnel, Academic units Advising personnel OIPRE, Admissions, Testing in conjunction with EDU, ENG, MTH representatives
Review achievement of UC outcomes Pre-/post-assessment Increase in retention and GPA, decrease in probation numbers Increase in % passing 100, 101 and other follow-on courses

Blueprints to Excellence: Enhancing the Academic Support Services and Campus Culture Alabama A&M University’s Quality Enhancement Plan
It takes a whole university to graduate a student! xliv
Objectives Procedures Benchmarks Timeline Entities Responsible Evaluation features of the new “Academic Auditing System”
g. Develop a comprehensive assessment and placement model
2. Develop a model to identify students most at risk using past history of retention and completion at AAMU coupled with the academic and socioeconomic factors which characterize our incoming freshmen
a. Integrate all University student databases
b. Develop
model c. Validate
model d. Refer
identified ‘at risk’ cohort for proactive intervention strategies
e. Assess impact
Database integration First iteration model Validation and testing Identification of first ‘at risk’ cohort Data collection for assessment of impact Adjustment of model
1/05 8/05 8/05-5/06 6/06 7/06
OFA, Admissions, Computer Center, B&F, Student Affairs, Academic Affairs OIPRE with OFA and Admissions OIPRE OIPRE All of the above
Comparison of expected retention of selected cohort, GPAs, and academic progression with actual figures Determination of prediction efficiency of model and adjustment by integration of current year’s student data
3. Develop an “Academic Auditing System” for insuring that students are advised before registration, take classes appropriate to their placement, and take courses in the proper sequence to optimize student learning
a. Identify the elements of the proposed “Academic Auditing System”
b. Develop the software approach
c. Test and validate the software
d. Communicate and demonstrate system for uniform and total university
Descriptors of auditing system delineated Software beta version installed Initial tests conducted Adoption by the University
4/04 5/05 6/05 8/05
Registrar’s Office EITS and Computer Services Registrar’s Office Registrar and Academic Affairs VP
Percentage of compliance with advisor/counselor consultation, numbers of students slated for 100 courses who actually enroll in them in the first semester, number of instances of out-of sequence courses being taken

Blueprints to Excellence: Enhancing the Academic Support Services and Campus Culture Alabama A&M University’s Quality Enhancement Plan
It takes a whole university to graduate a student! xlv
Objectives Procedures Benchmarks Timeline Entities Responsible Evaluation adoption
Goal B: To improve the campus culture to embrace diversity and the arts, foster scholarly attainment, and promote mature, socially-conscious behaviors among all members of the university family. Objectives Approaches Benchmarks Timeline Entities
Responsible Assessment Tools
1. Implement a “Scholartorium” where students, faculty, and staff can engage in scholarly activities in an informal setting and where a variety of services can be offered to enhance student learning in a centers approach.
a. Develop a mentoring and academic coaching center to develop enthusiastic self-learners and guide students in acquiring the requisite fundamentals for success.
b. Establishment of a tutoring center to strengthen academic performance in the classroom
c. Create a center to promote professional development center to promote professional development, to enhance teaching and learning effectiveness, and to enhance scholarly activity among faculty, staff, and students
d. Design of a course support center to make use of small study groups particularly for the difficult-to-master courses
e. Initiate of a student
Location of the site Development of the facility design concept Approval by Board Construction of the site Implementation of at least three of the proposed mini-centers Follow-on implementation of the remaining mini-centers Formation of study groups and observation of activity Acquisition of leadership learning materials Use of materials Project level activities conducted by student leaders on the campus and in the community
5/04 8/04 9/04 1/05 9/05-5/06 9/06-5/07 5/07 9/05 10/05 1/06 and ongoing
VPs of Academic Affairs and Student Affairs University College Staff (tutorial and retention) Telecommunications Center, Career Development, Academic Affairs and faculty Students and involved faculty Student government leadership and interested faculty
Increase in the percentage of students and faculty reporting mentorship relationships in satisfaction surveys Number of students making use of tutorial services Increase in scholarly activity as evidenced by publications, proposal development, scholarly works, books, artistic pursuits, etc. reported in faculty activity reports Counts of participants Reports of student leadership sponsored or initiated events and activities

Blueprints to Excellence: Enhancing the Academic Support Services and Campus Culture Alabama A&M University’s Quality Enhancement Plan
It takes a whole university to graduate a student! xlvi
Objectives Approaches Benchmarks Timeline Entities Responsible
Assessment Tools
leadership center which would allow students to explore leadership skills, self-group-community concepts, and apply the leadership skills to campus and community needs
2. Design and construct a “Bulldog Den” within the Scholartorium to serve as a center of dialog, communication, sharing, good fellowship, and scholarly exchange.
a. Develop a sense of “Bulldog pride” in the unique heritage of AAMU by showcasing examples of its history and achievements
b. Foster a sense of community among students, faculty, and staff, promote an atmosphere of appreciating diversity, and create an environment where issues important to students, staff, and faculty may be explored by providing an informal centralized location for refreshment and relaxation
Design and construction as part of the Scholartorium Sponsorship of at least two events among the following: - AAMU history
showcase - Art and sculpture - Dramatic
performances - Intellectual debates - Diversity symposia - Explorations of
other cultures - University academic
bowls
1/05 9/05 and ongoing
Faculty, staff, and student input Selected architect and construction firm Management of “Bulldog Den”
3. Establish a “Eminent Teaching Roundtable” to celebrate, honor,
a. Establish guidelines for consideration for induction into the Eminent
‘Excellence in Teaching Blueprint’ published on the web Selection of members
3/04 5/04
VP of Academic Affairs Dean, School of Education
Blueprint document developed and published on the web

Blueprints to Excellence: Enhancing the Academic Support Services and Campus Culture Alabama A&M University’s Quality Enhancement Plan
It takes a whole university to graduate a student! xlvii
Objectives Approaches Benchmarks Timeline Entities Responsible
Assessment Tools
and reward excellence in teaching and to use the “eminent teachers” as a resource for development of strategies to enhance teaching on campus, elevate the scholarly activity in teaching, and enhance attitudes of expectations faculty have of our students
Teaching Roundtable
b. Appoint a review panel
c. Nominate candidate “eminent teachers” from each school
d. Screen and select by review panel
e. Formally induct into the Roundtable at the annual faculty/staff conference
f. Implement rewards for appointment as “eminent teachers” (2% raise, $1,500 discretionary teaching budget, professional travel)
g. Empower the members of the “Teaching Center of Excellent” to develop strategies for teaching enhancement and increasing faculty expectations of students
Two candidates selected from each School “Eminent Teachers” selected Induction ceremony held Raise implemented Budgets established Monthly meetings and strategy developments Implementation of selected strategies
12/04 5/05 8/05 10/05 10/05 and ongoing 5/06 and ongoing
Review Panel Deans of Schools Review panel with Academic VP approval Budget Office “Eminent Scholars” “Eminent Scholars” Oversight by Academic VP
Establishment of the founding members of the Teaching Center of Excellence Effective use of new resources (materials and trips) Minutes of meetings held Assessment of effectiveness of implemented strategies
4. Implement an actual and virtual events kiosk to enhance effective communication across campus and among constituent groups
a. Develop a virtual site for the electronic kiosk which can be accessed through the AAMU web site which features notices of events, notifications of policy or procedure
Site development on AAMU web page Publicizing the availability of the site
8/04 8/04
EITS with input from Student Government, Student Affairs Public Relations Telecommunications
Number of ‘hits’ on the virtual kiosk site Response to survey questions concerning enhanced campus communication, use of virtual

Blueprints to Excellence: Enhancing the Academic Support Services and Campus Culture Alabama A&M University’s Quality Enhancement Plan
It takes a whole university to graduate a student! xlviii
Objectives Approaches Benchmarks Timeline Entities Responsible
Assessment Tools
changes, sharing of achievements and other expressions of ‘Bulldog pride’, and implementation of faculty/staff/student chat rooms to foster exchange of ideas.
b. Gather design concepts developed by students in conjunction with faculty, identification of suitable centralized location, and construction of the “electronic events kiosk”
All campus participation in kiosk design Location selected Architect’s design refinement Construction of electronic events kiosk
12/04 5/05
VPs of Academic Affairs and Student Affairs Selected architect Selected construction firm
kiosk site, and volume of postings in the chat room Volume of materials posted Survey of perceived enhancement of communication
5. Conduct intensive customer service training for all university personnel to enhance perceptions of friendliness and service
a. Design of an intensive series approach to enhancing customer relations between AAMU students and university personnel
b. Identify a calendar for implementation including which units will be targeted as the primary participants
c. Implement training series, assess effectiveness, and modify approach and methodology if warranted
d. Assess unit by
Training series framework designed, location identified, and speakers/facilitators contacted Selection of unit participants and scheduling Training series initiated Survey administration to measure change in perceived friendliness
5/04 9/04 10/04 and ongoing 12/04 and 8/05
OIPRE, Psychology faculty, Retention, and consultants, Human Resources Academic Affairs, Student Affairs, Business & Finance, Research & Development Selected speakers/facilitators OIPRE
Survey of participants pre- and post-workshop to determine change in attitudes Student and faculty/staff satisfaction survey questions of perceived friendliness of various student services units Feedback via suggestions boxes placed in each unit Unit customer surveys OIPRE satisfaction
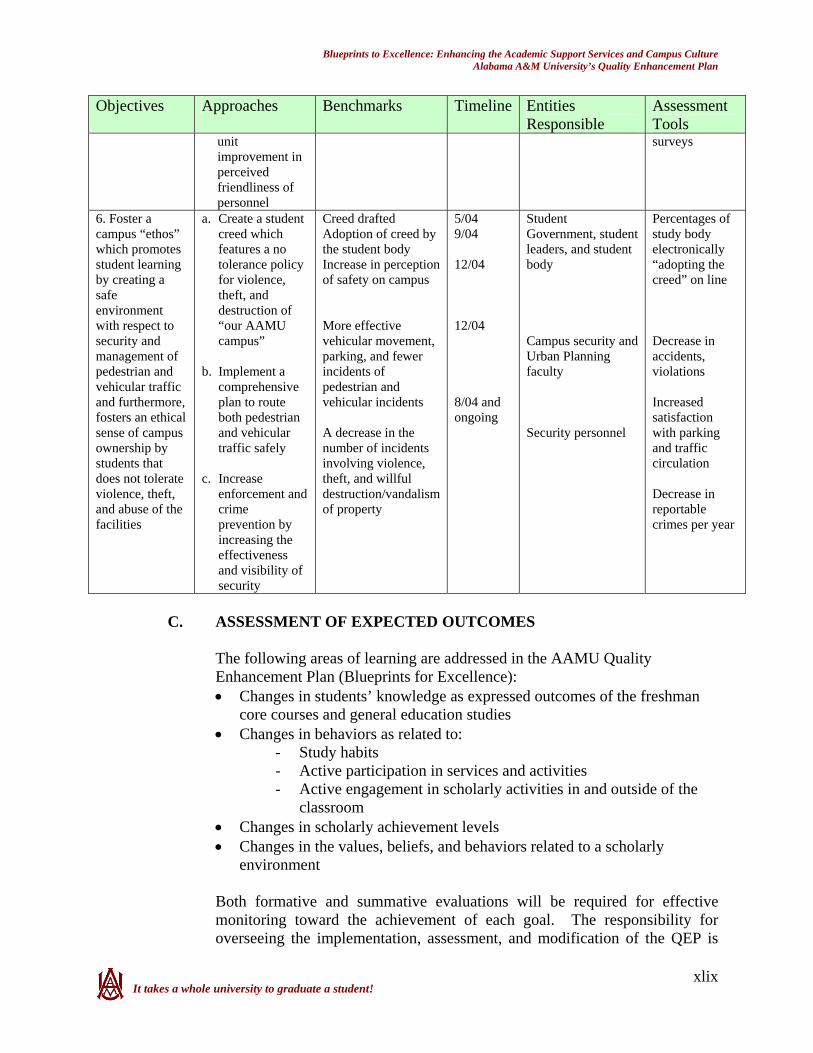
Blueprints to Excellence: Enhancing the Academic Support Services and Campus Culture Alabama A&M University’s Quality Enhancement Plan
It takes a whole university to graduate a student! xlix
Objectives Approaches Benchmarks Timeline Entities Responsible
Assessment Tools
unit improvement in perceived friendliness of personnel
surveys
6. Foster a campus “ethos” which promotes student learning by creating a safe environment with respect to security and management of pedestrian and vehicular traffic and furthermore, fosters an ethical sense of campus ownership by students that does not tolerate violence, theft, and abuse of the facilities
a. Create a student creed which features a no tolerance policy for violence, theft, and destruction of “our AAMU campus”
b. Implement a
comprehensive plan to route both pedestrian and vehicular traffic safely
c. Increase
enforcement and crime prevention by increasing the effectiveness and visibility of security
Creed drafted Adoption of creed by the student body Increase in perception of safety on campus More effective vehicular movement, parking, and fewer incidents of pedestrian and vehicular incidents A decrease in the number of incidents involving violence, theft, and willful destruction/vandalism of property
5/04 9/04 12/04 12/04 8/04 and ongoing
Student Government, student leaders, and student body Campus security and Urban Planning faculty Security personnel
Percentages of study body electronically “adopting the creed” on line Decrease in accidents, violations Increased satisfaction with parking and traffic circulation Decrease in reportable crimes per year
C. ASSESSMENT OF EXPECTED OUTCOMES
The following areas of learning are addressed in the AAMU Quality Enhancement Plan (Blueprints for Excellence): • Changes in students’ knowledge as expressed outcomes of the freshman
core courses and general education studies • Changes in behaviors as related to:
- Study habits - Active participation in services and activities - Active engagement in scholarly activities in and outside of the
classroom • Changes in scholarly achievement levels • Changes in the values, beliefs, and behaviors related to a scholarly
environment Both formative and summative evaluations will be required for effective monitoring toward the achievement of each goal. The responsibility for overseeing the implementation, assessment, and modification of the QEP is
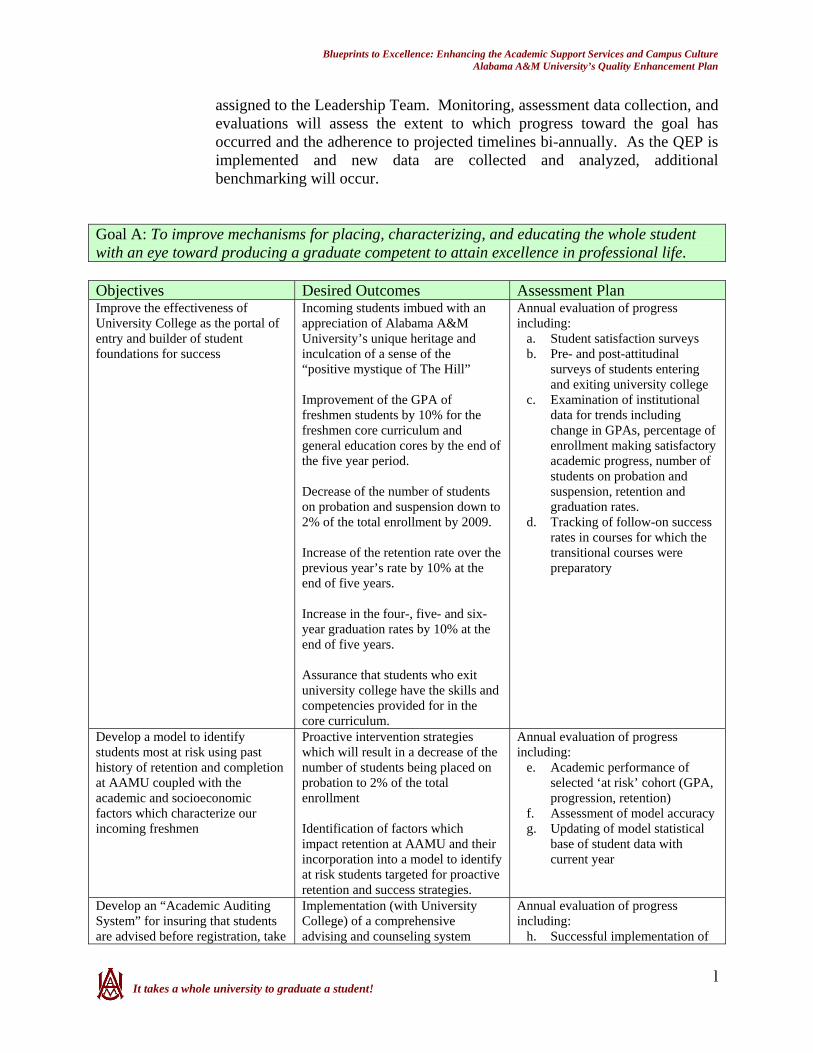
Blueprints to Excellence: Enhancing the Academic Support Services and Campus Culture Alabama A&M University’s Quality Enhancement Plan
It takes a whole university to graduate a student! l
assigned to the Leadership Team. Monitoring, assessment data collection, and evaluations will assess the extent to which progress toward the goal has occurred and the adherence to projected timelines bi-annually. As the QEP is implemented and new data are collected and analyzed, additional benchmarking will occur.
Goal A: To improve mechanisms for placing, characterizing, and educating the whole student with an eye toward producing a graduate competent to attain excellence in professional life. Objectives Desired Outcomes Assessment Plan Improve the effectiveness of University College as the portal of entry and builder of student foundations for success
Incoming students imbued with an appreciation of Alabama A&M University’s unique heritage and inculcation of a sense of the “positive mystique of The Hill” Improvement of the GPA of freshmen students by 10% for the freshmen core curriculum and general education cores by the end of the five year period. Decrease of the number of students on probation and suspension down to 2% of the total enrollment by 2009. Increase of the retention rate over the previous year’s rate by 10% at the end of five years. Increase in the four-, five- and six-year graduation rates by 10% at the end of five years. Assurance that students who exit university college have the skills and competencies provided for in the core curriculum.
Annual evaluation of progress including:
a. Student satisfaction surveys b. Pre- and post-attitudinal
surveys of students entering and exiting university college
c. Examination of institutional data for trends including change in GPAs, percentage of enrollment making satisfactory academic progress, number of students on probation and suspension, retention and graduation rates.
d. Tracking of follow-on success rates in courses for which the transitional courses were preparatory
Develop a model to identify students most at risk using past history of retention and completion at AAMU coupled with the academic and socioeconomic factors which characterize our incoming freshmen
Proactive intervention strategies which will result in a decrease of the number of students being placed on probation to 2% of the total enrollment Identification of factors which impact retention at AAMU and their incorporation into a model to identify at risk students targeted for proactive retention and success strategies.
Annual evaluation of progress including:
e. Academic performance of selected ‘at risk’ cohort (GPA, progression, retention)
f. Assessment of model accuracy g. Updating of model statistical
base of student data with current year
Develop an “Academic Auditing System” for insuring that students are advised before registration, take
Implementation (with University College) of a comprehensive advising and counseling system
Annual evaluation of progress including:
h. Successful implementation of

Blueprints to Excellence: Enhancing the Academic Support Services and Campus Culture Alabama A&M University’s Quality Enhancement Plan
It takes a whole university to graduate a student! li
Objectives Desired Outcomes Assessment Plan classes appropriate to their placement, and take courses in the proper sequence to optimize student learning
Structure and implementation of an audit system which results in 100% assessment/correct placement of incoming freshmen, and no student taking classes without required prerequisites Improved advisement of students and tracking of student progress Greater numbers of students successfully completing their degrees in a shorter time
system i. Reduced incidence of students
targeted for specific transitional courses (100 level) that do not take them in the first semester, students taking courses without required prerequisites, students not taking courses in sequence.
j. Successful adoption of the academic auditing system by advisors
k. Reduction in times to complete graduation
Goal B: To improve the campus culture to embrace diversity and the arts, foster scholarly attainment, and promote mature, society-conscious behaviors among all the parts of the university family. Objectives Desired Outcomes Assessment Plan Implement a “Scholartorium” where students, faculty, and staff can engage in scholarly activities in an informal setting and where a variety of services can be offered to enhance student learning in a centers approach.
Insure the integration of the University’s core values into all aspects of student life Establishment of informal study groups to increase academic achievement Establish a student leadership institute as an avenue for student-driven enhancement of the academics, environment, and culture on campus and increased civic engagement in the community Increase scholarly productivity of faculty and students Establishment and use of mini-centers which address academic coaching, tutoring, e-tutoring, etc. with increased usage by students through self-referral and instructor/advisor referral Increase the participation of faculty, staff, and students, in various social, civic, educational, and cultural activities, on and off campus
Annual evaluation of progress including:
l. Measurement of attitudinal change and impact in annual student satisfaction survey.
m. Change in GPAs in difficult-to-master courses
n. Incidence in civic and community projects
o. Greater number of publications, scholarly works, books written, projects completed, professional meetings attended, and presentations
p. Greater quality of student work in selected ‘anchor’ courses.
q. Numbers of students who utilize the coaching and tutoring services
r. Attendance figures for activities on campus
Design and construct a “Bulldog Den” within the Scholartorium to serve as a center of dialog,
Increase by 30% the percentage of faculty and students reporting mentoring relationships
s. Percentage of students and faculty reporting mentoring relationships in student and

Blueprints to Excellence: Enhancing the Academic Support Services and Campus Culture Alabama A&M University’s Quality Enhancement Plan
It takes a whole university to graduate a student! lii
Objectives Desired Outcomes Assessment Plan communication, sharing, good fellowship, and scholarly exchange.
faculty/staff satisfaction surveys
t. Observation of interactions in situ at the “Bulldog Den”
Establish a “Eminent Teaching Roundtable” to celebrate, honor, and reward excellence in teaching and to use the “eminent teachers” as a resource for development of strategies to enhance teaching on campus, elevate the scholarly activity in teaching, and enhance attitudes of expectations faculty have of our students
Improvement of overall faculty teaching performance and enhanced initiative to engage in innovative teaching Enhanced faculty expectations of students performance in classes
u. Increase in number of
“eminent teachers” v. Faculty attitudinal
measurement in faculty/staff satisfaction surveys
w. Increase in use of teaching innovation documented by faculty activity reports
Implement an actual and virtual events kiosk to enhance effective communication across campus and among its constituent groups
Increased participation of faculty, staff, and students in various social, civic, educational, and cultural activities on and off campus
x. Increase in participation in events on campus
Conduct intensive customer service training for all university personnel to enhance perceptions of friendliness and service
Improved student, faculty, staff, and community satisfaction with services provided by the university
y. Measurement of student and faculty satisfaction via campus-wide satisfaction surveys
z. Intra-office customer satisfaction surveys
Foster a campus “ethos” which promotes student learning by creating a safe environment with respect to security and management of pedestrian and vehicular traffic and furthermore, fosters an ethical sense of campus ownership by students that does not tolerate violence, theft, and abuse of the facilities
Increase in the perception and actuality of safety on campus. Improved campus circulation and reduction of congestion
aa. Survey of satisfaction with security, parking, perception of safety, and ease of campus travel
Summary: The methodologies identified above and the customary outcomes assessment process already in place will provide data so that the QEP development team may re-evaluate the goals and objectives for its implementation, refine the strategies to be employed, and modify the timelines for implementation.
D. PROJECT RESOURCES
It is recognized that the physical structure for the Scholartorium is a long-range goal. We, therefore, propose that current plans to build a student fitness center is expanded to build a more comprehensive student center which would include both the fitness and Scholartorium facilities. In the meantime, the Scholartorium concepts will be initiated immediately through the establishment of mini centers located throughout the campus. Areas within the old dining hall which is now being renovated, a resource room within the Learning Resources Center, and a student conference room within the School of Engineering building are examples of sites that could be used to establish mini centers.
Blueprints to Excellence: Enhancing the Academic Support Services and Campus Culture Alabama A&M University’s Quality Enhancement Plan
It takes a whole university to graduate a student! liii
Implementation and completion of Goal A and parts of Goal B are estimated to be approximately $400,000.00 per year. Specifically, resources include:
• Human Resources - Coordinator - Tutors, mentors, and academic coaches - Webmaster - Consultants (Customer Service Training) - Architect
• Physical Resources - Scholartorium (addition of planned facility or renovation of
existing facility) - Hardware/Software - Center Materials
• Miscellaneous - Student leadership programs - Eminent Teachers
E. QEP MANAGEMENT PLAN
The ultimate responsibility for the achievement of the Quality Enhancement Plan lies with the chief administrator of the University. The QEP leadership team will monitor the overall implementation, while the day-to-day activities will be managed by the QEP Plan Coordinator who will also serve as liaison between the administration and the project leaders and their teams. Additionally, the coordinator will assist units in the planning and implementing sub-projects. More specifically, these activities will include, but not be limited to the following:
• Formulate teams to carry out each objective • Monitor progress toward achievement of specific objectives • Perform annual assessment of adherence to timelines, and achievement of goals and
objectives • Assist with the modification of plans as needed • Submit annual reports the status of the QEP.
To insure continued involvement of the entire University community project teams will be assigned to carry out the activities of each sub-project. Team leaders will:
• Conduct appropriate activities for successful implementation of projects • Provide benchmark reports as appropriate • Maintain records of activities • Identify and communicate additional project needs • Submit progress reports to Plan Coordinator • Provide input for annual reports
Annual reports and evaluation results will be published in the fall of each academic year.

Blueprints to Excellence: Enhancing the Academic Support Services and Campus Culture Alabama A&M University’s Quality Enhancement Plan
It takes a whole university to graduate a student! liv
EXECUTIVE SUMMARY Students entering Alabama A&M University in Fall 2003 are predominately black and come from homes which lie over 100 miles away from campus. Over 85% of these students live on campus, but in some ways, students entering Alabama A&M University are different from those who are entering other HBCUs. These differences affect their expectations and perceptions of campus life and ultimately whether they are retained and successfully graduated. Their parents are more affluent and better educated than those of students entering other HBCUs which may increase their expectations for quality of living. Relative to incoming freshmen at other HBCUs, AAMU’s incoming students are less exposed to diversity of racial and ethnic backgrounds and may be socially or politically immature. Alabama A&M University can overcome this apparent deficiency by enriching the campus environment and culture to celebrate diversity, explore culture and other artistic and creative expression, and expose students to higher values of scholarship. These freshmen also come with some habits which could pose problems for academic success such as studying less time for class, spending large amounts of time watching television, and missing class or coming late to class. In other ways, our incoming freshmen Fall 2003 class is better prepared for the academic challenges that they face since this class contained a large number of valedictorians, salutatorians, and honor students. This class also has higher ACT scores and GPAs than previous years’ classes. Changing the campus culture to one which expects strong academic achievement, successful education of the whole student, and pursuit of scholarly activity then becomes a keystone to integration of the goals of the QEP. Changing policy with respect to minimum academic performance will also help to set the tone. Establishment of a “warning” status (GPA<2.5) in addition to the usual “probation” grouping (GPA <2.0) would help to identify students who may need to refine study skills, to avail themselves of tutors, or to develop better time management skills and could prevent students from being placed on the more severe probation list, and retain more of them with the goal of improving retention. Raising the minimum grade required to pass successfully to the next level of mathematics or English to a “C” in both cases would also change the culture on campus to a more academic one. The first two years are crucial to retaining and ultimately graduating these students successfully. Proper placement of the students into classes, active mentoring and advisement, and early intervention with high risk students is essential. The success of intrusive academic services in reducing the number of students on probation is clear evidence of the potential of this approach in a reactive mode. This same approach could be equally if not more effective if extended to a proactive mode where at risk students are identified before they are placed on probation and educated in living and learning skills so essential for a successful college career. University College, as the entry point for all freshmen, has a vital role in insuring a smooth transition into college academic life and for determining proper placement of students into the appropriate levels of mathematics and English courses. Not only this, it also serves as an in loco parentis for students who are quite a distance away from home and whose social support system has been shifted to AAMU. As such, its services should be expanded to include identification of high risk students, proactive life and learning skills enhancement, identification of learning styles, pairing with mentors/advisors in their major, and assessment to determine effectiveness of approaches.

Blueprints to Excellence: Enhancing the Academic Support Services and Campus Culture Alabama A&M University’s Quality Enhancement Plan
It takes a whole university to graduate a student! lv
University College is the entity whose mission centers on incoming students, the freshmen core of courses, and the general education core. Because of this a close examination of the functions of University College, its effectiveness, and the degree to which it coordinates with other vital entities in the process must be an objective under this goal. University College does not stand alone as the sole participant in the process of integrating the new incoming student into mainstream campus culture. Many student service units play a vital part such as Admissions, Financial Aid, Registrar’s Office, Financial Services, Student Affairs, and the academic program areas with the recognition that “it takes a whole University to graduate a student”. As such, each and every unit on campus has a role to play in each student’s successful degree attainment, thus two major goals for the QEP have been determined as follows: Goal A – To improve mechanisms for placing, characterizing, and educating the whole student
with a focus toward the successful development of competent graduates prepared to attain excellence in professional life.
Objective 1 - Restructure University College with a view toward a) better integration of its
multiple functions, b) amalgamation of all tutoring services under one leadership, c) revision of the Survival Skills courses, d) examination, assessment, development, and placement of incoming freshmen, e) comprehensive and integrated academic advising system, f) an early alert system and g) expansion of the intrusive retention service to a more proactive preventative stance than its current reactive approach to students on probation.
Objective 2 – Integrate the University student databases to insure accuracy and consistency
and for use in development of a model capable of identifying students who are most at risk of non-retention.
Objective 3 – Develop an “Academic Auditing System to insure that a) the student is
appropriately advised or counseled before registering for classes, b) the student enrolls classes that are appropriate for his or her placement level, and c) the student takes prerequisite classes before taking more advanced classes.
Goal B - To improve the campus culture to embrace diversity and the arts, foster scholarly
attainment, and promote mature, society-conscious behaviors among all the parts of the university family.
Objective 1 - Establishment of a “scholartorium” where students, faculty, and staff engage in
scholarly activities in an informal setting. This structure is designed to enhance student performance, using the center approach.
Objective 2 - Design and create a “Bulldog Den” as center for dialog, communication,
sharing, good fellowship, and scholarly exchange within the scholartorium. Objective 3 – Establish an Eminent Teaching Roundtable to foster an environment where
innovations in teaching are recognized and rewarded.
Blueprints to Excellence: Enhancing the Academic Support Services and Campus Culture Alabama A&M University’s Quality Enhancement Plan
It takes a whole university to graduate a student! lvi
Objective 4 – Develop and construct of actual and virtual “events kiosk” as a means of enhancing communication on campus.
Objective 5 – Enhancing perceived friendliness and helpfulness of student services, financial
services, research and development, and academic affairs staff via customer service workshops.
Objective 6 – Fostering a campus “ethos” which promotes student learning by creating a safe
environment with respect to security and management of pedestrian and vehicular traffic and furthermore, fosters an ethical sense of campus ownership by students that does not tolerate violence, theft, and abuse of the facilities.
Based upon the above stated goals and objectives, we anticipate that the following outcomes will be achieved:
Improve the GPA of freshman students by 10% for the core curriculum and general education in five years.
Structure and implement an assessment and placement system. Assure 100% placement of all students in the core curriculum and general education courses
based on the approved assessment measurements. Reduce the number of students on probation down to 2%. Increase retention by 10% over five years. Increase graduation in four years by 10%, five year by 10% and six years by 10% in five
years. Implement a degree auditing system that tracks students’ academic progress from entry to
exit (early alert, comprehensive academic advising, etc.). Increase by 30% the number of mentoring relationships between faculty and students and
student to student. Establish informal study groups. Improve faculty instructional performance. Implement a comprehensive advising and counseling system. Increase the level of scholarly productivity of faculty and students. Establish a student leadership institute. Form mini-centers addressing academic coaching, tutoring, e-tutoring, etc. Improve student, faculty, staff and the general community’s satisfaction with services
provided by the University. Increase the participation of faculty, staff and students in various social, civic, educational,
and cultural activities on and off campus. Provide for students to acquire fundamental life skills necessary for survival in the world of
work. Assure the integration of the University’s core values into its programs and services. Develop and implement a multivariate prediction model that will help to identify incoming
students at greatest risk for non-retention and those factors most related to persistence at AAMU. The model will use socioeconomic and high school performance data from student database records for the last ten years. Identification of factors that lead to persistence.
To create “a positive mystique of The Hill.”