abn 81 108 676 204 - asx · preliminary final report super retail group limited (sul) abn 81 108...
TRANSCRIPT

APPENDIX 4E PRELIMINARY FINAL REPORT
SUPER RETAIL GROUP LIMITED (SUL) ABN 81 108 676 204
Statutory Results
Current Reporting Period: From 2 July 2017 to 30 June 2018 (52 weeks) Previous Reporting Period: From 3 July 2016 to 1 July 2017 (52 weeks)
Results for Announcement to the Market
Statutory Results
$m
Comparison to 2017 Statutory Results
$m
Revenue from ordinary activities $2,570.4 Up 4.2% from $2,465.8
Profit from ordinary activities after tax attributable to members
$128.3 Up 26.0% from $101.8
Net profit for the period attributable to members $128.3 Up 26.0% from $101.8
Dividends
Amount Per Share Franked Amount Per Share
Interim dividend – Current Period 21.5¢ 21.5¢
Final dividend – Current Period (1)
27.5¢ 27.5¢ Record date for determining entitlements to the final dividend 30 August 2018
(1)Declared 20 August 2018, payable 2 October 2018.
Brief explanation of figures reported above to enable the figures to be understood
This report is based on the consolidated financial statements which have been audited. The audit report, which was unqualified, is included within the Company’s Financial Report which accompanies this Appendix 4E.
Key features of the result include:
• Normalised Net Profit After Tax (NPAT) at $145.3 million, an increase of 7.0 per cent over the comparative period
• Group’s Segment Earnings Before Interest and Tax (EBIT) at $219.6 million, an increase of 5.9 per cent
• Contribution from all Divisions, with Auto, Outdoor and Sports Segment EBIT growth of 4.9 per cent, 16.5 per cent and 0.2 per cent respectively
• Operating cash flow of $308.4 million, $73.9 million higher than the comparative period
• Investing cash flows of $241.2 million supporting the Group’s strategic plan with the acquisition of Macpac of $133.8
million, investment in property, plant, equipment and computer software of $107.1 million and investment in Autocrew joint venture of $0.3 million.
• Final dividend of 27.5 cents contributing to a full year dividend of 49.0 cents, 5.4 per cent higher than the comparative period
For
per
sona
l use
onl
y

APPENDIX 4E PRELIMINARY FINAL REPORT
SUPER RETAIL GROUP LIMITED (SUL) ABN 81 108 676 204
Details of associates and joint venture entities
Name of entity Ownership percentage
Autoguru Australia Pty Ltd - associate 49.5% Autocrew Australia Pty Ltd – joint venture 50.0%
Control gained or lost over entities during the period
(a) Names of entities where control was gained in the period
Name of entity Date control gained Macpac Holdings Pty Ltd 31 March 2018 Macpac Group Holdings Limited 31 March 2018 Macpac Retail Pty Ltd 31 March 2018 Macpac Limited 31 March 2018 Macpac Enterprise 31 March 2018 MP Finco Limited 31 March 2018 Mouton Noir Management Pty Ltd 31 March 2018 Mouton NOIR IP Limited 31 March 2018 (b) Names of entities where control was lost in the period
Name of entity Date control lost Autoguru Australia Pty Ltd 19 February 2018
For
per
sona
l use
onl
y
DIRECTORS’ AND FINANCIAL
REPORTS
2018
For
per
sona
l use
onl
y

2 Super Retail Group Limited • Directors’ & Financial Reports 2018
Super Retail Group is one of Australasia’s largest retailers and is listed on the Australian Securities Exchange (ASX).
We have over 670 stores, an annualised turnover of more than $2.5 billion, and
operations in Australia, New Zealand and China.
Our retail portfolio includes BCF Boating Camping Fishing, Macpac, Rebel and
Supercheap Auto. Our online and digital presence complements our physical
store footprint to enable our customers to shop whenever and however they
prefer.
In addition to our extensive retail network, our commercial entities – Auto Trade
Direct, Infinite Retail and Super Retail Commercial – offer opportunities for
businesses to use our sourcing and supply chain capabilities to buy the products
they need, when they need them.
We have a clear view of the future, a solid strategic roadmap and a passionate
team of almost 12,000 members – all committed to delivering solutions that
engage and inspire our customers.
For
per
sona
l use
onl
y

DIRECTORS’ REPORT
Super Retail Group Limited • Directors’ & Financial Reports 2018 3
The Directors present their report together with the consolidated financial statements of the Group comprising Super Retail
Group Limited (SUL) (the Company) and its subsidiaries for the period ended 30 June 2018.
1. Directors The Directors of the Company at any time during or since the end of the period, up to the date of this report are:
Directors: S A Pitkin
(Independent Non-Executive Chair) (appointed as Chair 23 October 2017) P A Birtles
(Group Managing Director and Chief Executive Officer)
R A Rowe
(Non-Executive Director) D J Eilert
(Independent Non-Executive)
L K Inman
(Independent Non-Executive) H L Mowlem
(Independent Non-Executive)
P D Everingham
(Independent Non-Executive) (appointed 19 December 2017)
Former: R J Wright
(Independent Non-Executive Chair) (retired 23 October 2017)
Details of the qualifications, experience and responsibilities of the Directors can be found in the Group’s annual report.
Special Responsibilities of Directors:
Director Audit & Risk Committee Nomination Committee Human Resources &
Remuneration Committee
S A Pitkin(2) � �(1) �
P A Birtles n/a � n/a
R A Rowe n/a � n/a
D J Eilert � � �
L K Inman(3) � � �(1)
H L Mowlem(4) �(1) � �
P D Everingham(5) n/a � n/a
(1) Denotes Chair of Committee. (2) Appointed as Chair of Nomination Committee 23 October 2017 (3) Appointed as Chair of Human Resources & Remuneration Committee 23 October 2017 (4) Appointed as Chair of Audit & Risk Committee 23 October 2017 (5) Appointed 19 December 2017.
1.1 Directorships of listed companies held by members of the Board
Current directors:
Director Listed Company Directorship Key Dates
S A Pitkin
Super Retail Group
Limited
Star Entertainment
Group Limited Link Administration
Holdings Limited
Independent Non-Executive Chair
Independent Non-Executive Director
Independent Non-Executive Director
Independent Non-Executive Director
Current, appointed 23 October 2017
Appointed 01 July 2010
Current, appointed 31 July 2014
Current, appointed 23 September
2015
Former directorships:
IPH Limited
Billabong International
Limited
Independent Non-Executive Director
Independent Non-Executive Director
Former, appointed 23 September 2014 and ceased 20 November 2017
Former, appointed 28 February 2012
and ceased 15 August 2016
P A Birtles
Super Retail Group Limited GWA Group Limited
Group Managing Director and Chief Executive Officer
Independent Non-Executive Director
Current, appointed 05 January 2006
Current, appointed 24 November
2010
R A Rowe
Super Retail Group
Limited
Non-Executive Director Current, appointed 08 April 2004
For
per
sona
l use
onl
y

DIRECTORS’ REPORT (continued)
4 Super Retail Group Limited • Directors’ & Financial Reports 2018
1. Directors (continued) 1.1 Directorships of listed companies held by members of the Board (continued) Current directors:
Director Listed Company Directorship Key Dates
D J Eilert
Super Retail Group
Limited
Navitas Limited Elders
Domain Holdings
Independent Non-Executive Director
Non-Executive Director Non-Executive Director
Non-Executive Director
Current, appointed 21 October 2015
Current appointed 28 July 2014 Current appointed 14 November 2017
Current appointed 16 November 2017
Former directorships:
Veda Group Limited Non-Executive Director Former, appointed 4 October 2013
and delisted 26 February 2016
L K Inman
Super Retail Group
Limited
Precinct Properties New Zealand Limited
Independent Non-Executive Director
Independent Non-Executive Director
Current, appointed 21 October 2015
Current, appointed 28 October 2015
Former directorships:
Commonwealth Bank
of Australia
Bellamy’s Australia Limited
Non-Executive Director
Non-Executive Director
Former, appointed 16 March 2011 and
ceased 16 November 2017
Former, appointed 15 February 2015 and ceased 28 February 2017
H L Mowlem
Super Retail Group
Limited
Independent Non-Executive Director Current, appointed 13 June 2017
Former directorships:
Billabong International Limited
Independent Non-Executive Director
Former, appointed 24 October 2012 and delisted 26 April 2018
P D Everingham
Super Retail Group
Limited
iCar Asia Limited
Independent Non-Executive Director
Independent Non-Executive Director
Current, appointed 19 December 2017
Current, appointed 1 July 2017
Former director:
Director Listed Company Directorship Key Dates
R J Wright Super Retail Group
Limited
APA Ethane Limited
Australian Pipeline
Limited
Independent Non-Executive Chair
Independent Non-Executive Director
Chair and Non-Executive Director
Independent Non-Executive Director
Former, appointed 28 October 2009
and ceased 23 October 2017
Former, appointed 19 May 2004 and
ceased 23 October 2017 Former, appointed 10 July 2008 and
ceased September 2016
Former, appointed 10 Feb 2000 and
ceased October 2015
1.2 Directors’ Meetings The number of meetings of the Company’s Board of Directors and each Board Committee held during the period ended 30 June 2018 is set out below:
Meetings of Committees
Board Meetings Audit and Risk Nomination Human Resources and
Remuneration
Attended Held(1) Attended Held(1) Attended Held(1) Attended Held(1)
R J Wright 4 4 1 1 n/a n/a 3 3
S A Pitkin 13 13 4 4 1 1 5 5
P A Birtles 13 13 4 4 1 1 5 5
R A Rowe 13 13 4 4 1 1 5 5
D J Eilert 13 13 4 4 1 1 5 5
L K Inman 13 13 4 4 1 1 5 5
H L Mowlem 13 13 4 4 1 1 5 5
P D Everingham 8 8 2 2 n/a n/a 1 1
(1)Number of meetings held during the time the Director held office during the year.
For
per
sona
l use
onl
y
DIRECTORS’ REPORT (continued)
Super Retail Group Limited • Directors’ & Financial Reports 2018 5
1. Directors (continued)
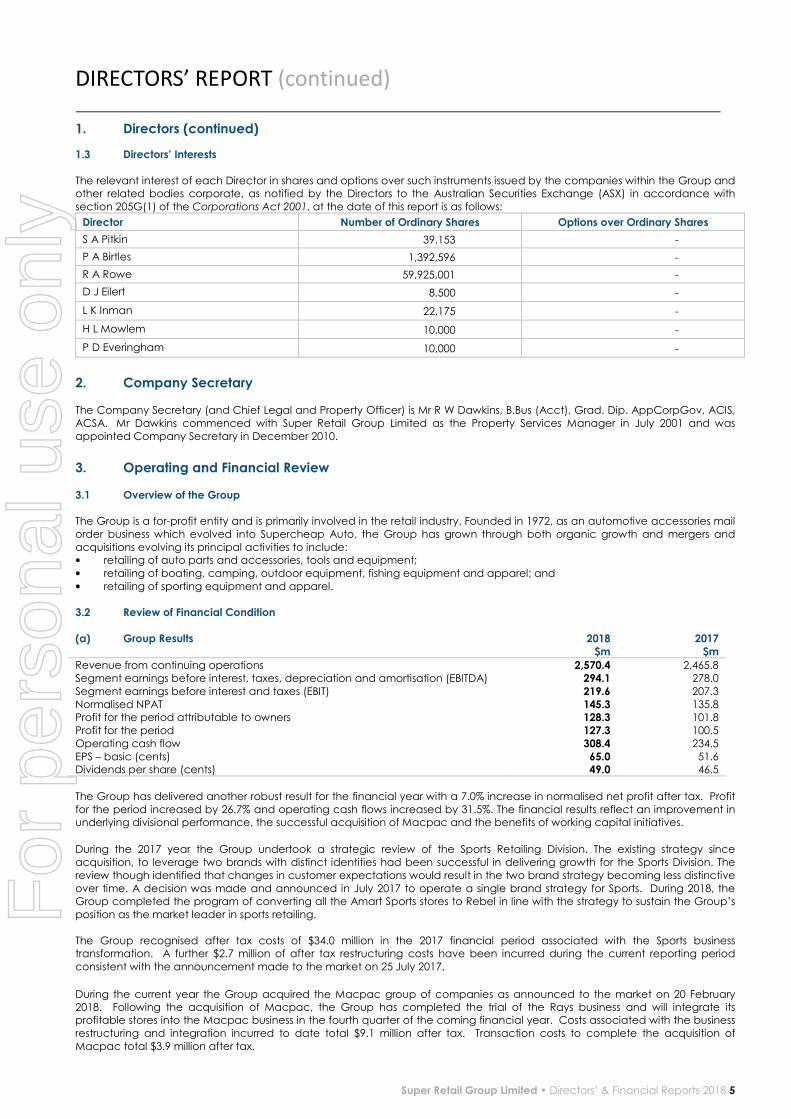
1.3 Directors’ Interests The relevant interest of each Director in shares and options over such instruments issued by the companies within the Group and other related bodies corporate, as notified by the Directors to the Australian Securities Exchange (ASX) in accordance with
section 205G(1) of the Corporations Act 2001, at the date of this report is as follows:
Director Number of Ordinary Shares Options over Ordinary Shares
S A Pitkin 39,153 -
P A Birtles 1,392,596 -
R A Rowe 59,925,001 -
D J Eilert 8,500 -
L K Inman 22,175 -
H L Mowlem 10,000 -
P D Everingham 10,000 -
2. Company Secretary
The Company Secretary (and Chief Legal and Property Officer) is Mr R W Dawkins, B.Bus (Acct), Grad. Dip. AppCorpGov, ACIS,
ACSA. Mr Dawkins commenced with Super Retail Group Limited as the Property Services Manager in July 2001 and was
appointed Company Secretary in December 2010.
3. Operating and Financial Review
3.1 Overview of the Group The Group is a for-profit entity and is primarily involved in the retail industry. Founded in 1972, as an automotive accessories mail
order business which evolved into Supercheap Auto, the Group has grown through both organic growth and mergers and
acquisitions evolving its principal activities to include: • retailing of auto parts and accessories, tools and equipment;
• retailing of boating, camping, outdoor equipment, fishing equipment and apparel; and
• retailing of sporting equipment and apparel.
3.2 Review of Financial Condition (a) Group Results 2018 2017 $m $m
Revenue from continuing operations 2,570.4 2,465.8
Segment earnings before interest, taxes, depreciation and amortisation (EBITDA) 294.1 278.0
Segment earnings before interest and taxes (EBIT) 219.6 207.3
Normalised NPAT 145.3 135.8 Profit for the period attributable to owners 128.3 101.8
Profit for the period 127.3 100.5
Operating cash flow 308.4 234.5
EPS – basic (cents) 65.0 51.6 Dividends per share (cents) 49.0 46.5
The Group has delivered another robust result for the financial year with a 7.0% increase in normalised net profit after tax. Profit
for the period increased by 26.7% and operating cash flows increased by 31.5%. The financial results reflect an improvement in underlying divisional performance, the successful acquisition of Macpac and the benefits of working capital initiatives.
During the 2017 year the Group undertook a strategic review of the Sports Retailing Division. The existing strategy since
acquisition, to leverage two brands with distinct identities had been successful in delivering growth for the Sports Division. The
review though identified that changes in customer expectations would result in the two brand strategy becoming less distinctive
over time. A decision was made and announced in July 2017 to operate a single brand strategy for Sports. During 2018, the Group completed the program of converting all the Amart Sports stores to Rebel in line with the strategy to sustain the Group’s
position as the market leader in sports retailing.
The Group recognised after tax costs of $34.0 million in the 2017 financial period associated with the Sports business transformation. A further $2.7 million of after tax restructuring costs have been incurred during the current reporting period
consistent with the announcement made to the market on 25 July 2017.
During the current year the Group acquired the Macpac group of companies as announced to the market on 20 February 2018. Following the acquisition of Macpac, the Group has completed the trial of the Rays business and will integrate its profitable stores into the Macpac business in the fourth quarter of the coming financial year. Costs associated with the business
restructuring and integration incurred to date total $9.1 million after tax. Transaction costs to complete the acquisition of
Macpac total $3.9 million after tax.
For
per
sona
l use
onl
y
DIRECTORS’ REPORT (continued)
6 Super Retail Group Limited • Directors’ & Financial Reports 2018
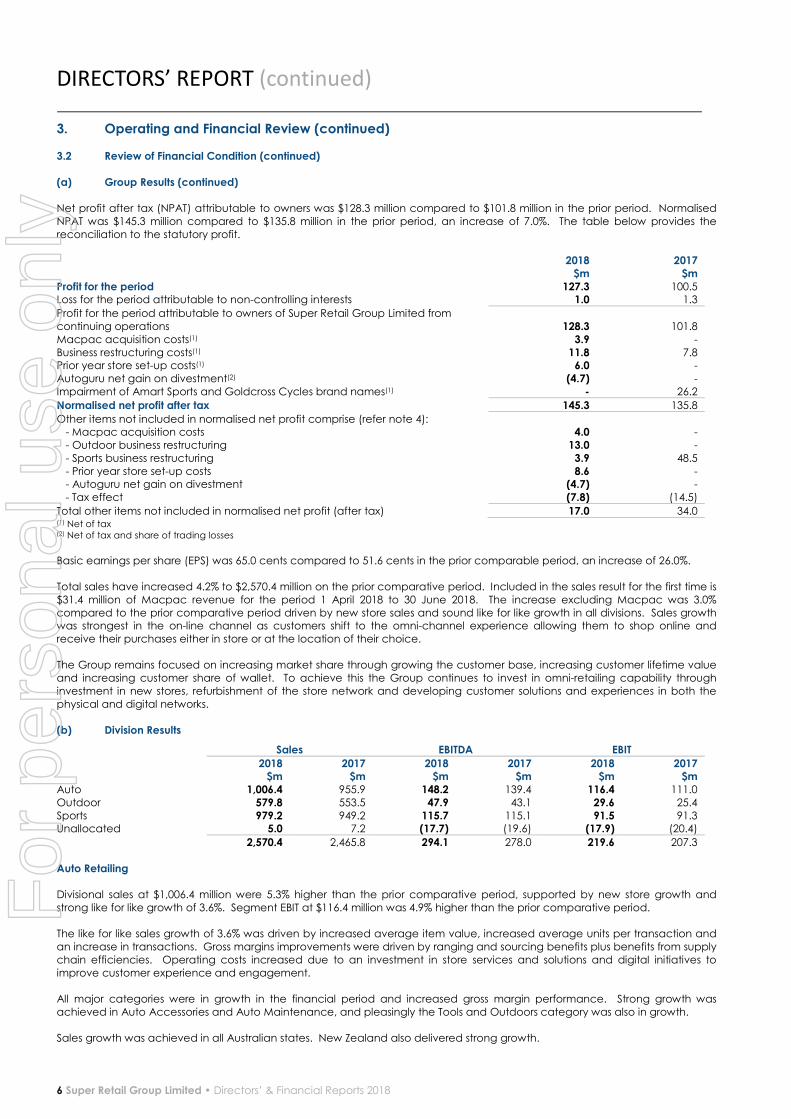
3. Operating and Financial Review (continued) 3.2 Review of Financial Condition (continued) (a) Group Results (continued) Net profit after tax (NPAT) attributable to owners was $128.3 million compared to $101.8 million in the prior period. Normalised
NPAT was $145.3 million compared to $135.8 million in the prior period, an increase of 7.0%. The table below provides the
reconciliation to the statutory profit. 2018 2017 $m $m Profit for the period 127.3 100.5 Loss for the period attributable to non-controlling interests 1.0 1.3
Profit for the period attributable to owners of Super Retail Group Limited from
continuing operations
128.3
101.8
Macpac acquisition costs(1) 3.9 -
Business restructuring costs(1) 11.8 7.8 Prior year store set-up costs(1) 6.0 -
Autoguru net gain on divestment(2) (4.7) -
Impairment of Amart Sports and Goldcross Cycles brand names(1) - 26.2
Normalised net profit after tax 145.3 135.8
Other items not included in normalised net profit comprise (refer note 4): - Macpac acquisition costs 4.0 -
- Outdoor business restructuring 13.0 -
- Sports business restructuring 3.9 48.5
- Prior year store set-up costs 8.6 - - Autoguru net gain on divestment (4.7) -
- Tax effect (7.8) (14.5)
Total other items not included in normalised net profit (after tax) 17.0 34.0 (1) Net of tax (2) Net of tax and share of trading losses
Basic earnings per share (EPS) was 65.0 cents compared to 51.6 cents in the prior comparable period, an increase of 26.0%. Total sales have increased 4.2% to $2,570.4 million on the prior comparative period. Included in the sales result for the first time is
$31.4 million of Macpac revenue for the period 1 April 2018 to 30 June 2018. The increase excluding Macpac was 3.0%
compared to the prior comparative period driven by new store sales and sound like for like growth in all divisions. Sales growth was strongest in the on-line channel as customers shift to the omni-channel experience allowing them to shop online and
receive their purchases either in store or at the location of their choice.
The Group remains focused on increasing market share through growing the customer base, increasing customer lifetime value
and increasing customer share of wallet. To achieve this the Group continues to invest in omni-retailing capability through
investment in new stores, refurbishment of the store network and developing customer solutions and experiences in both the
physical and digital networks. (b) Division Results
Sales EBITDA EBIT
2018 2017 2018 2017 2018 2017 $m $m $m $m $m $m Auto 1,006.4 955.9 148.2 139.4 116.4 111.0
Outdoor 579.8 553.5 47.9 43.1 29.6 25.4
Sports 979.2 949.2 115.7 115.1 91.5 91.3 Unallocated 5.0 7.2 (17.7) (19.6) (17.9) (20.4)
2,570.4 2,465.8 294.1 278.0 219.6 207.3
Auto Retailing Divisional sales at $1,006.4 million were 5.3% higher than the prior comparative period, supported by new store growth and
strong like for like growth of 3.6%. Segment EBIT at $116.4 million was 4.9% higher than the prior comparative period.
The like for like sales growth of 3.6% was driven by increased average item value, increased average units per transaction and
an increase in transactions. Gross margins improvements were driven by ranging and sourcing benefits plus benefits from supply
chain efficiencies. Operating costs increased due to an investment in store services and solutions and digital initiatives to
improve customer experience and engagement.
All major categories were in growth in the financial period and increased gross margin performance. Strong growth was
achieved in Auto Accessories and Auto Maintenance, and pleasingly the Tools and Outdoors category was also in growth.
Sales growth was achieved in all Australian states. New Zealand also delivered strong growth.
For
per
sona
l use
onl
y
DIRECTORS’ REPORT (continued)
Super Retail Group Limited • Directors’ & Financial Reports 2018 7
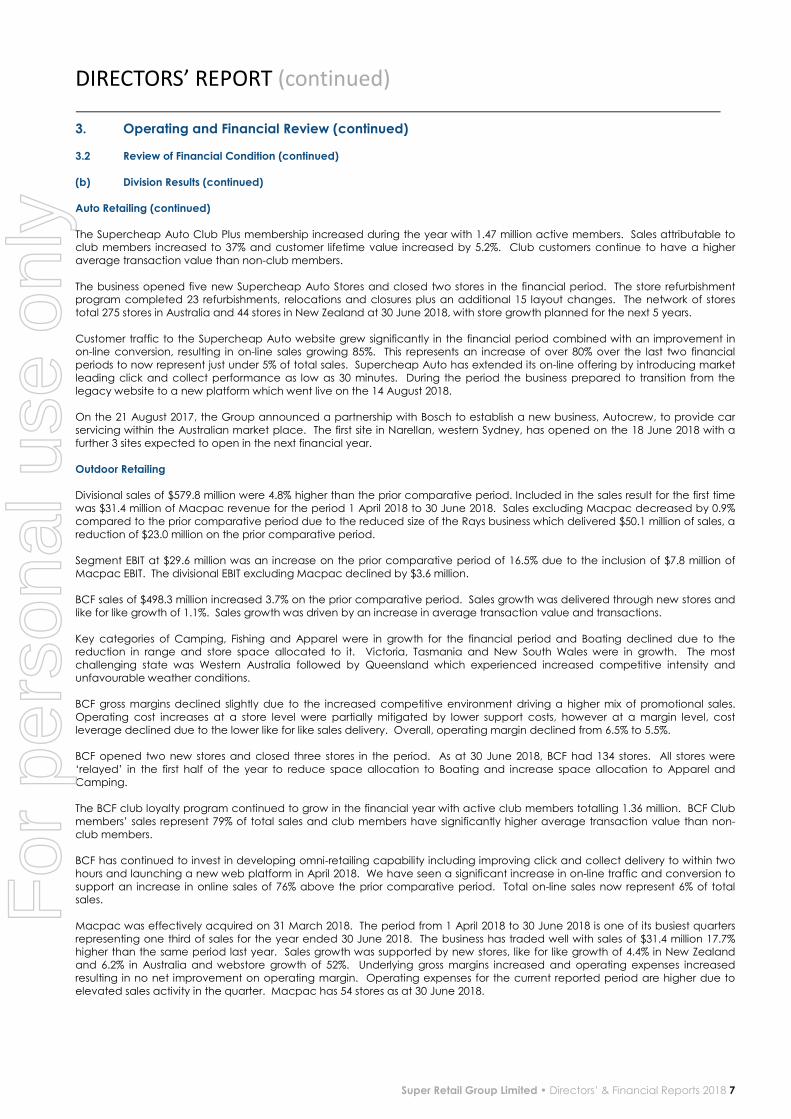
3. Operating and Financial Review (continued) 3.2 Review of Financial Condition (continued)
(b) Division Results (continued) Auto Retailing (continued)
The Supercheap Auto Club Plus membership increased during the year with 1.47 million active members. Sales attributable to club members increased to 37% and customer lifetime value increased by 5.2%. Club customers continue to have a higher
average transaction value than non-club members.
The business opened five new Supercheap Auto Stores and closed two stores in the financial period. The store refurbishment program completed 23 refurbishments, relocations and closures plus an additional 15 layout changes. The network of stores
total 275 stores in Australia and 44 stores in New Zealand at 30 June 2018, with store growth planned for the next 5 years.
Customer traffic to the Supercheap Auto website grew significantly in the financial period combined with an improvement in on-line conversion, resulting in on-line sales growing 85%. This represents an increase of over 80% over the last two financial
periods to now represent just under 5% of total sales. Supercheap Auto has extended its on-line offering by introducing market
leading click and collect performance as low as 30 minutes. During the period the business prepared to transition from the
legacy website to a new platform which went live on the 14 August 2018.
On the 21 August 2017, the Group announced a partnership with Bosch to establish a new business, Autocrew, to provide car
servicing within the Australian market place. The first site in Narellan, western Sydney, has opened on the 18 June 2018 with a
further 3 sites expected to open in the next financial year. Outdoor Retailing Divisional sales of $579.8 million were 4.8% higher than the prior comparative period. Included in the sales result for the first time
was $31.4 million of Macpac revenue for the period 1 April 2018 to 30 June 2018. Sales excluding Macpac decreased by 0.9%
compared to the prior comparative period due to the reduced size of the Rays business which delivered $50.1 million of sales, a
reduction of $23.0 million on the prior comparative period.
Segment EBIT at $29.6 million was an increase on the prior comparative period of 16.5% due to the inclusion of $7.8 million of
Macpac EBIT. The divisional EBIT excluding Macpac declined by $3.6 million.
BCF sales of $498.3 million increased 3.7% on the prior comparative period. Sales growth was delivered through new stores and
like for like growth of 1.1%. Sales growth was driven by an increase in average transaction value and transactions.
Key categories of Camping, Fishing and Apparel were in growth for the financial period and Boating declined due to the reduction in range and store space allocated to it. Victoria, Tasmania and New South Wales were in growth. The most
challenging state was Western Australia followed by Queensland which experienced increased competitive intensity and
unfavourable weather conditions.
BCF gross margins declined slightly due to the increased competitive environment driving a higher mix of promotional sales.
Operating cost increases at a store level were partially mitigated by lower support costs, however at a margin level, cost
leverage declined due to the lower like for like sales delivery. Overall, operating margin declined from 6.5% to 5.5%.
BCF opened two new stores and closed three stores in the period. As at 30 June 2018, BCF had 134 stores. All stores were
‘relayed’ in the first half of the year to reduce space allocation to Boating and increase space allocation to Apparel and
Camping.
The BCF club loyalty program continued to grow in the financial year with active club members totalling 1.36 million. BCF Club
members’ sales represent 79% of total sales and club members have significantly higher average transaction value than non-
club members.
BCF has continued to invest in developing omni-retailing capability including improving click and collect delivery to within two
hours and launching a new web platform in April 2018. We have seen a significant increase in on-line traffic and conversion to
support an increase in online sales of 76% above the prior comparative period. Total on-line sales now represent 6% of total sales.
Macpac was effectively acquired on 31 March 2018. The period from 1 April 2018 to 30 June 2018 is one of its busiest quarters
representing one third of sales for the year ended 30 June 2018. The business has traded well with sales of $31.4 million 17.7% higher than the same period last year. Sales growth was supported by new stores, like for like growth of 4.4% in New Zealand
and 6.2% in Australia and webstore growth of 52%. Underlying gross margins increased and operating expenses increased
resulting in no net improvement on operating margin. Operating expenses for the current reported period are higher due to
elevated sales activity in the quarter. Macpac has 54 stores as at 30 June 2018.
For
per
sona
l use
onl
y

DIRECTORS’ REPORT (continued)
8 Super Retail Group Limited • Directors’ & Financial Reports 2018
3. Operating and Financial Review (continued) 3.2 Review of Financial Condition (continued)
(b) Division Results (continued) Outdoor Retailing (continued) The Rays trial was operating during the financial reporting period and has now been completed. At balance date there are nine Rays stores which have traded well through the year and will be transitioned to Macpac in the fourth quarter of the next
financial year. The Rays business delivered sales of $50.1 million and contributed an EBIT loss of $5.5 million in the financial
reporting period. The loss was in line with the prior comparative period loss.
Sports Retailing
Divisional sales at $979.2 million were 3.2% higher than the prior comparable period supported by new stores and like for like
sales growth of 2.0%. Segment EBIT at $91.5 million was 0.2% higher the prior comparative period.
On the 25 July 2017, the Group announced a decision to convert the Amart Sports stores to Rebel bringing a single national
brand under Rebel which was completed by the end of October 2017. The division converted 68 Amart Sports stores to Rebel
stores within 68 days. This resulted in some business disruption through the key Christmas trading period through to the end of the financial year when the range for all stores was able to be aligned.
The sound sales growth in the financial period has been supported by increased transaction growth offset by lower average
transaction value attributable to increased promotional activation to support the brand transition undertaken in the year.
The key categories of clothing and footwear delivered strong growth in the financial period offset by a small decline in hard
goods and cycling which has been significantly reduced as a result of the Amart Sports integration.
Rebel has continued to invest in developing omni-retailing capability in the year including launching click and collect in
October 2017. Click and collect sales for the financial period represent 25% of total on-line sales. In the financial period website
visits have increased 36%, conversion has increased by a third and on-line sales have increased by 152% to represent 8% of total sales. In the financial period Rebel invested in a new web platform which went live in July 2018.
The Rebel Active club program continued to grow this financial period with active club members totalling 2.47 million. Sales to
club members represent 61% of total sales.
As a result of the Amart Sports integration to Rebel the RebelFit stores were closed and the RebelFit brand has been brought
within the store platform to showcase the fitness category. In the financial period the business has opened three stores and
closed eight stores. The total store network at 30 June 2018 was 159 stores.
Infinite Retail operated consistently with the prior reported period delivering a break even result.
Group Costs
Group costs for the period were $17.9 million, down 12.3% compared to the prior period. The Group costs include Corporate
costs of $10.4 million, $3.1 million of un-allocated distribution centre costs, $4.1 million of omni-retail development costs and
digital investment of $0.3 million.
(c) Financial Position and Cash Flow 2018 2017 $m $m BALANCE SHEET
Trade and other receivables 23.8 42.6 Inventories 545.5 481.5
Trade and other payables (391.4) (297.9)
Current tax (liabilities) / assets (9.6) (1.5)
Total working capital 168.3 224.7
Cash and cash equivalents 15.2 19.9
Borrowings (438.1) (400.6)
Net debt (422.9) (380.7)
Property, plant and equipment 270.4 264.5
Intangible assets 891.6 750.1
Other financial assets 9.3 -
Derivatives 5.3 (3.1) Provisions (92.7) (83.8)
Deferred taxes (30.1) (17.1)
NET ASSETS 799.2 754.6
For
per
sona
l use
onl
y
DIRECTORS’ REPORT (continued)
Super Retail Group Limited • Directors’ & Financial Reports 2018 9
3. Operating and Financial Review (continued) 3.2 Review of Financial Condition (continued)
(c) Financial Position and Cash Flow (continued)
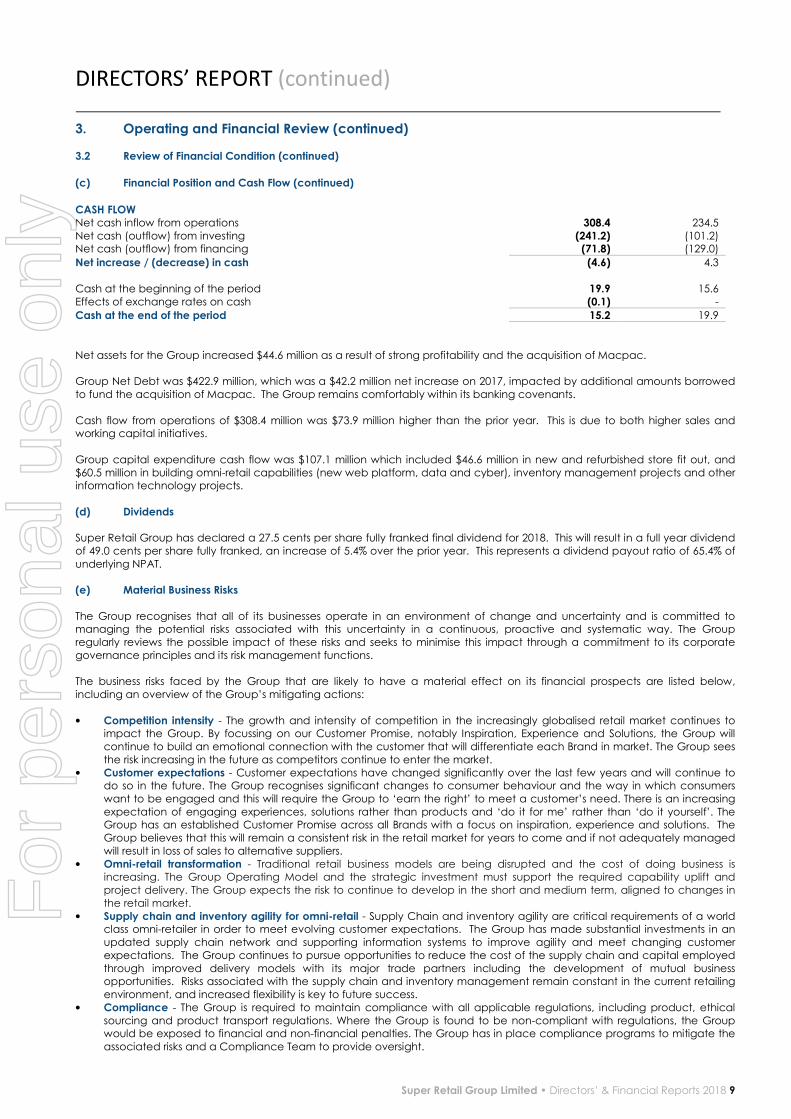
CASH FLOW
Net cash inflow from operations 308.4 234.5
Net cash (outflow) from investing (241.2) (101.2) Net cash (outflow) from financing (71.8) (129.0)
Net increase / (decrease) in cash (4.6) 4.3
Cash at the beginning of the period 19.9 15.6
Effects of exchange rates on cash (0.1) -
Cash at the end of the period 15.2 19.9
Net assets for the Group increased $44.6 million as a result of strong profitability and the acquisition of Macpac.
Group Net Debt was $422.9 million, which was a $42.2 million net increase on 2017, impacted by additional amounts borrowed
to fund the acquisition of Macpac. The Group remains comfortably within its banking covenants.
Cash flow from operations of $308.4 million was $73.9 million higher than the prior year. This is due to both higher sales and working capital initiatives.
Group capital expenditure cash flow was $107.1 million which included $46.6 million in new and refurbished store fit out, and
$60.5 million in building omni-retail capabilities (new web platform, data and cyber), inventory management projects and other information technology projects.
(d) Dividends Super Retail Group has declared a 27.5 cents per share fully franked final dividend for 2018. This will result in a full year dividend
of 49.0 cents per share fully franked, an increase of 5.4% over the prior year. This represents a dividend payout ratio of 65.4% of
underlying NPAT.
(e) Material Business Risks The Group recognises that all of its businesses operate in an environment of change and uncertainty and is committed to managing the potential risks associated with this uncertainty in a continuous, proactive and systematic way. The Group
regularly reviews the possible impact of these risks and seeks to minimise this impact through a commitment to its corporate
governance principles and its risk management functions.
The business risks faced by the Group that are likely to have a material effect on its financial prospects are listed below,
including an overview of the Group’s mitigating actions:
• Competition intensity - The growth and intensity of competition in the increasingly globalised retail market continues to impact the Group. By focussing on our Customer Promise, notably Inspiration, Experience and Solutions, the Group will
continue to build an emotional connection with the customer that will differentiate each Brand in market. The Group sees
the risk increasing in the future as competitors continue to enter the market. • Customer expectations - Customer expectations have changed significantly over the last few years and will continue to
do so in the future. The Group recognises significant changes to consumer behaviour and the way in which consumers
want to be engaged and this will require the Group to ‘earn the right’ to meet a customer’s need. There is an increasing
expectation of engaging experiences, solutions rather than products and ‘do it for me’ rather than ‘do it yourself’. The Group has an established Customer Promise across all Brands with a focus on inspiration, experience and solutions. The
Group believes that this will remain a consistent risk in the retail market for years to come and if not adequately managed
will result in loss of sales to alternative suppliers. • Omni-retail transformation - Traditional retail business models are being disrupted and the cost of doing business is
increasing. The Group Operating Model and the strategic investment must support the required capability uplift and
project delivery. The Group expects the risk to continue to develop in the short and medium term, aligned to changes in
the retail market. • Supply chain and inventory agility for omni-retail - Supply Chain and inventory agility are critical requirements of a world
class omni-retailer in order to meet evolving customer expectations. The Group has made substantial investments in an
updated supply chain network and supporting information systems to improve agility and meet changing customer
expectations. The Group continues to pursue opportunities to reduce the cost of the supply chain and capital employed
through improved delivery models with its major trade partners including the development of mutual business opportunities. Risks associated with the supply chain and inventory management remain constant in the current retailing
environment, and increased flexibility is key to future success.
• Compliance - The Group is required to maintain compliance with all applicable regulations, including product, ethical
sourcing and product transport regulations. Where the Group is found to be non-compliant with regulations, the Group would be exposed to financial and non-financial penalties. The Group has in place compliance programs to mitigate the
associated risks and a Compliance Team to provide oversight.
For
per
sona
l use
onl
y

DIRECTORS’ REPORT (continued)
10 Super Retail Group Limited • Directors’ & Financial Reports 2018
3. Operating and Financial Review (continued) 3.2 Review of Financial Condition (continued)
(e) Material Business Risks (continued)
• Cyber and information security - The digital economy and associated transformation in retail delivery creates new
challenges for all companies in relation to maintaining a strong cyber resilience program. The Group is implementing
strategies to provide protection against deliberate exploitation of computer systems, technology-dependent enterprises and networks by internal and external parties. Cyber security is an evolving and significant risk to all retailers and the
Group will need to maintain ongoing vigilance and adopt appropriate responses (technological / physical / other) to
protect its information assets. The Group has made and will continue to make a significant investment in Information
Management Systems to meet the challenges of the digital economy and evolving technology landscape. The Group believes that this will remain a consistent and increasing risk requiring proactive management.
• Organisation structure, culture and capabilities - Attraction, retention, engagement, safety and succession of team
members are key risks to be managed to maximise financial growth in the retail sector and support our transition to
becoming an omni-retailer. A review of the Group’s operating model is underway and will identify the design requirements and transformation to a new way of working to support the Group’s strategy to be a world class omni-retailer. Transitioning
the organisation to a new operating model will increase risk in the near term, however reduce risk in the medium to long
term.
• Breach of industrial practices - The Group, like all retailers is exposed to industrial relations risk that can impact the reputation and financial performance of the business. There are dedicated programs of work in place to mitigate these
risks. • Financial risk - The Group’s activities expose it to a number of financial risks. The Group adopts a financial risk
management program which seeks to minimise the potential adverse impacts on financial performance of the Group. Financial risks and specific risk management approaches are reported in more detail in the Notes to the Consolidated
Financial Statements.
3.3 Dividends
Dividends paid or declared by the Group to members since the end of the previous financial year were:
Cents per share Total amount $m
Payment date
Declared and paid during the year:
2017 final fully franked dividend 25.0 49.3 6 October 2017
2018 interim fully franked dividend 21.5 42.4 3 April 2018
Declared after end of year:
2018 final fully franked dividend 27.5 54.2 2 October 2018
3.4 Significant Changes in the State of Affairs
There were no significant changes in the Group’s state of affairs during the period other than that described in section 3.5
below.
3.5 Matters Subsequent to the End of the Financial Year
Since 30 June 2018 Super Retail Group limited does not have any matters subsequent to the end of the financial year to be
disclosed.
3.6 Likely Developments and Future Prospects
Information on likely developments in the operations of the Group is set out in this report under the section Review of Financial Condition. Further information on the expected results of operations has not been included in this report because the Directors
believe it would be likely to result in unreasonable prejudice to the Group.
3.7 Environmental Regulation
The Group’s environmental obligations are regulated under State, Territory and Federal Law. The Group has an Environmental
Management System in place and a policy of complying with its environmental performance obligations. All material environmental performance obligations are monitored by the Board. No environmental breaches have been notified to the
Group during the period ended 30 June 2018.
For
per
sona
l use
onl
y

DIRECTORS’ REPORT (continued)
Super Retail Group Limited • Directors’ & Financial Reports 2018 11
4. Remuneration Report – Audited The Directors of Super Retail Group present this Remuneration Report for the period ended 30 June 2018. The Remuneration Report outlines the Group’s remuneration philosophy and practices, explains how the Group’s 2018 performance has driven
executive remuneration outcomes, and provides the details of specific remuneration arrangements that apply to Key
Management Personnel (executive KMP) in accordance with section 300A of the Corporations Act 2001 (Cth) (Corporations Act) and applicable accounting standards.
The structure of the Remuneration Report is outlined below.
Contents
Section 1 Remuneration Governance
Section 2 Key Management Personnel
Section 3 Remuneration Strategy and Policy Section 4 Executive KMP Remuneration Structure
Section 5 Non-Executive Directors Remuneration Structure
Section 6 Relationship of Remuneration to Group Performance
Section 7 Remuneration Outcomes for 2018 Section 8 Remuneration Changes for 2019
Section 9 Service Agreements
Section 10 Period of Restraint
Section 11 Additional Information Section 1: Remuneration Governance 1.1 Role of the Human Resources and Remuneration Committee
The Human Resources and Remuneration Committee (the Committee) has the delegated responsibility from the Board to
review and make recommendations to the Board in relation to the overall human resources and remuneration practices of the Company. This includes, but is not limited to, supporting and advising the Board in relation to the Company's human resources
strategy including human resource policies; remuneration policies; health and safety; talent management; and otherwise
assisting the Board to comply with legal and statutory requirements in respect of human resources and remuneration matters.
Without limiting its role, the remuneration responsibilities of the Committee include the following:
Remuneration Policy a) Reviewing and making recommendations to the Board regarding the Company’s remuneration policy objectives. b) Subject to amendment, the Committee shall have regard to the following policy objectives:
• To align remuneration policy with the achievement of Company strategy and objectives;
• To attract, retain and motivate skilled Directors and Management;
• To provide an equitable remuneration framework, providing a reasonable balance between fixed, short-term and long-term remuneration components;
• To align remuneration to individual and Company performance, including incentive programs that are challenging
and are linked to the creation of value for Shareholders;
• To align remuneration to Company values; and • To align remuneration with prudent risk taking and the Company’s long term financial soundness.
c) Reviewing and making recommendations to the Board regarding the Company’s remuneration policy including but not
limited to, in respect of: • Alignment of the Company’s remuneration framework with the Company's business strategy and objectives;
• The remuneration framework, including alignment with industry standards and trends in remuneration policy;
• The structure of short-term and long-term incentive plans, including equity plans, performance targets, and an
assessment of the effectiveness of rewarding the achievement of Company and individual objectives; • Performance based remuneration and the reduction, cancellation, or claw-back of performance based
remuneration in the event of serious misconduct or material misstatement in the financial statements;
• The broad level and nature of participation by senior executives and other management in incentive plans, including
equity plans; • The administration of an equity plan, including amendments to terms of existing equity plans and/or any trust deed
applying in relation to an equity plan; and
• Compliance with legislative and regulatory requirements.
Chief Executive Officer and Executive Director Remuneration a) Reviewing and making recommendations to the Board regarding the remuneration arrangements and terms of
appointment for the Chief Executive Officer [CEO], including contract term, annual remuneration adjustments and
participation in the Company’s short-term and long-term incentive plans. b) Reviewing and making recommendations to the Board regarding the objectives and performance assessments of the
CEO, including development plans.
c) Advising the legal and regulatory requirements, including any shareholder approvals which are necessary to obtain in
respect of Executive Director remuneration.
For
per
sona
l use
onl
y

DIRECTORS’ REPORT (continued)
12 Super Retail Group Limited • Directors’ & Financial Reports 2018
4. Remuneration Report – Audited (continued)
Senior Executive Remuneration a) Reviewing and making recommendations to the Board, having regard to the CEO’s recommendations, regarding the
remuneration arrangements and terms of appointment for senior executives, including contract term, annual
remuneration adjustments and participation in the Company’s short-term and long-term incentive plans. b) Reviewing and making recommendations to the Board regarding the objectives and performance assessments of senior
executives, including development plans.
Non-Executive Directors Remuneration a) Reviewing and making recommendations to the Board on remuneration of Non-Executive Directors of the Company,
including but not limited to Director fees, Committee fees, travel and other expense reimbursement, and other benefits.
b) Advising the legal and regulatory requirements, including any shareholder approvals which are necessary to obtain in respect of non-executive Director remuneration.
Disclosure and Reporting a) Reviewing and making recommendations to the Board in relation to disclosures applicable to the Committee’s Charter,
processes and activities during each reporting period, including but not limited to in respect of:
• The Remuneration Report for inclusion in the annual Directors’ Report;
• Diversity reporting, including as required under ASX Listing Rules and the Workplace Gender Equality Act; and
• The existence and terms of any scheme for retirement benefits (other than statutory superannuation) for Non-Executive Directors.
b) Review and facilitate shareholder engagement in relation to the Company’s remuneration policies and practices.
The Committee reviews its Charter at least once in each financial year. The Corporate Governance Statement (available in the Investor Centre, Corporate Governance section of the Group’s website at www.superretailgroup.com) provides further
information on the role of the Committee. The membership of the Committee is noted in section 1 of the Directors’ report, as is
the number of meetings and individual attendance during the period ended 30 June 2018.
1.2 Involvement of Independent Advisors
The Committee operates independently of senior executives and engages directly with remuneration consultants. The requirements for external consultants’ services are assessed annually in the context of remuneration matters that the Committee
requires to address. During 2018, external advice was received from Ernst & Young related to market remuneration
benchmarking, and market remuneration practices for remuneration structures.
No remuneration recommendations as defined by the Corporations Act 2001 were provided.
1.3 Remuneration Report approval at 2017 Annual General Meeting (AGM) The Remuneration Report for the 2017 financial year received positive shareholder support at the 2017 AGM, with 98.57% of
votes in favour of the resolution.
1.4 Gender Pay Equity The Group is committed to remunerating all employees fairly and equitably. The Group conducts annual gender pay equity
reviews that are presented to the Committee. No significant gaps were identified at the point of last review.
Section 2: Key Management Personnel (KMP) The names and titles of the Group’s KMP, being those persons having authority and responsibility for planning, directing and
controlling the activities of the entity, are set out below.
2.1 Non-Executive Directors Current: S A Pitkin Chair and Independent Non-Executive Director (appointed as Chair 23 October 2017)
R A Rowe Non-Executive Director D J Eilert Independent Non-Executive Director
L K Inman Independent Non-Executive Director
H L Mowlem Independent Non-Executive Director
P D Everingham Independent Non-Executive Director (appointed 19 December 2017)
Former: R J Wright Chair and Independent Non-Executive Director (retired 23 October 2017)
For
per
sona
l use
onl
y
DIRECTORS’ REPORT (continued)
Super Retail Group Limited • Directors’ & Financial Reports 2018 13
4. Remuneration Report – Audited (continued) 2.2 Executive Director
P A Birtles Group Managing Director and Chief Executive Officer
2.3 Other executive KMP Current: D J Burns Chief Financial Officer
E A Berchtold Managing Director – Sports Division
A M Heraghty Managing Director – Outdoor Division
C D Wilesmith Managing Director – Auto Division
Section 3: Remuneration Strategy and Policy
One of the Group’s core principles is that the attraction, development, engagement and retention of passionate team members provides a competitive advantage which is fundamental to the long term success of the Group. The maintenance of
a workplace culture and the development of people practices that support this principle are strategic priorities for the Group.
The development of people practices covers a number of areas including attraction, diversity, learning and development, engagement, workplace health and safety, talent and succession management, and remuneration and benefits.
Remuneration and benefits practices are set in the context of an overall policy to provide market competitive remuneration
arrangements which support the attraction, development, engagement and retention of passionate team members, and that are aligned with the interests of shareholders.
The Group is committed to creating a high performance culture. The philosophy is to provide flexible and competitive market based total remuneration arrangements that are linked to the performance of the Group and its businesses and support
services.
The key elements of the Remuneration Policy are: • To provide competitive total remuneration arrangements that enable the Group to attract and retain high performing
team members, and to reward them for their contribution to the success of the Group;
• To align remuneration arrangements with the delivery of sustainable value to the Group’s shareholders;
• To maintain a pay for performance environment through linking incentive pay opportunities to the achievement of specific, measurable business goals;
• To position base salaries at or around the median and performance incentives in the 3rd quartile of relevant market
remuneration levels, subject to individual performance;
• To provide gender pay equity across the Group through regular analysis and review; • To provide arrangements with the flexibility to recognise individuals based on performance, experience and qualifications;
• To provide equitable, fair and consistent pay arrangements across the Group through a systematic methodology involving
job value and market positioning;
• To align remuneration to Company values; and • To align remuneration with prudent risk taking and the Company’s long term financial soundness.
Remuneration can include a number of different elements such as base pay, superannuation, short term incentives, long term
incentives, tools of trade, study and relocation assistance, share plans and novated lease arrangements. The elements of the total remuneration package may vary according to the job role, team members’ experience and performance and market
practice. The Group Managing Director and Chief Executive Officer, and his direct reports (senior executives) are remunerated
under a Total Target Remuneration structure.
For the 2018 financial year, remuneration benchmarking for all executive KMP was sourced from Ernst & Young (EY)
Remuneration Consultants. The Board referenced two sets of comparator groups to benchmark remuneration, being:
• Market Capitalisation comparator group: S&P/ASX 200 companies within 50% to 150% of Super Retail Group’s 12 month
average market capitalisation; and
• Market Capitalisation and GICS comparator group: S&P/ASX 200 companies within the ‘Consumer Discretionary Sector’
Global Industry Classification Standard (GICS).
The intent for the 2018 financial year was to use S&P/ASX 200 companies within 50% to 150% of Super Retail Group’s 12 month
average market capitalisation as one of two referenced sets of comparator groups. However, due to sample size returning
insufficient data, EY’s assessment of the comparator groups showed that the market capitalisation (50% - 200%) comparator group included a broader set of companies which aids ongoing remuneration management and provides balance in the peer
group (between companies with larger, and those with lower, market capitalisation). For this reason, the market capitalisation
(50% - 200%) comparator group was also referenced during the 2018 financial year.
For
per
sona
l use
onl
y
DIRECTORS’ REPORT (continued)
14 Super Retail Group Limited • Directors’ & Financial Reports 2018
4. Remuneration Report – Audited (continued) Section 4: Executive KMP Remuneration Structure
The executive KMP remuneration structure is reviewed annually by the Committee against the Remuneration Policy, external remuneration practices, market expectations and regulatory standards.
The Group Managing Director and Chief Executive Officer, together with the other executive KMP, are remunerated under a
Total Target Remuneration (TTR) structure consisting of three elements: • Base Salary Package (inclusive of superannuation contributions, car allowance and other non-monetary benefits);
• Short Term Incentive (STI); and
• Long Term Incentive (LTI).
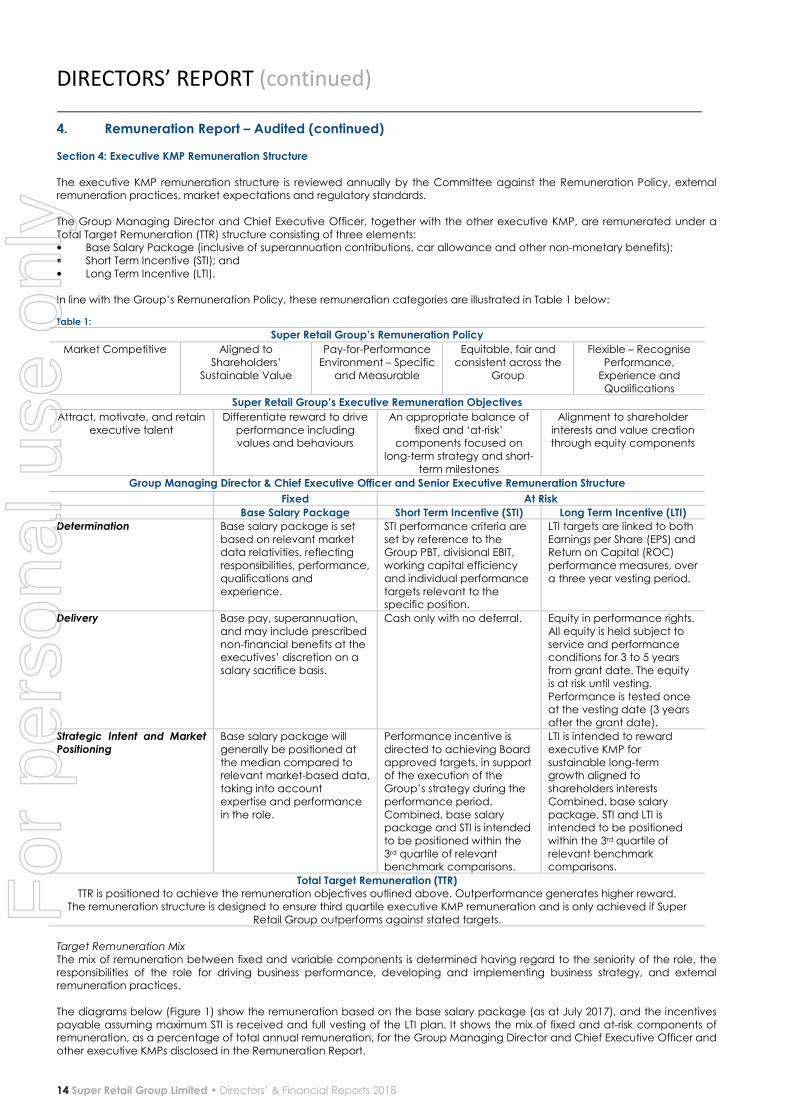
In line with the Group’s Remuneration Policy, these remuneration categories are illustrated in Table 1 below:
Table 1:
Super Retail Group’s Remuneration Policy
Market Competitive Aligned to
Shareholders’
Sustainable Value
Pay-for-Performance
Environment – Specific
and Measurable
Equitable, fair and
consistent across the
Group
Flexible – Recognise
Performance,
Experience and
Qualifications
Super Retail Group’s Executive Remuneration Objectives
Attract, motivate, and retain
executive talent
Differentiate reward to drive
performance including values and behaviours
An appropriate balance of
fixed and ‘at-risk’ components focused on
long-term strategy and short-
term milestones
Alignment to shareholder
interests and value creation through equity components
Group Managing Director & Chief Executive Officer and Senior Executive Remuneration Structure
Fixed At Risk
Base Salary Package Short Term Incentive (STI) Long Term Incentive (LTI)
Determination Base salary package is set
based on relevant market data relativities, reflecting
responsibilities, performance,
qualifications and
experience.
STI performance criteria are
set by reference to the Group PBT, divisional EBIT,
working capital efficiency
and individual performance
targets relevant to the specific position.
LTI targets are linked to both
Earnings per Share (EPS) and Return on Capital (ROC)
performance measures, over
a three year vesting period.
Delivery Base pay, superannuation,
and may include prescribed
non-financial benefits at the executives’ discretion on a
salary sacrifice basis.
Cash only with no deferral. Equity in performance rights.
All equity is held subject to
service and performance conditions for 3 to 5 years
from grant date. The equity
is at risk until vesting.
Performance is tested once at the vesting date (3 years
after the grant date).
Strategic Intent and Market
Positioning
Base salary package will
generally be positioned at
the median compared to relevant market-based data,
taking into account
expertise and performance
in the role.
Performance incentive is
directed to achieving Board
approved targets, in support of the execution of the
Group’s strategy during the
performance period.
Combined, base salary package and STI is intended
to be positioned within the
3rd quartile of relevant benchmark comparisons.
LTI is intended to reward
executive KMP for
sustainable long-term growth aligned to
shareholders interests
Combined, base salary
package, STI and LTI is intended to be positioned
within the 3rd quartile of
relevant benchmark comparisons.
Total Target Remuneration (TTR) TTR is positioned to achieve the remuneration objectives outlined above. Outperformance generates higher reward.
The remuneration structure is designed to ensure third quartile executive KMP remuneration and is only achieved if Super
Retail Group outperforms against stated targets.
Target Remuneration Mix
The mix of remuneration between fixed and variable components is determined having regard to the seniority of the role, the
responsibilities of the role for driving business performance, developing and implementing business strategy, and external remuneration practices.
The diagrams below (Figure 1) show the remuneration based on the base salary package (as at July 2017), and the incentives
payable assuming maximum STI is received and full vesting of the LTI plan. It shows the mix of fixed and at-risk components of remuneration, as a percentage of total annual remuneration, for the Group Managing Director and Chief Executive Officer and
other executive KMPs disclosed in the Remuneration Report.
For
per
sona
l use
onl
y

DIRECTORS’ REPORT (continued)
Super Retail Group Limited • Directors’ & Financial Reports 2018 15
4. Remuneration Report – Audited (continued)
Figure 1:
The LTI component is based on the notional monetary value at the time of grant. This notional valuation may differ from the
accounting valuation which considers probability of vesting and other factors.
(a) Base Salary Package
The Remuneration Policy provides executive KMP a base salary package that targets the median market base salary package
for a comparable role in a similarly sized S&P/ASX 200 company. The executive KMP’s performance, skills and experience are
also considered in determining the base salary package.
The base salary package comprises base pay and superannuation, and may include prescribed non-financial benefits at the
executives’ discretion on a salary sacrifice basis. The Group provides superannuation contributions in line with statutory
obligations.
No guaranteed base salary increases are included in any executive KMP’s service contract. Approved amendments to base
salary packages are effective from the commencement of the new financial year.
(b) Short Term Incentive (STI)
Consistent with the prior year, the 2018 STI scheme (the Scheme) for all executive KMP is based on a balanced scorecard. The Committee governs the design of the STI scheme, KPI and target setting, and holds discretion over the outcomes.
The Scheme is designed to ensure executive KMP performance is directed towards Board approved targets, in support of the
execution of the Group’s strategy. Taking a balanced scorecard approach allows executive KMP performance to be assessed in a holistic way for four key drivers of performance, namely:
• Financial (50%)
• Strategy / Business Improvement (20% - 30%)
• Customer (10% - 15%) • People (10% - 15%)
The significant weighting of financial outcomes with a minimum of 50% maintains a strong link between actual financial
performance and incentive paid. A minimum Group Profit Before Tax (PBT) of at least 90% of target must be met before any short term incentives are payable. If this level is not reached, the Scheme is deemed to be discretionary and any payment
made to executives will be at the Board’s discretion.
Setting performance levels at target and stretch is a critical element of the STI scheme. They support continuous improvement and are correlated with the overall Group target and the contribution of each executive. Accordingly, the performance
required at each “target” (100%) level, is equivalent to the budget for each available measure. The performance required at
the “Stretch” level (150%) is equivalent to the strategic plan levels for each available measure.
(i) Performance-based ‘At Risk’ Remuneration and Evaluating the Performance of executive KMPs in 2018
Variable or ‘at-risk’ remuneration forms a significant portion of the executive KMP remuneration opportunity. The purpose of
variable remuneration is to focus executives on the execution of the Group’s strategy. The key aspects are summarised in the
scheme construct shown in Table 2 below: Table 2:
Plan STI awards are made under the Super Retail Group Short Term Incentive Scheme.
Participation The Group Managing Director and Chief Executive Officer and other executive KMP are invited to participate in the Scheme.
Purpose The Scheme rewards a combination of Board approved financial and non-financial
performance measures that articulate performance expectations at both target and over-
achievement that are aligned to the creation of shareholder value.
The primary financial measure is Group PBT combined with Divisional EBIT (where appropriate). In addition, a balance of non-financial measures are included on executing
key objectives such as business improvement, customer and people, which are aligned to
the Group’s business plan.
For
per
sona
l use
onl
y
DIRECTORS’ REPORT (continued)
16 Super Retail Group Limited • Directors’ & Financial Reports 2018
4. Remuneration Report – Audited (continued)
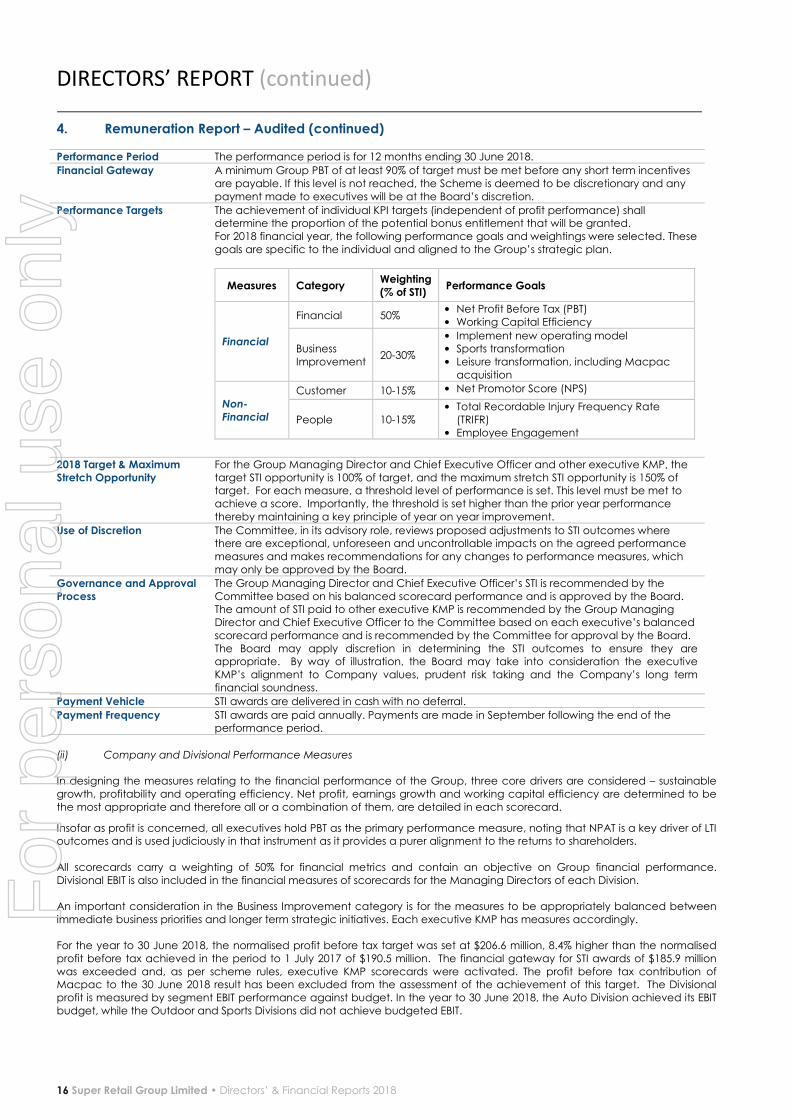
Performance Period The performance period is for 12 months ending 30 June 2018.
Financial Gateway A minimum Group PBT of at least 90% of target must be met before any short term incentives
are payable. If this level is not reached, the Scheme is deemed to be discretionary and any
payment made to executives will be at the Board’s discretion.
Performance Targets The achievement of individual KPI targets (independent of profit performance) shall determine the proportion of the potential bonus entitlement that will be granted.
For 2018 financial year, the following performance goals and weightings were selected. These
goals are specific to the individual and aligned to the Group’s strategic plan.
Measures Category Weighting (% of STI)
Performance Goals
Financial
Financial 50% • Net Profit Before Tax (PBT) • Working Capital Efficiency
Business
Improvement 20-30%
• Implement new operating model • Sports transformation
• Leisure transformation, including Macpac
acquisition
Non-
Financial
Customer 10-15% • Net Promotor Score (NPS)
People 10-15%
• Total Recordable Injury Frequency Rate (TRIFR)
• Employee Engagement
2018 Target & Maximum Stretch Opportunity
For the Group Managing Director and Chief Executive Officer and other executive KMP, the
target STI opportunity is 100% of target, and the maximum stretch STI opportunity is 150% of target. For each measure, a threshold level of performance is set. This level must be met to
achieve a score. Importantly, the threshold is set higher than the prior year performance
thereby maintaining a key principle of year on year improvement.
Use of Discretion The Committee, in its advisory role, reviews proposed adjustments to STI outcomes where there are exceptional, unforeseen and uncontrollable impacts on the agreed performance
measures and makes recommendations for any changes to performance measures, which
may only be approved by the Board.
Governance and Approval Process
The Group Managing Director and Chief Executive Officer’s STI is recommended by the
Committee based on his balanced scorecard performance and is approved by the Board. The amount of STI paid to other executive KMP is recommended by the Group Managing
Director and Chief Executive Officer to the Committee based on each executive’s balanced
scorecard performance and is recommended by the Committee for approval by the Board.
The Board may apply discretion in determining the STI outcomes to ensure they are appropriate. By way of illustration, the Board may take into consideration the executive
KMP’s alignment to Company values, prudent risk taking and the Company’s long term
financial soundness.
Payment Vehicle STI awards are delivered in cash with no deferral.
Payment Frequency STI awards are paid annually. Payments are made in September following the end of the performance period.
(ii) Company and Divisional Performance Measures
In designing the measures relating to the financial performance of the Group, three core drivers are considered – sustainable
growth, profitability and operating efficiency. Net profit, earnings growth and working capital efficiency are determined to be
the most appropriate and therefore all or a combination of them, are detailed in each scorecard.
Insofar as profit is concerned, all executives hold PBT as the primary performance measure, noting that NPAT is a key driver of LTI outcomes and is used judiciously in that instrument as it provides a purer alignment to the returns to shareholders.
All scorecards carry a weighting of 50% for financial metrics and contain an objective on Group financial performance.
Divisional EBIT is also included in the financial measures of scorecards for the Managing Directors of each Division.
An important consideration in the Business Improvement category is for the measures to be appropriately balanced between
immediate business priorities and longer term strategic initiatives. Each executive KMP has measures accordingly.
For the year to 30 June 2018, the normalised profit before tax target was set at $206.6 million, 8.4% higher than the normalised
profit before tax achieved in the period to 1 July 2017 of $190.5 million. The financial gateway for STI awards of $185.9 million
was exceeded and, as per scheme rules, executive KMP scorecards were activated. The profit before tax contribution of Macpac to the 30 June 2018 result has been excluded from the assessment of the achievement of this target. The Divisional
profit is measured by segment EBIT performance against budget. In the year to 30 June 2018, the Auto Division achieved its EBIT
budget, while the Outdoor and Sports Divisions did not achieve budgeted EBIT.
For
per
sona
l use
onl
y

DIRECTORS’ REPORT (continued)
Super Retail Group Limited • Directors’ & Financial Reports 2018 17
4. Remuneration Report – Audited (continued) (iii) Executive Performance Objectives and Outcomes for 2018 including Board Discretionary Override
Set out below are the individual KPIs and 2018 achievement for each of the executive KMP. These outcomes will be moderated because of the mistake the Company has made in its approach to store set-up projects. Accountability for this significant mistake should be reflected in remuneration outcomes for the 2018 financial year. The Group Managing Director and Chief Executive Officer has recommended, and the Board has accepted the recommendation, that the Group Managing Director and Chief Executive Officer receive no STI payment for the 2018 financial year, and the other executive KMP have their STI payments reduced by 25%.
The Board has reviewed the impact of the mistake on STI and LTI arrangements over the prior seven years and has determined
that the mistake will not have altered STI payments or LTI vesting made to KMP over those years.
The individual KPIs and 2018 achievement as determined by the Board for the Group Managing Director and Chief Executive
Officer were as per Table 3 below:
Table 3:
Measure Description of
Measure Weighting Actual Performance Range Commentary on Performance
B
elo
w
Thre
sho
ld
Thre
sho
ld
to Ta
rge
t
Targ
et
Targ
et to
Stre
tch
Stre
tch
1. Financial Measures:
Financial
Net Profit Before Tax (PBT)
35% �
In 2018, the Group’s normalised profit
before tax outcome, excluding the
impact of Macpac, was $194.1m Although this represented a 1.9% year-on-
year performance improvement, the result
was below target
Working Capital Efficiency
15% �
This is a good result for the Group representing a 12.5% improvement in
average net inventory (excluding
Macpac) due to strong inventory
management execution in Auto and Outdoor offset by a softer performance
from the Sports division
Business Improvement
Implement new
operating model
20%
�
Board endorsed operating model,
implementation captured in budgets for
2019
AMART re-
branding �
Rebranding of all Amart stores within the
agreed timeframe (before 1st November)
and within the approved capex budget
Leisure
transformation � Board endorsed value creation strategy
for Rays transformation, Macpac acquisition delivered
2. Non-Financial Measures:
Customer
Customer
Centricity - Net
Promotor Score (NPS) 15%
� NPS result represents a significant
improvement of 8.2% year-on-year
Omni Retail
Customer Offer �
Board endorsed business case for omni-
retail customer experience, deliver project
and commercial milestones per plan
People
Total Recordable Injury Frequency
Rate (TRIFR)
15%
� TRIFR result represents a significant
improvement of 21.2% year-on-year
Level of Employee Engagement
�
Engagement levels marginally declined
year-on-year, but maintains top quartile engagement performance for Australian /
New Zealand companies
The overall outcome for the Group Managing Director and Chief Executive Officer was assessed by the Board to be a
performance level of 62%, driven by outperformance in the Business Improvement, Customer, and Safety measures and
impacted by underperformance in PBT and the stable result in the Employee Engagement score. As a point of calibration, in
the 2018 financial year, the Group’s normalised profit before tax outcome, excluding the impact of Macpac, was $194.1 million. Although this result represented a 1.9% year-on-year performance improvement, it was below the target by 6.1%.
A scorecard outcome of 62% is a below target ($1,000,000) outcome which would have resulted in a payment of $620,000. As explained above no STI payment will be made to the Group Managing Director and Chief Executive Officer for the 2018 financial year.
For
per
sona
l use
onl
y

DIRECTORS’ REPORT (continued)
18 Super Retail Group Limited • Directors’ & Financial Reports 2018
4. Remuneration Report – Audited (continued)
The individual KPIs and 2018 achievement as determined by the Board for the other executive KMP were as per Table 4 below:
Table 4:
Name
Company Measures
Financial (50%)
Business Improvement (20%) Customer (15%) People (15%) STI Total %
D J Burns Threshold to Target Target to Stretch Target to Stretch Target to Stretch 75%
E A Berchtold Below Threshold Target to Stretch Target to Stretch Threshold to Target 58%
A M Heraghty Threshold to target Target to Stretch Target to Stretch Target to Stretch 88%
C D Wilesmith Threshold to Target Threshold to Target Target to Stretch Target to Stretch 66%
As explained above the other executive KMP have had their STI reduced by 25%. These outcomes are reflected in Table 9 and
Figure 4.
In considering the 2018 achievements for the other executive KMP and STI outcomes, the following is noted: • Position to Market – As a result of the 25% reduction, the collective outcomes will position the executive KMP (excluding
the Group Managing Director and Chief Executive Officer) at between the first quartile and the median for awarded STI
(market capitalization comparator group).
In the 2018 financial year no portion of the STI award was deferred into equity, because of the Board’s assessment that:
• The nature of the business is one where revenue is not dependent on long term contracts;
• The Group has a strong risk management framework; and • STI payment arrangements are reasonable and the Group can demonstrate a clear link between STI payments and the
Group performance over a number of years.
However, the Committee is reviewing whether a deferral of a portion of STI into equity may be appropriate in the future.
(c) Long Term Incentive (LTI)
The Group’s remuneration structure aims to align long term incentives for executive KMPs and other executives with the delivery
of sustainable value to shareholders. The alignment of interests is important in ensuring that executive KMPs and other
executives are focused on delivering sustainable returns to shareholders, whilst allowing the Group to attract and retain executives of a high calibre.
In October 2009, the Group’s shareholders approved the establishment of the Super Retail Group Limited Performance Rights
Plan (Plan). The Plan is an at-risk component of executive remuneration under which an equity award may be provided to
executives based on the achievement of specific performance measures, linking the long-term remuneration of executive KMP
and other executives with the economic benefit derived by shareholders over a three to five year performance period. Participation in the Plan is by invitation only as determined by the Board. The key attributes of the Group’s LTI Plan are provided
in Table 5 below:
Table 5:
Plan LTI awards are granted under the Super Retail Group Employee Performance Rights Plan.
Participation The Plan allows for the annual grant of Performance Rights to executive KMP and other executives.
Purpose The Plan aligns executive remuneration with the creation of shareholder value. This is achieved through the use of both normalised Earnings Per Share (EPS) Compound Annual Growth and Return
on Capital (ROC). The Plan has also been designed to act as a retention mechanism, and to
encourage executive KMP and other executives to build and retain the Group’s shares over the
long term. The Super Retail Employee Performance Rights Plan Rules are available on the Group’s website.
LTI Instrument Performance Rights are granted by the Group for nil consideration. Each performance right is a
right to receive a fully-paid ordinary share at no cost if service-based and performance-based
vesting conditions are met.
Allocation Methodology
The number of Performance Rights granted to each executive KMP is determined in accordance with the Executive Remuneration Structure outlined above, and have a value of between 50% and
100% of their base salary package. The notional value of Performance Rights granted to executive
KMP and other executives is determined on a face value basis using the volume weighted average
price (VWAP) for Super Retail Group shares traded on the ASX on the five trading days from, and including the release of the Group’s results for the preceding reporting period. The value of
Performance Rights for grant purposes may differ from the accounting valuation which considers
probability of vesting and other factors.
Performance Period The performance period is three years commencing on 1 July in the year the award is made. For the 2018 awards, this is the three year period from 1 July 2018 to 30 June 2021.
For
per
sona
l use
onl
y

DIRECTORS’ REPORT (continued)
Super Retail Group Limited • Directors’ & Financial Reports 2018 19
4. Remuneration Report – Audited (continued)
Performance Hurdles and Vesting Schedules
Equity grants to executive KMP and other executives are in two equal tranches of 50% to growth in
EPS and 50% to averaged ROC. The performance conditions are:
Measure Normalised EPS CAGR Averaged ROC
Weight 50% 50%
Nature Growth of Group Group Absolute
Performance Zone
(Threshold to Maximum)
10% to 15% compound annual
growth
12% to 15% annual average
Payout Below threshold (<10%):
0% of elements vested
Threshold (10%):
50% of elements vested Maximum of above (15%):
100% of elements vested
Straight-line vesting:
Between threshold (10%) and maximum (15%)
Below threshold (<12%):
0% of elements vested
Threshold (12%):
50% of elements vested Maximum of above (15%):
100% of elements vested
Straight-line vesting:
Between threshold (12%) and maximum (15%)
Performance Period If the performance conditions are satisfied within the Performance
Period, the Performance Rights will vest over the subsequent years in
accordance with the following schedule:
Time after grant of
Performance Rights:
3 years
4 years 5 years
Percentage of Performance
Rights that vest:
50%
25% 25%
Under these performance hurdles, for the plan to achieve 100% vesting, the cumulative EPS growth
must be at least 15%, and ROC must average at least 15%.
For performance rights granted since 2016 the averaged ROC performance hurdle has changed as follows:
• If the averaged ROC is 10%, then 30% of the Performance Rights will be available to vest;
• If the averaged ROC is 12%, then 50% of the Performance Rights will be available to vest; or
• If the averaged ROC is 15%, then 100% of the Performance Rights will be available to vest. Performance Rights will vest on a pro rata basis between these averaged ROC ranges.
Testing and Time Restrictions
At the end of three financial years, equity grants are tested against the performance hurdles set. If
the performance hurdles are not met at the vesting date, the Performance Rights will lapse. There is
no retesting of performance hurdles under the Plan.
Dividends and Voting Rights
Performance Rights do not carry voting or dividend rights.
Hedging Arrangements
Participating executives are prohibited from entering into any hedging arrangements in relation to
Performance Rights.
Clawback Policy The Group implemented a Clawback Policy within the Employee Performance Rights Plan to meet
good governance practice. The plan document is available on the Group’s website. There have been no circumstances to date where the policy was invoked.
Termination Provisions Executive KMP must be employed at the time of vesting to receive the allotment of shares. The
Board has discretion to amend the employment requirement based on the circumstances
associated with the executive KMP and other executives leaving. The Board plans to exercise its
discretion where an employee leaves due to retirement, retrenchment or redundancy, or termination by mutual consent. The employee may retain entitlement to a portion of the
Performance Rights pro-rated to reflect the period of service from the start of the Performance
Period to the date of departure. After the employees’ departure the Performance Rights would
only be available to vest to the extent that the performance conditions are met. Where an employee leaves due to resignation or termination with cause, all unvested Performance Rights will
lapse.
Change of Control Provisions
Any unvested Performance Rights may vest at the Board’s discretion, having regard to pro-rated
performance.
The Plan allows for the annual grant of Performance Rights to executive KMP and other executives. The grant of Performance
Rights entitles the executive to be granted an equivalent number of shares upon vesting of those Performance Rights. The vesting of Performance Rights is subject to the satisfaction of performance conditions and service conditions as detailed in the
Super Retail Employee Performance Rights Plan Rules and can be viewed in the Investor Centre, Corporate Governance
section of the Group’s website, www.superretailgroup.com.
Section 5: Non-Executive Directors Remuneration Structure
The Group’s remuneration strategy is designed to attract and retain experienced, qualified Non-Executive Directors and to
remunerate appropriately to reflect the demands which are made on them and the responsibilities of the position. Non-Executive Directors receive fees to recognise their contribution to the work of the Board and the associated Committees that
they serve.
For
per
sona
l use
onl
y
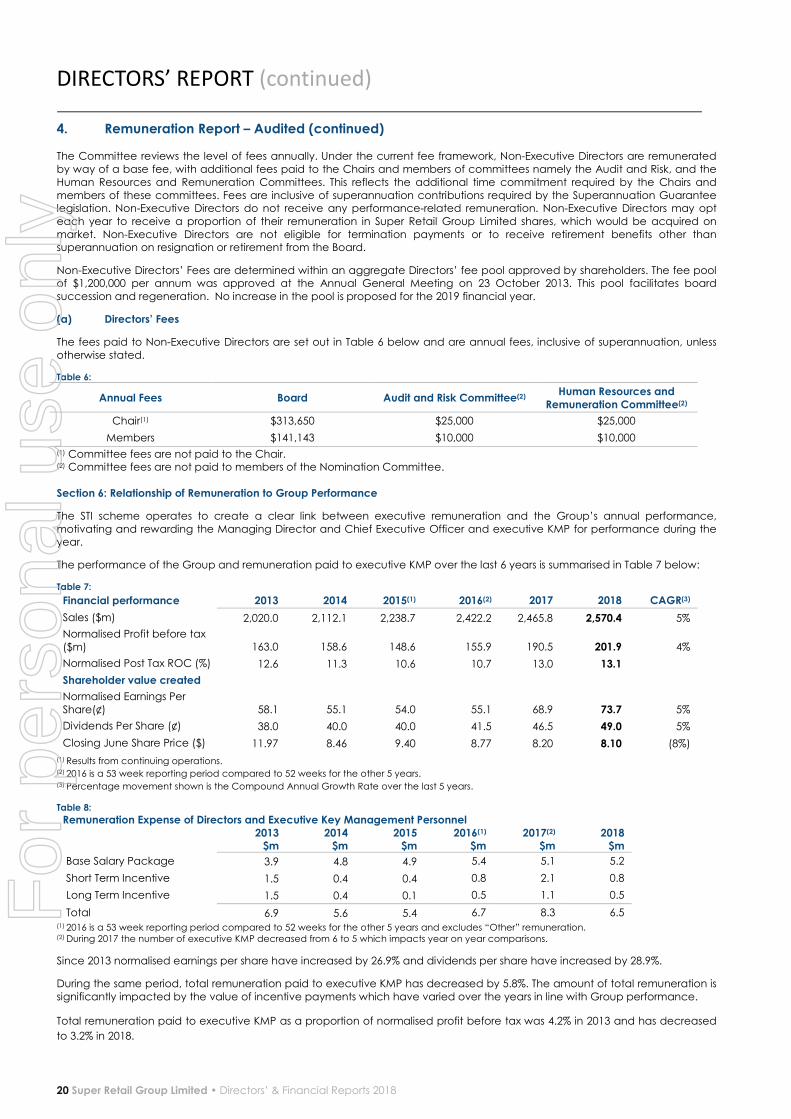
DIRECTORS’ REPORT (continued)
20 Super Retail Group Limited • Directors’ & Financial Reports 2018
4. Remuneration Report – Audited (continued) The Committee reviews the level of fees annually. Under the current fee framework, Non-Executive Directors are remunerated
by way of a base fee, with additional fees paid to the Chairs and members of committees namely the Audit and Risk, and the
Human Resources and Remuneration Committees. This reflects the additional time commitment required by the Chairs and
members of these committees. Fees are inclusive of superannuation contributions required by the Superannuation Guarantee legislation. Non-Executive Directors do not receive any performance-related remuneration. Non-Executive Directors may opt
each year to receive a proportion of their remuneration in Super Retail Group Limited shares, which would be acquired on
market. Non-Executive Directors are not eligible for termination payments or to receive retirement benefits other than superannuation on resignation or retirement from the Board.
Non-Executive Directors’ Fees are determined within an aggregate Directors’ fee pool approved by shareholders. The fee pool of $1,200,000 per annum was approved at the Annual General Meeting on 23 October 2013. This pool facilitates board
succession and regeneration. No increase in the pool is proposed for the 2019 financial year.
(a) Directors’ Fees
The fees paid to Non-Executive Directors are set out in Table 6 below and are annual fees, inclusive of superannuation, unless
otherwise stated.
Table 6:
Annual Fees Board Audit and Risk Committee(2) Human Resources and
Remuneration Committee(2)
Chair(1) $313,650 $25,000 $25,000
Members $141,143 $10,000 $10,000
(1) Committee fees are not paid to the Chair. (2) Committee fees are not paid to members of the Nomination Committee.
Section 6: Relationship of Remuneration to Group Performance
The STI scheme operates to create a clear link between executive remuneration and the Group’s annual performance,
motivating and rewarding the Managing Director and Chief Executive Officer and executive KMP for performance during the year.
The performance of the Group and remuneration paid to executive KMP over the last 6 years is summarised in Table 7 below:
Table 7:
Financial performance 2013 2014 2015(1) 2016(2) 2017 2018 CAGR(3)
Sales ($m) 2,020.0 2,112.1 2,238.7 2,422.2 2,465.8 2,570.4 5%
Normalised Profit before tax
($m) 163.0 158.6 148.6 155.9 190.5 201.9 4%
Normalised Post Tax ROC (%) 12.6 11.3 10.6 10.7 13.0 13.1
Shareholder value created
Normalised Earnings Per
Share(¢) 58.1 55.1 54.0 55.1 68.9 73.7 5%
Dividends Per Share (¢) 38.0 40.0 40.0 41.5 46.5 49.0 5%
Closing June Share Price ($) 11.97 8.46 9.40 8.77 8.20 8.10 (8%)
(1) Results from continuing operations. (2) 2016 is a 53 week reporting period compared to 52 weeks for the other 5 years. (3) Percentage movement shown is the Compound Annual Growth Rate over the last 5 years.
Table 8:
Remuneration Expense of Directors and Executive Key Management Personnel
2013 $m
2014 $m
2015 $m
2016(1) $m
2017(2) $m
2018 $m
Base Salary Package 3.9 4.8 4.9 5.4 5.1 5.2
Short Term Incentive 1.5 0.4 0.4 0.8 2.1 0.8
Long Term Incentive 1.5 0.4 0.1 0.5 1.1 0.5
Total 6.9 5.6 5.4 6.7 8.3 6.5 (1) 2016 is a 53 week reporting period compared to 52 weeks for the other 5 years and excludes “Other” remuneration. (2) During 2017 the number of executive KMP decreased from 6 to 5 which impacts year on year comparisons.
Since 2013 normalised earnings per share have increased by 26.9% and dividends per share have increased by 28.9%.
During the same period, total remuneration paid to executive KMP has decreased by 5.8%. The amount of total remuneration is
significantly impacted by the value of incentive payments which have varied over the years in line with Group performance.
Total remuneration paid to executive KMP as a proportion of normalised profit before tax was 4.2% in 2013 and has decreased
to 3.2% in 2018.
For
per
sona
l use
onl
y

DIRECTORS’ REPORT (continued)
Super Retail Group Limited • Directors’ & Financial Reports 2018 21
4. Remuneration Report – Audited (continued) Executive KMP STI paid compared to EPS over the last 6 financial years: Figure 2:
Executive KMP LTI expense compared to EPS over the last 6 financial years: Figure 3:
For
per
sona
l use
onl
y

DIRECTORS’ REPORT (continued)
22 Super Retail Group Limited • Directors’ & Financial Reports 2018
4. Remuneration Report – Audited (continued)
Section 7: Remuneration Outcomes for 2018
Details of the remuneration of the Directors and executive KMP of the Group are set out in Table 9 below:
Table 9:
2018
Short-term Benefits Post-
employment Share-based
Name
Cash salary
and fees Cash bonus
Non- monetary benefits
Super- annuation
Performance Rights
Other (1)
Total
$ $ $ $ $ $ $
Non-Executive S A Pitkin(2) 252,928 - - 18,857 - - 271,785 R A Rowe 118,761 - - 22,382 - - 141,143 D J Eilert 147,162 - - 13,980 - - 161,142 L K Inman(3) 176,143 - - - - - 176,143 H L Mowlem(4) 156,944 - - 14,910 - - 171,854 P D Everingham(5) 68,911 - - 6,547 - - 75,458 R J Wright(6) 97,867 - - 7,337 - - 105,204
Subtotal 1,018,716 - - 84,013 - - 1,102,729 Executive Director P A Birtles 1,230,911 - 3,640 20,049 241,391 7,789. 1,503,780 Other executive KMP D J Burns 637,851 168,750 - 20,049 65,598 4,077. 896,325 E A Berchtold(7) 629,072 195,750 4,154 20,049 76,400 (21,740). 903,685 A M Heraghty 738,343 254,100 11,608 20,049 83,716 43,687. 1,151,503 C D Wilesmith 631,951 222,750 48,000 20,049 76,044 (7,019) 991,775
Subtotal 3,868,128 841,350 67,402 100,245 543,149 26,794. 5,447,068 Total 4,886,844 841,350 67,402 184,258 543,149 26,794. 6,549,797
2017
Short-term Benefits Post-
employment Share-based
Name
Cash salary
and fees Cash bonus
Non- monetary benefits
Super- annuation
Performance Rights
Other (1)
Total
$ $ $ $ $ $ $
Non-Executive S A Pitkin 158,333 - - 15,042 - - 173,375
R A Rowe 104,074 - - 34,301 - - 138,375
D J Eilert 144,635 - - 13,740 - - 158,375
L K Inman(3) 168,657 - - - - - 168,657
H L Mowlem(4) 7,296 - - 693 - - 7,989
R J Wright 287,884 - - 19,616 - - 307,500
R J Skippen(8) 52,778 - - 5,014 - - 57,792
Subtotal 923,657 - - 88,406 - - 1,012,063
Executive Director P A Birtles 1,206,744 844,600 3,640 19,616 418,069 (7,335) 2,485,334
Other executive KMP
D J Burns 625,384 272,500 - 19,616 122,121 10,471 1,050,092
E A Berchtold 635,384 331,100 30,000 19,616 163,274 (7,049) 1,172,325
A M Heraghty 648,351 279,000 102,033 19,616 222,476 (12,566) 1,258,910
C D Wilesmith 612,384 428,000 48,000 19,616 159,488 50,022 1,317,510
G G Carroll(9) 28,886 - - 3,989 - - 32,875
Subtotal 3,757,133 2,155,200 183,673 102,069 1,085,428 33,543 7,317,046
Total 4,680,790 2,155,200 183,673 190,475 1,085,428 33,543 8,329,109 (1) Includes accruals for annual leave and long service leave entitlements. (2) S A Pitkin commenced as Board Chair on 23 October 2017. (3) L K Inman commenced as Chair of the Audit & Risk Committee from 24 October 2016, ceased as Chair on 23 October 2017, and subsequently
commenced as Chair of the Human Resources & Remuneration Committee from 23 October 2017. (4) H L Mowlem commenced as Director on 13 June 2017, and commenced as Chair of the Audit & Risk Committee from 23 October 2017. (5) P D Everingham commenced as Director on 19 December 2017. (6) R J Wright retired at the conclusion of the 2017 Annual General Meeting on 23 October 2017. (7) E A Berchtold adjusted cash salary is reflective of a period of unpaid leave taken during the 2018 financial year. (8) R J Skippen retired effective 24 October 2016. (9) G G Carroll resigned effective 22 July 2016 and ceased as executive KMP on this date.
For
per
sona
l use
onl
y

DIRECTORS’ REPORT (continued)
Super Retail Group Limited • Directors’ & Financial Reports 2018 23
4. Remuneration Report – Audited (continued)
Figure 4 reflects the final value of STI paid to KMP in the 2018 financial year.
Figure 4:
Remuneration related to performance Both STI and LTI are awarded based on performance. The achievement rates of both STI and LTI are detailed below, indicating
the relative proportions paid and forfeited.
(i) Short Term Incentives
STI is dependent on the satisfaction of performance conditions as set out in Section 4(b). The 2018 STI payment was awarded on
13 August 2018. No part of the STI payments are payable in future years.
The Committee reviewed the performance objectives and weightings for 2018 to ensure continued alignment with the Group’s strategy.
(ii) Long Term Incentives
LTI is dependent on the satisfaction of performance conditions and service conditions as set out in Section 4(c). Vesting Outcomes for LTI Performance Rights Granted for the 2014 to 2016 financial periods Table 10:
Grant Date Financial Results
determining vesting EPS 3 Year
CAGR Vested Forfeited
ROC Averaged
Vested Forfeited
September 2013 June 2016 1.7% nil 100% 10.9% nil 100%
September 2014 June 2017 7.7% nil 100% 11.4% nil 100%
September 2015 June 2018 10.9% 29.5% 20.5% 12.2% 26.7% 23.3%
For
per
sona
l use
onl
y

DIRECTORS’ REPORT (continued)
24 Super Retail Group Limited • Directors’ & Financial Reports 2018
4. Remuneration Report – Audited (continued) Performance Rights over equity instruments of Super Retail Group Limited The movement during the reporting period in the number of performance rights over ordinary shares in the Company held
directly or indirectly or beneficially, by each executive KMP, including their related parties is as per Table 11 below:
Table 11:
Held at 1 July 2017 Granted(1) Vested
Other Changes(2)
Held at 30 June 2018(3)
Value of Performance Rights granted in year
Financial year in which grant vests
2018 Number Number Number Number Number $ Year
P A Birtles
2015 100,000 - - (100,000) - n/a 2018, 2019, 2020
2016(4) 104,516 - - - 104,516 n/a 2019, 2020, 2021
2017 117,031 - - - 117,031 n/a 2020, 2021, 2022
2018 - 156,433 - - 156,433 997,925 2021, 2022, 2023
D J Burns
2015 32,017 - - (32,017) - n/a 2018, 2019, 2020
2016(4) 34,994 - - - 34,994 n/a 2019, 2020, 2021
2017 30,685 - - - 30,685 n/a 2020, 2021, 2022
2018 - 50,860 - - 50,860 324,449 2021, 2022, 2023
E A Berchtold
2015 37,519 - - (37,519) - n/a 2018, 2019, 2020
2016(4) 45,291 - - - 45,291 n/a 2019, 2020, 2021
2017 40,554 - - - 40,554 n/a 2020, 2021, 2022
2018 - 54,114 - - 54,114 345,207 2021, 2022, 2023
A M Heraghty
2016(4) 52,258 - - - 52,258 n/a 2019, 2020, 2021
2017 45,586 - - - 45,586 n/a 2020, 2021, 2022
2018 - 59,526 - - 59,526 379,731 2021, 2022, 2023
C D Wilesmith
2015 35,859 - - (35,859) - n/a 2018, 2019, 2020
2016(4) 43,897 - - - 43,897 n/a 2019, 2020, 2021
2017 39,666 - - - 39,666 n/a 2020, 2021, 2022
2018 - 54,114 - - 54,114 345,207 2021, 2022, 2023 (1) Performance Rights provided as remuneration to each of the executive KMP of the Group during the financial year. (2) Other changes represent Performance Rights that lapsed or were forfeited during the financial year. (3) The maximum possible total financial value in future years is dependent on the Group share price at exercise date, the minimum possible total
value is nil. (4) These performance rights will partially vest with the announcement of the June 2018 financial results.
The Performance Rights granted in the current reporting period were valued for the purpose of the financial statements using a
fair value of $6.38. The Performance Rights are expensed over a five year period in line with the vesting conditions of the
Performance Rights; refer to Section 4(c), for details of these vesting conditions. Performance Rights are granted using a face
value methodology. Plan participants may not enter into any transaction designed to remove the at risk aspect of the Performance Rights before they vest. The value at exercise date for Performance Rights is the Group share price. There are no
amounts unpaid on the shares issued as a result of the exercise of the options in the 2018 financial year.
Option over equity instruments of Super Retail Group Limited No Options were granted or vested during the financial year.
Section 8: Remuneration Changes for 2019 (a) Approach for 2019 In the 2019 year, the Committee will continue to assess all elements of executive KMP total reward to achieve continuing alignment to the Group’s remuneration objectives (refer to Table 1).
(b) Total Reward Structure – Group Managing Director and Chief Executive Officer The Board has reviewed the total reward structure for Group Managing Director and Chief Executive Officer and determined
there will be no changes for the 2019 financial year.
(c) Total Reward Structure - executive KMP This year, the comparator benchmarks show that overall executive KMP base salary package and short term incentive
packages for the 2019 year will be at market median with individual executive KMP base salary and short term incentive
packages varying from 96% to 110% of the respective market median. Overall executive KMP base salary packages will increase by 1.3% in the 2019 year.
For
per
sona
l use
onl
y
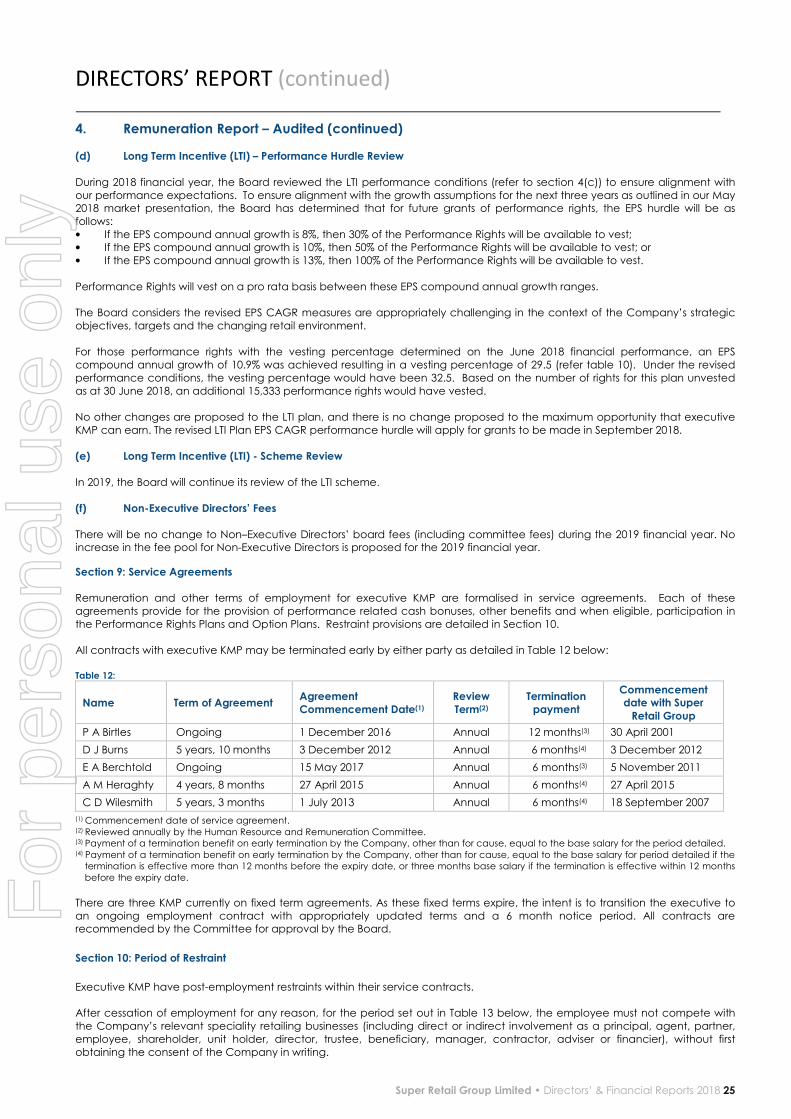
DIRECTORS’ REPORT (continued)
Super Retail Group Limited • Directors’ & Financial Reports 2018 25
4. Remuneration Report – Audited (continued) (d) Long Term Incentive (LTI) – Performance Hurdle Review During 2018 financial year, the Board reviewed the LTI performance conditions (refer to section 4(c)) to ensure alignment with
our performance expectations. To ensure alignment with the growth assumptions for the next three years as outlined in our May 2018 market presentation, the Board has determined that for future grants of performance rights, the EPS hurdle will be as
follows:
• If the EPS compound annual growth is 8%, then 30% of the Performance Rights will be available to vest; • If the EPS compound annual growth is 10%, then 50% of the Performance Rights will be available to vest; or
• If the EPS compound annual growth is 13%, then 100% of the Performance Rights will be available to vest.
Performance Rights will vest on a pro rata basis between these EPS compound annual growth ranges.
The Board considers the revised EPS CAGR measures are appropriately challenging in the context of the Company’s strategic
objectives, targets and the changing retail environment.
For those performance rights with the vesting percentage determined on the June 2018 financial performance, an EPS
compound annual growth of 10.9% was achieved resulting in a vesting percentage of 29.5 (refer table 10). Under the revised
performance conditions, the vesting percentage would have been 32.5. Based on the number of rights for this plan unvested
as at 30 June 2018, an additional 15,333 performance rights would have vested.
No other changes are proposed to the LTI plan, and there is no change proposed to the maximum opportunity that executive
KMP can earn. The revised LTI Plan EPS CAGR performance hurdle will apply for grants to be made in September 2018.
(e) Long Term Incentive (LTI) - Scheme Review
In 2019, the Board will continue its review of the LTI scheme. (f) Non-Executive Directors’ Fees There will be no change to Non–Executive Directors’ board fees (including committee fees) during the 2019 financial year. No increase in the fee pool for Non-Executive Directors is proposed for the 2019 financial year.
Section 9: Service Agreements Remuneration and other terms of employment for executive KMP are formalised in service agreements. Each of these
agreements provide for the provision of performance related cash bonuses, other benefits and when eligible, participation in
the Performance Rights Plans and Option Plans. Restraint provisions are detailed in Section 10.
All contracts with executive KMP may be terminated early by either party as detailed in Table 12 below:
Table 12:
Name Term of Agreement Agreement Commencement Date(1)
Review Term(2)
Termination payment
Commencement date with Super
Retail Group
P A Birtles Ongoing 1 December 2016 Annual 12 months(3) 30 April 2001
D J Burns 5 years, 10 months 3 December 2012 Annual 6 months(4) 3 December 2012
E A Berchtold Ongoing 15 May 2017 Annual 6 months(3) 5 November 2011
A M Heraghty 4 years, 8 months 27 April 2015 Annual 6 months(4) 27 April 2015
C D Wilesmith 5 years, 3 months 1 July 2013 Annual 6 months(4) 18 September 2007
(1) Commencement date of service agreement. (2) Reviewed annually by the Human Resource and Remuneration Committee. (3) Payment of a termination benefit on early termination by the Company, other than for cause, equal to the base salary for the period detailed. (4) Payment of a termination benefit on early termination by the Company, other than for cause, equal to the base salary for period detailed if the
termination is effective more than 12 months before the expiry date, or three months base salary if the termination is effective within 12 months
before the expiry date.
There are three KMP currently on fixed term agreements. As these fixed terms expire, the intent is to transition the executive to
an ongoing employment contract with appropriately updated terms and a 6 month notice period. All contracts are recommended by the Committee for approval by the Board.
Section 10: Period of Restraint
Executive KMP have post-employment restraints within their service contracts.
After cessation of employment for any reason, for the period set out in Table 13 below, the employee must not compete with
the Company’s relevant speciality retailing businesses (including direct or indirect involvement as a principal, agent, partner,
employee, shareholder, unit holder, director, trustee, beneficiary, manager, contractor, adviser or financier), without first
obtaining the consent of the Company in writing.
For
per
sona
l use
onl
y
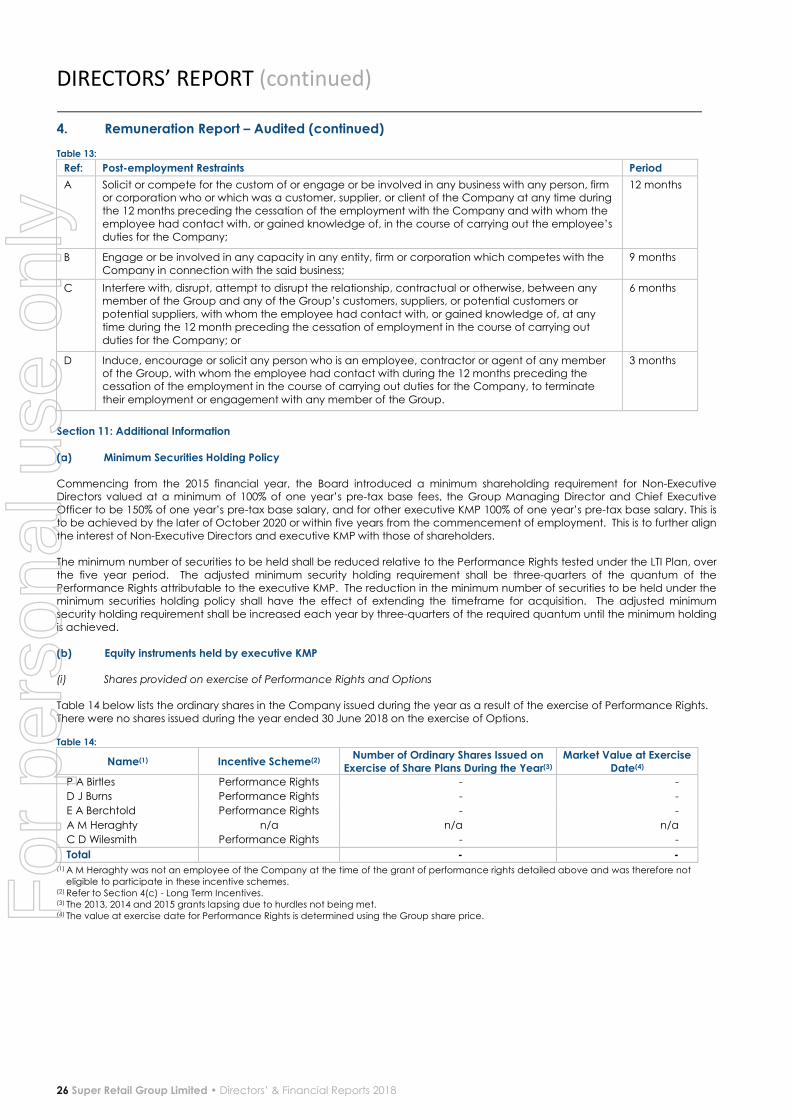
DIRECTORS’ REPORT (continued)
26 Super Retail Group Limited • Directors’ & Financial Reports 2018
4. Remuneration Report – Audited (continued) Table 13:
Ref: Post-employment Restraints Period
A Solicit or compete for the custom of or engage or be involved in any business with any person, firm or corporation who or which was a customer, supplier, or client of the Company at any time during
the 12 months preceding the cessation of the employment with the Company and with whom the
employee had contact with, or gained knowledge of, in the course of carrying out the employee’s
duties for the Company;
12 months
B Engage or be involved in any capacity in any entity, firm or corporation which competes with the
Company in connection with the said business;
9 months
C Interfere with, disrupt, attempt to disrupt the relationship, contractual or otherwise, between any member of the Group and any of the Group’s customers, suppliers, or potential customers or
potential suppliers, with whom the employee had contact with, or gained knowledge of, at any
time during the 12 month preceding the cessation of employment in the course of carrying out
duties for the Company; or
6 months
D Induce, encourage or solicit any person who is an employee, contractor or agent of any member of the Group, with whom the employee had contact with during the 12 months preceding the cessation of the employment in the course of carrying out duties for the Company, to terminate
their employment or engagement with any member of the Group.
3 months
Section 11: Additional Information (a) Minimum Securities Holding Policy
Commencing from the 2015 financial year, the Board introduced a minimum shareholding requirement for Non-Executive Directors valued at a minimum of 100% of one year’s pre-tax base fees, the Group Managing Director and Chief Executive
Officer to be 150% of one year’s pre-tax base salary, and for other executive KMP 100% of one year’s pre-tax base salary. This is
to be achieved by the later of October 2020 or within five years from the commencement of employment. This is to further align
the interest of Non-Executive Directors and executive KMP with those of shareholders.
The minimum number of securities to be held shall be reduced relative to the Performance Rights tested under the LTI Plan, over
the five year period. The adjusted minimum security holding requirement shall be three-quarters of the quantum of the
Performance Rights attributable to the executive KMP. The reduction in the minimum number of securities to be held under the minimum securities holding policy shall have the effect of extending the timeframe for acquisition. The adjusted minimum
security holding requirement shall be increased each year by three-quarters of the required quantum until the minimum holding
is achieved.
(b) Equity instruments held by executive KMP
(i) Shares provided on exercise of Performance Rights and Options
Table 14 below lists the ordinary shares in the Company issued during the year as a result of the exercise of Performance Rights.
There were no shares issued during the year ended 30 June 2018 on the exercise of Options. Table 14:
Name(1) Incentive Scheme(2) Number of Ordinary Shares Issued on
Exercise of Share Plans During the Year(3) Market Value at Exercise
Date(4)
P A Birtles Performance Rights - -
D J Burns Performance Rights - -
E A Berchtold Performance Rights - -
A M Heraghty n/a n/a n/a
C D Wilesmith Performance Rights - -
Total - - (1) A M Heraghty was not an employee of the Company at the time of the grant of performance rights detailed above and was therefore not
eligible to participate in these incentive schemes. (2) Refer to Section 4(c) - Long Term Incentives. (3) The 2013, 2014 and 2015 grants lapsing due to hurdles not being met. (4) The value at exercise date for Performance Rights is determined using the Group share price.
For
per
sona
l use
onl
y
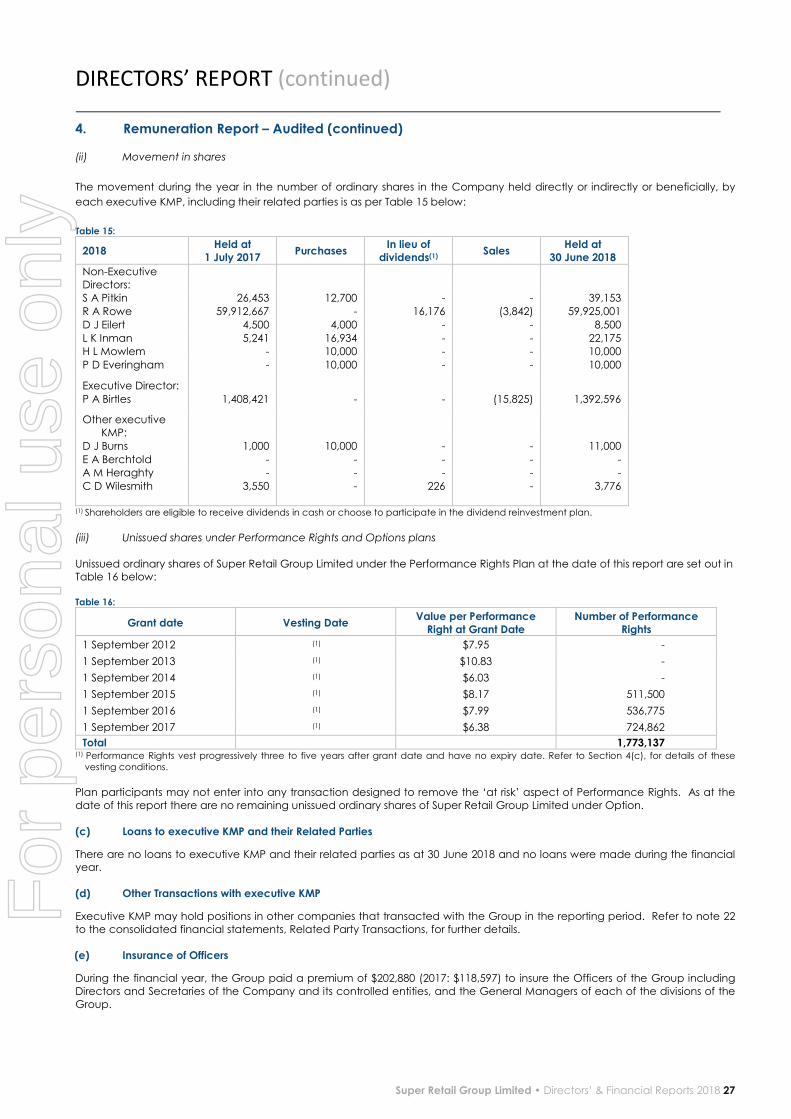
DIRECTORS’ REPORT (continued)
Super Retail Group Limited • Directors’ & Financial Reports 2018 27
4. Remuneration Report – Audited (continued) (ii) Movement in shares
The movement during the year in the number of ordinary shares in the Company held directly or indirectly or beneficially, by
each executive KMP, including their related parties is as per Table 15 below:
Table 15:
2018 Held at
1 July 2017 Purchases
In lieu of dividends(1)
Sales Held at
30 June 2018
Non-Executive
Directors:
S A Pitkin 26,453 12,700 - - 39,153
R A Rowe 59,912,667 - 16,176 (3,842) 59,925,001
D J Eilert 4,500 4,000 - - 8,500
L K Inman 5,241 16,934 - - 22,175
H L Mowlem - 10,000 - - 10,000
P D Everingham - 10,000 - - 10,000
Executive Director:
P A Birtles 1,408,421 - - (15,825) 1,392,596 Other executive
KMP:
D J Burns 1,000 10,000 - - 11,000
E A Berchtold - - - - -
A M Heraghty - - - - -
C D Wilesmith 3,550 - 226 - 3,776
(1) Shareholders are eligible to receive dividends in cash or choose to participate in the dividend reinvestment plan.
(iii) Unissued shares under Performance Rights and Options plans
Unissued ordinary shares of Super Retail Group Limited under the Performance Rights Plan at the date of this report are set out in Table 16 below:
Table 16:
Grant date Vesting Date Value per Performance
Right at Grant Date Number of Performance
Rights
1 September 2012 (1) $7.95 -
1 September 2013 (1) $10.83 -
1 September 2014 (1) $6.03 -
1 September 2015 (1) $8.17 511,500
1 September 2016 (1) $7.99 536,775
1 September 2017 (1) $6.38 724,862
Total 1,773,137 (1) Performance Rights vest progressively three to five years after grant date and have no expiry date. Refer to Section 4(c), for details of these
vesting conditions.
Plan participants may not enter into any transaction designed to remove the ‘at risk’ aspect of Performance Rights. As at the
date of this report there are no remaining unissued ordinary shares of Super Retail Group Limited under Option.
(c) Loans to executive KMP and their Related Parties
There are no loans to executive KMP and their related parties as at 30 June 2018 and no loans were made during the financial year.
(d) Other Transactions with executive KMP
Executive KMP may hold positions in other companies that transacted with the Group in the reporting period. Refer to note 22
to the consolidated financial statements, Related Party Transactions, for further details.
(e) Insurance of Officers
During the financial year, the Group paid a premium of $202,880 (2017: $118,597) to insure the Officers of the Group including
Directors and Secretaries of the Company and its controlled entities, and the General Managers of each of the divisions of the
Group.
For
per
sona
l use
onl
y

DIRECTORS’ REPORT (continued)
28 Super Retail Group Limited • Directors’ & Financial Reports 2018
4. Remuneration Report – Audited (continued) The liabilities insured are legal costs that may be incurred in defending civil or criminal proceedings that may be brought against
the officers in their capacity as Officers of entities in the Group, and any other payments arising from liabilities incurred by the
Officers in connection with such proceedings, other than where such liabilities arise out of conduct involving a wilful breach of
duty by the officers or the improper use by the officers of their position or of information to gain advantage for themselves or someone else or to cause detriment to the Group. It is not possible to apportion the premium between amounts relating to the
insurance against legal costs and those relating to other liabilities.
5. Non-Audit Services The Company may decide to employ the auditor on assignments additional to their statutory audit duties where the auditor’s
expertise and experience with the Company and/or the Group are important.
The Board of Directors has considered the position and, in accordance with the advice received from the Audit and Risk
Committee, is satisfied that the provision of the non-audit services is compatible with the general standard of independence for auditors imposed by the Corporations Act 2001. The Directors are satisfied that the provision of non-audit services by the
auditor, as set out below, did not compromise the auditor independence requirements of the Corporations Act 2001 for the
following reasons:
• all non-audit services have been reviewed by the Audit and Risk Committee to ensure they do not impact the impartiality
and objectivity of the auditor;
• none of the services undermine the general principles relating to auditor independence as set out in APES 110 Code of
Ethics for Professional Accountants, including reviewing or auditing the auditor’s own work, acting in a management or a decision-making capacity for the Company, acting as advocate for the Company or jointly sharing economic risk and
rewards.
During the period the following fees were paid or payable for services provided by the auditor PricewaterhouseCoopers of the parent entity and its network firms for audit and non-audit services provided during the year is set out below:
2018 $
2017 $
Audit Services
PricewaterhouseCoopers Australian firm:
Remuneration for audit and review services 585,570 492,100
Other assurance(1) 44,721 191,700
Total remuneration for audit and review services 630,291 683,800
Taxation and Other Services
PricewaterhouseCoopers Australian firm:
Taxation Services 394,329 113,368
Customs prudential review 18,500 - Digital advertising advisory 49,572 -
Workshop facilitation 51,601 -
Business review of subsidiary - 50,000
Network firms of PricewaterhouseCoopers Australia: Taxation Services 66,924 66,803
Total remuneration for non-audit services 580,926 230,171 (1) Cyber security audit in 2018 and Risk Appetite assurance services in 2017.
For
per
sona
l use
onl
y

DIRECTORS’ REPORT (continued)
Super Retail Group Limited • Directors’ & Financial Reports 2018 29
6. Corporate Governance Statement The Group’s Corporate Governance Statement sets out the corporate governance framework adopted by the Board of Super
Retail Group Limited. This statement is publically available on the Super Retail Group external website:
http://www.superretailgroup.com
7. Proceedings on behalf of the Company
No proceedings have been brought or intervened in on behalf of the Company with leave of the Court under section 237 of the Corporations Act 2001.
8. Auditors Independence Declaration
A copy of the auditor’s independence declaration as required under section 307C of the Corporations Act 2001 is set out on
page 30.
9. Rounding of amounts
The Company is of a kind referred to in ASIC Corporations (Rounding in Financial/Directors’ Reports) Instrument 2016/191, issued by the Australian Securities and Investments Commission, relating to the ‘rounding off’ of amounts in the Directors’ Report.
Amounts in the Directors’ Report have been rounded off in accordance with that instrument to the nearest hundred thousand
dollars or in certain cases to the nearest dollar.
This report is made in accordance with a resolution of the Directors.
S A Pitkin P A Birtles Chair Group Managing Director and
Chief Executive Officer
Brisbane
20 August 2018
For
per
sona
l use
onl
y

30 Super Retail Group Limited • Directors’ & Financial Reports 2018
Auditor’s Independence Declaration As lead auditor for the audit of Super Retail Group Limited for the year ended 30 June 2018, I declare that to the best of my knowledge and belief, there have been:
(a) no contraventions of the auditor independence requirements of the Corporations Act 2001 in relation to the audit; and
(b) no contraventions of any applicable code of professional conduct in relation to the audit.
This declaration is in respect of Super Retail Group Limited and the entities it controlled during the period.
Kim Challenor Brisbane Partner PricewaterhouseCoopers
20 August 2018
PricewaterhouseCoopers, ABN 52 780 433 757 480 Queen Street, BRISBANE QLD 4000, GPO Box 150, BRISBANE QLD 4001 T: +61 7 3257 5000, F: +61 7 3257 5999, www.pwc.com.au
Liability limited by a scheme approved under Professional Standards Legislation.
For
per
sona
l use
onl
y
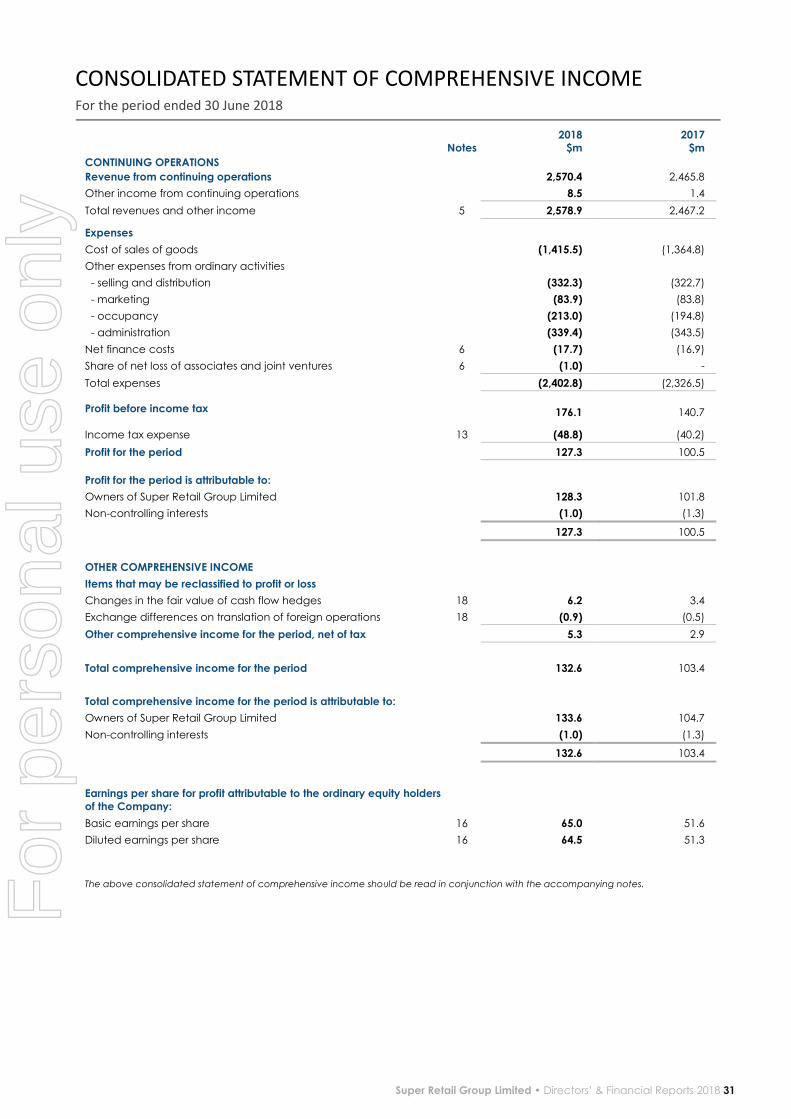
CONSOLIDATED STATEMENT OF COMPREHENSIVE INCOME For the period ended 30 June 2018
Super Retail Group Limited • Directors’ & Financial Reports 2018 31
Notes 2018
$m 2017
$m
CONTINUING OPERATIONS
Revenue from continuing operations 2,570.4 2,465.8
Other income from continuing operations 8.5 1.4
Total revenues and other income 5 2,578.9 2,467.2
Expenses
Cost of sales of goods (1,415.5) (1,364.8)
Other expenses from ordinary activities
- selling and distribution (332.3) (322.7)
- marketing (83.9) (83.8)
- occupancy (213.0) (194.8)
- administration (339.4) (343.5)
Net finance costs 6 (17.7) (16.9)
Share of net loss of associates and joint ventures 6 (1.0) -
Total expenses (2,402.8) (2,326.5)
Profit before income tax 176.1 140.7
Income tax expense 13 (48.8) (40.2)
Profit for the period 127.3 100.5
Profit for the period is attributable to:
Owners of Super Retail Group Limited 128.3 101.8
Non-controlling interests (1.0) (1.3)
127.3 100.5
OTHER COMPREHENSIVE INCOME
Items that may be reclassified to profit or loss
Changes in the fair value of cash flow hedges 18 6.2 3.4
Exchange differences on translation of foreign operations 18 (0.9) (0.5)
Other comprehensive income for the period, net of tax 5.3 2.9
Total comprehensive income for the period 132.6 103.4
Total comprehensive income for the period is attributable to:
Owners of Super Retail Group Limited 133.6 104.7
Non-controlling interests (1.0) (1.3)
132.6 103.4
Earnings per share for profit attributable to the ordinary equity holders of the Company:
Basic earnings per share 16 65.0 51.6
Diluted earnings per share 16 64.5 51.3
The above consolidated statement of comprehensive income should be read in conjunction with the accompanying notes. For
per
sona
l use
onl
y

CONSOLIDATED BALANCE SHEET As at 30 June 2018
32 Super Retail Group Limited • Directors’ & Financial Reports 2018
Notes 2018
$m 2017
$m
ASSETS
Current assets
Cash and cash equivalents 15.2 19.9
Trade and other receivables 7 23.8 42.6
Inventories 8 545.5 481.5
Derivative financial instruments 15 6.8 -
Total current assets 591.3 544.0
Non-current assets
Property, plant and equipment 9 270.4 264.5
Intangible assets 10 891.6 750.1
Other financial assets 23(b) 9.3 -
Total non-current assets 1,171.3 1,014.6
Total assets 1,762.6 1,558.6
LIABILITIES
Current liabilities
Trade and other payables 11 342.3 253.7
Interest-bearing liabilities 12 3.0 2.6
Current tax liabilities 13 9.6 1.5
Provisions 14 71.0 62.3
Derivative financial instruments 15 1.5 3.1
Total current liabilities 427.4 323.2
Non-current liabilities
Trade and other payables 11 49.1 44.2
Interest-bearing liabilities 12 435.1 398.0
Deferred tax liabilities 13 30.1 17.1
Provisions 14 21.7 21.5
Total non-current liabilities 536.0 480.8
Total liabilities 963.4 804.0
NET ASSETS 799.2 754.6
EQUITY
Contributed equity 17 542.3 542.3
Reserves 18 10.3 3.5
Retained earnings 18 247.3 210.7
Capital and reserves attributable to owners of Super Retail Group Limited 799.9 756.5
Non-controlling interests (0.7) (1.9)
TOTAL EQUITY 799.2 754.6
The above consolidated balance sheet should be read in conjunction with the accompanying notes. For
per
sona
l use
onl
y

CONSOLIDATED STATEMENT OF CHANGES IN EQUITY For the period ended 30 June 2018
Super Retail Group Limited • Directors’ & Financial Reports 2018 33
Contributed Equity
Reserves Retained Earnings
Total Non-Controlling
Interests
Total
Equity
Notes $m $m $m $m $m $m
Balance at 2 July 2016 542.3 (0.9) 193.7 735.1 (1.1) 734.0
Profit for the period - - 101.8 101.8 (1.3) 100.5
Other comprehensive loss for the period - 2.9 - 2.9 - 2.9
Total comprehensive income for the period - 2.9 101.8 104.7 (1.3) 103.4
Transactions with owners in
their capacity as owners
Dividends provided for or paid 21 - - (84.8) (84.8) - (84.8)
Employee performance rights 18 - 2.0 - 2.0 - 2.0
Change in ownership interest in controlled entities 23(a) - (0.5) - (0.5) 0.5 -
- 1.5 (84.8) (83.3) 0.5 (82.8)
Balance at 1 July 2017 542.3 3.5 210.7 756.5 (1.9) 754.6
Profit for the period - - 128.3 128.3 (1.0) 127.3
Other comprehensive loss for the period - 5.3 - 5.3 - 5.3
Total comprehensive income for the period - 5.3 128.3 133.6 (1.0) 132.6
Transactions with owners in
their capacity as owners
Dividends provided for or paid 21 - - (91.7) (91.7) - (91.7)
Employee performance rights 18 - 1.1 - 1.1 - 1.1
Transactions with non-controlling interests 23(b) - 0.6 - 0.6 2.0 2.6
Change in ownership interest in controlled entities 23(a) - (0.2) - (0.2) 0.2 -
- 1.5 (91.7) (90.2) 2.2 (88.0)
Balance at 30 June 2018 542.3 10.3 247.3 799.9 (0.7) 799.2
The above consolidated statement of changes in equity should be read in conjunction with the accompanying notes.
For
per
sona
l use
onl
y
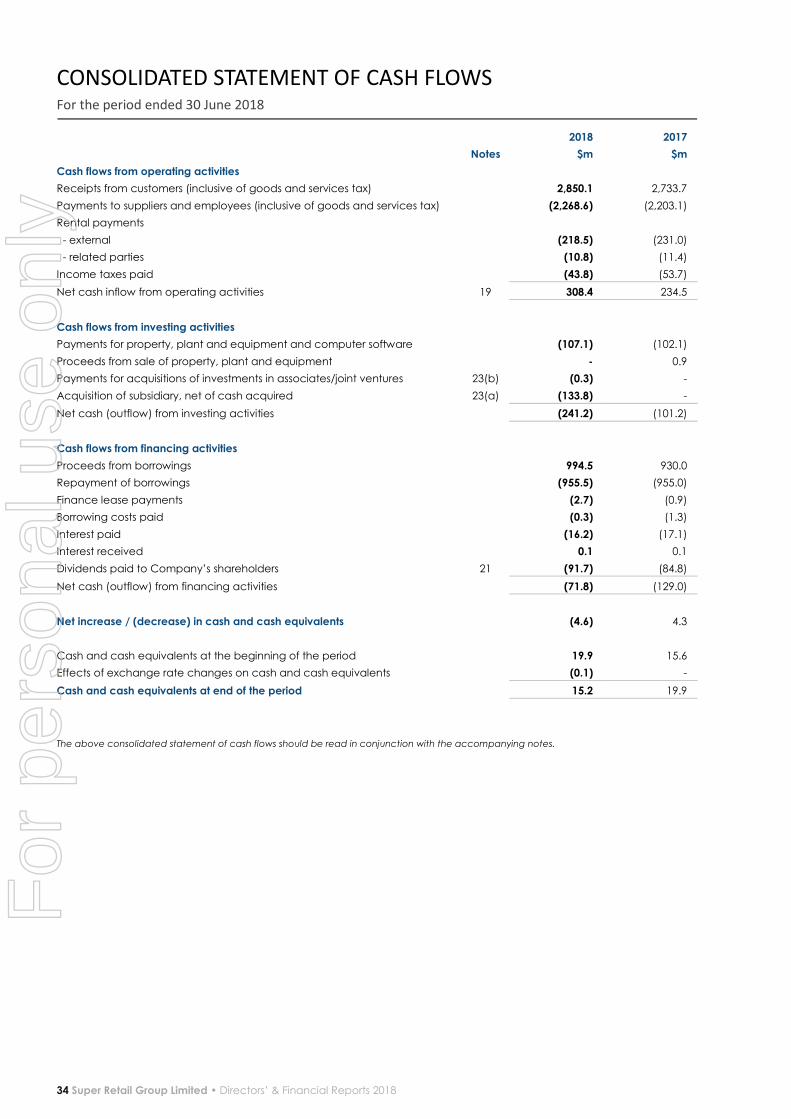
CONSOLIDATED STATEMENT OF CASH FLOWS For the period ended 30 June 2018
34 Super Retail Group Limited • Directors’ & Financial Reports 2018
2018 2017
Notes $m $m
Cash flows from operating activities
Receipts from customers (inclusive of goods and services tax) 2,850.1 2,733.7
Payments to suppliers and employees (inclusive of goods and services tax) (2,268.6) (2,203.1)
Rental payments
- external (218.5) (231.0)
- related parties (10.8) (11.4)
Income taxes paid (43.8) (53.7)
Net cash inflow from operating activities 19 308.4 234.5
Cash flows from investing activities
Payments for property, plant and equipment and computer software (107.1) (102.1)
Proceeds from sale of property, plant and equipment - 0.9
Payments for acquisitions of investments in associates/joint ventures 23(b) (0.3) -
Acquisition of subsidiary, net of cash acquired 23(a) (133.8) -
Net cash (outflow) from investing activities (241.2) (101.2)
Cash flows from financing activities
Proceeds from borrowings 994.5 930.0
Repayment of borrowings (955.5) (955.0)
Finance lease payments (2.7) (0.9)
Borrowing costs paid (0.3) (1.3)
Interest paid (16.2) (17.1)
Interest received 0.1 0.1
Dividends paid to Company’s shareholders 21 (91.7) (84.8)
Net cash (outflow) from financing activities (71.8) (129.0)
Net increase / (decrease) in cash and cash equivalents (4.6) 4.3
Cash and cash equivalents at the beginning of the period 19.9 15.6
Effects of exchange rate changes on cash and cash equivalents (0.1) -
Cash and cash equivalents at end of the period 15.2 19.9
The above consolidated statement of cash flows should be read in conjunction with the accompanying notes.
For
per
sona
l use
onl
y
NOTES TO THE CONSOLIDATED FINANCIAL STATEMENTS For the period ended 30 June 2018
Super Retail Group Limited • Directors’ & Financial Reports 2018 35
TABLE OF CONTENTS
Basis of Preparation 36 1. Reporting entity 36
2. Summary of significant accounting policies 36
3. Critical accounting estimates and judgements 39
Group Performance 40 4. Segment information 40
5. Revenue and other income from continuing operations 42
6. Expenses from continuing operations 43
Assets and Liabilities 44 7. Trade and other receivables 44
8. Inventories 45
9. Property, plant and equipment 45
10. Intangible assets 47 11. Trade and other payables 50
12. Interest-bearing liabilities 50
13. Income taxes 51 14. Provisions 56
15. Financial assets and financial liabilities 58
Capital Structure, Financing and Risk Management 61 16. Earnings per share 61
17. Contributed equity 62
18. Reserves and retained earnings 63 19. Reconciliation of profit from ordinary activities after income tax to net cash inflow from operating activities 64
20. Financial risk management 65
21. Capital management 71
Group Structure 72 22. Related party transactions 72
23. Business combinations 73 24. Deed of cross guarantee 75
25. Parent entity financial information 77
26. Investments in controlled entities 78
Other 79 27. Key management personnel disclosures 79
28. Share-based payments 79 29. Remuneration of auditors 81
30. Contingencies 81
31. Commitments 82 32. Net tangible asset backing 82
33. Events occurring after balance date 82
For
per
sona
l use
onl
y
NOTES TO THE CONSOLIDATED FINANCIAL STATEMENTS (continued) For the period ended 30 June 2018
36 Super Retail Group Limited • Directors’ & Financial Reports 2018
1. Reporting entity Super Retail Group Limited (the Company) is a company domiciled in Australia. The address of the Company’s registered office and principal place of business is 751 Gympie Road, Lawnton, Queensland.
The consolidated annual financial report of the Company as at and for the period ended 30 June 2018 comprises: the Company and its subsidiaries (together referred to as the Group, and individually as Group entities).
The Group is a for-profit entity and is primarily involved in the retail industry. Principal activities of the Group consist of:
• retailing of auto parts and accessories, tools and equipment; • retailing of boating, camping, outdoor equipment, fishing equipment and apparel; and
• retailing of sporting equipment and apparel.
2. Summary of significant accounting policies This section sets out the principal accounting policies upon which the Group’s consolidated financial statements are prepared
as a whole. Specific accounting policies are described in their respective Notes to the consolidated financial statements. These policies have been consistently applied to all the years presented, unless otherwise stated.
(a) Basis of preparation Statement of compliance This general purpose financial report has been prepared in accordance with Australian Accounting Standards, other authoritative pronouncements of the Australian Accounting Standards Board, Urgent Issues Group Interpretations and the Corporations Act 2001. The consolidated financial statements and accompanying notes of Super Retail Group Limited comply with International Financial Reporting Standards (IFRS) as issued by the International Accounting Standards Board. Basis of measurement
These financial statements have been prepared under the historical cost convention, unless otherwise stated.
(b) Principles of consolidation The consolidated financial statements incorporate the assets and liabilities of all entities controlled by Super Retail Group Limited (the Company or parent entity) as at 30 June 2018 and the results of its controlled entities for the period then ended. The effects of all transactions between entities in the consolidated entity are fully eliminated. (i) Transactions eliminated on consolidation Intra-group balances and transactions, and any unrealised income and expenses arising from intra-group transactions, are eliminated in preparing the consolidated financial statements. Unrealised losses are eliminated in the same way as unrealised gains, but only to the extent that there is no evidence of impairment. (ii) Subsidiaries Subsidiaries are all entities (including structured entities) over which the Group has control. The Group controls an entity when the Group is exposed to, or has rights to, variable returns from its involvement with the entity and has the ability to affect those returns through its power to direct the activities of the entity. Subsidiaries are fully consolidated from the date on which control is transferred to the Group. These are deconsolidated from the date that control ceases. Intercompany transactions, balances and unrealised gains on transactions between Group companies are eliminated. Unrealised losses are also eliminated unless the transaction provides evidence of an impairment of the transferred asset. Accounting policies of subsidiaries have been changed where necessary to ensure consistency with the policies adopted by the Group. Non-controlling interests in the results and equity of subsidiaries are shown separately in the consolidated income statement, statement of comprehensive income, balance sheet and statement of changes in equity respectively. (iii) Business combinations The acquisition method of accounting is used to account for all business combinations (refer note 23 - Business combinations), regardless of whether equity instruments or other assets are acquired. The consideration transferred for the acquisition of a subsidiary comprises the fair value of the assets transferred, the liabilities incurred and the equity interests issued by the Group. The consideration transferred also includes the fair value of any contingent consideration arrangement and the fair value of any pre-existing equity interest in the subsidiary. Acquisition-related costs are expensed as incurred. Identifiable assets acquired and liabilities and contingent liabilities assumed in a business combination are, with limited exceptions, measured initially at their fair values as at the acquisition date. On an acquisition-by-acquisition basis, the Group recognises any non-controlling interest in the acquiree either at fair value or at the non-controlling interest’s proportionate share of the acquiree’s net identifiable assets.
For
per
sona
l use
onl
y
NOTES TO THE CONSOLIDATED FINANCIAL STATEMENTS (continued) For the period ended 30 June 2018
Super Retail Group Limited • Directors’ & Financial Reports 2018 37
2. Summary of significant accounting policies (continued) (b) Principles of consolidation (continued) (iii) Business combinations (continued) The excess of the consideration transferred, the amount of any non-controlling interest in the acquiree and the acquisition-date fair value of any previous equity interest in the acquiree over the fair value of the Group’s share of the net identifiable assets acquired is recorded as goodwill. If those amounts are less than the fair value of the net identifiable assets of the subsidiary acquired and the measurement of all amounts has been reviewed, the difference is recognised directly in profit or loss as a bargain purchase. Where settlement of any part of cash consideration is deferred, the amounts payable in the future are discounted to their present value as at the date of exchange. The discount rate used is the entity’s incremental borrowing rate, being the rate at which a similar borrowing could be obtained from an independent financier under comparable terms and conditions. Contingent consideration is classified either as equity or a financial liability. Amounts classified as a financial liability are subsequently remeasured to fair value with changes in fair value recognised in profit or loss. (iv) Investments in associates and joint ventures Associates and joint ventures are entities over which the Group has significant influence or joint control but not control. They are accounted for using the equity method (see (v) below), after initially being recognised at cost in the consolidated balance sheet. (v) Equity method Under the equity method of accounting, the investments are initially recognised at cost and adjusted thereafter to recognise the Group’s share of the post-acquisition profits or losses of the investee in profit or loss, and the Group’s share of movements in other comprehensive income of the investee in other comprehensive income. Dividends received or receivable from associates and joint ventures are recognised as a reduction in the carrying amount of the investment. When the Group’s share of losses in an equity-accounted investment equals or exceeds its interest in the entity, including any other unsecured long-term receivables, the Group does not recognise further losses, unless it has incurred obligations or made payments on behalf of the other entity. Unrealised gains on transactions between the Group and its associates and joint ventures are eliminated to the extent of the Group’s interest in these entities. Unrealised losses are also eliminated unless the transaction provides evidence of an impairment of the asset transferred. Accounting policies of equity accounted investees have been changed where necessary to ensure consistency with the policies adopted by the Group. The Group treats transactions with non-controlling interests that do not result in a loss of control as transactions with equity owners of the Group. A change in ownership interest results in an adjustment between the carrying amounts of the controlling and non-controlling interests to reflect their relative interests in the subsidiary. Any difference between the amount of the adjustment to non-controlling interests and any consideration paid or received is recognised in a separate reserve within equity attributable to the owners of Super Retail Group Limited. (vi) Comparatives
Where applicable, various comparative balances have been reclassified to align with current period presentation. These
amendments have no material impact on the consolidated financial statements.
(c) Foreign currency translation (i) Functional and presentation currency Items included in the financial statements of each of the Group’s entities are measured using the currency of the primary economic environment in which the entity operates (‘the functional currency’). The consolidated financial statements are presented in Australian dollars, which is Super Retail Group Limited’s functional and presentation currency. (ii) Transactions and balances Foreign currency transactions are translated into the functional currency using the exchange rates prevailing at the dates of the transactions. Foreign exchange gains and losses resulting from the settlement of such transactions and from the translation at year-end exchange rates of monetary assets and liabilities denominated in foreign currencies are recognised in the income statement, except when deferred in equity as qualifying cash flow hedges and qualifying net investment hedges. Translation differences on non-monetary items such as equities held at fair value through profit or loss, are reported as part of the fair value gain or loss. Translation differences on non-monetary items, such as equities classified as available-for-sale financial assets, are included in the fair value reserve in equity. (iii) Group companies The results and financial position of all the Group entities (none of which has the currency of a hyperinflationary economy) that have a functional currency different from the presentation currency are translated into the presentation currency as follows:
For
per
sona
l use
onl
y
NOTES TO THE CONSOLIDATED FINANCIAL STATEMENTS (continued) For the period ended 30 June 2018
38 Super Retail Group Limited • Directors’ & Financial Reports 2018
2. Summary of significant accounting policies (continued) (c) Foreign currency translation (continued) (iii) Group companies (continued) • assets and liabilities for each statement of financial position presented are translated at the closing rate at the date of
that statement of financial position; • income and expenses for each income statement are translated at average exchange rates (unless this is not a
reasonable approximation of the cumulative effect of the rates prevailing on the transaction dates, in which case income and expenses are translated at the dates of the transactions); and
• all resulting exchange differences are recognised as a separate component of equity. (d) Goods and Services Tax Revenues, expenses and assets are recognised net of the amount of goods and services tax, except where the amount of goods and services tax incurred is not recoverable. In these circumstances the goods and services tax is recognised as part
of the cost of acquisition of the asset or as part of the item of expense. Receivables and payables in the consolidated
statement of financial position are shown inclusive of goods and services tax.
Cash flows are presented on a gross basis. The GST components of cash flows arising from investing or financing activities
which are recoverable from, or payable to, the taxation authority, are presented as operating cash flow. (e) Rounding of amounts
The economic entity is of a kind referred to in ASIC Corporations (Rounding in Financial/Directors’ Reports) Instrument
2016/191, issued by the Australian Securities and Investments Commission, relating to the ‘rounding off’ of amounts in the financial report. Amounts in the financial report have been rounded off in accordance with that instrument to the nearest
hundred thousand dollars.
(f) Financial year
As allowed under Section 323D(2) of the Corporations Act 2001, the Directors have determined the financial year to be a
fixed period of 52 calendar or 53 calendar weeks. For the period to 30 June 2018, the Group is reporting on the 52 week period that began 2 July 2017 and ended 30 June 2018. For the period to 1 July 2017, the Group is reporting on the 52 week
period that began 3 July 2016 and ended 1 July 2017.
(g) New and amended standards adopted by the Group Certain new accounting standards and interpretations have been published that are not mandatory to the current reporting
period and have not been early adopted by the Group as follows:
AASB 9 Financial Instruments – effective 1 July 2018 This standard addresses the classification, measurement and de-recognition of financial assets and financial liabilities and
new rules for hedge accounting. There are no significant impacts on the Group’s consolidated financial statements resulting
from the application of AASB 9. IFRS 15 Revenue from Contracts with Customers – effective 1 July 2018
This standard establishes the reporting principles relating to the nature, amount, timing, and uncertainty of revenue and cash flows arising from a contract with a customer. There are no significant impacts on the Group’s consolidated financial
statements resulting from the application of IFRS 15. IFRS 16 Leases – effective 1 July 2019 IFRS 16 introduces a single lessee accounting model requiring a lessee to recognise assets and liabilities for all leases with a
term of more than 12 months where they are not considered of low value. A right-of-use asset will be recognised representing the right to use the underlying leased asset and a lease liability representing the obligations to make lease
payments. As a consequence, a lessee recognises depreciation of the right-of-use asset and interest on the lease liability.
The classification of cash flows will also be affected as operating lease payments under AASB 117 (which will be superseded by IFRS 16) are presented as operating cash flows, whereas under IFRS 16, the lease payments will be split into a principal and
an interest portion which will be presented as financing and operating cash flows respectively.
This standard will materially impact the Group’s consolidated financial statements at transition and in future years, as the Group’s operating leases (primarily in relation to store, distribution centre, office leases and motor vehicles) are recognised
on balance sheet.
During the financial year, the implementation plan for the new leases standard has commenced in a number of areas
including:
• Identification of leases and contracts that could be determined to include a lease;
• Collation of lease data required for the calculation of the impact assessment;
For
per
sona
l use
onl
y
NOTES TO THE CONSOLIDATED FINANCIAL STATEMENTS (continued) For the period ended 30 June 2018
Super Retail Group Limited • Directors’ & Financial Reports 2018 39
2. Summary of significant accounting policies (continued)
(g) New and amended standards adopted by the Group (continued)
• Identification of areas of complexity or judgement relevant to the Group; and • Identification of necessary changes to systems and processes required to enable reporting and accounting in
accordance with the new standard.
Note 31 reflects that as at 30 June 2018, the Group had lease commitments for property and motor vehicles before the straight lining adjustment of $1,009.1 million (2017: $993.1 million). A preliminary assessment indicates that these
arrangements will meet the definition of a lease under IFRS 16, and hence the Group will recognise a right-of-use asset and a
corresponding liability in respect of all these leases unless they qualify for low value or short-term leases upon the application
of IFRS 16.
A reliable estimate of the financial impact on the Group is dependent the finalisation of a number of areas, including:
• Choice of transition method;
• Selection of discount rates; • Estimates of lease-term for leases with options; and
• Assessment of completeness of data. The financial impact is dependent on the composition of the lease portfolio at the time of transition. Therefore it is not yet practicable to determine a reliable estimate of the financial impact on the Group. There are no other standards that are not yet effective and that are expected to have a material impact on the entity in the current or future reporting periods and on foreseeable future transactions.
3. Critical accounting estimates and judgements Estimates and judgements are continually evaluated and are based on historical experience and other factors, including
expectations of future events that may have a financial impact on the entity and that are believed to be reasonable under
the circumstances.
(a) Critical accounting estimates and assumptions The Group makes estimates and assumptions concerning the future. The resulting accounting estimates will, by definition,
seldom equal the related actual results. The estimates and assumptions that have a significant risk of causing a material
adjustment to the carrying amounts of assets and liabilities within the next financial year are included in the following Notes
to the consolidated financial statements: • Note 8 – Inventories;
• Note 9 – Property, plant and equipment;
• Note 10 – Intangible assets;
• Note 14 – Provisions; • Note 23 – Business combinations.
For
per
sona
l use
onl
y

NOTES TO THE CONSOLIDATED FINANCIAL STATEMENTS (continued) For the period ended 30 June 2018
40 Super Retail Group Limited • Directors’ & Financial Reports 2018
4. Segment information
(a) Description of segments Management has determined the operating segments based on the reports reviewed by the Group Managing Director and Chief Executive Officer that are used to make strategic decisions. No operating segments have been aggregated to form
the below reportable operating segments. This results in the following business segments:
Auto: retailing of auto parts and accessories, tools and equipment; Outdoor: retailing of boating, camping, outdoor equipment, fishing equipment and apparel; and
Sports: retailing of sporting equipment and apparel.
With the addition of the Macpac business, the previous segment of Leisure has been renamed during the year as Outdoor.
(b) Segment information provided to the Group Managing Director and Chief Executive Officer Detailed below is the information provided to the Group Managing Director and Chief Executive Officer for reportable
segments. Items not included in Normalised Net Profit After Tax (Normalised NPAT) are one-off charges relating to business
restructuring, acquisitions, divestments and prior year store set-up costs.
For the period ended 30 June 2018
Auto $m
Outdoor $m
Sports $m
Total continuing operations
$m
Inter-segment eliminations/ unallocated
$m
Consolidated $m
Segment Revenue and Other Income
External segment revenue(1) 1,006.4 579.8 979.2 2,565.4 5.7 2,571.1
Inter segment sales - - - - (0.7) (0.7)
Other income(2) 0.6 0.2 0.7 1.5 0.1 1.6
Total segment revenue and other income 1,007.0 580.0 979.9 2,566.9 5.1 2,572.0
Segment EBITDA(3) 148.2 47.9 115.7 311.8 (17.7) 294.1
Segment depreciation and
amortisation(4) (31.8) (18.3) (24.2) (74.3) (0.2) (74.5)
Segment EBIT result 116.4 29.6 91.5 237.5 (17.9) 219.6
Net finance costs (17.7)
Total segment NPBT 201.9
Segment income tax expense(5) (56.6)
Normalised NPAT 145.3
Other items not included in the total segment NPAT(6) (17.0)
Profit for the period attributable to:
Owners of Super Retail Group Limited 128.3
Non-controlling interests (1.0)
Profit for the period 127.3 (1) Includes non-controlling interest (NCI) revenue of $1.6 million. (2) Excludes gain on divestment of controlled entities $6.9 million. (3) Adjusted for NCI operating result of $1.0 million, $16.9 million of business restructuring costs, $4.0 million of acquisition costs, $8.6 million of prior
year store set-up costs and net gain on divestment of $4.7 million. (4) Adjusted for $5.2 million provision for asset depreciation and impairment relating to business restructuring costs. (5) Segment income tax expense of $56.6 million excludes $7.8 million relating to the tax effect of prior year store set-up costs and business
restructuring costs. (6) Includes $24.8 million of costs consisting of business restructuring costs $16.9 million, acquisition costs $4.0 million, prior year store set-up costs
$8.6 million and net gain on divestment of $4.7 million and the related income tax effect of $7.8 million.
Other items not included in total segment NPAT - 2018 Sports
During the reporting period the Group completed the program of converting all Amart Sports stores to Rebel in line with the strategy to sustain the Group’s position as the market leader in sports retailing. In June 2017 the Group recognised $34.0
million of after tax restructuring costs associated with the rebranding. A further $2.7 million of after tax costs have been
incurred during the current reporting period consistent with the announcement made to the market on 25 July 2017.
Outdoor
During the reporting period the Group acquired the Macpac group of companies as announced to the market on 20 February 2018. Following the acquisition of Macpac, the Group has completed the trial of the Rays business and will
integrate its profitable stores into the Macpac business in the fourth quarter of the coming financial year. Costs associated
with the business restructuring and integration incurred during the current reporting period total $13.0 million before tax ($9.1
million after tax), consistent with that announced to the market. Transaction costs to complete the acquisition of Macpac total $4.0 million before tax ($3.9 million after tax).
For
per
sona
l use
onl
y
NOTES TO THE CONSOLIDATED FINANCIAL STATEMENTS (continued) For the period ended 30 June 2018
Super Retail Group Limited • Directors’ & Financial Reports 2018 41
4. Segment information (continued)
(b) Segment information provided to the Group Managing Director and Chief Executive Officer (continued)
Gain on divestment – Autoguru
During the period the Group’s investment in Autoguru decreased to 49.5% - refer note 23 (b). The net gain on divestment partially offset by associated trading losses was $4.7 million before tax (nil tax) and has been excluded from normalised NPAT.
Prior year store set-up costs
The Group has identified that team members involved in store set-up activities should have received additional amounts to the amounts paid. A remediation program is underway and will be completed in the next financial period. The amount
relating to prior periods of $8.6 million, ($6.0 million after tax) is not included in normalised NPAT.
For the period ended 1 July 2017
Auto $m
Outdoor $m
Sports $m
Total continuing operations
$m
Inter-segment eliminations/ unallocated
$m
Consolidated $m
Segment Revenue and Other Income
External segment revenue(1) 955.9 553.5 949.2 2,458.6 7.9 2,466.5
Inter segment sales - - - - (0.7) (0.7)
Other income 0.2 0.3 0.5 1.0 0.4 1.4
Total segment revenue and other income 956.1 553.8 949.7 2,459.6 7.6 2,467.2
Segment EBITDA(2) 139.4 43.1 115.1 297.6 (19.6) 278.0
Segment depreciation and amortisation(3) (28.4) (17.7) (23.8) (69.9) (0.8) (70.7)
Segment EBIT result 111.0 25.4 91.3 227.7 (20.4) 207.3
Net finance costs(4) (16.8)
Total segment NPBT 190.5
Segment income tax expense(5) (54.7)
Normalised NPAT 135.8
Other items not included in the total segment NPAT(6) (34.0)
Profit for the period attributable to:
Owners of Super Retail Group Limited 101.8
Non-controlling interests (1.3)
Profit for the period 100.5 (1) Includes non-controlling interest (NCI) revenue of $1.5 million.
(2) Adjusted for NCI operating result of $1.8 million, business restructuring costs of $3.5 million and $37.3 million impairment charge for the Amart
Sports and Goldcross Cycles brand names, refer note 10 – Intangible assets. (3) Adjusted for NCI depreciation of $0.1 million, $7.7 million provision for asset impairment relating to business restructuring and $37.3 million of
brand name impairment. (4) Adjusted for NCI interest of $0.1 million. (5) Segment income tax expense of $54.7 million excludes $14.5 million relating to the tax effect of business restructuring costs with a value of
$48.5 million. (6) Includes $48.5 million of business restructuring costs and the related income tax effect of $14.5 million.
Other items not included in total segment NPAT - 2017
Sports
During the 2017 year, the Group undertook a review of the strategy for its Sports Division recognising that the dynamics of the sports retail market are set to evolve in the next few years. As a result, the Group concluded that the optimal strategy to
sustain its position as the market leader in sports retailing would be to focus on building one retail brand. Therefore the Group
commenced a program to convert all Amart Sports stores to Rebel by November 2017. As a result there were $48.5 million of
before tax business restructuring costs associated with the rebranding during 2017, comprising $37.3 million of brand name impairment, $7.7 million of Property, plant and equipment impairment and $3.5 million of other restructuring costs.
(c) Other information
Revenue is attributable to the country where the sale of goods has transacted. The consolidated entity’s divisions are operated in two main geographical areas with the following areas of operation:
Australia (the home country of the parent entity) Auto: retailing of auto parts and accessories, tools and equipment;
Outdoor: retailing of boating, camping, outdoor equipment, fishing equipment and apparel; and
Sports: retailing of sporting equipment and apparel.
New Zealand Auto: retailing of auto parts and accessories, tools and equipment; and
Outdoor: retailing of outdoor equipment and apparel.
For
per
sona
l use
onl
y
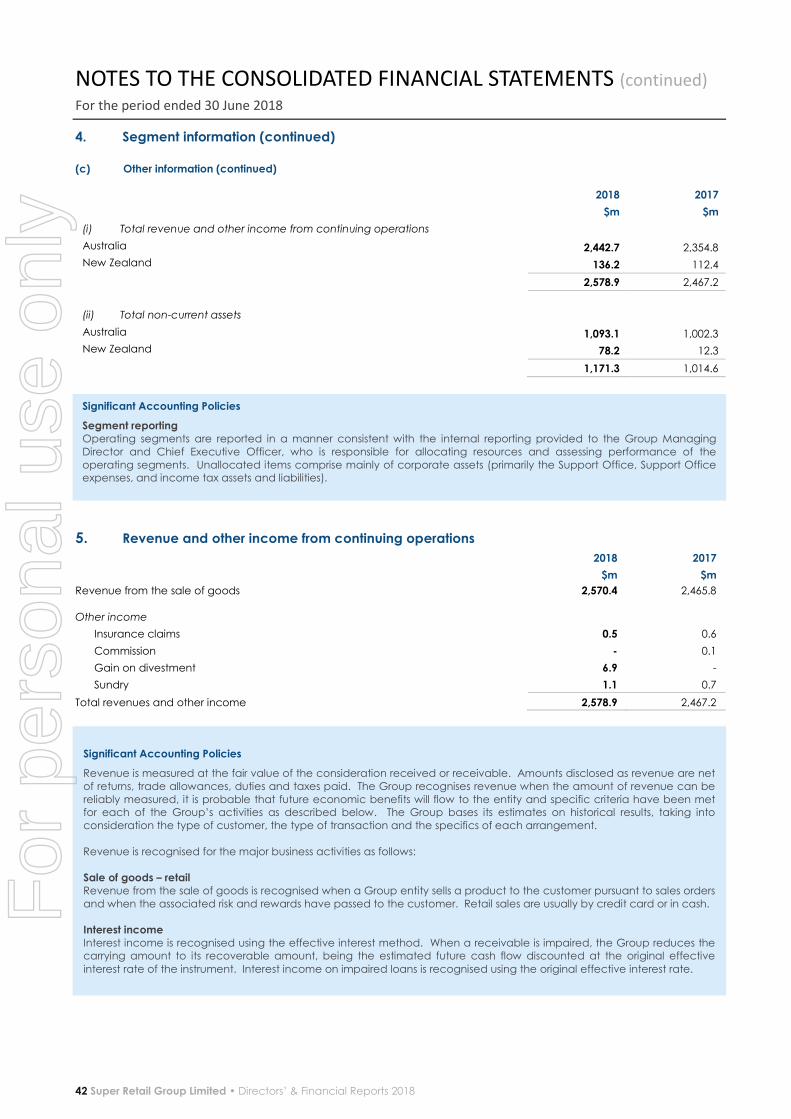
NOTES TO THE CONSOLIDATED FINANCIAL STATEMENTS (continued) For the period ended 30 June 2018
42 Super Retail Group Limited • Directors’ & Financial Reports 2018
4. Segment information (continued)
(c) Other information (continued)
2018 2017
$m $m
(i) Total revenue and other income from continuing operations
Australia 2,442.7 2,354.8
New Zealand 136.2 112.4
2,578.9 2,467.2
(ii) Total non-current assets
Australia 1,093.1 1,002.3
New Zealand 78.2 12.3
1,171.3 1,014.6
5. Revenue and other income from continuing operations
2018 2017
$m $m
Revenue from the sale of goods 2,570.4 2,465.8
Other income
Insurance claims 0.5 0.6
Commission - 0.1
Gain on divestment 6.9 -
Sundry 1.1 0.7
Total revenues and other income 2,578.9 2,467.2
Significant Accounting Policies
Segment reporting Operating segments are reported in a manner consistent with the internal reporting provided to the Group Managing
Director and Chief Executive Officer, who is responsible for allocating resources and assessing performance of the
operating segments. Unallocated items comprise mainly of corporate assets (primarily the Support Office, Support Office expenses, and income tax assets and liabilities).
Significant Accounting Policies
Revenue is measured at the fair value of the consideration received or receivable. Amounts disclosed as revenue are net
of returns, trade allowances, duties and taxes paid. The Group recognises revenue when the amount of revenue can be
reliably measured, it is probable that future economic benefits will flow to the entity and specific criteria have been met for each of the Group’s activities as described below. The Group bases its estimates on historical results, taking into
consideration the type of customer, the type of transaction and the specifics of each arrangement.
Revenue is recognised for the major business activities as follows:
Sale of goods – retail Revenue from the sale of goods is recognised when a Group entity sells a product to the customer pursuant to sales orders
and when the associated risk and rewards have passed to the customer. Retail sales are usually by credit card or in cash.
Interest income Interest income is recognised using the effective interest method. When a receivable is impaired, the Group reduces the carrying amount to its recoverable amount, being the estimated future cash flow discounted at the original effective
interest rate of the instrument. Interest income on impaired loans is recognised using the original effective interest rate.
For
per
sona
l use
onl
y
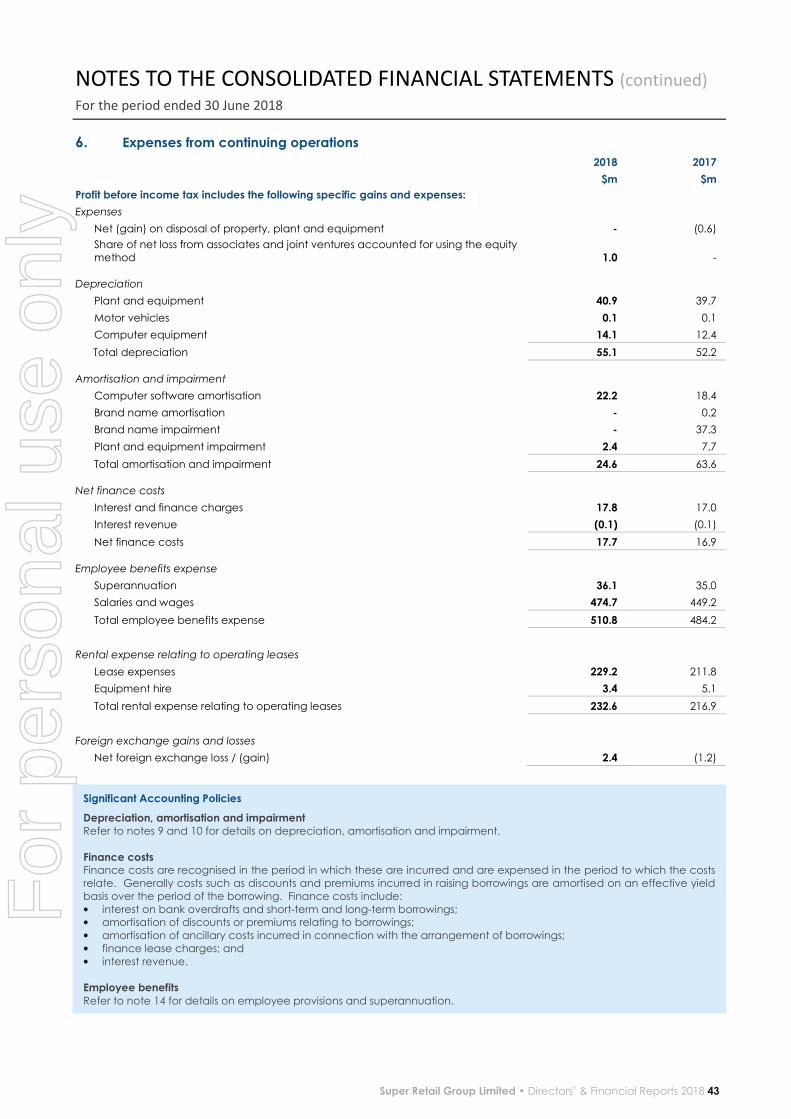
NOTES TO THE CONSOLIDATED FINANCIAL STATEMENTS (continued) For the period ended 30 June 2018
Super Retail Group Limited • Directors’ & Financial Reports 2018 43
6. Expenses from continuing operations
2018 2017
$m $m
Profit before income tax includes the following specific gains and expenses:
Expenses
Net (gain) on disposal of property, plant and equipment - (0.6)
Share of net loss from associates and joint ventures accounted for using the equity
method 1.0 -
Depreciation
Plant and equipment 40.9 39.7
Motor vehicles 0.1 0.1
Computer equipment 14.1 12.4
Total depreciation 55.1 52.2
Amortisation and impairment
Computer software amortisation 22.2 18.4
Brand name amortisation - 0.2
Brand name impairment - 37.3
Plant and equipment impairment 2.4 7.7
Total amortisation and impairment 24.6 63.6
Net finance costs
Interest and finance charges 17.8 17.0
Interest revenue (0.1) (0.1)
Net finance costs 17.7 16.9
Employee benefits expense
Superannuation 36.1 35.0
Salaries and wages 474.7 449.2
Total employee benefits expense 510.8 484.2
Rental expense relating to operating leases
Lease expenses 229.2 211.8
Equipment hire 3.4 5.1
Total rental expense relating to operating leases 232.6 216.9
Foreign exchange gains and losses
Net foreign exchange loss / (gain) 2.4 (1.2)
Significant Accounting Policies
Depreciation, amortisation and impairment Refer to notes 9 and 10 for details on depreciation, amortisation and impairment.
Finance costs Finance costs are recognised in the period in which these are incurred and are expensed in the period to which the costs
relate. Generally costs such as discounts and premiums incurred in raising borrowings are amortised on an effective yield
basis over the period of the borrowing. Finance costs include:
• interest on bank overdrafts and short-term and long-term borrowings; • amortisation of discounts or premiums relating to borrowings;
• amortisation of ancillary costs incurred in connection with the arrangement of borrowings;
• finance lease charges; and
• interest revenue.
Employee benefits Refer to note 14 for details on employee provisions and superannuation.
For
per
sona
l use
onl
y

NOTES TO THE CONSOLIDATED FINANCIAL STATEMENTS (continued) For the period ended 30 June 2018
44 Super Retail Group Limited • Directors’ & Financial Reports 2018
6. Expenses from continuing operations (continued)
7. Trade and other receivables
2018 2017
Current $m $m
Trade receivables 10.0 14.2
Provision for impairment of receivables (0.6) (0.8)
Net trade receivables 9.4 13.4
Other receivables 7.7 5.9
Prepayments 6.7 23.3
Net current trade and other receivables 23.8 42.6
(a) Impaired trade receivables As at 30 June 2018 current trade receivables of the Group with a nominal value of $0.6 million (2017: $0.8 million) were
impaired and provided for. The individually impaired receivables mainly relate to wholesalers with whom the Group no
longer trade.
(b) Past due but not impaired
As at 30 June 2018, trade receivables of $2.4 million (2017: $3.8 million) were past due but not impaired. These relate to a number of independent customers for whom there is no recent history of default. The ageing analysis of these trade
receivables is as follows:
2018 2017
$m $m
30 to 60 days 0.2 1.1
60 to 90 days 0.7 1.0
90 days and over 1.5 1.7
2.4 3.8
Significant Accounting Policies (continued)
Leases Leases in which a significant portion of the risks and rewards of ownership are retained by the lessor are classified as
operating leases. Payments made under operating leases (net of any incentives received from the lessor) are charged to the income statement on a straight-line basis over the period of the lease term.
Foreign exchange gains and losses Refer to note 2 (c) for details on foreign exchange gains and losses.
Significant Accounting Policies
Trade receivables Trade receivables are recognised initially at fair value and subsequently measured at amortised cost, less provision for
doubtful debts. Trade receivables are due for settlement 30 days from the end of the month after sale. Collectability of trade receivables is reviewed on an ongoing basis. Debts which are known to be uncollectable are written off. A
provision for doubtful receivables is established when there is objective evidence that the Group will not be able to collect
all amounts due. The amount of any impairment loss is included within Administration in the income statement.
Impairment of trade receivables
Refer to note 15 for details of impairment of financial assets including trade receivables. For
per
sona
l use
onl
y

NOTES TO THE CONSOLIDATED FINANCIAL STATEMENTS (continued) For the period ended 30 June 2018
Super Retail Group Limited • Directors’ & Financial Reports 2018 45
8. Inventories
2018 2017
$m $m
Finished goods, at lower of cost or net realisable value 545.5 481.5
(a) Inventory expense
Inventories recognised as expense during the period ended 30 June 2018 amounted to $1,338.7 million (2017: $1,291.2 million).
Write-downs of inventories to net realisable value recognised as an expense during the period ended 30 June 2018 amounted to $9.4 million (2017: $2.7 million). This expense has been included in cost of sales of goods within the
consolidated statement of comprehensive income.
9. Property, plant and equipment
2018 2017
$m $m
Plant and equipment, at cost 407.3 373.1
Less accumulated depreciation (180.4) (155.9)
Net plant and equipment 226.9 217.2
Motor vehicles, at cost 0.6 0.7
Less accumulated depreciation (0.4) (0.5)
Net motor vehicles 0.2 0.2
Computer equipment, at cost 104.7 97.9
Less accumulated depreciation (61.4) (50.8)
Net computer equipment 43.3 47.1
Total net property, plant and equipment 270.4 264.5
Significant Accounting Policies
Inventories Inventories are measured at the lower of cost and net realisable value. Costs comprise direct purchase costs and an appropriate proportion of supply chain variable and fixed overhead expenditure in bringing them to their existing location and condition. Costs are assigned to individual items of stock on the basis of weighted average costs. Critical accounting estimates and assumptions
Net realisable value Net realisable value is the estimated selling price in the ordinary course of business less the estimated cost of completion and the estimated costs necessary to make the sale.
For
per
sona
l use
onl
y

NOTES TO THE CONSOLIDATED FINANCIAL STATEMENTS (continued) For the period ended 30 June 2018
46 Super Retail Group Limited • Directors’ & Financial Reports 2018
9. Property, plant and equipment (continued)
(a) Reconciliations
Reconciliations of the carrying amounts for each class of property, plant and equipment are set out below:
2018
Plant and equipment
$m
Motor vehicles
$m
Computer equipment
$m
Total
$m
Carrying amounts at 1 July 2017 217.2 0.2 47.1 264.5
Additions 47.9 - 10.2 58.1
Acquisition of subsidiary (note 23(a)) 5.6 0.1 0.2 5.9
Depreciation (40.9) (0.1) (14.1) (55.1)
Impairment(1) (2.4) - - (2.4)
Divestment of subsidiary (note 23(b)) (0.1) - - (0.1)
Foreign currency exchange differences (0.4) - (0.1) (0.5)
Carrying amounts at 30 June 2018 226.9 0.2 43.3 270.4
2017
Carrying amounts at 2 July 2016 203.3 0.3 33.3 236.9
Additions 60.9 - 26.2 87.1
Disposals (0.3) - - (0.3)
Depreciation (39.7) (0.1) (12.4) (52.2)
Impairment(1) (7.7) - - (7.7)
Foreign currency exchange differences 0.7 - - 0.7
Carrying amounts at 1 July 2017 217.2 0.2 47.1 264.5
(1) During 2018 certain items of Plant and equipment relating to assets in leased locations associated with the Outdoor business transformation
activities were considered to be impaired (2017: Sports business transformation activities) – refer note 4 – Segment information.
Finance Leases
The carrying value of computer equipment held under finance leases as at 30 June 2018 was $9.9 million (2017: $11.2 million). Additions during the year were $1.0 million (2017: $11.2 million). Leased assets are pledged as security for the related finance
lease liability.
Significant Accounting Policies
Carrying value Property, plant and equipment are stated at historical cost, less any accumulated depreciation or amortisation. Historical
costs include expenditure that is directly attributable to the acquisition of the items.
Subsequent costs are included in the asset’s carrying amount or recognised as a separate asset, as appropriate, only
when it is probable that future economic benefits associated with the item will flow to the Group and the cost of the item
can be measured reliably. All repairs and maintenance are charged to the income statement during the financial period
in which they are incurred.
Depreciation and amortisation of property, plant and equipment Depreciation and amortisation are calculated on a straight line basis for accounting and on a diminishing value basis for
tax. Depreciation and amortisation allocates the cost of an item of property, plant and equipment net of residual values over the expected useful life of each asset to the consolidated entity. Estimates of remaining useful lives and residual
values are reviewed and adjusted, if appropriate, at each statement of financial position date.
The depreciation rates used for each class of assets are:
Plant and equipment 7.5% – 37.5%
Capitalised leased plant and equipment 10% – 37.5%
Motor vehicles 25%
Computer equipment 20% – 37.5%
An asset’s carrying amount is written down immediately to its recoverable amount if the asset’s carrying amount is
greater than its estimated recoverable amount.
For
per
sona
l use
onl
y

NOTES TO THE CONSOLIDATED FINANCIAL STATEMENTS (continued) For the period ended 30 June 2018
Super Retail Group Limited • Directors’ & Financial Reports 2018 47
9. Property, plant and equipment (continued)
10. Intangible assets 2018 2017
$m $m
Goodwill, at cost 528.0 449.7
Less accumulated impairment charge (2.1) (2.1)
Net goodwill 525.9 447.6
Computer software, at cost 213.9 174.3
Less accumulated amortisation (101.5) (80.8)
Net computer software 112.4 93.5
Brand names, at cost 311.8 267.5
Less accumulated amortisation and impairment charge (58.5) (58.5)
Net brand names 253.3 209.0
Total net intangible assets 891.6 750.1
(a) Reconciliations
Reconciliations of the carrying amounts for each class of intangible asset are set out below:
Goodwill
$m
Computer Software
$m
Brand Name
$m
Totals
$m
2018
Carrying amounts at 1 July 2017 447.6 93.5 209.0 750.1
Additions - 41.1 - 41.1
Acquisition of subsidiary (note 23(a)) 79.0 0.2 44.3 123.5
Divestment of subsidiary (note 23(b)) (0.7) (0.2) - (0.9)
Amortisation charge - (22.2) - (22.2)
Carrying amounts at 30 June 2018 525.9 112.4 253.3 891.6
Significant Accounting Policies (continued)
Gains and losses Gains and losses on disposals are determined by comparing proceeds with carrying amount. These are included in the
income statement. When revalued assets are sold, it is Group policy to transfer the amounts included in other reserves in
respect of those assets to retained earnings.
Make good requirements in relation to leased premises Make good costs arising from contractual obligations in lease agreements are recognised as provisions at the inception of
the agreement. A corresponding asset is taken up in property, plant and equipment at that time. Expected future
payments are discounted using appropriate market yields at reporting date. Leases The Group leases certain property, plant and equipment. Leases of property, plant and equipment where the Group has
substantially all the risks and rewards of ownership, are classified as finance leases. Finance leases are capitalised at the lease’s inception at the lower of the fair value of the leased property and the present value of the minimum lease
payments. The corresponding rental obligations, net of finance charges, are included in other long term payables. Each
lease payment is allocated between the liability and finance charges so as to achieve a constant rate on the finance
balance outstanding. The interest element of the finance cost is charged to the income statement over the lease period so as to produce a constant periodic rate of interest on the remaining balance of the liability for each period. Property, plant
and equipment acquired under finance leases are depreciated over the shorter of the asset’s useful life and the lease term.
Critical accounting estimates and assumptions
Impairment Assets that are subject to depreciation are reviewed for impairment whenever events or changes in circumstances indicate
that the carrying amount may not be recoverable. An impairment loss is recognised for the amount by which the asset’s carrying amount exceeds its recoverable amount. The recoverable amount is the higher of an asset’s fair value less costs to
sell and value in use. For the purposes of assessing impairment, assets are grouped at the lowest levels for which there are
separately identifiable cash flows (cash generating units).
For
per
sona
l use
onl
y

NOTES TO THE CONSOLIDATED FINANCIAL STATEMENTS (continued) For the period ended 30 June 2018
48 Super Retail Group Limited • Directors’ & Financial Reports 2018
10. Intangible assets (continued) (a) Reconciliations (continued)
Goodwill
$m
Computer Software
$m
Brand Name
$m
Totals
$m
2017
Carrying amounts at 2 July 2016 447.6 78.3 246.5 772.4
Additions - 33.6 - 33.6
Impairment - - (37.3) (37.3)
Amortisation charge - (18.4) (0.2) (18.6)
Carrying amounts at 1 July 2017 447.6 93.5 209.0 750.1
(b) Impairment tests for goodwill
Goodwill is allocated to the Group’s cash generating units (CGUs) identified according to the group of assets based on
acquisition. A CGU level summary of the goodwill allocation is presented below:
CGU
2018
$m
2017
$m
Auto 45.3 45.3
Outdoor 104.1 25.1
Sports 376.5 376.5
Group - 0.7
Total 525.9 447.6
The recoverable amount of a CGU is determined based on value-in-use calculations. These calculations use cash flow
projections based on financial business plans approved by the Board of Directors covering a five-year period. Cash flows
beyond the five-year period are extrapolated using the estimated growth rates stated below. The growth rate does not exceed the long-term average growth rate for the business in which the CGU operates.
Key assumptions used for value-in-use calculations
Management have consistently applied two key assumptions in the value-in-use analysis across each business segment CGU, a pre-tax discount rate of 14.0% (2017: 14.0%) and terminal growth rate of 3.0% (2017: 3.0%). Budgeted gross margin is
determined based on past performance and its expectations for the future. The weighted average growth rates used are
consistent with forecasts included in industry reports.
The recoverable amount of the Group’s goodwill currently exceeds its carrying value. Management does not consider that
a reasonably possible change in any of the key assumptions would cause the carrying value of any of the CGU’s to exceed
their recoverable amounts.
(c) Impairment tests for the useful life for brands
No amortisation is provided against the carrying value of the purchased brand names on the basis that they are considered to have indefinite useful lives.
Key factors taken into account in assessing the useful life of brands were:
• the strong recognition of brands; and • there are currently no legal, technical or commercial factors indicating that the life should be considered limited.
The carrying values of the purchased brand names are:
Brand
2018
$m
2017
$m
Rebel Sport 209.0 209.0
Macpac 44.3 -
Total 253.3 209.0
For
per
sona
l use
onl
y

NOTES TO THE CONSOLIDATED FINANCIAL STATEMENTS (continued) For the period ended 30 June 2018
Super Retail Group Limited • Directors’ & Financial Reports 2018 49
10. Intangible assets (continued)
(c) Impairment tests for the useful life for brands (continued) Key assumptions used for value-in-use calculations
Management have consistently applied two key assumptions in the value-in-use analysis across each brand, a pre-tax
discount rate of 14.0% (2017: 14.0%) and terminal growth rate of 3.0% (2017: 3.0%). Budgeted gross margin is determined based on past performance and its expectations for the future. The weighted average growth rates used are consistent with
forecasts included in industry reports.
The recoverable amount of the brand names currently exceeds their carrying values. Management does not consider that a reasonably possible change in any of the key assumptions would cause the carrying value of any of the brand names to
exceed their recoverable amounts.
2017 impairment The Group recognised an impairment charge of $37.3 million against the Amart Sports and Goldcross Cycles brand names
following the decision to commence a program of converting all Amart Sports stores to Rebel with a target of presenting one
brand to market by November 2017. Based on this decision, the recoverable amount was determined to be nil based on a fair value less costs to sell calculation for the remaining four months that the brands will be operating. This impairment
charge was included in administration expenses in the consolidated income statement.
Significant Accounting Policies
Goodwill Goodwill represents the excess of the cost of an acquisition over the fair value of the Group’s share of the net identifiable
assets of the acquired subsidiary or business at the date of the acquisition. Goodwill on acquisitions of subsidiaries is included in intangible assets. Goodwill is not amortised. Instead, it is tested for impairment annually, or more frequently if
events or changes in circumstances indicated that it might be impaired, and is carried at cost less accumulated
impairment losses. Any impairment is recognised as an expense and is not subsequently reversed.
Gains and losses on the disposal of an entity include the carrying amount of goodwill relating to the entity sold.
Goodwill is allocated to cash-generating units for the purpose of impairment testing. The allocation is made to those cash-generating units or groups of cash-generating units that are expected to benefit from the business combination in which
the goodwill arose, identified according to operating segments.
Intangible assets with indefinite useful lives Separately acquired trademarks and licences are shown at historical cost. Trademarks and licences acquired in a business
combination are recognised at fair value at the acquisition date. Trademarks are amortised over their useful lives.
Other intangible assets Amortisation is calculated on a straight line basis. The amortisation rates used for each class of intangible assets are as
follows:
Computer software 10% – 33.3%
Brand names Nil
Computer software
Costs incurred in developing products or systems and costs incurred in acquiring software and licenses that will contribute
to future period financial benefits through revenue generation and/or cost reduction are capitalised to software and
systems. Costs capitalised include external direct costs of materials and service, employee costs and an appropriate portion of relevant overheads. IT development costs include only those costs directly attributable to the development
phase and are only recognised following completion of technical feasibility and where the Group has an intention and
ability to use the asset.
Brand names
Brand names that are acquired as part of a business combination are recognised separately from goodwill. These assets
are carried at their fair value at the date of acquisition less impairment losses. Brand names are valued using the relief
from royalty method. Brand names are determined to have indefinite useful lives and therefore do not attract amortisation.
Research and development Research expenditure is recognised as an expense as incurred. Costs incurred on development projects (relating to the design and testing of new or improved products) are recognised as intangible assets when it is probable that the project
will, after considering its commercial and technical feasibility, be completed and generate future economic benefits and
its costs can be measured reliably. The expenditure capitalised comprises all directly attributable costs, including costs of
materials, services, direct labour and an appropriate proportion of overheads. Other development expenditures that do not meet these criteria are recognised as an expense as incurred. Development costs previously recognised as an
expense are not recognised as an asset in a subsequent period. Capitalised development costs are recorded as
intangible assets and amortised from the point at which the asset is ready for use.
For
per
sona
l use
onl
y

NOTES TO THE CONSOLIDATED FINANCIAL STATEMENTS (continued) For the period ended 30 June 2018
50 Super Retail Group Limited • Directors’ & Financial Reports 2018
10. Intangible assets (continued)
11. Trade and other payables
2018 2017
Current $m $m
Trade payables 255.6 179.5
Other payables 81.2 70.1
Straight line lease adjustment 5.5 4.1
Total current trade and other payables 342.3 253.7
Non-current
Straight line lease adjustment 49.1 44.2
Total non-current trade and other payables 49.1 44.2
12. Interest-bearing liabilities 2018 2017
Current $m $m
Finance leases - secured by leased asset 3.0 2.6
Total current interest-bearing liabilities 3.0 2.6
Non-current
Finance leases - secured by leased asset 6.5 8.6
Bank debt funding facility - secured - 0.1
Bank debt funding facility - unsecured(1) 428.6 389.3
Total non-current interest-bearing liabilities 435.1 398.0 (1)Net of borrowing costs capitalised of $1.4 million (2017: $1.7 million).
Significant Accounting Policies (continued)
Other items of expenditure Significant items of expenditure, such as costs incurred in store set-ups, are expensed in the financial period in which these
costs are incurred.
Critical accounting estimates and assumptions
Capitalised software costs and useful lives The Group has undertaken significant development of software in relation to the multi-channel customer programme and
mutli-channel supply chain and inventory programme. The useful lives have been determined based on the intended
period of use of this software.
Estimated impairment of indefinite useful life non-financial assets The Group tests annually whether indefinite useful life non-financial assets have suffered any impairment, in accordance
with the accounting policy stated above. The recoverable amounts of cash-generating units have been determined
based on value-in-use calculations. These calculations require the use of assumptions. Refer above for details of these assumptions.
Significant Accounting Policies
Trade and other payables Trade and other payables are payables for goods and services provided to the consolidated entity prior to the end of the
financial period and which are unpaid at that date. The amounts are unsecured and are normally paid within 60 days of
recognition. Trade and other payables are presented as current liabilities unless payment is not due within 12 months from the reporting date.
Leases Refer to note 6 for details on the straight lining of lease expenses.
For
per
sona
l use
onl
y

NOTES TO THE CONSOLIDATED FINANCIAL STATEMENTS (continued) For the period ended 30 June 2018
Super Retail Group Limited • Directors’ & Financial Reports 2018 51
12. Interest-bearing liabilities (continued)
(a) Reconciliation of liabilities arising from financing activities
1 July 2017
$m
Cash flows
$m
Non-cash – Amortisation and
additions
$m
30 June 2018
$m
Finance leases 11.2 (2.7) 1.0 9.5
Bank debt funding facility(1) 389.4 38.7 0.5 428.6
Total 400.6 36.0 1.5 438.1
2 July 2016
$m
Cash flows
$m
Non-cash – Amortisation and
additions
$m
1 July 2017
$m
Finance leases 0.8 (0.8) 11.2 11.2
Bank debt funding facility(1) 415.0 (26.3) 0.7 389.4
Total 415.8 (27.1) 11.9 400.6
(1)Net of borrowing costs paid
13. Income taxes
2018 2017
$m $m
(a) Income tax expense
Current tax expense 51.9 49.5
Deferred tax (benefit) (2.4) (9.0)
Adjustments to tax expense of prior periods (0.7) (0.3)
48.8 40.2
Deferred income tax (revenue) / expense included in income tax expense comprises:
(Increase) / decrease in deferred tax assets (note 13(e)) (3.6) 3.3
Increase / (Decrease) in deferred tax liabilities (note 13(e)) 1.2 (12.3)
(2.4) (9.0)
(b) Numerical reconciliation between tax expense and pre-tax profit
Profit before income tax from continuing operations 176.1 140.7
Tax at the Australian tax rate of 30% (2017: 30%) 52.8 42.2
Tax effect of amounts which are not deductible / (taxable) in
calculating taxable income:
Tax consolidation adjustments regarding NZ branches (3.2) (2.3)
Gain on divestment of subsidiary (2.0) -
Non-deductible acquisition costs 1.1 -
Research and development credits and sundry items 0.4 (0.1)
49.1 39.8
Difference in overseas tax rates (0.3) (0.1)
Derecognition of tax losses and deferred tax assets 0.7 0.8
Adjustments to tax expense of prior periods (0.7) (0.3)
Income tax expense 48.8 40.2
Effective tax rate:
Australia 29.1% 28.2%
Consolidated group 27.7% 28.6%
Significant Accounting Policies
Borrowings Borrowings are initially recognised at fair value, net of transaction costs incurred. Borrowings are subsequently measured
at amortised cost. Any difference between the proceeds (net of transaction costs) and the redemption value is
recognised in the income statement over the period of the borrowings using the effective interest method.
For
per
sona
l use
onl
y
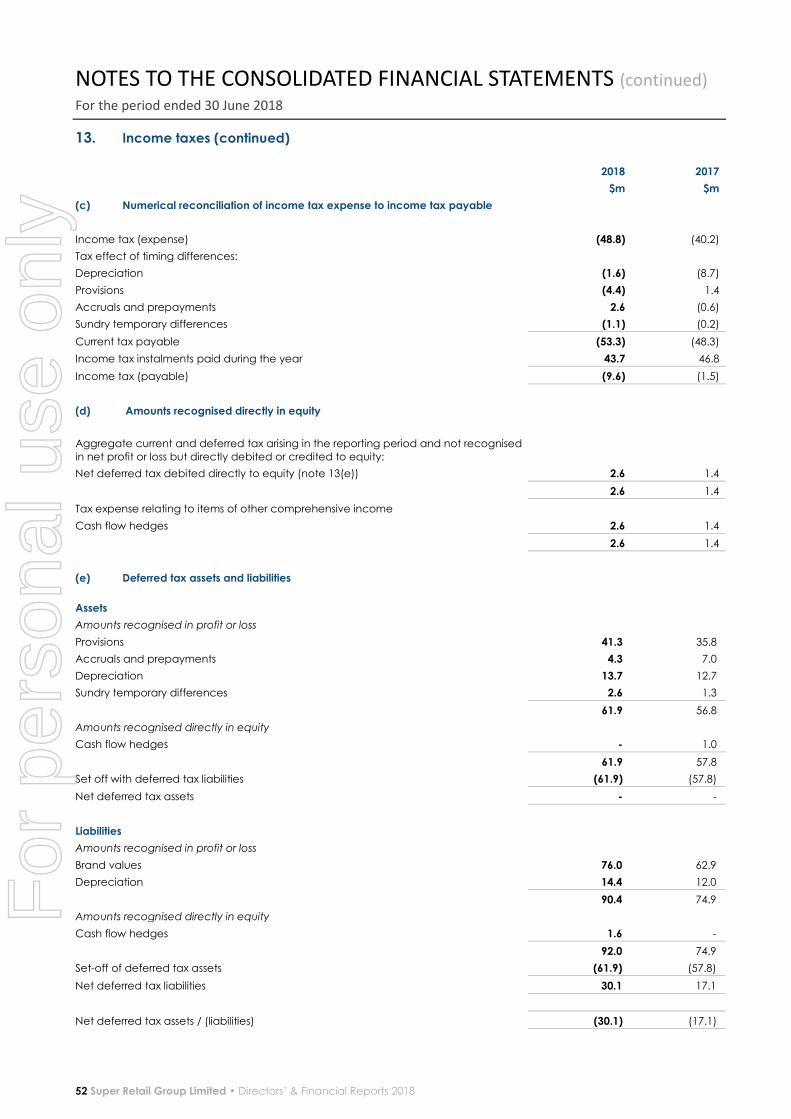
NOTES TO THE CONSOLIDATED FINANCIAL STATEMENTS (continued) For the period ended 30 June 2018
52 Super Retail Group Limited • Directors’ & Financial Reports 2018
13. Income taxes (continued) 2018 2017
$m $m
(c) Numerical reconciliation of income tax expense to income tax payable
Income tax (expense) (48.8) (40.2)
Tax effect of timing differences:
Depreciation (1.6) (8.7)
Provisions (4.4) 1.4
Accruals and prepayments 2.6 (0.6)
Sundry temporary differences (1.1) (0.2)
Current tax payable (53.3) (48.3)
Income tax instalments paid during the year 43.7 46.8
Income tax (payable) (9.6) (1.5)
(d) Amounts recognised directly in equity
Aggregate current and deferred tax arising in the reporting period and not recognised
in net profit or loss but directly debited or credited to equity:
Net deferred tax debited directly to equity (note 13(e)) 2.6 1.4
2.6 1.4
Tax expense relating to items of other comprehensive income
Cash flow hedges 2.6 1.4
2.6 1.4
(e) Deferred tax assets and liabilities
Assets
Amounts recognised in profit or loss
Provisions 41.3 35.8
Accruals and prepayments 4.3 7.0
Depreciation 13.7 12.7
Sundry temporary differences 2.6 1.3
61.9 56.8
Amounts recognised directly in equity
Cash flow hedges - 1.0
61.9 57.8
Set off with deferred tax liabilities (61.9) (57.8)
Net deferred tax assets - -
Liabilities
Amounts recognised in profit or loss
Brand values 76.0 62.9
Depreciation 14.4 12.0
90.4 74.9
Amounts recognised directly in equity
Cash flow hedges 1.6 -
92.0 74.9
Set-off of deferred tax assets (61.9) (57.8)
Net deferred tax liabilities 30.1 17.1
Net deferred tax assets / (liabilities) (30.1) (17.1)
For
per
sona
l use
onl
y

NOTES TO THE CONSOLIDATED FINANCIAL STATEMENTS (continued) For the period ended 30 June 2018
Super Retail Group Limited • Directors’ & Financial Reports 2018 53
13. Income taxes (continued) (e) Deferred tax assets and liabilities (continued)
2018 2017
$m $m
Movements in deferred tax assets:
Opening balance 57.8 62.5
Acquisition of subsidiary (note 23(a)) 0.5 -
Credited / (charged) to the income statement 3.6 (3.3)
(Charged) / credited to equity - (1.4)
Closing balance 61.9 57.8
Deferred tax assets to be recovered after more than 12 months 35.0 31.7
Deferred tax assets to be recovered within 12 months 26.9 26.1
61.9 57.8
Movements in deferred tax liabilities:
Opening balance 74.9 87.2
Acquisition of subsidiary (note 23(a)) 13.3 -
Charged / (credited) to the income statement 1.2 (12.3)
Charged / (credited) to equity 2.6 -
Closing balance 92.0 74.9
Deferred tax liabilities to be settled after more than 12 months 92.0 74.9
Deferred tax liabilities to be settled within 12 months - -
92.0 74.9
(f) Unrecognised deferred tax assets
Tax losses 13.6 13.9
Deferred tax assets have not been recognised in respect of these tax losses because it is not considered probable that
future taxable profit will be available against which they can be realised.
(g) Tax transparency report
In May 2016, the government announced the release of the Board of Taxation’s final report on the voluntary Tax Transparency Code. The aim of the Code is to provide a mechanism by which medium and large companies can be held
accountable for their Australian tax affairs, and to give stakeholders confidence that companies are compliant with their
statutory obligations.
Currently the Code is voluntary. Super Retail Group supports the concept of voluntary tax transparency as an important
measure for all large companies to provide assurance to the Australian community that their tax obligations are being
appropriately met. We know that Super Retail Group’s success is dependent on the wellbeing of the economies and communities where our businesses operate and our conservative approach to tax strategy is one of the many ways we act
to ensure sustainability of our operations. We are pleased to disclose our taxes paid in Australia and to detail our approach
to tax planning for the first time.
The requirements of the Code are broken into Part A which forms part of the tax note as referenced below and Part B as
disclosed below. The make-up of the respective parts is as follows:
(i) Part A:
• Effective company tax rates for our Australian and global operations (Note 13 (b))
• A reconciliation of accounting profit to tax expense and to income tax payable (Note 13 (c))
• Identification of material temporary (Note 13 (b)) and non-temporary differences (Note 13 (c))
(ii) Part B:
• Tax policy, tax strategy and governance
• Information about international related party dealings
• A tax contribution summary of Income tax paid
For
per
sona
l use
onl
y
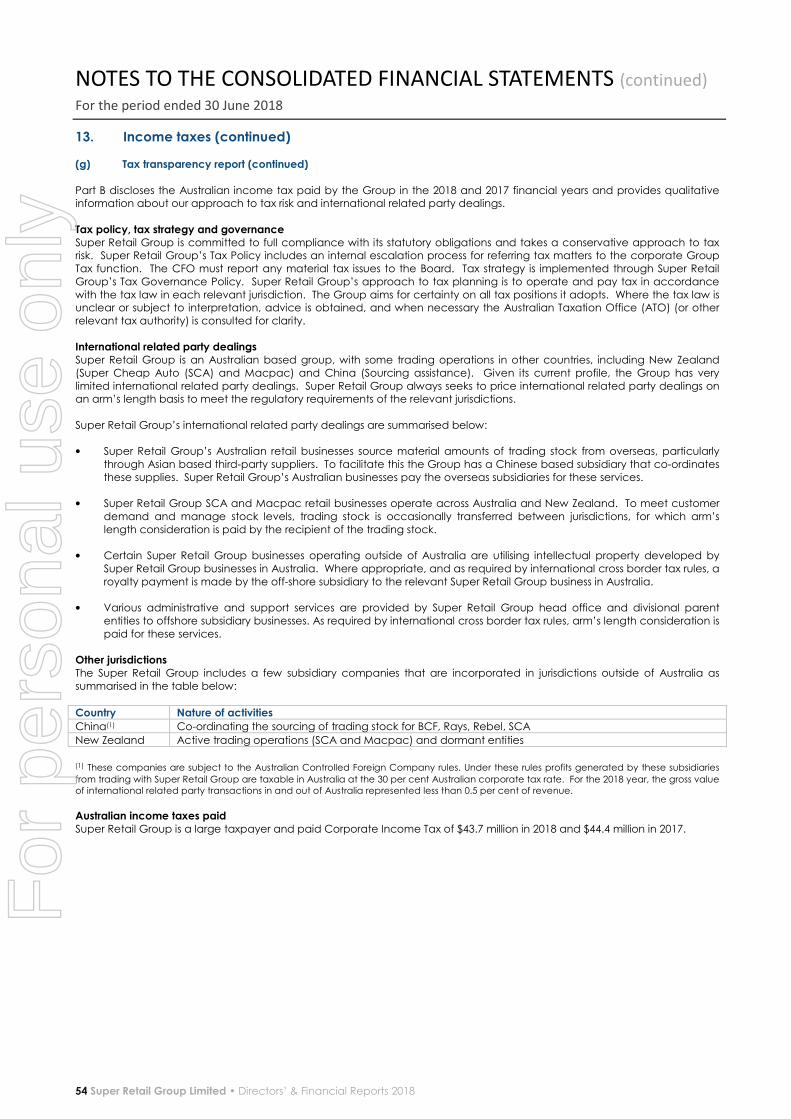
NOTES TO THE CONSOLIDATED FINANCIAL STATEMENTS (continued) For the period ended 30 June 2018
54 Super Retail Group Limited • Directors’ & Financial Reports 2018
13. Income taxes (continued)
(g) Tax transparency report (continued)
Part B discloses the Australian income tax paid by the Group in the 2018 and 2017 financial years and provides qualitative information about our approach to tax risk and international related party dealings.
Tax policy, tax strategy and governance Super Retail Group is committed to full compliance with its statutory obligations and takes a conservative approach to tax risk. Super Retail Group’s Tax Policy includes an internal escalation process for referring tax matters to the corporate Group
Tax function. The CFO must report any material tax issues to the Board. Tax strategy is implemented through Super Retail
Group’s Tax Governance Policy. Super Retail Group’s approach to tax planning is to operate and pay tax in accordance
with the tax law in each relevant jurisdiction. The Group aims for certainty on all tax positions it adopts. Where the tax law is unclear or subject to interpretation, advice is obtained, and when necessary the Australian Taxation Office (ATO) (or other
relevant tax authority) is consulted for clarity.
International related party dealings Super Retail Group is an Australian based group, with some trading operations in other countries, including New Zealand
(Super Cheap Auto (SCA) and Macpac) and China (Sourcing assistance). Given its current profile, the Group has very
limited international related party dealings. Super Retail Group always seeks to price international related party dealings on an arm’s length basis to meet the regulatory requirements of the relevant jurisdictions.
Super Retail Group’s international related party dealings are summarised below:
• Super Retail Group’s Australian retail businesses source material amounts of trading stock from overseas, particularly
through Asian based third-party suppliers. To facilitate this the Group has a Chinese based subsidiary that co-ordinates
these supplies. Super Retail Group’s Australian businesses pay the overseas subsidiaries for these services.
• Super Retail Group SCA and Macpac retail businesses operate across Australia and New Zealand. To meet customer
demand and manage stock levels, trading stock is occasionally transferred between jurisdictions, for which arm’s
length consideration is paid by the recipient of the trading stock.
• Certain Super Retail Group businesses operating outside of Australia are utilising intellectual property developed by
Super Retail Group businesses in Australia. Where appropriate, and as required by international cross border tax rules, a
royalty payment is made by the off-shore subsidiary to the relevant Super Retail Group business in Australia.
• Various administrative and support services are provided by Super Retail Group head office and divisional parent
entities to offshore subsidiary businesses. As required by international cross border tax rules, arm’s length consideration is
paid for these services.
Other jurisdictions The Super Retail Group includes a few subsidiary companies that are incorporated in jurisdictions outside of Australia as
summarised in the table below:
Country Nature of activities
China(1) Co-ordinating the sourcing of trading stock for BCF, Rays, Rebel, SCA
New Zealand Active trading operations (SCA and Macpac) and dormant entities
(1) These companies are subject to the Australian Controlled Foreign Company rules. Under these rules profits generated by these subsidiaries
from trading with Super Retail Group are taxable in Australia at the 30 per cent Australian corporate tax rate. For the 2018 year, the gross value
of international related party transactions in and out of Australia represented less than 0.5 per cent of revenue.
Australian income taxes paid Super Retail Group is a large taxpayer and paid Corporate Income Tax of $43.7 million in 2018 and $44.4 million in 2017.
For
per
sona
l use
onl
y

NOTES TO THE CONSOLIDATED FINANCIAL STATEMENTS (continued) For the period ended 30 June 2018
Super Retail Group Limited • Directors’ & Financial Reports 2018 55
13. Income taxes (continued)
13. Income taxes (continued)
Significant Accounting Policies
Current and deferred tax The income tax expense or revenue for the period is the tax payable on the current period’s taxable income based on the national income tax rate for each jurisdiction adjusted by changes in deferred tax assets and liabilities attributable to temporary differences between the tax bases of assets and liabilities and their carrying amounts in the financial statements, and to unused tax losses. Deferred tax assets and liabilities Deferred tax assets and liabilities are recognised for temporary differences at the tax rates expected to apply when the assets are recovered or liabilities are settled, based on those tax rates which are enacted or substantively enacted for each jurisdiction. The relevant tax rates are applied to the cumulative amounts of deductible and taxable temporary differences to measure the deferred tax asset or liability. An exception is made for certain temporary differences arising from the initial recognition of an asset or a liability. No deferred tax asset or liability is recognised in relation to these temporary differences if they arise in a transaction, other than a business combination, that at the time of the transaction did not affect either accounting profit or taxable profit or loss. Deferred tax assets are recognised for deductible temporary differences and unused tax losses only if it is probable that future taxable amounts will be available to utilise those temporary differences and losses. Deferred tax liabilities and assets are not recognised for temporary differences between the carrying amount and tax bases of investments in controlled entities where the parent entity is able to control the timing of the reversal of the temporary differences and it is probable that the differences will not reverse in the foreseeable future. Current and deferred tax balances attributable to amounts recognised directly in equity are also recognised directly in equity. Deferred tax assets and liabilities are offset when there is a legally enforceable right to offset current tax assets and liabilities and when the deferred tax balances relate to the same taxation authority. Current tax assets and tax liabilities are offset where the entity has a legally enforceable right to offset and intends either to settle on a net basis, or to realise the asset and settle the liability simultaneously. A deferred tax liability is recognised in relation to some of the Group’s indefinite life intangibles. The tax base assumed in determining the amount of the deferred tax liability is the capital cost base of the assets. Tax consolidation Super Retail Group Limited and its wholly-owned Australian controlled entities have implemented the tax consolidation
legislation as of 1 July 2003 and account for current and deferred tax amounts under the Separate taxpayer within Group
approach in accordance with AASB Interpretation 1052, Tax Consolidation Accounting.
On adoption of the tax consolidation legislation, the entities in the tax consolidated group entered into a tax sharing
agreement which, in the opinion of the directors, limits the joint and several liability of the wholly-owned entities in the case
of a default by the head entity, Super Retail Group Limited.
The entities have also entered into a tax funding agreement under which the wholly-owned entities fully compensate Super
Retail Group Limited for any current tax payable assumed and are compensated by Super Retail Group Limited for any
current tax receivable and deferred tax assets relating to unused tax losses or unused tax credits that are transferred to Super Retail Group Limited under the tax consolidation legislation. The funding amounts are determined by reference to
the amounts recognised in the wholly-owned entities’ financial statements.
The amounts receivable/payable under the tax funding agreement are due upon receipt of the funding advice from the head entity, which is issued as soon as practicable after the end of each financial year. The head entity may also require
payment of interim funding amounts to assist with its obligations to pay tax instalments.
For
per
sona
l use
onl
y
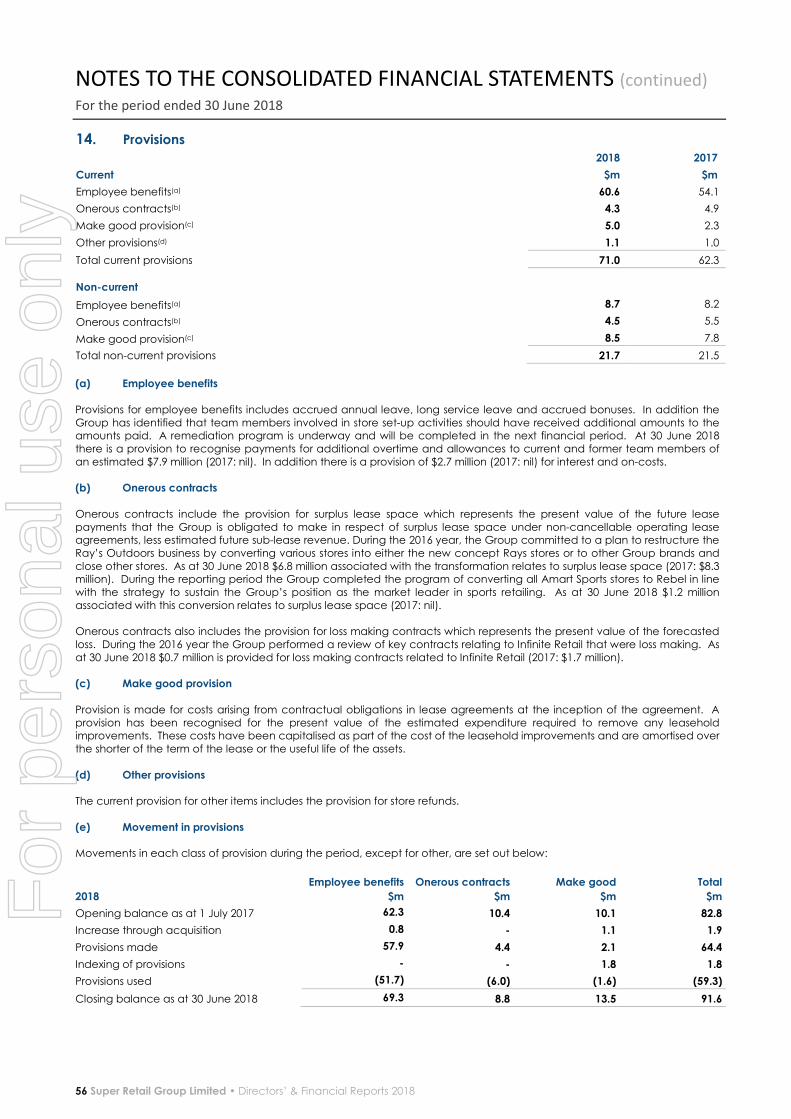
NOTES TO THE CONSOLIDATED FINANCIAL STATEMENTS (continued) For the period ended 30 June 2018
56 Super Retail Group Limited • Directors’ & Financial Reports 2018
14. Provisions
2018 2017
Current $m $m
Employee benefits(a) 60.6 54.1
Onerous contracts(b) 4.3 4.9
Make good provision(c) 5.0 2.3
Other provisions(d) 1.1 1.0
Total current provisions 71.0 62.3
Non-current
Employee benefits(a) 8.7 8.2
Onerous contracts(b) 4.5 5.5
Make good provision(c) 8.5 7.8
Total non-current provisions 21.7 21.5
(a) Employee benefits Provisions for employee benefits includes accrued annual leave, long service leave and accrued bonuses. In addition the
Group has identified that team members involved in store set-up activities should have received additional amounts to the amounts paid. A remediation program is underway and will be completed in the next financial period. At 30 June 2018
there is a provision to recognise payments for additional overtime and allowances to current and former team members of
an estimated $7.9 million (2017: nil). In addition there is a provision of $2.7 million (2017: nil) for interest and on-costs.
(b) Onerous contracts Onerous contracts include the provision for surplus lease space which represents the present value of the future lease
payments that the Group is obligated to make in respect of surplus lease space under non-cancellable operating lease agreements, less estimated future sub-lease revenue. During the 2016 year, the Group committed to a plan to restructure the
Ray’s Outdoors business by converting various stores into either the new concept Rays stores or to other Group brands and
close other stores. As at 30 June 2018 $6.8 million associated with the transformation relates to surplus lease space (2017: $8.3 million). During the reporting period the Group completed the program of converting all Amart Sports stores to Rebel in line
with the strategy to sustain the Group’s position as the market leader in sports retailing. As at 30 June 2018 $1.2 million
associated with this conversion relates to surplus lease space (2017: nil).
Onerous contracts also includes the provision for loss making contracts which represents the present value of the forecasted
loss. During the 2016 year the Group performed a review of key contracts relating to Infinite Retail that were loss making. As
at 30 June 2018 $0.7 million is provided for loss making contracts related to Infinite Retail (2017: $1.7 million).
(c) Make good provision Provision is made for costs arising from contractual obligations in lease agreements at the inception of the agreement. A
provision has been recognised for the present value of the estimated expenditure required to remove any leasehold improvements. These costs have been capitalised as part of the cost of the leasehold improvements and are amortised over
the shorter of the term of the lease or the useful life of the assets.
(d) Other provisions The current provision for other items includes the provision for store refunds.
(e) Movement in provisions Movements in each class of provision during the period, except for other, are set out below:
2018
Employee benefits
$m
Onerous contracts
$m
Make good
$m
Total
$m
Opening balance as at 1 July 2017 62.3 10.4 10.1 82.8
Increase through acquisition 0.8 - 1.1 1.9
Provisions made 57.9 4.4 2.1 64.4
Indexing of provisions - - 1.8 1.8
Provisions used (51.7) (6.0) (1.6) (59.3)
Closing balance as at 30 June 2018 69.3 8.8 13.5 91.6
For
per
sona
l use
onl
y
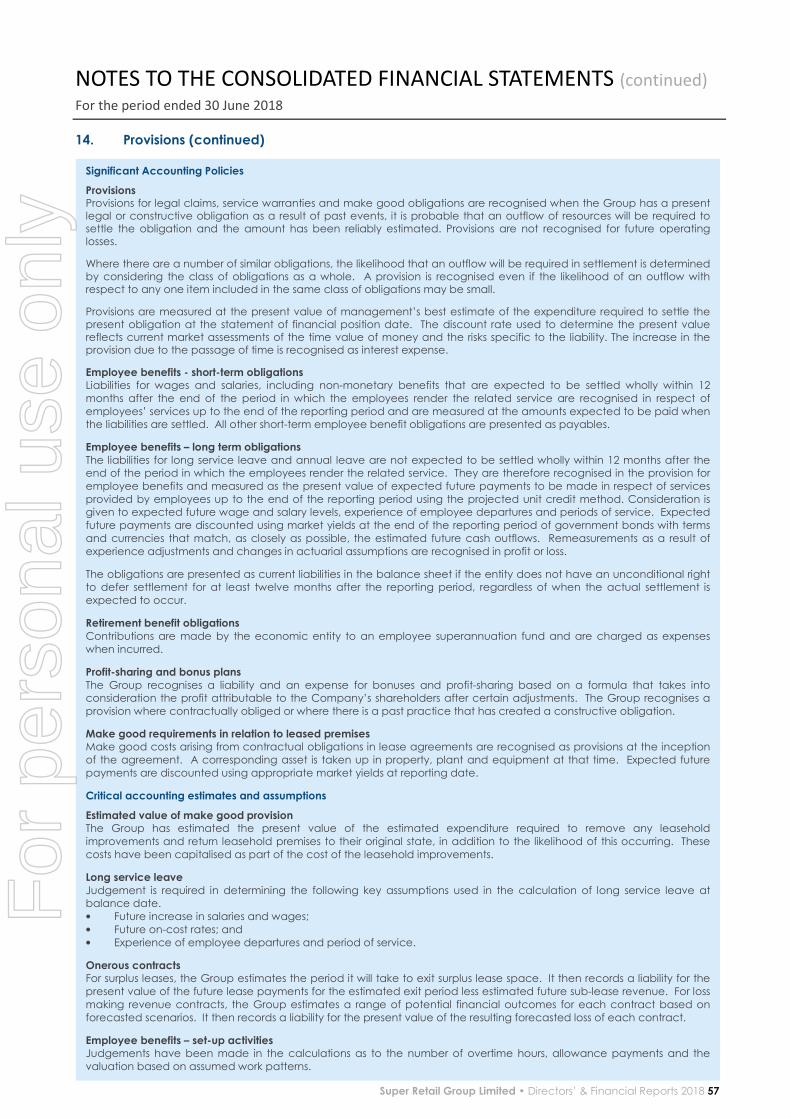
NOTES TO THE CONSOLIDATED FINANCIAL STATEMENTS (continued) For the period ended 30 June 2018
Super Retail Group Limited • Directors’ & Financial Reports 2018 57
14. Provisions (continued)
Significant Accounting Policies
Provisions Provisions for legal claims, service warranties and make good obligations are recognised when the Group has a present legal or constructive obligation as a result of past events, it is probable that an outflow of resources will be required to settle the obligation and the amount has been reliably estimated. Provisions are not recognised for future operating losses.
Where there are a number of similar obligations, the likelihood that an outflow will be required in settlement is determined by considering the class of obligations as a whole. A provision is recognised even if the likelihood of an outflow with respect to any one item included in the same class of obligations may be small.
Provisions are measured at the present value of management’s best estimate of the expenditure required to settle the present obligation at the statement of financial position date. The discount rate used to determine the present value reflects current market assessments of the time value of money and the risks specific to the liability. The increase in the provision due to the passage of time is recognised as interest expense.
Employee benefits - short-term obligations Liabilities for wages and salaries, including non-monetary benefits that are expected to be settled wholly within 12
months after the end of the period in which the employees render the related service are recognised in respect of
employees’ services up to the end of the reporting period and are measured at the amounts expected to be paid when the liabilities are settled. All other short-term employee benefit obligations are presented as payables.
Employee benefits – long term obligations The liabilities for long service leave and annual leave are not expected to be settled wholly within 12 months after the end of the period in which the employees render the related service. They are therefore recognised in the provision for
employee benefits and measured as the present value of expected future payments to be made in respect of services
provided by employees up to the end of the reporting period using the projected unit credit method. Consideration is given to expected future wage and salary levels, experience of employee departures and periods of service. Expected
future payments are discounted using market yields at the end of the reporting period of government bonds with terms
and currencies that match, as closely as possible, the estimated future cash outflows. Remeasurements as a result of
experience adjustments and changes in actuarial assumptions are recognised in profit or loss.
The obligations are presented as current liabilities in the balance sheet if the entity does not have an unconditional right to defer settlement for at least twelve months after the reporting period, regardless of when the actual settlement is
expected to occur.
Retirement benefit obligations Contributions are made by the economic entity to an employee superannuation fund and are charged as expenses
when incurred.
Profit-sharing and bonus plans The Group recognises a liability and an expense for bonuses and profit-sharing based on a formula that takes into consideration the profit attributable to the Company’s shareholders after certain adjustments. The Group recognises a
provision where contractually obliged or where there is a past practice that has created a constructive obligation.
Make good requirements in relation to leased premises Make good costs arising from contractual obligations in lease agreements are recognised as provisions at the inception
of the agreement. A corresponding asset is taken up in property, plant and equipment at that time. Expected future
payments are discounted using appropriate market yields at reporting date.
Critical accounting estimates and assumptions
Estimated value of make good provision The Group has estimated the present value of the estimated expenditure required to remove any leasehold
improvements and return leasehold premises to their original state, in addition to the likelihood of this occurring. These
costs have been capitalised as part of the cost of the leasehold improvements.
Long service leave Judgement is required in determining the following key assumptions used in the calculation of long service leave at balance date.
• Future increase in salaries and wages;
• Future on-cost rates; and
• Experience of employee departures and period of service.
Onerous contracts For surplus leases, the Group estimates the period it will take to exit surplus lease space. It then records a liability for the
present value of the future lease payments for the estimated exit period less estimated future sub-lease revenue. For loss
making revenue contracts, the Group estimates a range of potential financial outcomes for each contract based on
forecasted scenarios. It then records a liability for the present value of the resulting forecasted loss of each contract.
Employee benefits – set-up activities Judgements have been made in the calculations as to the number of overtime hours, allowance payments and the
valuation based on assumed work patterns.
For
per
sona
l use
onl
y
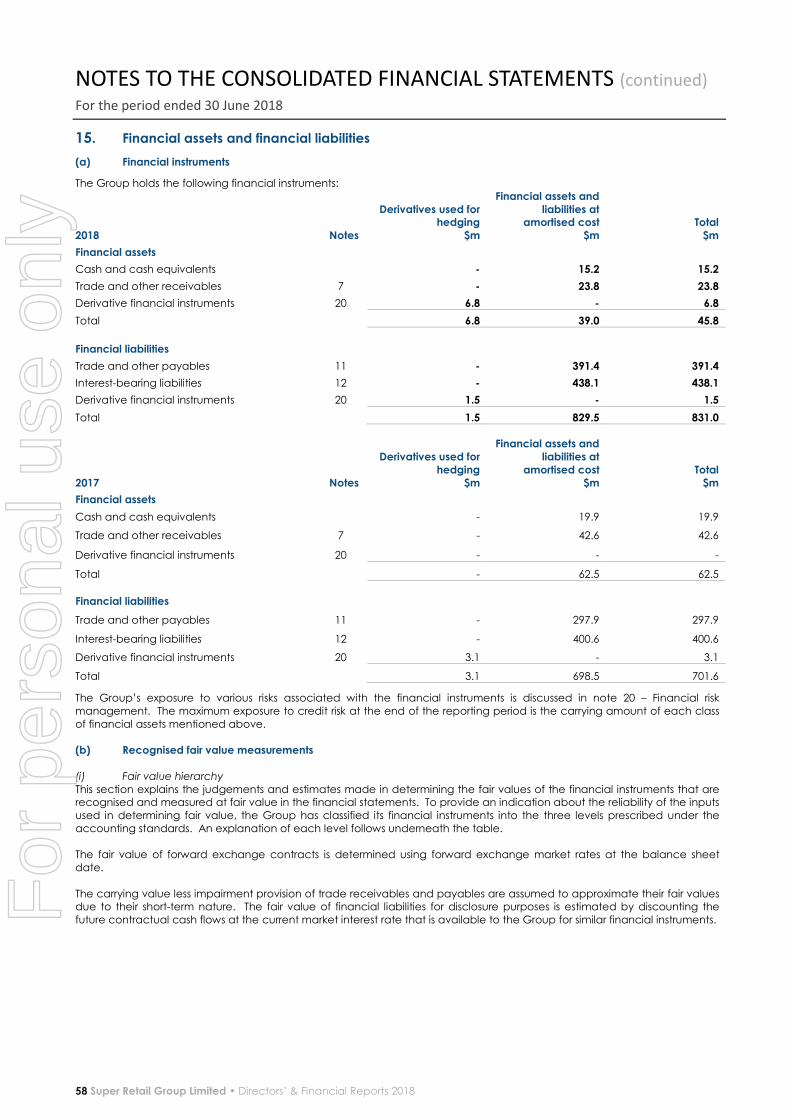
NOTES TO THE CONSOLIDATED FINANCIAL STATEMENTS (continued) For the period ended 30 June 2018
58 Super Retail Group Limited • Directors’ & Financial Reports 2018
15. Financial assets and financial liabilities
(a) Financial instruments
The Group holds the following financial instruments:
2018
Notes
Derivatives used for hedging
$m
Financial assets and liabilities at
amortised cost $m
Total $m
Financial assets
Cash and cash equivalents - 15.2 15.2
Trade and other receivables 7 - 23.8 23.8
Derivative financial instruments 20 6.8 - 6.8
Total 6.8 39.0 45.8
Financial liabilities
Trade and other payables 11 - 391.4 391.4
Interest-bearing liabilities 12 - 438.1 438.1
Derivative financial instruments 20 1.5 - 1.5
Total 1.5 829.5 831.0
2017 Notes
Derivatives used for hedging
$m
Financial assets and liabilities at
amortised cost $m
Total $m
Financial assets
Cash and cash equivalents - 19.9 19.9
Trade and other receivables 7 - 42.6 42.6
Derivative financial instruments 20 - - -
Total - 62.5 62.5
Financial liabilities
Trade and other payables 11 - 297.9 297.9
Interest-bearing liabilities 12 - 400.6 400.6
Derivative financial instruments 20 3.1 - 3.1
Total 3.1 698.5 701.6
The Group’s exposure to various risks associated with the financial instruments is discussed in note 20 – Financial risk
management. The maximum exposure to credit risk at the end of the reporting period is the carrying amount of each class
of financial assets mentioned above.
(b) Recognised fair value measurements
(i) Fair value hierarchy
This section explains the judgements and estimates made in determining the fair values of the financial instruments that are recognised and measured at fair value in the financial statements. To provide an indication about the reliability of the inputs
used in determining fair value, the Group has classified its financial instruments into the three levels prescribed under the
accounting standards. An explanation of each level follows underneath the table.
The fair value of forward exchange contracts is determined using forward exchange market rates at the balance sheet
date.
The carrying value less impairment provision of trade receivables and payables are assumed to approximate their fair values due to their short-term nature. The fair value of financial liabilities for disclosure purposes is estimated by discounting the
future contractual cash flows at the current market interest rate that is available to the Group for similar financial instruments.
For
per
sona
l use
onl
y
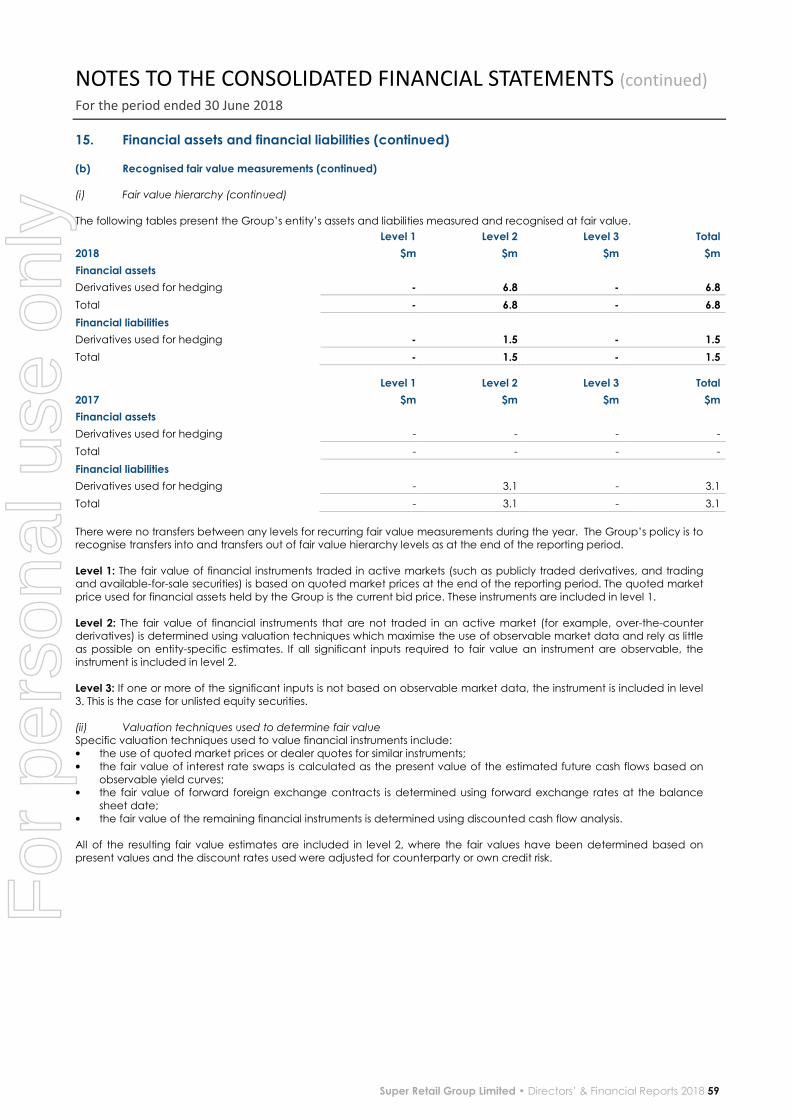
NOTES TO THE CONSOLIDATED FINANCIAL STATEMENTS (continued) For the period ended 30 June 2018
Super Retail Group Limited • Directors’ & Financial Reports 2018 59
15. Financial assets and financial liabilities (continued)
(b) Recognised fair value measurements (continued) (i) Fair value hierarchy (continued)
The following tables present the Group’s entity’s assets and liabilities measured and recognised at fair value.
Level 1 Level 2 Level 3 Total
2018 $m $m $m $m
Financial assets
Derivatives used for hedging - 6.8 - 6.8
Total - 6.8 - 6.8
Financial liabilities
Derivatives used for hedging - 1.5 - 1.5
Total - 1.5 - 1.5
Level 1 Level 2 Level 3 Total
2017 $m $m $m $m
Financial assets
Derivatives used for hedging - - - -
Total - - - -
Financial liabilities
Derivatives used for hedging - 3.1 - 3.1
Total - 3.1 - 3.1
There were no transfers between any levels for recurring fair value measurements during the year. The Group’s policy is to recognise transfers into and transfers out of fair value hierarchy levels as at the end of the reporting period.
Level 1: The fair value of financial instruments traded in active markets (such as publicly traded derivatives, and trading and available-for-sale securities) is based on quoted market prices at the end of the reporting period. The quoted market
price used for financial assets held by the Group is the current bid price. These instruments are included in level 1.
Level 2: The fair value of financial instruments that are not traded in an active market (for example, over-the-counter derivatives) is determined using valuation techniques which maximise the use of observable market data and rely as little
as possible on entity-specific estimates. If all significant inputs required to fair value an instrument are observable, the
instrument is included in level 2.
Level 3: If one or more of the significant inputs is not based on observable market data, the instrument is included in level
3. This is the case for unlisted equity securities.
(ii) Valuation techniques used to determine fair value
Specific valuation techniques used to value financial instruments include:
• the use of quoted market prices or dealer quotes for similar instruments;
• the fair value of interest rate swaps is calculated as the present value of the estimated future cash flows based on
observable yield curves; • the fair value of forward foreign exchange contracts is determined using forward exchange rates at the balance
sheet date;
• the fair value of the remaining financial instruments is determined using discounted cash flow analysis.
All of the resulting fair value estimates are included in level 2, where the fair values have been determined based on
present values and the discount rates used were adjusted for counterparty or own credit risk.
For
per
sona
l use
onl
y

NOTES TO THE CONSOLIDATED FINANCIAL STATEMENTS (continued) For the period ended 30 June 2018
60 Super Retail Group Limited • Directors’ & Financial Reports 2018
15. Financial assets and financial liabilities (continued)
Significant Accounting Policies
Financial assets classification The Group classifies its financial assets in the following categories: financial assets at fair value through profit or loss, and loans and receivables. The classification depends on the purpose for which the investments were acquired. Management determines the classification of its investments at initial recognition and re-evaluates this designation at each reporting date.
Financial assets at fair value through profit or loss This category has two sub-categories: financial assets held for trading, and those designated at fair value through profit or loss on initial recognition. A financial asset is classified in this category if acquired principally for the purpose of selling in the short term or if so designated by management. Derivatives are also categorised as held for trading unless they are designated as hedges. Assets in this category are classified as current assets if they are either held for trading or are expected to be realised within 12 months of the balance sheet date. Loans and receivables Loans and receivables are non-derivative financial assets with fixed or determinable payments that are not quoted in an
active market. They are included in current assets, except for those with maturities greater than 12 months after the end of
the reporting period which are classified as non-current assets.
Regular purchases and sales of financial assets are recognised on trade date – the date on which the Group commits to purchase or sell the asset. Financial assets are derecognised when the rights to receive cash flows from the financial assets have expired or have been transferred and the Group has transferred substantially all the risks and rewards of ownership. At initial recognition, the Group measures a financial asset at its fair value plus, in the case of a financial asset not at fair value through profit or loss, transaction costs that are directly attributable to the acquisition of the financial asset. Transaction costs of financial assets carried at fair value through profit or loss are expensed in profit or loss. Loans and receivables are subsequently carried at amortised cost using the effective interest method. Impairment of financial assets The Group assesses at the end of each reporting period whether there is objective evidence that a financial asset or group of financial assets is impaired. A financial asset or a group of financial assets is impaired and impairment losses are incurred only if there is objective evidence of impairment as a result of one or more events that occurred after the initial recognition of the asset (a ‘loss event’) and that loss event (or events) has an impact on the estimated future cash flows of the financial asset or group of financial assets that can be reliably estimated. Evidence of impairment may include indications that the receivable or a group of receivables is experiencing significant
financial difficulty, default or delinquency in interest or principal payments, the probability that they will enter bankruptcy
or other financial reorganisation, and where observable data indicate that there is a measurable decrease in the
estimated future cash flows, such as changes in arrears or economic conditions that correlate with defaults. For loans and receivables category, the amount of the loss is measured as the difference between the asset’s carrying amount and the present value of estimated future cash flows (excluding future credit losses that have not been incurred) discounted at the financial asset’s original effective interest rate. The carrying amount of the asset is reduced and the amount of the loss is recognised in the consolidated income statement. If, in a subsequent period, the amount of the impairment loss decreases and the decrease can be related objectively to an event occurring after the impairment was recognised (such as an improvement in the debtor’s credit rating), the reversal of the previously recognised impairment loss is recognised in the consolidated income statement. Derivative financial instruments and hedging activities Derivatives are initially recognised at fair value on the date a derivative contract is entered into and are subsequently remeasured to their fair value. The method of recognising the resulting gain or loss depends on whether the derivative is designated as a hedging instrument, and if so, the nature of the item being hedged. The Group designates certain derivatives as either: hedges of the fair value of recognised assets or liabilities or a firm commitment (fair value hedge); or hedges of highly probable forecast transactions (cash flow hedges). The Group documents at the inception of the transaction the relationship between hedging instruments and hedged items as well as its risk management objective and strategy for undertaking various hedge transactions. The Group also documents its assessment, both at hedge inception and on an ongoing basis, of whether the derivatives that are used in hedging transactions have been and will continue to be highly effective in offsetting changes in cash flows of hedged items.
For
per
sona
l use
onl
y
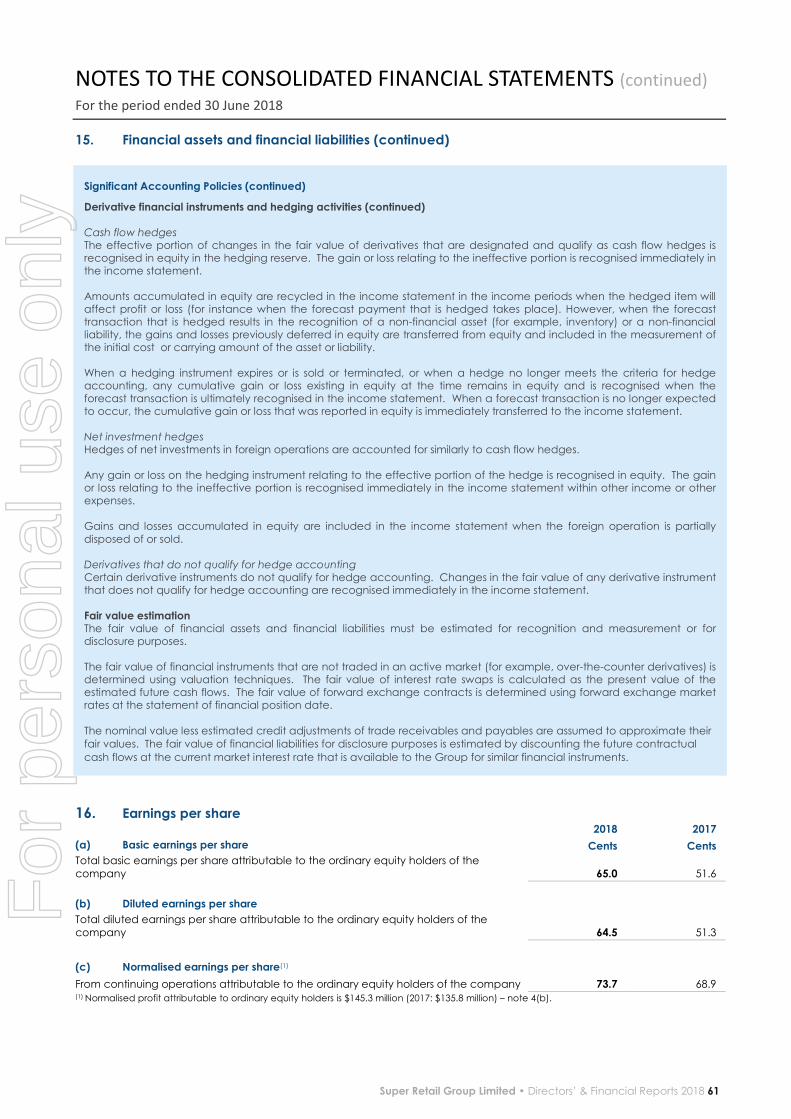
NOTES TO THE CONSOLIDATED FINANCIAL STATEMENTS (continued) For the period ended 30 June 2018
Super Retail Group Limited • Directors’ & Financial Reports 2018 61
15. Financial assets and financial liabilities (continued)
16. Earnings per share 2018 2017
(a) Basic earnings per share Cents Cents
Total basic earnings per share attributable to the ordinary equity holders of the
company 65.0 51.6
(b) Diluted earnings per share
Total diluted earnings per share attributable to the ordinary equity holders of the
company 64.5 51.3
(c) Normalised earnings per share(1)
From continuing operations attributable to the ordinary equity holders of the company 73.7 68.9 (1) Normalised profit attributable to ordinary equity holders is $145.3 million (2017: $135.8 million) – note 4(b).
Significant Accounting Policies (continued)
Derivative financial instruments and hedging activities (continued) Cash flow hedges The effective portion of changes in the fair value of derivatives that are designated and qualify as cash flow hedges is recognised in equity in the hedging reserve. The gain or loss relating to the ineffective portion is recognised immediately in the income statement. Amounts accumulated in equity are recycled in the income statement in the income periods when the hedged item will affect profit or loss (for instance when the forecast payment that is hedged takes place). However, when the forecast transaction that is hedged results in the recognition of a non-financial asset (for example, inventory) or a non-financial liability, the gains and losses previously deferred in equity are transferred from equity and included in the measurement of the initial cost or carrying amount of the asset or liability. When a hedging instrument expires or is sold or terminated, or when a hedge no longer meets the criteria for hedge accounting, any cumulative gain or loss existing in equity at the time remains in equity and is recognised when the forecast transaction is ultimately recognised in the income statement. When a forecast transaction is no longer expected to occur, the cumulative gain or loss that was reported in equity is immediately transferred to the income statement. Net investment hedges Hedges of net investments in foreign operations are accounted for similarly to cash flow hedges. Any gain or loss on the hedging instrument relating to the effective portion of the hedge is recognised in equity. The gain or loss relating to the ineffective portion is recognised immediately in the income statement within other income or other expenses. Gains and losses accumulated in equity are included in the income statement when the foreign operation is partially disposed of or sold. Derivatives that do not qualify for hedge accounting Certain derivative instruments do not qualify for hedge accounting. Changes in the fair value of any derivative instrument that does not qualify for hedge accounting are recognised immediately in the income statement. Fair value estimation The fair value of financial assets and financial liabilities must be estimated for recognition and measurement or for disclosure purposes. The fair value of financial instruments that are not traded in an active market (for example, over-the-counter derivatives) is determined using valuation techniques. The fair value of interest rate swaps is calculated as the present value of the estimated future cash flows. The fair value of forward exchange contracts is determined using forward exchange market rates at the statement of financial position date. The nominal value less estimated credit adjustments of trade receivables and payables are assumed to approximate their
fair values. The fair value of financial liabilities for disclosure purposes is estimated by discounting the future contractual
cash flows at the current market interest rate that is available to the Group for similar financial instruments.
For
per
sona
l use
onl
y

NOTES TO THE CONSOLIDATED FINANCIAL STATEMENTS (continued) For the period ended 30 June 2018
62 Super Retail Group Limited • Directors’ & Financial Reports 2018
16. Earnings per share (continued) 2018 2017
(d) Weighted average number of shares used as the denominator Number Number
Weighted average number of shares used as the denominator in calculating basic
EPS 197,240,020 197,229,369
Adjustments for calculation of diluted earnings per share – performance rights 1,773,137 1,078,275
Weighted average potential ordinary shares used as the denominator in
calculating diluted earnings per share 199,013,157 198,307,644
2018 2017
(e) Reconciliations of earnings used in calculating earnings per share $m $m
Basic earnings and diluted earnings per share
Profit attributable to the ordinary equity holders of the company used in EPS
calculating basic earnings per share:
128.3 101.8
(f) Information concerning the classification of securities
Options and Performance Rights
Options and performance rights granted are considered to be potential ordinary shares and have been included in the
determination of diluted earnings per share to the extent to which they are dilutive.
17. Contributed equity
(a) Share capital
2018 2017
$m $m
Ordinary shares fully paid (197,240,020 ordinary shares as at 30 June 2018) 542.3 542.3
Number of Shares Issue Price $m
(i) Movement in ordinary share capital
Opening Balance 2 July 2016 197,177,318 542.3
Shares issued under performance rights 62,702 - -
Balance 1 July 2017 197,240,020 542.3
Shares issued under performance rights - - -
Closing balance 30 June 2018 197,240,020 542.3
Ordinary shares have no par value and the Company does not have a limited amount of authorised capital.
The ordinary shares entitle the holder to participate in dividends and the proceeds on winding up of the parent entity in
proportion to the number of and amounts paid on the shares held.
On a show of hands every holder of ordinary shares present, in person or by proxy, at a meeting of shareholders of the parent entity is entitled to one vote and, upon a poll, each share is entitled to one vote.
Significant Accounting Policies
Basic earnings per share Basic earnings per share is calculated by dividing:
• the profit attributable to equity holders of the Company, excluding any costs of servicing equity other than ordinary shares;
• by the weighted average number of ordinary shares outstanding during the financial year, adjusted for bonus
elements in ordinary shares issued during the year and excluding treasury shares.
Diluted earnings per share Diluted earnings per share adjusts the figures used in the determination of basic earnings per share to take into account
the after income tax effect of interest and other financing costs associated with dilutive potential ordinary shares and the
weighted average number of shares assumed to have been issued for no consideration in relation to dilutive potential
ordinary shares.
For
per
sona
l use
onl
y

NOTES TO THE CONSOLIDATED FINANCIAL STATEMENTS (continued) For the period ended 30 June 2018
Super Retail Group Limited • Directors’ & Financial Reports 2018 63
17. Contributed equity (continued)
(a) Share capital (continued)
Performance rights over 734,862 (2017: 571,775) ordinary shares were issued during the period with no (2017: 62,702)
performance rights vesting during the period. Under the share option plan, nil (2017: nil) ordinary shares were issued during
the period. Information relating to performance rights and options outstanding at the end of the financial period are set out in note 28 – Share-based payments.
Dividend reinvestment plan The Company has established a dividend reinvestment plan under which holders of ordinary shares may elect to have all or part of their dividend entitlements satisfied by shares purchased on market rather than by being paid in cash.
18. Reserves and retained earnings
2018 2017
$m $m
(a) Reserves
Foreign currency translation reserve 2.5 3.4
Share based payments reserve 11.6 10.5
Hedging reserve 4.0 (2.2)
NCI equity reserve (7.8) (8.2)
Total 10.3 3.5
(i) Movements
Foreign currency translation reserve
Balance at the beginning of the financial period 3.4 3.9
Net exchange difference on translation of foreign controlled entities (0.9) (0.5)
Balance at the end of the financial period 2.5 3.4
Share-based payments reserve
Balance at the beginning of the financial period 10.5 8.5
Options and performance rights expense 1.1 2.0
Balance at the end of the financial period 11.6 10.5
Hedging reserve
Balance at the beginning of the financial period (2.2) (5.6)
Revaluation – gross 8.8 4.8
Deferred tax (2.6) (1.4)
Balance at the end of the financial period 4.0 (2.2)
NCI equity reserve
Balance at the beginning of the financial period (8.2) (7.7)
Change in ownership interest in controlled entities 0.4 (0.5)
Balance at the end of the financial period (7.8) (8.2)
Significant Accounting Policies
Contributed equity Ordinary shares are classified as equity. Incremental costs directly attributable to the issue of new shares or options are
shown in equity as a deduction, net of tax, from the proceeds. Incremental costs directly attributable to the issue of new
shares or options, or for the acquisition of a business, are included in the cost of the acquisition as part of the purchase
consideration.
For
per
sona
l use
onl
y
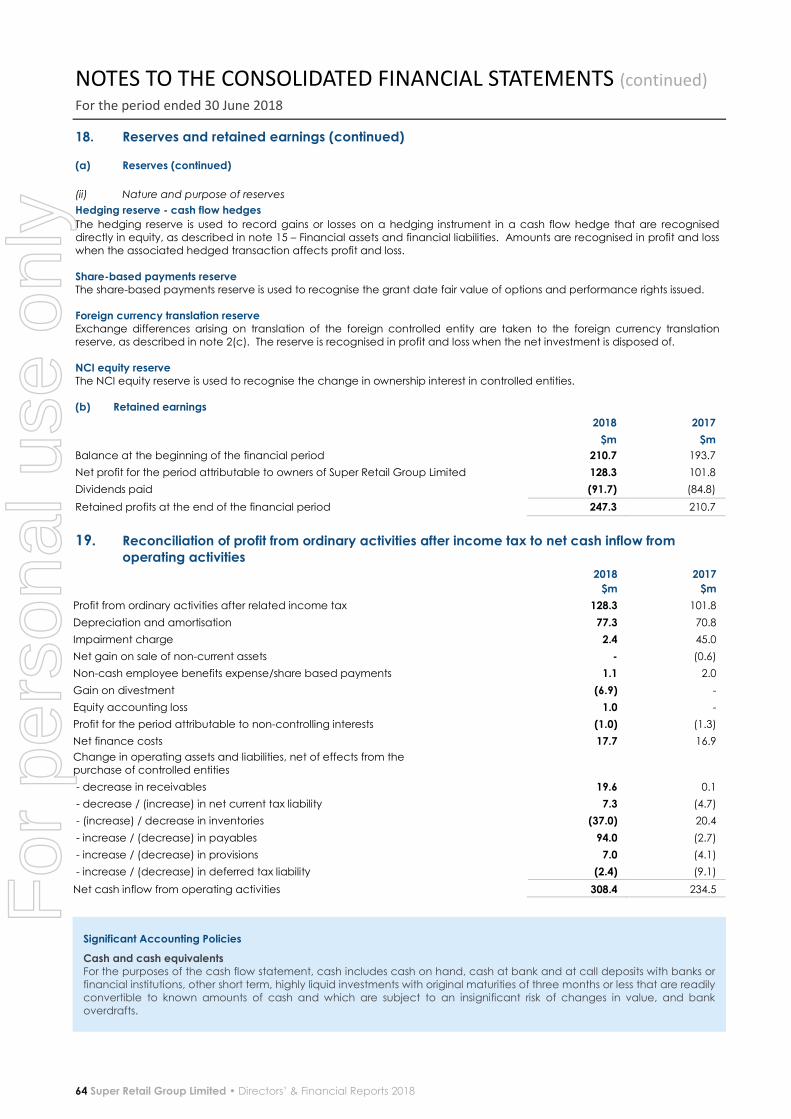
NOTES TO THE CONSOLIDATED FINANCIAL STATEMENTS (continued) For the period ended 30 June 2018
64 Super Retail Group Limited • Directors’ & Financial Reports 2018
18. Reserves and retained earnings (continued) (a) Reserves (continued)
(ii) Nature and purpose of reserves
Hedging reserve - cash flow hedges
The hedging reserve is used to record gains or losses on a hedging instrument in a cash flow hedge that are recognised
directly in equity, as described in note 15 – Financial assets and financial liabilities. Amounts are recognised in profit and loss
when the associated hedged transaction affects profit and loss. Share-based payments reserve The share-based payments reserve is used to recognise the grant date fair value of options and performance rights issued.
Foreign currency translation reserve Exchange differences arising on translation of the foreign controlled entity are taken to the foreign currency translation
reserve, as described in note 2(c). The reserve is recognised in profit and loss when the net investment is disposed of.
NCI equity reserve The NCI equity reserve is used to recognise the change in ownership interest in controlled entities.
(b) Retained earnings
2018 2017
$m $m
Balance at the beginning of the financial period 210.7 193.7
Net profit for the period attributable to owners of Super Retail Group Limited 128.3 101.8
Dividends paid (91.7) (84.8)
Retained profits at the end of the financial period 247.3 210.7
19. Reconciliation of profit from ordinary activities after income tax to net cash inflow from operating activities
2018
$m
2017
$m
Profit from ordinary activities after related income tax 128.3 101.8
Depreciation and amortisation 77.3 70.8
Impairment charge 2.4 45.0
Net gain on sale of non-current assets - (0.6)
Non-cash employee benefits expense/share based payments 1.1 2.0
Gain on divestment (6.9) -
Equity accounting loss 1.0 -
Profit for the period attributable to non-controlling interests (1.0) (1.3)
Net finance costs 17.7 16.9
Change in operating assets and liabilities, net of effects from the
purchase of controlled entities
- decrease in receivables 19.6 0.1
- decrease / (increase) in net current tax liability 7.3 (4.7)
- (increase) / decrease in inventories (37.0) 20.4
- increase / (decrease) in payables 94.0 (2.7)
- increase / (decrease) in provisions 7.0 (4.1)
- increase / (decrease) in deferred tax liability (2.4) (9.1)
Net cash inflow from operating activities 308.4 234.5
Significant Accounting Policies
Cash and cash equivalents For the purposes of the cash flow statement, cash includes cash on hand, cash at bank and at call deposits with banks or
financial institutions, other short term, highly liquid investments with original maturities of three months or less that are readily
convertible to known amounts of cash and which are subject to an insignificant risk of changes in value, and bank
overdrafts.
For
per
sona
l use
onl
y
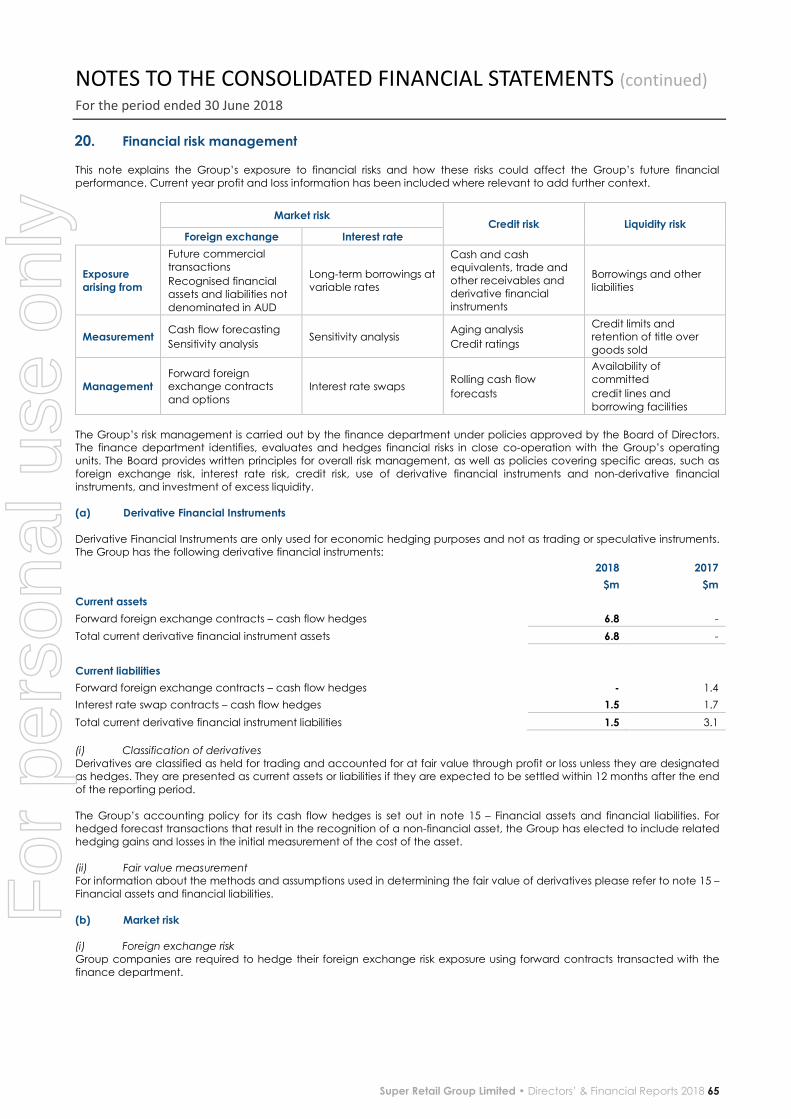
NOTES TO THE CONSOLIDATED FINANCIAL STATEMENTS (continued) For the period ended 30 June 2018
Super Retail Group Limited • Directors’ & Financial Reports 2018 65
20. Financial risk management This note explains the Group’s exposure to financial risks and how these risks could affect the Group’s future financial
performance. Current year profit and loss information has been included where relevant to add further context.
Market risk Credit risk Liquidity risk
Foreign exchange Interest rate
Exposure arising from
Future commercial
transactions
Recognised financial
assets and liabilities not
denominated in AUD
Long-term borrowings at
variable rates
Cash and cash equivalents, trade and
other receivables and
derivative financial
instruments
Borrowings and other
liabilities
Measurement Cash flow forecasting
Sensitivity analysis Sensitivity analysis
Aging analysis
Credit ratings
Credit limits and retention of title over
goods sold
Management Forward foreign exchange contracts
and options
Interest rate swaps Rolling cash flow
forecasts
Availability of
committed
credit lines and
borrowing facilities
The Group’s risk management is carried out by the finance department under policies approved by the Board of Directors. The finance department identifies, evaluates and hedges financial risks in close co-operation with the Group’s operating
units. The Board provides written principles for overall risk management, as well as policies covering specific areas, such as
foreign exchange risk, interest rate risk, credit risk, use of derivative financial instruments and non-derivative financial
instruments, and investment of excess liquidity.
(a) Derivative Financial Instruments
Derivative Financial Instruments are only used for economic hedging purposes and not as trading or speculative instruments. The Group has the following derivative financial instruments:
2018 2017
$m $m
Current assets
Forward foreign exchange contracts – cash flow hedges 6.8 -
Total current derivative financial instrument assets 6.8 -
Current liabilities
Forward foreign exchange contracts – cash flow hedges - 1.4
Interest rate swap contracts – cash flow hedges 1.5 1.7
Total current derivative financial instrument liabilities 1.5 3.1
(i) Classification of derivatives
Derivatives are classified as held for trading and accounted for at fair value through profit or loss unless they are designated as hedges. They are presented as current assets or liabilities if they are expected to be settled within 12 months after the end
of the reporting period.
The Group’s accounting policy for its cash flow hedges is set out in note 15 – Financial assets and financial liabilities. For hedged forecast transactions that result in the recognition of a non-financial asset, the Group has elected to include related
hedging gains and losses in the initial measurement of the cost of the asset.
(ii) Fair value measurement
For information about the methods and assumptions used in determining the fair value of derivatives please refer to note 15 –
Financial assets and financial liabilities.
(b) Market risk (i) Foreign exchange risk
Group companies are required to hedge their foreign exchange risk exposure using forward contracts transacted with the
finance department.
For
per
sona
l use
onl
y
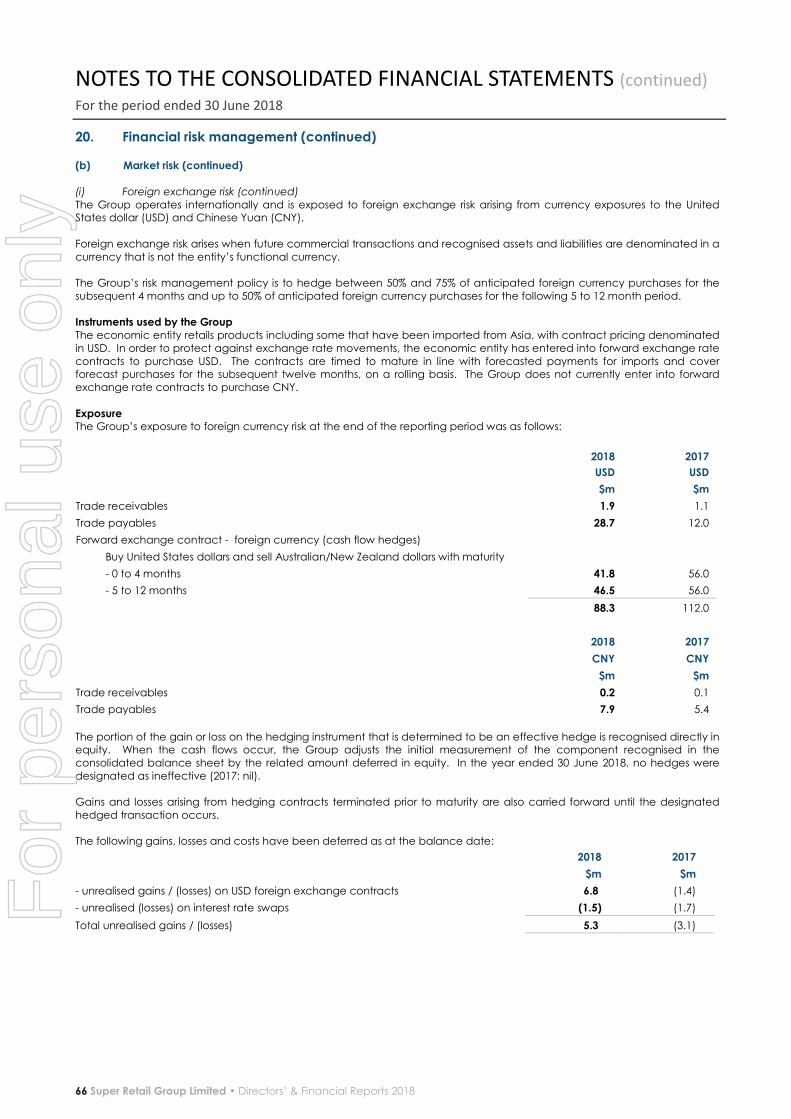
NOTES TO THE CONSOLIDATED FINANCIAL STATEMENTS (continued) For the period ended 30 June 2018
66 Super Retail Group Limited • Directors’ & Financial Reports 2018
20. Financial risk management (continued) (b) Market risk (continued)
(i) Foreign exchange risk (continued)
The Group operates internationally and is exposed to foreign exchange risk arising from currency exposures to the United States dollar (USD) and Chinese Yuan (CNY).
Foreign exchange risk arises when future commercial transactions and recognised assets and liabilities are denominated in a
currency that is not the entity’s functional currency.
The Group’s risk management policy is to hedge between 50% and 75% of anticipated foreign currency purchases for the
subsequent 4 months and up to 50% of anticipated foreign currency purchases for the following 5 to 12 month period.
Instruments used by the Group The economic entity retails products including some that have been imported from Asia, with contract pricing denominated
in USD. In order to protect against exchange rate movements, the economic entity has entered into forward exchange rate
contracts to purchase USD. The contracts are timed to mature in line with forecasted payments for imports and cover forecast purchases for the subsequent twelve months, on a rolling basis. The Group does not currently enter into forward
exchange rate contracts to purchase CNY.
Exposure The Group’s exposure to foreign currency risk at the end of the reporting period was as follows:
The portion of the gain or loss on the hedging instrument that is determined to be an effective hedge is recognised directly in equity. When the cash flows occur, the Group adjusts the initial measurement of the component recognised in the
consolidated balance sheet by the related amount deferred in equity. In the year ended 30 June 2018, no hedges were
designated as ineffective (2017: nil).
Gains and losses arising from hedging contracts terminated prior to maturity are also carried forward until the designated
hedged transaction occurs.
The following gains, losses and costs have been deferred as at the balance date:
2018 2017
USD USD
$m $m
Trade receivables 1.9 1.1
Trade payables 28.7 12.0
Forward exchange contract - foreign currency (cash flow hedges)
Buy United States dollars and sell Australian/New Zealand dollars with maturity
- 0 to 4 months 41.8 56.0
- 5 to 12 months 46.5 56.0
88.3 112.0
2018 2017
CNY CNY
$m $m
Trade receivables 0.2 0.1
Trade payables 7.9 5.4
2018 2017
$m $m
- unrealised gains / (losses) on USD foreign exchange contracts 6.8. (1.4)
- unrealised (losses) on interest rate swaps (1.5) (1.7)
Total unrealised gains / (losses) 5.3. (3.1)
For
per
sona
l use
onl
y
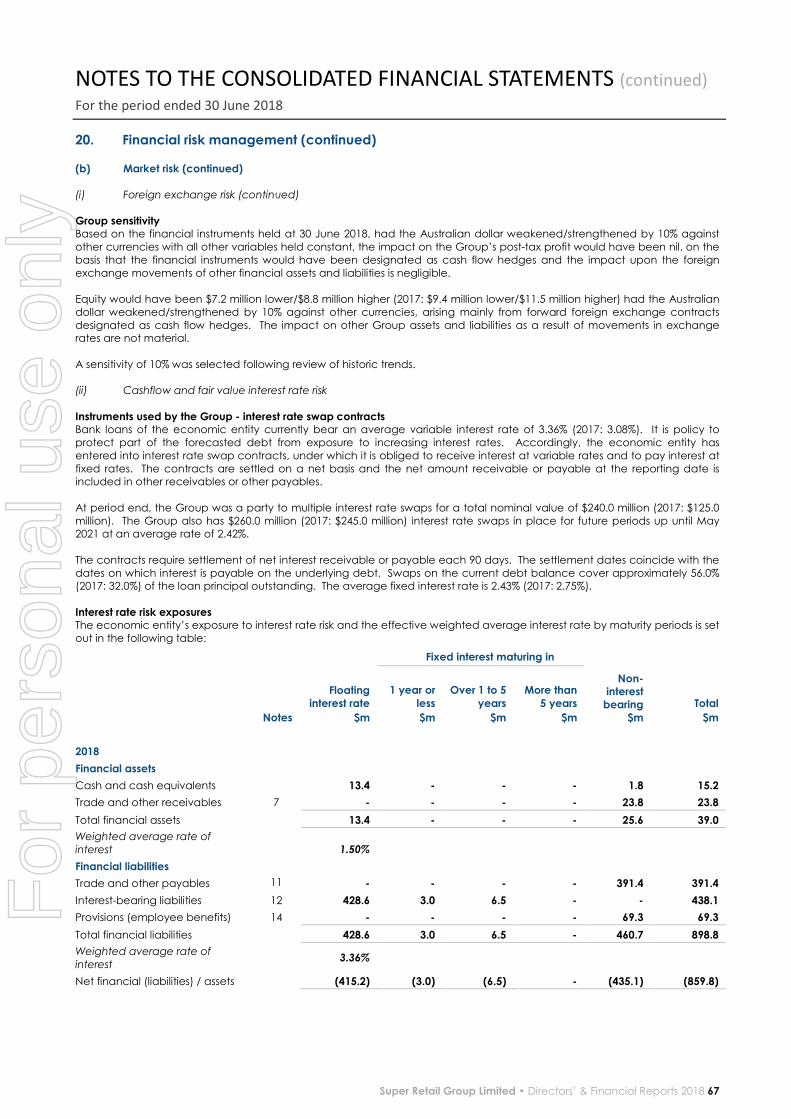
NOTES TO THE CONSOLIDATED FINANCIAL STATEMENTS (continued) For the period ended 30 June 2018
Super Retail Group Limited • Directors’ & Financial Reports 2018 67
20. Financial risk management (continued) (b) Market risk (continued) (i) Foreign exchange risk (continued)
Group sensitivity Based on the financial instruments held at 30 June 2018, had the Australian dollar weakened/strengthened by 10% against
other currencies with all other variables held constant, the impact on the Group’s post-tax profit would have been nil, on the
basis that the financial instruments would have been designated as cash flow hedges and the impact upon the foreign
exchange movements of other financial assets and liabilities is negligible.
Equity would have been $7.2 million lower/$8.8 million higher (2017: $9.4 million lower/$11.5 million higher) had the Australian
dollar weakened/strengthened by 10% against other currencies, arising mainly from forward foreign exchange contracts
designated as cash flow hedges. The impact on other Group assets and liabilities as a result of movements in exchange rates are not material.
A sensitivity of 10% was selected following review of historic trends.
(ii) Cashflow and fair value interest rate risk
Instruments used by the Group - interest rate swap contracts Bank loans of the economic entity currently bear an average variable interest rate of 3.36% (2017: 3.08%). It is policy to
protect part of the forecasted debt from exposure to increasing interest rates. Accordingly, the economic entity has
entered into interest rate swap contracts, under which it is obliged to receive interest at variable rates and to pay interest at
fixed rates. The contracts are settled on a net basis and the net amount receivable or payable at the reporting date is included in other receivables or other payables.
At period end, the Group was a party to multiple interest rate swaps for a total nominal value of $240.0 million (2017: $125.0
million). The Group also has $260.0 million (2017: $245.0 million) interest rate swaps in place for future periods up until May 2021 at an average rate of 2.42%.
The contracts require settlement of net interest receivable or payable each 90 days. The settlement dates coincide with the
dates on which interest is payable on the underlying debt. Swaps on the current debt balance cover approximately 56.0% (2017: 32.0%) of the loan principal outstanding. The average fixed interest rate is 2.43% (2017: 2.75%).
Interest rate risk exposures The economic entity’s exposure to interest rate risk and the effective weighted average interest rate by maturity periods is set
out in the following table:
Fixed interest maturing in
Notes
Floating interest rate
$m
1 year or less
$m
Over 1 to 5 years
$m
More than 5 years
$m
Non-interest
bearing $m
Total
$m
2018
Financial assets
Cash and cash equivalents 13.4 - - - 1.8 15.2
Trade and other receivables 7 - - - - 23.8 23.8
Total financial assets 13.4 - - - 25.6 39.0
Weighted average rate of
interest
1.50%
Financial liabilities
Trade and other payables 11 - - - - 391.4 391.4
Interest-bearing liabilities 12 428.6 3.0 6.5 - - 438.1
Provisions (employee benefits) 14 - - - - 69.3 69.3
Total financial liabilities 428.6 3.0 6.5 - 460.7 898.8
Weighted average rate of
interest 3.36%
Net financial (liabilities) / assets (415.2) (3.0) (6.5) - (435.1) (859.8)
For
per
sona
l use
onl
y

NOTES TO THE CONSOLIDATED FINANCIAL STATEMENTS (continued) For the period ended 30 June 2018
68 Super Retail Group Limited • Directors’ & Financial Reports 2018
20. Financial risk management (continued) (b) Market risk (continued) (ii) Cashflow and fair value interest rate risk (continued)
Group sensitivity The Group’s main interest rate risk arises from long-term borrowings. Borrowings issued at variable rates expose the Group to cash flow interest rate risk. Borrowings issued at fixed rates expose the Group to fair value interest rate risk. During the 2018
and 2017 financial years, the Group’s borrowings were at variable rates and were denominated in Australian dollars.
As at the reporting date, the Group had the following variable rate borrowings and interest rate swap contracts outstanding:
An analysis by maturities is provided in (d) below.
The Group risk management policy is to maintain fixed interest rate hedges of approximately 40% of anticipated debt levels over a 3 year period. The Group utilises interest rate swaps to hedge its interest rate exposure on borrowings.
As at 30 June 2018, if interest rates had changed by +/- 100 basis points from the year-end rates with all other variables held
constant, post-tax profit and equity for the year would have been $1.3 million lower/higher (2017: $1.9 million lower/higher), mainly as a result of higher/lower interest expense on bank loans.
(c) Credit risk Credit risk arises from cash and cash equivalents, favourable derivative financial instruments and deposits with banks and
financial institutions, as well as credit exposures to wholesale and retail customers, including outstanding receivables and
committed transactions.
(i) Risk management
Credit risk is managed on a Group basis. For banks and financial institutions, only independently rated parties with a minimum
rating of ‘A’ are accepted.
If wholesale customers are independently rated, these ratings are used. Otherwise, if there is no independent rating, risk
control assesses the credit quality of the customer, taking into account its financial position, past experience and other
factors. Individual risk limits are set based on internal or external ratings in accordance with limits set by the board. The compliance with credit limits by wholesale customers is regularly monitored by line management.
Fixed interest maturing in
Notes
Floating interest rate
$m
1 year or less
$m
Over 1 to 5 years
$m
More than 5 years
$m
Non-interest
bearing $m
Total
$m
2017
Financial assets
Cash and cash equivalents 18.1 - - - 1.8 19.9
Trade and other receivables 7 - - - - 42.6 42.6
Total financial assets 18.1 - - - 44.4 62.5
Weighted average rate of
interest
1.50%
Financial liabilities
Trade and other payables 11 - - - - 297.9 297.9
Interest-bearing liabilities 12 389.4 2.6 8.6 - - 400.6
Provisions (employee benefits) 14 - - - - 62.3 62.3
Total financial liabilities 389.4 2.6 8.6 - 360.2 760.8
Weighted average rate of
interest 3.08%
Net financial (liabilities) / assets (371.3) (2.6) (8.6) - (315.8) (698.3)
2018 2017
$m $m
Bank overdrafts and bank loans 430.0 391.0
Interest rate swaps 240.0 125.0
For
per
sona
l use
onl
y

NOTES TO THE CONSOLIDATED FINANCIAL STATEMENTS (continued) For the period ended 30 June 2018
Super Retail Group Limited • Directors’ & Financial Reports 2018 69
20. Financial risk management (continued) (c) Credit risk (continued) (i) Risk management (continued)
Sales to retail customers are required to be settled in cash or using major credit cards, mitigating credit risk. There are no
significant concentrations of credit risk, whether through exposure to individual customers, specific industry sectors and/or regions.
(ii) Security
For wholesale customers without credit rating, the Group generally retains title over the goods sold until full payment is received, thus limiting the loss from a possible default to the profit margin made on the sale. For some trade receivables the
Group may also obtain security in the form of guarantees, deeds of undertaking or letters of credit which can be called
upon if the counterparty is in default under the terms of the agreement. (d) Liquidity risk
Prudent liquidity risk management implies maintaining sufficient cash and the availability of funding through an adequate amount of committed credit facilities to meet obligations when due. Due to the dynamic nature of the underlying
businesses, finance department maintains flexibility in funding by maintaining availability under committed credit lines.
Management monitors rolling forecasts of the Group’s liquidity reserve (comprising the undrawn borrowing facilities below) and cash and cash equivalents on the basis of expected cash flows. In addition, the Group’s liquidity management policy
involves projecting cash flows in major currencies and considering the level of liquid assets necessary to meet these.
(i) Financing arrangements
2018 2017
Unrestricted access was available at balance date to the following lines of credit: $m $m
Total facilities
- bank debt funding facility 640.0 540.0
- multi-option facility (including indemnity/guarantee) 20.0 20.0
Total 660.0 560.0
Facilities used at balance date
- bank debt funding facility(1) 430.0 391.0
- multi-option facility (including indemnity/guarantee) 3.3 3.4
Total 433.3 394.4
Unused balance of facilities at balance date
- bank debt funding facility 210.0 149.0
- multi-option facility (including indemnity/guarantee) 16.7 16.6
Total 226.7 165.6
(1) As at 30 June 2018, $20.7 million (2017: $20.2 million) of the overdraft facility has been drawn and in accordance with financing
arrangements this is offset by cash funds in transit.
Current interest rates on bank loans of the economic entity are 3.25% - 3.51% (2017: 2.97% - 3.19%). (ii) Maturities of financial liabilities
The following tables analyse the Group’s financial liabilities into relevant maturity groupings based on their contractual
maturities for: - all non-derivative financial liabilities; and
- net and gross settled derivative financial instruments for which the contractual maturities are essential for an
understanding of the timing of the cash flows.
The amounts disclosed in the table are the contractual undiscounted cash flows. Balances due within 12 months equal their
carrying balances as the impact of discounting is not significant. For interest rate swaps the cash flows have been estimated
using forward interest rates applicable at the end of the reporting period.
For
per
sona
l use
onl
y
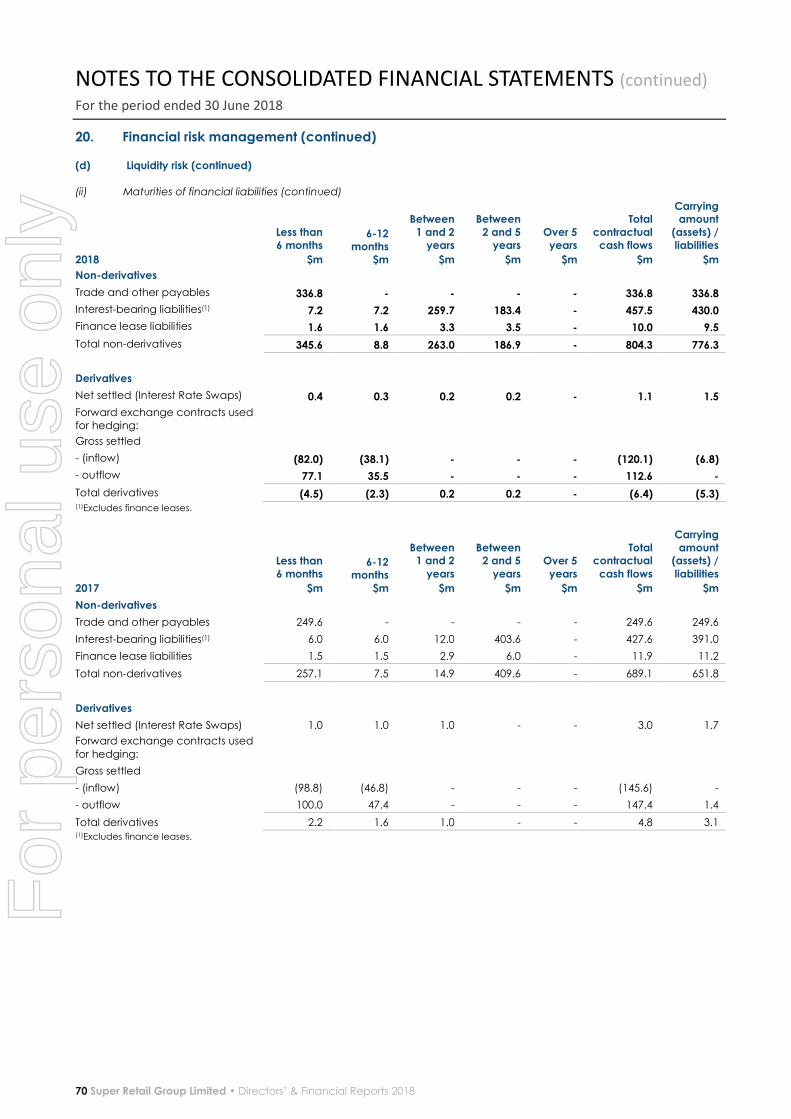
NOTES TO THE CONSOLIDATED FINANCIAL STATEMENTS (continued) For the period ended 30 June 2018
70 Super Retail Group Limited • Directors’ & Financial Reports 2018
20. Financial risk management (continued) (d) Liquidity risk (continued)
(ii) Maturities of financial liabilities (continued)
2018
Less than 6 months
$m
6-12 months
$m
Between 1 and 2
years
$m
Between 2 and 5
years
$m
Over 5 years
$m
Total contractual
cash flows
$m
Carrying amount
(assets) / liabilities
$m
Non-derivatives
Trade and other payables 336.8 - - - - 336.8 336.8
Interest-bearing liabilities(1) 7.2 7.2 259.7 183.4 - 457.5 430.0
Finance lease liabilities 1.6 1.6 3.3 3.5 - 10.0 9.5
Total non-derivatives 345.6 8.8 263.0 186.9 - 804.3 776.3
Derivatives
Net settled (Interest Rate Swaps) 0.4 0.3 0.2 0.2 - 1.1 1.5
Forward exchange contracts used
for hedging:
Gross settled
- (inflow) (82.0) (38.1) - - - (120.1) (6.8)
- outflow 77.1 35.5 - - - 112.6 -
Total derivatives (4.5) (2.3) 0.2 0.2 - (6.4) (5.3) (1)Excludes finance leases.
2017
Less than 6 months
$m
6-12 months
$m
Between 1 and 2
years
$m
Between 2 and 5
years
$m
Over 5 years
$m
Total contractual
cash flows
$m
Carrying amount
(assets) / liabilities
$m
Non-derivatives
Trade and other payables 249.6 - - - - 249.6 249.6
Interest-bearing liabilities(1) 6.0 6.0 12.0 403.6 - 427.6 391.0
Finance lease liabilities 1.5 1.5 2.9 6.0 - 11.9 11.2
Total non-derivatives 257.1 7.5 14.9 409.6 - 689.1 651.8
Derivatives
Net settled (Interest Rate Swaps) 1.0 1.0 1.0 - - 3.0 1.7
Forward exchange contracts used
for hedging:
Gross settled
- (inflow) (98.8) (46.8) - - - (145.6) -
- outflow 100.0 47.4 - - - 147.4 1.4
Total derivatives 2.2 1.6 1.0 - - 4.8 3.1 (1)Excludes finance leases.
For
per
sona
l use
onl
y

NOTES TO THE CONSOLIDATED FINANCIAL STATEMENTS (continued) For the period ended 30 June 2018
Super Retail Group Limited • Directors’ & Financial Reports 2018 71
21. Capital management
(a) Risk management
The Group’s objectives when managing capital are to safeguard their ability to continue as a going concern, so that they
can continue to provide returns for shareholders and benefits for other stakeholders, and maintain an optimal capital structure to reduce the cost of capital.
In order to maintain or adjust the capital structure, the Group may adjust the amount of dividends paid to shareholders,
return capital to shareholders, issue new shares or sell assets to reduce debt.
The Group monitors overall capital on the basis of the gearing ratio. The ratio is calculated as net debt divided by total
capital. Net debt is calculated as total borrowings less cash and cash equivalents. Total capital is calculated as equity as
shown in the consolidated balance sheet (including non-controlling interests) plus net debt.
During 2018 the Group’s strategy, which was unchanged from 2017, was to ensure that the gearing ratio remained below
50%. This target ratio range excludes the short-term impact of acquisitions. The gearing ratios at 30 June 2018 and 1 July 2017 were as follows:
2018 2017
$m $m
Total borrowings 438.1 400.6
Less: Cash & cash equivalents (15.2) (19.9)
Net Debt 422.9 380.7
Total Equity 799.2 754.6
Total Capital 1,222.1 1,135.3
Gearing Ratio 34.6% 33.5%
The Group monitors ongoing capital on the basis of the fixed charge cover ratio. The ratio is calculated as earnings before net finance costs, income tax, depreciation, amortisation and store and rental expense divided by fixed charge obligations
(being finance costs and store and distribution centre rental expenses). Rental expenses are calculated net of straight line
lease adjustments, while finance costs exclude non-cash mark-to-market losses or gains on interest rate swaps.
During 2018 the Group’s strategy, which was unchanged from 2017, was to maintain a fixed charge cover ratio of around 2.0
times and a net debt to EBITDA of below 2.5 times. The fixed charge cover and net debt to EBITDA ratios at 30 June 2018
and 1 July 2017 were as follows:
2018 2017
$m $m
Profit attributable to Owners of Super Retail Group Limited 128.3 101.8
Add: Taxation expense 48.8 40.2
Net finance costs 17.7 16.9
Depreciation and amortisation (excludes impairment) 77.3 70.8
EBITDA 272.1 229.7
Rental expense 232.6 216.9
EBITDAR 504.7 446.6
Net finance costs 17.7 16.9
Rental expense 232.6 216.9
Fixed charges 250.3 233.8
Fixed charge cover ratio 2.02 1.91
Net debt to EBITDA ratio 1.55 1.66
Fixed charge cover ratio from normalised net profit after tax(1) 2.13 2.12
Net debt to EBITDA ratio from normalised net profit after tax(1) 1.44 1.37 (1) Normalised EBITDAR is $521.2m (2017: $495.1m) and normalised EBITDA is $294.2m (2017: $278.2m)
(i) Loan Covenants
Financial covenants are provided by Super Retail Group Limited with respect to leverage, gearing, fixed charges coverage
and shareholder funds. The Group has complied with the financial covenants of its borrowing facilities during the 2018 and 2017 financial years. There are no assets pledged as security in relation to the unsecured debt in the 2018 financial year
(2017: nil).
For
per
sona
l use
onl
y
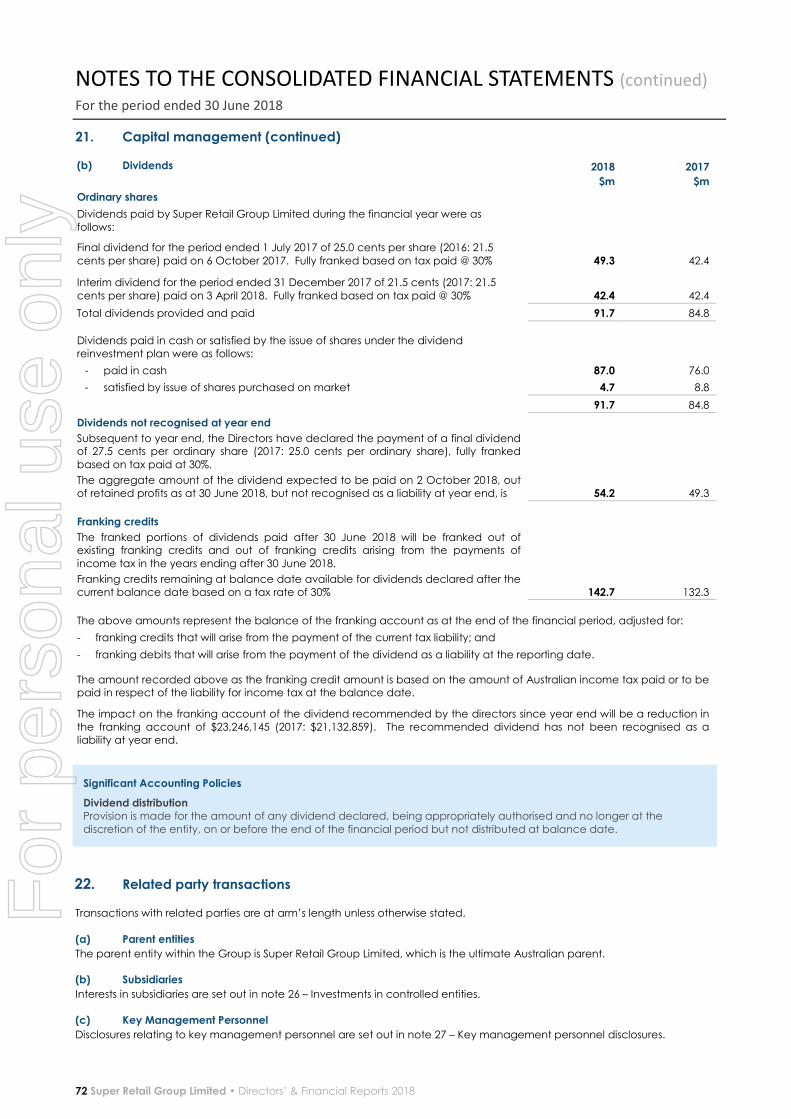
NOTES TO THE CONSOLIDATED FINANCIAL STATEMENTS (continued) For the period ended 30 June 2018
72 Super Retail Group Limited • Directors’ & Financial Reports 2018
21. Capital management (continued) (b) Dividends
2018
$m
2017
$m
Ordinary shares
Dividends paid by Super Retail Group Limited during the financial year were as
follows:
Final dividend for the period ended 1 July 2017 of 25.0 cents per share (2016: 21.5
cents per share) paid on 6 October 2017. Fully franked based on tax paid @ 30% 49.3 42.4
Interim dividend for the period ended 31 December 2017 of 21.5 cents (2017: 21.5
cents per share) paid on 3 April 2018. Fully franked based on tax paid @ 30% 42.4 42.4
Total dividends provided and paid 91.7 84.8
Dividends paid in cash or satisfied by the issue of shares under the dividend
reinvestment plan were as follows:
- paid in cash 87.0 76.0
- satisfied by issue of shares purchased on market 4.7 8.8
91.7 84.8
Dividends not recognised at year end
Subsequent to year end, the Directors have declared the payment of a final dividend of 27.5 cents per ordinary share (2017: 25.0 cents per ordinary share), fully franked
based on tax paid at 30%.
The aggregate amount of the dividend expected to be paid on 2 October 2018, out
of retained profits as at 30 June 2018, but not recognised as a liability at year end, is 54.2 49.3
Franking credits
The franked portions of dividends paid after 30 June 2018 will be franked out of existing franking credits and out of franking credits arising from the payments of
income tax in the years ending after 30 June 2018.
Franking credits remaining at balance date available for dividends declared after the
current balance date based on a tax rate of 30% 142.7 132.3
The above amounts represent the balance of the franking account as at the end of the financial period, adjusted for:
- franking credits that will arise from the payment of the current tax liability; and
- franking debits that will arise from the payment of the dividend as a liability at the reporting date.
The amount recorded above as the franking credit amount is based on the amount of Australian income tax paid or to be paid in respect of the liability for income tax at the balance date.
The impact on the franking account of the dividend recommended by the directors since year end will be a reduction in
the franking account of $23,246,145 (2017: $21,132,859). The recommended dividend has not been recognised as a
liability at year end.
22. Related party transactions Transactions with related parties are at arm’s length unless otherwise stated.
(a) Parent entities
The parent entity within the Group is Super Retail Group Limited, which is the ultimate Australian parent. (b) Subsidiaries
Interests in subsidiaries are set out in note 26 – Investments in controlled entities.
(c) Key Management Personnel
Disclosures relating to key management personnel are set out in note 27 – Key management personnel disclosures.
Significant Accounting Policies
Dividend distribution Provision is made for the amount of any dividend declared, being appropriately authorised and no longer at the
discretion of the entity, on or before the end of the financial period but not distributed at balance date.
For
per
sona
l use
onl
y
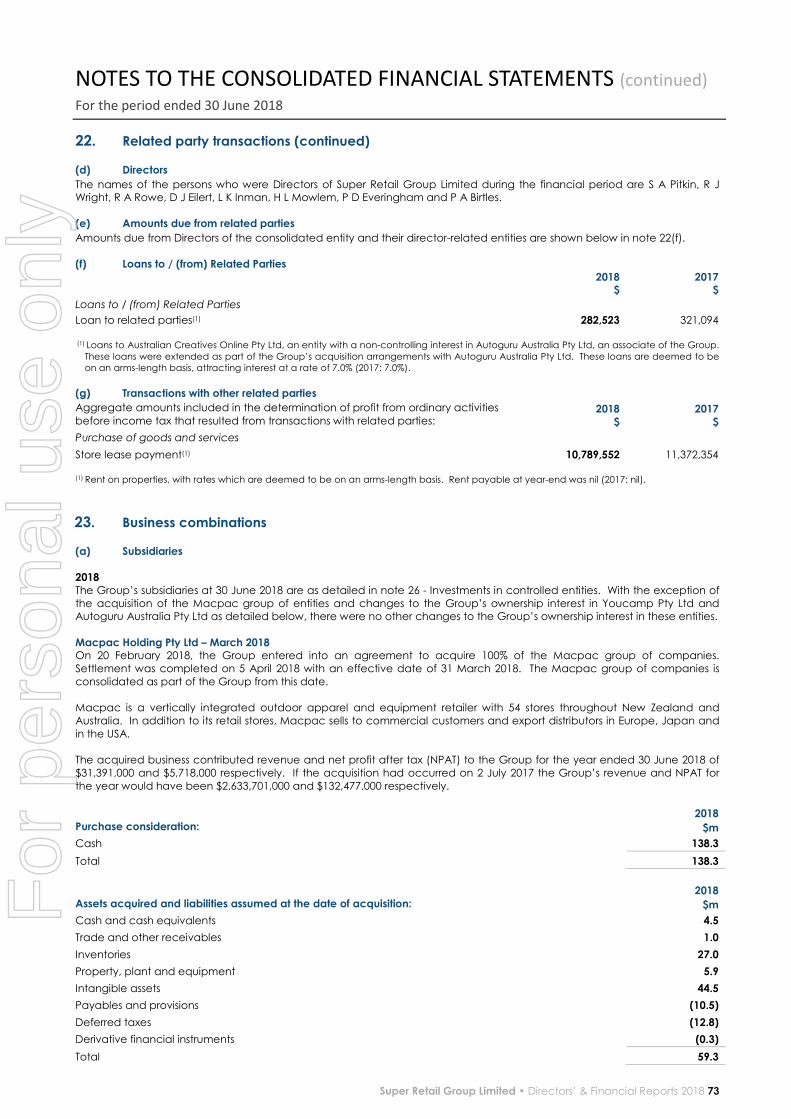
NOTES TO THE CONSOLIDATED FINANCIAL STATEMENTS (continued) For the period ended 30 June 2018
Super Retail Group Limited • Directors’ & Financial Reports 2018 73
22. Related party transactions (continued) (d) Directors
The names of the persons who were Directors of Super Retail Group Limited during the financial period are S A Pitkin, R J Wright, R A Rowe, D J Eilert, L K Inman, H L Mowlem, P D Everingham and P A Birtles.
(e) Amounts due from related parties
Amounts due from Directors of the consolidated entity and their director-related entities are shown below in note 22(f).
(f) Loans to / (from) Related Parties
2018
$ 2017
$
Loans to / (from) Related Parties
Loan to related parties(1) 282,523 321,094
(1) Loans to Australian Creatives Online Pty Ltd, an entity with a non-controlling interest in Autoguru Australia Pty Ltd, an associate of the Group.
These loans were extended as part of the Group’s acquisition arrangements with Autoguru Australia Pty Ltd. These loans are deemed to be
on an arms-length basis, attracting interest at a rate of 7.0% (2017: 7.0%).
(g) Transactions with other related parties
Aggregate amounts included in the determination of profit from ordinary activities
before income tax that resulted from transactions with related parties: 2018
$ 2017
$
Purchase of goods and services
Store lease payment(1) 10,789,552 11,372,354
(1) Rent on properties, with rates which are deemed to be on an arms-length basis. Rent payable at year-end was nil (2017: nil).
23. Business combinations (a) Subsidiaries
2018 The Group’s subsidiaries at 30 June 2018 are as detailed in note 26 - Investments in controlled entities. With the exception of
the acquisition of the Macpac group of entities and changes to the Group’s ownership interest in Youcamp Pty Ltd and Autoguru Australia Pty Ltd as detailed below, there were no other changes to the Group’s ownership interest in these entities.
Macpac Holding Pty Ltd – March 2018 On 20 February 2018, the Group entered into an agreement to acquire 100% of the Macpac group of companies.
Settlement was completed on 5 April 2018 with an effective date of 31 March 2018. The Macpac group of companies is
consolidated as part of the Group from this date.
Macpac is a vertically integrated outdoor apparel and equipment retailer with 54 stores throughout New Zealand and
Australia. In addition to its retail stores, Macpac sells to commercial customers and export distributors in Europe, Japan and
in the USA.
The acquired business contributed revenue and net profit after tax (NPAT) to the Group for the year ended 30 June 2018 of
$31,391,000 and $5,718,000 respectively. If the acquisition had occurred on 2 July 2017 the Group’s revenue and NPAT for
the year would have been $2,633,701,000 and $132,477,000 respectively.
Purchase consideration:
2018
$m
Cash 138.3
Total 138.3
Assets acquired and liabilities assumed at the date of acquisition:
2018
$m
Cash and cash equivalents 4.5
Trade and other receivables 1.0
Inventories 27.0
Property, plant and equipment 5.9
Intangible assets 44.5
Payables and provisions (10.5)
Deferred taxes (12.8)
Derivative financial instruments (0.3)
Total 59.3
For
per
sona
l use
onl
y
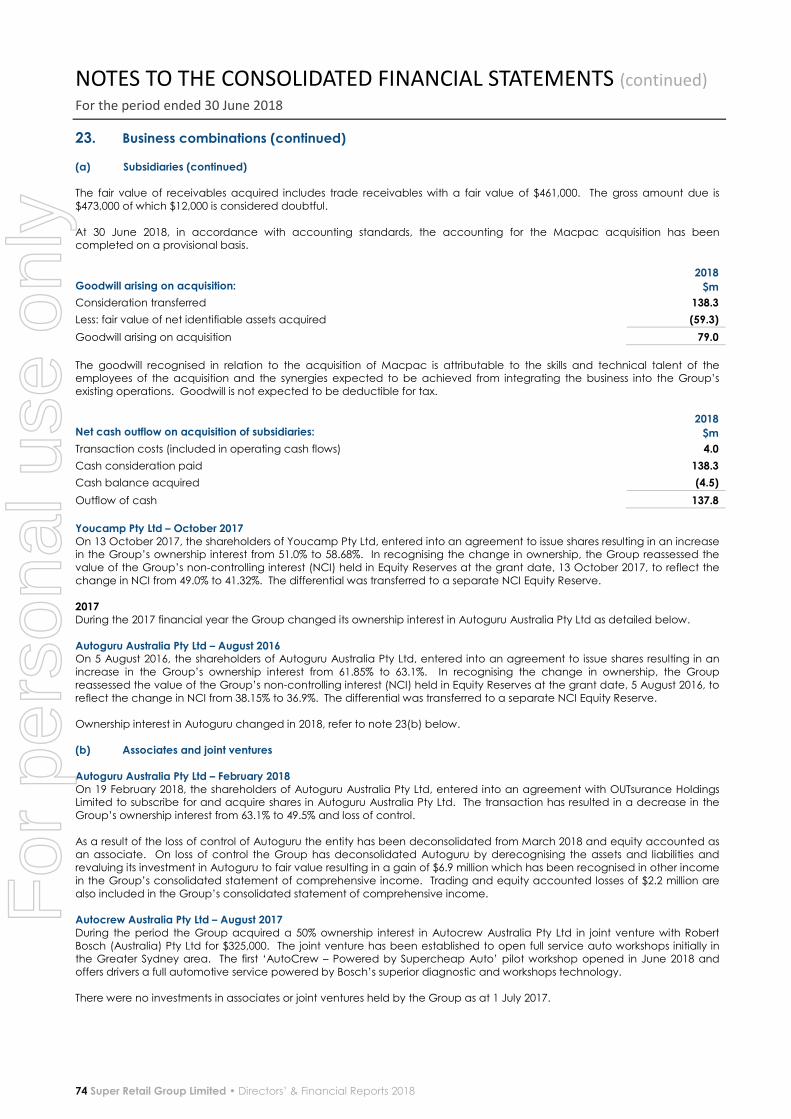
NOTES TO THE CONSOLIDATED FINANCIAL STATEMENTS (continued) For the period ended 30 June 2018
74 Super Retail Group Limited • Directors’ & Financial Reports 2018
23. Business combinations (continued)
(a) Subsidiaries (continued) The fair value of receivables acquired includes trade receivables with a fair value of $461,000. The gross amount due is
$473,000 of which $12,000 is considered doubtful.
At 30 June 2018, in accordance with accounting standards, the accounting for the Macpac acquisition has been completed on a provisional basis.
Goodwill arising on acquisition:
2018
$m
Consideration transferred 138.3
Less: fair value of net identifiable assets acquired (59.3)
Goodwill arising on acquisition 79.0
The goodwill recognised in relation to the acquisition of Macpac is attributable to the skills and technical talent of the employees of the acquisition and the synergies expected to be achieved from integrating the business into the Group’s
existing operations. Goodwill is not expected to be deductible for tax.
Net cash outflow on acquisition of subsidiaries:
2018
$m
Transaction costs (included in operating cash flows) 4.0
Cash consideration paid 138.3
Cash balance acquired (4.5)
Outflow of cash 137.8
Youcamp Pty Ltd – October 2017 On 13 October 2017, the shareholders of Youcamp Pty Ltd, entered into an agreement to issue shares resulting in an increase in the Group’s ownership interest from 51.0% to 58.68%. In recognising the change in ownership, the Group reassessed the
value of the Group’s non-controlling interest (NCI) held in Equity Reserves at the grant date, 13 October 2017, to reflect the
change in NCI from 49.0% to 41.32%. The differential was transferred to a separate NCI Equity Reserve. 2017 During the 2017 financial year the Group changed its ownership interest in Autoguru Australia Pty Ltd as detailed below.
Autoguru Australia Pty Ltd – August 2016 On 5 August 2016, the shareholders of Autoguru Australia Pty Ltd, entered into an agreement to issue shares resulting in an
increase in the Group’s ownership interest from 61.85% to 63.1%. In recognising the change in ownership, the Group
reassessed the value of the Group’s non-controlling interest (NCI) held in Equity Reserves at the grant date, 5 August 2016, to
reflect the change in NCI from 38.15% to 36.9%. The differential was transferred to a separate NCI Equity Reserve.
Ownership interest in Autoguru changed in 2018, refer to note 23(b) below.
(b) Associates and joint ventures
Autoguru Australia Pty Ltd – February 2018 On 19 February 2018, the shareholders of Autoguru Australia Pty Ltd, entered into an agreement with OUTsurance Holdings Limited to subscribe for and acquire shares in Autoguru Australia Pty Ltd. The transaction has resulted in a decrease in the
Group’s ownership interest from 63.1% to 49.5% and loss of control.
As a result of the loss of control of Autoguru the entity has been deconsolidated from March 2018 and equity accounted as an associate. On loss of control the Group has deconsolidated Autoguru by derecognising the assets and liabilities and
revaluing its investment in Autoguru to fair value resulting in a gain of $6.9 million which has been recognised in other income
in the Group’s consolidated statement of comprehensive income. Trading and equity accounted losses of $2.2 million are
also included in the Group’s consolidated statement of comprehensive income. Autocrew Australia Pty Ltd – August 2017 During the period the Group acquired a 50% ownership interest in Autocrew Australia Pty Ltd in joint venture with Robert
Bosch (Australia) Pty Ltd for $325,000. The joint venture has been established to open full service auto workshops initially in the Greater Sydney area. The first ‘AutoCrew – Powered by Supercheap Auto’ pilot workshop opened in June 2018 and
offers drivers a full automotive service powered by Bosch’s superior diagnostic and workshops technology.
There were no investments in associates or joint ventures held by the Group as at 1 July 2017.
For
per
sona
l use
onl
y

NOTES TO THE CONSOLIDATED FINANCIAL STATEMENTS (continued) For the period ended 30 June 2018
Super Retail Group Limited • Directors’ & Financial Reports 2018 75
24. Deed of cross guarantee
Super Retail Group Limited, A-Mart All Sports Pty Ltd, Auto Trade Direct Pty Ltd, Workout World Pty Ltd, Coyote Retail Pty
Limited, Foghorn Holdings Pty Ltd, Goldcross Cycles Pty Ltd, Ray’s Outdoors Pty Ltd, Rebel Pty Ltd, Rebel Group Limited, Rebel
Management Services Pty Limited, Rebel Sport Limited, Rebel Wholesale Pty Limited, Rebelsport.com Pty Limited, SCA Equity Plan Pty Ltd, SRG Leisure Retail Pty Ltd, SRGS Pty Ltd, Super Cheap Auto Pty Ltd, Super Retail Commercial Pty Ltd and Super
Retail Group Services Pty Ltd are parties to a Deed of Cross Guarantee under which each company guarantees the debts of
the others. By entering into the Deed, the wholly owned entities have been relieved from the requirement to prepare a financial report and directors’ report under ASIC Corporations (Wholly-owned Companies) Instrument 2016/785 issued by the
Australian Securities and Investments Commission.
(a) Consolidated Comprehensive Income Statement and Summary of Movements in Consolidated Retained Earnings
The above companies represent a Closed Group for the purposes of the Class Order, and as there are no other parties to the Deed of Cross Guarantee that are controlled by Super Retail Group Limited, they also represent the Extended Closed Group.
Set out below is a consolidated comprehensive income statement and a summary of movements in consolidated retained
earnings for the period ended 30 June 2018 of the Closed Group.
2018 2017
Consolidated Comprehensive Income Statement $m $m
Revenue from continuing operations 2,395.4 2,323.9
Other income from continuing operations 5.8 1.3
Total revenues and other income 2,401.2 2,325.2
Cost of sales of goods (1,323.8) (1,281.5)
Other expenses from ordinary activities
- selling and distribution (312.6) (306.6)
- marketing (78.4) (79.0)
- occupancy (202.5) (186.4)
- administration (304.3) (317.2)
Net finance costs (16.9) (16.3)
Share of net loss of associates and joint ventures (1.0) -
Total expenses (2,239.5) (2,187.0)
Profit before income tax 161.7 138.2
Income tax expense (45.1) (39.0)
Profit for the period 116.6 99.2
Statement of comprehensive income
Profit for the period 116.6 99.2
Other comprehensive income
Items that may be reclassified to profit or loss
Changes in the fair value of cash flow hedges 4.8 3.4
Other comprehensive income for the period, net of tax 4.8 3.4
Total comprehensive income for the period 121.4 102.6
Summary of movements in consolidated retained earnings
Retained profits at the beginning of the financial period 208.6 194.2
Profit for the period 116.6 99.2
Dividends paid (91.7) (84.8)
Retained profits at the end of the financial period 233.5 208.6
For
per
sona
l use
onl
y

NOTES TO THE CONSOLIDATED FINANCIAL STATEMENTS (continued) For the period ended 30 June 2018
76 Super Retail Group Limited • Directors’ & Financial Reports 2018
24. Deed of cross guarantee (continued) (b) Consolidated Balance Sheet
Set out below is a consolidated balance sheet as at 30 June 2018 of the Closed Group.
ASSETS 2018 2017
Current assets $m $m
Cash and cash equivalents - 13.9
Trade and other receivables 17.9 44.3
Inventories 491.5 454.1
Derivative financial instruments 5.2 -
Total current assets 514.6 512.3
Non-current assets
Other financial assets 182.9 37.7
Property, plant and equipment 250.3 250.9
Intangible assets 761.1 742.1
Total non-current assets 1,194.3 1,030.7
Total assets 1,708.9 1,543.0
LIABILITIES
Current liabilities
Trade and other payables 316.3 237.6
Interest-bearing liabilities 5.7 2.6
Current tax liabilities 6.8 2.2
Derivative financial instruments 1.5 3.1
Provisions 66.1 58.8
Total current liabilities 396.4 304.3
Non-current liabilities
Trade and other payables 48.3 43.3
Interest-bearing liabilities 435.1 397.9
Deferred tax liabilities 17.9 18.2
Provisions 21.2 20.1
Total non-current liabilities 522.5 479.5
Total liabilities 918.9 783.8
NET ASSETS 790.0 759.2
EQUITY
Contributed equity 542.3 542.3
Reserves 14.2 8.3
Retained profits 233.5 208.6
TOTAL EQUITY 790.0 759.2
For
per
sona
l use
onl
y

NOTES TO THE CONSOLIDATED FINANCIAL STATEMENTS (continued) For the period ended 30 June 2018
Super Retail Group Limited • Directors’ & Financial Reports 2018 77
25. Parent entity financial information
The individual financial statements for the parent entity show the following aggregate amounts:
2018
$m
2017
$m
Balance Sheet
Current assets 274.2 201.0
Total assets 1,078.9 1,005.7
Current liabilities 14.7 27.0
Total liabilities 443.4 416.4
NET ASSETS 635.5 589.3
Contributed equity 542.3 542.3
Reserves
- share-based payments 11.6 10.5
- cash flow hedges (1.0) (1.2)
Retained earnings 82.6 37.7
Total Equity 635.5 589.3
Profit after tax for the period 136.6 96.5
Total comprehensive income 136.8 98.0
Significant Accounting Policies
Parent entity financial information The financial information for the parent entity, Super Retail Group Limited has been prepared on the same basis as the
consolidated financial statements, except as set out below.
Investments in subsidiaries Investments in subsidiaries are accounted for at cost in the financial statements of Super Retail Group Limited.
Tax consolidation legislation
Super Retail Group Limited and its wholly-owned Australian controlled entities have implemented the tax consolidation
legislation.
The head entity, Super Retail Group Limited, and the controlled entities in the tax consolidated group account for current
and deferred tax amounts under the Separate taxpayer within Group approach in accordance with AASB Interpretation
1052, Tax Consolidation Accounting.
In addition to its own current and deferred tax amounts, Super Retail Group Limited also recognises the current tax
liabilities (or assets) and the deferred tax assets arising from unused tax losses and unused tax credits assumed from
controlled entities in the tax consolidated group.
The entities have also entered into a tax funding agreement under which the wholly-owned entities fully compensate
Super Retail Group Limited for any current tax payable assumed and are compensated by Super Retail Group Limited for
any current tax receivable and deferred tax assets relating to unused tax losses or unused tax credits that are transferred to Super Retail Group Limited under the tax consolidation legislation. The funding amounts are determined by reference
to the amounts recognised in the wholly-owned entities’ financial statements.
The amounts receivable/payable under the tax funding agreement are due upon receipt of the funding advice from the head entity, which is issued as soon as practicable after the end of each financial year. The head entity may also require
payment of interim funding amounts to assist with its obligations to pay tax instalments.
Assets or liabilities arising under tax funding agreements with the tax consolidated entities are recognised as current amounts receivable from or payable to other entities in the Group. Any difference between the amounts assumed and
amounts receivable or payable under the tax funding agreement are recognised as a contribution to (or distribution
from) wholly-owned tax consolidated entities.
Financial guarantees
Where the parent entity has provided financial guarantees in relation to loans and payables of subsidiaries for no
compensation, the fair values of these guarantees are accounted for as contributions and recognised as part of the cost of the investment.
For
per
sona
l use
onl
y

NOTES TO THE CONSOLIDATED FINANCIAL STATEMENTS (continued) For the period ended 30 June 2018
78 Super Retail Group Limited • Directors’ & Financial Reports 2018
26. Investments in controlled entities
The Group’s subsidiaries at 30 June 2018 are set out below. Unless otherwise stated, they have share capital consisting of
ordinary shares that are held directly by the Group, and the proportion of ownership interests held equals the voting rights held by the Group. The country of incorporation is also their principal place of business.
Equity Holding
Name of Entity Country of
Incorporation Principal Activities
2018
%
2017
%
A-Mart All Sports Pty Ltd(1) Australia Sports retail 100 100
Autoguru Australia Pty Ltd(6) Australia Auto services 48.5 63.1
Auto Trade Direct (NZ) Limited New Zealand Auto retail 100 100
Auto Trade Direct Pty Ltd(1) Australia Auto retail 100 100
BCF New Zealand Limited New Zealand Outdoor retail 100 100
Workout World Pty Limited(1)(2) Australia Sports retail 100 100
Coyote Retail Pty Limited(1) Australia Sports retail 100 100
Macpac New Zealand Limited(5) New Zealand Outdoor retail 100 100
Foghorn Holdings Pty Ltd(1) Australia Sports retail 100 100
Goldcross Cycles Pty Ltd(1) Australia Sports retail 100 100
Infinite Retail Pty Ltd Australia Sports retail 95 95
VBM Retail (HK) Limited(3) Hong Kong Sports retail 95 95
Infinite Retail UK Limited(3) United Kingdom Sports retail 95 95
VBM Retail NZ Limited(3) New Zealand Sports retail 95 95
Macpac Holdings Pty Ltd Australia Outdoor retail 100 -
Macpac Group Holdings Limited New Zealand Outdoor retail 100 -
Macpac Retail Pty Ltd Australia Outdoor retail 100 -
Macpac Limited New Zealand Outdoor retail 100 -
Macpac Enterprise New Zealand Outdoor retail 100 -
MP Finco Limited New Zealand Outdoor retail 100 -
Mouton Noir Management Pty Ltd Australia Outdoor retail 100 -
Mouton NOIR IP Limited New Zealand Outdoor retail 100 -
Oceania Bicycles Pty Ltd Australia Sports retail 100 100
Oceania Bicycles Limited(4) New Zealand Sports retail 100 100
Ray’s Outdoors New Zealand Limited New Zealand Outdoor retail 100 100
Ray’s Outdoors Pty Ltd(1) Australia Outdoor retail 100 100
Rebel Pty Ltd(1) Australia Sports retail 100 100
Rebel Group Limited(1) Australia Sports retail 100 100
Rebel Management Services Pty Limited(1) Australia Sports retail 100 100
Rebel Sport Limited(1) Australia Sports retail 100 100
Rebel Wholesale Pty Limited(1) Australia Sports retail 100 100
Rebelsport.com Pty Limited(1) Australia Sports retail 100 100
SCA Equity Plan Pty Ltd Australia Investments 100 100
SRG Leisure Retail Pty Ltd(1) Australia Outdoor retail 100 100
SRGS (New Zealand) Limited New Zealand Product acquisition and distribution 100 100
SRGS Pty Ltd(1) Australia Product acquisition and distribution 100 100
Super Cheap Auto (New Zealand) Pty Ltd New Zealand Auto retail 100 100
Super Cheap Auto Pty Ltd(1) Australia Auto retail 100 100
Super Retail Commercial Pty Ltd(1) Australia Auto retail 100 100
Super Retail Group Services (New Zealand) Limited New Zealand Support services 100 100
Super Retail Group Services Pty Ltd(1) Australia Support services 100 100
Super Retail Group Trading (Shanghai) Ltd China Product sourcing 100 100
Youcamp Pty Ltd Australia Leisure services 58.68 51 (1) These controlled entities have been granted relief from the necessity to prepare financial reports in accordance with ASIC Corporations
(Wholly-owned Companies) Instrument 2016/785 issued by the Australian Securities and Investments Commission. (2) Previously known as Coyote Retail Investments Pty Limited. (3) Investment is held directly by Infinite Retail Pty Ltd. (4) Investment is held directly by Oceania Bicycles Pty Ltd. (5) Previously known as FCO New Zealand Limited. (6) Ceased to be a subsidiary in March 2018 – refer note 23(b) - Business combinations.
For
per
sona
l use
onl
y

NOTES TO THE CONSOLIDATED FINANCIAL STATEMENTS (continued) For the period ended 30 June 2018
Super Retail Group Limited • Directors’ & Financial Reports 2018 79
27. Key management personnel disclosures
(a) Key management personnel compensation 2018 2017
$ $
Short-term employee benefits 5,768,055 7,003,923
Long-term employee benefits 54,336 49,283
Post-employment benefits 184,258 190,475
Share-based payments 543,148 1,085,428
6,549,797 8,329,109
The key management personnel remuneration in some instances has been paid by a subsidiary.
Loans to key management personnel There were no loans to individuals at any time.
Other transactions with key management personnel Aggregate amounts of each of the above types of other transactions with key management personnel of Super Retail
Group Limited:
2018 2017
Amounts paid to key management personnel as shareholders $ $
Dividends 28,538,241 26,392,262
28. Share-based payments
(a) Executive Performance Rights
The Company has established the Super Retail Group Executive Performance Rights Plan (Performance Rights) to assist in the
retention and motivation of executives of Super Retail Group (Participants). It is intended that the Performance Rights will
enable the Company to retain and attract skilled and experienced executives and provide them with the motivation to enhance the success of the Company.
Under the Performance Rights, rights may be offered to Participants selected by the Board. Unless otherwise determined by
the Board, no payment is required for the grant of rights under the Rights Plan.
Subject to any adjustment in the event of a bonus issue, each right is an option to subscribe for one Share. Upon the exercise
of a right by a Participant, each Share issued will rank equally with other Shares of the Company.
Performance Rights issued under the plan may not be transferred unless approved by the Board. The table below
summarises rights granted under the plan.
Number of Rights Issued Grant Date 2018
Balance at start of the
year (Number)
Granted during the
year (Number)
Exercised during the
year (Number)
Forfeited during the
year (Number)
Balance at the end of
the year (Number)
Unvested at the end of
the year (Number)
1 September 2014 479,724 - - (479,724) - -
1 September 2015 546,500 - - (35,000) 511,500 511,500
1 September 2016 571,775 - - (35,000) 536,775 536,775
1 September 2017 - 734,862 - (10,000) 724,862 724,862
1,597,999 734,862 - (559,724) 1,773,137 1,773,137
2017
1 September 2011 62,702 - (62,702) - - -
1 September 2012 - - - - - -
1 September 2013 368,508 - - (368,508) - -
1 September 2014 506,405 - - (26,681) 479,724 479,724
1 September 2015 575,615 - - (29,115) 546,500 546,500
1 September 2016 - 571,775 - - 571,775 571,775
1,513,230 571,775 (62,702) (424,304) 1,597,999 1,597,999
For
per
sona
l use
onl
y
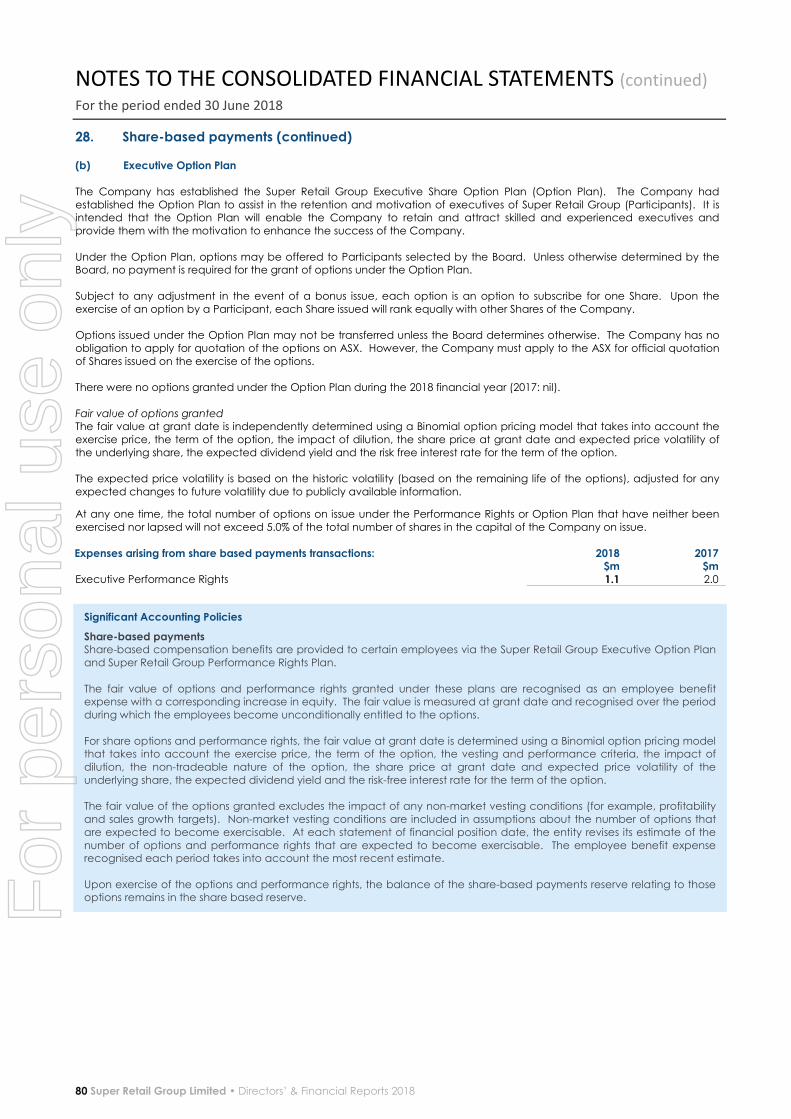
NOTES TO THE CONSOLIDATED FINANCIAL STATEMENTS (continued) For the period ended 30 June 2018
80 Super Retail Group Limited • Directors’ & Financial Reports 2018
28. Share-based payments (continued) (b) Executive Option Plan
The Company has established the Super Retail Group Executive Share Option Plan (Option Plan). The Company had
established the Option Plan to assist in the retention and motivation of executives of Super Retail Group (Participants). It is intended that the Option Plan will enable the Company to retain and attract skilled and experienced executives and
provide them with the motivation to enhance the success of the Company.
Under the Option Plan, options may be offered to Participants selected by the Board. Unless otherwise determined by the Board, no payment is required for the grant of options under the Option Plan.
Subject to any adjustment in the event of a bonus issue, each option is an option to subscribe for one Share. Upon the
exercise of an option by a Participant, each Share issued will rank equally with other Shares of the Company.
Options issued under the Option Plan may not be transferred unless the Board determines otherwise. The Company has no
obligation to apply for quotation of the options on ASX. However, the Company must apply to the ASX for official quotation
of Shares issued on the exercise of the options.
There were no options granted under the Option Plan during the 2018 financial year (2017: nil).
Fair value of options granted
The fair value at grant date is independently determined using a Binomial option pricing model that takes into account the
exercise price, the term of the option, the impact of dilution, the share price at grant date and expected price volatility of
the underlying share, the expected dividend yield and the risk free interest rate for the term of the option.
The expected price volatility is based on the historic volatility (based on the remaining life of the options), adjusted for any
expected changes to future volatility due to publicly available information.
At any one time, the total number of options on issue under the Performance Rights or Option Plan that have neither been
exercised nor lapsed will not exceed 5.0% of the total number of shares in the capital of the Company on issue.
Expenses arising from share based payments transactions: 2018
$m 2017
$m
Executive Performance Rights 1.1 2.0
Significant Accounting Policies
Share-based payments Share-based compensation benefits are provided to certain employees via the Super Retail Group Executive Option Plan
and Super Retail Group Performance Rights Plan.
The fair value of options and performance rights granted under these plans are recognised as an employee benefit expense with a corresponding increase in equity. The fair value is measured at grant date and recognised over the period
during which the employees become unconditionally entitled to the options.
For share options and performance rights, the fair value at grant date is determined using a Binomial option pricing model that takes into account the exercise price, the term of the option, the vesting and performance criteria, the impact of
dilution, the non-tradeable nature of the option, the share price at grant date and expected price volatility of the
underlying share, the expected dividend yield and the risk-free interest rate for the term of the option.
The fair value of the options granted excludes the impact of any non-market vesting conditions (for example, profitability
and sales growth targets). Non-market vesting conditions are included in assumptions about the number of options that
are expected to become exercisable. At each statement of financial position date, the entity revises its estimate of the
number of options and performance rights that are expected to become exercisable. The employee benefit expense recognised each period takes into account the most recent estimate.
Upon exercise of the options and performance rights, the balance of the share-based payments reserve relating to those options remains in the share based reserve.
For
per
sona
l use
onl
y

NOTES TO THE CONSOLIDATED FINANCIAL STATEMENTS (continued) For the period ended 30 June 2018
Super Retail Group Limited • Directors’ & Financial Reports 2018 81
29. Remuneration of auditors
During the period the following fees were paid or payable for services provided by the auditor of the parent entity, its related
practices and non-related audit firms.
2018
$
2017
$
(a) PricewaterhouseCoopers Australia
(i) Assurance services
Audit and review of financial statements 585,570 492,100
Other assurance(1) 44,721 191,700
Total remuneration for audit and other assurance services 630,291 683,800
(ii) Taxation services
Tax compliance services, including review of Company income tax returns 394,329 113,368
Total remuneration for taxation services 394,329 113,368
(iii) Other services
Customs prudential review 18,500 -
Digital advertising advisory 49,572 -
Workshop facilitation 51,601 -
Business review of subsidiary - 50,000
Total remuneration for advisory services 119,673 50,000
Total remuneration of PricewaterhouseCoopers Australia 1,144,293 847,168
(b) Network firms of PricewaterhouseCoopers Australia
(i) Taxation services
Tax compliance services, including review of Company income tax returns 66,924 66,803
Total remuneration for taxation services 66,924 66,803
Total remuneration of network firms of PricewaterhouseCoopers Australia 66,924 66,803
Total auditors’ remuneration 1,211,217 913,971 (1) Cyber security audit in 2018 and Risk Appetite assurance services in 2017.
It is the Group’s policy to employ PricewaterhouseCoopers on assignments additional to their statutory audit duties where
PricewaterhouseCoopers’ expertise and experience with the Group are important. These assignments are principally tax
advice and due diligence reporting on acquisitions, or where PricewaterhouseCoopers is awarded assignments on a
competitive basis. It is the Group’s policy to seek competitive tenders for all major consulting projects. The Board has considered the non-audit services provided during the year by the auditor, and in accordance with written advice provided
by resolution of the Audit and Risk Committee, is satisfied that the provision of those non-audit services during the year by the
auditor is compatible with, and did not compromise, the auditor independence requirements of the Corporations Act 2001.
30. Contingencies
2018 2017
$m $m
Guarantees
Guarantees issued by the bankers of the Group in support of various rental
arrangements.
The maximum future rental payments guaranteed amount to: 5.5 3.4
From time to time the Group is subject to legal claims as a result of its operations. An immaterial contingent liability may exist
for any exposure over and above current provisioning levels.
For
per
sona
l use
onl
y

NOTES TO THE CONSOLIDATED FINANCIAL STATEMENTS (continued) For the period ended 30 June 2018
82 Super Retail Group Limited • Directors’ & Financial Reports 2018
31. Commitments 2018
$m 2017
$m
Capital commitments
Commitments for the acquisition of plant and equipment contracted for at the
reporting date but not recognised as liabilities payable:
Within one year 2.9 3.5
Total capital commitments 2.9 3.5
Lease commitments
Commitments in relation to operating lease payments for property and motor vehicles
under non-cancellable operating leases are payable as follows:
Within one year 222.1 205.4
Later than one year but not later than five years 654.2 625.7
Later than five years 132.8 162.0
Less lease straight lining adjustment (note 11) (54.6) (48.3)
Total lease commitments 954.5 944.8
Future minimum lease payments expected to be received in relation to non-
cancellable sub-leases of operating leases 3.1 3.9
The Group leases various offices, warehouses and retail stores under non-cancellable operating leases. The leases have
varying terms, escalation clauses and renewal rights. On renewal the terms of the leases are renegotiated.
Finance leases
The Group leases various plant and equipment with a carrying amount of $9.9 million (2017: $11.2 million) under finance
leases expiring within five years.
2018
$m 2017
$m
Commitments in relation to finance leases are payable as follows:
Within one year 3.2 2.9
Later than one year but not later than five years 6.8 9.0
Minimum lease payments 10.0 11.9
Future finance charges (0.5) (0.7)
Total lease liabilities 9.5 11.2
Representing lease liabilities:
Current (note 12) 3.0 2.6
Non-current (note 12) 6.5 8.6
9.5 11.2
32. Net tangible asset backing 2018 2017
Cents Cents
Net tangible asset per ordinary share ($0.08) $0.34
Net tangible asset per ordinary share is calculated based on Net Assets of $799.2 million (2017: $754.6 million) less intangible assets of $891.6 million (2017: $750.1 million) adjusted for the associated deferred tax liability of $76.2 million (2017: $62.9
million). The number of shares used in the calculation was 197,240,020 (2017: 197,240,020).
33. Events occurring after balance date
No matter or circumstance has arisen since 30 June 2018 that has significantly affected, or may significantly affect:
(a) the Group’s operations in future financial years; or (b) the results of those operations in future financial years; or
(c) the Group’s state of affairs in future financial years.
For
per
sona
l use
onl
y
DIRECTORS’ DECLARATION
Super Retail Group Limited • Directors’ & Financial Reports 2018 83
In the Directors’ opinion:
(a) the financial statements and notes set out on pages 31 to 82 are in accordance with the Corporations Act 2001,
including:
(i) complying with Accounting Standards, the Corporations Regulations 2001 and other mandatory professional
reporting requirements; and (ii) giving a true and fair view of the consolidated entity's financial position as at 30 June 2018 and of its
performance for the financial period ended on that date; and
(b) there are reasonable grounds to believe that the Company will be able to pay its debts as and when they become due and payable; and
(c) at the date of this declaration, there are reasonable grounds to believe that the members of the Extended Closed
Group identified in note 24 will be able to meet any obligations or liabilities to which they are, or may become,
subject by virtue of the deed of cross guarantee described in note 24.
Note 2(a) confirms that the financial statements also comply with International Financial Reporting Standards as issued by
the International Accounting Standards Board.
The Directors have been given the declarations by the Group Managing Director and Chief Financial Officer required by
section 295A of the Corporations Act 2001.
This declaration is made in accordance with a resolution of the directors.
S A Pitkin P A Birtles Director Director
Brisbane 20 August 2018
For
per
sona
l use
onl
y

84 Super Retail Group Limited • Directors’ & Financial Reports 2018
Independent auditor’s report To the members of Super Retail Group Limited
Report on the audit of the financial report
Our opinion
In our opinion:
The accompanying financial report of Super Retail Group Limited (the Company) and its controlled entities (together the Group) is in accordance with the Corporations Act 2001, including:
(a) giving a true and fair view of the Group's financial position as at 30 June 2018 and of its financial performance for the year then ended
(b) complying with Australian Accounting Standards and the Corporations Regulations 2001.
What we have audited
The Group financial report comprises:
the consolidated balance sheet as at 30 June 2018
the consolidated statement of comprehensive income for the year then ended
the consolidated statement of changes in equity for the year then ended
the consolidated statement of cash flows for the year then ended
the notes to the consolidated financial statements, which include a summary of significant accounting policies
the directors’ declaration.
Basis for opinion
We conducted our audit in accordance with Australian Auditing Standards. Our responsibilities under those standards are further described in the Auditor’s responsibilities for the audit of the financial report section of our report.
We believe that the audit evidence we have obtained is sufficient and appropriate to provide a basis for our opinion.
Independence
We are independent of the Group in accordance with the auditor independence requirements of the Corporations Act 2001 and the ethical requirements of the Accounting Professional and Ethical Standards Board’s APES 110 Code of Ethics for Professional Accountants (the Code) that are relevant to our audit of the financial report in Australia. We have also fulfilled our other ethical responsibilities in accordance with the Code.
PricewaterhouseCoopers, ABN 52 780 433 757 480 Queen Street, BRISBANE QLD 4000, GPO Box 150, BRISBANE QLD 4000 T +61 7 3257 5000, F +61 7 3257 5999, www.pwc.com.au Liability limited by a scheme approved under Professional Standards Legislation.
For
per
sona
l use
onl
y

Super Retail Group Limited • Directors’ & Financial Reports 2018 85
Our audit approach
An audit is designed to provide reasonable assurance about whether the financial report is free from material misstatement. Misstatements may arise due to fraud or error. They are considered material if individually or in aggregate, they could reasonably be expected to influence the economic decisions of users taken on the basis of the financial report.
We tailored the scope of our audit to ensure that we performed enough work to be able to give an opinion on the financial report as a whole, taking into account the geographic and management structure of the Group, its accounting processes and controls and the industry in which it operates.
Materiality
For the purpose of our audit we used overall Group materiality of $8.8 million, which represents approximately 5% of the Group’s profit before tax.
We applied this threshold, together with qualitative considerations, to determine the scope of our audit and the nature, timing and extent of our audit procedures and to evaluate the effect of misstatements on the financial report as a whole.
We chose Group profit before tax from continuing operations because, in our view, it is the benchmark against which the performance of the Group is most commonly measured.
We utilised a 5% threshold based on our professional judgement, noting it is within the range of commonly acceptable profit-related thresholds.
Audit Scope
Our audit focused on where the Group made subjective judgements; for example, significant accounting estimates involving assumptions and inherently uncertain future events.
The Group is segmented into three divisions - Auto, Outdoor and Sports, and operates in three countries - Australia, New Zealand and China. The financial report is a consolidation of wholly owned and controlled subsidiaries. The accounting processes happen at the Group finance function at its head office in Brisbane.
Our audit procedures were mostly performed at this head office and also included site visits to stores and distribution centres in Australia and New Zealand to perform audit procedures over inventory. Our team included specialists in information technology and taxation and experts in actuarial and valuation.
Key audit matters
Key audit matters are those matters that, in our professional judgement, were of most significance in our audit of the financial report for the current period. The key audit matters were addressed in the context of our audit of the financial report as a whole, and in forming our opinion thereon, and we do not provide a separate opinion on these matters. Further, any commentary on the outcomes of a particular audit procedure is made in that context. We communicated the key audit matters to the Audit and Risk Committee.
For
per
sona
l use
onl
y

86 Super Retail Group Limited • Directors’ & Financial Reports 2018
Key audit matter How our audit addressed the key audit matter
Inventory valuation and provisions
Refer to Note 8 (Inventories), $545.5 million
The valuation of inventory and provisions for stock loss, stock valuation
and attributable overheads was a key audit matter because of the
judgements involved in the areas described below.
Stock loss provision
As inventory was counted by the Group on a cyclical basis during the
year, rather than in full at the end of the year, the stock loss provision at
30 June 2018 contained a degree of estimation as to the quantity and
value of projected stock items for items not counted at the year end
date.
Stock valuation provision
Inventory was recognised at the lower of cost and net realisable value
based on a rolling average selling price. The determination of the net
realisable value of inventory of a seasonal and discontinued nature
required a degree of estimation as to the clearance margin for these
stock items at balance date.
Attributable overheads
There is judgement involved in how much of the directly attributable
overheads associated with bringing inventory to its final destination for
sale are recognised as part of the cost of inventory.
Stock loss provision
We attended a sample of stock counts
throughout the year at the Group’s retail
stores and considered the results of stock
counts not observed.
For a sample of retail stores where we
attended cyclical counts, we obtained roll-
forward schedules showing activity in the
period between the stock count date and year
end date. We used the results of our cyclical
counts to reconcile opening balances, and year
end closing balances were reconciled to the
general ledger.
We re-performed the calculation for the
projected stock variance.
Stock valuation provision
For a sample of individual products, we
compared the recognised costs to the relevant
invoice and recalculated the allocation of
directly attributable costs.
We compared the carrying value at year end
date to the most recent sales price for a
sample of inventory items.
For a sample of seasonal and discontinued
inventory items, we compared the last stock
movement date to the relevant invoice and
assessed the mark down margin assigned to
that stock item by checking the current retail
prices of the items in stores.
Attributable overheads
On a sample basis, we considered the nature
of overhead costs capitalised by reading their
description on supporting documentation,
having regards to the types of costs allowable
by the accounting standards.
We checked the mathematical accuracy of the
calculation of the overhead costs attributed to
inventory and compared the amount to the
accounting records.
For
per
sona
l use
onl
y
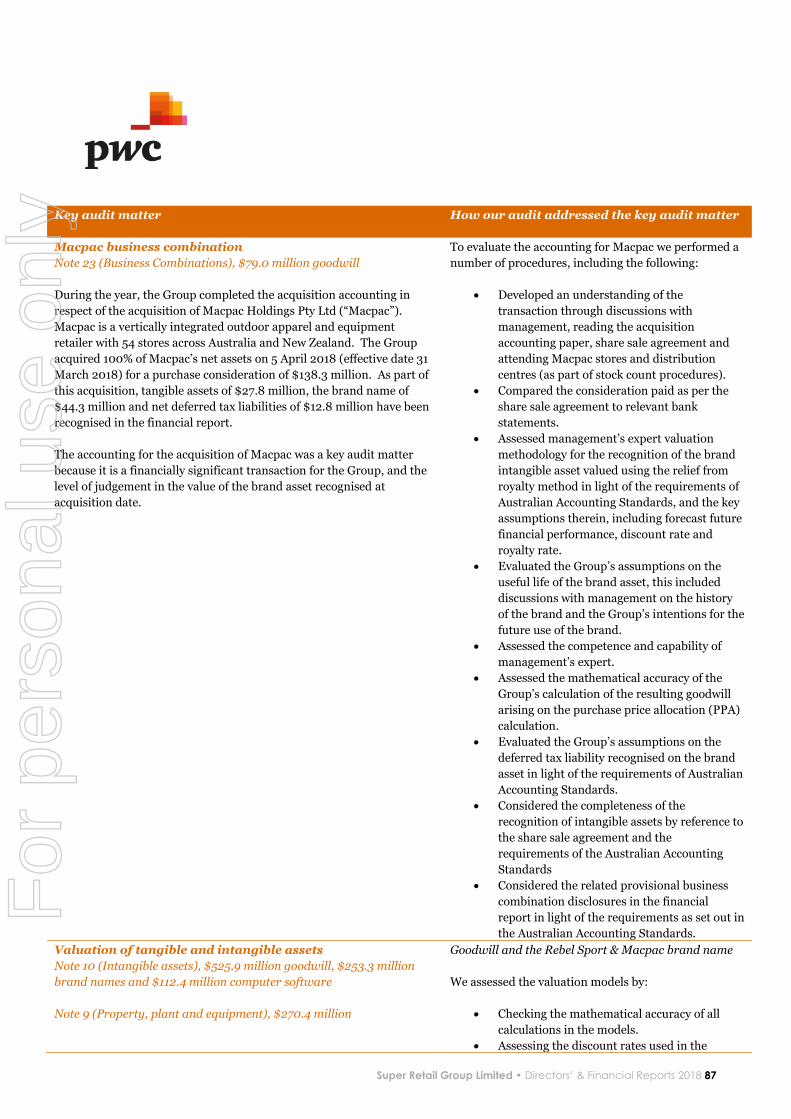
Super Retail Group Limited • Directors’ & Financial Reports 2018 87
Key audit matter How our audit addressed the key audit matter
Macpac business combination
Note 23 (Business Combinations), $79.0 million goodwill
During the year, the Group completed the acquisition accounting in
respect of the acquisition of Macpac Holdings Pty Ltd (“Macpac”).
Macpac is a vertically integrated outdoor apparel and equipment
retailer with 54 stores across Australia and New Zealand. The Group
acquired 100% of Macpac’s net assets on 5 April 2018 (effective date 31
March 2018) for a purchase consideration of $138.3 million. As part of
this acquisition, tangible assets of $27.8 million, the brand name of
$44.3 million and net deferred tax liabilities of $12.8 million have been
recognised in the financial report.
The accounting for the acquisition of Macpac was a key audit matter
because it is a financially significant transaction for the Group, and the
level of judgement in the value of the brand asset recognised at
acquisition date.
To evaluate the accounting for Macpac we performed a
number of procedures, including the following:
Developed an understanding of the
transaction through discussions with
management, reading the acquisition
accounting paper, share sale agreement and
attending Macpac stores and distribution
centres (as part of stock count procedures).
Compared the consideration paid as per the
share sale agreement to relevant bank
statements.
Assessed management’s expert valuation
methodology for the recognition of the brand
intangible asset valued using the relief from
royalty method in light of the requirements of
Australian Accounting Standards, and the key
assumptions therein, including forecast future
financial performance, discount rate and
royalty rate.
Evaluated the Group’s assumptions on the
useful life of the brand asset, this included
discussions with management on the history
of the brand and the Group’s intentions for the
future use of the brand.
Assessed the competence and capability of
management’s expert.
Assessed the mathematical accuracy of the
Group’s calculation of the resulting goodwill
arising on the purchase price allocation (PPA)
calculation.
Evaluated the Group’s assumptions on the
deferred tax liability recognised on the brand
asset in light of the requirements of Australian
Accounting Standards.
Considered the completeness of the
recognition of intangible assets by reference to
the share sale agreement and the
requirements of the Australian Accounting
Standards
Considered the related provisional business
combination disclosures in the financial
report in light of the requirements as set out in
the Australian Accounting Standards.
Valuation of tangible and intangible assets
Note 10 (Intangible assets), $525.9 million goodwill, $253.3 million
brand names and $112.4 million computer software
Note 9 (Property, plant and equipment), $270.4 million
Goodwill and the Rebel Sport & Macpac brand name
We assessed the valuation models by:
Checking the mathematical accuracy of all
calculations in the models.
Assessing the discount rates used in the
For
per
sona
l use
onl
y

88 Super Retail Group Limited • Directors’ & Financial Reports 2018
Key audit matter How our audit addressed the key audit matter
Goodwill and the Rebel Sport brand name $734.9 million
When the annual review for impairment was conducted, the recoverable
amount for each cash generating unit (CGU) was determined based on a
discounted cash flow valuation model which relied on the directors’
assumptions and estimates of future trading performance. The directors
consider that each segment and brand name constitutes its own CGU.
The key assumptions applied by the directors in the valuation models
were:
CGU-specific discount rates
future revenue growth
gross margin
Macpac brand name $44.3 million
Upon acquisition, the directors determined that Macpac’s goodwill
should be allocated to the Outdoor CGU.
The methodology applied in the valuation model is consistent with the
models described above for Rebel Sports.
The valuation of goodwill and brand names was a key audit matter
because of the judgements involved in determining the discount rate,
the estimated future revenue growth and the potential future return
from use of the brand name.
Computer software $112.4 million
The Group has undertaken significant development of software in
relation to the omni-channel customer programme and omni-channel
supply chain and inventory programme. The valuation of computer
software was a key audit matter because of the judgments involved in
assessing whether the recognition criteria of Australian Accounting
Standards had been met and in estimating the useful life of software.
Property Plant & Equipment $270.4 million
The directors determined that each retail store represented a separate
CGU when undertaking the impairment tests. Corporate assets were
included within the valuation assessment of the key segments (sports,
leisure and auto).
The key assumptions and judgements applied by the directors in the
impairment tests were:
The individual retail store contribution margin
The strategic initiatives in place for individual stores with
negative Group contribution margins.
valuation models, with support from PwC
valuation experts, by comparing the rates to
our internal benchmark data.
Comparing the forecasted growth rates to
relevant historical Group and industry data
and industry forecasts.
Comparing the gross margins to historical
Group data.
Evaluating the information included in the
valuation models against our knowledge of the
Group gained through reviewing the strategic
initiatives and meeting with managing
directors and commercial managers from each
segment.
Stress-testing the key assumptions in the
models, including: future revenue growth,
trading margins and discount rates; and
noting that the valuation under these
sensitivities was within an acceptable range,
which was determined taking into account
market data and historical data.
Evaluated the Group’s assessment that the
useful lives of indefinite life brand name
remained appropriate at year end. This
included discussions with management to
understand the Group’s future strategy.
Computer software
For a sample of software capitalised during the year, we
performed the following procedures, amongst others:
Assessed the nature of the costs capitalised in
light of the requirements of Australian
Accounting Standards.
Evaluated the reasonableness of the estimated
useful life estimated for software by
comparing it to industry benchmark data.
Property Plant & Equipment
We performed the following procedures, amongst
others:
Obtained management’s assessment of the
profitability of all individual stores and their
contribution margin to the Group
Considered and discussed the strategic
initiatives for stores with negative
contributions to the Group during meetings
with commercial managers for each brand.
For
per
sona
l use
onl
y
Super Retail Group Limited • Directors’ & Financial Reports 2018 89
Key audit matter How our audit addressed the key audit matter
Outdoor restructuring
Directors’ Report (Operating and Financial Review), $13.0 million
As part of the Macpac acquisition plan, the Group will integrate its
profitable Ray’s stores into the Macpac business in the fourth quarter of
the coming financial year. Costs associated with the business
restructuring and integration incurred during the reporting period total
$13.0 million before tax.
The outdoor restructuring provision was a key audit matter because of
the judgements used in calculating the restructuring provision,
specifically onerous leases and associated fixed asset impairment.
For the fixed assets and leasehold improvements we
ensured completeness of the listing by ensuring only
items from onerous stores had been written off.
For the Ray’s onerous lease provision, we performed
the following procedures over the Group’s calculations
and assumptions:
We checked that the costs included within the
provision were unavoidable future costs based
on the nature/description and our knowledge
of the contracts
Agreed a sample of estimates of unavoidable
costs to relevant invoices and lease
agreements
Checked the lease expiry period to the lease
agreements for the remaining leases
Compared the discount rate applied in the
calculation to the government bond rate,
which we consider was an appropriate
benchmark rate.
Provision for store set-up activities
Note 14 (Provisions) $7.9 million for estimated additional overtime
and allowances and $2.7 million for interest and on-costs.
The Group has identified that team members involved in store set-up
activities should have received additional amounts to the amounts paid.
The Group expects that remediation of this issue will be completed in
the next financial period.
The Group has determined an estimate of the impact for this payment
of $7.9 million for estimated additional overtime and allowances to
current and former team members, and $2.7 million for interest and on-
costs.
The provision for store set-up activities was a key audit matter because
of the estimation uncertainty and judgements used in determining the
overtime and allowance payments to be considered and calculating the
provision and the nature of the matter.
In assessing the provision for additional overtime and
allowance payments, our procedures included the
following:
Developed an understanding of the basis for
management’s best estimate of the provision
and the nature of the estimation uncertainty at
balance date
Tested the accuracy and completeness of
management’s model by agreeing the model
inputs to the supporting documentation and
checking inclusion in the model of data from
relevant source.
Stress-tested the key assumptions in the
models, being overtime hours and work
patterns, noting that the valuation under these
sensitivities was within an acceptable range,
which was determined by us, taking into
account historical data and professional
judgement.
Tested the mathematical accuracy of the
provision and its appropriateness in light of
the requirements of Australian Accounting
Standards.
We also considered the adequacy of the disclosures
made in the financial statements, including their
appropriateness under Australian Accounting
Standards.
For
per
sona
l use
onl
y

90 Super Retail Group Limited • Directors’ & Financial Reports 2018
Other information
The directors are responsible for the other information. The other information comprises the information included in the Group’s annual report for the year ended 30 June 2018, but does not include the financial report and our auditor’s report thereon. Prior to the date of this auditor’s report, the other information we obtained included the Director’s report. We expect the remaining other information to be made available to us after the date of this auditor’s report, including Our business, Chairman's and CEO's messages, Group strategy, Board of Directors and Group Leadership Team, Our people, Sustainability, Directors' report and Shareholder information. Our opinion on the financial report does not cover the other information and we do not and will not express an opinion or any form of assurance conclusion thereon. In connection with our audit of the financial report, our responsibility is to read the other information identified above and, in doing so, consider whether the other information is materially inconsistent with the financial report or our knowledge obtained in the audit, or otherwise appears to be materially misstated. If, based on the work we have performed on the other information that we obtained prior to the date of this auditor’s report, we conclude that there is a material misstatement of this other information, we are required to report that fact. We have nothing to report in this regard. When we read the other information not yet received as identified above, if we conclude that there is a material misstatement therein, we are required to communicate the matter to the directors and use our professional judgement to determine the appropriate action to take.
Responsibilities of the directors for the financial report
The directors of the Company are responsible for the preparation of the financial report that gives a true and fair view in accordance with Australian Accounting Standards and Corporations Act 2001 and for such internal control as the directors determine is necessary to enable the preparation of the financial report that gives a true and fair view and is free from material misstatement, whether due to fraud or error.
In preparing the financial report, the directors are responsible for assessing the ability of the Group to continue as a going concern, disclosing, as applicable, matters related to going concern and using the going concern basis of accounting unless the directors either intend to liquidate the Group or to cease operations, or have no realistic alternative but to do so.
Auditor’s responsibilities for the audit of the financial report
Our objectives are to obtain reasonable assurance about whether the financial report as a whole is free from material misstatement, whether due to fraud or error, and to issue an auditor’s report that includes our opinion. Reasonable assurance is a high level of assurance, but is not a guarantee that an audit conducted in accordance with the Australian Auditing Standards will always detect a material misstatement when it exists. Misstatements can arise from fraud or error and are considered material if, individually or in the aggregate, they could reasonably be expected to influence the economic decisions of users taken on the basis of the financial report.
A further description of our responsibilities for the audit of the financial report is located at the Auditing and Assurance Standards Board website at: http://www.auasb.gov.au/auditors_responsibilities/ar1.pdf. This description forms part of our auditor's report.
For
per
sona
l use
onl
y

Super Retail Group Limited • Directors’ & Financial Reports 2018 91
Report on the remuneration report
Our opinion on the remuneration report
We have audited the remuneration report included in pages 11 to 28 of the directors’ report for the year ended 30 June 2018.
In our opinion, the remuneration report of Super Retail Group Limited for the year ended 30 June 2018 complies with section 300A of the Corporations Act 2001.
Responsibilities
The directors of the Company are responsible for the preparation and presentation of the remuneration report in accordance with section 300A of the Corporations Act 2001. Our responsibility is to express an opinion on the remuneration report, based on our audit conducted in accordance with Australian Auditing Standards.
PricewaterhouseCoopers
Kim Challenor Brisbane Partner 20 August 2018
For
per
sona
l use
onl
y

SHAREHOLDER INFORMATION For the period ended 30 June 2018
92 Super Retail Group Limited • Directors’ & Financial Reports 2018
The shareholder information set out below was applicable as at 16 August 2018.
Number of Shareholders
There were 10,077 shareholders, holding 197,240,020 fully paid ordinary shares.
A. Distribution of equity securities
Analysis of numbers of equity security holders by size of holding:
Range Ordinary Shareholders
Performance Rights &
Option holders
1-1000 4,950 -
1,001-5,000 4,152 11
5,001-10,000 620 10
10,001-100,000 311 36
100,001 and over 44 5
Total 10,077 62
There were 543 holders of less than a marketable parcel of ordinary shares.
B. Equity security holders
The names of the twenty largest holders of quoted equity securities are listed below:
Name Ordinary shares
Number held Percentage of issued shares
SCA FT PTY LTD 56,575,423 28.68%
HSBC CUSTODY NOMINEES (AUSTRALIA) LIMITED 41,813,461 21.20%
J P MORGAN NOMINEES AUSTRALIA LIMITED 24,815,937 12.58%
CITICORP NOMINEES PTY LIMITED 14,857,978 7.53%
NATIONAL NOMINEES LIMITED 9,069,817 4.60%
BNP PARIBAS NOMS PTY LTD 7,104,950 3.60%
BNP PARIBAS NOMINEES PTY LTD 5,184,015 2.64%
CITICORP NOMINEES PTY LIMITED 1,257,455 0.64%
SCCASP HOLDINGS PTY LTD 1,078,703 0.55%
BNP PARIBAS NOMINEES PTY LTD 789,500 0.40%
BNP PARIBAS NOMS (NZ) LTD 722,258 0.37%
MR PETER ALAN BIRTLES 675,000 0.34%
MR PETER ALAN BIRTLES 665,000 0.34%
EQUITAS NOMINEES PTY LIMITED 602,372 0.31%
AMP LIFE LIMITED 579,907 0.29%
HSBC CUSTODY NOMINEES (AUSTRALIA) LIMITED-GSCO ECA 575,364 0.29%
EQUITAS NOMINEES PTY LIMITED 567,302 0.29%
EQUITAS NOMINEES PTY LIMITED 547,135 0.28%
EQUITAS NOMINEES PTY LIMITED 535,391 0.27%
NATIONAL NOMINEES LIMITED 535,086 0.27%
168,552,054 85.46%
For
per
sona
l use
onl
y

SHAREHOLDER INFORMATION (continued) For the period ended 30 June 2018
Super Retail Group Limited • Directors’ & Financial Reports 2018 93
C. Substantial shareholdings
As at 16 August 2018, there are four substantial shareholders that the Company is aware of:
Name Ordinary shares
Number held Percentage of issued
shares
Date of most
Recent notice
SCA FT PTY LTD 56,954,670 28.99% 02/08/2013
MACQUARIE GROUP LIMITED 10,720,317 5.43% 30/11/2017
YARRA FUNDS MANAGEMENT 12,841,080 6.51% 29/06/2018
VINVA INVESTMENT MANAGEMENT 12,007,196 6.09% 02/08/2018
D. Unquoted equity securities
As at 16 August 2018, there were 1,773,137 unlisted performance rights, granted to 62 holders, over unissued ordinary shares in the Company.
E. Voting rights
The voting rights relating to each class of equity securities is as follows:
a) Ordinary Shares
On a show of hands at a General Meeting of the Company, every member present in person or by proxy shall have one vote
and upon poll each person present in person or by proxy shall have one vote for each ordinary share held.
b) Options and Performance Rights
Performance Rights and Options do not have any voting rights.
F. Market buy-back There is currently no on market buy-back.
For
per
sona
l use
onl
y

For
per
sona
l use
onl
y

SUPER RETAIL GROUP LIMITED
ABN
81 108 676 204
Principal Registered Office
751 Gympie Road
LAWNTON QLD 4501 Australia
Telephone: +61 7 3482 7900
Facsimile: +61 7 3205 8522
For
per
sona
l use
onl
y