abn-amro - mobile networks - w
DESCRIPTION
mobile networks studyTRANSCRIPT

Industry250 Bishopsgate
London EC2M 4AA, UK
Tel: + 44 20 7678 8000
Fax: + 44 20 7678 7353
A S I A P A C I F I C
Hong Kong
ABN AMRO Asia Ltd
38th Floor, Cheung Kong Center
2 Queen’s Road Central, Hong Kong
Tel: +852 2700 3000
Tlx: HX 74111
Fax: +852 2700 5000
Auckland
ABN AMRO Equities (NZ) Ltd
+64 9 358 7500
Bangkok
ABN AMRO Asia Securities Public
Company Limited
+66 2 679 5790
Bombay
ABN AMRO Asia Equities (India) Ltd
+91 22 285 4363
Jakarta
PT ABN AMRO Asia Securities (Indonesia)
+62 21 515 1880
Kuala Lumpur
ABN AMRO Asia Equity Research
(Malaysia) Sdn Bhd
+60 3 2166 8213
Makati City
ABN AMRO Asia Securities (Philippines) Inc.
+63 2 867 7800
Port Louis
SBM ABN AMRO Asia Securities Ltd
+230 202 1473
Seoul
ABN AMRO Asia Limited
+82 2 2131 6400
Shanghai
ABN AMRO Asia Ltd
+86 21 5049 6333
Singapore
ABN AMRO Asia Securities
(Singapore) Pte Limited
+65 536 7688
Sydney
ABN AMRO Equities Australia Ltd
+61 2 8259 5000
Taipei
ABN AMRO Bank NV
+886 2 25037888
E U R O P E A N D A F R I C A
United Kingdom
ABN AMRO Equities (UK) Ltd
250 Bishopsgate
London EC2M 4AA, UK
Tel: +44 20 7678 8000
Fax: +44 20 7678 7353
Netherlands
ABN AMRO Bank N.V.
Gustav Mahlerlaan 10
1082 PP Amsterdam
The Netherlands
Tel: +31 20 628 9393
Fax: +31 20 628 7740
Brussels
ABN AMRO Bank N.V.
+32 2 546 0460
Bucharest
ABN AMRO Bank (Romania) S.A.
+40 1 2 020 400
Cairo
ABN AMRO Delta Securities (Egypt)
+20 2 3317480
Copenhagen
Alfred Berg Bank A/S
+45 33 961000
Dublin
ABN AMRO Stockbrokers (Ireland) Ltd
+353 1 609 3700
Frankfurt
ABN AMRO Bank (Deutschland) AG
+49 69 2690 00
Helsinki
Alfred Berg Finland Oy Ab
+358 9 228 321
Istanbul
ABN AMRO Bank NV
+90 212 2938802
Johannesburg
ABN AMRO Bank NV
+27 11 685 2000
Madrid
ABN AMRO Equities (Spain) S.A. SVB
+34 91 423 6900/82
Milan
ABN AMRO Bank N.V.
+39 02 722671
Oslo
Alfred Berg Norge A/S
+47 22 005000
Paris
ABN AMRO Securities (France) S.A.
+33 1 56 21 5000
Stockholm
Alfred Berg Fondkommission AB
+46 8 7235800
Warsaw
ABN AMRO Securities (Polska) S.A.
+48 22 573 0500
T H E A M E R I C A S
New York
ABN AMRO Inc.
Park Avenue Plaza
55 East 52nd Street,
6th Floor
New York, New York 10055
Tel: +1 212 409 1000
Fax: +1 212 409 5224
Boston
ABN AMRO Inc.
+1 617 753 6900
Chicago
ABN AMRO Inc.
+1 877 711 1781
Houston
ABN AMRO Inc.
+1 832 681 7100
Mexico
ABN AMRO Securities (Mexico) SA
+52555 2577800
San Francisco
ABN AMRO Inc.
+1 415 659 3086
Sao Paulo
Banco ABN AMRO Real
+55 11 31742600
Jamie Mariani
+44 20 7678 0243
Rodney Sherrington
+44 20 7678 1610
Marketing Analyst
Simon Carrington
+44 20 7678 0395
October 2002Pan-European Telecoms
3G Tsunami: the revolution begins
� The 3G growth opportunity
exists - in voice, not data,
services
� Network capacity could grow
five-fold
� 58% price cuts may deliver
30% ARPU growth by 2006
� Wireless stocks to rerate,
after initial period of
readjustment
� mmO2 and Orange offer
greatest long-term upside
potential
Pan
-Eu
ro
pean
Tele
co
ms
3G
Tsu
nam
i: the r
evo
lutio
n b
eg
ins
Octo
ber 2
00
2
3G-tsnunami-cov 15/10/02, 12:03 pm1

Please refer to terms relating to the provision of this research at the end of the document.
http://www.abnamroresearch.com
ABN AMRO UK250 BishopsgateLondonEC2M 4AAUnited Kingdom
IndustryMobile Networks - W. Europe
3G Tsunami: The revolution beginsLonger-term flat rate access plans and pre-to-post-paid migration
will drive structurally higher ARPUs and increased cash flow per sub.
In the interim price reductions will put pressure on margins. We
maintain a neutral stance and highlight mmo2 (Buy from Add) and
Orange (Buy) as preferred plays.
Summary of recommendations
New Recomm. Old Recomm. Price Target
Mmo2 Buy Add 60p
Orange Buy Buy €7.0
TIM Hold Hold €4.1
TEM Hold Hold €6.0
Vodafone Add Add 105pSource: ABN AMRO
The European cellular equity story has changed. While stale bulls
continue to cling to the 'blue sky' mobile data service vision, mobile voice
communication is the killer application. We believe wireless networks will
account for 30%-40% of originated traffic (from 10%-15% today),
structurally shifting ARPU by up to 30% by end 2006.
New entrant competition: We anticipate that H3G will adopt bucket
pricing plans throughout its operations in Europe (similar to VoiceStream in
the US). Aggressively priced bundles charged at a flat rate fee could result
in a structural shift in European cellular's share of GDP.
In Europe, 3G capacity enables voice substitution. We believe 3G
will increase available capacity by up to 5x in some markets. As wireless
voice prices decline towards a 50% premium to underlying fixed line prices,
we expect a material displacement of volume from fixed to mobile.
Ahead of rising ARPU, lower prices will hit profitablity, due to
declining gross telephony margins. Ironically, operators with
disproportionate exposure to the corporate market could suffer most, as
they cannabalise higher-value customers.
Prior to CYQ3 results we continue to prefer Orange (Buy) and mm02
(Buy from Add). We have reduced our price targets for TIM (€4.1 from €4.4)
and TEM (€6 from €6.7).
16 October 2002
Jamie Mariani
[email protected]+44 207 678 0243
Rodney Sherrington
[email protected]+44 207 678 1610
Telecom Networks
W. Europe
Europe-Ds Telecom Services
605.74
Sector Performance
435
935
1435
1935
2435
Aug-99 Aug-00 Aug-01
I N D US TR Y D E V E LO P M E N TS > CO R P O R A T E S TR A TEG Y
(1M) (3M) (12M)
Absolute -4.9% -6.6% -21.0%
Source: Datastream

M O B I L E N E T W O R K S - W . E U R O P E 1 6 O C T O B E R 2 0 0 2 2
In Brief…
What's ChangedPerformance. European wireless stocks have outperformed strongly since we last
looked in detail at the subsector (European Cellular Bear Trap dated 9 July 2002).
Industry restructuring, strong Q202 results and scope for even better numbers at the
Q3s have underpinned this achievement. Our preference for beta has been partially
validated with strong relative performance from Orange (Buy), Vodafone (Add) and
mmo2 (Buy from Add). To the end of the Q302 results season, we expect continued
strong share price movements. Beyond November the key management challenge will
be to turn volume into value.
Chart 1 : Relative share price performance (09/07/02 to date)
-20%-15%
4% 6% 7%10%
19%
-6%
-25%
-15%
-5%
5%
15%
25%
35%
FTSE EURO100
DJ Stoxx 50 FTSE GlobalTelco Services
TEM TIM mmo2 Vodafone Orange
Percentage change
Top picks
Source: ABN AMRO
Capacity and competition. The deployment of 3G networks throughout Europe will
increase capacity by up to 5x (with Italy most affected). Contrary to consensus
expectations (which focus on the long-promised data wave), we suspect that H3G
could introduce “bucket” pricing plans. It is our core belief that as cellular prices move
to a 50% premium to underlying fixed line prices, mass substitution could occur. We
believe that wireless networks will account for 30%-40% of originated traffic (from
10%-15% today), structurally shifting ARPUs by up to 30% by end 2006.
Unfortunately changing business model is unlikely to frictionless. We expect a
minimum 300-500bp contraction in margin.
Recommendations. We have upgraded mmo2 to Buy (from Add) and increased our
fair value estimate to 60p, reflecting recent consolidation in the German market and
the prosect of further restructuring. The Buy recommendation on Orange is
maintained, with a price target of €7. Price targets for the southern European
operators have been lowered to €4.1 and €6.0 for TIM and TEM respectively. We areleaving our view on Vodafone unchanged (Add, 105p price target).
E X E C U T I V E S U M M A R Y
M O B I L E N E T W O R K S - W . E U R O P E 1 6 O C T O B E R 2 0 0 2 3
A C T I O N P O I N T S
■ Ahead of CYQ302 results we prefer Orange and mmo2. This is framed
with reference to our core belief that in the event of (1) industry
restructuring, (2) strong Q3 (over Q2) ARPU expansion higher-risk stocks
will outperform.
■ During the medium term (into 2003), we would consider a change in
stance, reflecting our core belief that a change in business model (to
bucket pricing from tariff plans) could dramatically contract margins
(300-500bp). Operators with corporate exposure (eg Vodafone) look
particularly exposed. Longer term we continue to prefer the higher-beta
plays, recognising the potential of F2M substitution.
Issues to Consider
The mobile data services vision is increasingly bankrupt. The core problem
facing Europe’s wireless operators is simple, identifying opportunities large enough to
drive top-line growth today’s absolute level. In our view, data services should be
viewed as an incremental bonus. Disciplined capital investment should require focuson revenue streams, where sufficient demand exists to validate investment.
Fixed to mobile substitution offers a compelling second leg of growth. In the
short term, pre-to-post-paid migration is the most important driver of the top line.
Our forecasts imply 4%-8% blended ARPU growth from this dynamic over the next
four years. During the medium term we expect wireless networks to grab 30%-40%
share of outgoing total traffic by year-end 2006, driven by price cuts of about 50%-
60%. This could structurally shift ARPU upwards by around 30% by year-end 2006.
Bucket pricing plans facilitate displacement and are superior. US operators
have maintained high ARPUs by not targeting lower value prepaid subs, and through
the introduction of bucket plans. The US model generates higher EBITDA per
subscriber. Similar to the impact VoiceStream had on the US, H3G could be thecatalyst in Europe for driving voice substitution through flat rate access.
3G provides capacity to drive wireline volume displacement. European 2G
capacity constraints have prohibited the introduction of bucket pricing plans. We do
not buy into the “3G is data” proposition (3G is capacity). We estimate that W-CDMA,
using a conservative 20% increase in spectral efficiency, results in a 1.7x-2.8xincrease in capacity. In densely populated areas, capacity could increase by up to 5x.
Switching between business models will cause friction. In our view (should
bucket pricing plans emerge), a margin contraction is inevitable. Dramatically falling
prices will drive structurally lower gross telephony margins. Ironically, operators with
exposure to the corporate market could be the worst affected. Notwithstanding this
uncertainty, longer-term investors should view fixed to mobile substitution as a
potentially unique opportunity. We cannot think of any other sector in the wider
economy that offers such easily identifiable growth.

M O B I L E N E T W O R K S - W . E U R O P E 1 6 O C T O B E R 2 0 0 2 4
Contents
I N D U S T R Y D Y N A M I C S
Data services dream 7
The mobile data services vision appears increasingly bankrupt. Global SMSrevenue amounted to about US$13bn (approximately £8.7bn) in 2001,contributing a mere 4% to total global mobile revenue of nearly US$300bn(approx...
Introduction 7
M A C R O D Y N A M I C S
Fixed to mobile substitution 21
In the short term, pre-to-post-paid migration is the most important driver ofrevenue growth. We believe high prepaid call charges have stunted usage. Ourforecasts imply about 4% annual growth in blended ARPU over the n...
Introduction 21
I N V E S T M E N T V I E W
Bucket pricing plans 45
Despite intense competition, US operators have maintained high ARPU levels bynot targeting lower-value prepay subscribers, and through the introduction of“bucket plans.” US operators have increased the number of free m...
Introduction 45
Bucket plans generate higher ARPU and usage 47
Average yield based on actual minutes used 51
S E C T O R D Y N A M I C S
3G as the facilitator 59
In our view, European 2G capacity constraints have prohibited the introduction ofbucket pricing plans (and by association fixed-to-mobile substitution). While 3Gmay facilitate the use of high-speed applications, the re...
Introduction 59
N E W S H I G H L I G H T
Fixed-line tariff rebalancing 71
Fixed-line tariff rebalancing is a significant topic that merits more space than wehave in this note (hence our intention to revisit it at a later date). However, wemust recognise that fixed line tariff rebalancing pro...
Background 71
R I S K A N A L Y S I S
Economic impact 73
We see between 10% and 25% upside from our existing fair value estimates forthe European wireless community as a result of (1) our pre-to-post-paidmigration thesis and (2) our central case fixed-to-mobile substitution...
Timing 73
T A B L E O F C O N T E N T S
M O B I L E N E T W O R K S - W . E U R O P E 1 6 O C T O B E R 2 0 0 2 5
A P P E N D I X
European 3G licensing conditions 81
In this section we have presented regulatory requirements for rollout by majorEuropean market. License duration ranges between 12 and 20 years, with sharplydivergent coverage requirements by country. In Korea, we note...
Technical glossary 82
Erlang 82
T E A M
Acknowledgements 83

M O B I L E N E T W O R K S - W . E U R O P E 1 6 O C T O B E R 2 0 0 2 6
This page has been left intentionally blank

M O B I L E N E T W O R K S - W . E U R O P E 1 6 O C T O B E R 2 0 0 2 7
I N D U S T R Y D Y N A M I C S
Data services dream
The mobile data services vision appears increasingly bankrupt. Global SMS revenue
amounted to about US$13bn (approximately £8.7bn) in 2001, contributing a mere
4% to total global mobile revenue of nearly US$300bn (approximately £200bn). In
the E5 (France, Germany, Italy, Spain and the UK), we estimate mobile revenue of
€75bn was generated during 2001. The core problem facing Europe’s wireless
operators is simple, identifying opportunities large enough to drive top-line growth
from this absolute level. Contrary to some commentators’ expectations, we do not
believe that MMS will materially affect European operators’ top line during the next
24 months. Disciplined capital investment should require operators to focus on
identifiable revenue streams. In our view data should be viewed as an incremental
“bonus.”
Introduction
In this section of the note we present:
■ the size of the E5 voice and data market (€75bn and €6bn, respectively);
■ the absolute revenue required to generate a material upside surprise (€9bn);
■ the validity of operator-articulated targets for data as a percentage of revenue;
■ our view on the sustainability of the low volume/high prices of SMS;
■ the problem of scale – why MMS will struggle to drive growth;
■ the potential cannibalisation of voice/SMS by MMS; and
■ a preliminary assessment of the margin/capex impact of take-up.
Data services lookincreasingly like the ‘bettermousetrap’ nobody wants

I N D U S T R Y D Y N A M I C S
M O B I L E N E T W O R K S - W . E U R O P E 1 6 O C T O B E R 2 0 0 2 8
European revenue
In the E5, we estimate that mobile revenue of €75bn was generated during 2001,
accounting for about 1.1% of GDP. The problem facing Europe’s major operators is
clear – identifying opportunities large enough to generate material growth from thisabsolute number.
Table 1 : E5 total revenue (€m) calendarised
1999E 2000E 2001E
France 8,863 12,343 15,046
% Change 39% 22%
Germany 10,729 15,057 16,480
% Change 40% 9%
Italy 11,671 13,808 15,534
% Change 18% 12%
Spain 6,523 8,107 9,615
% Change 24% 19%
UK 11,975 16,384 18,582
% Change 37% 13%
Total E5 49,761 65,699 75,257
% Change 32% 15%
Source: ABN AMRO estimate
Data revenue
Relative to the absolute size of the European cellular market, data pales by
comparison. We calculate that data revenue of €6.3bn was posted in 2001,
corresponding to a small 8.3% of the total top line, or nearly 10% of service
revenue.
Major operator revenue outlook
As the absolute size of operators’ revenue line grows further, future growth
becomes more difficult. We calculate that to deliver 5%-10% upside surprise at the
top line, Europe’s major operators would need to generate an additional €4.5bn-
9.0bn to December 2002/March 2003 (see following table), corresponding to thetotal top line of the UK IT Hardware sector.
Table 2 : Revenue by major operator
Unit Revenue2002/03F
5% Upside 10% upside
mmo2 £m 4,815 241 481
Orange €m 16,877 844 1,688
TIM €m 10,648 532 1,065
TEM €m 9,096 455 910
Vodafone £m 29,480 1,474 2,948
Total Revenue €m 88,063 4,403 8,806
Source: ABN AMRO
Wireless revenue of €75bnwas generated during 2001in the E5
Scale creates growthdifficulties
Revenue upside would needto register scale in line withthe top line of the UK IThardware sector
I N D U S T R Y D Y N A M I C S
M O B I L E N E T W O R K S - W . E U R O P E 1 6 O C T O B E R 2 0 0 2 9
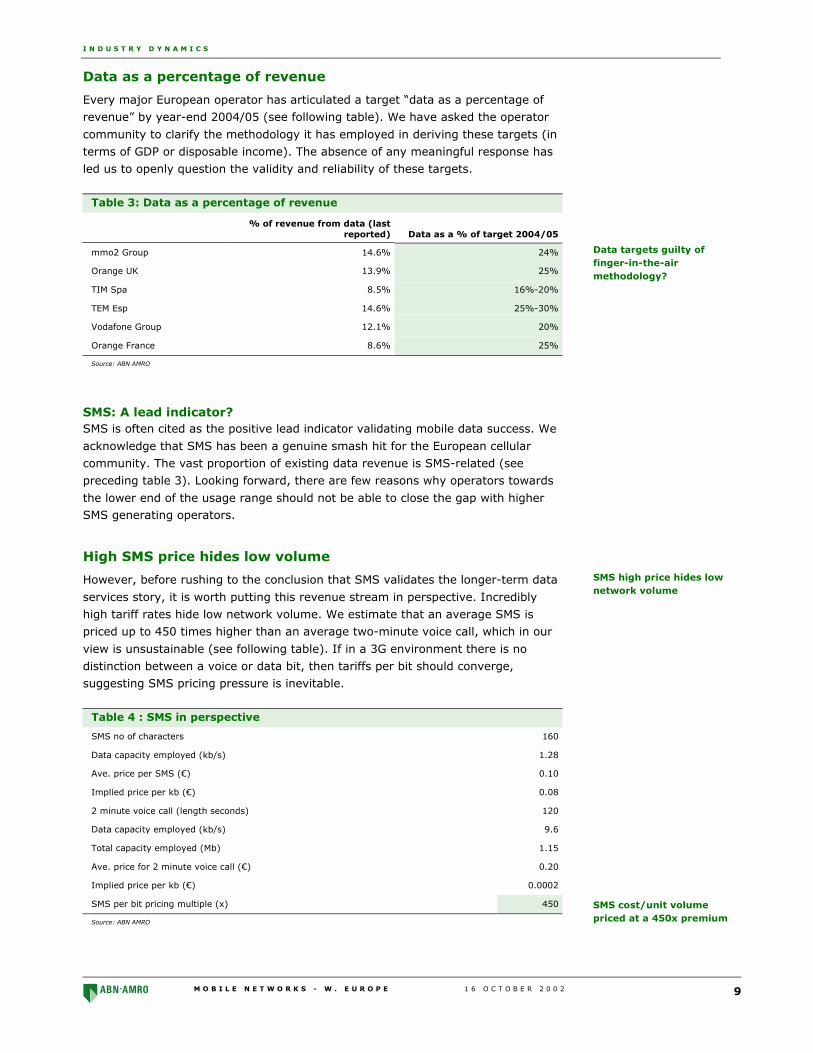
Data as a percentage of revenue
Every major European operator has articulated a target “data as a percentage of
revenue” by year-end 2004/05 (see following table). We have asked the operator
community to clarify the methodology it has employed in deriving these targets (in
terms of GDP or disposable income). The absence of any meaningful response has
led us to openly question the validity and reliability of these targets.
Table 3: Data as a percentage of revenue
% of revenue from data (lastreported) Data as a % of target 2004/05
mmo2 Group 14.6% 24%
Orange UK 13.9% 25%
TIM Spa 8.5% 16%-20%
TEM Esp 14.6% 25%-30%
Vodafone Group 12.1% 20%
Orange France 8.6% 25%
Source: ABN AMRO
SMS: A lead indicator?SMS is often cited as the positive lead indicator validating mobile data success. We
acknowledge that SMS has been a genuine smash hit for the European cellular
community. The vast proportion of existing data revenue is SMS-related (see
preceding table 3). Looking forward, there are few reasons why operators towards
the lower end of the usage range should not be able to close the gap with higherSMS generating operators.
High SMS price hides low volume
However, before rushing to the conclusion that SMS validates the longer-term data
services story, it is worth putting this revenue stream in perspective. Incredibly
high tariff rates hide low network volume. We estimate that an average SMS is
priced up to 450 times higher than an average two-minute voice call, which in our
view is unsustainable (see following table). If in a 3G environment there is no
distinction between a voice or data bit, then tariffs per bit should converge,
suggesting SMS pricing pressure is inevitable.
Table 4 : SMS in perspective
SMS no of characters 160
Data capacity employed (kb/s) 1.28
Ave. price per SMS (€) 0.10
Implied price per kb (€) 0.08
2 minute voice call (length seconds) 120
Data capacity employed (kb/s) 9.6
Total capacity employed (Mb) 1.15
Ave. price for 2 minute voice call (€) 0.20
Implied price per kb (€) 0.0002
SMS per bit pricing multiple (x) 450
Source: ABN AMRO
Data targets guilty offinger-in-the-airmethodology?
SMS high price hides lownetwork volume
SMS cost/unit volumepriced at a 450x premium

I N D U S T R Y D Y N A M I C S
M O B I L E N E T W O R K S - W . E U R O P E 1 6 O C T O B E R 2 0 0 2 10
Actual capacity used close to 0%
We estimate that SMS traffic is close to 0% of total traffic carried. Even in the
youth segment (the keenest users of SMS), we understand that SMS traffic
represents less than 0.5% of total traffic. We can demonstrate this with reference
to TIM, the leading Italian operator. To June 2002, TIM generated 17.8bn voice
minutes and 3.8bn messages (see following table).
Table 5 : SMS capacity in perspective
Jun-02
Voice minutes (m) 17,842
Average length (seconds) 60
Capacity employed per second (kb/s) 9.6
Capacity employed per minute (kb/s) 576.0
Total capacity employed (Mb) 10,277
SMS volume (m) 3,826
Ave. no of characters per SMS 160
Capacity employed per SMS (kb/s) 1.28
Capacity employed (Mb) 4.9
SMS as a % of total traffic 0.05%
Source: ABN AMRO
We calculate that SMS as a percentage of total traffic accounts for about 0.05% of
usage. While Italy does not “lead the curve” in terms of SMS usage, our example
underlines an important point, namely, the tiny volume contribution of SMS.
Regulator interest in SMS
We also note that OFTEL, the UK regulator, is examining UK SMS termination rates,
following a complaint by an unnamed operator. At present, SMS termination rates
are unregulated, leaving operators free to set rates. The four UK operators
currently charge a termination rate of 3p per message. This is approximately 3x the
rate of fixed-line termination charges in the UK, and 30% of voice cellular
termination fees. A risk to forecasts is that the “cost price” of SMS becomes an
important determinant of retail prices as a result of regulatory intervention. We
also highlight the role OFTEL plays as an opinion leader in European regulation.
MMS: The silver bullet?Multimedia Messaging Service (MMS) allows users to send and receive messages
with colour photos, voice, sound and text. Data bulls have suggested that the MMS
has immense potential (see following chart). According to Mobile Streams by 2008,MMS volume globally is expected to be double that of SMS.
SMS capacity used minimal
TIM SMS less than 1% oftotal traffic
SMS termination rates maycome under increasingscrutiny
Data bulls continue tobelieve in the ‘power’ ofMMS

I N D U S T R Y D Y N A M I C S
M O B I L E N E T W O R K S - W . E U R O P E 1 6 O C T O B E R 2 0 0 2 11
Chart 2 : Monthly mobile messaging volume at year-end, 2002-2008
0
10,00
20,000
30,000
40,000
50,000
60,000
70,000
80,000
90,000
100,00
Monthly total global Monthly total global
Monthly total global
Source: Mobile streams
Our discussions with investors suggest to us that MMS is still perceived as the silver
bullet for European cellular. Following the somewhat unexpected success of SMS,
the market appears to believe that MMS provides the next step on the long path to
build a credible mobile data equity story.
2002/03: An important year for messaging?MMS was widely launched across Europe during 1H02. Historically, we (incorrectly)
viewed the potential of MMS as the largest potential upside risk to our short-term
forecasts. Today we do not expect a material impact on group revenue for any ofEurope’s major cellular operators this year (or next year) from MMS.
The problem of scale – Sha-mail lead indicator?
The J-Phone service Sha-mail is often cited as an example of the success of MMS,
although Vodafone (J-Phone’s owner) does not disclose the top-line contribution.
We understand the following.
■ Historically, J-Phone has charged between €0.12 and €0.33 per message (about
£0.21, at the top end).
■ At year-end (March 2002), J-Phone had 4 million camera phone customers
(about one-third of the subscriber base).
■ At the end of August 2002, J-Phone had 6m Sha-mail enabled handsets (at theend of August 2001, J-Phone had approximately 1.8m Sha-mail handsets sold).
■ To August, J-Phone had a 12-month period-average number of Sha-mailsubscribers of 3.9m.
■ In early 2002 (at the time of the J-Phone presentation to analysts, 28 February
2002), Vodafone management indicated that the J-Phone picture messagingservice was being used about twice a week.
For simplicity, we have factored in a constant “two messages sent a week” scenarioto calculate the revenue generated from MMS.
MMS silver bullet statusprovides some hope ...
... but ignores theimportance of handsetreplacement and top-lineabsolute scale
Sha-mail is often cited asexample of MMS success
I N D U S T R Y D Y N A M I C S
M O B I L E N E T W O R K S - W . E U R O P E 1 6 O C T O B E R 2 0 0 2 12
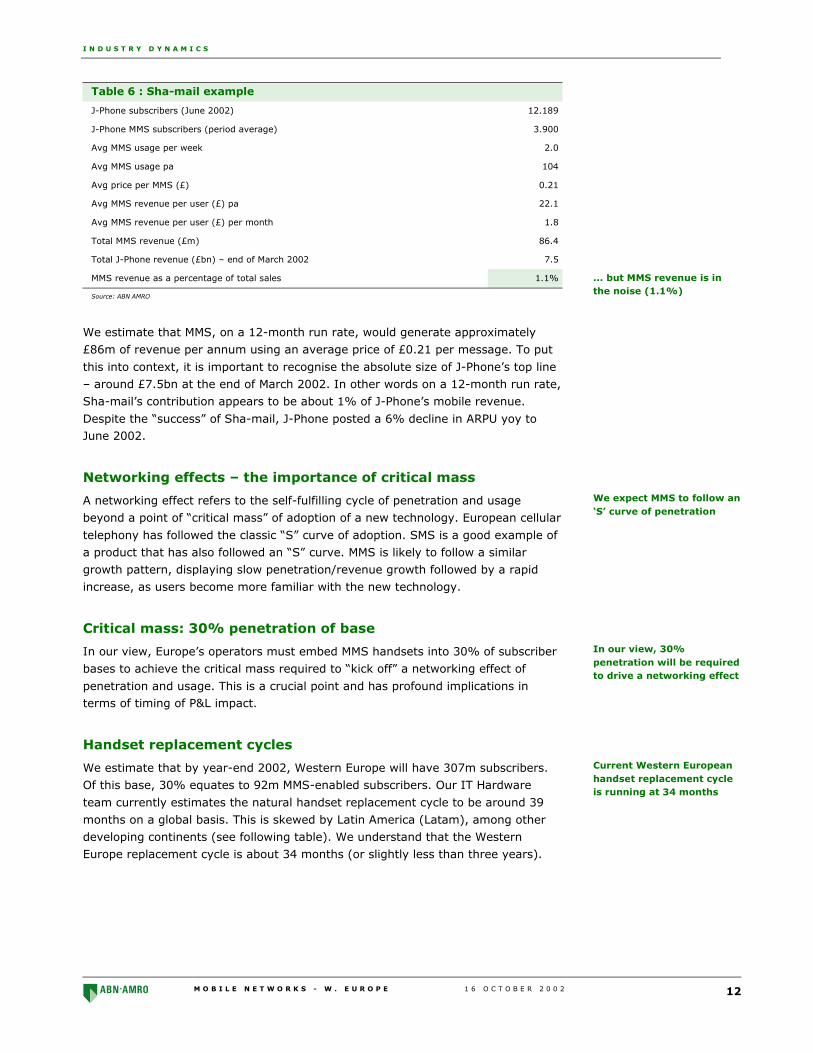
Table 6 : Sha-mail example
J-Phone subscribers (June 2002) 12.189
J-Phone MMS subscribers (period average) 3.900
Avg MMS usage per week 2.0
Avg MMS usage pa 104
Avg price per MMS (£) 0.21
Avg MMS revenue per user (£) pa 22.1
Avg MMS revenue per user (£) per month 1.8
Total MMS revenue (£m) 86.4
Total J-Phone revenue (£bn) – end of March 2002 7.5
MMS revenue as a percentage of total sales 1.1%
Source: ABN AMRO
We estimate that MMS, on a 12-month run rate, would generate approximately
£86m of revenue per annum using an average price of £0.21 per message. To put
this into context, it is important to recognise the absolute size of J-Phone’s top line
– around £7.5bn at the end of March 2002. In other words on a 12-month run rate,
Sha-mail’s contribution appears to be about 1% of J-Phone’s mobile revenue.
Despite the “success” of Sha-mail, J-Phone posted a 6% decline in ARPU yoy toJune 2002.
Networking effects – the importance of critical mass
A networking effect refers to the self-fulfilling cycle of penetration and usage
beyond a point of “critical mass” of adoption of a new technology. European cellular
telephony has followed the classic “S” curve of adoption. SMS is a good example of
a product that has also followed an “S” curve. MMS is likely to follow a similar
growth pattern, displaying slow penetration/revenue growth followed by a rapid
increase, as users become more familiar with the new technology.
Critical mass: 30% penetration of base
In our view, Europe’s operators must embed MMS handsets into 30% of subscriber
bases to achieve the critical mass required to “kick off” a networking effect of
penetration and usage. This is a crucial point and has profound implications interms of timing of P&L impact.
Handset replacement cycles
We estimate that by year-end 2002, Western Europe will have 307m subscribers.
Of this base, 30% equates to 92m MMS-enabled subscribers. Our IT Hardware
team currently estimates the natural handset replacement cycle to be around 39
months on a global basis. This is skewed by Latin America (Latam), among other
developing continents (see following table). We understand that the Western
Europe replacement cycle is about 34 months (or slightly less than three years).
... but MMS revenue is inthe noise (1.1%)
We expect MMS to follow an‘S’ curve of penetration
In our view, 30%penetration will be requiredto drive a networking effect
Current Western Europeanhandset replacement cycleis running at 34 months

I N D U S T R Y D Y N A M I C S
M O B I L E N E T W O R K S - W . E U R O P E 1 6 O C T O B E R 2 0 0 2 13
Table 7: Replacement cycle (months)
2000 2001 2002E 2003E
Europe (W & E) 24 31 35 35
- W Europe 24 30 34 34
- E Europe 34 39 48 40
Middle East & Africa 33 32 44 45
Asia/Pacific 34 37 46 47
North America 27 31 33 32
South America 30 37 50 48
Total 28 33 39 39
Source: ABN AMRO IT Hardware equity research team
A three-year handset replacement cycle suggests an annual rate of handset churn
of nearly 33%. Even if 50% of the replacement handsets sold during 2003 were
MMS-enabled this corresponds to only 17% of Western Europe’s existing subscriber
base owning an MMS-enabled handset by calendar year-end 2003, some distance
below the critical mass level we estimate is required to drive usage/revenue.
Using the 34-month handset replacement cycle, Western Europe would need to
wait until year-end 2004 to reach the point of critical mass in terms of MMS
penetration. This suggests that a material revenue boost will not occur until
CY2005. Bulls of MMS beware!
What about guidance of 18 months?
We have heard some operators talking handset replacement cycles of 18 months
today, ie every one and a half years. We can sanity-check the “reasonableness” of
this claim with reference to total global handset sales. Holding “new” European
sales and ROW handset sales constant, we can identify the implied replacement
handsets sold in Europe and the impact this has on total global handset sales. For
example, if we believe that 2002 and 2003 will both have an 18-month
replacement cycle, we can imply global handset sales of 474m and 559m
respectively (see following table), somewhat ahead of our IT Hardware team’s
forecasts.
Table 8 : Scenario analysis: 18-month handset replacement cycle
2002E 2003E
Suggested replacement cycle (months) 18 18
Replacement cycle implied replacement handsetsales 153 187
Add new sales 18 13
Implied total handset WE sales 171 200
ROW handset sales 303 359
Implied total handset sales 474 559
IT Hardware forecast 402 471
Variance 72 88
Source: ABN AMRO
Nevertheless we do not rule out a shortening of the handset replacement cycle in
Western Europe, should operators choose to aggresively subsidise growth.
Even if 50% of all WesternEuropean handsets sold in2003 were MMS, only 17%of Western Europe’s basewould be MMS-enabled
MMS critical mass isreached CY2005
18-month replacementcycle would lead to materialupgrades of global handsetsale forecasts

I N D U S T R Y D Y N A M I C S
M O B I L E N E T W O R K S - W . E U R O P E 1 6 O C T O B E R 2 0 0 2 14
Vodafone – a worked example
Using Vodafone group as a benchmark, we can quickly emphasise the importance
of absolute scale. To the end of March 2003, we forecast Vodafone to generate
£29.3bn of revenue (consolidated – see following table). To deliver a 10% upside
surprise at the top line, Vodafone would need to generate another £2.9bn in
revenue.
MMS pricing structures vary on a case-by-case basis. The average price appears to
be around €0.40-0.60 per message (about 25p-40p; outliers such as Telenor in
Norway have recently dramatically reduced their price from as much as €1.33 permessage to €0.65).
Table 9 : Vodafone – the problem of scale (£)
Mar-03 Mar-04
Vodafone consolidated revenue 29,480 31,922
Vodafone average subscribers 91.7 95.8
Vodafone consolidated ARPU 321.5 333.4
Vodafone consolidated ARPU (Monthly) 26.8 27.8
10% upside surprise (revenue) 2,948 3,192
MMS Enalbed Handsets 11% 26%
MMS Subscribers (period end) 10.4 25.2
MMS Subscribers (beginning period) 4.0 10.4
Ave. MMS Subscribers 7.2 17.8
MMS ARPU (Monthly) 34.2 15.0
Ave. price per MMS 0.25 0.25
Implied MMS volume per subscriber (Monthly) 136.9 59.9
Implied MMS volume per subscriber (Weekly) 31.6 13.8
Implied total MMS volume 11,792 12,769
Source: ABN AMRO
In our example we have factored in 11% and 26% of Vodafone’s subscriber base to
buy MMS-enabled handsets by the end of March 2003 and March 2004,
respectively, and an average price of £0.25 per message. Our basic analysis shows
that to deliver a 10% upside surprise to our existing revenue forecast, Vodafone
would need to encourage its initial MMS-enabled subscribers to pay for 31.6
messages a week to the end of March 2003 (or 13.8 messages per week to the end
of March 2004). We believe this level of volume is too challenging.
Best case: 1.5% impact
To fiscal 2004, we suspect that MMS provides at most 1.5% upside to our existing
forecasts. This view is based on three simple drivers:
■ factoring in a generous 26% of Vodafone’s base will buy (and use) MMS-enabled
handsets (implying 25.6m MMS subscribers at the end of March 2004 from10.4m at the end of March 2003);
■ usage of 2x a week (resulting in 104 messages a year);.and
■ an average price of £0.25,
Vodafone would need togenerate about £3bn ofrevenue to generate a 10%upside revenue surprise.
Using an average price of 25pper message ...
... implied volume appearschallenging: 32 messages aweek could provedemanding

I N D U S T R Y D Y N A M I C S
M O B I L E N E T W O R K S - W . E U R O P E 1 6 O C T O B E R 2 0 0 2 15
Pulling these drivers together suggests potential incremental revenue of nearly £2.2
per month per subscriber, corresponding to £26 per year. In total, this offers
£469m of additional revenue to the end of March 2004 (about 1.5% of consolidated
revenue). This realistic upside is in the noise (see following table).
Table 10 : Vodafone impact of MMS
Mar-04
Avg MMS subs (m) 18.0
Usage pa per sub 104.0
Total usage (m) 1,875.6
Price per MMS 0.25
MMS ARPU pa 26.0
MMS ARPU (monthly) 2.2
MMS revenue (£m) 468.9
Implied % of revenue 1.5%
Source: ABN AMRO
Voice cannibalisation
We also note the potential cannibalisation of existing SMS revenue by MMS, and the
potential of MMS to substitute for voice usage. Arguably MMS can be viewed as the
classic “technology” push innovation, for which little or insufficient demand exists.
Should customers not perceive they have a real "new” need for the technology,
they could either:
■ not buy the innovation; or
■ substitute MMS for existing cellular usage.
Arguably evidence to date suggests that data has been generated at the expense of
existing voice revenue streams. In the charts that follow we show that NTT
DoCoMo,1 the widely accepted leader in data service deployment, has not yet
registered an increase in ARPU, and data ARPU appear to have been generated
largely at the expense of voice ARPU. Similarly, Vodafone’s voice ARPU in its key
European territories has continued to decline at a faster rate than blended ARPU
(assuming constant spending patterns across time), suggesting data service
cannibalisation.
1Our analysis of NTT DoCoMo ignores the impact of marginal investment costs for 2G. In Japan, a
high number of subscribers for available spectrum has led to higher capital costs (increased cost ofcell splitting), hence discouraging aggressive volume expansion. Nevertheless, data’s initial failure to
drive expanding ARPUs for DoCoMo provides a negative benchmark for European investors.
Realistic upside in the noise
Evidence to date suggeststhat messaging hascannibalised existing voicerevenue streams

I N D U S T R Y D Y N A M I C S
M O B I L E N E T W O R K S - W . E U R O P E 1 6 O C T O B E R 2 0 0 2 16
Chart 3 : NTT DoCoMo ARPU trend (yen) Chart 4 : Voice/Data ARPU trends CY Q2 02/Q2 01
0
2,000
4,000
6,000
8,000
10,000
12,000
14,000
1997
1998
1999
2000
2001
Q1 0
2
Q2 0
2
Q3 0
2
Q4 0
2
Q1 0
3
Q2 0
3F
Q3 0
3F
Q4 0
3F
ARPU (12m, contract) VARPU DARPU
-14%
-12%
-10%
-8%
-6%
-4%
-2%
0%
2%
4%
VOD - UK VOD -Germany
VOD - Italy DoCoMo
ARPU VARPU
CY Q2 02/Q2 01
Source: Company reports Source: Company reports
Notwithstanding this axiom, we do acknowledge that the higher pricing of MMS
relative to existing voice and SMS usage could reduce the risk of cannibalisation.
Table 11 : Relative price, voice, SMS and MMS (€)
Price Premium/Discount to voice
Avg price 2 minute voice call 0.20 0%
Avg price per SMS 0.10 -50%
Avg price per MMS 0.40 100%
Source: ABN AMRO
Margin impact of MMS
So far we have considered the revenue impact of MMS. It is also important to
consider the margin implications. As we have noted historically (see Floating at the
edge, dated 14 January 2002) the process of embedding MMS-enabled handsets
into an operator’s subscriber base requires a substantial investment in opex
(handset subsidies, dealer commissions and marketing expenses).
Subscriber acquisition costs/subscriber retention costs (SAC/SRC) historically have
represented 7.0%-45% of an operator’s top line. The top end of this range has
been provided by the least mature new entrants throughout Europe. Typically, for a
more mature operator, we see SAC/SRC running at 7.0%-20.0% of sales. A major
risk to margins is the cost of (1) acceleration in the handset replacement cycle (ie
volume) and/or (2) increasing handset subsidies (ie unit cost).
(1) Volume
Our views on the prospect of acceleration in the European handset replacement
cycle are well known. We have long argued that an increase in churn is inevitable,
if the European operator community is to achieve material data-related revenue
growth in the medium term. Our margin thesis has revolved around the concept of
technology migration (stimulating the migration of exiting 2G subscriber to next-
generation terminals).
DoCoMo has failed to drivean ARPU upgrade from data
In our view, embeddinghandsets requires amaterial investment in opex
SAC/SRC could increasebetween 100-300bp as apercentage of sales
We suspect an increase inchurn is inevitable

I N D U S T R Y D Y N A M I C S
M O B I L E N E T W O R K S - W . E U R O P E 1 6 O C T O B E R 2 0 0 2 17
We recognise that the speed of migration will vary on a country-by-country basis,reflecting:
■ the level of market share concentration;
■ the balance sheet strength of the smaller players; and
■ the arrival (or absence) of new entrants.
We continue to believe that Spain and France will be the most benign markets in
terms of competition, with the UK confirming its reputation as the most competitive
market in Europe. Italy, currently a benign market, is a wild card that could seemuch fiercer price-based competition looking forward.
In our view, the key metric on which investors should focus to assess our volume
thesis is gross additions. For the purpose of simplicity, our modelling of costs
includes “internal migrations” as external churn. While this is technically incorrect,
it does enable us to capture the volume driver of costs. Should the number of the
gross adds accelerate (all other factors held equal), operating costs will increase as
a percentage of sales. We highlight the structural shift in growth that Europe has
(and will) continue to undergo away from “new” growth, to the size and share ofthe disconnection pool, driven by churn and SOGA (see following chart).
Chart 5 : German gross adds example
2.0 2.5 5.79.3
34.4
7.33.7 4.7 4.0
1.4 1.4
2.1
3.5
5.9
12.014.2
15.2 15.7
29%
14% 15%
19%
16%
23%25% 25% 24%
0
5
10
15
20
25
30
35
40
45
1996 1997 1998 1999 2000 2001 2002 2003 2004
0%
5%
10%
15%
20%
25%
30%
35%
Net Adds (m) Disconnections (m) Churn %
Source: RegTP/Group3G
Our modelling incorporates full detail on the trend in gross adds across Europe. A
copy of this model is available upon request. Investors requiring further detail of
our views on technology migration should refer to Vodafone – The cost of capitalchallenge, dated 8 April 2002.
(2) Unit cost
We note recent comment from the Carphone Warehouse that by late January 2003,
MMS-enabled handsets will be priced for the mass market. The Nokia 7650 is
currently priced at €450-500. In 2003, Carphone is seeking to sell camera-enabled
handsets for €72-80 to contract customers. Similarly, first estimates of the unit
cost of the dual-mode 3G Nokia handset were €700-800 (about £500).
Speed of migration will varyon a country-by-countrybasis
Churn becomes a key driverof margin
Tracking gross adds crucial
Handset retailers havesuggested that handsetswill need to be retailedbelow €100

I N D U S T R Y D Y N A M I C S
M O B I L E N E T W O R K S - W . E U R O P E 1 6 O C T O B E R 2 0 0 2 18
Our IT Hardware team has suggested an initial unit cost range of €600-700 per 3G
handset. To put this in some context, existing unit costs for 2G handsets in Europe
range between €250 and €300. (Globally, costs range between €100 and €110,
reflecting the low-end 2G handsets sold into markets such as China). While we
would expect this cost to fall as scale production commences, it could result in a
sharp short-term spike to subsidies.
Average subsidies at the last reported date have been running €24-350 per
addition. At the (all-important) post-paid level, SACs have been €156-350
(excluding the Italian experience; see following table). Post-paid subsidies over the
past year have diverged between (1) falling subsidisation of lower-end handsets
and (2) accelerating subsidisation of higher-end handsets (eg the Ericsson T68i).
Table 12 : Major operator SAC trends FY2002/1H02
Vodafone mmO2 Orange
(€) ContractSAC
PrepaidSAC
BlendedSAC
SAC as% ofSales
ContractSAC
PrepaidSAC
BlendedSAC
SAC as% ofSales
ContractSAC
PrepaidSAC
BlendedSAC
SAC as% ofSales
UK 184 41 110 7.5% 286 84 156 13.1% 350 32 158 9.0%
Germany 156 24 81 6.6% 254 70 157 17.1% na na na na
Italy 35 35 35 3.0% na na na na na na na na
France na na na na na na na na 206 83 140 10.2%
Source: ABN AMRO
Using a unit cost of (say) €650 would result in a material spike in subsidies if the
operator’s objective is to retail the product below €300 (about £200). This could
have a profound impact on margin. The implied subsidy would grow to about €350
per handset. This is significantly ahead of existing average post-paid handset
subsidies, although we note that it is more in line with existing high-end handset
subsidies. The actual margin impact would be driven by the number of gross adds
(volume) connecting to 3G. Our central case is for a 100-300bp reduction in
profitability (purely from an increase in SG&A as a percentage of sales).
A key risk to a positive outlook is that aggressive subsidisation does not result in
significant increases in ARPU (ie value destruction occurs). This risk is most
pronounced in markets such as the UK and Germany (in Europe) given the lower
level of industry concentration and the scope for the present equilibrium to be
destabilised by aggressive new entrants.
Capex impact of MMS
Investors should also be aware of the capex implications of successful MMS
deployment. GSM networks operate with eight time slots. A typical MMS can take
up to three time slots, cannibalising existing time slots allocated to voice
communication.
While the operator community claim this “success-driven” capex is already built
into its models, we are sceptical given the lack of visibility on (1) MMS subscriber
targets and (2) existing network capacity utilisation in major urban areas. Hence
the successful deployment of MMS could lead to upward momentum in capex
guidance from the major operators, although we note that this spend would besuccess-driven.
Our IT Hardware teamsuggests that 3G handsetswill cost €600-700
Post-paid subsidiescurrently sit at €156-300
Average subsidies couldmaterially increase to make3G handset prices attractiveto the end user
Successful deployment ofMMS could shift capexexpectations upwards ...
... although capex would besuccess-driven …
I N D U S T R Y D Y N A M I C S
M O B I L E N E T W O R K S - W . E U R O P E 1 6 O C T O B E R 2 0 0 2 19
Strategic investor choices
Hence we encourage investors to sanity-check claims that MMS (or data) is the
silver bullet for the European wireless community. In our view, a fresh
management approach is required. We suspect that operator business models (and,
for that matter, analyst forecasts) based on material contributions from mobile data
in the short term could be fundamentally flawed.
We are not writing off the medium- to longer-term prospects of mobile data. On the
contrary, we recognise the potential for data (as a longer-term driver) to surprise
on the upside. In our view the risk look finely balanced. We can use a basicportfolio analysis tool to consider the risks.
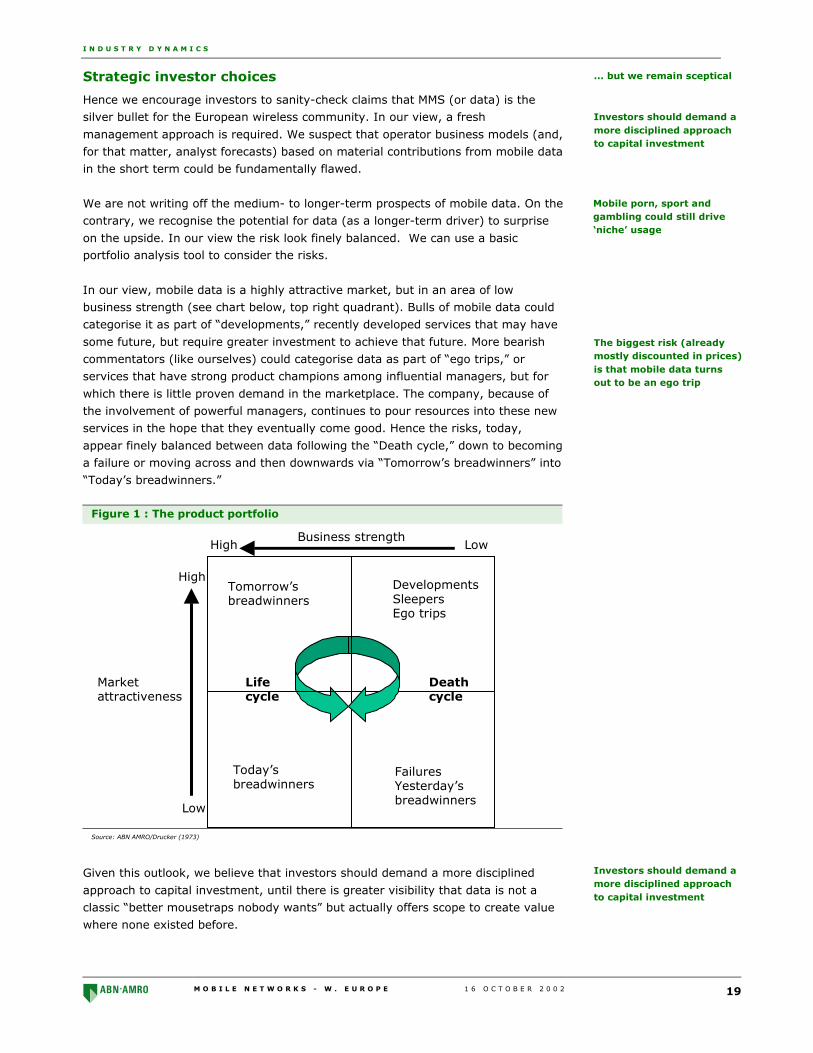
In our view, mobile data is a highly attractive market, but in an area of low
business strength (see chart below, top right quadrant). Bulls of mobile data could
categorise it as part of “developments,” recently developed services that may have
some future, but require greater investment to achieve that future. More bearish
commentators (like ourselves) could categorise data as part of “ego trips,” or
services that have strong product champions among influential managers, but for
which there is little proven demand in the marketplace. The company, because of
the involvement of powerful managers, continues to pour resources into these new
services in the hope that they eventually come good. Hence the risks, today,
appear finely balanced between data following the “Death cycle,” down to becoming
a failure or moving across and then downwards via “Tomorrow’s breadwinners” into
“Today’s breadwinners.”
Figure 1 : The product portfolio
Business strengthLowHigh
Tomorrow’s breadwinners
Developments SleepersEgo trips
Today’s breadwinners
Failures Yesterday’sbreadwinners
Marketattractiveness
Low
High
Lifecycle
Deathcycle
Source: ABN AMRO/Drucker (1973)
Given this outlook, we believe that investors should demand a more disciplined
approach to capital investment, until there is greater visibility that data is not a
classic “better mousetraps nobody wants” but actually offers scope to create value
where none existed before.
... but we remain sceptical
Investors should demand amore disciplined approachto capital investment
Mobile porn, sport andgambling could still drive‘niche’ usage
The biggest risk (alreadymostly discounted in prices)is that mobile data turnsout to be an ego trip
Investors should demand amore disciplined approachto capital investment

I N D U S T R Y D Y N A M I C S
M O B I L E N E T W O R K S - W . E U R O P E 1 6 O C T O B E R 2 0 0 2 20
This page has been left intentionally blank
M O B I L E N E T W O R K S - W . E U R O P E 1 6 O C T O B E R 2 0 0 2 21
M A C R O D Y N A M I C S
Fixed to mobile substitution
In the short term, pre-to-post-paid migration is the most important driver of
revenue growth. We believe high prepaid call charges have stunted usage. Our
forecasts imply about 4% annual growth in blended ARPU over the next five years
from this dynamic. During the medium term, we suspect that consensus models of
revenue growth are fundamentally flawed, assuming 2G economics (lower volume,
low ARPU, low EBITDA per subscriber) will underpin European 3G. It is our core
belief that at a 50% premium to underlying fixed-line prices, mass displacement of
voice minutes and revenue will occur from fixed to mobile networks. In our view,
3G will be characterised by higher-volume, higher-ARPU, higher-EBITDA per
subscriber voice services, similar to the model that prevails in the US. Our central
case assumes mobile grabbing 30%-40% share of outgoing total traffic by year-end
2006, from 10%-15% today, driven by price cuts of about 50%-60%. This view has
a profound implication for European ARPU growth, which could structurally shift
upwards by about 30% by year-end 2006. The key is flawless execution to turn
volume into value.
Introduction
In this section of the note we present:
■ the ARPU impact of pre-to-post-paid migration;
■ US volume as a lead indicator for Europe;
■ the defining characteristics of 3G over 2G economics;
■ the relative price of mobile vs fixed;
■ the cross-elasticity of demand of mobile to fixed-line;
■ a sensitivity analysis on the scope for voice substitution by call type and the
impact on ARPU; and finally
■ the risk/opportunity presented by declining termination rates.
Fixed to mobile substitutionoffers a compelling secondleg of growth

M A C R O D Y N A M I C S
M O B I L E N E T W O R K S - W . E U R O P E 1 6 O C T O B E R 2 0 0 2 22
Background
The average European wireless subscribers still only use their handset for about 3.0
outgoing minutes a day, or 4.5 minutes including incoming minutes of use (MOU).
Across Europe, mobile calls represent 10%-15% of total outgoing call volume. In
the UK there are seven times as many minutes carried on fixed-line networks than
on the UK’s wireless networks (see following chart).
Chart 6 : UK call volume by type (bn minutes)
0
50
100
150
200
250
300
1999 2000 2001
Fixed local calls Fixed Internet calls Fixed long distance calls
Mobile outgoing calls Fixed international calls Fixed to mobile calls
Source: ABN AMRO/OFTEL
At the top line, we believe that Europe’s wireless landscape will be characterised bythree major phases during the next four years, namely:
■ Phase one: prepaid to post-paid subscriber migration (2002-2006);
■ Phase two: material fixed-to-mobile call volume substitution (2004-2006); and
■ Phase three: dramatically declining termination rates (2002-2006).
Phase One: Pre-to-post-paid migration
It is our core belief that European cellular usage has been stunted by high prepaid
call charges. Including the handset subsidy offered on post-paid products, we
estimate prepaid prices are 40%-110% higher than “equivalent usage” post-paid
offers across Europe. In our view, lower call charges have played a key role indriving materially higher volume in the US market.
Prepaid subscribers as a percentage of the total European base appear to have
already peaked. Looking forward, we expect four key drivers to cajole Europe’s pre-
paid subscribers into migrating: (1) handset subsidies, (2) dealer incentives, (3)
product exclusivity and (4) bucket pricing plans (value for money).
Phase One drives higher usage/blended ARPUs
We retain a firm belief that increasing pre-to-post-paid migration offers a
compelling macro driver of volume and blended ARPU. The impact of migration can
be identified with reference to a “generic” model.
European wireless usersstill only use 3 minutes aday
At the top line, the wirelesslandscape will becharacterised by threemajor phases
Prepaid usage has beenstunted by high call charges
In Europe, prepaidsubscribers have peaked asa percentage of totalsubscribers
Prepaid subscribermigration offers a strongmacro driver of blendedARPU

M A C R O D Y N A M I C S
M O B I L E N E T W O R K S - W . E U R O P E 1 6 O C T O B E R 2 0 0 2 23
Our generic model is built on Country X. In Country X we have considered OperatorY.
■ To capture the impact of pre-to-post-paid migration, we have moved operator
Y’s post-paid share of overall gross adds from 38% at x+0 (today), to 60% inx+1 (today + one year).
■ Each new year’s post-paid subscriber connections are assumed to connect to a
lower-priced post-paid plan, reflecting incremental subscriber dilution (we have
factored in a 20% decline pa).
■ In terms of current period (x+0) post-and prepaid ARPU, we have used £40 and£9, respectively.
In the following chart we show the evolution of subscribers by post-paid plan type
(post-paid subscribers joining high-value, Phase One, Phase Two and Phase Three
plans).
Figure 2 : Generic subscriber evolution by plan type
0.0
1.0
2.0
3.0
4.0
5.0
6.0
7.0
8.0
9.0
10.0
X+0 X+1 X+2 X+3 X+4 X+5 X+6 X+7 X+8 X+9 X+10 X+11
Time (Yrs)
Subsc
riber
s (m
)
High Value Contract Phase 1 Contract Phase 2 Contract Phase 3 Contract
Source: ABN AMRO
The chart shows the highest value post-paid subscribers (the bottom area) falling in
absolute numbers over time. Each year’s connections are assumed to connect to a
new type of plan (Phase One in x+1, Phase Two in x+2 and Phase Three in x+3).
In aggregate, total post-paid subscribers grow to nearly 60% of the total base from
31%. We have then factored in the different (declining) incremental post-paidARPUs for new connections (see following chart).
We have built a genericmodel to show theimportance of planmigration
We have grouped eachyears connections by a plantype, to model migration
Incrementally we expectpost-paid ARPU to fall
M A C R O D Y N A M I C S
M O B I L E N E T W O R K S - W . E U R O P E 1 6 O C T O B E R 2 0 0 2 24
Figure 3 : Generic ARPU evolution by plan type
0.0
10.0
20.0
30.0
40.0
50.0
60.0
X+0 X+1 X+2 X+3 X+4 X+5 X+6 X+7 X+8 X+9 X+10 X+11
Time (yrs)
ARPU
(G
BP£)
High Value Contract Phase 1 Contract Phase 2 Contract
Phase 3 Contract Total Contract Total Blended
Source: ABN AMRO
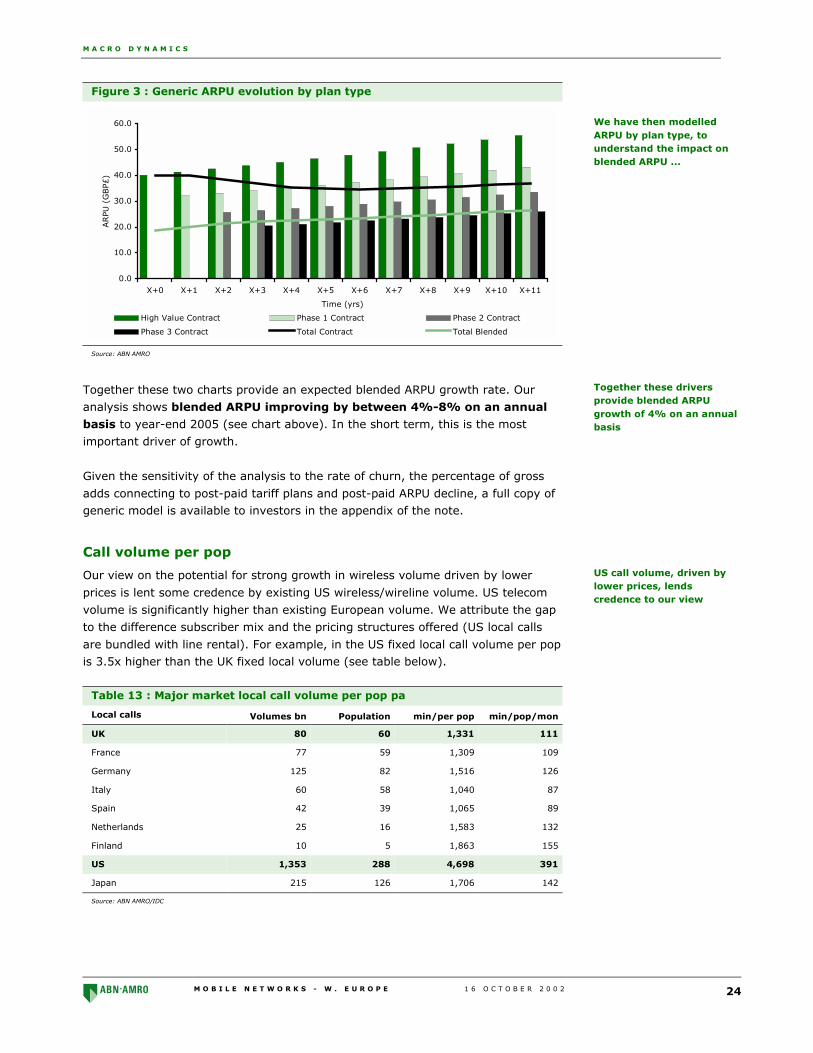
Together these two charts provide an expected blended ARPU growth rate. Our
analysis shows blended ARPU improving by between 4%-8% on an annual
basis to year-end 2005 (see chart above). In the short term, this is the most
important driver of growth.
Given the sensitivity of the analysis to the rate of churn, the percentage of gross
adds connecting to post-paid tariff plans and post-paid ARPU decline, a full copy ofgeneric model is available to investors in the appendix of the note.
Call volume per pop
Our view on the potential for strong growth in wireless volume driven by lower
prices is lent some credence by existing US wireless/wireline volume. US telecom
volume is significantly higher than existing European volume. We attribute the gap
to the difference subscriber mix and the pricing structures offered (US local calls
are bundled with line rental). For example, in the US fixed local call volume per popis 3.5x higher than the UK fixed local volume (see table below).
Table 13 : Major market local call volume per pop pa
Local calls Volumes bn Population min/per pop min/pop/mon
UK 80 60 1,331 111
France 77 59 1,309 109
Germany 125 82 1,516 126
Italy 60 58 1,040 87
Spain 42 39 1,065 89
Netherlands 25 16 1,583 132
Finland 10 5 1,863 155
US 1,353 288 4,698 391
Japan 215 126 1,706 142
Source: ABN AMRO/IDC
We have then modelledARPU by plan type, tounderstand the impact onblended ARPU ...
Together these driversprovide blended ARPUgrowth of 4% on an annualbasis
US call volume, driven bylower prices, lendscredence to our view

M A C R O D Y N A M I C S
M O B I L E N E T W O R K S - W . E U R O P E 1 6 O C T O B E R 2 0 0 2 25
Call volume per line
If we re-run our analysis using a per line metric, we can remove the distortion of
differences in penetration (see following table). On average we estimate US telco
volume is about 6x higher per line than the European average. For example, in the
US, fixed local call volume is 6.5x higher than the UK fixed local volumes per line,
or 6.9x the European average. Mobile traffic per line is about 3x European average
volume.
Table 14 : Major market wireline local call volume per line
Volume bnNo of Lines
(m) Minutes/Line Min/Line/Mon
UK 80 84 951 79
France 77 73 1060 88
Germany 125 157 794 66
Italy 60 52 1,157 96
Spain 42 33 1,267 106
Netherlands 25 27 950 79
Finland 10 11 849 71
US 1,345 219 6,133 511
Source: ABN AMRO/Country regulators
In the following table we have summarised the multiple of US minutes per line by
call type relative to the European average by call type per line. The evidence makes
stark reading. For the wireless industry we do not believe that the difference in
usage is primarily attributable to differences in penetration.
Table 15 : US vs European telco volume (2000)
Euro ave. MOU perline per line
US ave. MOU perline per month
European averagemultiple
Local - Euro average 84 511 6.1
National - Euro average 35 315 8.9
International - Euro average 5 11 2.1
Mobile - Euro average 107 284 2.7
Source: ABN AMRO
Our thesis is simple – in the event of subscribers moving from pre-to-post-paid
plans (with large bundles), usage should increase. Evidence to date supports a
positive view. We highlight TEM’s Q202 results, which indicated that average usage
from migrated subscribers jumped more than 2x. Applying the US propensity to call
to each of Europe’s major markets results in a significant shift in European wireless
outgoing volume.
US local call volume per line6x higher than in Europe
In aggregate call volume inthe US is between 2x and6x the European average
Should pre-to-post paidmigration occur blendedspend should increase

M A C R O D Y N A M I C S
M O B I L E N E T W O R K S - W . E U R O P E 1 6 O C T O B E R 2 0 0 2 26
Table 16 : Mobile minutes 2001: applying a US multiplier
Annual mobilevolume 2001 (bn)
US multiplier (x) New annual mobilevolume (bn)
UK 69.4 2.7 187.3
France 65.6 2.7 177.1
Germany 74.1 2.7 200.1
Italy 49.1 2.7 132.6
Spain 27.6 2.7 74.6
European major market total 285.8 2.7 771.7
Source: ABN AMRO
Readers should recognise that we have not incorporated this volume increase into
our bottom-up models for each operator. We merely present the data as a further
perspective. This is important from a wireline perspective, given the scope for the
wireless subsector to gain (in terms of volume) from pre-to-post-paid subscribermigration, but not entirely at the revenue expense of the wireline operators.
Phase Two: fixed to mobile substitution
While local access fees may be largely retained by wireline telephony operators, we
expect a large percentage of fixed-line voice calls to migrate to Europe’s cellular
networks. This view has a profound implication for European ARPU growth and
fundamental valuation.
2G vs 3G economics
Increasingly, we suspect that consensus models of revenue growth are
fundamentally flawed, assuming 2G economics will underpin European 3G. We
reject the view that blended ARPU will gently tick along at 3-5% growth pa, coupled
with margin progression and capex/sales falling to sub-10%. In our view, European
cellular models that follow this trend ignore the potential capacity for 3G to enablethe mass substitution of fixed-line voice minutes to the wireless network.
Material wireless growthmay not necessarilyterminally damage wirelinevolume but ...
... As 3G is deployed acrossEurope, we anticipate largeF2M volume displacement
The assumption that 2Gmobile economics willprevail in 3G could befundamentally flawed

M A C R O D Y N A M I C S
M O B I L E N E T W O R K S - W . E U R O P E 1 6 O C T O B E R 2 0 0 2 27
Chart 7 : 2G vs 3G economics
European 2GEconomics
Growth via shift in capacity 3G Economics
Low MOU/low volumegrowth
Low ARPU/declining voiceARPU
Higher MOU/high volumegrowth
Higher ARPU/lower yield
High level of marketconcentration
High margins Lower margins
Lower EBITDA persubscriber
Higher EBITDA persubscriber
Capex: Capacity andmaintenance
Capex: coverage focused
Low NOPAT/IC: goodreturns
Higher NOPAT/Similar IC:higher returns
Lower level of marketconcentration
Shift in Capacity
2 x - 5 x
Source: ABN AMRO
Elasticity of demandHistorically, a great deal of telco equity research has been dedicated to the
discussion of elasticity of demand, the percentage change in quantity demanded for
a percentage change in price. Analysis of elasticity of demand is obscured by
penetration growth. The authors of this study have seen estimates ranging from
negative 0.6 to negative 0.9, suggesting a high degree of elasticity at historical
price levels (implying volume growth somewhat compensates for price declines).
Cross-elasticity of demandFrom a theoretical perspective, the key determinant of elasticity of demand is the
availability of substitutes, which is a key point missed by many industry experts. Adiscussion of elasticity of demand for one good in isolation is flawed.
Elasticity of demand rangesfrom negative 0.6 tonegative 0.9
... but the key is crosselasticity of demand

M A C R O D Y N A M I C S
M O B I L E N E T W O R K S - W . E U R O P E 1 6 O C T O B E R 2 0 0 2 28
In our view, the key factor to focus in on is the cross-elasticity of demand
between European wireless and European wireline (ie At what price will wireless be
preferred to fixed-line communication?). Cross-elasticity of demand refers to the
responsiveness of demand in one product to the change in price of another product.
Substitute goods have positive cross-elasticities. To better understand cross-
elasticity, we have focused our attention on the relative price of cellular to fixed
line.
Fixed vs mobile: A comparative analysis
The average price of a cellular minute of use vs a fixed-line minute of use has fallen
to nearly 3x today from about 6x in 1995 (excluding fixed-line access and
connection fees; see following chart).
Chart 8 : Comparative price of mobile vs fixed
-
1.0
2.0
3.0
4.0
5.0
6.0
7.0
1996 1997 1998 1999 2000 2001
Euro average
Source: ABN AMRO estimates/IDC
France
In determining revenue, we can either include or exclude access and connection
charges. Choice of methodology has a significant impact on the implied multiple of
cellular prices to fixed line. For example, in the French market, including access
fees, we calculate a multiple of around 2x vs a relative call price of nearer 3x
excluding access fees. In terms of the relative price of fixed voice calls to a mobile
voice calls, the French market offers a decent proxy for Europe in aggregate (seefollowing chart, including fixed-line access).
We estimate wireless as amultiple of wireline hasfallen to about 3x from 6x
In France, the multiple hasfallen to nearly 3x
M A C R O D Y N A M I C S
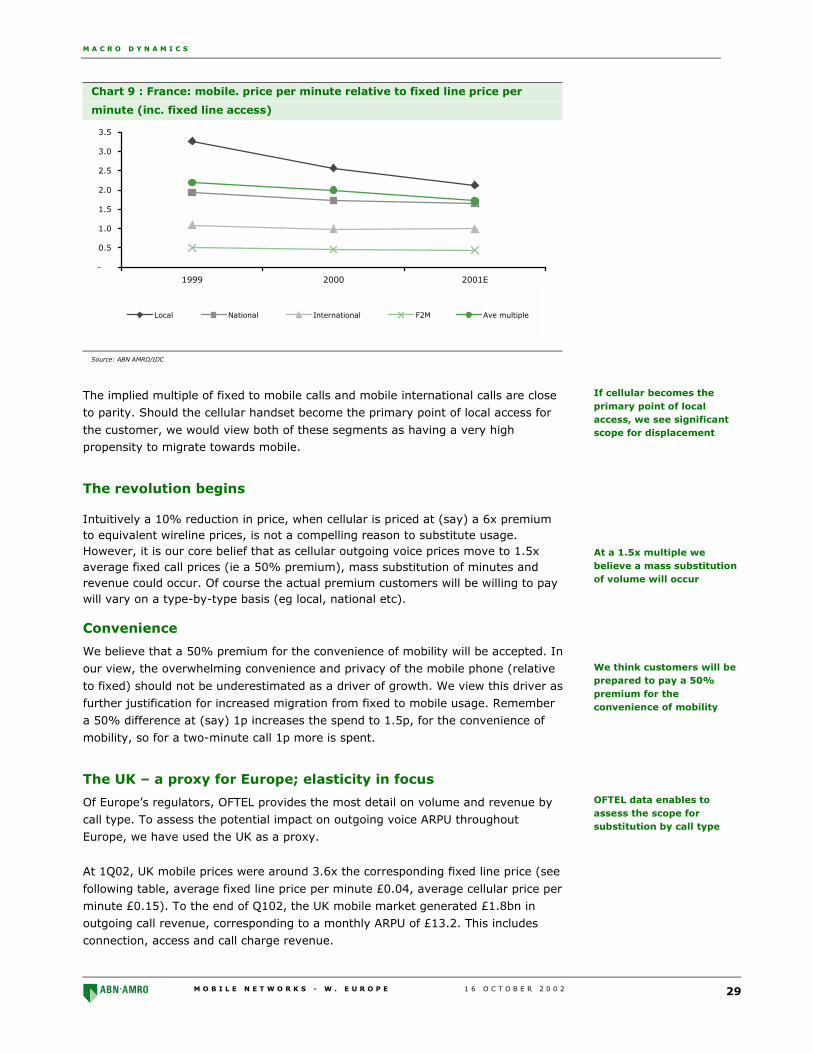
M O B I L E N E T W O R K S - W . E U R O P E 1 6 O C T O B E R 2 0 0 2 29
Chart 9 : France: mobile. price per minute relative to fixed line price per
minute (inc. fixed line access)
-
0.5
1.0
1.5
2.0
2.5
3.0
3.5
1999 2000 2001E
Local National International F2M Ave multiple
Source: ABN AMRO/IDC
The implied multiple of fixed to mobile calls and mobile international calls are close
to parity. Should the cellular handset become the primary point of local access for
the customer, we would view both of these segments as having a very highpropensity to migrate towards mobile.
The revolution begins
Intuitively a 10% reduction in price, when cellular is priced at (say) a 6x premiumto equivalent wireline prices, is not a compelling reason to substitute usage.However, it is our core belief that as cellular outgoing voice prices move to 1.5xaverage fixed call prices (ie a 50% premium), mass substitution of minutes andrevenue could occur. Of course the actual premium customers will be willing to paywill vary on a type-by-type basis (eg local, national etc).
Convenience
We believe that a 50% premium for the convenience of mobility will be accepted. In
our view, the overwhelming convenience and privacy of the mobile phone (relative
to fixed) should not be underestimated as a driver of growth. We view this driver as
further justification for increased migration from fixed to mobile usage. Remember
a 50% difference at (say) 1p increases the spend to 1.5p, for the convenience of
mobility, so for a two-minute call 1p more is spent.
The UK – a proxy for Europe; elasticity in focus
Of Europe’s regulators, OFTEL provides the most detail on volume and revenue by
call type. To assess the potential impact on outgoing voice ARPU throughout
Europe, we have used the UK as a proxy.
At 1Q02, UK mobile prices were around 3.6x the corresponding fixed line price (see
following table, average fixed line price per minute £0.04, average cellular price per
minute £0.15). To the end of Q102, the UK mobile market generated £1.8bn in
outgoing call revenue, corresponding to a monthly ARPU of £13.2. This includes
connection, access and call charge revenue.
If cellular becomes theprimary point of localaccess, we see significantscope for displacement
At a 1.5x multiple webelieve a mass substitutionof volume will occur
We think customers will beprepared to pay a 50%premium for theconvenience of mobility
OFTEL data enables toassess the scope forsubstitution by call type
M A C R O D Y N A M I C S
M O B I L E N E T W O R K S - W . E U R O P E 1 6 O C T O B E R 2 0 0 2 30
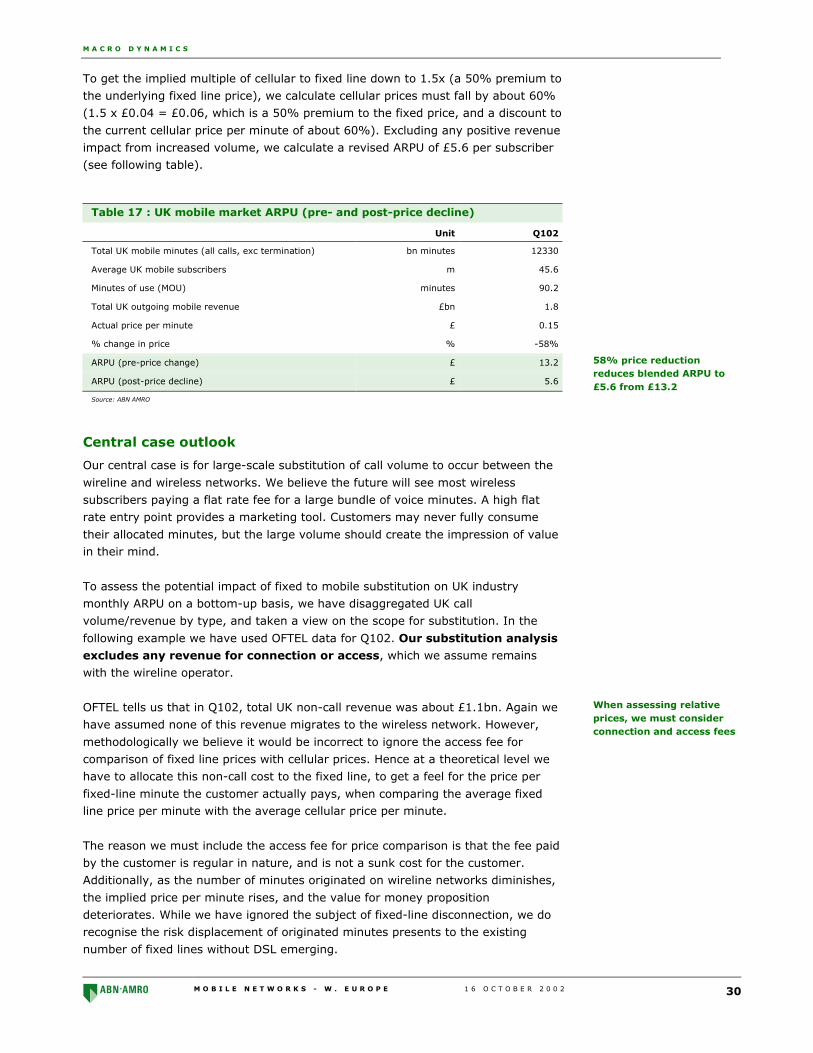
To get the implied multiple of cellular to fixed line down to 1.5x (a 50% premium to
the underlying fixed line price), we calculate cellular prices must fall by about 60%
(1.5 x £0.04 = £0.06, which is a 50% premium to the fixed price, and a discount to
the current cellular price per minute of about 60%). Excluding any positive revenue
impact from increased volume, we calculate a revised ARPU of £5.6 per subscriber
(see following table).
Table 17 : UK mobile market ARPU (pre- and post-price decline)
Unit Q102
Total UK mobile minutes (all calls, exc termination) bn minutes 12330
Average UK mobile subscribers m 45.6
Minutes of use (MOU) minutes 90.2
Total UK outgoing mobile revenue £bn 1.8
Actual price per minute £ 0.15
% change in price % -58%
ARPU (pre-price change) £ 13.2
ARPU (post-price decline) £ 5.6
Source: ABN AMRO
Central case outlook
Our central case is for large-scale substitution of call volume to occur between the
wireline and wireless networks. We believe the future will see most wireless
subscribers paying a flat rate fee for a large bundle of voice minutes. A high flat
rate entry point provides a marketing tool. Customers may never fully consume
their allocated minutes, but the large volume should create the impression of valuein their mind.
To assess the potential impact of fixed to mobile substitution on UK industry
monthly ARPU on a bottom-up basis, we have disaggregated UK call
volume/revenue by type, and taken a view on the scope for substitution. In the
following example we have used OFTEL data for Q102. Our substitution analysis
excludes any revenue for connection or access, which we assume remains
with the wireline operator.
OFTEL tells us that in Q102, total UK non-call revenue was about £1.1bn. Again we
have assumed none of this revenue migrates to the wireless network. However,
methodologically we believe it would be incorrect to ignore the access fee for
comparison of fixed line prices with cellular prices. Hence at a theoretical level we
have to allocate this non-call cost to the fixed line, to get a feel for the price per
fixed-line minute the customer actually pays, when comparing the average fixedline price per minute with the average cellular price per minute.
The reason we must include the access fee for price comparison is that the fee paid
by the customer is regular in nature, and is not a sunk cost for the customer.
Additionally, as the number of minutes originated on wireline networks diminishes,
the implied price per minute rises, and the value for money proposition
deteriorates. While we have ignored the subject of fixed-line disconnection, we do
recognise the risk displacement of originated minutes presents to the existing
number of fixed lines without DSL emerging.
58% price reductionreduces blended ARPU to£5.6 from £13.2
When assessing relativeprices, we must considerconnection and access fees
M A C R O D Y N A M I C S
M O B I L E N E T W O R K S - W . E U R O P E 1 6 O C T O B E R 2 0 0 2 31
Including access fees, we estimate that the implied multiple (of cellular price per
minute vs fixed price per minute) is about 1.5x (ie cellular at a 50% premium to
the underlying fixed line price). Excluding access fees from the relative price
comparison, the price multiple between the two platform grows from 1.5x to 2.6x.
We can calculate this from total fixed call revenue post-substitution excluding
access of £1.5bn, divided by the number of minutes equals an average price per
minute of £0.02, which is 2.6x less than the implied price per mobile minute of
£0.06 post price decline.
Including access fees, total fixed line quarterly revenue equalled £2.5bn in Q102,
divided by the number of minutes equals an average price per minute of £0.04.
This is 1.5x less than the implied price per mobile minute of £0.06 post pricedecline.
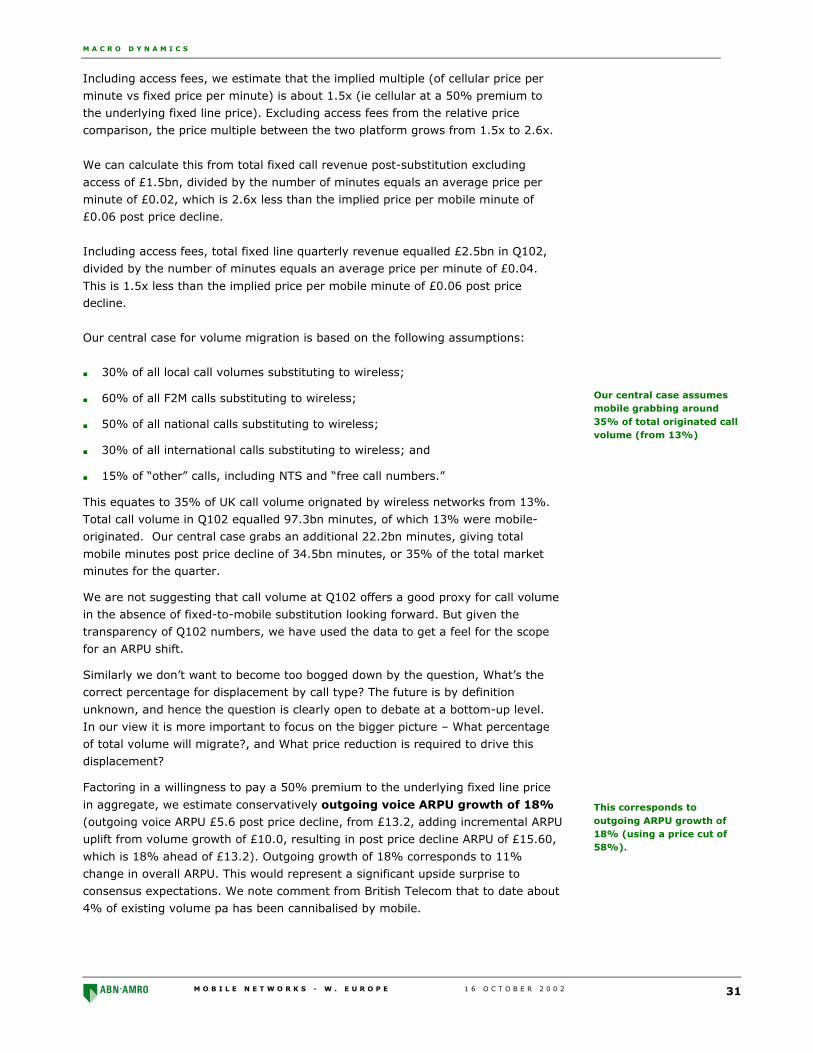
Our central case for volume migration is based on the following assumptions:
■ 30% of all local call volumes substituting to wireless;
■ 60% of all F2M calls substituting to wireless;
■ 50% of all national calls substituting to wireless;
■ 30% of all international calls substituting to wireless; and
■ 15% of “other” calls, including NTS and “free call numbers.”
This equates to 35% of UK call volume orignated by wireless networks from 13%.
Total call volume in Q102 equalled 97.3bn minutes, of which 13% were mobile-
originated. Our central case grabs an additional 22.2bn minutes, giving total
mobile minutes post price decline of 34.5bn minutes, or 35% of the total marketminutes for the quarter.
We are not suggesting that call volume at Q102 offers a good proxy for call volume
in the absence of fixed-to-mobile substitution looking forward. But given the
transparency of Q102 numbers, we have used the data to get a feel for the scope
for an ARPU shift.
Similarly we don’t want to become too bogged down by the question, What’s the
correct percentage for displacement by call type? The future is by definition
unknown, and hence the question is clearly open to debate at a bottom-up level.
In our view it is more important to focus on the bigger picture – What percentage
of total volume will migrate?, and What price reduction is required to drive this
displacement?
Factoring in a willingness to pay a 50% premium to the underlying fixed line price
in aggregate, we estimate conservatively outgoing voice ARPU growth of 18%
(outgoing voice ARPU £5.6 post price decline, from £13.2, adding incremental ARPU
uplift from volume growth of £10.0, resulting in post price decline ARPU of £15.60,
which is 18% ahead of £13.2). Outgoing growth of 18% corresponds to 11%
change in overall ARPU. This would represent a significant upside surprise to
consensus expectations. We note comment from British Telecom that to date about
4% of existing volume pa has been cannibalised by mobile.
Our central case assumesmobile grabbing around35% of total originated callvolume (from 13%)
This corresponds tooutgoing ARPU growth of18% (using a price cut of58%).

MOBILE NETWORKS - W. EUROPE16 OCTOBER 200232
MACRO DYNAMICS
Tab
le 1
8 : U
K M
ark
et O
utg
oin
g D
rivers
Q1
20
02
OFT
EL S
tatistics
Lo
cal ca
lls F
2M
calls
Natio
nal
calls
Inte
rnatio
na
lca
lls O
ther ca
lls T
ota
l Fix
ed
calls
Mo
bile
To
tal A
ll Calls
Sta
rting
Po
int
Call vo
lum
e bn m
ins
18.8
3.5
13.6
2.0
47.1
85.0
12.3
97.3
Call reven
ue (exc. access) £
bn
0.4
0.5
0.4
0.3
0.7
2.3
1.8
4.1
Implied
revenue p
er min
ute
0.0
2 0
.14
0.0
3 0
.14
0.0
1 0
.03
0.1
5 0
.04
Impact o
f Subsitu
tion
Mobile p
rice per m
inute red
uctio
n-5
8%
New
mobile p
rice 0
.06
Sco
pe fo
r local su
bstitu
tion
30%
60%
50%
30%
15%
26%
Averag
e mobile su
bscrib
ers 4
5.6
45.6
45.6
45.6
45.6
45.6
45.6
MO
U su
bstitu
ted to
mobile (b
n m
ins)
5.6
2.1
6.8
0.6
7.1
22.2
22.2
Implied
additio
nal M
OU
per su
b 4
1.3
15.2
49.9
4.3
51.7
162.4
162.4
Reven
ue lo
st to Fixed
Line
0.1
0.3
0.2
0.1
0.1
0.8
Reven
ue su
bstitu
ted to
mobile
0.3
0.1
0.4
0.0
4 0
.4 1
.4 1
.4M
obile R
evenue lo
st due to
price cu
t 1
.0In
cremen
tal ARPU
uplift
2.5
0.9
3.1
0.3
3.2
10.0
10.0
En
d G
am
eCall vo
lum
e bn m
ins
13.2
1.4
6.8
1.4
40.0
62.8
34.5
97.3
Call reven
ue (exc. access) £
bn
0.3
0.2
0.2
0.2
0.6
1.5
2.1
3.6
Implied
revenue p
er min
ute
0.0
2 0
.14
0.0
3 0
.14
0.0
1 0
.02
0.0
6 0
.04
Pre-p
rice declin
e P
ost p
rice declin
eA
RP
U 1
3.2
5.6
Increm
ental A
RPU
uplift (fro
m su
bstitu
tion)
10.0
New
ARPU
(post p
rice declin
e inc. vo
lum
e uplift)
15.6
% C
han
ge
18%
Differen
ce T
otal fixed
line call vo
lum
e 8
5.0
62.8
22.2
Total m
obile call vo
lum
e 1
2.3
34.5
22.2
97.3
97.3
-
Total fixed
line call vo
lum
e87%
65%
Total m
obile call vo
lum
e13%
35%
Differen
ce T
otal fixed
line call rev
enue
2.3
1.5
0.8
Total m
obile call rev
enue
1.8
2.1
0.3
Total telco
call revenue
4.1
3.6
0.5
Total fixed
line access reven
ue
1.1
1.1
- T
otal telco
revenue
5.1
4.7
0.5
Total fixed
line call rev
enue (%
)56%
41%
Total m
obile call rev
enue (%
)44%
59%
Total telco
call revenue (%
)100%
100%
Total fixed
line call rev
enue
44%
32%
Total m
obile call rev
enue
35%
46%
Total fixed
line access reven
ue
21%
23%
Total telco
revenue
100%
100%
Source
: ABN
AM
RO

M A C R O D Y N A M I C S
M O B I L E N E T W O R K S - W . E U R O P E 1 6 O C T O B E R 2 0 0 2 33
UK local calls
Factoring 30% volume substitution at an average cellular price of £0.06 results in
revenue for the quarter of £0.3bn substituting to mobile from fixed line. This
corresponds to 5.6bn minutes of fixed-line local voice calls substituting to the
mobile network, or an additional 41 monthly MOU per wireless subscriber per
month (see following table).
Table 19 : UK local call market (quarter only £bn)
End-Q102
Fixed local call volume (bn mins) 18.8
Fixed local call revenue (exc. access) (£bn) 0.4
Implied revenue per minute 0.02
Scope for local substitution 30%
Local MOU substituted to mobile (bn mins) 5.6
Implied additional MOU per sub 41.3
Local revenue substituted to mobile 0.3
Source: ABN AMRO/OFTEL
Using an average price per cellular minute of £0.06 implies a premium of 2.8x the
average price per fixed-line minute (fixed-line price per minute of £0.022). This
massively overstates the actual premium the wireless user is paying because it
ignores the wireline access and connection fee that the customer pays.
UK F2M calls
Using an average revenue per cellular minute of £0.06, and assuming the
displacement of 60% of fixed to mobile volume to mobile, we see about £0.1bn of
fixed calls to mobile moving to mobile. This amounts to about 2.1bn of additional
minutes, or 15 monthly MOU per wireless subscriber. It is important for readers to
recognise that as the wireless handset becomes the “accepted” point of access, we
believe that a significant networking effect could occur (in terms of mobile to
mobile communication). Hence we believe that our 60% migration assumptioncould prove too conservative.
Table 20 : UK F2M call market (quarter only £bn)
End-Q102
F2M call volume (bn mins) 3.5
F2M call revenue (exc. access) (£bn) 0.5
F2M Implied revenue per minute 0.14
Scope for F2M substitution 60%
MOU substituted to mobile (bn mins) 2.1
Implied additional MOU per sub 15.2
F2M revenue substituted to mobile 0.1
Source: ABN AMRO/OFTEL
30% local call volumesubstitution equates to anadditional 41 MOU permonth
30% local call volumesubstitution drives £0.3bnto mobile
60% F2M substitutioncorresponds to 15 MOU persub per month
60% substitution results in£0.1bn moving to mobile
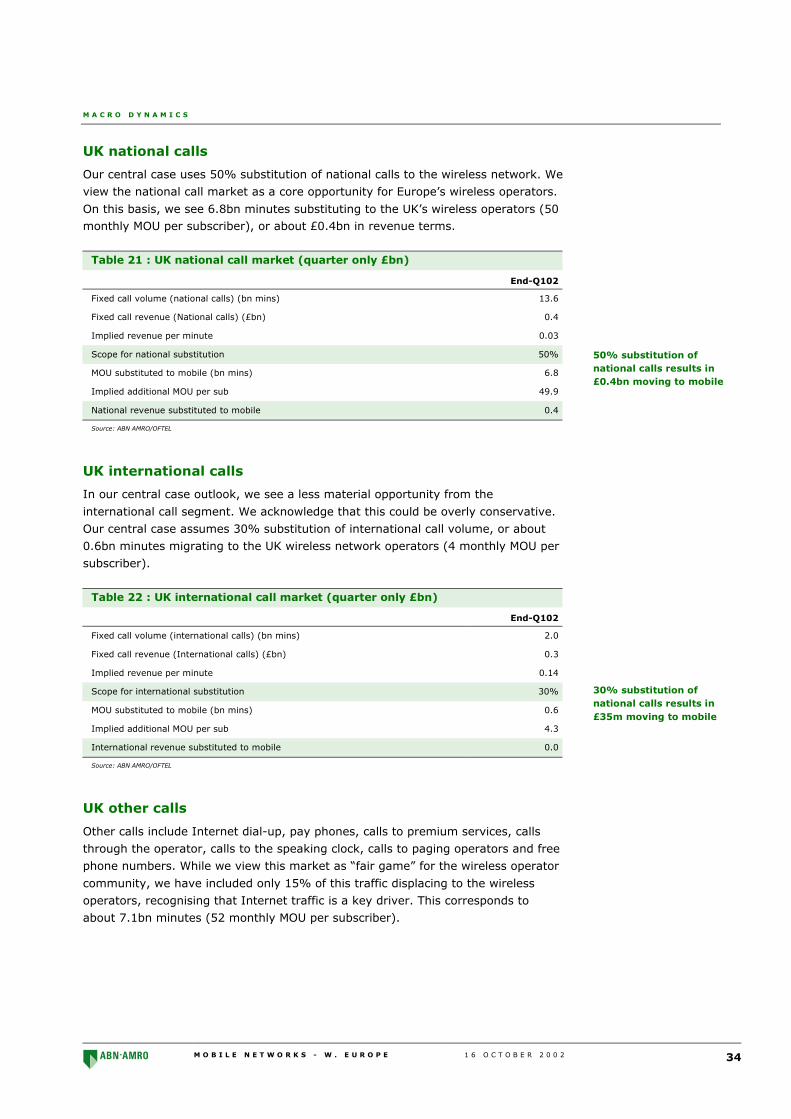
M A C R O D Y N A M I C S
M O B I L E N E T W O R K S - W . E U R O P E 1 6 O C T O B E R 2 0 0 2 34
UK national calls
Our central case uses 50% substitution of national calls to the wireless network. We
view the national call market as a core opportunity for Europe’s wireless operators.
On this basis, we see 6.8bn minutes substituting to the UK’s wireless operators (50monthly MOU per subscriber), or about £0.4bn in revenue terms.
Table 21 : UK national call market (quarter only £bn)
End-Q102
Fixed call volume (national calls) (bn mins) 13.6
Fixed call revenue (National calls) (£bn) 0.4
Implied revenue per minute 0.03
Scope for national substitution 50%
MOU substituted to mobile (bn mins) 6.8
Implied additional MOU per sub 49.9
National revenue substituted to mobile 0.4
Source: ABN AMRO/OFTEL
UK international calls
In our central case outlook, we see a less material opportunity from the
international call segment. We acknowledge that this could be overly conservative.
Our central case assumes 30% substitution of international call volume, or about
0.6bn minutes migrating to the UK wireless network operators (4 monthly MOU per
subscriber).
Table 22 : UK international call market (quarter only £bn)
End-Q102
Fixed call volume (international calls) (bn mins) 2.0
Fixed call revenue (International calls) (£bn) 0.3
Implied revenue per minute 0.14
Scope for international substitution 30%
MOU substituted to mobile (bn mins) 0.6
Implied additional MOU per sub 4.3
International revenue substituted to mobile 0.0
Source: ABN AMRO/OFTEL
UK other calls
Other calls include Internet dial-up, pay phones, calls to premium services, calls
through the operator, calls to the speaking clock, calls to paging operators and free
phone numbers. While we view this market as “fair game” for the wireless operator
community, we have included only 15% of this traffic displacing to the wireless
operators, recognising that Internet traffic is a key driver. This corresponds to
about 7.1bn minutes (52 monthly MOU per subscriber).
50% substitution ofnational calls results in£0.4bn moving to mobile
30% substitution ofnational calls results in£35m moving to mobile
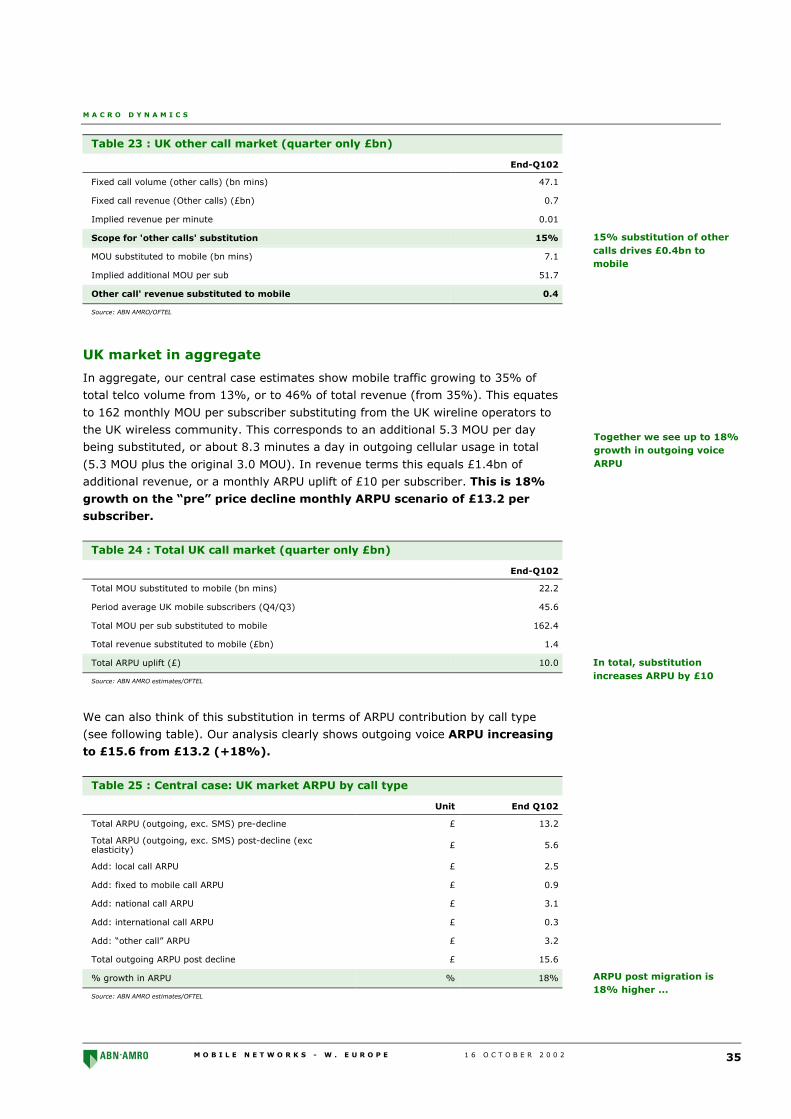
M A C R O D Y N A M I C S
M O B I L E N E T W O R K S - W . E U R O P E 1 6 O C T O B E R 2 0 0 2 35
Table 23 : UK other call market (quarter only £bn)
End-Q102
Fixed call volume (other calls) (bn mins) 47.1
Fixed call revenue (Other calls) (£bn) 0.7
Implied revenue per minute 0.01
Scope for 'other calls' substitution 15%
MOU substituted to mobile (bn mins) 7.1
Implied additional MOU per sub 51.7
Other call' revenue substituted to mobile 0.4
Source: ABN AMRO/OFTEL
UK market in aggregate
In aggregate, our central case estimates show mobile traffic growing to 35% of
total telco volume from 13%, or to 46% of total revenue (from 35%). This equates
to 162 monthly MOU per subscriber substituting from the UK wireline operators to
the UK wireless community. This corresponds to an additional 5.3 MOU per day
being substituted, or about 8.3 minutes a day in outgoing cellular usage in total
(5.3 MOU plus the original 3.0 MOU). In revenue terms this equals £1.4bn of
additional revenue, or a monthly ARPU uplift of £10 per subscriber. This is 18%
growth on the “pre” price decline monthly ARPU scenario of £13.2 per
subscriber.
Table 24 : Total UK call market (quarter only £bn)
End-Q102
Total MOU substituted to mobile (bn mins) 22.2
Period average UK mobile subscribers (Q4/Q3) 45.6
Total MOU per sub substituted to mobile 162.4
Total revenue substituted to mobile (£bn) 1.4
Total ARPU uplift (£) 10.0
Source: ABN AMRO estimates/OFTEL
We can also think of this substitution in terms of ARPU contribution by call type
(see following table). Our analysis clearly shows outgoing voice ARPU increasing
to £15.6 from £13.2 (+18%).
Table 25 : Central case: UK market ARPU by call type
Unit End Q102
Total ARPU (outgoing, exc. SMS) pre-decline £ 13.2
Total ARPU (outgoing, exc. SMS) post-decline (excelasticity) £ 5.6
Add: local call ARPU £ 2.5
Add: fixed to mobile call ARPU £ 0.9
Add: national call ARPU £ 3.1
Add: international call ARPU £ 0.3
Add: “other call” ARPU £ 3.2
Total outgoing ARPU post decline £ 15.6
% growth in ARPU % 18%
Source: ABN AMRO estimates/OFTEL
15% substitution of othercalls drives £0.4bn tomobile
Together we see up to 18%growth in outgoing voiceARPU
In total, substitutionincreases ARPU by £10
ARPU post migration is18% higher ...

M A C R O D Y N A M I C S
M O B I L E N E T W O R K S - W . E U R O P E 1 6 O C T O B E R 2 0 0 2 36
Industry impact
We can also think about the potential of fixed to mobile substitution in terms of the
total industry, recognising the importance of the 50% premium to the underlying
fixed-line price per minute. Our central case for mobile (holding all other factors
equal) suggests that UK mobile revenue grows to £2.1bn (for Q102 factoring in the
indicated substitution), and UK wireline revenue declines by 24% to £2.5bn from
£3.3bn. For the wireline operators this does not include any compensating benefit
from DSL. In aggregate, this results in total outgoing telecoms revenue in the UK
declining by about 9% (from about £5.1bn to £4.7bn).
Table 26 : UK fixed and mobile market post 58% cellular price decline
Fixed: post-price decline End-Q102
Fixed local call revenue (exc. access) (£bn) 0.3
F2M call revenue (exc. access) (£bn) 0.2
Fixed call revenue (national calls) (£bn) 0.2
Fixed call revenue (international calls) (£bn) 0.2
Fixed call revenue (Other calls) (£bn) 0.6
Total fixed call revenue (£bn) 1.5
Fixed access revenue (£bn) 1.1
Total fixed revenue (post-decline) £bn 2.5
% change -24.3%
Total fixed minutes bn 62.8
Actual price per minute (£) 0.04
% change 3%
Mobile revenue £bn 2.1
% change 18%
Mobile volume bn 34.5
% change 180%
Actual price per minute (£) 0.06
Implied multiple 1.5
Source: ABN AMRO estimates/OFTEL
We can present this impact more clearly using the following pie chart.
Figure 4 : UK telecoms quarterly revenue (£bn): central case
Pre-Decline Post-Decline
£5.1bn £4.7bn
Wireline revenue(pre-decline)% total 64%
Mobile revenue(pre-decline)% total 35%
Wireline revenue(post-decline)% total 54%
Mobile revenue(post-decline)% total 46%
Source: ABN AMRO
... but migration (withoutDSL growth) damages thewireline industry

M A C R O D Y N A M I C S
M O B I L E N E T W O R K S - W . E U R O P E 1 6 O C T O B E R 2 0 0 2 37
A word of warning
Intuitively, some readers of this study may ask why total revenue is shrinking. If
UK wireline loses more than 22bn minutes to wireless, and UK wireless customers
are prepared to pay a 50% premium to the underlying fixed line price, then
(surely) the industry should grow (not contract). This is (of course) correct,
excluding the original UK wireless revenue (see following chart). Total fixed falls to
£2.5bn from £3.3bn, mobile adds £1.4bn, resulting in total revenue of £3.8bn(from £3.3bn). But mobile also loses £1bn from its historical revenue stream.
Figure 5 : Q102 UK telco market revenue evolution (£bn)3.3 0.8
2.5
1.8 1
0.8
1.4 2.2
0
0.5
1
1.5
2
2.5
3
3.5
Total F.L..R (Pre-Decline)
Total F.L R (Lost)
Total F.L.R(Post-Decline)
Mobile (Pre-Decline)
Mobile (Lost) Mobile (Post Decline)
Mobile Rev. Added Mobile Rev(Post-Decline)
£.b
n
Source: ABN AMRO
Sensitivity analysis
In the following table we have presented a range of scenarios for outgoing voice
ARPU based on our analysis of the UK market at Q102. This enables investors to
take their own view of the scope for traffic substitution, for a given price reduction
and identify potential outgoing voice ARPU. For example, assuming a (say) 55%
share of traffic and 58% price reduction suggests outgoing voice ARPU shifts to
£24.4 (+84%).
Table 27 : Absolute ARPU (£) scenario analysis
Price reduction
-78% -68% -58% -48% -38% -28% -18%
Volume share 15% 4.1 5.5 6.8 8.1 9.4 10.8 12.1
25% 8.5 9.9 11.2 12.5 13.8 15.2 16.5
35% 12.9 14.3 15.6 16.9 18.2 19.5 20.9
45% 17.3 18.6 20.0 21.3 22.6 23.9 25.3
55% 21.7 23.0 24.4 25.7 27.0 28.3 29.7
65% 26.1 27.4 28.7 30.1 31.4 32.7 34.0
75% 30.5 31.8 33.1 34.5 35.8 37.1 38.4
Source: ABN AMRO
Without DSL growth,telecoms shrinks
We have also run asensitivity analysis on theprice change required todrive migration
For example, assuming a58% price cut results in55% of originated callsmigrating to mobile, movingARPU to £24

M A C R O D Y N A M I C S
M O B I L E N E T W O R K S - W . E U R O P E 1 6 O C T O B E R 2 0 0 2 38
Table 28 : Percentage change ARPU: scenario analysis
Price reduction
0.2 -78% -68% -58% -48% -38% -28% -18%
Volume share 15% -69% -59% -49% -39% -29% -19% -9%
25% -36% -26% -16% -6% 4% 14% 24%
35% -2% 8% 18% 28% 38% 48% 58%
45% 31% 41% 51% 61% 71% 81% 91%
55% 64% 74% 84% 94% 104% 114% 124%
65% 97% 107% 117% 127% 137% 147% 157%
75% 130% 140% 150% 160% 170% 180% 190%
Source: ABN AMRO
What about the power of the network?
A key risk is presented by the management of this process. We recognise that
running volume into value will be a challenging task. To quote a famous Greek
proverb, “What’s small, dark and knocking at the door? The future.” People are
rightly cynical about forecasting, but forecasting is at the heart of the planning
process and competitive positioning. However, it is our core belief that the low case
scenario is unlikely to emerge, because it ignores the scope for a networking effecton usage.
In our view, an analysis of existing call volume does not fully capture the potentialof the volume opportunity for the European wireless operator community. Why?
■ Mobiles are not generally shared and are most usually carried on the person,which provides an opportunity for a networking effect of increasing usage.
■ Our core thesis is that high prepaid charges have stunted European cellular
usage.
Hence our earlier assessment of the percentage of fixed-line call volume that could
displace to mobile could fundamentally underestimate the overall size of the
wireline telephony opportunity. In other words, the total size of the voicetelephony/broadband data market could explode (see following chart).
Chart 10 : Hypothetical volume forecast
-
5,000
10,000
15,000
20,000
25,000
1997
1998
1999
2000
2001
2002
2003
2004
2005
2006
2007
2008T
hou
sands
of G
igab
ytes
per
yea
r
Total Fixed Narrowband Data Total Fixed Narrowband Voice Total Fixed Narrowband
Total Broadband Data Total Broadband Voice Total Broadband
Total Mobile
Source: ABN AMRO
Using the same example,we can observe 84%growth on the pre-declineARPU
Should the wireless handsetbecome the primary accesspoint, large scale growth inthe size of the pie couldoccur
A classic bull market chart,or maybe realistic upside?

M A C R O D Y N A M I C S
M O B I L E N E T W O R K S - W . E U R O P E 1 6 O C T O B E R 2 0 0 2 39
F2M additive to pre-to-post paid migration
It is crucial to note that this fixed-to-mobile substitution growth is in addition to
underlying volume growth and the benefit we expect from pre-to-post-paid
migration (see above). In other words, there are two distinct drivers of ARPU:
■ Phase One: 4%-8% annual growth in blended ARPU from pre-to-post-paid
migration for the next four years’ and
■ Phase Two: an 18% structural shift in outgoing voice ARPU by 2006 (holding all
other factors equal 11% overall ARPU growth)
This results in up to 30% overall ARPU growth in total by year-end 2006.
Phase Three: Termination rate declines
Slowing subscriber growth at a time of sharply falling mobile termination prices
could further expose the cellular operators to a revenue crunch. Where regulated
reductions in mobile termination rates are exercised, they must be passed onto the
consumer. Termination rates typically account for 15%-35% of operators’ revenue.
Termination rates in Europe remain substantially higher than is observable in other
major markets, including the US and Korea (see following chart).
Chart 11 : European termination rates (€)
0
5
10
15
20
25
30
35
Aust
ria
Bel
giu
m
Den
mar
k
Ger
man
y
Finla
nd
Fran
ce
Gre
ece
Irel
and
Ital
y
Luxe
mbou
rge
Net
her
lands
Nor
way
Port
ugal
Sw
eden
Sw
itze
rlan
d
Spai
n
UK
Kor
ea US
Source: ABN AMRO/country regulators
In Regulation – Friend or Foe? dated 16 August 2002 we ran a detailed sensitivity
of various operators’ revenue to reductions in termination rates. Simply put, all
operators have material exposure – but new entrant operators have
disproportionately higher exposure. Ironically, as many regulators aim to promote
competition, they cannot cut rates too aggressively. We can assess the impact of
cuts to termination rates with reference to the UK.
A UK example
In the UK, OFTEL has suggested that RPI negative 12% should be applied to all UK
operators’ termination fees. Historically, UK operators have been subject to RPI
negative 9% for fixed line calls to wireless only. The extension of the mandate will
encompass about 48% of total incoming volume from 21% under the previousregulation (see following tables).
We have to balanceimproving outgoing voiceARPUs with potential fortermination rate cuts
European termination ratesremain at a signifiacntpremium to other majormarkets
Lower quality (primarily)new entrant businesses aremost exposed
The UK (again) offers anexcellent benchmark forunderstanding theeconomic impact of cuts

M A C R O D Y N A M I C S
M O B I L E N E T W O R K S - W . E U R O P E 1 6 O C T O B E R 2 0 0 2 40
We can work through the impact of RPI-12% using OFTEL data. First, we know
from OFTEL that mobile outgoing calls amounted to 12.3bn minutes in Q102 (for
the quarter, see following table).
Table 29 : UK mobile volume (m mins) Q102
(m mins) %
UK calls 11,931 97%
Outgoing international 166 1%
Roaming 233 2%
All calls (outgoing) 12,330 100%
Source: OFTEL
Of these minutes we know the percentage split between fixed calls, and on-and off-
net mobile minutes (see following table).
Table 30 : UK mobile volume call split % (excluding SMS)
FY Dec 01 Jan - Mar 2002
UK fixed calls 49% 6,042
On-Net mobile 26% 3,206
Off-Net mobile 13% 1,603
Outgoing international 1% 123
Roaming abroad 2% 247
Other 9% 1,110
100% 12,330
Source: ABN AMRO
We know that total interconnection volume amounted to 6.1bn minutes. Using the
data above we can imply about 1.3bn minutes attributable from the fixed line (see
following table).
Table 31 : UK interconnection volume
Jan - Mar 2002 % split
Portion from on network mobiles 3,206 52.4%
Portion from off network mobiles 1,603 26.2%
Total Portion from other mobiles 4,809 78.6%
Portion from fixed line 1,309 21.4%
Interconnection total 6,118 100.0%
Source: ABN AMRO
We also know that quarterly interconnect revenue of £672m was generated during
1Q02, and that £361m was attributable to off-net mobile. Hence factoring in a
2.0% RPI rate (ie a 10% price cut), suggests a 2.4% reduction in total quarterly
revenue (24% of revenue attributable to interconnect, multiplied by the percentage
subject to regulation [100%], multiplied by the percentage fall in regulated
interconnection [10%]). Hence double-digit declines in termination rate (all otherfactors held equal) results in minor negative revenue growth for the industry.
Using OFTEL data we canwork through the proposedRPI-12% cut
OFTEL tells us the splitbetween fixed, on- and off-net mobile minutes
We know that totalinterconnection minutesamounted to 6.1bn minutes(Q102), implying 1.3bnminutes attributable fromthe fixed line
Using an inflation rate of2%, and RPI-12% suggestsa 2.4% reduction inquarterly revenue, which isin the noise

M A C R O D Y N A M I C S
M O B I L E N E T W O R K S - W . E U R O P E 1 6 O C T O B E R 2 0 0 2 41
Table 32 : UK interconnection calculations
Volume Revenue ppm
On-net mobiles 3,206 0 0.00
Off-net mobiles 1,603 361 0.22
Mobile-to-mobile 4,809 361 0.07
Fixed-line 1,309 311 0.24
Total 6,118 672 0.11
Source: ABN AMRO
Given much of the doom and gloom surrounding the issue of termination rates, it is
important not to lose sight of the minor impact at the top line of RPI-12%. We put
a 60% probability on the RPI-12% cut being endorsed by the UK’s competition
commission. If this were confirmed, we would view it as an upside surprise to the
market’s current expectation.
We recognise that in a worst-case scenario, the competition commission could
introduce a draconian one-off price cut. Using a 20% price cut (for the purpose of
scenario analysis) we would expect revenue to decline between 4% and 5%, and
EBITDA by 8%-10%. Either way, we do not expect any announcements before
Q103.
Increasingly we think investors should question this analysis that excludes volume
uplift. Focusing on the impact to the profitability of a reduction in termination rates
without any compensating volume increase is appealing (due to simplicity), but it
ignores the possibility that growth in volume could occur, potentially compensating
operators for the loss in price.
Impediment to substitution
We recognise that the one of biggest impediments to potential substitution is the
high rate of mobile termination fees throughout Europe. We expect termination
rates will continue to decline at a double-digit rate for the foreseeable future.
Ironically, cuts in termination rates could refocus management on the fixed-to-
mobile substitution opportunity. Hence we believe falling termination rates are key
to enabling growth in outgoing voice ARPU.
The US experience
While there is a weight of evidence showing that cuts to terminations rates do
materially affect short-term profitability in markets with relatively high levels of
termination (see Portugal as an example), we believe there could be a silver lining
to the cloud. In our view, the US cellular market provides a benchmark that could
provide an indicator of Europe’s future. US blended ARPUs are more than 50%
higher than UK ARPUs (see following chart).
We put 60% probability onthe RPI-12% ruling beingconfirmed
We put a 40% probabilityon a draconian price cut ...
… but remind investors ofthe potential for increasingvolume to at least partiallyoffset losses
Ironically, cuts intermination rates could r-focus management onfixed-to-mobile substitution
The US model suggeststhere could be a silverlining to the cloud ...
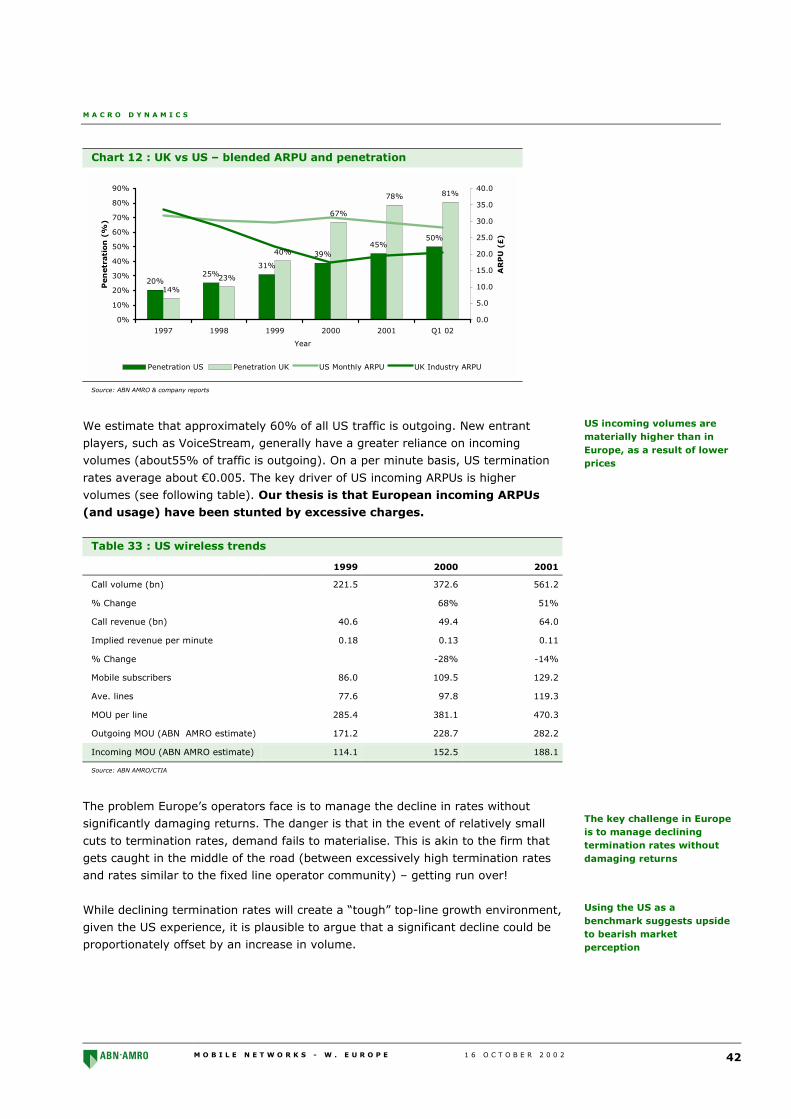
M A C R O D Y N A M I C S
M O B I L E N E T W O R K S - W . E U R O P E 1 6 O C T O B E R 2 0 0 2 42
Chart 12 : UK vs US – blended ARPU and penetration
20%25%
31%
39%45%
50%
14%
23%
40%
67%
78% 81%
0%
10%
20%
30%
40%
50%
60%
70%
80%
90%
1997 1998 1999 2000 2001 Q1 02
Year
Pen
etr
ati
on
(%
)
0.0
5.0
10.0
15.0
20.0
25.0
30.0
35.0
40.0
AR
PU
(£
)
Penetration US Penetration UK US Monthly ARPU UK Industry ARPU
Source: ABN AMRO & company reports
We estimate that approximately 60% of all US traffic is outgoing. New entrant
players, such as VoiceStream, generally have a greater reliance on incoming
volumes (about55% of traffic is outgoing). On a per minute basis, US termination
rates average about €0.005. The key driver of US incoming ARPUs is higher
volumes (see following table). Our thesis is that European incoming ARPUs
(and usage) have been stunted by excessive charges.
Table 33 : US wireless trends
1999 2000 2001
Call volume (bn) 221.5 372.6 561.2
% Change 68% 51%
Call revenue (bn) 40.6 49.4 64.0
Implied revenue per minute 0.18 0.13 0.11
% Change -28% -14%
Mobile subscribers 86.0 109.5 129.2
Ave. lines 77.6 97.8 119.3
MOU per line 285.4 381.1 470.3
Outgoing MOU (ABN AMRO estimate) 171.2 228.7 282.2
Incoming MOU (ABN AMRO estimate) 114.1 152.5 188.1
Source: ABN AMRO/CTIA
The problem Europe’s operators face is to manage the decline in rates without
significantly damaging returns. The danger is that in the event of relatively small
cuts to termination rates, demand fails to materialise. This is akin to the firm that
gets caught in the middle of the road (between excessively high termination rates
and rates similar to the fixed line operator community) – getting run over!
While declining termination rates will create a “tough” top-line growth environment,
given the US experience, it is plausible to argue that a significant decline could be
proportionately offset by an increase in volume.
US incoming volumes arematerially higher than inEurope, as a result of lowerprices
The key challenge in Europeis to manage decliningtermination rates withoutdamaging returns
Using the US as abenchmark suggests upsideto bearish marketperception

M A C R O D Y N A M I C S
M O B I L E N E T W O R K S - W . E U R O P E 1 6 O C T O B E R 2 0 0 2 43
Top down: share of GDP
While getting into the detail is useful, it is important not to forget the implied share
of GDP that we are suggesting is attainable for Europe’s wireless operators.
According to our estimates, wireless’s share of GDP ranges between 0.7% and1.3% in Europe’s major markets.
Wireline spend ranges between 1.2x and 2.3x wireless spend as a percentage of
GDP. Hence in aggregate, telecoms spend accounts for 2.2%- 3.3% of GDP. In the
UK, telco spend accounted for around 2.4% at year-end 2001 (see following table).
Table 34 : UK telco spend
(£) 1998 1999 2000 2001
Wireline revenue (£) 13.4 14.2 14.9 15.0
Wireless revenue (£) 3.9 5.3 6.9 8.2
Nominal GDP (£) 859 902 950 988
Telecom spend as %GDP 2.0% 2.2% 2.3% 2.4%
Wireline spend as %GDP 1.6% 1.6% 1.6% 1.5%
Wireless spend as % GDP 0.5% 0.6% 0.7% 0.8%
Source: ABN AMRO
This can be compared with the higher share of GDP that is observable in the US.
Wireless share of GDP is particularly impressive given the materially lower rate ofpenetration (c.50% vs Europe c.81%).
Table 35 : US telco spend as a % of GDP
1998 1999 2000 2001
Wireless 0.4% 0.5% 0.6% 0.8%
LD 1.1% 1.1% 1.0% 0.9%
Local 1.3% 1.3% 1.3% 1.3%
Total 2.8% 2.9% 3.0% 3.0%
Source: ABN AMRO/FCC
We have sanity-checked ourbottom-up work to share ofGDP
Wireline spend rangesbetween 1.2x and 2.3xwireless spend
US wireless share of GDP isparticularly impressivegiven the lower rate ofpenetration

M A C R O D Y N A M I C S
M O B I L E N E T W O R K S - W . E U R O P E 1 6 O C T O B E R 2 0 0 2 44
This page has been left intentionally blank

M O B I L E N E T W O R K S - W . E U R O P E 1 6 O C T O B E R 2 0 0 2 45
I N V E S T M E N T V I E W
Bucket pricing plans
Despite intense competition, US operators have maintained high ARPU levels by not
targeting lower-value prepay subscribers, and through the introduction of “bucket
plans.” US operators have increased the number of free minutes of service, rather
than reduce the monthly access fee. In Europe, “tariff plans” have resulted in
significant ARPU dilution, and higher margins but lower pre-capex cash flow per
subscriber. In our view, the bucket pricing plan offers superior long-term returns to
Europe’s tariff plan model. As a result, we believe that Europe will move towards
flat rate access fees. We highlight that success can breed failure as the historical
success model becomes the major obstacle to a firm’s adoption of the new reality.
The introduction of the “your plan” flat rate fee by Orange in the UK provides early-
stage validation of our view. In addition we flag that an analysis of VoiceStream,
the aggressive US new entrant, provides a benchmark for understanding the
potential impact of Hutchison in Europe, and the domino effect we forecast
throughout the European wireless landscape.
Introduction
In this section of the note we present:
■ the difference in subscriber mix by major market;
■ US vs European ARPUs;
■ bucket plan volume;
■ capacity/capex as a driver of pricing; and
■ US bucket plan yields vs Europe’s major markets.
Flat rate access plansenable fixed-to-mobilesubstitution

I N V E S T M E N T V I E W
M O B I L E N E T W O R K S - W . E U R O P E 1 6 O C T O B E R 2 0 0 2 46
The US experience
US operators, while reporting falling historic ARPU, have consistently reported
higher and more stable ARPUs than their European counterparts. We attribute this
to two key drivers, post-paid focus and bucket plans.
Post-paid focus
US operators have not aggressively targeted lower-value prepay subscribers. This
is easily identifiable from a comparative analysis of subscriber mix by geography
(see following chart). In the US, this product is unattractive because prepaidcustomers would also have to pay for incoming calls.
Chart 13 : Worldwide subscriber bases
85%
15%
72%
28%
65%
35%
67%
33%
52%
48%
3%
97%
9%
91%
Italy UK Spain Germany France Japan US
Pre-Pay Post-Pay
Total 50 48 29 58 37 62 130Subs (m)
89%
53%
60%
69%
79%75%
46%
Source: ABN AMRO and Deutsche Telekom
Flat rate fees/increasing volume
The US cellular business model has increased the number of free minutes of service
included in access plans (bucket plans), rather than reducing the cost of access
plans. By comparison, European operators have traditionally structured mobile
plans with cheaper access fees, but with much fewer free minutes included and
charging per minute for calls made (tariff plans). The US model is based onincreasing volume offsetting declining prices to maintain ARPU.
US vs UK blended ARPUs
Blended ARPUs in the US are materially higher than in Europe. To December 2001,
in the US monthly ARPU stood at £29.7, compared with £19.6 in the UK, ie over
50% higher (see following chart). At 2Q02, Vodafone was the highest ARPU
operator in the UK (£23 per month) vs monthly ARPU at Nextel [NXTL-US$9.20,
N/R] of £48 and AT&T Wireless [AWE-US$4.94, N/R] of £43 per month. This is a
direct function of the higher-volume/lower-margin business model that has been
adopted (in marked contrast to the established European model).
US operators haveconsistently reportedhigher and more stableARPUs than their Europeanpeers
The US model is volumebased
US monthly industry ARPUover 50% higher than theUK industry average
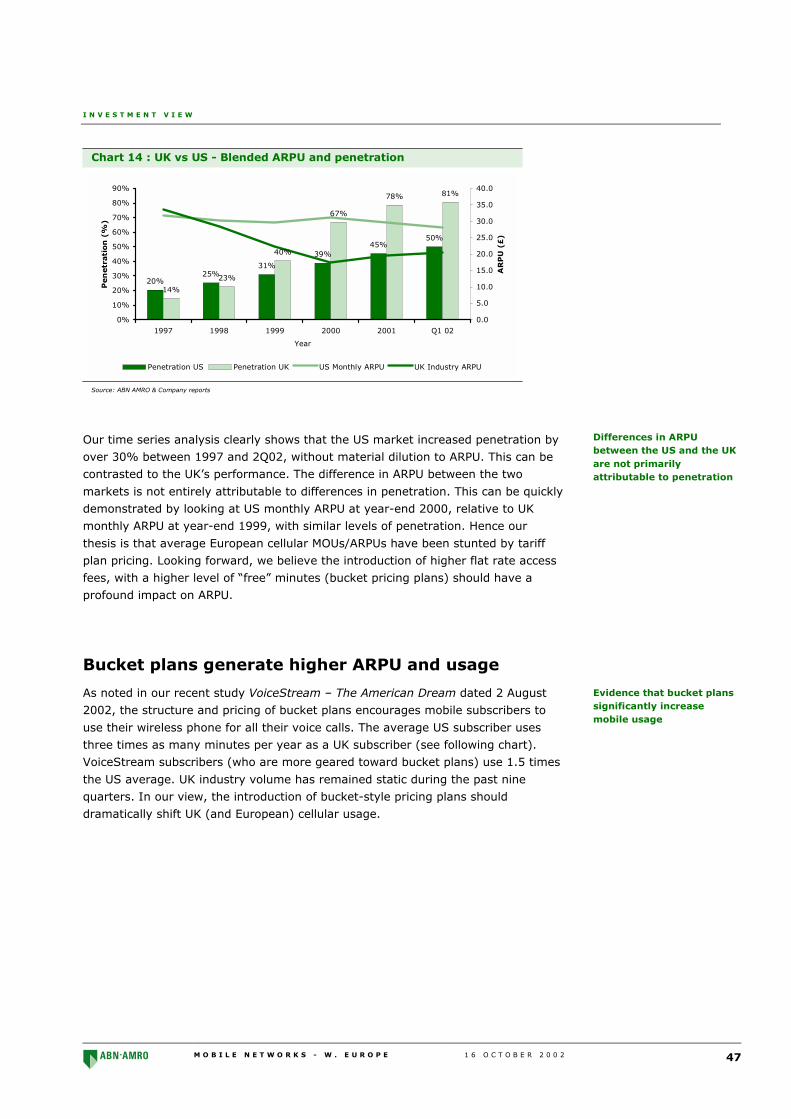
I N V E S T M E N T V I E W
M O B I L E N E T W O R K S - W . E U R O P E 1 6 O C T O B E R 2 0 0 2 47
Chart 14 : UK vs US - Blended ARPU and penetration
20%25%
31%
39%45%
50%
14%
23%
40%
67%
78% 81%
0%
10%
20%
30%
40%
50%
60%
70%
80%
90%
1997 1998 1999 2000 2001 Q1 02
Year
Pen
etr
ati
on
(%
)
0.0
5.0
10.0
15.0
20.0
25.0
30.0
35.0
40.0
AR
PU
(£
)
Penetration US Penetration UK US Monthly ARPU UK Industry ARPU
Source: ABN AMRO & Company reports
Our time series analysis clearly shows that the US market increased penetration by
over 30% between 1997 and 2Q02, without material dilution to ARPU. This can be
contrasted to the UK’s performance. The difference in ARPU between the two
markets is not entirely attributable to differences in penetration. This can be quickly
demonstrated by looking at US monthly ARPU at year-end 2000, relative to UK
monthly ARPU at year-end 1999, with similar levels of penetration. Hence our
thesis is that average European cellular MOUs/ARPUs have been stunted by tariff
plan pricing. Looking forward, we believe the introduction of higher flat rate access
fees, with a higher level of “free” minutes (bucket pricing plans) should have a
profound impact on ARPU.
Bucket plans generate higher ARPU and usage
As noted in our recent study VoiceStream – The American Dream dated 2 August
2002, the structure and pricing of bucket plans encourages mobile subscribers to
use their wireless phone for all their voice calls. The average US subscriber uses
three times as many minutes per year as a UK subscriber (see following chart).
VoiceStream subscribers (who are more geared toward bucket plans) use 1.5 times
the US average. UK industry volume has remained static during the past nine
quarters. In our view, the introduction of bucket-style pricing plans should
dramatically shift UK (and European) cellular usage.
Differences in ARPUbetween the US and the UKare not primarilyattributable to penetration
Evidence that bucket planssignificantly increasemobile usage

I N V E S T M E N T V I E W
M O B I L E N E T W O R K S - W . E U R O P E 1 6 O C T O B E R 2 0 0 2 48
Chart 15 : Monthly MOU (incoming and outgoing)
0
100
200
300
400
500
600
700
Q1 00A Q2 00A Q3 00A Q4 00A Q1 01A Q2 01A Q3 01A Q4 01A Q1 02A
Period
Min
ute
s
VoiceStream US Industry Average UK Industry Average
Source: ABN AMRO, company reports and OFTEL data
Following AT&T Wireless, VoiceStream introduced more aggressive bucket pricing
plans into the US market, creating a domino effect. US national operators offer two
main types of bucket plans, which generally provide more minutes than most
subscribers can consume. This is a marketing ploy used particularly well by
VoiceStream to make the subscribers feel they are receiving greater value for
money.
■ National one-rate plans eliminate long distance charges. These plans consist
of a monthly fee that includes an allocation of “anytime minutes,” off-peak
minutes and one standard overage rate. It is difficult to compare plans across
operators because some, like VoiceStream, charge extra for off-network
roaming, while others include it in the price.
■ Regional plans offer users free minutes in their region (multi-state, not
national) but typically charge for roaming out of one’s region and for long
distance minutes. This is the plan that has given VoiceStream the most publicity
– ie 3,000 “anytime” minutes for $59.99 – but accounts for less than 20% of
new customers.
Recent pricing plans announced by the big six operators are very similar as each
fights for market share. VoiceStream has been the most aggressive US operator,
setting industry-low price points for both national one-rate and regional plans.
The evidence available from the US market model to date suggests that new
subscribers are choosing national instead of regional plans. Customers are using
these national plans to replace their landline phones for long distance calls, but still
using wireline for untimed local calls.
Two main types of bucketplans
VoiceStream the mostaggressive US operator
80% of new subscribers arechoosing national plans
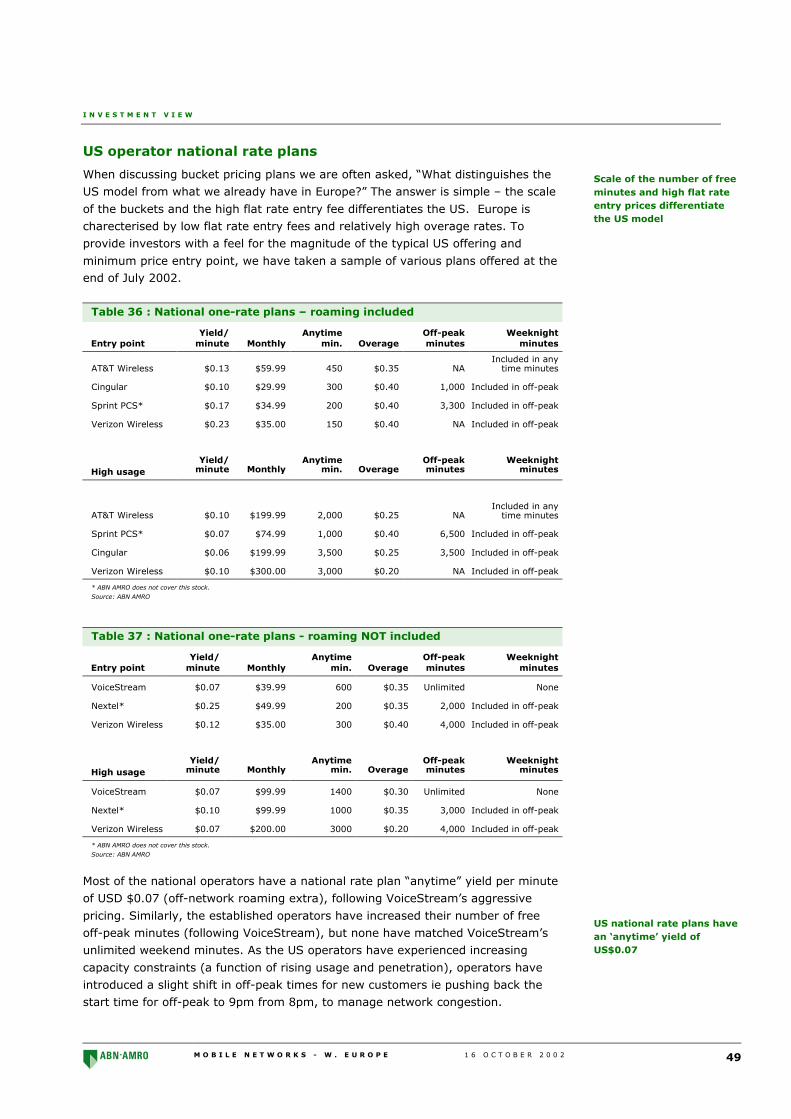
I N V E S T M E N T V I E W
M O B I L E N E T W O R K S - W . E U R O P E 1 6 O C T O B E R 2 0 0 2 49
US operator national rate plans
When discussing bucket pricing plans we are often asked, “What distinguishes the
US model from what we already have in Europe?” The answer is simple – the scale
of the buckets and the high flat rate entry fee differentiates the US. Europe is
charecterised by low flat rate entry fees and relatively high overage rates. To
provide investors with a feel for the magnitude of the typical US offering and
minimum price entry point, we have taken a sample of various plans offered at theend of July 2002.
Table 36 : National one-rate plans – roaming included
Entry pointYield/
minute MonthlyAnytime
min. OverageOff-peakminutes
Weeknightminutes
AT&T Wireless $0.13 $59.99 450 $0.35 NAIncluded in any
time minutes
Cingular $0.10 $29.99 300 $0.40 1,000 Included in off-peak
Sprint PCS* $0.17 $34.99 200 $0.40 3,300 Included in off-peak
Verizon Wireless $0.23 $35.00 150 $0.40 NA Included in off-peak
High usageYield/
minute MonthlyAnytime
min. OverageOff-peakminutes
Weeknightminutes
AT&T Wireless $0.10 $199.99 2,000 $0.25 NAIncluded in any
time minutes
Sprint PCS* $0.07 $74.99 1,000 $0.40 6,500 Included in off-peak
Cingular $0.06 $199.99 3,500 $0.25 3,500 Included in off-peak
Verizon Wireless $0.10 $300.00 3,000 $0.20 NA Included in off-peak
* ABN AMRO does not cover this stock.
Source: ABN AMRO
Table 37 : National one-rate plans - roaming NOT included
Entry pointYield/
minute MonthlyAnytime
min. OverageOff-peakminutes
Weeknightminutes
VoiceStream $0.07 $39.99 600 $0.35 Unlimited None
Nextel* $0.25 $49.99 200 $0.35 2,000 Included in off-peak
Verizon Wireless $0.12 $35.00 300 $0.40 4,000 Included in off-peak
High usageYield/
minute MonthlyAnytime
min. OverageOff-peakminutes
Weeknightminutes
VoiceStream $0.07 $99.99 1400 $0.30 Unlimited None
Nextel* $0.10 $99.99 1000 $0.35 3,000 Included in off-peak
Verizon Wireless $0.07 $200.00 3000 $0.20 4,000 Included in off-peak
* ABN AMRO does not cover this stock.
Source: ABN AMRO
Most of the national operators have a national rate plan “anytime” yield per minute
of USD $0.07 (off-network roaming extra), following VoiceStream’s aggressive
pricing. Similarly, the established operators have increased their number of free
off-peak minutes (following VoiceStream), but none have matched VoiceStream’s
unlimited weekend minutes. As the US operators have experienced increasing
capacity constraints (a function of rising usage and penetration), operators have
introduced a slight shift in off-peak times for new customers ie pushing back the
start time for off-peak to 9pm from 8pm, to manage network congestion.
Scale of the number of freeminutes and high flat rateentry prices differentiatethe US model
US national rate plans havean ‘anytime’ yield ofUS$0.07

I N V E S T M E N T V I E W
M O B I L E N E T W O R K S - W . E U R O P E 1 6 O C T O B E R 2 0 0 2 50
US operator regional plans
Table 38 : Regional (Northeast neighbourhood) rate plans
Entry pointYield/
minute MonthlyAnytime
min. OverageOff-peakminutes Roaming
Longdistance
VoiceStream $0.02 $59.99 3,000 $0.35 NA $0.49 $0.20
AT&T Wireless $0.30 $29.99 100 $0.40 2,000 $0.69 NA
Nextel* $0.10 $49.99 500 $0.35 NA NA $0.15
Sprint PCS* $0.14 $34.99 250 $0.40 3,250 NA $0.20
Verizon Wireless $0.10 $35.00 350 $0.45 4,000 $0.69 $0.20
High usageYield/
minute MonthlyAnytime
min. OverageOff-peakminutes Roaming
Longdistance
VoiceStream $0.02 $59.99 3,000 $0.35 NA $0.49 $0.20
AT&T Wireless $0.08 $199.99 2,500 $0.25 Unlimited $0.69 NA
Nextel* $0.10 $99.99 1,000 $0.35 NA NA $0.15
Sprint PCS* $0.09 $69.99 800 $0.40 6200 NA $0.20
Verizon Wireless $0.07 $100.00 1,500 $0.30 4000 $0.69 $0.20
* ABN AMRO does not cover this stock.
Source: ABN AMRO
Many investors flag the low yield per minute ($0.02) generated by VoiceStream’s
controversial 3,000 “anytime” minute regional plan as being an unsustainablebusiness model; however, the following points must be considered.
■ This plan was introduced in 3Q01 primarily as a marketing tool by VoiceStream
to reinforce its image as being the best value wireless provider in the US. The
actual effect on VoiceStream’s network capacity and margins is limited as less
than 20% of new net adds choose this plan.
■ On average, only 1,000 (16.6 hours per month) of the 3,000 minutes (50 hours
per month) are actually used, implying a real yield of $0.06 per minute, which is
almost in line with the competition and not dissimilar to the $0.07 yieldgenerated by national call plans.
We believe that national operators will continue to promote this offer as a
marketing tool while they have spare capacity. However, as penetration and usage
increase, operators will need to either increase prices and/or reduce the number of
bundled minutes. The speed of this process will be an individual consideration foreach operator based on spare network capacity available.
Spare network capacity in each market is a function of spectrum and the number
of subscribers on the network. In the US, VoiceStream is by far the smallest
national operator in terms of subscribers, but has a similar amount of spectrum in
the top 50 markets as its competitors, and therefore has greater spare capacity tocarry additional minutes on its network (see following chart).
Points to consider about the3,000 ‘anytime’ minuteregional plan
Little impact on margins –only 20% of customerschoosing this plan
Only one-third of minutesused, generating sameactual yield as national callplans
VoiceStream is the smallestnational operator, but has asimilar amount of spectrumin the top 50 markets

I N V E S T M E N T V I E W
M O B I L E N E T W O R K S - W . E U R O P E 1 6 O C T O B E R 2 0 0 2 51
Chart 16 : MHZ per subscriber (average top 50 markets)
0.00
0.50
1.00
1.50
2.00
2.50
3.00
3.50
4.00
Verizon Wireless CingularWireless
AT&T Wireless Sprint PCS NextelCommunications
Voicestream
ABN AMRO does not cover Sprint PCS or Nextel Communications.
Source: ABN AMRO
Additionally, all of VoiceStream’s network is based on GSM technology, while some
operators such as AWE and Cingular are still partially using less capacity-efficient
TDMA. Cingular’s chief technology officer has stated that upgrading to GSM/GPRS
by 2004 will increase voice capacity on Cingular’s existing network by 120%, while
at the same time requiring 18% less spectrum.
Average yield based on actual minutes used
To calculate the average actual yield per minute being generated by the various
plan options, we have divided average ARPU by the actual number of minutes used
(rather than offered) for the past nine quarters. In the US market VoiceStream,
with its lower-priced bucket plans, is the cheapest US wireless provider per minute.
The effect of competition and bucket plans has led to the US market pricing per
minute (yield) being relatively cheaper.
Chart 17 : Yield per MOU
0.00
0.05
0.10
0.15
0.20
0.25
0.30
Q1 00A Q2 00A Q3 00A Q4 00A Q1 01A Q2 01A Q3 01A Q4 01A Q1 02A
Period
Yie
ld (
USD
)
VoiceStream US Industry Average UK Industry Average
Source: ABN AMRO, company reports and OFTEL data
VoiceStream’s networktechnology is morecapacity-efficient
VoiceStream the cheapestUS wireless provider perminute
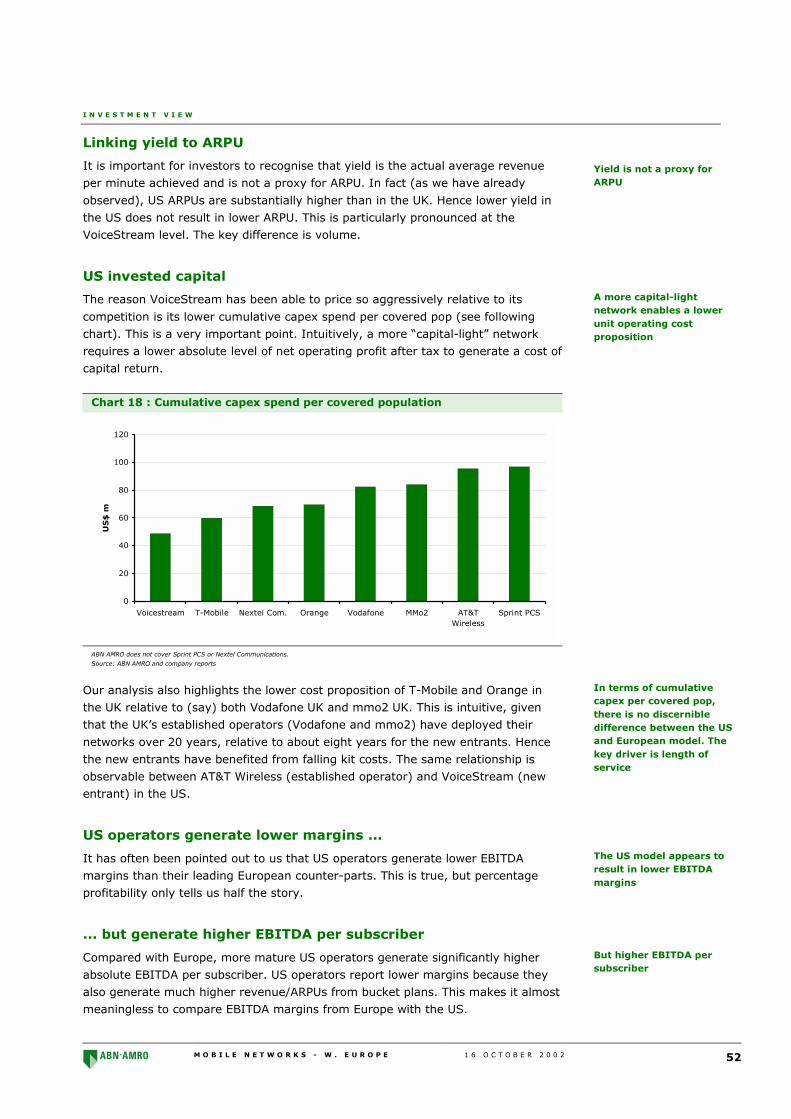
I N V E S T M E N T V I E W
M O B I L E N E T W O R K S - W . E U R O P E 1 6 O C T O B E R 2 0 0 2 52
Linking yield to ARPU
It is important for investors to recognise that yield is the actual average revenue
per minute achieved and is not a proxy for ARPU. In fact (as we have already
observed), US ARPUs are substantially higher than in the UK. Hence lower yield in
the US does not result in lower ARPU. This is particularly pronounced at the
VoiceStream level. The key difference is volume.
US invested capital
The reason VoiceStream has been able to price so aggressively relative to its
competition is its lower cumulative capex spend per covered pop (see following
chart). This is a very important point. Intuitively, a more “capital-light” network
requires a lower absolute level of net operating profit after tax to generate a cost of
capital return.
Chart 18 : Cumulative capex spend per covered population
0
20
40
60
80
100
120
Voicestream T-Mobile Nextel Com. Orange Vodafone MMo2 AT&TWireless
Sprint PCS
US
$ m
ABN AMRO does not cover Sprint PCS or Nextel Communications.
Source: ABN AMRO and company reports
Our analysis also highlights the lower cost proposition of T-Mobile and Orange in
the UK relative to (say) both Vodafone UK and mmo2 UK. This is intuitive, given
that the UK’s established operators (Vodafone and mmo2) have deployed their
networks over 20 years, relative to about eight years for the new entrants. Hence
the new entrants have benefited from falling kit costs. The same relationship is
observable between AT&T Wireless (established operator) and VoiceStream (new
entrant) in the US.
US operators generate lower margins ...
It has often been pointed out to us that US operators generate lower EBITDA
margins than their leading European counter-parts. This is true, but percentage
profitability only tells us half the story.
... but generate higher EBITDA per subscriber
Compared with Europe, more mature US operators generate significantly higher
absolute EBITDA per subscriber. US operators report lower margins because they
also generate much higher revenue/ARPUs from bucket plans. This makes it almost
meaningless to compare EBITDA margins from Europe with the US.
Yield is not a proxy forARPU
A more capital-lightnetwork enables a lowerunit operating costproposition
In terms of cumulativecapex per covered pop,there is no discernibledifference between the USand European model. Thekey driver is length ofservice
The US model appears toresult in lower EBITDAmargins
But higher EBITDA persubscriber

I N V E S T M E N T V I E W
M O B I L E N E T W O R K S - W . E U R O P E 1 6 O C T O B E R 2 0 0 2 53
Chart 19 : EBITDA per subscriber
-80.0
-60.0
-40.0
-20.0
-
20.0
40.0
60.0
80.0
Via
g
Voi
ceStr
eam
/Pow
erte
l
Eplu
s
T-M
obile
- U
K
Ora
nge
- U
K
MM
o2
Vod
afon
e -
Ger
man
y
T-M
obile
Ger
man
y
Vod
afon
e -
UK
AT&
T W
irel
ess
Sprint
PCS
Ver
izon
Wirel
ess
Cin
gula
r
(Euro
)
ABN AMRO does not cover Sprint PCS.
Source: ABN AMRO & Company reports
Higher pre-capex cash flow per subscriber supports our thesis that the US model
could be superior to the existing European model. Unfortunately, it is difficult to
compare absolute cash flow per subscriber between the US and Europe. This is a
function of three key factors.
■ Differences in penetration. If the numerator is reasonably similar, differences
in the denominator distort comparison. As US penetration moves towards
maturity (c.75%), comparison would be more meaningful.
■ Differences in capex phase. US operators are completing network coverage
relative to more mature European network operators that are primarily investing
in capacity and maintenance. Coverage remains the most capital-intensivephase of the cellular business model.
■ Technology migration. US operators such as AT&T Wireless and Cingular have
(and will continue) to be affected by the commitment of capital to migrate their
existing networks from TDMA to GSM.
Notwithstanding the difficulty of comparison, we suspect that the US model
(technology migration issues aside) is not proportionately more capital-intensive
than the European model. When coverage has been completed, capacity and
maintenance is success-driven and represents a very small percentage of
incremental revenue generated. In other words, higher pre-capex cash flow per
subscriber should feed down to higher absolute cash flow per subscriber.
If our thesis is correct, we must address why US cellular assets trade at such a
material discount to their European peers. We attribute this to four easily
identifiable factors.
■ Uncertainty over incremental penetration growth remaining (driving
significant forecast downgrades to top-line growth)
■ A structurally more competitive market. We note nearly 50% of the US
population has access to over six wireless operators (over 75% have access to
over five). The US Herfindahl index at year-end 2001 sat at 1700, suggesting
fierce competition, much lower than its European peers (eg Italy at 3729,
suggesting a high degree of pricing power).
Higher pre-capex cash flowper sub supports ourpositive thesis
Cellular capex is primarilycoverage (not capacity)driven
Weak US cellular valuationsdo not affect our positive on‘bucket pricing’ thesis
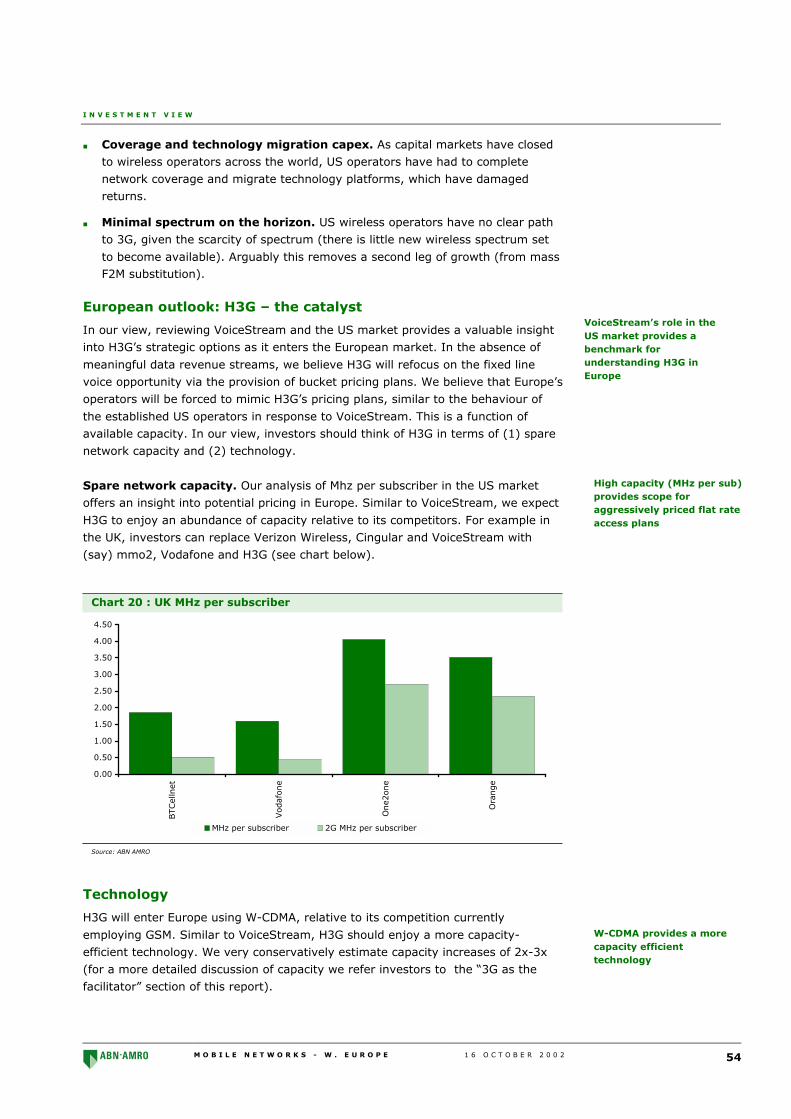
I N V E S T M E N T V I E W
M O B I L E N E T W O R K S - W . E U R O P E 1 6 O C T O B E R 2 0 0 2 54
■ Coverage and technology migration capex. As capital markets have closed
to wireless operators across the world, US operators have had to complete
network coverage and migrate technology platforms, which have damaged
returns.
■ Minimal spectrum on the horizon. US wireless operators have no clear path
to 3G, given the scarcity of spectrum (there is little new wireless spectrum set
to become available). Arguably this removes a second leg of growth (from massF2M substitution).
European outlook: H3G – the catalyst
In our view, reviewing VoiceStream and the US market provides a valuable insight
into H3G’s strategic options as it enters the European market. In the absence of
meaningful data revenue streams, we believe H3G will refocus on the fixed line
voice opportunity via the provision of bucket pricing plans. We believe that Europe’s
operators will be forced to mimic H3G’s pricing plans, similar to the behaviour of
the established US operators in response to VoiceStream. This is a function of
available capacity. In our view, investors should think of H3G in terms of (1) spare
network capacity and (2) technology.
Spare network capacity. Our analysis of Mhz per subscriber in the US market
offers an insight into potential pricing in Europe. Similar to VoiceStream, we expect
H3G to enjoy an abundance of capacity relative to its competitors. For example in
the UK, investors can replace Verizon Wireless, Cingular and VoiceStream with
(say) mmo2, Vodafone and H3G (see chart below).
Chart 20 : UK MHz per subscriber
0.00
0.50
1.00
1.50
2.00
2.50
3.00
3.50
4.00
4.50
BTCel
lnet
Vodaf
one
One2
one
Ora
nge
MHz per subscriber 2G MHz per subscriber
Source: ABN AMRO
Technology
H3G will enter Europe using W-CDMA, relative to its competition currently
employing GSM. Similar to VoiceStream, H3G should enjoy a more capacity-
efficient technology. We very conservatively estimate capacity increases of 2x-3x
(for a more detailed discussion of capacity we refer investors to the “3G as the
facilitator” section of this report).
VoiceStream’s role in theUS market provides abenchmark forunderstanding H3G inEurope
High capacity (MHz per sub)provides scope foraggressively priced flat rateaccess plans
W-CDMA provides a morecapacity efficienttechnology

I N V E S T M E N T V I E W
M O B I L E N E T W O R K S - W . E U R O P E 1 6 O C T O B E R 2 0 0 2 55
European yield
As part of the preparation for this note, we analysed the yield observable in the UK,
France and Italy (see following chart). The markets with the highest level of
concentration ie less competition have enjoyed the highest yield (France and Italy).
This is in line with our core belief that industry structure determines longer-term
sustainable returns.
Chart 21 : Key European market yields: the impact of competition
0.15
0.20
0.25
0.30
1999 Q100 Q200 Q300 Q400 Q101 Q201 Q301 Q401
Period
Yie
ld (
USD
)
France Italy UK
Source: ABN AMRO
European yield outlook
The trend in yield per minute observable in the US provides an excellent lead
indicator of potential yields throughout Europe as a result of the entrance of
Hutchison 3G. In the US, VoiceStream has been able to prosper with a lower yield
as a result of its lower invested capital base. In Europe, we believe that H3G will be
able to play the same game.
Chart 22 : US % change in yield Q200A to Q102A
-20%
-15%
-10%
-5%
0%
5%
10%
Q2 00A Q3 00A Q4 00A Q1 01A Q2 01A Q3 01A Q4 01A Q1 02A
Voicestream % change US industry % change
Source: ABN AMRO
Other European marketsstill have very high yieldlevels
The trend observable in theUS provides a lead indicatorof Europe’s potential future

I N V E S T M E N T V I E W
M O B I L E N E T W O R K S - W . E U R O P E 1 6 O C T O B E R 2 0 0 2 56
Over the past two years, US industry yields have fallen by a CAGR of 20%, relative
to VoiceStream posting an annual decline of about 15%. However, we note that US
yields have stabilised in recent quarters, reflecting capacity constraints.
Cumulative capex
We understand that HWL’s original business plan budgeted for about US$10bn of
cumulative capex to year-end 2005 for its European wireless operations. We
believe that approximately 55% of this spend will be dedicated to the UK operation
(US$5.5bn), 35% to Italy (US$3.5bn) and what remains to HWL’s more minor
operations (eg Denmark, Sweden, Ireland, Austria etc). More recently, HWL has
indicated that the operations in Italy and the UK will benefit from infrastructure
sharing, reducing capital expenditure by around 20%, implying new cumulative
capex of €4.4bn for the UK and €2.8bn for Italy.
Cumulative capex per covered pop
Using this data as a starting point we can pinpoint H3G’s position in the UK relative
to the existing competition.
■ Using Companies House data, we can identify cumulative capex for each of the
UK’s major operators to year-end 2001 (with the exception of Vodafone and T-
Mobile, for which we have used an estimate of 10% of their top lines for theperiod to December 2001).
■ We then assume a maintenance level of capex at 6% of each operator’s forecast
top line per annum to year-end 2005.
■ Finally, we take a common view on the cost of deploying a 3G network in the UK
for the established operators, conservatively assuming 50% of existing 2G sitescan be re-used (see following table).
Table 39 : UK established operator 3G capex to year-end 2005
(€m) Cost
H3G capex 4,400
70% of capex “real estate build” 3,080
Existing operator (50% re-use of existing sites) 1,540
Other kit capex 1,320
Total existing operator 3G capex 2,860
As a % of total 65%
Source: ABN AMRO
While this analysis is “quick and dirty,” it enables us to identify the cumulative
capex per covered pop by operator (see following chart). Reflecting its newer
operator status, H3G enjoys a significantly lower cumulative capex per coveredpop.
In the US, industry yieldshave fallen by a CAGR of20% over the past twoyears
H3G could enjoy a similarlowest-cost operatorposition
We have presented apotential cumulative capexper covered pop analysis forthe UK operators
While this is ‘quick anddirty,’ it enables us tobetter understand thepotential pricingenvironment

I N V E S T M E N T V I E W
M O B I L E N E T W O R K S - W . E U R O P E 1 6 O C T O B E R 2 0 0 2 57
Chart 23 : Forecast cumulative capex per covered pop by UK operator
-
20
40
60
80
100
120
140
160
180
mmo2 Vodafone Orange T-Mobile H3G
Source: ABN AMRO estimates
As demonstrated by the pricing of VoiceStream in the US market, an operator’s
returns are a function of its balance sheet invested capital (of which a large
proportion is capex); historical cost plays an important role in framing reported
returns. To 2005, we would expect H3G to have a “lighter” balance sheet than its
established peers. Over the longer term, as the UK’s established operators replace
the capital in their balance sheet, we would expect a movement towards
convergence.
Over the longer term wewould expect a movementtowards convergence

I N V E S T M E N T V I E W
M O B I L E N E T W O R K S - W . E U R O P E 1 6 O C T O B E R 2 0 0 2 58
This page has been left intentionally blank
M O B I L E N E T W O R K S - W . E U R O P E 1 6 O C T O B E R 2 0 0 2 59
S E C T O R D Y N A M I C S
3G as the facilitator
In our view, European 2G capacity constraints have prohibited the introduction of
bucket pricing plans (and by association fixed-to-mobile substitution). While 3G
may facilitate the use of high-speed applications, the real untold story of 3G is
capacity. 3G will enable Europe’s cellular operators to increase volume
aggressively. We estimate that employing W-CDMA with just one transceiver, 3G
will increase existing operator capacity between 1.7x and 2.8x, employing a
conservative 20% improvement in spectral efficiency. In densely populated areas,
capacity could increase by up to 5.0x employing only one transceiver. It is our core
belief that this will drive substantial displacement. In the medium term we do not
rule out the possibility that EDGE could be deployed in Europe to unlock existing 3G
spectrum allocation.
Introduction
In this section of this note we present:
■ existing operator capacity constraints;
■ modulation comparisons;
■ cell sites as a driver of capacity;
■ W-CDMA vs GSM capacity analysis;
■ frequency allocations by operator;
■ the potential capacity uplift from W-CDMA and additional spectrum; and
■ the scope for EDGE as an interim solution.
3G provides the capacity todrive fixed-linedisplacement

S E C T O R D Y N A M I C S
M O B I L E N E T W O R K S - W . E U R O P E 1 6 O C T O B E R 2 0 0 2 60
Existing operator capacity constraints
A method of assessing the capacity of existing operators is to look at the number of
cell sites per subscriber vs covered pops per cell site.
■ Covered POPS per base station. This calculation provides a rough proxy to
compare the amount of capacity each operator has built into its footprint.
Operators with high covered POPs per base station can spend additional capex
on base stations to increase capacity, while operators with low covered POPs per
base station are closer to reaching maximum capacity.
■ Subscribers per base station. This calculation provides a rough proxy to the
current capacity each operator has available to service its existing subscriber
base.
Whilst our matrix does not gives us absolute capacity, in our view it provides a
good feel for relative capacity constraints across Europe (see chart below).
Figure 6 : Capacity matrix (1H02 2002)
Vodafone (Germany)
T-Mobile (Germany)
E-Plus
mmo2 (Germany)
TEM Esp
TIM Spa
mmo2 (UK)
T-Mobile (UK)
Orange (UK)
Vodafone (UK)
Bouygues
Orange (France)
-
200
400
600
800
1,000
1,200
1,400
1,600
1,800
2,000
2,500 3,500 4,500 5,500 6,500 7,500 8,500 9,500
1H02 CPOP/Cell
1H
02 S
ub/C
ell
Quadrant Two:High capacity built into footprintLow capacity per subscriber
Quadrant Three:Low capacity built into footprintLow capacity per subscriber
Quadrant One:High capacity built into footprintHigh capacity per subscriber
Quadrant Four:Low capacity built into footprintHigh capacity per subscriber
Source: ABN AMRO
The graph can be interpreted by looking at the four quadrants.
■ Quadrant One. Operators in this quadrant have the most flexibility with regard
to medium-term capex spend because they have the greatest available capacity
per subscriber. They offer the best network access because they have already
built a lot of capacity into their footprint and have low market share. As these
operators obtain greater subscribers and market share, they will move towards
Quadrant Two, and therefore report significantly higher-than-average returns onnew invested capital.
■ Quadrant Two. Operators in this quadrant are normally in highly penetrated
markets and are relatively capacity-constrained, requiring additional spectrum
or improved technology. They have already built a lot of capacity into their
footprint (fewer covered POPs per cell site) but because of their high market
share have less available capacity for each subscriber (greater number of
subscribers per cell site). Subscribers will experience network congestion during
peak periods. TIM Spa fits into this category.
We have presented a simplerelative capacity matrix foreach major Europeanoperator
Quadrant One. Excesscapacity enables operatorsto generate high returns asthey add new subscribers
Quadrant Two. Operatorsare generating high returnsbut are relatively capacity-constrained

S E C T O R D Y N A M I C S
M O B I L E N E T W O R K S - W . E U R O P E 1 6 O C T O B E R 2 0 0 2 61
■ Quadrant Three. Operators in this quadrant have not yet built a lot of capacity
into their footprint and have low capacity per each subscriber. Subscribers will
experience network congestion during peak periods; however, by spending
additional capex on new cell sites, these operators can improve their network
capacity. This quadrant is an indicator of high future capex. Most of Europe’smajor operators fit in this quadrant.
■ Quadrant Four. Operators in this quadrant have not yet built a lot of capacity
into their footprint, but have high capacity for each subscriber. If these
operators are not experiencing rapid growth, they can delay capex. Mmo2
Germany fits in this category.
These quadrants show that Hutchison3G could be relatively well placed compared
with its European peers, admittedly recognising its lower intended population
coverage (around 80%). When it is established, H3G’s network/footprint should be
able to handle many more subscribers without needing substantial additional capex.
It is also important to note that it is not all rosy for the remaining European
operators with regard to capex spend and, in particular, capacity when compared
with the H3G’s potential. We can clearly observe the relative capacity
constraints of Europe’s most established operators, such as TIM Spa,
Vodafone Germany, Vodafone UK and Orange UK. In our view this is majorincentive for these operators to accelerate the deployment of 3G.
Enabling volume growth
To have confidence in our fixed to mobile substitution thesis, investors must believe
in the prospect of an imminent material increase in available voice capacity. Thecapacity of a cellular system is dependent upon several factors, including:
■ the signal (analog or digital);
■ the coding and modulation method used in air interface;
■ the total number of cells in the network system; and
■ the amount of frequency,
(1) The signal – analog - AMPS (1G) to digital
Signals are either digital or analog. Analog signal transmission is a form of
electronic transmission accomplished by adding signals of varying frequency or
amplitude to carrier waves of a given frequency of alternating electromagnetic
current. This compares with a digital signal, which consists of a discrete set of data
points that can take on only fixed values of one or zero. The ones and zeroes arecalled bits, which comes from the phrase binary digits.
In all segments of communication, a migration to digital from analog has been
occurring for several reasons: (1) Increased capacity on digital networks is possible
because data compression allows multiple digital channels and more economic
benefits; (2) signal quality is better and is nearly independent of distance and
network topology; (3) there is better resistance to interference; and (4) frequency
is more easily shared with other signals and is more flexible. Depending on the
digital technology (the coding and modulation), digital cellular has three to
15 times greater capacity than analog service. Both GSM and W-CDMA are
digital.
Quadrant Three. Operatorsface imminent future capexspend to meet existingsubscribers’ needs
Quadrant Four. Operatorscan delay capex ifexperiencing slowsubscriber growth
We can clearly observeemerging capacityconstraints for Europe’smajor operators
We have considered fourpotential drivers ofincreased capacity

S E C T O R D Y N A M I C S
M O B I L E N E T W O R K S - W . E U R O P E 1 6 O C T O B E R 2 0 0 2 62
(2) Coding and modulation
Three major cellular digital technologies are currently in use: TDMA, CDMA and
GSM. A fourth technology used to a lesser extent is iDEN. Each has own their own
advantages and disadvantages. For a more detailed “bottom-up” discussion of each
of these technology platforms, we refer investors to the detailed descriptions within
VoiceStream – The American Dream.
Table 40 : Comparison of the various mobile systems
System Advantages Disadvantages
TDMA Capacity advantage of 3X over analog Average sound quality, more digitised, than normal human
voice
More operators on GSM and CDMA
Does not have the capacity of GSM or CDMA
CDMA Has a nationwide footprint in the US
Has the most significant capacity gains over analog systems, of
approximately at least 6x. Therefore, cost per minute of service
and capital expenditures could fall to low levels
Newest digital technology. Less experience about what could
happen with regard to the potential technology glitches or in
overcapacity situations.
Initial costs to build CDMA are significantly higher, expensive
handsets
Fewer equipment manufacturers for CDMA than for GSM.
Hence, less economies of scale and therefore higher
Not widely used in Asia or Europe
GSM Most widely used in the world
Proven technology
Cheaper handsets, cheaper equipment
Has capacity gains of 3-5x over analog systems
Footprint still not comparable with CDMA or TDMA in the US
Present system not entirely suited for wireless data
IDEN Only technology that can currently support 3-1 function of
dispatch, cellular and paging
Packet-switched based network should work well with wireless
data
Limited use and support from equipment providers, handsets
Less spectrum that other players
Source: Company reports and ABN AMRO
Because radio spectrum is a limited resource shared by all users, a method must be
devised to divide up the bandwidth among as many users as possible. The method
used by GSM is a combination of TDMA and frequency division multiple access
(FDMA). The FDMA part involves the division by frequency of the (maximum) 25
MHz bandwidth into 124 carrier frequencies spaced 200 kHz apart. One or more
carrier frequencies are assigned to each base station.
The introduction of 3G should lead to a structural shift in spectral efficiency (see
following discussion, “The total number of cells”), enables scalability and provides
additional spectrum (see frequency allocation discussion above). 3G provides the
additional capacity to deploy bucket pricing plans and drive mass fixed-to-mobile
substitution.
(3) The total number of cells
Network systems are generally designed with a sufficient number of cells, and radio
frequencies assigned to each cell, to serve the estimated number of subscribers
and network traffic in each service area. As the capacity requirements in each cell
increase, additional radio frequencies may be used to cover the same area.
Three major cellulartechnologies co-exist
The introduction of 3Gshould lead to a structuralshift in capacity
S E C T O R D Y N A M I C S
M O B I L E N E T W O R K S - W . E U R O P E 1 6 O C T O B E R 2 0 0 2 63
Coverage and capacity trade-off
There is clear trade-off between coverage, capacity and quality of service in the 3G
wireless business model. 3G operates at a higher frequency than GSM and as a
result requires a greater density of cell sites. GSM 900 normally has a maximum
cell radius if about 35km due to its frame structure. GSM 1800 has at least 8-10dB
weaker link budget, resulting in a typical cell radius of about 3-5km.
The authors of this study do not profess to have a doctrate in physics. We
acknowledge the work of Claes Beckman from the the Royal Institute of Technology
in Stockholm that has given us the scope to calculate the capacity benefit of W-CDMA over GSM based on different coverage scenarios.
GSM capacity (static channel allocation)
If we look at a very simple GSM network with static channel allocation and 5Mhz of
spectrum, we find that:
■ 5MHz divided over 200KHz per radio channel gives us 25 carriers;
■ 12 of those are control channels;
■ the other 13 traffic channels can be allocated in a 1/3 re-use; and
■ in total we get five carriers per sector,
We can then derive total capacity:
■ maximum 5 carriers per sector; and
■ 5*8-1 = 39 voice channels, with 2% blocking equates to 28 Erlangs/sector
W-CDMA capacity
We understand that the soft capacity of W-CDMA gives flexibility between
coverage, capacity and quality. As a cell sites coverage area increases, capacity
drops dramatically. We can calculate the capacity of a simple W-CDMA network
with 5MHz of spectrum assuming a cell site radius of 3.5km and one transciever,
which implies 42 voice channels per sector, with 2% blocking giving 33
Erlangs/sector.
W-CDMA vs GSM 1800
Therefore, in a network with a cell site radius of 3-5km, 5 MHz of spectrum and one
transceiver, we get only a marginal improvement in capacity of about 20% from
employing W-CDMA from GSM. This immediately raises the question, Why bother
with W-CDMA? The key is that in smaller cells, W-CDMA capacity increases
substantially. For example, in a cell site of about 2.6km, W-CDMA could provide up
to 86 voice channels per sector and about 75 Erlang (ie an improvement of nearly
170%). And this is based on one transceiver, which is scalable. It has been pointed
out to us that GSM could deliver similar capacity using modern techniques such as
AMR, frequency hopping and 1/1 re-use, but would require 11 radios per sector.
Hence W-CDMA can offer material capacity improvements. The secret is the
wideband 5MHz radio channel. We flag that should European operators deploy more
than one transceiver per cell site, available capacity could explode (ie an operator
could double a cell’s existing capacity from about US$50,000 of incremental capex
on an additional transceiver).
There is a clear trade-offbetween coverage, capacityand QoS in the W-CMDAmodel
We have calculated thecapacity benefit offered byW-CDMA over 2G
In a large cell site (3-5km)W-CDMA offers a 20%improvement to capacity
In a smaller cell site W-CDMA offers a 127%improvement in capacity

S E C T O R D Y N A M I C S
M O B I L E N E T W O R K S - W . E U R O P E 1 6 O C T O B E R 2 0 0 2 64
(4) The amount of frequency
Before Europe began the process of 3G licensing, total 2G spectrum available in
Europe was similar to the 170MHz allocated in the US. However, most European
countries have now allocated on average an additional 130MHz of spectrum for 3Guse, bringing the total amount of spectrum available to an average of 220-330MHz.
Chart 24 : Allocated unpaired spectrum per country - pre and post 3G auctions
0
50
100
150
200
250
300
350
United States France Spain Germany Italy United Kingdom
Spect
rum
(M
hz)
2G Spectrum 3G Spectrum
Source: ABN AMRO
Existing frequency
A simplistic approach to assessing an operator’s capacity is to look at Mhz per
subscriber. This approach clearly favours operators with a smaller subscriber base
(eg VoiceStream in the US, T-Mobile in the UK). It is our view that the smaller
operators have greater ability to service their existing subscriber base and
therefore dictate pricing. It also shows the magnitude of 3G spectrum waiting on-
line in Europe (total MHz per subscriber shows 2G and 3G specturm, vs. 2G only
MHz per subscriber). We can contrast Europe’s relative capacity depth toconstraints in the US.
Chart 25 : France MHz per subscriber Chart 26 : Germany MHz per subscriber
0.00
1.00
2.00
3.00
4.00
5.00
6.00
7.00
8.00
Itineris SFR Bouyges
MHz per subscriber 2G MHz per subscriber
0.00
1.00
2.00
3.00
4.00
5.00
6.00
7.00
8.00
9.00
DeT
e M
obil
Man
nes
man
n
E-P
lus
E2
MHz per subscriber 2G MHz per subscriber
Source: ABN AMRO estimates Source: ABN AMRO estimates
Spectrum and capacityissues for larger USoperators in each market
In our view, smalleroperators have a greaterability to dictate pricing
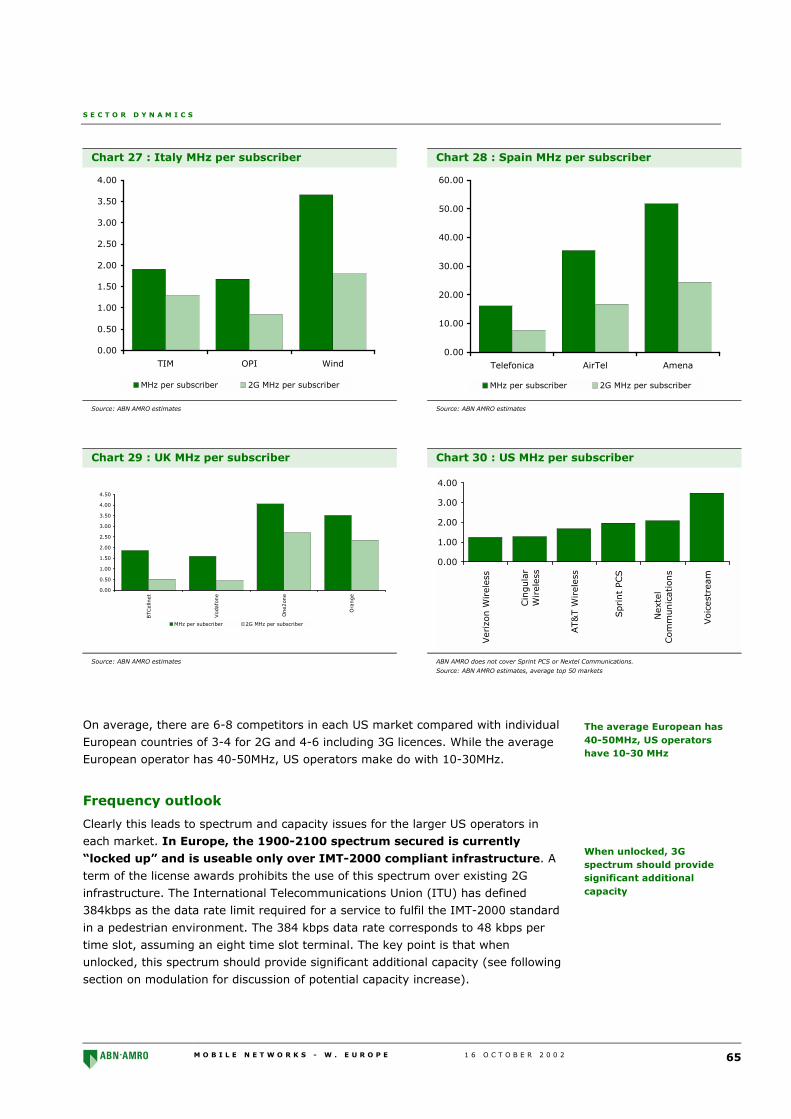
S E C T O R D Y N A M I C S
M O B I L E N E T W O R K S - W . E U R O P E 1 6 O C T O B E R 2 0 0 2 65
Chart 27 : Italy MHz per subscriber Chart 28 : Spain MHz per subscriber
0.00
0.50
1.00
1.50
2.00
2.50
3.00
3.50
4.00
TIM OPI Wind
MHz per subscriber 2G MHz per subscriber
0.00
10.00
20.00
30.00
40.00
50.00
60.00
Telefonica AirTel Amena
MHz per subscriber 2G MHz per subscriber
Source: ABN AMRO estimates Source: ABN AMRO estimates
Chart 29 : UK MHz per subscriber Chart 30 : US MHz per subscriber
0.00
0.50
1.00
1.50
2.00
2.50
3.00
3.50
4.00
4.50
BTCel
lnet
Vod
afon
e
One2
one
Ora
nge
MHz per subscriber 2G MHz per subscriber
0.00
1.00
2.00
3.00
4.00Verizo
n W
irele
ss
Cin
gula
rW
irele
ss
AT&
T W
irele
ss
Sprint
PCS
Next
el
Com
munic
ations
Voic
est
ream
Source: ABN AMRO estimates ABN AMRO does not cover Sprint PCS or Nextel Communications.
Source: ABN AMRO estimates, average top 50 markets
On average, there are 6-8 competitors in each US market compared with individual
European countries of 3-4 for 2G and 4-6 including 3G licences. While the average
European operator has 40-50MHz, US operators make do with 10-30MHz.
Frequency outlook
Clearly this leads to spectrum and capacity issues for the larger US operators in
each market. In Europe, the 1900-2100 spectrum secured is currently
“locked up” and is useable only over IMT-2000 compliant infrastructure. A
term of the license awards prohibits the use of this spectrum over existing 2G
infrastructure. The International Telecommunications Union (ITU) has defined
384kbps as the data rate limit required for a service to fulfil the IMT-2000 standard
in a pedestrian environment. The 384 kbps data rate corresponds to 48 kbps per
time slot, assuming an eight time slot terminal. The key point is that when
unlocked, this spectrum should provide significant additional capacity (see following
section on modulation for discussion of potential capacity increase).
The average European has40-50MHz, US operatorshave 10-30 MHz
When unlocked, 3Gspectrum should providesignificant additionalcapacity

S E C T O R D Y N A M I C S
M O B I L E N E T W O R K S - W . E U R O P E 1 6 O C T O B E R 2 0 0 2 66
3G – 1.7x-2.8x increase in capacity
Having identified two key drivers of additional capacity (spectral efficiency and
additional spectrum) we can put them together to get a feel for the potential
increase in capacity from the introduction of W-CDMA across Europe. For example,
even in the event of W-CDMA (3G) only operating 20% ahead of existing GSM
infrastructure and one transceiver we calculate a capacity increase of between 1.7x
(France) and 2.8x (Italy) to existing capacity (see following tables).
Table 41 : France: potential capacity increase
2Gspectrum
Totalpaired
spectrum
Capacityincrease
(1:1)
Newspectrum
(1.2:1)
Capacityincrease
(1.2:1)
Orange 24 39 1.6 42.0 1.8
SFR 24 39 1.6 42.0 1.8
Bouyges 26 41 1.6 44.4 1.7
Sub-total 74.4 119.4 1.6 128.4 1.7
Source: ABN AMRO
Table 42 : Germany: potential capacity increase
2Gspectrum
Totalpaired
spectrum
Capacityincrease
(1:1)
Newspectrum
(1.2:1)
Capacityincrease
(1.2:1)
T-Mobil 17.4 27.4 1.6 29.4 1.7
Vodafone D2 17.6 27.6 1.6 29.6 1.7
E-Plus 22.4 32.4 1.4 34.4 1.5
mmo2 (Viag) 22.4 32.4 1.4 34.4 1.5
Mobilcom 0.0 10.0 na 12.0 na
Quam 0.0 10.0 na 12.0 na
Sub-total 79.8 139.8 1.8 151.8 1.9
Source: ABN AMRO
Table 43 : Italy: potential capacity increase
2Gspectrum
Totalpaired
spectrum
Capacityincrease
(1:1)
Newspectrum
(1.2:1)
Capacityincrease
(1.2:1)
TIM 31.2 46.2 1.5 49.2 1.6
Vodafone-Omnitel 15.2 30.2 2.0 33.2 2.2
Wind 14.6 29.6 2.0 32.6 2.2
Andala 0.0 20.0 na 24.0 na
IPSE 0.0 20.0 na 24.0 na
Sub-total 61.0 146.0 2.4 163.0 2.7
Source: ABN AMRO
We have considered thepotential capacity increaseusing a 20% improvementin spectral efficiency
Capacity is increased by uybetween 1.7x-2.8x

S E C T O R D Y N A M I C S
M O B I L E N E T W O R K S - W . E U R O P E 1 6 O C T O B E R 2 0 0 2 67
Table 44 : Spain: potential capacity increase
2Gspectrum
Totalpaired
spectrum
Capacityincrease
(1:1)
Newspectrum
(1.2:1)
Capacityincrease
(1.2:1)
Telefonica Moviles (Esp) 13.4 28.4 2.1 31.4 2.3
Vodafone Airtel 13.4 28.4 2.1 31.4 2.3
Amena 13.4 28.4 2.1 31.4 2.3
xfera 0.0 15.0 na 18.0 na
Sub-total 40.2 100.2 2.5 112.2 2.8
Source: ABN AMRO
Table 45 : UK: potential capacity increase
2Gspectrum
Totalpaired
spectrum
Capacityincrease
(1:1)
Newspectrum
(1.2:1)
Capacityincrease
(1.2:1)
mmo2 (Cellnet) 5.8 15.8 2.7 17.8 3.1
Vodafone 5.8 20.8 3.6 23.8 4.1
T-Mobil 30.0 40.0 1.3 42.0 1.4
Orange 30.0 40.0 1.3 42.0 1.4
3 (Hutchison 3G) 0.0 15.0 na 18.0 na
Sub-total 71.5 131.5 1.8 143.5 2.0
Source: ABN AMRO
Of course, this dramatically understates the spectral efficiency of W-CDMA relative
to GSM, in the event of more dense cell site coverage in major urban areas. For
example, using the top end of expectations (75 Erlang), W-CDMA offers nearly
170% more capacity than existing 2G infrastructure (in other words, a ratio of
2.7:1.0) using only one transceiver.
Using a 2.7x we estimate that capacity is increased by between 2.6x and 5.0x.
Even at this conservative level this is a material increase in capacity. Looking
forward, as operators add further transceivers to each cell site, an explosion in
capacity could occur at a very low incremental capital expenditure (i. real estate
costs, and civil engineering costs have already been met). We also note that
eventually existing spectrum allocated to 2G will be re-farmed for use with W-
CDMA technology. This would drive a minimal 20% increase in the 2G spectrum to
which in the analysis above we apply a 1x multiple. Hence our capacity increase
estimates appear very conservative.
Capacity increase varies market by market
We also note the sharp difference observable between countries. Italy clearly
stands out as the market with the greatest increase in available capacity. This has
implications for the timing of the introduction of bucket pricing plans and the speed
of fixed to mobile substitution. At the other end of the spectrum, France will see a
less significant increase in supply, suggesting a slower emergence of fixed-to-
mobile substitution.
Capacity is increasedbetween 2.6x and 5.0xusing more aggressiveestimate of spectralefficiency
Italy stands out as having aparticularly stark increasein capacity
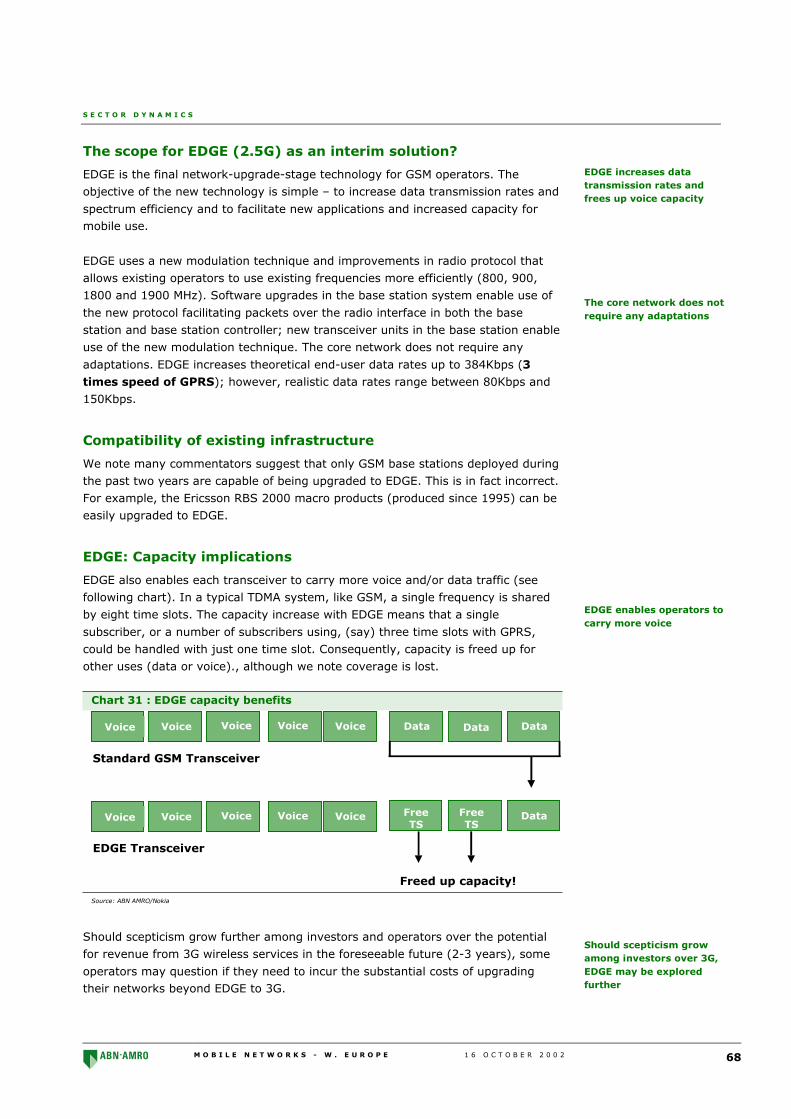
S E C T O R D Y N A M I C S
M O B I L E N E T W O R K S - W . E U R O P E 1 6 O C T O B E R 2 0 0 2 68
The scope for EDGE (2.5G) as an interim solution?
EDGE is the final network-upgrade-stage technology for GSM operators. The
objective of the new technology is simple – to increase data transmission rates and
spectrum efficiency and to facilitate new applications and increased capacity formobile use.
EDGE uses a new modulation technique and improvements in radio protocol that
allows existing operators to use existing frequencies more efficiently (800, 900,
1800 and 1900 MHz). Software upgrades in the base station system enable use of
the new protocol facilitating packets over the radio interface in both the base
station and base station controller; new transceiver units in the base station enable
use of the new modulation technique. The core network does not require any
adaptations. EDGE increases theoretical end-user data rates up to 384Kbps (3
times speed of GPRS); however, realistic data rates range between 80Kbps and
150Kbps.
Compatibility of existing infrastructure
We note many commentators suggest that only GSM base stations deployed during
the past two years are capable of being upgraded to EDGE. This is in fact incorrect.
For example, the Ericsson RBS 2000 macro products (produced since 1995) can be
easily upgraded to EDGE.
EDGE: Capacity implications
EDGE also enables each transceiver to carry more voice and/or data traffic (see
following chart). In a typical TDMA system, like GSM, a single frequency is shared
by eight time slots. The capacity increase with EDGE means that a single
subscriber, or a number of subscribers using, (say) three time slots with GPRS,
could be handled with just one time slot. Consequently, capacity is freed up for
other uses (data or voice)., although we note coverage is lost.
Chart 31 : EDGE capacity benefits
Voice Voice
Voice
Voice Voice Voice Data Data Data
Voice Voice
Voice
Voice Voice Voice FreeTS
Data
Standard GSM Transceiver
EDGE Transceiver
Freed up capacity!
FreeTS
Source: ABN AMRO/Nokia
Should scepticism grow further among investors and operators over the potential
for revenue from 3G wireless services in the foreseeable future (2-3 years), some
operators may question if they need to incur the substantial costs of upgradingtheir networks beyond EDGE to 3G.
EDGE increases datatransmission rates andfrees up voice capacity
The core network does notrequire any adaptations
EDGE enables operators tocarry more voice
Should scepticism growamong investors over 3G,EDGE may be exploredfurther
S E C T O R D Y N A M I C S
M O B I L E N E T W O R K S - W . E U R O P E 1 6 O C T O B E R 2 0 0 2 69
US perspective
Operators see little need for higher data rates within the current suite of products
being developed. Supporting this view for US GSM operators (AWE, Cingular and
VoiceStream) is that fact that timing of availability of sufficient additional spectrum
is very unclear. Cingular, the second-largest US wireless operator, has announced
that it had no plans after EDGE to roll out W-CDMA.
European options
European operators that have no such spectrum issues following the recent 3G
auctions have long been expected to bypass EDGE in their rush to deploy third-
generation WCDMA. However, there stands a greater chance now that European
operators also concerned with returns on additional capex may decide to delay
investing in 3G infrastructure. Obviously, this would require changes in
laws/regulations regarding scheduled build-out licence requirements and use of
new 3G spectrum. However, it is important that investors are aware of this issueand its implications for free cash flow.
What about the regulators?
A fly in the ointment is the specified technology that each operator has nominated
for deploying additional spectrum. For example, in the UK, each of the existing
operators specified UMTS as the technology platform they intended to deploy to
fulfil the IMT 2000 standard. To unlock the spectrum granted, each of the UK
operators would have to approach OFCOM (the UK telco regulator) to request a
change in their license conditions (ie to enable the use of the 3G spectrum, withEDGE). Our conversations with the UK operators suggest that this is a possibility.
What about handsets?
To date, no EDGE handsets are available. This represents a major impediment to
EDGE deployment. In theory, the development of an EDGE handset should be
easier than dual mode (3G and 2G) handset technology. Starhub, the No. 2
Singapore operator, had indicated it is working with Nokia to develop an EDGE
handset for deployment in its market. We anticipate similar operator pressure fromthe US.
Should more operators consider EDGE as a capacity-enhancing solution, the vendor
community would come under greater pressure to deliver an appropriate handset.
This would be similar to the process behind the development of the GAIT handset
(TDMA/GSM) in the US, when the vendor community was cajoled into developing
the terminal by AT&T Wireless and Cingular. While the widespread deployment of
EDGE throughout Europe remains a wildcard, it is important to be aware of its
implications.
Arguably US operatorsprovide a sanity check
Regulatory changes wouldbe required and ...
... new handsets wouldneed to developed

S E C T O R D Y N A M I C S
M O B I L E N E T W O R K S - W . E U R O P E 1 6 O C T O B E R 2 0 0 2 70
This page has been left intentionally blank

M O B I L E N E T W O R K S - W . E U R O P E 1 6 O C T O B E R 2 0 0 2 71
N E W S H I G H L I G H T
Fixed-line tariff rebalancing
Fixed-line tariff rebalancing is a significant topic that merits more space than we
have in this note (hence our intention to revisit it at a later date). However, we
must recognise that fixed line tariff rebalancing provides a potential third driver of
material fixed-to-mobile call substitution. Should fixed line players be forced to
rebalance their tariffs (ie increase the price of access and drop the price of calls),
we suspect the wireless handset could become the primary telephony access point
for many customers. Political pressure on regulators to maintain universal access
provides a barrier to rebalancing. Notwithstanding this issue, we suspect operators
could overcome the obstacle via the provision of a bundled wireless alternative.
Background
Long distance fixed-line voice calls in Europe typically do not reflect underlying
network cost structure (for example, a fixed-line long distance call may cost
approximately €0.04, compared with as little as €0.02 for local traffic, without any
underlying cost difference). The difference in cost is an incumbent telephony
legacy, in which distance was a key driver of cost. The importance of distance as a
driver of cost has diminished (reflecting lower backhaul cost, driven by technology
innovation and the removal of physical operators connecting calls).
Arguably Europe’s wireline operator community are overcharging customers for
long distance and international call charges, and subsidising the provision of local
access, fulfilling political pressure for universal access. We suspect there is an
opportunity for Europe’s wireless operators to lobby country regulators to force
incumbent operators to rebalance their tariffs to reflect underlying network cost
structure.
Wireless opportunity
In our central case analysis of the fixed-to-mobile call market, we conservatively
assumed the migration of only about 30% of all local call volume from the wireline
to the wireless network. We further assumed that no fixed-line access fees would
be displaced to wireless. We suspect that in the event of tariff rebalancing, thiscould be overly conservative.
In our view, a core opportunity for Europe’s cellular operators pursuing fixed-to-
mobile substitution is provided by the local access/local call volume portion of voice
fixed-line calls and fixed to mobile calls. As we noted earlier in this research study,
as fixed-line voice call volume falls the implied price of each incremental unit of use
increases, thus encouraging savvy customers to re-assess their need for a wireline
connection to the home/office.
Fixed-line telephony pricesdo not reflect underlyingnetwork cost structures
Arguably wireline operatorsare overcharging for longdistance and internationalcalls, and subsidising localaccess
In the event of fixed-linetariff rebalancing, our localaccess substitution scenario(30%) could proveconservative

N E W S H I G H L I G H T
M O B I L E N E T W O R K S - W . E U R O P E 1 6 O C T O B E R 2 0 0 2 72
Easing of regulatory stance
Across Europe, the prices for cellular are dropping more quickly than fixed call
prices. Going forward we expect this to continue, with increasing prospect that the
fixed call prices may be increased. It is noteworthy that cellular prices are even
decreasing in countries like Germany and France, where mobile prices are not
regulated. This implies that cellular markets can be competitive in their own right.
Lobbying opportunity
Looking forward, this environment may help the cellular operators to lobby
regulators to rebalance local call charges to reflect the underlying network cost
structure. It is possible that if tariffs were rebalanced (to reflect underlying cost
structure), local calls could move towards the price of long distance calls.
Dramatically reduced European cellular tariffs, coupled with rebalancing of fixed-line voice tariffs, could be a powerful stimulant of the next phase of cellular growth.
US perspective
We note that in the US in 1993, President Clinton mandated that auctions be held
for frequencies within the PCS airwaves. The primary motive was to open up
competition in the cellular market, drive down the cost of wireless driving
individuals to use their cellular phone for local calls.
We suspect that more proactive lobbying of National Regulatory Authorities (NRAs)
by Europe’s cellular operator community could result in a more favourable
regulatory environment during the medium term. At a recent lecture given by Dave
Edmonds (head of OFTEL) and Gregory Sidack (ex-deputy counsel of the FCC),
both commentators indicated a belief in one wireline network and up to three
wireless networks contesting telephony markets longer term. Recognition of this
dynamic is important if Europe’s wireline operators are to rip a more material chunk
of the local market away from the wireline incumbent.
Reduced cellular tariffs andwireline tariff re-balancingcould be powerfulstimulants of growth
The future: one wirelineand three wirelessnetworks?
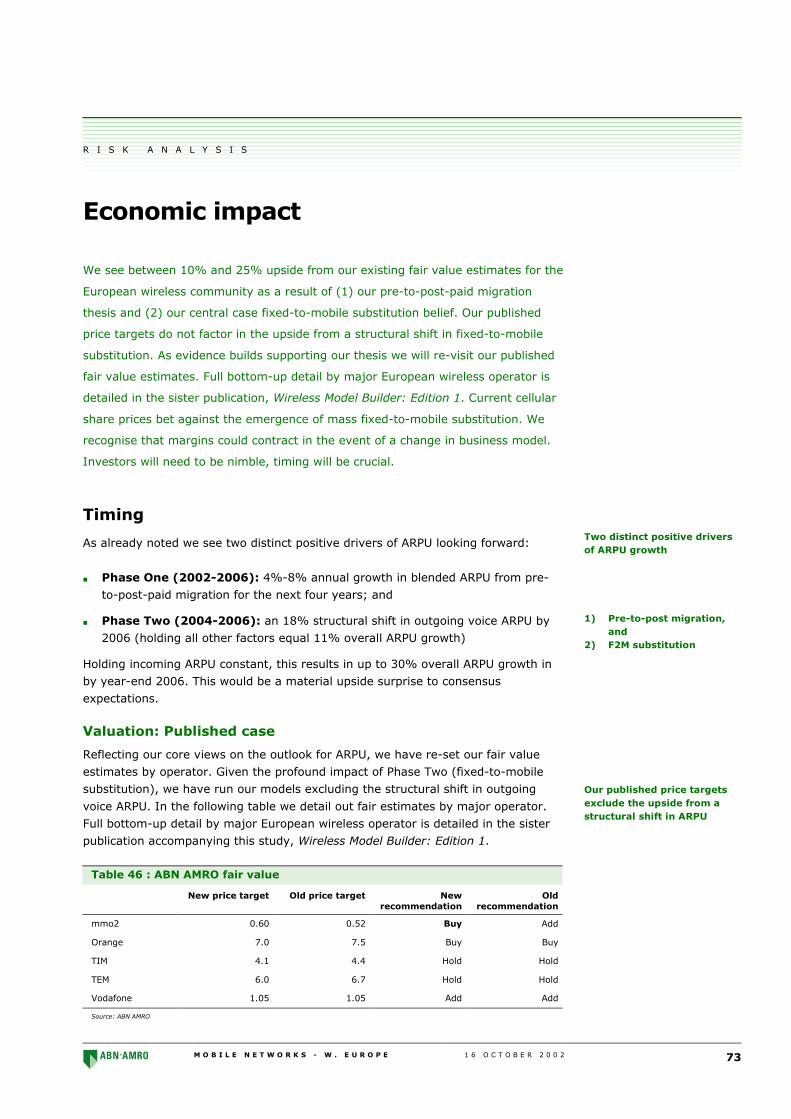
M O B I L E N E T W O R K S - W . E U R O P E 1 6 O C T O B E R 2 0 0 2 73
R I S K A N A L Y S I S
Economic impact
We see between 10% and 25% upside from our existing fair value estimates for the
European wireless community as a result of (1) our pre-to-post-paid migration
thesis and (2) our central case fixed-to-mobile substitution belief. Our published
price targets do not factor in the upside from a structural shift in fixed-to-mobile
substitution. As evidence builds supporting our thesis we will re-visit our published
fair value estimates. Full bottom-up detail by major European wireless operator is
detailed in the sister publication, Wireless Model Builder: Edition 1. Current cellular
share prices bet against the emergence of mass fixed-to-mobile substitution. We
recognise that margins could contract in the event of a change in business model.
Investors will need to be nimble, timing will be crucial.
Timing
As already noted we see two distinct positive drivers of ARPU looking forward:
■ Phase One (2002-2006): 4%-8% annual growth in blended ARPU from pre-
to-post-paid migration for the next four years; and
■ Phase Two (2004-2006): an 18% structural shift in outgoing voice ARPU by
2006 (holding all other factors equal 11% overall ARPU growth)
Holding incoming ARPU constant, this results in up to 30% overall ARPU growth in
by year-end 2006. This would be a material upside surprise to consensus
expectations.
Valuation: Published case
Reflecting our core views on the outlook for ARPU, we have re-set our fair value
estimates by operator. Given the profound impact of Phase Two (fixed-to-mobile
substitution), we have run our models excluding the structural shift in outgoing
voice ARPU. In the following table we detail out fair estimates by major operator.
Full bottom-up detail by major European wireless operator is detailed in the sister
publication accompanying this study, Wireless Model Builder: Edition 1.
Table 46 : ABN AMRO fair value
New price target Old price target Newrecommendation
Oldrecommendation
mmo2 0.60 0.52 Buy Add
Orange 7.0 7.5 Buy Buy
TIM 4.1 4.4 Hold Hold
TEM 6.0 6.7 Hold Hold
Vodafone 1.05 1.05 Add Add
Source: ABN AMRO
Two distinct positive driversof ARPU growth
1) Pre-to-post migration,and
2) F2M substitution
Our published price targetsexclude the upside from astructural shift in ARPU
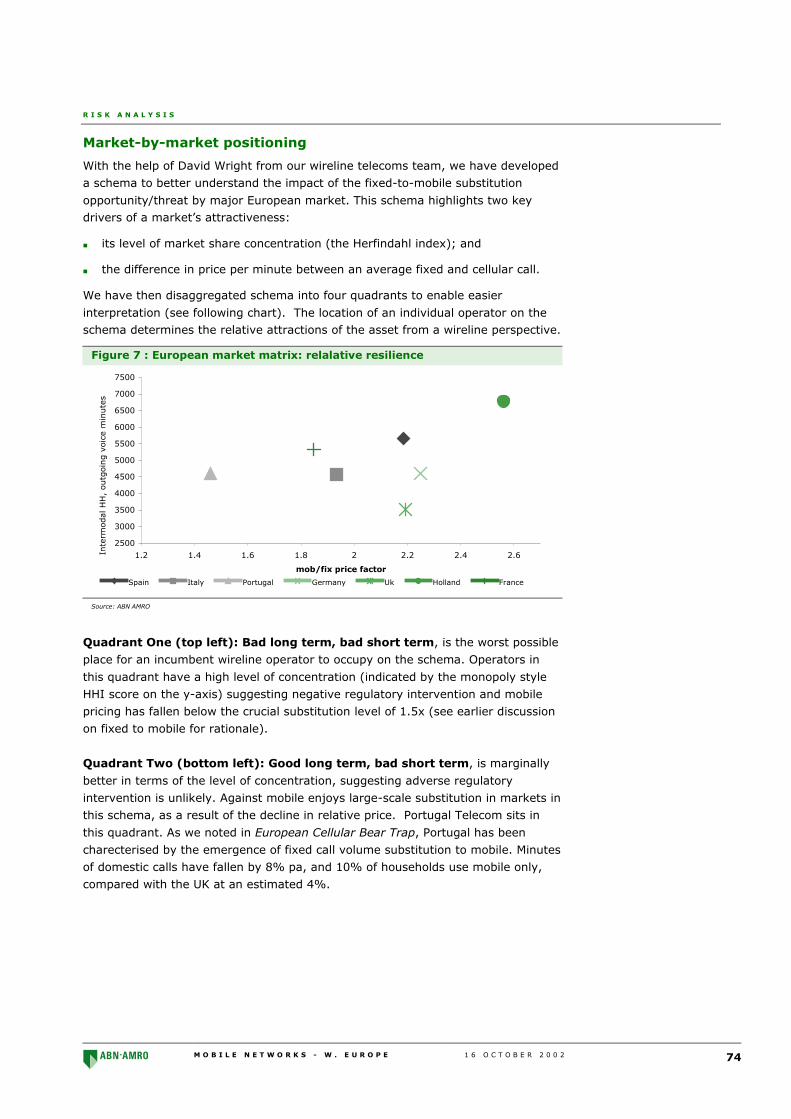
R I S K A N A L Y S I S
M O B I L E N E T W O R K S - W . E U R O P E 1 6 O C T O B E R 2 0 0 2 74
Market-by-market positioning
With the help of David Wright from our wireline telecoms team, we have developed
a schema to better understand the impact of the fixed-to-mobile substitution
opportunity/threat by major European market. This schema highlights two keydrivers of a market’s attractiveness:
■ its level of market share concentration (the Herfindahl index); and
■ the difference in price per minute between an average fixed and cellular call.
We have then disaggregated schema into four quadrants to enable easier
interpretation (see following chart). The location of an individual operator on theschema determines the relative attractions of the asset from a wireline perspective.
Figure 7 : European market matrix: relalative resilience
2500
3000
3500
4000
4500
5000
5500
6000
6500
7000
7500
1.2 1.4 1.6 1.8 2 2.2 2.4 2.6
mob/fix price factor
Spain Italy Portugal Germany Uk Holland France
Inte
rmod
al H
H,
outg
oing v
oice
min
ute
s
Source: ABN AMRO
Quadrant One (top left): Bad long term, bad short term, is the worst possible
place for an incumbent wireline operator to occupy on the schema. Operators in
this quadrant have a high level of concentration (indicated by the monopoly style
HHI score on the y-axis) suggesting negative regulatory intervention and mobile
pricing has fallen below the crucial substitution level of 1.5x (see earlier discussion
on fixed to mobile for rationale).
Quadrant Two (bottom left): Good long term, bad short term, is marginally
better in terms of the level of concentration, suggesting adverse regulatory
intervention is unlikely. Against mobile enjoys large-scale substitution in markets in
this schema, as a result of the decline in relative price. Portugal Telecom sits in
this quadrant. As we noted in European Cellular Bear Trap, Portugal has been
charecterised by the emergence of fixed call volume substitution to mobile. Minutes
of domestic calls have fallen by 8% pa, and 10% of households use mobile only,
compared with the UK at an estimated 4%.
R I S K A N A L Y S I S
M O B I L E N E T W O R K S - W . E U R O P E 1 6 O C T O B E R 2 0 0 2 75
Quadrant Three (top right): Bad long term, good short term, is a sweet spot
for existing returns for incumbent wireline operators, as they enjoy high levels of
market concentration (ie low competition) and mobile is still priced at a high
premium to fixed, suggesting little imminent impact from fixed to mobile
substitution. Spain and the Netherlands fit into this category. Longer term, the
prospect of fixed-line tariff rebalancing (increasing competition, lowering the HHI)
and aggressive 3G-driven price cuts suggest that a downward and “left” trajectorywill be established.
Quadrant Four (bottom right): Good long term, good short term, arguably is
the sweet spot for both existing and future returns for incumbent wireline
operators, as they have relatively minimal regulatory risk, and continue to display a
high premium for wireless prices over wireline (delaying the impact of substitution).BT and DT sit within this quadrant.
Fixed to mobile case
While local access fees may be largely retained by wireline telephony operators, we
are expecting a large percentage of fixed-line voice calls to migrate to Europe’s
cellular networks. This view has a profound implication for European ARPU growth
and fundamental valuation. Including our central case outlook for outgoing voice
ARPU (based on our work in the UK market) suggests upside of between 10%
and 25% from our fair value calculations. As more evidence emerges during
the medium term, supporting our thesis, we will be looking to revisit our published
price targets in anticipation of crystalisation of upside.
... but look out for margins
We are bullish regarding the outlook for fixed-to-mobile substitution to provide the
“next leg of growth” for Europe’s wireless operators. Notwithstanding this view,
ahead of the improvement in returns, lower prices will hit profitability, due to
declining gross telephony margins.
In the following table we have presented a framework for identifying the risk to
margins. In the left-hand column we have the potential volume increase from fixed
to mobile substitution; in the top row we detail the expected price decline per
minute. For example, using an initial price per minute decline of 30%, a volume
increase of 10% results in a margin decline of 13%. We can envisage a run-rate of
decline moving diagonally upwards towards the top right of the table. The exact
margin contraction will be determined by the volume increase that follows the price
cuts.
A structural shift in ARPUoffers between 10%-25%upside from our publishedvaluations
We have considered theimpact on margin
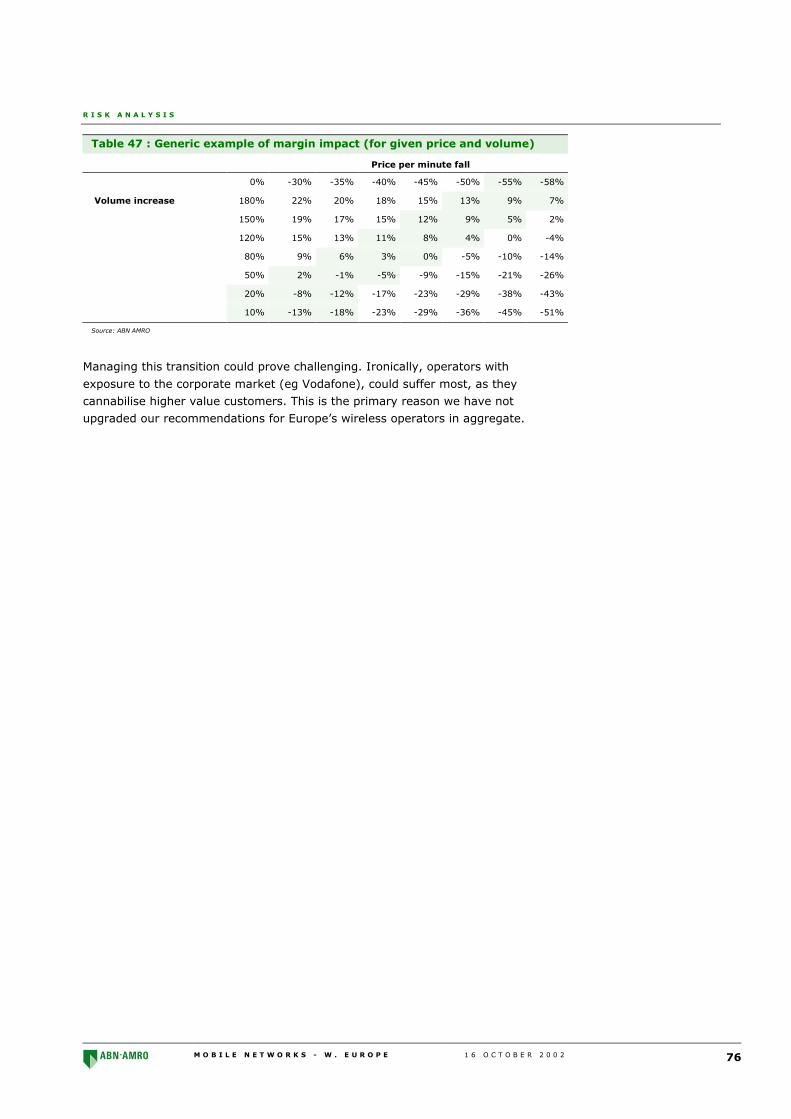
R I S K A N A L Y S I S
M O B I L E N E T W O R K S - W . E U R O P E 1 6 O C T O B E R 2 0 0 2 76
Table 47 : Generic example of margin impact (for given price and volume)
Price per minute fall
0% -30% -35% -40% -45% -50% -55% -58%
Volume increase 180% 22% 20% 18% 15% 13% 9% 7%
150% 19% 17% 15% 12% 9% 5% 2%
120% 15% 13% 11% 8% 4% 0% -4%
80% 9% 6% 3% 0% -5% -10% -14%
50% 2% -1% -5% -9% -15% -21% -26%
20% -8% -12% -17% -23% -29% -38% -43%
10% -13% -18% -23% -29% -36% -45% -51%
Source: ABN AMRO
Managing this transition could prove challenging. Ironically, operators with
exposure to the corporate market (eg Vodafone), could suffer most, as they
cannabilise higher value customers. This is the primary reason we have not
upgraded our recommendations for Europe’s wireless operators in aggregate.

M O B I L E N E T W O R K S - W . E U R O P E 1 6 O C T O B E R 2 0 0 2 77
R I S K A N A L Y S I S
Tab
le 4
8:
Gen
eri
c ad
op
tio
n m
od
el
Year
en
d D
ece
mb
er
Un
its
X+
0X
+1
X+
2X
+3
X+
4X
+5
X+
6X
+7
X+
8X
+9
X+
10
X+
11
Countr
y X P
opula
tion
m65.7
66.3
67.0
67.6
68.3
69.0
69.7
70.4
71.1
71.8
72.5
73.2
Pen
etra
tion r
ate
%75.0
76.0
77.0
78.0
79.0
80.0
81.0
82.0
83.0
84.0
85.0
85.0
All
subsc
riber
s (p
erio
d e
nd)
m49.2
50.4
51.6
52.8
54.0
55.2
56.4
57.7
59.0
60.3
61.6
62.3
Countr
y X N
et A
dds
per
per
iod
m1.1
41.1
61.1
71.1
91.2
11.2
31.2
51.2
71.2
91.3
11.3
30.6
2
Mar
ket
Churn
% p
er m
onth
%2.0
2.0
2.0
2.0
2.0
2.0
2.0
2.0
2.0
2.0
2.0
2.0
Countr
y X C
hurn
per
per
iod
m11.5
11.8
12.1
12.4
12.7
13.0
13.2
13.5
13.9
14.2
14.5
14.8
Countr
y X G
ross
Adds
m12.7
13.0
13.3
13.6
13.9
14.2
14.5
14.8
15.1
15.5
15.8
15.4
Oper
ator
Y S
ubsc
riber
s (p
erio
d e
nd)
m13.0
13.2
13.3
13.5
13.7
14.0
14.3
14.5
14.8
15.1
15.5
15.6
Net
Adds
per
per
iod
m0.0
50.1
10.1
60.2
00.2
30.2
50.2
70.2
80.3
00.3
10.3
20.1
4
Churn
% p
er m
onth
%2.0
2.0
2.0
2.0
2.0
2.0
2.0
2.0
2.0
2.0
2.0
2.0
Churn
per
per
iod
m3.1
3.1
3.2
3.2
3.2
3.3
3.4
3.4
3.5
3.6
3.6
3.7
Gro
ss A
dds
m3.1
73.2
43.3
23.3
93.4
73.5
53.6
23.7
03.7
83.8
73.9
53.8
5
Shar
e of G
ross
Adds
%25.0
%25.0
%25.0
%25.0
%25.0
%25.0
%25.0
%25.0
%25.0
%25.0
%25.0
%25.0
%
Shar
e of
Net
Adds
%4.7
%9.8
%13.6
%16.5
%18.6
%20.2
%21.4
%22.3
%23.0
%23.5
%23.9
%23.2
%
Ove
rall
Mar
ket
Shar
e%
26.5
%26.1
%25.8
%25.6
%25.5
%25.3
%25.2
%25.2
%25.1
%25.1
%25.1
%25.1
%
Contr
act
Subsc
riber
s (p
erio
d e
nd)
m4.1
75.1
15.8
86.5
07.0
27.4
67.8
58.1
98.4
98.7
79.0
49.1
8
Contr
act
Net
Adds
per
per
iod
m0.2
70.9
50.7
60.6
30.5
20.4
40.3
80.3
40.3
10.2
80.2
60.1
4
Contr
act
Churn
% p
er m
onth
%2.0
02.0
02.0
02.0
02.0
02.0
02.0
02.0
02.0
02.0
02.0
02.0
0
Contr
act
Churn
per
per
iod
m0.9
1.0
1.2
1.4
1.6
1.7
1.8
1.9
2.0
2.0
2.1
2.2
Contr
act
Gro
ss A
dds
m1.2
1.9
2.0
2.0
2.1
2.1
2.2
2.2
2.3
2.3
2.4
2.3
Contr
act
Share
of ove
rall
net
adds
%504%
834%
477%
318%
231%
178%
143%
120%
103%
92%
83%
100%
Contr
act
Share
of ove
rall
gro
ss a
dds
%38%
60%
60%
60%
60%
60%
60%
60%
60%
60%
60%
60%
Contr
act
% o
f Tota
l Subs
%32%
39%
44%
48%
51%
53%
55%
56%
57%
58%
58%
59%

M O B I L E N E T W O R K S - W . E U R O P E 1 6 O C T O B E R 2 0 0 2 78
R I S K A N A L Y S I S
Tab
le 4
9:
Gen
eri
c ad
op
tio
n m
od
el (c
on
t’)
Year
en
d D
ece
mb
er
Un
its
X+
0X
+1
X+
2X
+3
X+
4X
+5
X+
6X
+7
X+
8X
+9
X+
10
X+
11
Pre
pai
d S
ubsc
riber
s (p
erio
d e
nd)
m8.8
78.0
47.4
47.0
16.7
26.5
26.4
16.3
56.3
46.3
76.4
26.4
2
Pre
pai
d N
et A
dds
per
per
iod
m-0
.22
-0.8
3-0
.60
-0.4
3-0
.30
-0.1
9-0
.12
-0.0
6-0
.01
0.0
30.0
50.0
0
Pre
pai
d C
hurn
% p
er m
onth
%2.0
2.1
2.1
2.1
2.0
2.0
2.0
2.0
2.0
2.0
2.0
2.0
Pre
pai
d C
hurn
per
per
iod
m2.2
2.1
1.9
1.8
1.7
1.6
1.6
1.5
1.5
1.5
1.5
1.5
Pre
pai
d G
ross
Adds
m1.9
71.3
01.3
31.3
61.3
91.4
21.4
51.4
81.5
11.5
51.5
81.5
4
Pre
pai
d S
har
e of ove
rall
net
adds
%-4
04%
-734%
-377%
-218%
-131%
-78%
-43%
-20%
-3%
8%
17%
0%
Pre
pai
d S
har
e of ove
rall
gro
ss a
dds
%62%
40%
40%
40%
40%
40%
40%
40%
40%
40%
40%
40%
Pre
pai
d %
of Tota
l Subs
%68%
61%
56%
52%
49%
47%
45%
44%
43%
42%
42%
41%
Hig
h V
alue
Contr
act
Subsc
riber
s (p
erio
d e
nd)
m4.1
73.7
53.2
52.7
72.4
22.1
61.9
71.8
31.7
31.6
61.6
21.2
3
Hig
h V
alue
Net
Adds
per
per
iod
m0.2
7-0
.42
-0.5
0-0
.47
-0.3
5-0
.26
-0.1
9-0
.14
-0.1
0-0
.07
-0.0
4-0
.39
Hig
h V
alue
Churn
% p
er m
onth
%2.0
02.0
02.0
02.0
02.0
02.0
02.0
02.0
02.0
02.0
02.0
02.0
0
Hig
h V
alue
Churn
per
per
iod
m0.9
1.0
0.9
0.8
0.7
0.6
0.5
0.5
0.4
0.4
0.4
0.4
Hig
h V
alue
Gro
ss A
dds
m1.2
0.6
0.4
0.3
0.3
0.3
0.3
0.3
0.3
0.3
0.4
0.0
Hig
h V
alue
Shar
e of ove
rall
contr
act
net
adds
%100%
-44%
-66%
-76%
-68%
-59%
-50%
-41%
-32%
-24%
-16%
-273%
Hig
h V
alue
Shar
e of ove
rall
contr
act
gro
ss a
dds
%100%
30%
20%
15%
15%
15%
15%
15%
15%
15%
15%
0%
Hig
h V
alue
% o
f Tota
l Contr
act
Subs
100%
73%
55%
43%
34%
29%
25%
22%
20%
19%
18%
13%
Phas
e 1 C
ontr
act
Subsc
riber
s (p
erio
d e
nd)
m1.3
61.8
31.9
01.9
62.0
22.0
82.1
42.1
92.2
52.3
02.3
3
Phas
e 1 N
et
Adds
per
per
iod
m1.3
60.4
70.0
70.0
60.0
60.0
60.0
60.0
50.0
50.0
50.0
3
Phas
e 1 C
hurn
% p
er m
onth
%2.0
02.0
02.0
02.0
02.0
02.0
02.0
02.0
02.0
02.0
02.0
0
Phas
e 1 C
hurn
per
per
iod
m0.0
0.3
0.4
0.5
0.5
0.5
0.5
0.5
0.5
0.5
0.6
Phas
e 1 G
ross
Adds
m1.4
0.8
0.5
0.5
0.5
0.5
0.6
0.6
0.6
0.6
0.6
Phas
e 1 S
har
e of ove
rall
contr
act
net
adds
%144%
61%
11%
12%
14%
15%
16%
18%
19%
20%
18%
Phas
e 1 S
har
e of ove
rall
contr
act
gro
ss a
dds
%70%
40%
25%
25%
25%
25%
25%
25%
25%
25%
25%
Phas
e 1 %
of Tota
l Contr
act
Subs
%27%
31%
29%
28%
27%
27%
26%
26%
26%
25%
25%

M O B I L E N E T W O R K S - W . E U R O P E 1 6 O C T O B E R 2 0 0 2 79
R I S K A N A L Y S I S
Tab
le 5
0:
Gen
eri
c ad
op
tio
n m
od
el (c
on
t’)
Year
en
d D
ece
mb
er
Un
its
X+
0X
+1
X+
2X
+3
X+
4X
+5
X+
6X
+7
X+
8X
+9
X+
10
X+
11
Phas
e 2 C
ontr
act
Subsc
riber
s (p
erio
d e
nd)
m0.8
01.1
11.3
71.5
71.7
41.8
81.9
92.1
02.1
82.2
4
Phas
e 2 N
et
Adds
per
per
iod
m0.8
00.3
20.2
50.2
00.1
70.1
40.1
20.1
00.0
90.0
5
Phas
e 2 C
hurn
% p
er m
onth
%2.0
02.0
02.0
02.0
02.0
02.0
02.0
02.0
02.0
02.0
0
Phas
e 2 C
hurn
per
per
iod
m0.0
0.2
0.3
0.3
0.4
0.4
0.5
0.5
0.5
0.5
Phas
e 2 G
ross
Adds
m0.8
0.5
0.5
0.5
0.5
0.6
0.6
0.6
0.6
0.6
Phas
e 2 S
har
e of ove
rall
contr
act
net
adds
%104%
51%
49%
46%
43%
41%
38%
36%
34%
38%
Phas
e 2 S
har
e of ove
rall
contr
act
gro
ss a
dds
%40%
25%
25%
25%
25%
25%
25%
25%
25%
25%
Phas
e 2 %
of Tota
l Contr
act
Subs
%14%
17%
19%
21%
22%
23%
23%
24%
24%
24%
Phas
e 3 C
ontr
act
Subsc
riber
s (p
erio
d e
nd)
m0.7
11.2
71.7
12.0
62.3
42.5
82.7
72.9
33.3
9
Phas
e 3 N
et
Adds
per
per
iod
m0.7
10.5
60.4
40.3
50.2
80.2
30.1
90.1
60.4
5
Phas
e 3 C
hurn
% p
er m
onth
%2.0
02.0
02.0
02.0
02.0
02.0
02.0
02.0
02.0
0
Phas
e 3 C
hurn
per
per
iod
m0.0
0.2
0.3
0.4
0.5
0.6
0.6
0.7
0.7
Phas
e 3 G
ross
Adds
m0.7
0.7
0.7
0.8
0.8
0.8
0.8
0.8
1.2
Phas
e 3 S
har
e of ove
rall
contr
act
net
adds
%114%
107%
99%
92%
84%
76%
69%
62%
318%
Phas
e 3 S
har
e of ove
rall
contr
act
gro
ss a
dds
%35%
35%
35%
35%
35%
35%
35%
35%
50%
Phas
e 3 %
of Tota
l Contr
act
Subs
%11%
18%
23%
26%
29%
30%
32%
32%
37%
Op
era
tor
Y_
Co
un
try X
Su
bsc
rib
er
Su
mm
ary
Hig
h V
alue
Per
iod E
nd C
ontr
act
Subsc
riber
sm
4.2
3.7
3.2
2.8
2.4
2.2
2.0
1.8
1.7
1.7
1.6
1.2
Phas
e 1 P
erio
d E
nd C
ontr
act
Subsc
riber
sm
-1.4
1.8
1.9
2.0
2.0
2.1
2.1
2.2
2.2
2.3
2.3
Phas
e 2 P
erio
d E
nd C
ontr
act
Subsc
riber
sm
--
0.8
1.1
1.4
1.6
1.7
1.9
2.0
2.1
2.2
2.2
Phas
e 3 P
erio
d E
nd C
ontr
act
Subsc
riber
sm
--
-0.7
1.3
1.7
2.1
2.3
2.6
2.8
2.9
3.4
Tota
l Per
iod E
nd C
ontr
act
Subsc
riber
sm
4.2
5.1
5.9
6.5
7.0
7.5
7.8
8.2
8.5
8.8
9.0
9.2
Tota
l Per
iod E
nd P
repai
d S
ubsc
riber
sm
8.9
8.0
7.4
7.0
6.7
6.5
6.4
6.4
6.3
6.4
6.4
6.4
Tota
l Per
iod E
nd S
ubsc
riber
sm
13.0
13.2
13.3
13.5
13.7
14.0
14.3
14.5
14.8
15.1
15.5
15.6
Hig
h V
alue
Ave
rage
Contr
act
Subsc
riber
sm
4.0
4.0
3.5
3.0
2.6
2.3
2.1
1.9
1.8
1.7
1.6
1.4
Phas
e 1 A
vera
ge
Contr
act
Subsc
riber
sm
-0.7
1.6
1.9
1.9
2.0
2.1
2.1
2.2
2.2
2.3
2.3
Phas
e 2 A
vera
ge
Contr
act
Subsc
riber
sm
--
0.4
1.0
1.2
1.5
1.7
1.8
1.9
2.0
2.1
2.2
Phas
e 3 A
vera
ge
Contr
act
Subsc
riber
sm
--
-0.4
1.0
1.5
1.9
2.2
2.5
2.7
2.9
3.2
Tota
l Ave
rage
Contr
act
Subsc
riber
sm
4.0
4.6
5.5
6.2
6.8
7.2
7.7
8.0
8.3
8.6
8.9
9.1
Ave
rage
Pre
pai
d S
ubsc
riber
sm
9.0
8.5
7.7
7.2
6.9
6.6
6.5
6.4
6.3
6.4
6.4
6.4
Ave
rage
Tota
l Subsc
riber
sm
13.0
13.1
13.2
13.4
13.6
13.9
14.1
14.4
14.7
15.0
15.3
15.5

M O B I L E N E T W O R K S - W . E U R O P E 1 6 O C T O B E R 2 0 0 2 80
R I S K A N A L Y S I S
Tab
le 5
1:
Gen
eri
c ad
op
tio
n m
od
el (c
on
t’)
Year
en
d D
ece
mb
er
Un
its
X+
0X
+1
X+
2X
+3
X+
4X
+5
X+
6X
+7
X+
8X
+9
X+
10
X+
11
KP
I d
ata
& A
ssu
mp
tio
ns
Hig
h V
alue
Contr
act
ARPU
£40.0
41.2
42.4
43.7
45.0
46.4
47.8
49.2
50.7
52.2
53.8
55.4
% c
hange
PoP
%3.0
%3.0
%3.0
%3.0
%3.0
%3.0
%3.0
%3.0
%3.0
%3.0
%3.0
%
Phas
e 1 C
ontr
act
ARPU
£32.0
33.0
33.9
35.0
36.0
37.1
38.2
39.4
40.5
41.8
43.0
% c
hange
PoP
%-2
0.0
%3.0
%3.0
%3.0
%3.0
%3.0
%3.0
%3.0
%3.0
%3.0
%3.0
%
Phas
e 2 C
ontr
act
ARPU
£25.6
26.4
27.2
28.0
28.8
29.7
30.6
31.5
32.4
33.4
% c
hange
PoP
%-2
0.0
%3.0
%3.0
%3.0
%3.0
%3.0
%3.0
%3.0
%3.0
%3.0
%
Phas
e 3 C
ontr
act
ARPU
£20.5
21.1
21.7
22.4
23.1
23.7
24.5
25.2
25.9
% c
hange
PoP
%-2
0.0
%3.0
%3.0
%3.0
%3.0
%3.0
%3.0
%3.0
%3.0
%
Tota
l Ble
nded
Contr
act
ARPU
(Cal
cula
ted)
£40.0
39.8
38.5
36.8
35.4
34.7
34.6
34.7
35.1
35.7
36.4
36.7
% c
hange
PoP
%-0
.4%
-3.5
%-4
.4%
-3.8
%-1
.8%
-0.5
%0.5
%1.2
%1.6
%2.0
%0.7
%
Pre
pai
d A
RPU
£9.0
9.2
9.4
9.6
9.7
9.9
10.1
10.3
10.5
10.8
11.0
11.2
% c
hange
PoP
%2.0
%2.0
%2.0
%2.0
%2.0
%2.0
%2.0
%2.0
%2.0
%2.0
%2.0
%
Ble
nded
ARPU
(su
bsc
riber
rev
enue
only
)£
18.6
20.0
21.4
22.1
22.5
22.9
23.4
23.9
24.5
25.1
25.8
26.1
% c
hange
PoP
%7.7
%7.0
%3.1
%1.6
%1.9
%2.1
%2.3
%2.4
%2.5
%2.6
%1.4
%
Reven
ues:
Tota
l Contr
act
reve
nues
£m
1,9
35
2,2
18
2,5
36
2,7
29
2,8
69
3,0
17
3,1
74
3,3
40
3,5
15
3,6
99
3,8
93
4,0
11
% c
hange
PoP
%14.6
%14.3
%7.6
%5.1
%5.2
%5.2
%5.2
%5.2
%5.2
%5.2
%3.0
%
Pre
pai
d r
even
ues
£m
970
932
870
828
802
789
786
791
803
820
841
862
% c
hange
PoP
%-4
.0%
-6.7
%-4
.8%
-3.1
%-1
.6%
-0.4
%0.6
%1.5
%2.1
%2.6
%2.4
%
Tota
l se
rvic
e re
venues
2,9
05
3,1
50
3,4
05
3,5
57
3,6
71
3,8
07
3,9
61
4,1
31
4,3
18
4,5
19
4,7
34
4,8
73
Sourc
e:
ABN
AM
RO

M O B I L E N E T W O R K S - W . E U R O P E 1 6 O C T O B E R 2 0 0 2 81
A P P E N D I X
European 3G licensing conditions
In this section we have presented regulatory requirements for rollout by major
European market. License duration ranges between 12 and 20 years, with sharply
divergent coverage requirements by country. In Korea, we note that SK Telecom
must launch service by 2003 (with KT Freetel following in 2004 and LG Telecom by
2005). In Singapore, 80% coverage is required by 2004.
Table 52 : European 3G license summary by country
Country Duration (years) Requirements
UK 20 80% pop by 1.12.07
Germany 20 25% of pop by 31.12.03. 50% by 31.12.05
France 20 80% of pop by T1+8 years.
Italy 20 Regional capitals <30 months. Provincial capitals within next 30 months
Netherlands 15 60% of population by 2007
Switzerland 15 50% population coverage by end of 2004
Austria 20 25% by 31.12.03. 50% by 31.12.05
Spain 20 (Originally all cities with a population greater than 250,000 by August 2001 and total investment byfour operators of €16.29bn into 3g networks by 2010)
Government now saying that it is largely free of investment obligations and push back launch date tosometime in 2003
Sweden 15 In licence application. Generally 99.98% population coverage by 31.12.03
Portugal 15 20% of the national population at the end of the first year of the validity period of the license; 40% atthe end of the third year; 60% at end of the fifth year
Finland 20 No coverage obligation
Norway
1290% of the population of Greater Oslo, Bergen, Stavanger/Sandnes, Trondheim,
Fredrikstad/Sarpsborg, Porsgrunn/Skien, Drammen, Kristiansand, Tromsø, Tønsberg/ Åsgårdstrand,Sandefjord, and Bodø within five years
Denmark 15 End-04 30% population coverage, end 08-80%
Belgium 20 Start service, Sep-02. 30% coverage after 3 years
Ireland 20 A license- 53% of the national population (equivalent to the five major cities) by the end of 2005 andwith the fulfilment of the minimum 80% population requirement by the end of 2007
Source: ABN AMRO/Cellular News.com
A P P E N D I X
M O B I L E N E T W O R K S - W . E U R O P E 1 6 O C T O B E R 2 0 0 2 82
Technical glossary
Erlang
An Erlang is a unit of telecommunications traffic measurement. Strictly speaking,
an Erlang represents the continuous use of one voice path. In practice, it is used to
describe the total traffic volume of one hour. For example, if a group of users made
30 calls in one hour, and each call had an average call duration of 5 minutes, then
the number of Erlangs this represents is worked out as follows:
■ minutes of traffic in the hour = number of calls x duration;
■ minutes of traffic in the hour = 30 x 5 = 150;
■ in the hour = 150/60 = 2.5; which gives
■ a traffic figure of 2.5 Erlangs
Trunking
Erlang traffic measurements are made to help telecommunications network
designers understand traffic patterns within their voice networks. This is essential if
they are to establish the necessary trunk group sizes. The more efficient the
existing lines are used, the higher the trunking efficiency is of the network.
Erlang B
Several traffic models exist that share their name with the Erlang unit of traffic.
They are formulae that can be used to estimate the number of lines required in a
network, or to a central office (PSTN exchange lines).
Erlang B is the most commonly used traffic model, and is used to work out how
many lines are required if the traffic figure (in Erlangs) during the busiest hour and
the number of blocked calls are known. The model assumes that all unlocked callsare immediately cleared.

M O B I L E N E T W O R K S - W . E U R O P E 1 6 O C T O B E R 2 0 0 2 83
T E A M
Acknowledgements
We would like to thank Nimeshh Patel, from ABN AMRO’s wireline telecom equity
research team, for his invaluable insights and resource in researching global telcovolume and revenue trends by market and being a generally good bloke.
M O B I L E N E T W O R K S - W . E U R O P E 1 6 O C T O B E R 2 0 0 2 84
Companies mentioned: 0013.HK, ORA.PA, VOD.L
© Copyright 2002 ABN AMRO Bank N.V and affiliated companies ("ABN AMRO"). All rights reserved.
ABN AMRO Bank NV and/or one of the companies in the ABN AMRO Group have specific interests with respect toENEL and TIM, as defined under article 69, paragraph 1 of Consob Resolution n.11971/1999, as subsequentlyamended and supplemented, and Consob Notice n.DME/102955 or 20 April 2001. In particular, ABN AMRO BankNV and/or its holding company has issued financial instruments related to the securities of ENEL and TIM.
This material1 was prepared by the ABN AMRO affiliate named on the cover or inside cover page. It is provided for informationalpurposes only and does not constitute an offer to sell or a solicitation to buy any security or other financial instrument. Whilebased on information believed to be reliable, no guarantee is given that it is accurate or complete. While we endeavour toupdate on a reasonable basis the information and opinions contained herein, there may be regulatory, compliance or otherreasons that prevent us from doing so. The opinions, forecasts, assumptions, estimates, derived valuations, and target price(s)contained in this material are as of the date indicated and are subject to change at any time without prior notice. Theinvestments referred to may not be suitable for the specific investment objectives, financial situation or individual needs ofrecipients and should not be relied upon in substitution for the exercise of independent judgment. ABN AMRO may from time totime act as market maker, where permissible under applicable laws, buy or sell as agent or principal securities, warrants,futures, options, derivatives or other financial instruments referred to herein. ABN AMRO, officers, directors, employee benefitprogrammes or employees, including persons involved in the preparation or issuance of this material may from time to timehave long or short positions in securities, warrants, futures, options, derivatives or other financial instruments referred to inthis material. ABN AMRO may at any time solicit or provide investment banking, commercial banking, credit, advisory or otherservices to the issuer of any security referred to herein. Accordingly, information may be available to ABN AMRO, which is notreflected in this material, and ABN AMRO may have acted upon or used the information prior to, or immediately following itspublication. ABN AMRO may also within the last three years have acted as manager or co-manager for a public offering ofsecurities of issuers referred to herein. The stated price of any securities mentioned herein is as of the date indicated and is nota representation that any transaction can be effected at this price. Neither ABN AMRO or other person shall be liable for anydirect, indirect, special, incidental, consequential, punitive or exemplary damages, including lost profits arising in any way fromthe information contained in this material. This material is for the use of intended recipients only and the contents may not bereproduced, redistributed, or copied in whole or in part for any purpose without ABN AMRO's prior express consent. In anyjurisdiction in which distribution to private/retail customers would require registration or licensing of the distributor which thedistributor does not have currently, this document is intended solely for distribution to professional and institutional investors.
Should you require additional information please contact your local ABN AMRO account representative, unless governing lawsdictate otherwise.
Australia: This document is distributed in Australia by ABN AMRO Equities Australia Ltd (ABN 84 002 768 701), a participatingorganisation of the Australian Stock Exchange Ltd. Australian investors should note that this document was prepared forwholesale investors only.
Canada: The securities mentioned in this material are available only in accordance with applicable securities laws and may notbe eligible for sale in all jurisdictions. Persons in Canada requiring further information should contact ABN AMRO Incorporated.
Hong Kong: This document is being distributed in Hong Kong by ABN AMRO Asia Limited to persons whose business involvesthe acquisition, disposal or holding of securities.
India: Shares traded on stock exchanges within the Republic of India may only be purchased by different categories of residentIndian investors, Foreign Institutional Investors registered with The Securities and Exchange Board of India ("SEBI") orindividuals of Indian national origin resident outside India called Non Resident Indians ("NRIs") and overseas corporate bodies("OCBs"), predominantly owned by such persons or Persons of Indian Origin (PIO). Any recipient of this document wantingadditional information or to effect any transaction in Indian securities or financial instrument mentioned herein must do so bycontacting a representative of ABN AMRO Asia Equities (India) limited.
Italy: Persons in Italy requiring further information should contact ABN AMRO Bank N.V. Milan Branch.
New Zealand: This document is distributed in New Zealand by ABN AMRO Equities New Zealand Limited, a member firm of theNew Zealand Stock Exchange.
Russia: The Russian securities market is associated with several substantial risks: legal, economic and political ; and, highvolatility. There is a relatively high measure of legal uncertainty concerning rights, duties and legal remedies in the RussianFederation. Russian laws and regulations governing investments in securities markets may not be sufficiently developed or maybe subject to inconsistent or arbitrary interpretation or application. Russian securities are often not issued in physical form andregistration of ownership may not be subject to a centralized system. Registration of ownership of certain types of securitiesmay not be subject to standardized procedures and may even be effected on an ad hoc basis. The value of investments inRussian securities may be affected by fluctuations in available currency rates and exchange control regulations.
Singapore: This document is distributed in Singapore by ABN AMRO Asia Securities (Singapore) Private Limited to clients whofall within the description of persons in Regulation 44(i) to (iii) of the Securities Industry Regulations. Investors should notethat this material was prepared for professional investors only.
United Kingdom: This document has been issued in the United Kingdom by ABN AMRO Equities UK Limited, which is registeredin England No 2475694 and is regulated by the Financial Services Authority. The investment and services contained herein arenot available to private customers in the UK.
United States: Distribution of this document in the United States or to U.S. persons is intended to be solely to majorinstitutional investors as defined in Rule 15a-6 under the U.S. Securities Act of 1934. All U.S. persons that receive thisdocument by their acceptance thereof represent and agree that they are a major institutional investor and understand the risksinvolved in executing transactions in securities. Any U.S. recipient of this document wanting additional information or to effectany transaction in any security or financial instrument mentioned herein, must do so by contacting a registered representativeof ABN AMRO Incorporated, Park Avenue Plaza, 55 East 52nd Street, New York, N.Y. 10055, U.S., tel + 1212 409 1000, fax+1212 409 5222.
1 Material means all research information contained in any form including but not limited to hard copy, electronic form,presentations, e-mail, SMS or WAP.