aboriginal and torres strait islander health … the aboriginal and torres strait islander health...
TRANSCRIPT

Aboriginal and Torres Strait IslanderHealth Performance Framework
2017 Report

Tier 1 Health Status and OutcomesHealth conditions1.01 Low birthweight1.02 Topreasonsforhospitalisation1.03 Injury and poisoning1.04 Respiratory disease1.05 Circulatory disease1.06 Acuterheumaticfeverandrheumaticheartdisease1.07 High blood pressure1.08 Cancer1.09 Diabetes1.10 Kidney disease1.11 Oral health1.12 HIV/AIDS,hepatitisandsexuallytransmissibleinfections
Human function1.13 Communityfunctioning1.14 Disability1.15 Ear health1.16 Eye health
Life expectancy and wellbeing1.17 Perceivedhealthstatus1.18 Socialandemotionalwellbeing1.19 Lifeexpectancyatbirth
Deaths1.20 Infant and child mortality1.21 Perinatal mortality1.22 All causes age-standardised death rates1.23 Leading causes of mortality1.24 Avoidableandpreventabledeaths
Tier 2 Determinants of HealthEnvironmental factors2.01 Housing2.02 Accesstofunctionalhousingwithutilities2.03 Environmentaltobaccosmoke
Community capacity2.10 Community safety2.11 Contactwiththecriminaljusticesystem2.12 Childprotection2.13 Transport2.14 IndigenouspeoplewithaccesstotheirtraditionallandsSocio-economic factors
2.04 Literacy and numeracy2.05 Educationoutcomesforyoungpeople2.06 Educationalparticipationandattainmentofadults2.07 Employment2.08 Income2.09 Indexofdisadvantage
Health behaviours2.15 Tobacco use2.16 Riskyalcoholconsumption2.17 Drug and other substance use including inhalants2.18 Physicalactivity2.19 Dietarybehaviours2.20 Breastfeedingpractices2.21 Healthbehavioursduringpregnancy
Person-related factors2.22 Overweightandobesity
Tier 3 Health System PerformanceEffective/Appropriate/Efficient3.01 Antenatal care3.02 Immunisation3.03 Healthpromotion3.04 Earlydetectionandearlytreatment3.05 Chronic disease management3.06 Access to hospital procedures3.07 Selectedpotentiallypreventablehospitaladmissions3.08 Cultural competency
Responsive3.09 Dischargeagainstmedicaladvice3.10 Accesstomentalhealthservices3.11 Accesstoalcoholanddrugservices3.12 AboriginalandTorresStraitIslanderpeopleinthehealthworkforce3.13 Competentgovernance
Accessible3.14 Accesstoservicescomparedwithneed3.15 Accesstoprescriptionmedicines3.16 Accesstoafter-hoursprimaryhealthcare
Continuous3.17 Regular GP or health service3.18 Care planning for chronic diseases
Capable3.19 Accreditation3.20 Aboriginal and Torres Strait Islander peoples
training for health related disciplines
Sustainable3.21 ExpenditureonAboriginalandTorresStrait
Islander health compared to need3.22 Recruitmentandretentionofstaff
Figure 1AboriginalandTorresStraitIslanderHealthPerformanceFramework(HPF)PerformanceMeasures

Aboriginal and Torres Strait Islander Health Performance Framework 2017 Report
© Commonwealth of Australia 2017
ISBN 978-1-925362-27-5 (Hardcopy)
ISBN 978-1-925362-29-9 (PDF)
ISBN 978-1-925362-28-2 (HTML)
Ownership of intellectual property rights in this publication
Unless otherwise noted, copyright (and any other intellectual property rights, if any) in this publication is owned by the Commonwealth of Australia (referred to below as the Commonwealth).
Creative Commons licence
With the exception of the Coat of Arms, this publication is licensed under a Creative Commons Attribution 3.0 Australia Licence.
Creative Commons Attribution 3.0 Australia Licence is a standard form license agreement that allows you to copy, distribute, transmit and adapt this publication provided that you attribute the work.
A summary of the licence terms is available from http://creativecommons.org/licenses/by/3.0/au/deed.en. The full licence terms are available from http://creativecommons.org/licenses/by/3.0/au/legalcode.
The Commonwealth’s preference is that you attribute this publication (and any material sourced from it) using the following wording:
Source: Licensed from the Commonwealth of Australia under a Creative Commons Attribution 3.0 Australia Licence.
The Commonwealth of Australia does not necessarily endorse the content of this publication.
Suggested citation
Australian Health Ministers’ Advisory Council, 2017, Aboriginal and Torres Strait Islander Health Performance Framework 2017 Report, AHMAC, Canberra.
Enquiries should be directed to:
Health Systems Analysis Section Information and Evaluation Branch Policy, Analysis and Evaluation Division Department of the Prime Minister and Cabinet
p. 02 6271 5111
PO Box 6500 CANBERRA ACT 2601
Internet: http://www.dpmc.gov.au/hpf

Acknowledgements The Aboriginal and Torres Strait Islander Health Performance Framework 2017 Report, was prepared by the following staff in the Department of the Prime Minister and Cabinet—Shane Johnson, Matthew James, Kirrily Harrison, Ruth Nicholls, Scott Copley, Kylie Sjoberg, Katrina Anderson, Renée Wolford, Alice Church, Kailash Rajah, Timothy Saunders, Bobby Maher, Minette Salmon, Frances Algert, Mary Jackson and Fabiola Guzman. We would like to thank staff at the Australian Institute of Health and Welfare (AIHW) for their work on preparing the statistics for this report, with particular thanks to Fadwa Al-Yaman, Kim Dobbie, Tracy Dixon, Anh Pham Waddell, Therese Bourke, Bin Tong, Chun Oberst, Bronwyn Wyatt, Qinghe Yin, Ruth Penm, Ronda Ramsay, Jan Watson, Jakub Kielbasa, Ilona Brockway, Lisa Irvine, Jessica Cargill, Bernie Kok and Tetteh Dugbaza.
The Department worked closely with the HPF 2017 Report Steering Committee, with membership as follows:
• April Lawrie-Smith and Tania McGregor (SA Health, Chair NATSIHSC) • Fadwa Al-Yaman, Tracy Dixon and Kim Dobbie (AIHW) • Kate Thomann, Karen Visser, Tania Rishniw and Penny Jones (Australian Government Department of Health) • Senkham Boutdara (WA Health) • Debra Reid (Deputy Chair NAGATSIHID) • Vanessa Lee (NAGATSIHID) • Robert Starling (NACCHO representative NAGATSIHID).
We acknowledge the traditional owners of country throughout Australia, and their continuing connection to land, sea and community. We pay our respects to them and their cultures, and to elders both past and present. We would like to thank Aboriginal and Torres Strait Islander people for their assistance in the collection of data, without which this report would not have been possible.
We would also like to thank all of the individuals, communities and organisations that provided valuable input to the report:
• National Aboriginal and Torres Strait Islander Health Standing Committee (NATSIHSC) • National Advisory Group on Aboriginal and Torres Strait Islander Health Information and Data (NAGATSIHID) • Australian Bureau of Statistics (ABS), in particular the National Centre for Aboriginal and Torres Strait Islander Statistics, the Health and
Vitals Statistics Unit, the Demography Section, the Health Section, the Household Characteristics and Social Reporting Section and Consultancy and Training Services for preparation of customised tables, data checking and technical support
• Individuals with expertise in particular topics from various organisations who reviewed draft material • Aboriginal and Torres Strait Islander people who participated in workshops associated with the development and enhancement of the
measure of community functioning, particularly Professor Shane Houston • NSW Health for providing material used in the glossary of terms • Gilimbaa for providing artwork and graphic design.
Your time and commitment is greatly appreciated.
Artwork story
The Creation spirit shaped and formed this country, the rivers, and the mountains from the desert to the coast, imparting the Law to each and every one. Navigating by land and sea, we are the Custodians of this place – it nurtures us, sustains us, provides for us and heals us. We are connected, we are one.
Our ancestors protect and guide us, teaching us the ways of the past, strengthening our knowledge of Culture and directing our pathways, working together towards a brighter future.
The artwork used for the report has been derived from the Aboriginal and Torres Strait Islander Health Plan artwork created by Gilimbaa.

Table of Contents
Executive summary 1
Overview 3
Key findings ........................................................................................ 4 Life course .......................................................................................... 8 Gender .............................................................................................. 15 Regional analysis .............................................................................. 18 Social determinants .......................................................................... 23 Racism and discrimination ............................................................... 26 Demographic context ....................................................................... 28 Policies and strategies ...................................................................... 30 Background ....................................................................................... 36
Tier 1 Health Status and Outcomes 38
1.01 Low birthweight ....................................................................... 39 1.02 Top reasons for hospitalisation ................................................ 41 1.03 Injury and poisoning ................................................................. 43 1.04 Respiratory disease .................................................................. 45 1.05 Circulatory disease ................................................................... 47 1.06 Acute rheumatic fever and rheumatic heart disease .............. 49 1.07 High blood pressure ................................................................. 51 1.08 Cancer ....................................................................................... 53 1.09 Diabetes .................................................................................... 55 1.10 Kidney disease .......................................................................... 57 1.11 Oral health ................................................................................ 59 1.12 HIV/AIDS, hepatitis and sexually transmissible infections ....... 61 1.13 Community functioning ............................................................ 63 1.14 Disability ................................................................................... 67 1.15 Ear health ................................................................................. 69 1.16 Eye health ................................................................................. 71 1.17 Perceived health status ............................................................ 73 1.18 Social and emotional wellbeing ............................................... 75 1.19 Life expectancy at birth ............................................................ 79 1.20 Infant and child mortality ......................................................... 81 1.21 Perinatal mortality .................................................................... 83 1.22 All causes age-standardised death rates ................................ 85 1.23 Leading causes of mortality ..................................................... 87 1.24 Avoidable and preventable deaths .......................................... 91
Tier 2 Determinants of Health 94
2.01 Housing ..................................................................................... 95 2.02 Access to functional housing with utilities ............................... 97 2.03 Environmental tobacco smoke ................................................. 99 2.04 Literacy and numeracy ........................................................... 101 2.05 Education outcomes for young people .................................. 105 2.06 Educational participation and attainment of adults .............. 107 2.07 Employment ........................................................................... 109 2.08 Income .................................................................................... 111 2.09 Index of disadvantage ............................................................ 113 2.10 Community safety .................................................................. 115 2.11 Contact with the criminal justice system ............................... 117 2.12 Child protection ...................................................................... 121 2.13 Transport ................................................................................ 123 2.14 Indigenous people with access to their traditional lands ...... 125 2.15 Tobacco use ............................................................................ 127 2.16 Risky alcohol consumption ..................................................... 131 2.17 Drug and other substance use including inhalants ................ 133 2.18 Physical activity ...................................................................... 135 2.19 Dietary behaviours ................................................................. 137 2.20 Breastfeeding practices .......................................................... 139 2.21 Health behaviours during pregnancy ..................................... 141 2.22 Overweight and obesity ......................................................... 143
Tier 3 Health System Performance 146
3.01 Antenatal care ........................................................................ 147 3.02 Immunisation ......................................................................... 149 3.03 Health promotion ................................................................... 151 3.04 Early detection and early treatment ...................................... 153 3.05 Chronic disease management ................................................ 155 3.06 Access to hospital procedures ............................................... 157 3.07 Selected potentially preventable hospital admissions .......... 159 3.08 Cultural competency .............................................................. 161 3.09 Discharge against medical advice .......................................... 165 3.10 Access to mental health services ........................................... 167 3.11 Access to alcohol and drug services ....................................... 169 3.12 Aboriginal and Torres Strait Islander people in the health
workforce ................................................................................ 171 3.13 Competent governance ......................................................... 173 3.14 Access to services compared with need ................................ 175 3.15 Access to prescription medicines ........................................... 179 3.16 Access to after-hours primary health care ............................ 181 3.17 Regular GP or health service .................................................. 183 3.18 Care planning for chronic diseases ........................................ 185 3.19 Accreditation .......................................................................... 187 3.20 Aboriginal and Torres Strait Islander peoples training for
health-related disciplines ....................................................... 189 3.21 Expenditure on Aboriginal and Torres Strait Islander
health compared to need ....................................................... 191 3.22 Recruitment and retention of staff ........................................ 195
Technical Appendix 198
Statistical terms and methods ....................................................... 199 Main data sources ......................................................................... 201 Data development .......................................................................... 204 Notes to tables and figures ............................................................ 215
Abbreviations 231
Glossary 233
References 238


1
Executive summary
Improvements Concerns
Health Between 2003 and 2011 there has been a small decrease (5%) in the burden of disease in the Indigenous Australian population (AIHW, 2016f). Most of this improvement came from decreases in deaths.
Between 1998 and 2015 there has been a significant decline in the mortality rate for Indigenous Australians (15%). Major contributors to this decline include circulatory diseases (declined by 43%), respiratory disease (24%) and kidney disease (47% decline between 2006 and 2015). Circulatory disease was the most common cause of death for Indigenous Australians (24% of deaths) during 2011–15. Risk factors The Indigenous current smoking rate declined significantly by 9 percentage points (from 51% to 42%) between 2002 and 2014–15 for those aged 15 years and over.
Between 2008 and 2014–15, the proportion of Indigenous Australians aged 15 years and over drinking at risky levels declined for both single occasion (from 38% to 31%) and for lifetime risk (from 19% to 15%). Child and maternal health There has been a significant decline in the mortality rate for Indigenous children aged 0–4 years (33%) between 1998 and 2015.
The low birthweight rate declined by 13% between 2000 and 2014 for babies born to Indigenous mothers and there has been a narrowing of the gap.
Smoking during pregnancy declined for Indigenous mothers between 2006 and 2014 (from 54% to 46%). Health system Medicare services claimed by Indigenous Australians have increased over the last decade, including increases in health assessments, chronic disease management items and overall GP care. The Indigenous rate of Medicare GP services claimed (6,623 per 1,000) is higher than the non-Indigenous rate (5,840 per 1,000).
Between 1 July 2010 and 30 June 2016, 17.9 million scripts were issued under the PBS Co-payment Measure to Indigenous Australians.
Episodes of care delivered through Aboriginal and Torres Strait Islander primary health care services have tripled (from 1.2 million in 1999–2000 to 3.5 million in 2014–15). Social determinants Between 2008 and 2014–15, the gap in the Year 12 or equivalent attainment rate for those aged 20–24 years has narrowed by 14.7 percentage points and the 2020 Council of Australian Governments (COAG) target is currently on track.
There have also been improvements in overcrowding, homelessness and home ownership over the last decade.
Health Indigenous Australians experienced a burden of disease that was 2.3 times the rate of non-Indigenous Australians in 2011 (AIHW, 2016f).
The life expectancy of Indigenous Australians has improved slightly in recent years but progress will need to accelerate if the target to close the gap in life expectancy by 2031 is to be met.
In 2014–15, 45% of Indigenous Australians aged 15 years and over reported a disability or restrictive long-term health condition.
Cancer death rates for Indigenous Australians have increased by 21% between 1998 and 2015, while rates for non-Indigenous Australians have declined (by 13%).
There has been no improvement in mortality rates for diabetes or injury between 1998 and 2015; and there was a significant increase in the Indigenous suicide rate (32%). In 2012–13, 11% of Indigenous adults had diabetes (3 times the non-Indigenous rate) and 61% of those with diagnosed diabetes had high blood sugar levels indicating that the condition was not well managed.
The incidence rate of end stage kidney disease for Indigenous Australians was seven times the rate for non-Indigenous Australians in 2012–14. Risk factors In 2014–15, 42% of Indigenous Australians aged 15 years and over reported being a current smoker, 2.7 times the non-Indigenous rate. Indigenous smoking rates in very remote areas have not improved (remaining at around 53%).
In 2012–13, 66% of Indigenous Australians aged 15 years and over were overweight or obese.
In the 2012–13 Health Survey, 20% of Indigenous adults had high blood pressure and most (79%) had not previously been diagnosed with the condition. Child and maternal health In 2014 nationally, 10.5% of babies born to Indigenous mothers were low birthweight, twice the non-Indigenous rate (4.7%).
In 2014, 46% of Indigenous women smoked during pregnancy, 3.6 times the non-Indigenous rate. Health system In 2012–13, 21% of Indigenous Australians reported having problems accessing dentists, 14% doctors, 9% other health professionals and 6% hospitals.
The proportion of hospitalisations with a procedure recorded was lower for Indigenous Australians compared with non-Indigenous Australians. Indigenous Australians also had lower rates of elective surgery and longer waiting times.
Discharge from hospital against medical advice was seven times the non-Indigenous rate in the two years to June 2015. Social determinants There has been no progress on the employment target since 2008. Indigenous Australians are more likely to experience exposure to violence, child abuse and neglect, and contact with the criminal justice system than other Australians. In 2011, 28% of homeless Australians were Indigenous.

2

Overview
The overview includes:
- Key findings
- Life course
- Gender
- Regional analysis
- Social determinants
- Racism and discrimination
- Demographic context
- Policies and strategies
- Background

Overview
4
Key findings This is the sixth report against the Aboriginal and Torres Strait Islander Health Performance Framework (HPF)—see Figure 1. The HPF monitors progress in Aboriginal and Torres Strait Islander health outcomes, health system performance and the broader determinants of health. The health of Aboriginal and Torres Strait Islander peoples is improving for a number of measures, although there remain many areas where further concerted effort will be needed to achieve improvements in health outcomes.
This report includes updates for all administrative data collections and also the new ABS National Aboriginal and Torres Strait Islander Social Survey (‘Social Survey’, NATSISS) results for 2014–15. Data quality limitations and the small size of many estimates affect our ability to effectively monitor Indigenous health and the performance of the health system (see Technical Appendix).
There is a clear gap in robust evaluation evidence on effective interventions across a range of programme areas covered in this report. High quality evaluation evidence is vital for informing policy and programme development and planning.
Council of Australian Governments Targets Council of Australian Governments (COAG) has set seven targets on closing the gap between Aboriginal and Torres Strait Islander peoples and non-Indigenous Australians:
• Closing the life expectancy gap within a generation (2006 to 2031)—Indigenous life expectancy has improved slightly, but progress will need to accelerate if the target is to be met by 2031. Official Indigenous life expectancy estimates are only available every five years. Annual progress for this target is tracked using
mortality rates. While long-term Indigenous mortality rates have declined, the rate of change will need to accelerate to reach the target (see Figure 2).
• Halving the gap in mortality rates for Indigenous children under five within a decade (2008 to 2018)—there has been progress for infants but the 2015 Indigenous child mortality rate is not within the range required (see Figure 3).
• The original target for 95% of Indigenous four-year-olds in remote communities to be enrolled in early childhood education expired unmet in 2013 at 85%. In December 2015, COAG renewed the early childhood education target, aiming for 95% of all Indigenous four year olds enrolled by 2025. The baseline Indigenous enrolment rate in 2015 was 87%.
• Closing the gap between Indigenous and non-Indigenous school attendance within five years (2014 to 2018)—progress will need to accelerate for this target to be met.
• Halving the gap for Indigenous students in reading, writing and numeracy within a decade (2008 to 2018)—mixed progress has been made on this target. Of the eight areas (Year 3, 5, 7 and 9 for reading and numeracy), four have seen significant improvements and one (Year 9 numeracy) is on track in 2016.
• Halving the gap for Indigenous Australians aged 20–24 in Year 12 attainment or equivalent attainment rates (by 2020)—this target is on track to be met. Between 2008 and 2014–15, Indigenous Year 12 or equivalent attainment rates increased from 45.4% to 61.5% and the gap narrowed by 14.7 percentage points.
• Halving the gap in employment outcomes between Indigenous and non-Indigenous Australians within a decade (2008 to 2018)—this target is not on track and there has been no progress on the employment target since 2008.
Figure 2 Overall mortality rates by Indigenous status, NSW, Qld, WA, SA and the NT combined, 1998 to 2031
Source: ABS and AIHW analysis of National Mortality Database
Figure 3 Child mortality rates by Indigenous status: NSW, Qld, WA, SA and the NT combined, 1998 to 2018
Note: In part, the Indigenous mortality trend has changed for this reporting period due to an improvement in the quality of Indigenous identification. This means that caution should be used in interpreting the trends (see Technical Appendix for more detail). Source: ABS and AIHW analysis of National Mortality Database.
0
200
400
600
800
1,000
1,200
1,400
1998 2001 2004 2007 2010 2013 2016 2019 2022 2025 2028 2031
Deat
hs p
er 1
00,0
00 p
opul
atio
n
Year
Indigenous rate
Non-Indigenous rate
Target Indigenous rate
Projected non-Indigenous rate
Indigenous variability bands
Target
Indigenous data points
0
50
100
150
200
250
300
350
400
1998 2000 2002 2004 2006 2008 2010 2012 2014 2016 2018
Deat
hs p
er 1
00,0
00 p
opul
atio
n
Year
Indigenous rate
Non-Indigenous rate
Target Indigenous rate
Projected non-Indigenous rate
Indigenous variability bands
Target
Indigenous data points
Overview
5
Tier 1 Health Status and Outcomes
Improvements Concerns
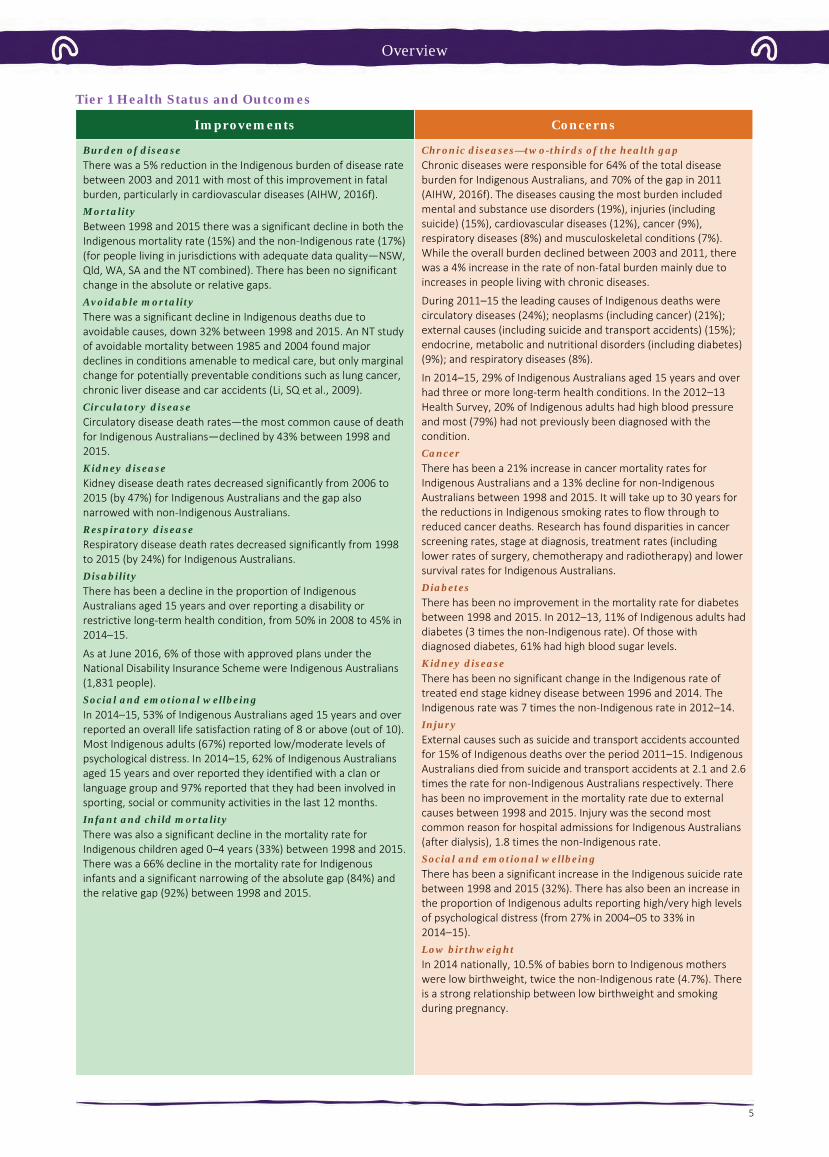
Burden of disease There was a 5% reduction in the Indigenous burden of disease rate between 2003 and 2011 with most of this improvement in fatal burden, particularly in cardiovascular diseases (AIHW, 2016f). Mortality Between 1998 and 2015 there was a significant decline in both the Indigenous mortality rate (15%) and the non-Indigenous rate (17%) (for people living in jurisdictions with adequate data quality—NSW, Qld, WA, SA and the NT combined). There has been no significant change in the absolute or relative gaps. Avoidable mortality There was a significant decline in Indigenous deaths due to avoidable causes, down 32% between 1998 and 2015. An NT study of avoidable mortality between 1985 and 2004 found major declines in conditions amenable to medical care, but only marginal change for potentially preventable conditions such as lung cancer, chronic liver disease and car accidents (Li, SQ et al., 2009). Circulatory disease Circulatory disease death rates—the most common cause of death for Indigenous Australians—declined by 43% between 1998 and 2015. Kidney disease Kidney disease death rates decreased significantly from 2006 to 2015 (by 47%) for Indigenous Australians and the gap also narrowed with non-Indigenous Australians. Respiratory disease Respiratory disease death rates decreased significantly from 1998 to 2015 (by 24%) for Indigenous Australians. Disability There has been a decline in the proportion of Indigenous Australians aged 15 years and over reporting a disability or restrictive long-term health condition, from 50% in 2008 to 45% in 2014–15.
As at June 2016, 6% of those with approved plans under the National Disability Insurance Scheme were Indigenous Australians (1,831 people). Social and emotional wellbeing In 2014–15, 53% of Indigenous Australians aged 15 years and over reported an overall life satisfaction rating of 8 or above (out of 10). Most Indigenous adults (67%) reported low/moderate levels of psychological distress. In 2014–15, 62% of Indigenous Australians aged 15 years and over reported they identified with a clan or language group and 97% reported that they had been involved in sporting, social or community activities in the last 12 months. Infant and child mortality There was also a significant decline in the mortality rate for Indigenous children aged 0–4 years (33%) between 1998 and 2015. There was a 66% decline in the mortality rate for Indigenous infants and a significant narrowing of the absolute gap (84%) and the relative gap (92%) between 1998 and 2015.
Chronic diseases—two-thirds of the health gap Chronic diseases were responsible for 64% of the total disease burden for Indigenous Australians, and 70% of the gap in 2011 (AIHW, 2016f). The diseases causing the most burden included mental and substance use disorders (19%), injuries (including suicide) (15%), cardiovascular diseases (12%), cancer (9%), respiratory diseases (8%) and musculoskeletal conditions (7%). While the overall burden declined between 2003 and 2011, there was a 4% increase in the rate of non-fatal burden mainly due to increases in people living with chronic diseases.
During 2011–15 the leading causes of Indigenous deaths were circulatory diseases (24%); neoplasms (including cancer) (21%); external causes (including suicide and transport accidents) (15%); endocrine, metabolic and nutritional disorders (including diabetes) (9%); and respiratory diseases (8%).
In 2014–15, 29% of Indigenous Australians aged 15 years and over had three or more long-term health conditions. In the 2012–13 Health Survey, 20% of Indigenous adults had high blood pressure and most (79%) had not previously been diagnosed with the condition. Cancer There has been a 21% increase in cancer mortality rates for Indigenous Australians and a 13% decline for non-Indigenous Australians between 1998 and 2015. It will take up to 30 years for the reductions in Indigenous smoking rates to flow through to reduced cancer deaths. Research has found disparities in cancer screening rates, stage at diagnosis, treatment rates (including lower rates of surgery, chemotherapy and radiotherapy) and lower survival rates for Indigenous Australians. Diabetes There has been no improvement in the mortality rate for diabetes between 1998 and 2015. In 2012–13, 11% of Indigenous adults had diabetes (3 times the non-Indigenous rate). Of those with diagnosed diabetes, 61% had high blood sugar levels. Kidney disease There has been no significant change in the Indigenous rate of treated end stage kidney disease between 1996 and 2014. The Indigenous rate was 7 times the non-Indigenous rate in 2012–14. Injury External causes such as suicide and transport accidents accounted for 15% of Indigenous deaths over the period 2011–15. Indigenous Australians died from suicide and transport accidents at 2.1 and 2.6 times the rate for non-Indigenous Australians respectively. There has been no improvement in the mortality rate due to external causes between 1998 and 2015. Injury was the second most common reason for hospital admissions for Indigenous Australians (after dialysis), 1.8 times the non-Indigenous rate. Social and emotional wellbeing There has been a significant increase in the Indigenous suicide rate between 1998 and 2015 (32%). There has also been an increase in the proportion of Indigenous adults reporting high/very high levels of psychological distress (from 27% in 2004–05 to 33% in 2014–15). Low birthweight In 2014 nationally, 10.5% of babies born to Indigenous mothers were low birthweight, twice the non-Indigenous rate (4.7%). There is a strong relationship between low birthweight and smoking during pregnancy.

Overview
6
Tier 2: Determinants of Health
Improvements Concerns
Smoking There has been a significant decline in smoking rates for Indigenous Australians aged 15 years and over between 2002 and 2014–15 (9 percentage points), including a significant improvement since 2008. From 2002 to 2014–15, the greatest decreases in smoking rates have been in the younger age groups—from 58% to 41% for 18–24 year olds and from 33% to 17% among 15–17 year olds.
For those who continue to smoke, there has been a decline in the average number of cigarettes smoked daily (from 15 in 2008 to 13 in 2014–15), although there is no safe level of smoking.
There has also been a decline between 2006 and 2014 in the rate of smoking among Indigenous women during pregnancy (from 54% to 46%). Alcohol Between 2008 and 2014–15, the proportion of Indigenous Australians aged 15 years and over drinking at risky levels declined for both single occasion (from 38% to 31%) and for lifetime risk (from 19% to 15%).
The proportion of Indigenous children aged 0–3 years with a birth mother who drank alcohol during pregnancy halved from 20% in 2008 to 10% in 2014–15, with the largest decline in non-remote areas (10 percentage points). Education Between 2008 and 2014–15, the gap in the Year 12 or equivalent attainment rate for those aged 20–24 years narrowed by 14.7 percentage points and the COAG target to halve the gap by 2020 is on track to be met.
In 2014–15, 47% of Aboriginal and Torres Strait Islander peoples aged 20–64 years reported they either had a Certificate III or above or were studying; a 21 percentage point increase from 2002. The gap narrowed in comparison to non-Indigenous Australians over this period. Housing Nationally, between 2008 and 2014–15, the proportion of Indigenous Australians living in overcrowded households declined by 6.8 percentage points (from 27.5% to 20.7%).
The rate of homelessness among Indigenous Australians fell by 14% between 2006 and 2011 (AIHW, 2014i).
Employment There has been little change in Indigenous employment rates since 2008 and the target to halve the gap within a decade is not on track. Education In Semester 1 2016, the Indigenous school attendance rate was 83.4%, compared with 93.1% for non-Indigenous students. There has been little change in the Indigenous school attendance rate from 2014 (83.5%).
In 2016, NAPLAN results were below the required trajectory points in seven of the eight areas for the target. Risk factors Around 37% of the Indigenous burden of disease was attributable to the 29 risk factors included in the study and they accounted for 51% of the gap with non-Indigenous Australians in 2011 (AIHW, 2016f). Key risk factors included tobacco use (12% of the Indigenous burden), alcohol use (8%), high body mass (8%), physical inactivity (6%), high blood pressure (5%) and high blood plasma glucose (5%). Dietary factors together accounted for approximately 10% of the burden. Tobacco use accounted for 23% of the health gap.
In 2014–15, 42% of Indigenous Australians aged 15 years and over reported being a current smoker, 2.7 times the non-Indigenous rate. Indigenous smoking rates in remote areas have not improved and are still 53%. In 2014, 46% of Indigenous women smoked during pregnancy, 3.6 times the non-Indigenous rate.
In 2012–13, 66% of Indigenous Australians aged 15 years and over were overweight or obese (29% overweight and 37% obese). Indigenous Australians were 1.6 times as likely to be obese as non-Indigenous Australians.
In 2014–15, 5% of Indigenous Australians aged 4–14 years and 4% of those aged 15 years and over reported adequate daily fruit and vegetable intake (NHMRC, 2013a).
In 2014–15, 31% of Indigenous Australians aged 15 years and over had used drugs and other substances in the last 12 months (up from 23% in 2008). Low income and the distribution of income In 2014–15, 36% of Indigenous adults were living in households in the bottom income quintile compared with 17% of non-Indigenous adults. In comparison, only 6% were in the top quintile compared with 22% of non-Indigenous adults. Community safety Indigenous Australians were more likely to experience exposure to violence, child abuse and neglect, and contact with the criminal justice system than other Australians.
In 2014–15, 22% of Indigenous Australians aged 15 years and over reported experiencing physical or threatened violence in the last 12 months (no significant change from 24% in 2002).
Between 2006 and 2016, the Indigenous imprisonment rate increased by 53%; and in 2016 the Indigenous imprisonment rate was 13 times the non-Indigenous rate (age-standardised).
In 2014–15, the rate of Indigenous 10–17 year olds under juvenile justice supervision was 15 times the non-Indigenous rate. Housing In 2014–15, 21% of Indigenous Australians lived in overcrowded households, 3.8 times the non-Indigenous rate.
Around 26% of Indigenous households were living in dwellings with major structural problems.
In 2011, Indigenous Australians accounted for 28% of the homeless population (AIHW, 2014i).

Overview
7
Tier 3: Health System Performance
Improvements Concerns
Chronic disease detection and management There has been a significant increase in a range of Medicare services claimed by Indigenous Australians since the introduction of the Indigenous chronic disease initiatives in 2009–10:
• Health assessment rates for Indigenous Australians more than tripled between July 2009 and June 2016.
• There has also been an increase in the Indigenous rate of Medicare GP management plans and team care arrangements claimed between July 2009 and June 2016. For GP management plans the Indigenous rate (129 per 1,000) is now higher than the non-Indigenous rate (86 per 1,000) (age-standardised). This is also the case for team care arrangements (112 and 72 per 1,000 respectively, age-standardised).
• There has also been a significant increase in overall GP Medicare items claimed by Indigenous Australians between 2003–04 and 2015–16. The Indigenous rate (6,623 per 1,000) is now higher than the non-Indigenous rate (5,840 per 1,000) (age-standardised).
The national Key Performance Indicators monitor the performance of over 200 Commonwealth-funded Indigenous primary health care organisations. In May 2015, around 32,900 regular clients of these organisations had Type 2 diabetes. In the six months to May 2015, 52% of these clients had their blood glucose levels tested, with 35% of those tested reporting a blood sugar result in the recommended range; 68% had their blood pressure assessed, with 43% reporting a result in the recommended range; and 67% reported a kidney function test, with 81% reporting a result in the normal range. Access to prescription medicines Between 1 July 2010 and 30 June 2016, 407,861 eligible Indigenous patients have benefited from the Closing the Gap Pharmaceutical Benefits Scheme (PBS) Co-payment Measure, subsidising 17.9 million PBS prescriptions. Health Workforce Between 1996 and 2011 the rate of Indigenous Australians employed in the health workforce increased from 96 per 10,000 to 155 per 10,000. Increased availability of Indigenous specific services Australian Government Indigenous specific health programme expenditure through the Department of Health has increased from $115 million in 1995–96 to $727 million in 2015–16, a growth in real terms of 284%. The episodes of care delivered through Aboriginal and Torres Strait Islander primary health care services have almost tripled (from 1.2 million in 1999–2000 to 3.5 million in 2014–15). Usual source of care In 2012–13, 86% of Indigenous Australians had a usual place to go for health problems/advice.
In 2014–15, most Indigenous Australians aged 15 years and over who saw a GP or specialist in the previous 12 months reported feeling their doctor always or usually: listened carefully to them (80%); showed them respect (85%); and spent enough time with them (79%). Antenatal care The proportion of Indigenous women accessing antenatal care during the first trimester increased by 13%, from 47% in 2011 to 52% in 2014 (age-standardised, excluding New South Wales). Immunisation coverage for children By 5 years of age the Indigenous immunisation rate (95%) was slightly higher than for other children (93%) in 2015.
Barriers to accessing health care In 2012–13, 30% of Indigenous Australians reported that they needed to, but didn’t, go to a health care provider in the previous 12 months. This varied by type of service with 21% not going to a dentist, 14% to a doctor, 9% to a counsellor, 9% to other health professionals and 6% to hospital when needed. Indigenous Australians living in non-remote areas (32%) were more likely to report not seeking care when needed than those living in remote areas (22%).
Selected potentially preventable hospitalisation rates for Indigenous Australians were 3 times the non-Indigenous rate during the period July 2013 to June 2015.
Indigenous Australians had lower rates of hospitalisations with a procedure recorded (62%) compared with non-Indigenous Australians (81%). Indigenous Australians also had lower rates of elective surgery and lower wait times.
Discharge from hospital against medical advice was 7 times the rate for Indigenous Australians compared with non-Indigenous Australians. Health workforce In 2011, 1.6% of the Indigenous Australian population was employed in health-related occupations compared with 3.4% of the non-Indigenous population. Aboriginal and Torres Strait Islander peoples are also currently under-represented in training for various health professions.
The supply of clinical doctors was not uniform across the country, being greater in major cities (421 FTE per 100,000 population) than in remote/very remote areas (251 FTE per 100,000) in 2015. Antenatal care Antenatal care for Indigenous women occurs later and less frequently than for non-Indigenous women. In 2014, 54% of Indigenous mothers had their first antenatal session in the first trimester of pregnancy. However, in 2014 the age-standardised proportion of Indigenous mothers who attended antenatal care in the first trimester was still lower than for non-Indigenous mothers (by 7 percentage points). Private health insurance cover In 2012–13, in non-remote areas, only 20% of Indigenous Australians were covered by private health insurance. The most common reason that Indigenous Australians did not have private health insurance was that they could not afford it (72%).
In the two years to June 2015, 7% of procedures recorded for Indigenous Australians occurred in private hospitals compared with 42% for non-Indigenous Australians. Cost The cost of the Indigenous health gap in the NT has been estimated at $16.7 billion, including: higher health expenditure, lost productivity and lost life-years (Zhao et al, 2016).

Life course
8
Life course As outlined in the National Aboriginal and Torres Strait Islander Health Plan 2012–2013, a life course approach to health acknowledges that there are critical periods of growth and development in-utero, in early infancy, and during childhood and adolescence that impact on social and cognitive skills, habits, coping strategies and physical health (Dept. of Health, 2013). These then interact with biological factors, social experiences and risk behaviours to either attenuate or exacerbate long-term risks to health (Cable, 2014).
There is a substantial body of evidence that the experience of the child in-utero, at the time of birth and in infancy and childhood has the potential to impact on health throughout life (Eades, S, 2004; Barker, 1990; Power et al, 2013).
Advances in neuroscience, molecular biology, genomics and transgenerational epidemiology provide further evidence that exposure to early childhood adversity impacts educational achievement, social and emotional wellbeing and measures of health, such as increased risk of obesity and high blood pressure (Crowell et al, 2016). Even in the absence of health risk behaviours in adulthood, the physiological effects of ‘toxic stress’ during childhood manifest later in life as cardiovascular disease, cancer, poor dental health and depression (Shonkoff et al, 2011).
Engaging with Aboriginal and Torres Strait Islander peoples in priority setting, policy development and programme implementation in a respectful and culturally competent way has been identified as a key success factor for programmes that support healthy lives (Lohoar et al, 2014; Griew et al, 2007).
The measure of community functioning within the HPF provides a range of strengths-based concepts that are critical to underpinning priorities for achieving outcomes consistent with the values of Aboriginal and Torres Strait Islander families and communities (see measure 1.13).
Maternal health and parenting Longitudinal research continues to demonstrate the importance of evidence-based investment in prenatal and early childhood periods in order to prevent and reduce poor educational and health outcomes in later life (Ip, 2016; Eckenrode et al, 2010).
Antenatal care and sustained home visiting provide opportunities to support healthy behaviours throughout pregnancy and into the early years of childhood. These types of programmes have been associated with positive outcomes in birthweight, maternal nutrition and breastfeeding (Emerson et al, 2015).
Access to antenatal care is very high for Indigenous women (99%) but often occurs later in the pregnancy and less frequently than for non-Indigenous women (see measure 3.01).
Indigenous women who receive care in the first trimester compared with those who receive no antenatal care are 4 times less likely to have a pre-term or low birthweight baby (see Figure 4). Figure 4 Relationship for Indigenous mothers between duration of pregnancy at first antenatal care session and low birthweight babies, 2014
Source: AIHW/NPESU analysis of National Perinatal Data Collection
Smoking increases the risk of adverse events in pregnancy (such as miscarriage, ectopic pregnancy, pre-term labour and antepartum haemorrhage), and is also associated with poor perinatal outcomes (such as low birthweight), and respiratory illnesses (such as bronchitis or pneumonia) during the child's first year of life (see measure 2.21). Smoking is also associated with a higher rate of perinatal deaths (see measure 1.21). Research in WA has found the effects of smoking and other stressors adversely affects several generations (AIHW, 2013c). In 2014, 54% of Aboriginal and Torres Strait Islander mothers did not smoke during pregnancy. However, Indigenous mothers were 3.6 times as likely to smoke during pregnancy as non-Indigenous mothers (age-standardised).
In addition to addressing health risk behaviours during pregnancy, the social and emotional wellbeing of mothers is also important in reducing early exposure to childhood adversity (Shonkoff et al, 2011). This includes ante/postnatal depression and stress related to income deprivation, housing instability, low levels of educational attainment (particularly for teenage mothers), racism, discrimination and exposure to family violence. For Indigenous females, intimate partner violence was a health risk factor responsible for 6.4% of the burden of disease and injury, having its impact not only through homicide and violence but also anxiety and depression, suicide and other diseases (Ayre et al, 2016). In 2015–16, Indigenous Australians accessed specialist homelessness services at 9 times the non-Indigenous rate of access (AIHW, 2017b). The majority of Indigenous clients were women (62%) and almost a quarter (23%) of all Indigenous clients were children aged 0–9 years.
A study of deaths of mothers in WA between 1983 and 2010 found a higher proportion of children born to Aboriginal mothers had experienced a maternal loss (5.4%) when compared with other children (1%) (Fairthorne et al, 2016).
Childhood (0–14 years) Brain development in the early years is greatly influenced by social and environmental factors, and this is a critical phase for establishing healthy cognitive and emotional processes. In the first three years of life, a child’s brain grows from 25% to 90% of its adult size (Emerson et al, 2015).
Most Indigenous babies are born a healthy weight (89% in 2014). However, in 2014, low birthweight was more common for babies born to Aboriginal and Torres Strait Islander mothers (10.5%) than non-Indigenous mothers (4.7%) (excluding multiple births). Low birthweight infants are at a greater risk of dying during their first year of life (see measure 1.21), and are prone to ill-health in childhood and the development of chronic disease as adults (OECD, 2011; Scott, 2014; Arnold, L et al, 2016; Luyckx et al, 2013; Zhang, Z et al, 2014; Hoy, W & Nicol, 2010; White, A et al, 2010).
In 2014, low birthweight rates for babies born to Indigenous mothers were highest in very remote areas, followed by remote areas, outer regional areas, major cities and then inner regional areas. However, for non-Indigenous mothers the rates were lowest in remote areas (4.2%) and ranged from 4.5% to 4.7% in other areas (see Figure 5).
9 11 12
37
0
10
20
30
40
50
<14 14–19 20+ no attendance
Per c
ent (
mot
hers
)
Gestation at first antenatal session (weeks)

Life course
9
Figure 5 Low birthweight per 100 live born singleton births, by Indigenous status of the mother and remoteness, 2014
Source: AIHW analysis of the National Perinatal Data Collection
The Millennium Cohort study found a clear social gradient in the types of parenting practices that encourage social and language development (Marmot, 2015). Weisleder et al. (2013), in a study of toddlers, found that the number of child-directed words heard over the course of a day ranged from 670 to 12,000 words. Infants who experienced more child-directed speech became more efficient in processing familiar words in real time and had larger vocabularies by the age of 24 months.
Analysis of the Longitudinal Study of Indigenous Children (LSIC) shows that 77% of Aboriginal and Torres Strait Islander children were at low risk of emotional/behavioural difficulties (Walter et al, 2016). For children in the LSIC, 76% of caregivers often/always showed affection; 48% had a warm relationship with their teacher; 54% had not been bullied; 65% had at least one friend; 9% attend cultural events often, and these factors were significantly associated with resilience.
Another study using data from the LSIC (Dept. of FaHCSIA, 2013) found that the main risk factors for social and emotional difficulties included: having a close family member having problems with the police/jail; being cared for by someone other than their regular carer for at least a week; and children being scared by other people's behaviour (see measures 2.10, 2.11 and 2.12). The 2001–02 WA Aboriginal Child Health Survey found that children were twice as likely to be at risk of emotional and behavioural difficulties if they lived in families with poor communication and decision making, poor emotional support and limited time spent together (Zubrick et al, 2005). Further evaluation is required to assess the effectiveness of Indigenous parenting programmes and how well they attract and retain participants and the cultural competence of the services (Emerson et al, 2015).
Dockery (2011) found an association for Indigenous Australians between strong cultural attachment and positive outcomes on a range of socio-economic indicators including health status, education and employment. Providing children with a positive sense of themselves facilitates a strong foundation in resilience (Eades, S, 2004). Promoting a positive home learning environment is an important contributor to good early learning outcomes, along with regularly participating in high quality early childhood education (Leske et al, 2015).
In 2014–15, 96% of Aboriginal and Torres Strait Islander children aged 0–14 years were involved in informal learning activities with a carer in the last week, 44% of 4–14 year olds had spent time with an Indigenous elder, and 54% of children aged 2–14 years were taught about Indigenous culture at school (see measure 1.13).
After controlling for a range of factors, Arcos Holzinger and Biddle (2015) found at ages five to seven (two years after preschool
enrolment) participation in preschool had some positive impact on vocabulary for Indigenous students. Over the longer term (three to five years after preschool enrolment) positive impacts on developmental outcomes, reading and maths achievement were seen for Indigenous students. In 2015, 87% of Indigenous children participated in early childhood education in the year before formal schooling (Dept. of Prime Minister & Cabinet, 2017). Biddle (2011) found decreased preschool attendance of children whose carers experienced feelings of discrimination, demonstrating the importance of cultural competency in services (see measure 3.08).
The Australian Early Development Census (AEDC) is a measure of children's development in the first year of school with teacher assessments across five domains (see Figure 6). As with all assessments the AEDC has its limitations. In 2015, most Indigenous children (58%) were not developmentally vulnerable on any domain (Dept. of Education & Training, 2016). In 2015, 62% of Indigenous children were developmentally on track for physical health and wellbeing; 59% for social competency; 63% for emotional maturity; 63% for language and cognitive skills and 60% for communication and general knowledge.
However, Indigenous children were twice as likely as non-Indigenous children to be developmentally vulnerable on at least one domain (42% compared with 21%). The gap between Indigenous and non-Indigenous children is starting to close for some AEDC measures. For example, the gap between Indigenous and non-Indigenous children on the language and cognitive skills (school-based) domain fell from 21 percentage points in 2009 to 15 percentage points in 2015. Figure 6 Percentage of Australian children 'developmentally vulnerable' in the Australian Early Development Census, by Indigenous status, 2015
Source: Commonwealth of Australia (2016)
In 2016, the majority of Indigenous school students met the national minimum standard in reading and numeracy. In 2016, around 81% of Indigenous students met the Year 3 national minimum standard in reading, 71% in Year 5, 77% in Year 7, and 74% in Year 9. Around 85% of Indigenous students met the national minimum standard for writing in Year 3, 74% in Year 5, 64% in Year 7, and 53% in Year 9. However, the proportion of Aboriginal and Torres Strait Islander students achieving the reading, writing and numeracy benchmarks remain below the corresponding proportions of non-Indigenous students (Figure 7 presents results for reading as an example). Guthridge et al. (2015) investigated the association between early life risk factors and NAPLAN results in a large cohort study of children in the NT. They found that, controlling for other factors, low birthweight is associated with poorer numeracy results for Indigenous children.
10.39.1
10.711.7 12.1
4.7 4.7 4.5 4.2 4.7
0
4
8
12
16
20
Major cities Innerregional
Outerregional
Remote Very remote
Num
ber
per 1
00 li
ve b
irths
Remoteness area
Babies of Aboriginal and Torres Strait Islander mothersBabies of non-Indigenous mothers
1920
17
21 21
8
6
89 9
0
5
10
15
20
25
Communicationskills/generalknowledge
Language andcognitive skills
Emotionalmaturity
Socialcompetence
Physical healthand well-being
Per c
ent
Aboriginal and Torres Strait Islander peoples Non-Indigenous Australians

Life course
10
Figure 7 Proportion of Year 3, 5, 7 and 9 students at or above the national minimum standards for reading, by Indigenous status, 2016
Source: ACARA 2016
NAPLAN test results decline with any absence from school and this accumulates over time (Hancock et al, 2013). In Semester 1 2016, national Indigenous attendance rates were 83.4%, compared with 93.1% for non-Indigenous students. There has been little change in the Indigenous school attendance rate from 2014 (83.5%). All of the changes at the state and territory level were less than one percentage point, apart from the NT (1.6 percentage point fall). Progress will need to accelerate from now on for the school attendance gap to be closed by 2018 (Dept. of Prime Minister & Cabinet, 2017).
Analysis undertaken by the Social Justice Commissioner shows that one of the most common reasons for substantiated child protection notifications for Indigenous children aged 0–17 years in 2014–15 was neglect (38%) (AHRC, 2015). Neglect is strongly associated with poor socio-economic status and refers to ‘the failure to provide for a child’s basic needs, including failure to provide adequate food, shelter, clothing, supervision, hygiene or medical attention’. Malnutrition or ‘failure to thrive’ continues to be a prominent reason for neglect, particularly in remote areas. The other most common reason is ‘emotional abuse’ (also 38% in 2014–15). Exposure to family violence is often categorised as ‘emotional abuse’ by child welfare agencies. A report by the Department for Child Protection and Family Support in WA found that over 50% of all referrals to child protection were related to family and domestic violence; and children were present at 70% of domestic violence incidents attended by police (Dept. for Child Protection & Family Support, 2013). A recent Inquiry in Victoria has found that family violence, in combination with parental alcohol and/or drug abuse, are the leading causes for Aboriginal children’s entry into out-of-home care. Of the Aboriginal children reviewed, 88% were impacted by family violence and 87% per cent were affected by a parent with alcohol or substance abuse issues (Commission for Children and Young People, 2016). Frequently, parents of children who come to the attention of child welfare have themselves been removed from their families as children. The Social Justice Commissioner’s analysis highlights the need for a healing and trauma informed approach to addressing the social determinants of health for Aboriginal and Torres Strait Islander peoples.
Children who live in a dwelling that is badly deteriorated have been found to have poorer physical health outcomes and social and emotional wellbeing compared with those growing up in a dwelling in excellent condition (Dockery et al, 2013). In 2014–15, around one-quarter (26%) of Indigenous households were living in dwellings with major structural problems (including problems such as sinking/moving foundations, sagging floors, wood rot/termite damage and roof defects). Comparisons between Indigenous and non-Indigenous children in the Longitudinal Study of Australian
Children (LSAC) show improvements in housing can be expected to translate into gains for Indigenous children's health, social and learning outcomes (Dockery et al, 2013).
Lower levels of education and income, and sub-standard living conditions are also associated with oral disease. In 2014–15, around a third (34%) of Indigenous children aged 4–14 years had teeth or gum problems. In the two years to June 2015, Indigenous children aged 0–4 years were hospitalised for dental conditions at twice the rate of non-Indigenous children (6.9 per 1,000 compared with 3.6 per 1,000). This indicates poor access to, and a large unmet need for, dental care in this age group. Dental disease in childhood is readily treated but cost is a major barrier for Indigenous families (Durey et al, 2016). In 2014–15, 82% of Indigenous children aged under 15 years reported cleaning their teeth once or twice per day.
Immunisation is highly effective in reducing illness and death caused by vaccine-preventable diseases. As at December 2015, immunisation coverage was high for Indigenous children, and by 5 years of age, the immunisation coverage (95%) was slightly higher than for other Australian children (93%) (see measure 3.02).
Hearing loss, especially in childhood, can lead to linguistic, social and learning difficulties and behavioural problems in school. Ear disease (particularly middle ear infections) is significantly higher for Indigenous children aged 0–14 years (2.9 times the non-Indigenous rate in 2014–15 self-reported survey data). In the period from July 2013 to June 2015, Indigenous children aged 0–14 years were hospitalised for tympanoplasty procedures (a reconstructive surgical treatment for a perforated eardrum) at 4 times the rate of non-Indigenous children.
Most Indigenous children have excellent vision. However, in 2014–15, 10% of Indigenous children aged 0–14 years reported eye or sight problems, up from 7% in 2008 (ABS, 2016e). In 2015 the prevalence of active trachoma in children aged 5–9 years in 131 screened at-risk Indigenous communities in NSW, SA, WA and the NT combined was 4.6% (NTSRU, 2017). Vision loss and/or eye disease can lead to learning difficulties and poor education and employment outcomes.
In the two years to June 2015, the hospitalisation rate for respiratory diseases for Indigenous children aged 0–4 years was 1.6 times the rate for non-Indigenous children. Since 2004–05 there has been a significant increase (24%) in hospitalisation rates for Indigenous children for respiratory diseases and an increase in the difference in rates with non-Indigenous children (see measure 1.04).
The home is a key setting for exposure to second-hand smoke for pregnant women and young children. Exposure to parents' smoking in childhood is found to have pervasive vascular health effects into adulthood (Gall et al, 2014). In 2014–15, 57% of Aboriginal and Torres Strait Islander children aged 0–14 years were living in households with a daily smoker, however this dropped to 13% where anyone smoked at home indoors. In comparison, 21% of non-Indigenous children within the same age range lived in households with a daily smoker. Socio-economic factors are associated with whether Indigenous children aged 0–14 years live in a household where smoking occurs indoors (see Figure 8). Children in the lowest income households, households under financial stress (where it was not possible to raise $2,000 in an emergency) and households that ran out of money for basic living expenses in the last year were more likely to be exposed to smoke inside their home. Children living in households that were owned rather than rented, or in households that were not overcrowded were less likely to be exposed to smoke inside their home.
80.6
70.877.4
73.6
96.0 94.4 95.6 94.0
0
20
40
60
80
100
Year 3 Year 5 Year 7 Year 9
Per c
ent
Year level
Reading
Aboriginal and Torres Strait Islander children Non-Indigenous children

Life course
11
Figure 8 Relationship between living in a household where no smoking occurs indoors and socio-economic factors, Indigenous children aged 0-14 years, 2014–15
Source: ABS and AIHW analysis of 2014–15 NATSISS
The Aboriginal and Torres Strait Islander burden of disease study found that overall disease burden was not evenly distributed over the different stages of life (AIHW, 2016f). Infants and children aged 0–4 years represented 12% of the Indigenous population, and accounted for 9% of the total burden of disease for Indigenous Australians in 2011. Infant and congenital conditions accounted for a large portion of the burden in this age group, mostly due to pre-term and low birthweight complications, SIDS, and other disorders of infancy and birth.
Children aged 5–14 years represented 24% of the total Indigenous population, but accounted for only 6% of the total burden of disease. The leading causes of health loss for this age group were asthma, anxiety disorders, depressive disorders and conduct disorders.
In 2011–15, the mortality rate for Indigenous children aged 0–4 years was twice the non-Indigenous rate (165 per 100,000 compared with 80 per 100,000). The leading cause of death for Indigenous infants was conditions originating in the perinatal period; while injury accounted for over half (54%) of the deaths in the 1–4 year old group. Injury was also the leading cause of death for Indigenous children aged 5–14 years (63%). The NT had the highest Indigenous child mortality rates and the largest gap compared with the mortality rates of non-Indigenous children (see Figure 9). Figure 9 Child (0-4) mortality rates per 100,000, by Indigenous status, by jurisdiction, NSW, Qld, WA, SA and NT, 2011–15
Source: ABS and AIHW analysis of National Mortality Database
Adolescents and youth (15–24 years) The transition between adolescence and adulthood is a time when young people experience a range of physical, psychological, social and financial changes including changes in their support networks and relationships, educational goals, and responsibilities within their family and community (Mission Australia, 2016).
Studies have found that empowering families and communities to work with youth on preventative health and to develop a positive sense of themselves are important factors for a strong foundation for long and healthy lives (Eades, S, 2004; Williamson et al, 2010). Effective engagement with Aboriginal and Torres Strait Islander youth requires consideration of the impacts of racism, intergenerational trauma and the emergent effects of ‘toxic’ stress (as discussed previously) that can affect young peoples’ ability to cope.
Achievement of educational goals is a key factor for positive health, social and economic outcomes later in life. Although Aboriginal and Torres Strait Islander people comprise 3% of the population, the younger demographic of the Indigenous population means they comprise 6.7% of school enrolments in government schools (ABS, 2016d). The majority of these students (84%) attend government schools. Over time there have been improvements in the proportion of Indigenous students remaining in school to Year 10 and Year 12, although Indigenous retention rates remain lower than for other students (see measure 2.05). Between 2008 and 2014–15, the gap in the Year 12 or equivalent attainment rate for those aged 20–24 years narrowed by 14.7 percentage points and the COAG target to halve the gap by 2020 is currently on track (see measure 2.06). Nationally, the proportion of Indigenous 20–24 year olds who had attained Year 12 or equivalent increased from 45.4% in 2008 to 61.5% in 2014–15. In 2016, the attendance rate for Indigenous students was 83.4%, almost 10 percentage points lower than the comparable rate for non-Indigenous students (93.1%). While this is a sizeable gap, the data tells us that on a given school day the vast majority of Aboriginal and Torres Strait Islander students are attending school. Factors associated with poor school attendance include inadequate housing and health care, mental health issues, family violence and intergenerational unemployment (Mission Australia, 2016).
Young Indigenous women are more likely to plan university study and have higher post-school aspirations than young Indigenous men (Sikora & Biddle, 2015). The 2015 Youth Survey found that financial difficulties were perceived as a barrier to the achievement of study/work goals for both Indigenous and non-Indigenous youth (Mission Australia, 2016).
In 2015, Indigenous young people were more likely than non-Indigenous young people to report plans to go to TAFE or college and get an apprenticeship. Getting a job was also found to be more important to Indigenous than non-Indigenous young people; however, they were less likely to be in paid employment and more likely to be looking for work. The Youth Survey found that half of Indigenous youth were looking for work compared with one-third of non-Indigenous youth.
Remoteness influences the social and environmental context of this transition period, due to factors ranging from cultural identification and social networks through to educational and employment opportunities. In 2011, 21% of Indigenous Australians lived in remote areas. In 2014–15, around 5% of Indigenous youth in non-remote areas spoke an Australian Indigenous language, compared with 54% of youth in remote areas. Indigenous youth in remote areas were more likely to identify with a clan, tribal or language group (75%) compared to youth in non-remote areas (47%). Indigenous youth in remote areas were more likely to have been involved in funerals/sorry business (56%) compared with youth in non-remote areas (22%). Indigenous youth in remote areas were more likely to have daily face to face contact with family or friends
81
97
82
92
8189
8593
0
20
40
60
80
100
Mos
t disa
dvan
tage
d q
uint
ile
Mos
t adv
anta
ged
qui
ntile
s
Una
ble
to ra
ise $
2,00
0
in
em
erge
ncy
Able
to ra
ise $
2,00
0 i
n em
erge
ncy
Day
s with
out $
for
basic
livi
ng e
xpen
ses
No
days
with
out $
for
bas
ic li
ving
exp
ense
s
Rent
er
Ow
ner
Perc
ent
Income Financial Stress Housing
111
163189
167
333
165
8197
5469
93 80
0
50
100
150
200
250
300
350
NSW Qld WA SA NT Total
Deat
hs p
er 1
,000
pop
ulat
ion
Jurisdiction
Aboriginal and Torres Strait Islander peoples Non-Indigenous Australians

Life course
12
from outside their household (73%) compared with youth in non-remote areas (47%), while young people in non-remote areas were more likely to use text messaging (88% compared with 63% in remote areas) or web-based chat (54% compared with 27% in remote areas). Similar proportions of Indigenous youth across remoteness areas felt able to get support in times of crisis (94% in non-remote and 90% in remote areas). Youth in non-remote areas were more likely to report being able to confide in family or friends outside their household (88% compared with 67% in remote areas). Indigenous youth in remote areas were more likely to have cared for a person with a disability, long-term health condition or old age in the last 4 weeks (35% compared with 20% in non-remote areas). Similar proportions of young people felt they have little or no say within their community on important issues (57% in non-remote areas and 60% in remote areas).
In 2014–15, a higher proportion of Indigenous Australians aged 15–24 years living in remote areas reported living in households that were not able to raise $2,000 in a week (65%) compared with non-remote areas (45%). In remote areas, the combined impact of living in areas of socio-economic disadvantage, low-quality housing, overcrowding and family violence are associated with educational disadvantage (Brackertz, 2016). Year 12 attainment among Aboriginal and Torres Strait Islander young people aged 20–24 years varied considerably by remoteness area in 2014–15, ranging from 69% in inner regional areas to 42% in remote and very remote areas. For Indigenous young people in remote areas there are fewer job opportunities (Mission Australia, 2016). In 2014–15, the proportion of Indigenous Australians aged 17–24 years fully engaged in education, training or employment ranged from 58% in major cities to 15% in very remote areas.
Aboriginal and Torres Strait Islander youth experience a number of challenges compared with non-Indigenous youth, including higher rates of high/very high levels of psychological distress (see measure 1.18). The 2015 Youth Survey found that 18% of Aboriginal and Torres Strait Islander young people surveyed had high levels of concern about suicide (compared with 11% non-Indigenous), 18% were concerned about discrimination (compared with 10% non-Indigenous) and one in five reported bullying and emotional abuse as a concern (Mission Australia, 2016). The same survey also found that young Indigenous males were more likely to report very low levels of happiness (10%) than Indigenous females (5%) or non-Indigenous youth (1.2%).
A 2014 study of 41 Aboriginal communities in the NT, WA and SA found nearly 80% of petrol sniffers were male and over half were aged 15–24 years (d'Abbs & Shaw, 2016) .
The burden of disease study found that the disease burden varied by age (AIHW, 2016f). Indigenous Australians aged 15–24 years represented 20% of the Indigenous population yet accounted for 13% of the total burden of disease for the Indigenous population. Injuries and mental and substance use disorders were the main contributors to the burden for Indigenous Australians in this age group. For Indigenous males in this age group, suicide and self-inflicted injuries, alcohol use disorders and motor vehicle traffic accidents were the leading causes of the burden. For Indigenous females in this age group, anxiety disorders, suicide and self-inflicted injuries, and depressive disorders were the leading causes of the burden.
In the 15–24 year age group, suicide and transport accidents were the leading cause of Indigenous deaths during the period 2011–15; and 64% of all deaths in this age group were males. In 2011–15, for those aged 15–24 years the Indigenous suicide rate was 3.9 times the non-Indigenous rate and transport accidents were 1.9 times the non-Indigenous rate (ABS, 2016f).
A supportive and stable home environment is a vital foundation for good health and participation in education and employment. In the 2015 Youth Survey 54% of Indigenous young people reported
moving house in the last 3 years (compared with 34% of non-Indigenous young people); and 30% reported spending time away from home because they felt they could not go back (compared with 12% of non-Indigenous young people) (Mission Australia, 2016). Family violence is a leading cause of homelessness for Indigenous women and children.
The majority of Indigenous young people reported good relationships with their family. However, a higher proportion of Indigenous young people reported concerns around family conflict (25%) compared with non-Indigenous young people (18%). Additionally, more Indigenous young people reported feeling unsafe in their neighbourhood (19%) compared with non-Indigenous young people (9%). Young people who spend time in juvenile detention are more likely to become homeless, to be unemployed, and to experience mental health issues and family violence (Mission Australia, 2016). In 2014–15, Indigenous males aged 15–24 years were 2.5 times more likely than Indigenous females of the same age to have been arrested by police in the last 5 years (23% compared with 9%), and 5% of males in this age group reported they had been incarcerated. On an average day in 2014–15, 43% of those under youth justice supervision were Indigenous. Given Indigenous youth only make up about 6% of the population aged 10–17 years, they were significantly over-represented in youth justice supervision. Young people may be supervised either in their communities or in secure detention facilities: on an average day most Indigenous youth under supervision are under community-based supervision (81%) with the remainder in detention (19%). Rates of supervision peaked for both Indigenous and non-Indigenous young people in 2010–11, before declining in subsequent years (from 213 to 180 per 10,000 for Indigenous young people, and from 17 to 12 per 10,000 for non-Indigenous young people) (see Figure 10). As at 30 June 2016, 27% of the adult prison population were also Indigenous. Disproportionate representation of Indigenous youth in contact with the justice system impacts on a range of areas including physical health and the social and emotional wellbeing of families and communities. Figure 10 Rates of young people aged 10–17 years under community-based supervision and detention, by Indigenous status, 2006–07 to 2014–15
Note: WA and the NT did not supply JJ NMDS data for 2008–09 to 2014–15 Source: AIHW Juvenile Justice National Minimum Dataset, 2014–15
Young people do not use primary health care services as frequently as other age groups. Research suggests social media and digital technologies (Rice et al, 2016), peer education (MacPhail & McKay, 2016) and ‘yarning circles’ (Duley et al, 2016) may be effective forms of health promotion for engaging with this age group. Sexual and reproductive health are particularly important during this stage of the life course. While Indigenous females aged 15–19 years have a higher fertility rate than other Australians of the same age, the
0
50
100
150
200
07 08 09 10 11 12 13 14 15
No.
per
10,
000
Year ended 30 JuneCommunity-based supervision IndigenousDetention IndigenousCommunity-based supervision Non-IndigenousDetention Non-Indigenous

Life course
13
median age of Indigenous mothers is 25 years. Teenage pregnancy can adversely affect education and employment opportunities for the mother, which in turn affects the socio-economic environment of her children.
In the 2015 Youth Survey over half of Indigenous youth placed a high personal value on physical and mental health (Mission Australia, 2016). The majority of Indigenous youth reported feeling positive overall about their lives. In 2014–15, the majority (97%) of Indigenous youth had participated in sporting, social or community activities in the previous year. In 2015, the top three sources of support reported by Indigenous youth were friends, parents and relatives/family friends (Mission Australia, 2016).
Smoking rates for Indigenous Australians were lowest for those in the 15–17 year age group (17%) compared with those aged 25–34 and 35–44 years (both 50%). Between 2002 and 2014–15, the greatest decreases in smoking rates have been in the younger age groups—from 58% to 41% for 18–24 year olds and from 33% to 17% among 15–17 year olds.
Adults (25–54 years) The burden of disease study found variation in disease burden across the life course (AIHW, 2016f). Indigenous adults aged 25–44 years represented 26% of the total Indigenous population in 2011 and contributed 30% to the total burden. For Indigenous males aged 25–44 years, alcohol use disorders were the leading contributor to the burden, followed by suicide and self-inflicted injuries and coronary heart disease. For Indigenous females in this age group, anxiety disorders and depressive disorders were the leading contributors to the burden, followed by other musculoskeletal conditions.
Mortality data for 2011–15 shows that for Indigenous Australians in the 25–34 year age group, external causes (including suicide and transport accidents) were the leading cause of death. Indigenous mortality rates due to ischaemic heart disease were 14 times those of non-Indigenous Australians in the same age group (ABS, 2016).
In the 35–54 year age groups chronic disease was the leading cause of death. In 2011–15, premature mortality rates from chronic disease (before the age of 75 years) were higher for Indigenous Australians than for non-Indigenous Australians (5 times for those aged 35–44 years and 3.7 times for those aged 45–54 years). In the 35–44 year age group in the NT, Indigenous mortality rates from chronic disease were 12 times the non-Indigenous rate (513 compared with 43 per 100,000).
In 2012–13, after adjusting for differences in the age structure of the two populations, Indigenous adults were 1.2 times as likely to have high measured blood pressure as non-Indigenous adults. For Indigenous Australians, rates started rising at younger ages and the largest gap was in the 35–44 year age group.
While hospitalisations for injury reflect hospital attendances for a condition rather than the extent of the problem in the community, injury was the second most common reason for Indigenous Australians being hospitalised (after dialysis). Indigenous hospitalisation rates for injury peaked in the 25–54 year age groups and have had a much greater impact on the young and middle-aged when compared with non-Indigenous hospitalisations for injury (with higher rates of falls for elderly people).
In the 2014–15 Social Survey, 61% of Indigenous Australians aged 15–64 years were in the labour force (see measure 2.07). For non-Indigenous Australians of working age, 77% were in the labour force according to the 2014 Survey of Education and Work. The proportion of Indigenous Australians of working age who are not in the labour force has increased from 36% in 2008 to 39% in 2014–15. In 2014–15, 48% of the Indigenous working age population were employed. This was a decline from 2008 where the employment rate peaked at 54%, but an overall increase from 1994 (38%). The non-Indigenous employment rate also declined between 2008 and
2014 (from 75% to 73%) and the gap has not changed (21 percentage points in 2008 and 24 percentage points in 2014–15).
In 2014–15, 92% of unemployed Indigenous Australians reported having difficulties finding work. Main issues reported were no jobs in local area or line of work (41%), transport problems/distance (32%) (measure 2.13), not having a driver’s licence (31%) and insufficient education/training skills (30%). For those not looking for work, the main reasons given were childcare (22%), studying or returning to study (20%) and having a long-term health condition or disability (18%).
55 years and older The role of leadership in supporting healthy families and communities is important and better measurement of this factor is needed. Leadership is a theme within the measure of community functioning (see measure 1.13) used to describe strong vision and direction from Elders (both male and female) in family and community and strong role models who make time to listen and advise.
In 2014–15, 88% of Indigenous Australians aged 55 years and over reported having at least one long-term health condition and 55% had 3 or more conditions. In 2014–15, older Indigenous Australians were less likely than younger people to report very good or excellent health: 54% in the 15–24 years age group compared with 23% in the 55 years and over age group (see Figure 11). Figure 11 Self-assessed health status by Indigenous status and age group, persons aged 15 years and over, 2014–15
Source: ABS and AIHW analysis of 2014–15 NATSISS
Mortality data for 2011–15 showed that for Indigenous males, deaths were highest in the 50–64 year age groups, while for Indigenous females deaths were highest in the 60–64 year age group. In 2015, chronic disease accounted for the majority of deaths of Indigenous Australians aged 55 years and over. Ischaemic heart disease was the leading cause of death in this age group (15%), followed by diabetes (10%) and respiratory diseases (8%) (ABS, 2016f).
The 2012–13 Health Survey included blood tests for measuring diabetes prevalence (ABS, 2014e). In 2012–13, 11% of Indigenous Australians aged 18 years and over had diabetes. Higher rates of diabetes were evident from 35 years onwards and by 55 years and over, one-third of Indigenous Australians had diabetes (see Figure 12).
5443
3527 23
63 66 62 5745
33
37
36
3433
28 25 2730
32
1319
2939 45
9 9 10 1324
0
20
40
60
80
100
15–24 25–34 35–44 45–54 55+ 15–24 25–34 35–44 45–54 55+
Per c
ent
Age group (years)
Excellent/very good Good Fair/poor
Aboriginal and TorresStrait Islander peoples
Non-IndigenousAustralians

Life course
14
Figure 12 Proportion of adults with diabetes, by Indigenous status and age, 2012–13
Source: ABS analysis of 2012–13 AATSIHS
The Aboriginal and Torres Strait Islander burden of disease study found different patterns in disease burden in the older age groups (AIHW, 2016f):
• Adults aged 45–64 years represented 15% of the Indigenouspopulation and contributed 30% of the total burden. ForIndigenous males aged 45–64 years, coronary heart disease,diabetes and lung cancer were the leading specific diseasescontributing to the burden. For Indigenous females in this agegroup, coronary heart disease, COPD and diabetes were theleading diseases contributing to the burden.
• Indigenous adults aged 65–74 years represented 2% of theIndigenous population, but accounted for 8% of the burden.Coronary heart disease, COPD, lung cancer and diabetes were themajor contributors to the burden in this age group. For males,falls was also a main contributor while for females othermusculoskeletal conditions and chronic kidney disease were alsomajor contributors to the burden.
• Adults aged 75 years and over comprised only 1% of theIndigenous population, but accounted for 5% of the total burden.Coronary heart disease, dementia, COPD, lung cancer, stroke, and diabetes were responsible for the majority of this burden in thisage group.
Longitudinal research suggests the incidence of dementia among Aboriginal and Torres Strait Islander Australians is high, and is associated with a younger onset; and prevalence of head injury (Lo Giudice et al, 2016). A recent study involving Aboriginal and Torres Strait Islander Australians aged 60 years and over from urban and regional areas resulted in a prevalence estimate for dementia of 13% (Radford et al, 2015).
Older people with a reduced degree of functional capacity require a range of services. Aged care is usually provided in combination with basic medical services, prevention, rehabilitation or palliative care services. The age for accessing the Commonwealth Home Support Program has been adjusted to take account of the younger age at which Indigenous Australians may begin to suffer from serious chronic illness. Health literacy in older adults is particularly important in managing complex health problems and responding to age-related issues in vision and hearing deterioration or impairment (CDCP, 2011).
0.13
9
18
35
0.3 0.73
5
11
0
10
20
30
40
18–24 25–34 35–44 45–54 55+
Per c
ent
Age group (years)
Aboriginal and Torres Strait Islander peoples Non-Indigenous Australians

Gender
15
Gender While many of the issues covered in this report show similarities for males and females, there are some key differences in health outcomes and determinants of health.
In 2010–12, life expectancy for Indigenous males was estimated to be 4 years lower than for Indigenous females. In addition, life expectancy for Indigenous males was estimated to be 10.6 years lower than that of non-Indigenous males and 9.5 years lower for females (see Figure 13). Figure 13 Life expectancy at birth, Indigenous and non-Indigenous Australians by sex, 2010–12
Source: ABS (2013b)
In 2011–15, infant mortality rates for Indigenous boys were 1.9 times as high as for non-Indigenous boys (6.5 per 1,000 live births compared with 3.5 per 1,000). For girls, the Indigenous rate was 1.8 times as high as for non-Indigenous girls (5.7 per 1,000 live births compared with 3.1 per 1,000).
During the period 2011–15, the mortality rate for Indigenous females was 1.7 times the rate for non-Indigenous females (888 per 100,000 compared with 510 per 100,000). The mortality rate for Indigenous males was also 1.7 times the rate for non-Indigenous males (1,110 per 100,000 compared with 658 per 100,000). The rate for Indigenous males was 1.2 times as high as for Indigenous females.
The Aboriginal and Torres Strait Islander burden of disease study found that 54% of the burden of illness and injury for Indigenous Australians was experienced by males and 46% by females (rate ratio of 1.27 times) in 2011 (AIHW, 2016f). The leading causes of the burden varied by sex: injuries were responsible for 19% of the burden for Indigenous males compared with 10% for Indigenous females. For males, injuries were ranked as the second leading cause (behind mental and substance use disorders); while for females, injuries were ranked third (behind mental and substance use disorders and cardiovascular diseases). Indigenous males experienced 68% of the burden from injuries and a greater share of the burden from cardiovascular diseases (58%), infant and congenital conditions (57%) and mental and substance use disorders (56%). Indigenous females experienced a greater share of the burden from blood and metabolic disorders (61%), musculoskeletal conditions (56%), kidney & urinary diseases (55%) and respiratory diseases (55%).
Results from the 2014–15 Social Survey showed that Indigenous females aged 15 years and over had a higher rate of self-reported disability/restrictive long-term health conditions (47%) than Indigenous males (43%).
In the period 2012–14, Indigenous females were 10.2 times more likely to have end stage kidney disease (ESKD) than non-Indigenous females (66 per 100,000 compared with 6.5 per 100,000). The incidence rate for Indigenous males was 4.6 times that for non-Indigenous males (57 per 100,000 compared with 12 per 100,000). As such, rates for Indigenous females were around 1.2 times as high as rates for Indigenous males.
In 2014–15, smoking rates for Indigenous Australian males aged 15 years and over (45%) were slightly higher than for females (40%); with recent research suggesting there are differences in the reasons why men and women take up smoking or decide to quit (Knott et al, 2016).
In 2012–13, 41% of Indigenous females aged 18 years and over drank alcohol at single occasion risky levels (binge drinking) compared with 33% of non-Indigenous females. Indigenous males were also more likely to drink at single occasion risky levels (64%) compared with non-Indigenous males (58%). The proportion for Indigenous males was higher than for Indigenous females (64% compared with 41%). Over the period 2011–15, in NSW, Qld, WA, SA and the NT combined, Indigenous males died from alcohol-related causes at 5 times the rate of non-Indigenous males (33 per 100,000 compared with 7 per 100,000), and Indigenous females at 6 times the rate for non-Indigenous females (13 per 100,000 compared with 2 per 100,000). Over the period July 2013 to June 2015, Indigenous males were hospitalised for diagnoses related to alcohol use at 4.2 times the rate for non-Indigenous males, and Indigenous females at 3.6 times the rate for non-Indigenous females.
Indigenous males aged 15 years and over were more likely to report having used a substance in the last 12 months compared with Indigenous females. Males were more likely to report having used marijuana, hashish or cannabis resin (25%) compared with females (14%) and were also more likely to report having used amphetamines or speed (6%) compared with females (3%). Females were more likely than males to report having used pain killers or analgesics for non-medical purposes (14% compared with 10%).
In 2012–13, Indigenous males aged 18 years and over were more likely to meet the physical activity guidelines for sufficient activity (43%) than Indigenous females (33%). Indigenous women aged 15 years and over had higher rates of obesity (40%) and lower rates of overweight (26%) compared with Indigenous males (34% and 31% respectively) (see Figure 14). Figure 14 Proportion of Indigenous persons aged 15 years and over by BMI category, by sex, 2012–13
Source: ABS and AIHW analysis of 2012–13 AATSIHS
69.173.7
79.783.1
0
20
40
60
80
100
Males Females
Life
exp
ecta
cy (y
ears
)
Sex
Aboriginal and Torres Strait Islander peoples Non-Indigenous Australians
2.8
31.7 31.134.3
4.2
29.326.1
40.4
0
10
20
30
40
50
Underweight Normal weight Overweight Obese
Per c
ent
BMI category
Males Females

Gender
16
The 2015 NAPLAN data shows that Indigenous girls are performing better than Indigenous boys in reading across all year levels and across all remoteness areas. For example, in very remote areas, 53% of all Indigenous girls met the national minimum standards for Year 3 reading in 2015 compared with 41% of Indigenous boys. However, there was little difference between indigenous boys and girls in numeracy results. For reading literacy on average, 15-year-old Indigenous females were about one-and-a-third years of schooling ahead of Indigenous males (Thomson, S et al, 2016). While there were no statistically significant differences between Indigenous girls and boys in mathematical literacy and scientific literacy, a recent study by Meehl and Biddle (2016) shows that Indigenous females outperform their male counterparts when maths, reading and science test scores are averaged. The gap between females and males is considerably larger for Indigenous Australians than for non-Indigenous Australians.
In 2014–15, 64% of Indigenous women aged 20–24 years had completed a Year 12 or equivalent qualification; this was slightly more than Indigenous men (60%). Indigenous women aged 20–64 years are as likely as Indigenous men to have a non-school qualification of Certificate III level or above (39% and 40% respectively), but slightly more likely to have a qualification of bachelor and above (7% and 5% respectively). Indigenous women (7%) are much less likely than non-Indigenous women (34%) to have a higher qualification.
Of Indigenous school leavers aged 17–24 years, 35% of women were fully engaged in work or study in 2011; this was substantially lower than for Indigenous men (45%). In 2011, 90% of Indigenous women aged 17–24 years who had at least one child were not fully engaged in work or study, compared with 45% of those without children.
In 2015, the Total Fertility Rate (the average number of babies born to a woman throughout her reproductive life of 15–49 years) for Indigenous women was 2.27, compared with 1.81 for all mothers (ABS, 2016a). The median age of Indigenous women who registered a birth in 2015 was 25.1 years, almost six years lower than the median age of all mothers (31.0 years). In 2014 Indigenous teenagers had a birth rate almost 6 times the non-Indigenous rate. The Indigenous teenage birth rate is at its lowest level since reporting using ABS Birth Registrations began in 2004. A recent study using the 2006–11 Australian Census Longitudinal Dataset found that a lower proportion of those with childcare responsibilities had educational attainment at Certificate level II than those without childcare responsibilities; that the disparity was greater for Indigenous than for non-Indigenous Australians; and that in the 15–24 year age group the disparity was greater for females than for males (Biddle & Crawford, 2015). Childcare responsibilities also have a significant impact on employment, particularly for women. The presence of dependent children is negatively associated with labour force participation for Australian females but not males (Belachew & Kumar, 2014).
In 2014–15, Indigenous males aged 15–64 years had higher rates of employment (54%) than Indigenous females (43%). Figure 15 shows that between 2008 and 2014–15 the employment rate for Indigenous males fell from 63% to 54%; while for Indigenous females there was no statistically significant change (46% compared with 43%). After removing CDEP employment from the trend, there was no statistically significant change in the male non-CDEP employment rate (55.3% compared with 53.9%) or the female non-CDEP employment rate (41.6% in 2008 compared with 43.3%) between 2008 and 2014–15. In 2014–15 the employment gap between Indigenous men and women was 11 percentage points, down from 18 percentage points in 1994. This is partly due to the decline of CDEP disproportionately affecting Indigenous men.
Figure 15 Employment rate, Indigenous Australians aged 15-64 years, by sex, 1994 to 2014–15 (per cent)
Source: ABS and AIHW analysis of NATSISS 1994, NATSISS 2002, 2008 and 2014–15, AATSIHS (core component) 2012-13
The most common industry of employment for Indigenous women (aged 15 and over) was Health Care and Social Assistance - 25% of employed Indigenous women reported this as the industry of their main job in 2014–15 (compared with 6% of Indigenous men). The most common industry for Indigenous men was Construction, with 16% of employed Indigenous men and only 1% of Indigenous women.
The most common occupation of employment for Indigenous women (aged 15 years and over) was Community and Personal Service Workers - 31% of employed Indigenous women reported this as the occupation of their main job in 2014–15 (compared with 13% of Indigenous men). The most common occupation for Indigenous men was Technicians and Trades Workers; for 25% of employed Indigenous men and only 6% of Indigenous women.
Indigenous women were less likely to have a very high or very low income than Indigenous men. In 2014–15, 8% of Indigenous women aged 15 and over were in the bottom 10% by personal gross weekly income; this is slightly less than for Indigenous men (12%). Only 1% of Indigenous women were in the top 10% by income, compared with 6% for Indigenous men. The proportion of Indigenous women in the middle two deciles by income (23%) was almost 10 percentage points higher than Indigenous men (14%). Over half (57%) of Indigenous women aged 18–64 years had government pensions or allowances as their main source of income in 2014–15; compared with 40% of Indigenous men.
Differences exist in the types of stressors experienced by men and women. In 2014–15, 30% of Indigenous females aged 15 years and over said they had not experienced problems due to any of 25 potentially stressful events in the last year (34% for Indigenous men). The most common stressor was the death of a friend or family member, for both Indigenous females (30%) and Indigenous males (25%). Indigenous females were less likely to have been stressed about not being able to get a job (16%) than Indigenous males (21%). Indigenous males were more likely to report trouble with the police (6% of men compared with 3% of females). Similar proportions of Aboriginal and Torres Strait Islander males and females reported alcohol or drug related problems as a stressor (9%).
47
55.9
62.7
52.8 53.9
28.9
4145.6
42.2 43.3
0
10
20
30
40
50
60
70
1994 2002 2008 2012-13 2014-15
Per c
ent
Year
Males Females

Gender
17
Indigenous women were less likely to feel safe walking alone in their local area after dark (51% compared with 83% of Indigenous men) and were less likely to feel safe at home alone after dark (79% compared with 95% of men). Indigenous females were more likely to report an experience of abuse or violent crime (4% compared to 2% of males). In non-remote areas 22% of Indigenous females reported family violence as a neighbourhood problem compared with 15% of males; while in remote areas males and females reported family violence at similar levels (49% of men and 47% of women). In remote areas the largest sex difference for neighbourhood problems was gambling, with 38% of Indigenous women reporting it a problem, 8 percentage points more than Indigenous men.
After adjusting for differences in the age structure of the two populations, Indigenous Australians were hospitalised for assault at 14 times the rate of non-Indigenous Australians. Indigenous females were 30 times as likely to have been hospitalised for assault as non-Indigenous females, and Indigenous males were 9 times as likely as non-Indigenous males. The Indigenous female rate was 53 times the non-Indigenous female rate in remote areas (and 38 times in very remote areas). In 2014–15, Indigenous female family violence-related hospitalisation rates were 32 times the rate for non-Indigenous females and the rate for Indigenous males was 23 times the rate for non-Indigenous males (SCRGSP, 2016b).
In 2014–15, 48% of Indigenous males aged 15 years and over reported that they had been charged by the police in their lifetime, and 20% had been arrested by the police in the last 5 years (compared with 23% and 9% respectively for Indigenous females). As at 30 June 2016, 90% of Indigenous prisoners were male and 10% were female. Indigenous men made up 27% of the total male prisoner population and Indigenous women represented 34% of the female prisoner population. During 2014–15 there were 4,741 Indigenous young people under youth justice supervision (AIHW, 2016ab). Females made up 20% of Indigenous young people under supervision (similar to the non-Indigenous proportion).
While similar proportions of Indigenous males (42%) and females (41%) aged 15 years and over reported that they had experienced being without a permanent place to live, the reasons behind these experiences differed. Women were more likely than men to report violence/abuse/neglect as a reason (8% compared with 3%), while men were more likely to report a work-related reason (5% compared with 2%).
Based on the 2014–15 Social Survey, Indigenous women aged 15 years and over were significantly more likely than Indigenous men to report high/very high levels of psychological distress (39% compared with 26%).
Over the period 2011–15, males made up 71% of suicides among Indigenous Australians. Rates for Indigenous males were highest among those aged 30–34 years (65 per 100,000 population), while rates for non-Indigenous males were highest among those aged 40–49 years (27 per 100,000). Rates for Indigenous females were highest among those aged 20–24 years and 35–39 years (both 26 per 100,000), while for non-Indigenous females rates were highest among those aged 45–49 years (8.7 per 100,000) (see Figure 16).
Figure 16 Mortality from suicide rates per 100,000, by Indigenous status, sex and age group, NSW, Qld, WA, SA and the NT, 2011–15
Source: AIHW and ABS analysis of National Mortality Database
Access to health care also varies by gender, with males and particularly teenage males less likely to access care. In the 2012–13 Health Survey, 40% of Indigenous males reported accessing health services in the last 2 weeks (12 months for hospital), compared with 48% of Indigenous females. However, there is a different pattern for Indigenous substance use services, with 54% of Indigenous clients being male and 46% female.
In 2014–15, for those aged 15 years and over, Indigenous women were more likely than Indigenous men to have participated in a cultural event, ceremony or organisation in the last 12 months (66% compared with 59%).
0
10
20
30
40
50
60
70
Deat
hs p
er 1
00,0
00 p
opul
atio
n
Age group (years)
Aboriginal and Torres Strait Islander people Non-Indigenous Australians
Males Females

Regional analysis
18
Regional analysis Remoteness area of residence influences the social and environmental context, including factors ranging from cultural identification and social networks through to educational and employment opportunities. Connectedness to family and community, land and sea, culture and identity have been identified as integral to health from Aboriginal and Torres Strait Islander perspectives (NAHSWP, 1989).
In 2011, around 79% of Indigenous Australians lived in regional and metropolitan areas and 21% lived in remote and very remote areas. While only 14% of Indigenous Australians lived in very remote areas, they made up a large proportion of those living in very remote areas (45%) and this pattern varies by jurisdiction (see Demographic context).
The Indigenous burden of disease study found a gradient in the burden of disease and injury by remoteness (AIHW, 2016f). Remote areas had the highest rate of Indigenous burden in 2011, followed by very remote areas. Inner regional areas had the lowest rate of total burden for Indigenous Australians. Remote areas also had the largest gap in the burden between Indigenous and non-Indigenous Australians (see Figure 17). Mental and substance use disorders was the leading contributor to overall Indigenous burden in major cities, inner regional and outer regional areas, contributing 25%, 23% and 21% of the burden respectively. Injuries were the leading contributor to overall Indigenous burden in remote and very remote areas contributing 19% of the burden. The study notes data quality concerns with the non-fatal estimates (AIHW, 2016l) page 284). Figure 17 Age-standardised disability-adjusted life year rates (per 1,000 people) by Indigenous status and remoteness, 2011
Source: AIHW (2016)
There is also a gradient by remoteness across a range of diseases. For example, measured rates of diabetes for Indigenous adults were higher in remote areas (21%) than in non-remote areas (9%) in 2012–13 (see Figure 18).
Figure 18 Proportion of Indigenous adults with diabetes by remoteness, 2012–13
Source: ABS analysis of 2012–13 AATSIHS
The incidence of patients commencing ongoing kidney replacement therapy (dialysis or kidney transplantation) for end stage kidney disease was higher for Indigenous Australians in remote (132 per 100,000) and very remote areas (133 per 100,000) than for those in major cities (29 per 100,000). For non-Indigenous Australians, rates were similar across all regions (see Figure 19). Figure 19 Age-standardised incidence of treated end stage kidney disease by Indigenous status and remoteness, 2012–14
Source: AIHW analysis of ANZDATA
There are also variations by region on a number of health risk factors. In 2014–15, Indigenous Australians aged 15 years and over living in major cities had lower current smoking rates (36%) than those living in very remote areas (53%).
Rates of overweight/obesity also vary by remoteness. In 2012–13, the proportion of Indigenous Australians aged 15 years and over who were obese ranged from 40% in inner regional areas to 32% in very remote areas.
379358
404
524
440
180209 203 217 229
0
100
200
300
400
500
600
Major cities Innerregional
Outerregional
Remote Very remote
Rate
per
1,0
00 p
opul
atio
n
Remoteness area
Aboriginal and Torres Strait Islander peoples Non-Indigenous Australians
8.3 8.6
11.9
17.8
22.8
11.1
0
5
10
15
20
25
Majorcities
Innerregional
Outerregional
Remote Veryremote
Australia
Per c
ent
Remoteness area
29 31
61
132 133
10 8 9 8 6
0
50
100
150
200
Major cities InnerRegional
OuterRegional
Remote Very Remote
Rate
per
100
,000
pop
ulat
ion
Remoteness area
Aboriginal and Torres Strait Islander peoples Non-Indigenous Australians

Regional analysis
19
Indigenous Australians aged 15 years and over living in remote areas were more likely to rate their overall life satisfaction with the highest overall score (27%) than those in non-remote areas (14%).
In 2014–15, Indigenous Australians aged 15 years and over living in remote/very remote areas were more likely to report their health as being good/excellent (80%) compared with those living in non-remote areas (73%). Note that interpretation of the self-assessed health question will be influenced by the person's view of 'health' and whether the concept is perceived holistically to include social, cultural, emotional and spiritual wellbeing, or as a biomedical concept linked to the absence of disease and incapacity (NAHSWP, 1989; Vass et al, 2011).
In 2014–15, Indigenous Australians who lived in remote areas (89%) were more likely than those in non-remote areas (70%) to recognise homelands/traditional country, and more likely to live on homelands/traditional country (44% compared with 17% respectively).
Those living in remote areas were more likely to speak an Australian Indigenous language (55%) than those living in non-remote areas (8%) and to be involved in selected cultural events, ceremonies or organisations in the last 12 months (82% and 57% respectively).
Those in remote areas were more likely to report face to face contact with family and friends living outside the household every day (66%) compared with those in non-remote areas (37%); were
more likely to provide support to relatives living outside the household (60% compared with 47%); and also more likely to have attended a funeral (81% compared with 55%).
In 2014–15, Indigenous Australians adults living in very remote areas were more likely to be in the lowest income quintile (61%) than those in major cities (25%).
Access to appropriate housing is also more difficult in remote areas. In 2014–15, half (50%) of Indigenous Australians in very remote areas lived in overcrowded households, compared with 15% in major cities. In very remote areas 37% of Indigenous households were living in dwellings with major structural problems compared with 25% of households in major cities.
In 2015, proportions of Aboriginal and Torres Strait Islander students achieving literacy and numeracy benchmarks were lower for students living in remote and very remote areas compared with metropolitan and provincial areas (see Figures 22 and 23). This relationship was also evident for non-Indigenous students, but was much less marked, resulting in a much larger gap between Indigenous and non-Indigenous results in remote areas than in metropolitan areas. For example, in 2015, 82% of all Indigenous students in metropolitan areas met or exceeded the National Minimum Standards for Year 5 reading compared with only 38% of Indigenous students in very remote areas.
Figure 22 Proportion of Indigenous Year 3 students at or above the national minimum standard in Reading, by Indigenous Area, 2015
Source: ACARA 2015
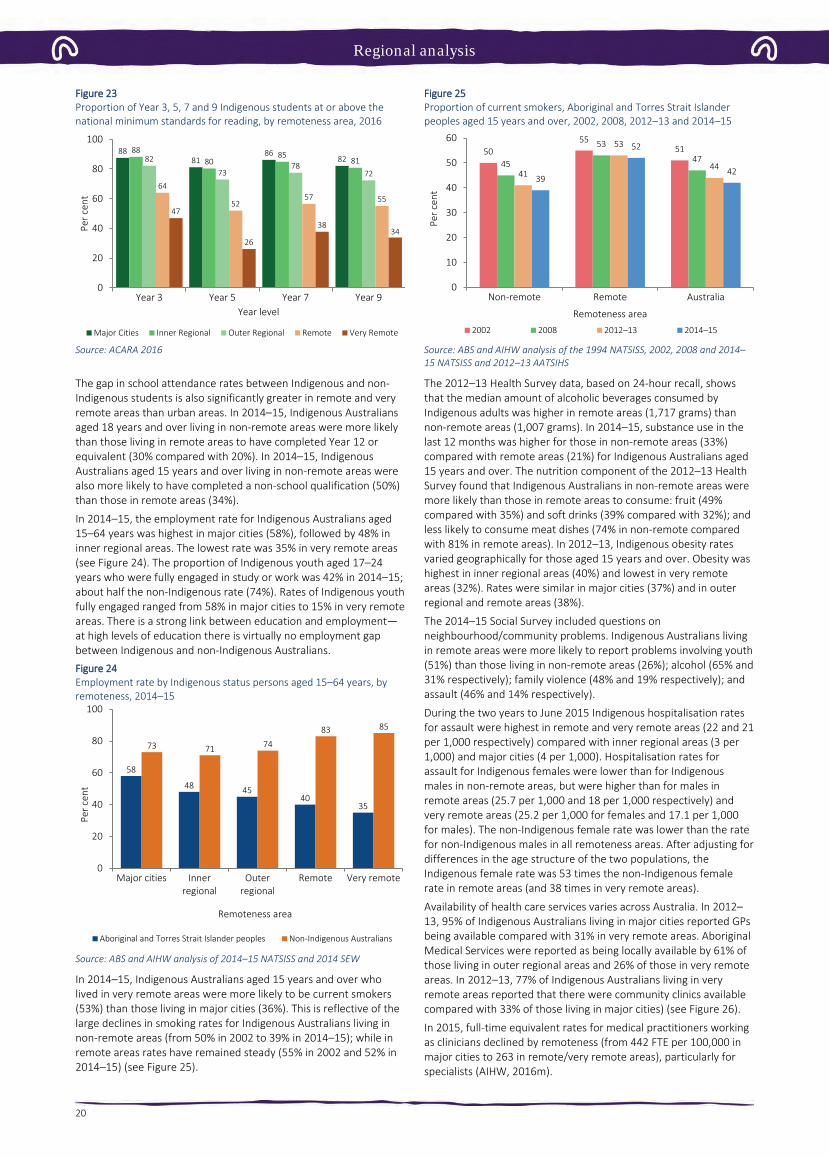
Regional analysis
20
Figure 23 Proportion of Year 3, 5, 7 and 9 Indigenous students at or above the national minimum standards for reading, by remoteness area, 2016
Source: ACARA 2016
The gap in school attendance rates between Indigenous and non-Indigenous students is also significantly greater in remote and very remote areas than urban areas. In 2014–15, Indigenous Australians aged 18 years and over living in non-remote areas were more likely than those living in remote areas to have completed Year 12 or equivalent (30% compared with 20%). In 2014–15, Indigenous Australians aged 15 years and over living in non-remote areas were also more likely to have completed a non-school qualification (50%) than those in remote areas (34%).
In 2014–15, the employment rate for Indigenous Australians aged 15–64 years was highest in major cities (58%), followed by 48% in inner regional areas. The lowest rate was 35% in very remote areas (see Figure 24). The proportion of Indigenous youth aged 17–24 years who were fully engaged in study or work was 42% in 2014–15; about half the non-Indigenous rate (74%). Rates of Indigenous youth fully engaged ranged from 58% in major cities to 15% in very remote areas. There is a strong link between education and employment—at high levels of education there is virtually no employment gap between Indigenous and non-Indigenous Australians. Figure 24 Employment rate by Indigenous status persons aged 15–64 years, by remoteness, 2014–15
Source: ABS and AIHW analysis of 2014–15 NATSISS and 2014 SEW
In 2014–15, Indigenous Australians aged 15 years and over who lived in very remote areas were more likely to be current smokers (53%) than those living in major cities (36%). This is reflective of the large declines in smoking rates for Indigenous Australians living in non-remote areas (from 50% in 2002 to 39% in 2014–15); while in remote areas rates have remained steady (55% in 2002 and 52% in 2014–15) (see Figure 25).
Figure 25 Proportion of current smokers, Aboriginal and Torres Strait Islander peoples aged 15 years and over, 2002, 2008, 2012–13 and 2014–15
Source: ABS and AIHW analysis of the 1994 NATSISS, 2002, 2008 and 2014–15 NATSISS and 2012–13 AATSIHS
The 2012–13 Health Survey data, based on 24-hour recall, shows that the median amount of alcoholic beverages consumed by Indigenous adults was higher in remote areas (1,717 grams) than non-remote areas (1,007 grams). In 2014–15, substance use in the last 12 months was higher for those in non-remote areas (33%) compared with remote areas (21%) for Indigenous Australians aged 15 years and over. The nutrition component of the 2012–13 Health Survey found that Indigenous Australians in non-remote areas were more likely than those in remote areas to consume: fruit (49% compared with 35%) and soft drinks (39% compared with 32%); and less likely to consume meat dishes (74% in non-remote compared with 81% in remote areas). In 2012–13, Indigenous obesity rates varied geographically for those aged 15 years and over. Obesity was highest in inner regional areas (40%) and lowest in very remote areas (32%). Rates were similar in major cities (37%) and in outer regional and remote areas (38%).
The 2014–15 Social Survey included questions on neighbourhood/community problems. Indigenous Australians living in remote areas were more likely to report problems involving youth (51%) than those living in non-remote areas (26%); alcohol (65% and 31% respectively); family violence (48% and 19% respectively); and assault (46% and 14% respectively).
During the two years to June 2015 Indigenous hospitalisation rates for assault were highest in remote and very remote areas (22 and 21 per 1,000 respectively) compared with inner regional areas (3 per 1,000) and major cities (4 per 1,000). Hospitalisation rates for assault for Indigenous females were lower than for Indigenous males in non-remote areas, but were higher than for males in remote areas (25.7 per 1,000 and 18 per 1,000 respectively) and very remote areas (25.2 per 1,000 for females and 17.1 per 1,000 for males). The non-Indigenous female rate was lower than the rate for non-Indigenous males in all remoteness areas. After adjusting for differences in the age structure of the two populations, the Indigenous female rate was 53 times the non-Indigenous female rate in remote areas (and 38 times in very remote areas).
Availability of health care services varies across Australia. In 2012–13, 95% of Indigenous Australians living in major cities reported GPs being available compared with 31% in very remote areas. Aboriginal Medical Services were reported as being locally available by 61% of those living in outer regional areas and 26% of those in very remote areas. In 2012–13, 77% of Indigenous Australians living in very remote areas reported that there were community clinics available compared with 33% of those living in major cities) (see Figure 26).
In 2015, full-time equivalent rates for medical practitioners working as clinicians declined by remoteness (from 442 FTE per 100,000 in major cities to 263 in remote/very remote areas), particularly for specialists (AIHW, 2016m).
8881
8682
8880
858182
7378
7264
5257 55
47
26
3834
0
20
40
60
80
100
Year 3 Year 5 Year 7 Year 9
Per c
ent
Year level
Major Cities Inner Regional Outer Regional Remote Very Remote
58
48 4540
35
73 71 74
83 85
0
20
40
60
80
100
Major cities Innerregional
Outerregional
Remote Very remote
Per c
ent
Remoteness area
Aboriginal and Torres Strait Islander peoples Non-Indigenous Australians
5055
51
45
53
47
41
53
4439
52
42
0
10
20
30
40
50
60
Non-remote Remote Australia
Per c
ent
Remoteness area2002 2008 2012–13 2014–15

Regional analysis
21
Figure 26 Available sources of health care by type, reported by Indigenous Australians, by remoteness, 2012–13
Source: ABS and AIHW analysis of 2012–13 AATSIHS
AIHW (2016p) analysis of the distribution of the clinical health workforce in relation to the Aboriginal and Torres Strait Islander population found that a higher proportion of Indigenous Australians live in areas with lower health workforce access scores than non-Indigenous Australians. It was estimated that approximately 46,200
Indigenous Australians live in areas of low relative supply of GPs (6.9% of the Indigenous population compared with 0.5% of the non-Indigenous population). The map in Figure 27 shows the areas with lowest relative supply of GPs in the dark blue and those within one hour drive time in yellow.
Figure 27 GP availability score and drive time boundaries, by SA2, 2014
Source: AIHW (2016p)
95 9488
71
31
83
41
5861
58
26
48
3340
37 36
77
42
70
8277 76
42
71
5 613 11
18
9
0
20
40
60
80
100
Major cities Inner regional Outer regional Remote Very remote Australia
Per c
ent
Remoteness area
Doctor/GP AMS Community clinic Hospital Other

Regional analysis
22
In 2012–13, Indigenous Australians living in non-remote areas (32%) were more likely to report not seeking care when needed than those living in remote areas (22%).
Medicare data shows that in 2015–16, Indigenous Australians living in remote areas had a lower rate of services claimed than those living in non-remote areas. This gradient was clear for Medicare service claim rates for GP, allied health and specialist services for both Indigenous and non-Indigenous Australians. See Figure 28 for the GP pattern. Medicare claims by Indigenous Australians for after-hours services were also highest in major cities (656 per 1,000), and lowest in remote areas (169 per 1,000). On the other hand, rates of claims for nurse/allied health services increased by remoteness for Indigenous Australians. This also reflects the types of services that are available in remote areas. Figure 28 Age-standardised rate of GP MBS services claimed through Medicare, by Indigenous status and remoteness area, 2015–16
Source: Medical Benefits Division, Department of Health
Medicare claim rates for private specialist care among Indigenous Australians were highest in major cities (582 per 1,000) and lowest in very remote areas (140 per 1,000). For GP services, Indigenous Australians claimed at a higher rate across all remoteness areas compared with non-Indigenous Australians (with the greatest difference in major cities and the smallest in very remote areas) (see Figure 29). Figure 29 Age-standardised rate of specialist MBS services claimed through Medicare, by Indigenous status and remoteness area, 2015–16
Source: Medical Benefits Division, Department of Health
In contrast, the hospitalisation data shows a different pattern. During the two years to June 2015, data from hospital records show that the hospitalisation rates for Indigenous Australians were highest in remote areas followed by very remote areas (and lowest in major cities) (see Figure 30). For non-Indigenous Australians, rates were similar across geographic areas except in very remote areas where rates were lower. The largest differences between rates for the two populations were in remote and very remote areas. Discharges from hospital against medical advice were most common for Indigenous Australians living in remote and very remote areas. Figure 30 Age-standardised hospitalisation rates (excluding dialysis) by Indigenous status and remoteness, July 2013–June 2015
Source: AIHW analysis of National Hospital Morbidity Database
0
1000
2000
3000
4000
5000
6000
7000
8000
Majorcities
Innerregional
Outerregional
Remote Veryremote
Australia
Serv
ices
per
1,0
00 p
opul
atio
n
Remoteness Area
Aboriginal and Torres Strait Islander peoples Non-Indigenous Australians
0
200
400
600
800
1000
1200
Majorcities
Innerregional
Outerregional
Remote Veryremote
Australia
Serv
ices
per
1,0
00 p
opul
atio
n
Remoteness Area
Aboriginal and Torres Strait Islander peoples Non-Indigenous Australians
0
100
200
300
400
500
600
700
Major cities Innerregional
Outerregional
Remote Very remote
Rate
per
1,0
00 p
opul
atio
n
Remoteness area
Aboriginal and Torres Strait Islander peoples Non-Indigenous Australians

Social determinants
23
Social determinants The origins of health behaviours are located in a complex range of environmental socio-economic, family and community factors. 'Inequities in health, avoidable health inequalities, arise because of the circumstances in which people grow, live, work, and age, and the systems put in place to deal with illness. The conditions in which people live and die are, in turn, shaped by political, social, and economic forces' (Nettleton et al, 2007).
Connectedness to family and community, land and sea, culture and identity have been identified as integral to health from Aboriginal and Torres Strait Islander perspectives (NAHSWP, 1989).
Studies have found that between one-third and one-half of the health gap between Aboriginal and Torres Strait Islander peoples and non-Indigenous Australians is associated with differences in socio-economic status (Booth & Carroll, 2005; DSI Consulting Pty Ltd & Benham, 2009).
Analysis by the AIHW of the 2011–13 Health Survey has found that selected social determinants such as education, employment status, overcrowding and household income accounted for 34% of the gap in health outcomes between Indigenous and non-Indigenous Australians; selected risk factors such as smoking, obesity, alcohol, and diet accounted for 19% of the gap; and that there was also overlap between social determinants and risk factors (11% of the gap) (see Figure 31). The relationships are complex and mediated by interactions with other factors. The remaining 47% are other factors that could not be explained by the model.
A recent study in the NT, of life expectancy at birth for Indigenous and non-Indigenous Australians using data from the period 1986 to 2005, found that socio-economic disadvantage was the leading risk factor accounting for one-third to one-half of the gap in life expectancy between Indigenous and non-Indigenous Australians (Zhao et al, 2013a). Figure 31 Proportions of the health gap explained by social determinants and behavioural risk factors, 2011–13
Source: AIHW (unpublished), 2016
Social determinants and health risk behaviours Factors such as education and employment interact with other social determinants of health in ways which overlap, and either grow or diminish opportunities to move along the social gradient (Marmot, 2015).
Those who have completed year 12 are more likely to be employed, and those who are employed have a regular source of income which means they are more likely to be able to afford to live in a house in good repair: these factors combined contribute to a positon of relative inequality on the health gradient (Marmot, 2015).
These determinants of health are known to be associated with modifiable risk factors, which act in various combinations, to either increase the risks for adverse health outcomes or have a protective impact on health. For example, not smoking or not smoking within
the house are both examples of reducing the health risks for children’s exposure to tobacco smoke (see measure 2.03).
The burden of disease study found that the risk factors causing the most Indigenous burden were tobacco use (12% of the total burden), alcohol use (8%), high body mass (8%), physical inactivity (6%), high blood pressure (5%) and high blood plasma glucose (5%). Dietary factors together accounted for 10% of the total burden (see Figure 32). Together, the 29 risk factors included in the study accounted for 51% of the gap in disease burden between Indigenous and non-Indigenous Australians. Tobacco use was the biggest contributor to this, accounting for 23% of the gap. Figure 32 Proportion of burden attributable to leading risk factors, Indigenous Australians, 2011
(a) Joint effect of 13 dietary risk factors. Source: AIHW, 2016
Figure 33 shows that a higher proportion of Aboriginal and Torres Strait Islander peoples who complete Year 12 are non-smokers (72%) compared with those whose highest year of schooling was Year 10 or below (52%). Figure 33 Relationship between highest year of school completed and health risk factors, Indigenous Australians aged 15 years and over, 2014–15
Source: ABS and AIHW analysis of 2014–15 NATSISS
Those who have completed Year 12 are also less likely to live in a household where smoking occurs indoors (89%) compared with those with schooling to Year 10 or below (76%). Similarly, those who were employed were more likely to be non-smokers (65%) than those who were unemployed (47%) (see Figure 34).
Gap due to other factors 46.8%
(unexplained component)
Social determinants
34.4%
Overlap between social determinants & behavioural risk factors (10.8%)
Behavioural risk factors
18.8%
12
8 8
65
10
0
2
4
6
8
10
12
14
Tobaccouse
High bodymass
Alcoholuse
Physicalinactivity
High bloodpressure
Dietaryrisks (jointeffect)(a)
Per c
ent
52
76
6872
89
73
0
20
40
60
80
100
Not a current smoker No householdexposure to smoke
Did not usesubstances in last 12
months
Per c
ent
Year 10 or below Year 12

Social determinants
24
Figure 34 Relationship between employment and risk factors, Indigenous Australians aged 15 years and over, 2014–15
Source: ABS and AIHW analysis of 2014–15 NATSISS
In 2014–15, 36% of Indigenous adults were living in households in the lowest income quintile; while 6% were in the top income quintile and 14% in the second highest. Indigenous Australians in the top two income quintiles were less likely to smoke (29%) than those in the bottom income quintile (53%). In 2014–15, 50% of Indigenous Australians aged 15 years and over were living in households that could not raise $2,000 within a week in an emergency.
Social determinants and health outcomes Alongside increased health risk behaviours, social determinants also directly affect health outcomes.
The Aboriginal and Torres Strait Islander burden of disease study found a trend of increasing rates of disease burden as socio-economic disadvantage increased (AIHW, 2016f). Figure 35 shows that Indigenous Australians living in areas with the most socio-economic disadvantage experienced the highest rate of disease burden (453 per1,000 people), more than twice the rate of burden in areas with the least socio-economic disadvantage (187 per 1,000 people) (based on the Indigenous-specific index of socio-economic disadvantage) in 2011. A gradient of increasing burden with increasing socio-economic disadvantage was observed in most disease groups. The greatest relative differences by socio-economic group were for kidney and urinary diseases, cardiovascular diseases, mental and substance use and endocrine disorders (including diabetes). Figure 35 Age-standardised disability-adjusted life year rates (per 1,000), by socio-economic disadvantage quintile, Indigenous Australians, 2011
Source: AIHW (2016)
A study of the NT population also found a linear relationship between increased risk of mortality and socio-economic disadvantage (see Figure 36) (Zhao et al, 2013c). Figure 36 Mortality rate ratios by socio-economic quintiles, NT
Source: Zhao et al. 2013b
In 2012–13, rates of high blood pressure (measured and/or self-reported) were lower for Indigenous Australians who completed school in Year 12 (18%) compared with those who completed school before Year 10 (38%). Rates were also lower for those living in the most advantaged areas (22%) compared with those in the most disadvantaged areas (28%) (see Figure 37). Rates of diabetes were also lower for those in the most socio-economically advantaged areas (9%) compared with disadvantaged areas (16%) and also for those who finished school in Year 12 (7%) compared with Year 9 or below (23%). Figure 37 Relationship between high blood pressure and social factors, Indigenous Australians, 2012–13
Source: ABS and AIHW analysis of 2012–13 AATSIHS
In 2014–15, Indigenous Australians aged 15 years and over in the top two income quintiles had higher rates of self-reported excellent/very good health status (52%) compared with those in the bottom quintile (37%). Rates were also higher for those who had completed Year 12 (50%) than for those who had finished school at Year 10 or below (34%) (see Figure 38).
In 2014–15, 76% of Indigenous Australians in the highest household income quintiles reported low/moderate psychological distress, compared with 60% of those in the lowest quintile. Those who had not experienced being without a permanent place to live were more likely to have low/moderate psychological distress (73%) compared with those who had experienced being without a permanent place to live (59%).
47
80
56
39
65
87
71
48
0
20
40
60
80
100
Not a currentsmoker
No householdexposure to
smoke
Did not usesubstances in
last 12 months
Eats fruit daily
Per c
ent
Unemployed Employed
453
376
275
185 187
0
100
200
300
400
500
1 2 3 4 5
Age-
sdt r
ate
per 1
,000
most disadvantaged → most advantagedSocioeconomic quintile
2.74
2.36
1.761.45
1.00
0
0.5
1
1.5
2
2.5
3
3.5
1 2 3 4 5
Mor
talit
y ra
te ra
tio
most disadvantaged → most advantagedSocioeconomic quintile
28
22
38
18 18
25
0
10
20
30
40
50
Mostdisadvantaged
Mostadvantaged
Year 9 Year 12 Unemployed Employed
Per c
ent
SEIFA Education Employment

Social determinants
25
Figure 38 Relationship between excellent/very good self-assessed health status and social factors, Indigenous Australians, 2014–15
Source: ABS and AIHW analysis of 2014–15 NATSISS
While smoking, drug, alcohol, and high sugar consumption are risk factors for periodontal disease, there is also strong evidence that compromised early childhood development, lower income and living in poor housing conditions contribute to oral health inequalities (Moeller & Quiñonez, 2016). Oral health can be improved through regular health checks, however cost is a major barrier for Aboriginal and Torres Strait Islander peoples, which result in patterns of dental service use to address pain rather than preventable health practices (Durey et al, 2016). Poor dental health can in turn limit success in employment outcomes (Moeller & Quiñonez, 2016), and can create additional health complications in chronic health conditions such as diabetes (Leite et al, 2013) and kidney disease (Akar et al, 2011).
Social determinants also affect use of health services. In 2012–13, Aboriginal and Torres Strait Islander peoples in the highest income quintiles were less likely than those in the lowest income quintile to visit casualty/outpatients in the last 2 weeks.
Health as a determinant of social outcomes A wide range of literature has shown evidence of the influence of health on educational and employment outcomes.
Analysis of the Longitudinal Study of Indigenous Children has found that 83% of Indigenous children with better health attended school at least 80% of the time compared with 65% of the time for children with poorer health (Arcos Holzinger & Biddle, 2015). In 2012–13, 20% of Indigenous children aged 5–14 years had days away from school in the last 2 weeks due to illness/injury. Analysis by the AIHW using 2004–05 Health Survey and 2008 Social Survey data has found
that the odds of an Indigenous child aged 5–17 years with poor self-assessed health status currently studying were one-fifth that of an Indigenous child with excellent self-assessed health status (odds ratio of 0.225) (see AIHW Detailed Analyses).
Similarly, poor health adversely affects employment. In 2014–15, 54% of Indigenous Australians aged 15 years and over with excellent/very good health status were employed compared with 31% of those with fair/poor health. Those with fair/poor health status were more likely to not be in the labour force (59%) than those with excellent/good health status (33%). Those with no long-term health conditions were more likely to be employed (50%) than those with three or more long-term health conditions (35%). In 2014–15, the main reasons Indigenous Australians aged 15 years and over outside of the labour force were not looking for a job included childcare (22%), studying or returning to study (20%) and having a long-term health condition or disability (18%).
Analysis of pooled National Health Survey data has shown a strong negative relationship between major chronic diseases and fair/poor self-assessed health status with participation in the labour force (Belachew & Kumar, 2014).
Analysis of the 2004–05 Health Survey found significant associations between most measures of health (self-assessed health, having circulatory conditions, diabetes, arthritis, disability) and employment outcomes for Indigenous Australians. For example, Indigenous Australians aged 15–64 who reported poor or fair self-assessed health were less likely to be working full-time than those not in the labour force (odds ratios of 0.110 and 0.305, respectively). Similarly, people with disability were less likely to be working full-time (odds ratio of 0.154) (see AIHW Detailed Analyses for details).
In 2014–15, 22% of Indigenous Australians aged 15 years and over reported they were a victim of physical or threatened violence in the last 12 months, 2.8 times the rate for non-Indigenous Australians (8%). Figure 39 shows the relationship between health and the experience of physical or threatened violence. Indigenous Australians with a disability/restrictive long-term health condition; those who exceeded the single occasion alcohol risk; and those who used substances in the last 12 months were more likely to have experienced physical or threatened violence in the last 12 months than those who had not experienced these conditions and risk factors. In addition, those in the lowest income quintile; those who were unemployed and those who had experienced housing insecurity were also more likely to have experienced physical or threatened violence than those without these social issues (see measure 2.10 for details).
Figure 39 Indigenous Australians aged 15 years and over, selected factors and experience of physical or threatened violence in previous 12 months, 2014–15
Source: ABS and AIHW analysis of NATSISS 2014-15
37
52
34
50
4347
0
10
20
30
40
50
60
Lowestquintile
4th/5thquintiles
Year 10 orbelow
Year 12 Unemployed Employed
Per c
ent
Income Education Employment
2517
3017
2720
3418
2619
3019
3116
0 10 20 30 40
Has disability/long term health conditionDoes not have disability/long term health condition
Current smokerNot current smoker
Exceeds single occasion alcohol riskDoes not exceed single occasion alcohol risk
Used substances in last 12 monthsDid not use substances in last 12 months
1st quintile (lowest)4th/5th quintile (highest)
UnemployedEmployed
Experienced housing insecurityHas not experienced housing insecurity
Per cent

Racism and discrimination
26
Racism and discrimination The link between self-reported perceptions or experiences of racism and poorer physical and mental health is well established (Kelaher et al, 2014; Ferdinand et al, 2012). There are a number of pathways from racism to ill-health, including: reduced access to societal resources such as education, employment, housing and medical care; inequitable exposure to risk factors including stress and cortisol dysregulation affecting mental health (anxiety and depression); immune, endocrine, cardiovascular and other physiological systems; and injury from racially motivated assault (see Figure 40) (Williams, DR & Mohammed, 2013; Paradies et al, 2013). Longitudinal and cross-sectional studies both nationally and internationally have found a strong association between experiences of racism and ill-health and psychological distress, mental health conditions, and risk behaviours such as substance use (Paradies, 2007; Gee & Walsemann, 2009; Paradies et al, 2014; Williams, CJ & Jacobs, 2009). A residual racial difference has been found in a range of health outcomes after controlling for socio-economic status (Williams, DR & Mohammed, 2009). Chronic exposure to racism leads to excessive stress, which is an established determinant of obesity, inflammation and chronic disease (Egger & Dixon, 2014). Analysis of the 2012–13 Health Survey found that Indigenous Australians with high/very high levels of psychological distress were 1.3 times as likely to report having circulatory disease and 1.8 times as likely to report having kidney disease. Recent research has found that young adult Indigenous Australians had impaired secretion of the stress hormone cortisol and that this was linked to the racial discrimination they experienced (Berger et al, 2017). Research in the US has found that supportive family environments in adolescence buffer the impact of racism, controlling for other factors (Brody et al, 2016).
Racism takes many forms:
• Interpersonal racism is the discrimination or promotion of unfairinequalities by people of one ethnic group toward people ofanother. This includes verbal or behavioural abuse.
• Internalised racism occurs where a member of a stigmatisedgroup believes racial stereotypes and accepts a position ofinferiority.
• Systematic or institutionalised racism is apparent in policies andpractices that support or create inequalities between ethnicgroups.
• Intra-personal racism is discrimination perpetrated by a memberof an ethnic group towards a member of the same group.
In the 2014–15 Social Survey, 35% of Indigenous Australians aged 15 years and over reported that they were treated unfairly in the previous 12 months because they are Aboriginal or Torres Strait Islander. Many said they had heard racial comments or jokes (23%), had been called names, teased or sworn at (14%), had been ignored or served last while accessing services or buying something (9%) or not trusted (9%) (ABS, 2016e).
In 2014, the Australian Reconciliation Barometer survey reported that Aboriginal and Torres Strait Islander people were 3 times as likely to have experienced verbal abuse in the past 6 months (31%) as the general community (13%) (Reconciliation Australia, 2015). The general community were more likely to cite the media (36%) as their main source of information about Indigenous Australians than Indigenous respondents (10%). Indigenous respondents were more likely to disagree strongly (50%) with a statement that ‘non-Indigenous Australians are superior’, than the general community (35%). However, 19% of Indigenous respondents agreed with this sentiment. Indigenous respondents were more likely than the general community to have experienced at least one form of prejudice, on the basis of their race (39%) than the general community (16%). Indigenous respondents were more likely to have experienced racial discrimination from:
• a school teacher and/or principal in the past 12 months (14%), 5times as many as the general community (3%)
• health staff (11%) and employers (13%) in the past 12 monthscompared with the general community (4% and 6% respectively)
• police (16%) and real estate agents (11%) in the past year,compared with just 4% of the general community.
Indigenous respondents were also more likely to feel that they cannot be themselves in their interactions with government (53%), or in interactions with law and order officials (54%), than the general public (35% and 32% respectively).
A recent survey on attitudes of non-Indigenous Australians (aged 25–44 years) towards Indigenous Australians (Beyond Blue, 2014) found that:
• Discrimination is commonly witnessed, with 40% seeing othersavoid Indigenous Australians on public transport and 38%witnessing verbal abuse of Indigenous Australians.
• 31% witnessed employment discrimination against IndigenousAustralians and 9% admit they themselves discriminate in thiscontext.
• 25% did not agree that discrimination has a negative personalimpact for Indigenous Australians.
• More than half (56%) believe that being an Indigenous Australianmakes it harder to succeed.
• Many believe it is acceptable to discriminate, with 21% admittingthey would move away from an Indigenous Australian if they satnearby, and 21% would watch an Indigenous Australian's actionswhen shopping.
Other studies have found self-reported experiences of racism among Aboriginal and Torres Strait Islander peoples range from 16%–97% depending on the aspects of racism researched (Paradies, 2011). A study of 755 Aboriginal Victorians reported that nearly all respondents (97%) had experienced at least one incident they perceived as racist in the preceding 12 months, with 35% reporting experiencing an incident within the past month (Ferdinand et al, 2012). Ferdinand et al. (2012) found two-thirds (67%) of Indigenous Australians who participated in their survey reported being spat at or having something thrown at them, and 84% reported being sworn at or verbally abused. Over half of those who experienced racial discrimination reported feelings of psychological distress and the risk of high or very high levels of psychological distress increased as the volume of racism increased. The research also found that about a third (29%) of respondents experienced racism in health settings, 35% in housing, 42% in employment and 67% in shops.
Experiences of racism in housing include real estate agents falsely stating that there are no rental properties available or no success in applications in comparison to other non-Indigenous applicants (Andersen et al, 2016; Nelson, J et al, 2015). Racism has also been found to be associated with mental health and aspects of physical health for Aboriginal children (Shepherd et al, 2016). A common response to experiencing racism is to subsequently avoid similar situations (Williams, DR & Mohammed, 2009). In the 2014–15 Social Survey, 14% of Indigenous Australians aged 15 years and over reported that they avoided situations due to past unfair treatment. This holds implications across health (Kelaher et al, 2014), education (Priest et al, 2014), and employment sectors (Biddle, 2013).

Racism and discrimination
27
Figure 40 Pathways between racism and ill-health, with cross references to measures within the Aboriginal and Torres Strait Islander Health Performance Framework
Source: Adapted from (Paradies, 2013)
Racial discrimination
Impact on access to goods, resources or
services
Poorer living conditions See HPF measures:
2.01 Housing 2.02 Access to functional housing with utilities
Mental health outcomes
• Anxiety • Depression• Substance use/misuse
See HPF measures:
1.18 Social and emotional wellbeing 2.16 Risky alcohol consumption 2.17 Drug and other substance use including inhalants
Psychological stress
Assault
Decreased quality of or access to health care See HPF measures:
3.14 Access to services compared with need 3.08 Cultural competency 3.06 Access to hospital procedures
Psychological symptoms See HPF measure:
1.18 Social and emotional wellbeing
Negative coping behaviours See HPF measures:
2.15 Tobacco use 2.16 Risky alcohol consumption 2.10 Community safety
Psychological stress response See HPF measure:
1.18 Social and emotional wellbeing
See HPF measure:
2.10 community safety
Physical health outcomes
• Cardiovascular disease• Decreased birth weights • Increased blood pressure• Physical injury
See HPF measures:
1.05 Circulatory disease 1.01 Low birthweight 1.07 High blood pressure 1.03 Injury and poisoning 1.02 Top reasons for hospitalisation 2.10 Community safety

Demographic context
28
Demographic context The estimated resident Aboriginal and Torres Strait Islander population of Australia as at 30 June 2011 was 669,881 people (ABS, 2013a). Using population projections for 2017, the Indigenous population was estimated to be 761,300 people, representing 3.1% of the Australian population. This proportion varies from region to region—from 29% of the population of the NT to 0.9% of the population of Victoria (see Table 1) (ABS, 2014c).
When the data are analysed as a proportion of the Indigenous population, the projected results for 2017 show that 31% of all Aboriginal and Torres Strait Islander peoples live in NSW, 29% live in Qld, 13% in WA and 10% in the NT (see Figure 41) (ABS, 2014c).
In 2011, around 79% of Indigenous Australians lived in regional and metropolitan areas. While only 14% of Indigenous Australians lived in very remote areas, they made up a large proportion of Australians living in very remote areas (45%) (see Table 2).
The age structure of the Aboriginal and Torres Strait Islander population is significantly younger than the non-Indigenous population (see Figure 42). In 2011, the median age for Indigenous Australians was 22 years compared with 38 years for non-Indigenous Australians. In 2011, 36% of Indigenous Australians were aged 0–14 years compared with 18% of non-Indigenous Australians. The younger age structure also represents a tremendous opportunity. With well-designed and competently delivered antenatal care and early childhood programmes, along with effective timely interventions helping young adults to adopt
healthy lives, there is an opportunity to reduce the gap in long-term health outcomes. While it is vital that the focus is on ensuring improvement of health for Aboriginal and Torres Strait Islander peoples across their life course, it is important to take account of demographic composition in planning for resource requirements and service delivery for Aboriginal and Torres Strait Islander peoples.
While the Indigenous population is young relative to the non-Indigenous population, it is also gradually ageing. In 2011, 36% of the Indigenous population was aged under 15 years, down from 38% in 2006. This is projected to decrease further to 32% in 2026. The share of the Indigenous population that is of workforce age (15–64 years) has risen from 58.6% in 2006 to 60.7% in 2011, and is projected to increase slightly to 61.2% in 2026. In contrast, the total Australian working age population (aged 15–64 years) was estimated to be 66.9% of the total population in 2012. This is projected to decrease to 63.6% by 2026.
The proportion of Indigenous people aged 65 years and over has increased from 3.0% in 2006 to 3.4% in 2011 and is projected to almost double to 6.4% from 2011 to 2026. A gradual demographic shift in the age profile of the Indigenous population will also have implications for service delivery, particularly for services aimed at older Indigenous Australians including aged care and planning for diseases such as cancer and dementia. The total Australian population aged 65 years and over was estimated to be 14.2% of the total population in 2012. This is projected to increase to 17.7% by 2026.
Figure 41 Aboriginal and Torres Strait Islander population by state and territory, 2017
Source: ABS population projections based on the 2011 Census (ABS, 2014)

Demographic context
29
Table 1 Projected population by jurisdiction and Indigenous status, 2017
Number of Indigenous population by
jurisdiction
Indigenous population % by jurisdiction (a)
Number of total population by jurisdiction(b)
Indigenous population as % of jurisdiction population
New South Wales 234,699 30.8 7,795,072 3.0
Victoria 55,073 7.2 6,146,277 0.9
Queensland 218,448 28.7 5,059,620 4.3
South Australia 42,406 5.6 1,744,656 2.4
Western Australia 99,697 13.1 2,835,948 3.5
Tasmania 27,682 3.6 525,336 5.3
Northern Territory 75,692 9.9 257,368 29.4
Australian Capital Territory 7,310 1.0 413,633 1.8
Australia* 761,300 100.0 24,781,121 3.1 (a) See Figure 18 (b) Indigenous plus non-Indigenous * Australia total includes ‘other Territories’Source: ABS population projections (Series B) based on the 2011 Census (ABS, 2014)
Table 2 Estimated resident population by remoteness area and Indigenous status, 2011
Number of Indigenous Australians Indigenous as % of total population
Indigenous as % of total Indigenous population
Major cities 233,146 1.5 34.8
Inner regional 147,683 3.6 22.0
Outer regional 146,129 7.2 21.8
Remote 51,275 16.3 7.7
Very remote 91,648 45.1 13.7
Australia 669,881 3.0 100.0 Source: ABS population estimates based on 2011 Census (ABS, 2013a)
Figure 42 Age distribution of Aboriginal and Torres Strait Islander peoples and non-Indigenous Australians, by Indigenous status and sex, 2017 (projections)
Source: ABS population projections based on the 2011 Census (ABS, 2014)
0 2 4 6 8 10 12 14
Females
02468101214
0-4
5-9
10-14
15-19
20-24
25-29
30-34
35-39
40-44
45-49
50-54
55-59
60-64
65-69
70-74
75+Males
Aboriginal and Torres Strait Islander peoples Non-Indigenous Australians
Per cent of total populations

Policies and strategies
30
Policies and strategies The Aboriginal and Torres Strait Islander Health Performance Framework is used to inform policy development and monitor progress in Indigenous health. An effective, efficient and equitable health system is an essential component for any whole-of-government effort to address the health of Aboriginal and Torres Strait Islander peoples. In addition, action is required in areas such as education, employment, safety and housing to achieve sustainable health gains.
The Council of Australian Governments (COAG) has committed to a number of Closing the Gap targets:
• closing the life expectancy gap within a generation by 2031 (seemeasure 1.19)
• halving the gap in mortality rates for Indigenous children underfive within a decade by 2018 (see measure 1.20)
• ensuring 95% of all Indigenous four year olds are enrolled in earlychildhood education by 2025
• closing the gap between Indigenous and non-Indigenous schoolattendance within five years by 2018 (see measure 2.04)
• halving the gap for Indigenous students in reading, writing andnumeracy within a decade by 2018 (see measure 2.04)
• halving the gap for Indigenous Australians in Year 12 attainmentor equivalent attainment rates by 2020 (see measure 2.05)
• halving the gap in employment outcomes between Indigenousand non-Indigenous Australians within a decade (see measure2.07).
The Australian Government is investing $4.9 billion in the Indigenous Advancement Strategy (IAS) from 2016–17 to 2019–20. In 2014–15, the IAS replaced more than 150 individual programmes with five streamlined programmes:
• jobs, land and economy• children and schooling• safety and wellbeing• culture and capability• remote Australia strategies.
The IAS will support the Government's priorities of getting children to school, adults into jobs and making communities safer. The Government will work in partnership with Aboriginal and Torres Strait Islander people in implementing the IAS. Communities will be at the centre of the design and delivery of local solutions to meet local needs.
The Australian Government Indigenous Australians' Health Programme commenced on 1 July 2014, consolidating four existing funding streams (primary health care base funding, child and maternal health programmes, Stronger Futures in the Northern Territory and the Aboriginal and Torres Strait Islander Chronic Disease Fund). In 2015, a capital works funding stream was also added to the programme. The aim of this programme is to improve the focus on local health needs, deliver the most effective outcomes, and better support efforts to achieve health equality between Indigenous and non-Indigenous Australians.
Chronic disease programmes provided through the Indigenous Australians' Health Programme include nationwide tobacco reduction and healthy lifestyle promotion activities, a care coordination and outreach workforce based in Primary Health Networks and Aboriginal Community Controlled Health Organisations and GP, specialist and allied health outreach services serving urban, rural and remote communities.
Additionally, the Australian Government provides GP health assessments for Aboriginal and Torres Strait Islander people under the MBS, along with follow-on care and incentive payments for improved chronic disease management, and cheaper medicines through the PBS. These programmes assist better chronic disease prevention and management by primary health care services.
Timeframes from program implementation to improved health outcomes vary (AIHW, 2014b). For example, the impact of antenatal care and health check initiatives can be seen fairly quickly after program implementation, while it can take up to 30 years for the decline in smoking rates at a population level to impact on population level cancer deaths rates. There is also a time lag to when data are available to measure those changes.
The National Aboriginal and Torres Strait Islander Health Plan 2013–2023 provides a long-term, evidence-based policy framework as part of the overarching COAG approach to Closing the Gap in Indigenous disadvantage. The key goal of the Health Plan is that ‘Aboriginal and Torres Strait Islander peoples have the right to live a healthy, safe and empowered life with a strong and healthy connection to culture and country’. The objectives of the Health Plan will be supported by the successful implementation of the IAS through early childhood initiatives and measures to address the underlying social determinants of poor health. The Health Plan also builds on other governments’ plans and strategies which support better health outcomes for Aboriginal and Torres Strait Islander people, including the COAG National Indigenous Reform Agreement and the previous National Strategic Framework for Aboriginal and Torres Strait Islander Health 2003–13.
The Implementation Plan for the National Aboriginal and Torres Strait Islander Health Plan 2013–2023 takes forward the overarching vision of the Health Plan by progressing strategies and actions that improve health outcomes for Aboriginal and Torres Strait Islander people. It outlines the actions to be taken by the Australian Government, the Aboriginal community controlled health sector, and other key stakeholders to give effect to the vision, principles, priorities and strategies of the Health Plan. The Implementation Plan is comprised of seven domains: health systems effectiveness; maternal health and parenting; childhood health and development; adolescent and youth health; healthy adults; healthy ageing; and the social and cultural determinants of health. The Implementation Plan identifies a set of 20 goals to support and complement the achievement of the COAG targets (see Figure 43). These goals will be used to measure progress towards achieving outcomes across governments, the health sector and community, and help to promote accountability. The goals deal broadly with improving the health of pregnant women, reducing smoking, tackling diabetes, providing more health checks and achieving better immunisation rates. These 20 goals relate to the three tiers of the Health Performance Framework and this is the first time that progress against the Implementation Plan goals have been reported on in this framework.
State and Territory Governments have developed Aboriginal and Torres Strait Islander health plans and strategies:
• The NSW Aboriginal health plan 2013–2023, incorporates sixstrategic directions(www.health.nsw.gov.au/aboriginal/Publications/aboriginal-health-plan-2013-2023.pdf)
• In SA, an Aboriginal Health Partnership Framework agreement2015–2020 has been signed, committing SA Health, theCommonwealth Department of Health and the Aboriginal HealthCouncil of SA to cooperate and work collaboratively on Aboriginalhealth issues such as Cancer, Diabetes and Heart and Stroke Care.
• In Victoria the Koolin Balit: Strategic Directions for AboriginalHealth 2012–2022, builds on the Victorian Health PrioritiesFramework 2012–2022. Whole-of-government strategies areoutlined in the Victorian Aboriginal Affairs Framework 2013–2018 (see www.health.vic.gov.au/aboriginalhealth).
• The WA Health Strategic Intent 2015–2020 outlines a clear visionto deliver a safe, high quality, and sustainable health system forall Western Australians. The Strategic Intent identifies AboriginalHealth Services as one of the four health strategic priorities.Furthermore, the WA Aboriginal Health and Wellbeing Framework2015–2030, which has been developed for Aboriginal people by
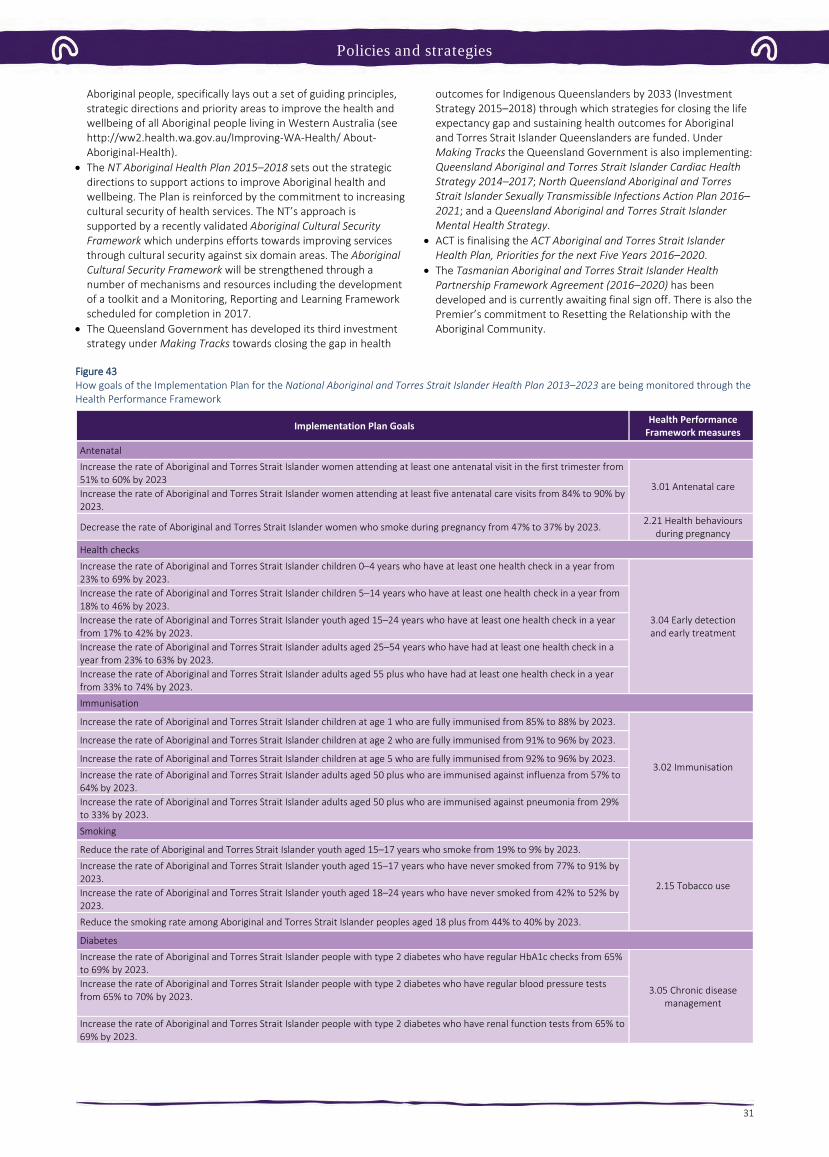
Policies and strategies
31
Aboriginal people, specifically lays out a set of guiding principles, strategic directions and priority areas to improve the health and wellbeing of all Aboriginal people living in Western Australia (see http://ww2.health.wa.gov.au/Improving-WA-Health/ About-Aboriginal-Health).
• The NT Aboriginal Health Plan 2015–2018 sets out the strategicdirections to support actions to improve Aboriginal health and wellbeing. The Plan is reinforced by the commitment to increasing cultural security of health services. The NT’s approach is supported by a recently validated Aboriginal Cultural Security Framework which underpins efforts towards improving services through cultural security against six domain areas. The Aboriginal Cultural Security Framework will be strengthened through a number of mechanisms and resources including the development of a toolkit and a Monitoring, Reporting and Learning Framework scheduled for completion in 2017.
• The Queensland Government has developed its third investmentstrategy under Making Tracks towards closing the gap in health
outcomes for Indigenous Queenslanders by 2033 (Investment Strategy 2015–2018) through which strategies for closing the life expectancy gap and sustaining health outcomes for Aboriginal and Torres Strait Islander Queenslanders are funded. Under Making Tracks the Queensland Government is also implementing: Queensland Aboriginal and Torres Strait Islander Cardiac Health Strategy 2014–2017; North Queensland Aboriginal and Torres Strait Islander Sexually Transmissible Infections Action Plan 2016–2021; and a Queensland Aboriginal and Torres Strait Islander Mental Health Strategy.
• ACT is finalising the ACT Aboriginal and Torres Strait IslanderHealth Plan, Priorities for the next Five Years 2016–2020.
• The Tasmanian Aboriginal and Torres Strait Islander HealthPartnership Framework Agreement (2016–2020) has been developed and is currently awaiting final sign off. There is also the Premier’s commitment to Resetting the Relationship with the Aboriginal Community.
Figure 43 How goals of the Implementation Plan for the National Aboriginal and Torres Strait Islander Health Plan 2013–2023 are being monitored through the Health Performance Framework
Implementation Plan Goals Health Performance Framework measures
Antenatal
Increase the rate of Aboriginal and Torres Strait Islander women attending at least one antenatal visit in the first trimester from 51% to 60% by 2023
3.01 Antenatal care Increase the rate of Aboriginal and Torres Strait Islander women attending at least five antenatal care visits from 84% to 90% by 2023.
Decrease the rate of Aboriginal and Torres Strait Islander women who smoke during pregnancy from 47% to 37% by 2023. 2.21 Health behaviours during pregnancy
Health checks
Increase the rate of Aboriginal and Torres Strait Islander children 0–4 years who have at least one health check in a year from 23% to 69% by 2023.
3.04 Early detection and early treatment
Increase the rate of Aboriginal and Torres Strait Islander children 5–14 years who have at least one health check in a year from 18% to 46% by 2023. Increase the rate of Aboriginal and Torres Strait Islander youth aged 15–24 years who have at least one health check in a year from 17% to 42% by 2023. Increase the rate of Aboriginal and Torres Strait Islander adults aged 25–54 years who have had at least one health check in a year from 23% to 63% by 2023. Increase the rate of Aboriginal and Torres Strait Islander adults aged 55 plus who have had at least one health check in a year from 33% to 74% by 2023.
Immunisation
Increase the rate of Aboriginal and Torres Strait Islander children at age 1 who are fully immunised from 85% to 88% by 2023.
3.02 Immunisation
Increase the rate of Aboriginal and Torres Strait Islander children at age 2 who are fully immunised from 91% to 96% by 2023.
Increase the rate of Aboriginal and Torres Strait Islander children at age 5 who are fully immunised from 92% to 96% by 2023.
Increase the rate of Aboriginal and Torres Strait Islander adults aged 50 plus who are immunised against influenza from 57% to 64% by 2023. Increase the rate of Aboriginal and Torres Strait Islander adults aged 50 plus who are immunised against pneumonia from 29% to 33% by 2023.
Smoking
Reduce the rate of Aboriginal and Torres Strait Islander youth aged 15–17 years who smoke from 19% to 9% by 2023.
2.15 Tobacco use
Increase the rate of Aboriginal and Torres Strait Islander youth aged 15–17 years who have never smoked from 77% to 91% by 2023. Increase the rate of Aboriginal and Torres Strait Islander youth aged 18–24 years who have never smoked from 42% to 52% by 2023.
Reduce the smoking rate among Aboriginal and Torres Strait Islander peoples aged 18 plus from 44% to 40% by 2023.
Diabetes
Increase the rate of Aboriginal and Torres Strait Islander people with type 2 diabetes who have regular HbA1c checks from 65% to 69% by 2023.
3.05 Chronic disease management
Increase the rate of Aboriginal and Torres Strait Islander people with type 2 diabetes who have regular blood pressure tests from 65% to 70% by 2023.
Increase the rate of Aboriginal and Torres Strait Islander people with type 2 diabetes who have renal function tests from 65% to 69% by 2023.

Policies and strategies
32
Child and maternal health Australian governments are investing in a range of initiatives aimed at improving child and maternal health.
The 2014–15 Budget provides funding of $94 million over three years from July 2015, for the Better Start to Life approach to expand efforts in child and maternal health. This includes:
• $54 million to increase the number of sites providing NewDirections: Mothers and Babies Services from 85 to 136. Theseservices provide Aboriginal and Torres Strait Islander families with access to antenatal care, practical advice and assistance withparenting, and health checks for children.
• $40 million to expand the Australian Nurse–Family PartnershipProgramme (ANFPP) from 3 to 13 sites. The ANFPP aims toimprove pregnancy outcomes by helping women engage in goodpreventive health practices, support parents to improve theirchild's health and development, and help parents develop avision for their own future, including continuing education andfinding work.
As part of the Women’s Safety Package, The Australian Government committed $1.1 million to enhance the ability of the ANFPP to support families who might be experiencing domestic and family violence.
The Indigenous Australians’ Health Programme has allocated $12 million over two years (from July 2016) to support the implementation of integrated early childhood services: Connected Beginnings, as recommended by the Forrest Review. The Department of Education has also allocated $30 million over three years to support the programme. The funding will support integrated health and education services for children (perinatal to school age), improving family and community engagement for both service streams. A small number of sites in rural and remote areas of Australia are being identified to trial the model.
The National Framework for Health Services for Aboriginal and Torres Strait Islander Children and Families is a guide for policy and programme development, implementation and review of evidence-based maternal, child and family health services (from pre-conception, antenatal, postnatal and early childhood health and development).
National Evidence-Based Antenatal Care Guidelines (the Guidelines) have been developed to help ensure women are provided consistent, quality, evidence-based maternity care. The Guidelines were developed with input from the Working Group for Aboriginal and Torres Strait Islander Women's Antenatal Care to provide culturally appropriate guidance and information for the health needs of Aboriginal and Torres Strait Islander pregnant women and their families. The Guidelines are intended for midwives, obstetricians, general practitioners, practice nurses, maternal and child health nurses, Aboriginal and Torres Strait Islander health workers and allied health professionals. One of the topics being reviewed/updated is the Antenatal Care of Aboriginal and Torres Strait Islander Women, focusing on how holistic care can be provided to meet spiritual, emotional, social and cultural needs as well as physical and healthcare needs. Other topics being reviewed include fetal growth and wellbeing, risk of preterm birth, and weight gain. A new topic on illicit substance use during pregnancy is also being considered.
The Australian Health Ministers' Advisory Council (AHMAC) is in the process of developing Guiding Principles for ‘Birthing on Country’ Service Model and Evaluation Framework to build upon the National Maternity Plan.
The Pregnancy, Birth and Baby helpline and website, provides information, support and counselling for women, partners and their families in relation to pregnancy and parenting.
The 2014–15 Federal Budget provides $9.2 million for the National Foetal Alcohol Spectrum Disorders (FASD) Action Plan to address the harmful impact of FASD on children and families. As part of the National FASD Action Plan, $4 million has been provided to enhance the capacity of maternal and child health services in Indigenous communities to prevent and manage FASD. Funding of $2.34 million has been committed for the development of a FASD resource package and training of New Directions: Mothers and Babies Services staff in this material.
In WA, the FASD prevention program is an alcohol in pregnancy project in the Kimberly region, run by the Ord Valley Aboriginal Health Service. The program provides education and support of antenatal clients and their families, as well as education sessions to students in the region. The success of the program can be attributed to both community investment and ownership and the willingness of the Aboriginal community to embrace change.
The National Tobacco Campaign—More Targeted Approach is aimed at reducing smoking prevalence among high-risk and hard-to-reach groups. Materials featuring Indigenous women have been included in the Quit for You, Quit for Two component, targeting pregnant women, their partners and women contemplating pregnancy.
Under the Tackling Indigenous Smoking (TIS) programme, regional grants allow for focused work on priority groups such as pregnant women and relationships with other programs for mothers and babies. Grants for three projects specifically targeting pregnant women have been awarded under the TIS innovation grant scheme.
In Tasmania, the Smoke Free Pregnancies Working Group has implemented A Smoke Free Start for Every Tasmanian Baby: A Plan for Action—2014 to 2017. The Aboriginal and Torres Strait Islander Smoking Cessation Program supports a number of smoking cessation activities in the ACT, with an emphasis on pregnant smokers and their cohabitants.
In SA, the Aboriginal Family Birthing Program (a partnership model between Aboriginal Maternal Infant Care Workers and midwives) supports Indigenous women and their families through pregnancy, childbirth and up to 6 weeks postnatally. For women in the programme, there has been a decrease in low birthweight rates, infant mortality and the proportion of Aboriginal mothers smoking during pregnancy.
In WA, the Aboriginal Maternity Group Practice programs provide outreach services for pregnant Aboriginal women. The programs are underpinned by steering groups in each district, which consist of community members and key local maternal and child health service providers. At the steering group meetings, the planning, implementation and evaluation of each of these programs is discussed and decisions are made about service delivery. The cultural governance is defined by the community participants through every aspect of the programmes’ delivery. The programmes have led to positive sustainable cultural change in practices in hospital as well as community settings.
The Collaborative Child Health, is a Birth to School Entry project in the Pilbara region, WA. Wirraka Maya allocated funding to primary prevention in Aboriginal communities; this includes conducting child health checks, hygiene sessions, ear health education, an alcohol in pregnancy intervention and the development of an outreach service to surrounding communities which results in almost 400 child health checks and 1000 immunisations per annum. Wirraka Maya also implemented the 0–5 High Risk Program across the Pilbara region which targeted children 0–5 years of age living within high risk environments.
The Koori Maternity Services programs, operating at 14 sites across Victoria, continue to increase the participation of Aboriginal women in antenatal and postnatal care services.

Policies and strategies
33
Community based pregnancy support and hospital antenatal services for young Aboriginal women and their families have continued in Tasmania. In particular, the state-wide Aboriginal Midwifery Outreach Project, with midwives based in Aboriginal health services, provides holistic antenatal and postnatal care and support, including home visits to Aboriginal women and women having Aboriginal babies.
Chronic disease All Australian governments are providing a range of programmes to support chronic disease prevention and management for Aboriginal and Torres Strait Islander peoples–see health plans and strategies above.
A National Strategic Framework for Chronic Conditions is being developed to provide guidance to all levels of government and health professionals to work towards the delivery of a more effective and coordinated national response to chronic conditions. The Framework moves away from a disease-specific approach recognising that there are often similar underlying principles for the prevention and management of many chronic conditions. It will better cater for shared health determinants, risk factors and multi-morbidities across a broad range of chronic conditions.
The Indigenous Australians' Health Program (IAHP), focuses on the prevention, early detection and management of chronic disease through expanded access to and coordination of comprehensive primary health care. Activities funded under the IAHP include nationwide tobacco reduction and healthy lifestyle promotion activities; a care coordination and outreach workforce based in Primary Health Networks and Aboriginal Medical Services; and GP, specialist and allied health outreach services that support urban, rural and remote communities.
Additionally, the Australian Government provides GP health assessments for Aboriginal and Torres Strait Islander people under the MBS, along with follow-on care and incentive payments for improved chronic disease management, and cheaper medicines through the PBS. These programmes assist better chronic disease prevention and management by primary health care services.
The Practice Incentives Program—Indigenous Health Incentive (PIP–IHI) supports general practices and Indigenous health services to provide better health care for Indigenous patients, including best practice management of chronic disease. GPs receive payments for registering with the program, for registering Indigenous patients with chronic disease and for providing best practice management of chronic disease.
The Medical Outreach Indigenous Chronic Disease Program aims to improve access to medical specialist, GP, allied and other health services for Aboriginal and Torres Strait Islander peoples. A total of $121.17 million from 2013–14 to 2016–17 has been committed for this measure.
The Quality Assurance for Aboriginal and Torres Strait Islander Medical Services program supports culturally appropriate and clinically effective management of diabetes patients in Indigenous communities. This occurs through training, technical support and quality assurance for ‘point of care’ pathology testing (e.g. HbA1c).
Education All governments have committed to increase the education achievement of Indigenous Australians. While the delivery of school education is constitutionally a state responsibility, the Australian Government provides leadership and fosters collective action to support achievement. Through COAG, governments have agreed to strategies relating to improving the quality of schools and education standards. Governments are also working to increase progress against the Closing the Gap targets for early childhood education, school attendance, literacy and numeracy achievement and Year 12 attainment.
In 2015, Commonwealth, State and Territory Education Ministers endorsed the National Aboriginal and Torres Strait Islander Education Strategy. The Strategy sets the principles and priorities to guide jurisdictions in developing and implementing localised policies to improve Aboriginal and Torres Strait Islander outcomes. It provides a series of national collaborative actions which Education ministers have agreed to, with a focus on:
• attendance and engagement• transition points including pathways to post-school options• early childhood transitions• standards to build a culturally competent teacher workforce • improvements to the Australian curriculum to provide greater
guidance on the consideration of Aboriginal and Torres StraitIslander perspectives.
Early learning The Australian Government has committed to work with state and territory governments to prioritise investment to support the integration of early childhood, maternal and child health, and family support services, with schools from July 2016 through the Connected Beginnings Programme. The aim of this programme is to ensure that Indigenous children in identified areas of high need achieve the learning and development outcomes necessary for a positive transition to school. Over time this will contribute to a reduction in the disparity in school readiness and educational outcomes between Indigenous and non-Indigenous children.
While state and territory governments are responsible for the provision of preschool education in their jurisdiction, the Australian Government provides funding to support jurisdictions in achieving universal access to quality early childhood education programs through a series of National Partnership Agreements on Universal Access to Early Childhood Education. This funding supports participation by all children in a preschool program for 600 hours per year, in the year before full-time school, delivered by an early childhood teacher who meets National Quality Framework requirements. The current National Partnership provides $840 million to states and territories to support the delivery of preschool programmes in 2016 and 2017. National Partnership arrangements include a focus on lifting the participation rates of Indigenous and vulnerable and disadvantaged children in preschool.
In December 2015, COAG agreed to a renewed Early Childhood Education Closing the Gap target (ECE CtG) for 95% of Indigenous four-year-olds to be enrolled in a quality early childhood education programme by 2025.
Schooling COAG has committed to improving educational standards and the quality of schools and has recently agreed a Closing the Gap target on school attendance (to be met by 2018) (COAG, 2014). Under constitutional arrangements, state and territory governments are responsible for ensuring all school-age children have the opportunity to enrol in a safe and supportive school that provides high quality education (SCRGSP, 2014). State and territory governments are responsible for the administration of government schools and provide the majority of the government funding for these schools. Non-government schools operate under conditions determined by state and territory government registration authorities.
The introduction of the Indigenous Advancement Strategy (IAS) in 2014 has improved the delivery of funding into Indigenous communities to support a range of children and schooling activities designed to improve children and young people’s education engagement and outcomes. Funding is largely used to support activities ‘outside the school gate’ which aim to further build children and young people’s learning capabilities. In remote Australia, the Australian Government’s Remote School Attendance
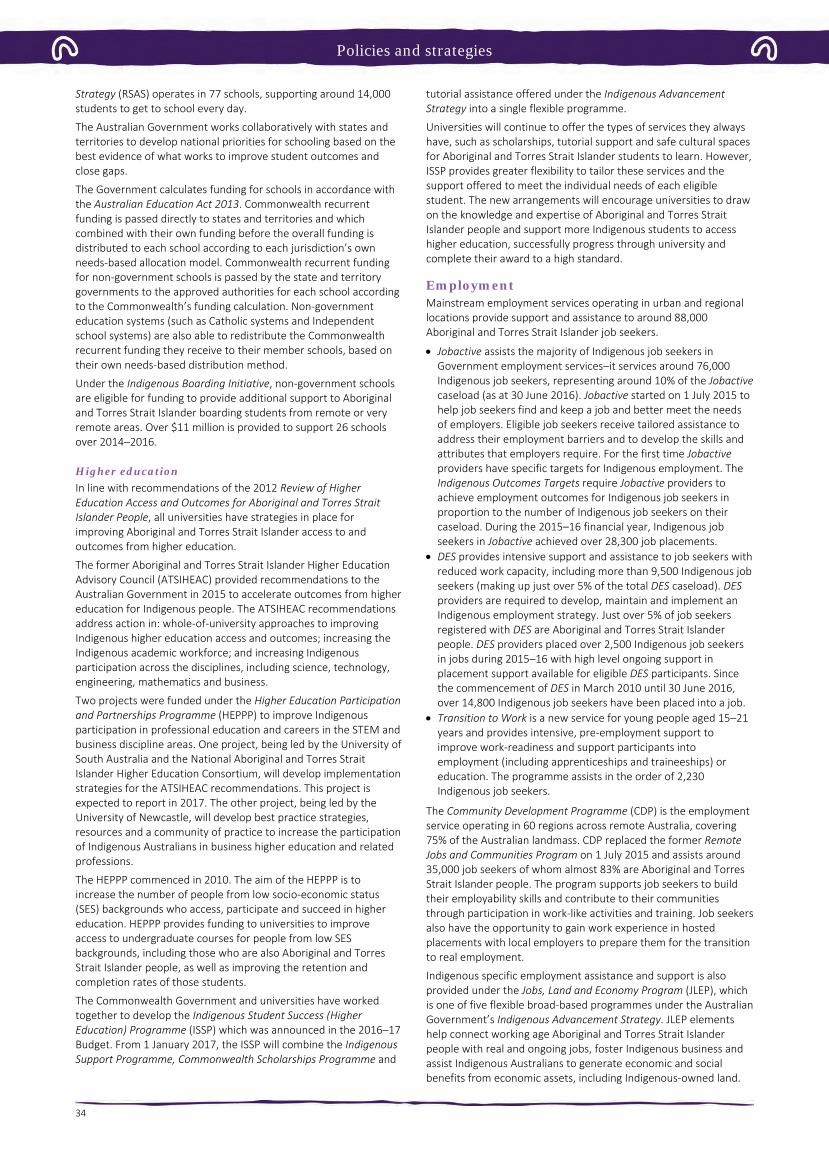
Policies and strategies
34
Strategy (RSAS) operates in 77 schools, supporting around 14,000 students to get to school every day.
The Australian Government works collaboratively with states and territories to develop national priorities for schooling based on the best evidence of what works to improve student outcomes and close gaps.
The Government calculates funding for schools in accordance with the Australian Education Act 2013. Commonwealth recurrent funding is passed directly to states and territories and which combined with their own funding before the overall funding is distributed to each school according to each jurisdiction’s own needs-based allocation model. Commonwealth recurrent funding for non-government schools is passed by the state and territory governments to the approved authorities for each school according to the Commonwealth’s funding calculation. Non-government education systems (such as Catholic systems and Independent school systems) are also able to redistribute the Commonwealth recurrent funding they receive to their member schools, based on their own needs-based distribution method.
Under the Indigenous Boarding Initiative, non-government schools are eligible for funding to provide additional support to Aboriginal and Torres Strait Islander boarding students from remote or very remote areas. Over $11 million is provided to support 26 schools over 2014–2016.
Higher education In line with recommendations of the 2012 Review of Higher Education Access and Outcomes for Aboriginal and Torres Strait Islander People, all universities have strategies in place for improving Aboriginal and Torres Strait Islander access to and outcomes from higher education.
The former Aboriginal and Torres Strait Islander Higher Education Advisory Council (ATSIHEAC) provided recommendations to the Australian Government in 2015 to accelerate outcomes from higher education for Indigenous people. The ATSIHEAC recommendations address action in: whole-of-university approaches to improving Indigenous higher education access and outcomes; increasing the Indigenous academic workforce; and increasing Indigenous participation across the disciplines, including science, technology, engineering, mathematics and business.
Two projects were funded under the Higher Education Participation and Partnerships Programme (HEPPP) to improve Indigenous participation in professional education and careers in the STEM and business discipline areas. One project, being led by the University of South Australia and the National Aboriginal and Torres Strait Islander Higher Education Consortium, will develop implementation strategies for the ATSIHEAC recommendations. This project is expected to report in 2017. The other project, being led by the University of Newcastle, will develop best practice strategies, resources and a community of practice to increase the participation of Indigenous Australians in business higher education and related professions.
The HEPPP commenced in 2010. The aim of the HEPPP is to increase the number of people from low socio-economic status (SES) backgrounds who access, participate and succeed in higher education. HEPPP provides funding to universities to improve access to undergraduate courses for people from low SES backgrounds, including those who are also Aboriginal and Torres Strait Islander people, as well as improving the retention and completion rates of those students.
The Commonwealth Government and universities have worked together to develop the Indigenous Student Success (Higher Education) Programme (ISSP) which was announced in the 2016–17 Budget. From 1 January 2017, the ISSP will combine the Indigenous Support Programme, Commonwealth Scholarships Programme and
tutorial assistance offered under the Indigenous Advancement Strategy into a single flexible programme.
Universities will continue to offer the types of services they always have, such as scholarships, tutorial support and safe cultural spaces for Aboriginal and Torres Strait Islander students to learn. However, ISSP provides greater flexibility to tailor these services and the support offered to meet the individual needs of each eligible student. The new arrangements will encourage universities to draw on the knowledge and expertise of Aboriginal and Torres Strait Islander people and support more Indigenous students to access higher education, successfully progress through university and complete their award to a high standard.
Employment Mainstream employment services operating in urban and regional locations provide support and assistance to around 88,000 Aboriginal and Torres Strait Islander job seekers.
• Jobactive assists the majority of Indigenous job seekers inGovernment employment services–it services around 76,000Indigenous job seekers, representing around 10% of the Jobactive caseload (as at 30 June 2016). Jobactive started on 1 July 2015 tohelp job seekers find and keep a job and better meet the needsof employers. Eligible job seekers receive tailored assistance toaddress their employment barriers and to develop the skills andattributes that employers require. For the first time Jobactive providers have specific targets for Indigenous employment. TheIndigenous Outcomes Targets require Jobactive providers toachieve employment outcomes for Indigenous job seekers inproportion to the number of Indigenous job seekers on theircaseload. During the 2015–16 financial year, Indigenous jobseekers in Jobactive achieved over 28,300 job placements.
• DES provides intensive support and assistance to job seekers withreduced work capacity, including more than 9,500 Indigenous jobseekers (making up just over 5% of the total DES caseload). DESproviders are required to develop, maintain and implement anIndigenous employment strategy. Just over 5% of job seekersregistered with DES are Aboriginal and Torres Strait Islanderpeople. DES providers placed over 2,500 Indigenous job seekersin jobs during 2015–16 with high level ongoing support inplacement support available for eligible DES participants. Sincethe commencement of DES in March 2010 until 30 June 2016,over 14,800 Indigenous job seekers have been placed into a job.
• Transition to Work is a new service for young people aged 15–21years and provides intensive, pre-employment support toimprove work-readiness and support participants intoemployment (including apprenticeships and traineeships) oreducation. The programme assists in the order of 2,230Indigenous job seekers.
The Community Development Programme (CDP) is the employment service operating in 60 regions across remote Australia, covering 75% of the Australian landmass. CDP replaced the former Remote Jobs and Communities Program on 1 July 2015 and assists around 35,000 job seekers of whom almost 83% are Aboriginal and Torres Strait Islander people. The program supports job seekers to build their employability skills and contribute to their communities through participation in work-like activities and training. Job seekers also have the opportunity to gain work experience in hosted placements with local employers to prepare them for the transition to real employment.
Indigenous specific employment assistance and support is also provided under the Jobs, Land and Economy Program (JLEP), which is one of five flexible broad-based programmes under the Australian Government’s Indigenous Advancement Strategy. JLEP elements help connect working age Aboriginal and Torres Strait Islander people with real and ongoing jobs, foster Indigenous business and assist Indigenous Australians to generate economic and social benefits from economic assets, including Indigenous-owned land.
Policies and strategies
35
The programme complements mainstream employment services and programmes and supported approximately 13,700 employment placements under its various elements, including CDP, during 2015–16. During this period, JLEP achieved almost 6,800 employmentoutcomes for job seekers of 26 weeks or longer. Increased employment, business and economic development is achieved through a range of JLEP elements including:
• an expanded commitment of 7,500 places through the successfulVocational Training and Employment Centres (VTEC) initiative
• the Employment Parity Initiative, targeting an additional 20,000jobs for unemployed Aboriginal and Torres Strait Islander peopleby 2020 with some of Australia’s largest employers, includingwith Woolworths and MSS
• Tailored Assistance Employment Grants, connecting working ageAboriginal and Torres Strait Islander people with real andsustainable jobs, and supporting Indigenous school students’transition from education into sustainable employment
• continued support of Indigenous rangers, with funding for 777full-time equivalent positions; Indigenous cadetships, which linkemployers with students undertaking their first undergraduatedegree; and Indigenous Enterprise Development funding tosupport Indigenous entrepreneurs or organisations to start orgrow a sustainable business
• the Indigenous Procurement Policy, which is realising significantincreases in Government contracts with majority ownedIndigenous businesses, and is supporting Indigenous people tomake the most out of their land assets and cultural knowledge
• the Commonwealth Government has committed to increasingthe representation of Indigenous employees across theCommonwealth public service to 3% by 2018 as outlined in theCommonwealth Aboriginal and Torres Strait Islander EmploymentStrategy, 1 July 2015.

Background
36
Background This is the sixth report against the Aboriginal and Torres Strait Islander Health Performance Framework (HPF)—see Figure 1.
In this report Aboriginal and Torres Strait Islander peoples are also referred to as Indigenous Australians.
The HPF comprises three tiers.
Tier 1—Health status and outcomes Measures the prevalence of health conditions including disease or injury, human function, life expectancy and wellbeing, and deaths.
Tier 2—Determinants of health Measures the determinants of health including socio-economic factors, environmental factors and health behaviours.
Tier 3—Health system performance Measures health system performance including effectiveness, responsiveness, accessibility, continuity, capability and sustainability.
The HPF covers the entire health system, including Indigenous specific services and programmes, and mainstream services. It includes performance measures across the full continuum, from inputs, processes, outputs, and intermediate outcomes to final outcomes.
Detailed Analyses The detailed statistical analysis (dynamic data displays with interactive charts and online tables), including state-specific reports that underpin the analysis in this report, are available on the Australian Institute of Health and Welfare website at:
http://www.aihw.gov.au/indigenous-data/health-performance-framework/
For this report, specific citations are included where the data comes from a report/research article and all of the other data are found in the AIHW Detailed Analyses online tables.
Key graphs and tables are shown within each performance measure with corresponding descriptions of the results in the Findings section.
Data limitations The statistics in this report are the latest available but some are several years old and therefore may not reflect the impact of recent action.
There are well-documented problems with the quality and availability of data about Aboriginal and Torres Strait Islander health. These limitations include the quality of data on all key health measures—including mortality and morbidity, uncertainty about the size and composition of the Aboriginal and Torres Strait Islander population, and a paucity of available data on other health issues such as access to health services (see the Technical Appendix for details). The following should be noted when interpreting the data analysis:
Under-identification Under-identification of Aboriginal and Torres Strait Islander people is the main issue in most administrative data collections. Under-identification is a major problem in hospital and mortality data collections, particularly for some states and territories.
The under-identification of Aboriginal and Torres Strait Islander people in administrative data collections is due to various factors, including:
• whether the question about Indigenous status is asked in the firstinstance
• issues about consistency in the way the question is asked andrecorded
• differing responses by the person involved depending on thesituation.
Decisions on which data to include have been based on the most recent evaluations (see the Technical Appendix). Work is underway to improve data quality. In future, some measures will have more comprehensive data available.
Coverage by jurisdictions Due to the under-identification issues described above, for some data collections the analysis has been limited to jurisdictions where better data quality is known to exist. Some measures presented in this report are based on an analysis of data for selected jurisdictions only. For example, mortality data are currently only published for NSW, Qld, WA, SA, and the NT.
Small and highly variable estimates The Aboriginal and Torres Strait Islander population represents 3% of the total Australian population. This can lead to very small numbers in some statistics and a high degree of variability year to year. Findings in this report are tested for statistical significance and trends and comparisons are quoted where these are significant.
Uncertainty in Indigenous population estimates Measuring the size of the Indigenous population is not easy. The Aboriginal and Torres Strait Islander Census population estimate has varied considerably over the last two decades with a 30% increase in the estimate between 2006 and 2011. Cohort analysis from one Census to the next show that these changes are not entirely due to demographic factors such as births, deaths, migration and immigration.
The population is used as the basis of rate calculations and trends have all been updated for this report based on the 2011 Census estimates—therefore historical estimates may have changed from previous HPF reports.
Inconsistencies in the Indigenous status question A standard Indigenous status question has been developed and endorsed nationally (AIHW, 2010c; ABS, 2014). However, the standard question and categories are still not used in data collections across all jurisdictions.

Background

Tier 1 Health Status and Outcomes
Health Conditions 1.01 Low birthweight 1.02 Top reasons for hospitalisation 1.03 Injury and poisoning 1.04 Respiratory disease 1.05 Circulatory disease 1.06 Acute rheumatic fever and rheumatic heart disease 1.07 High blood pressure 1.08 Cancer 1.09 Diabetes 1.10 Kidney disease 1.11 Oral health
1.12 HIV/AIDS, hepatitis and sexually transmissible
infections
Deaths 1.20 Infant and child mortality 1.21 Perinatal mortality 1.22 All causes age-standardised death rates 1.23 Leading causes of mortality 1.24 Avoidable and preventable deaths
Life Expectancy and wellbeing 1.17 Perceived health status 1.18 Social and emotional wellbeing 1.19 Life expectancy at birth
Human function 1.13 Community functioning 1.14 Disability 1.15 Ear health 1.16 Eye health
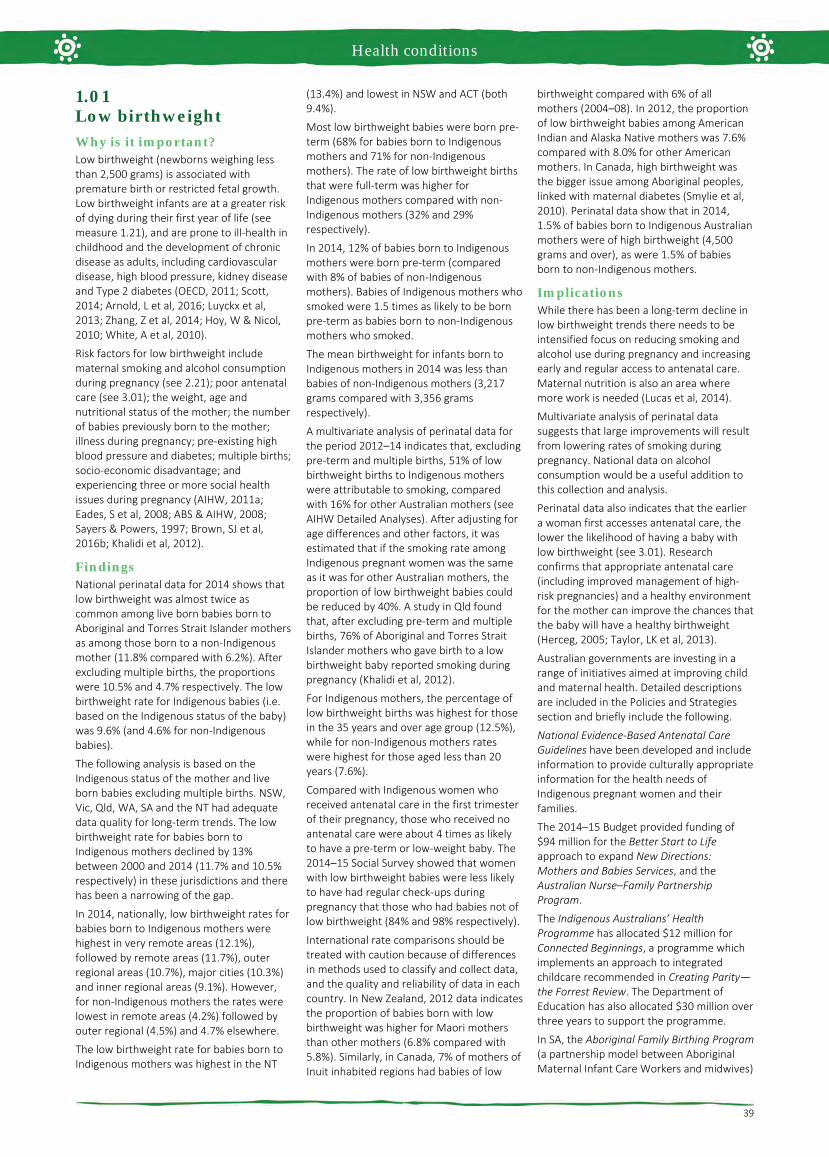
Health conditions
39
1.01 Low birthweight Why is it important? Low birthweight (newborns weighing less than 2,500 grams) is associated with premature birth or restricted fetal growth. Low birthweight infants are at a greater risk of dying during their first year of life (see measure 1.21), and are prone to ill-health in childhood and the development of chronic disease as adults, including cardiovascular disease, high blood pressure, kidney disease and Type 2 diabetes (OECD, 2011; Scott, 2014; Arnold, L et al, 2016; Luyckx et al, 2013; Zhang, Z et al, 2014; Hoy, W & Nicol, 2010; White, A et al, 2010).
Risk factors for low birthweight include maternal smoking and alcohol consumption during pregnancy (see 2.21); poor antenatal care (see 3.01); the weight, age and nutritional status of the mother; the number of babies previously born to the mother; illness during pregnancy; pre-existing high blood pressure and diabetes; multiple births; socio-economic disadvantage; and experiencing three or more social health issues during pregnancy (AIHW, 2011a; Eades, S et al, 2008; ABS & AIHW, 2008; Sayers & Powers, 1997; Brown, SJ et al, 2016b; Khalidi et al, 2012).
Findings National perinatal data for 2014 shows that low birthweight was almost twice as common among live born babies born to Aboriginal and Torres Strait Islander mothers as among those born to a non-Indigenous mother (11.8% compared with 6.2%). After excluding multiple births, the proportions were 10.5% and 4.7% respectively. The low birthweight rate for Indigenous babies (i.e. based on the Indigenous status of the baby) was 9.6% (and 4.6% for non-Indigenous babies).
The following analysis is based on the Indigenous status of the mother and live born babies excluding multiple births. NSW, Vic, Qld, WA, SA and the NT had adequate data quality for long-term trends. The low birthweight rate for babies born to Indigenous mothers declined by 13% between 2000 and 2014 (11.7% and 10.5% respectively) in these jurisdictions and there has been a narrowing of the gap.
In 2014, nationally, low birthweight rates for babies born to Indigenous mothers were highest in very remote areas (12.1%), followed by remote areas (11.7%), outer regional areas (10.7%), major cities (10.3%) and inner regional areas (9.1%). However, for non-Indigenous mothers the rates were lowest in remote areas (4.2%) followed by outer regional (4.5%) and 4.7% elsewhere.
The low birthweight rate for babies born to Indigenous mothers was highest in the NT
(13.4%) and lowest in NSW and ACT (both 9.4%).
Most low birthweight babies were born pre-term (68% for babies born to Indigenous mothers and 71% for non-Indigenous mothers). The rate of low birthweight births that were full-term was higher for Indigenous mothers compared with non-Indigenous mothers (32% and 29% respectively).
In 2014, 12% of babies born to Indigenous mothers were born pre-term (compared with 8% of babies of non-Indigenous mothers). Babies of Indigenous mothers who smoked were 1.5 times as likely to be born pre-term as babies born to non-Indigenous mothers who smoked.
The mean birthweight for infants born to Indigenous mothers in 2014 was less than babies of non-Indigenous mothers (3,217 grams compared with 3,356 grams respectively).
A multivariate analysis of perinatal data for the period 2012–14 indicates that, excluding pre-term and multiple births, 51% of low birthweight births to Indigenous mothers were attributable to smoking, compared with 16% for other Australian mothers (see AIHW Detailed Analyses). After adjusting for age differences and other factors, it was estimated that if the smoking rate among Indigenous pregnant women was the same as it was for other Australian mothers, the proportion of low birthweight babies could be reduced by 40%. A study in Qld found that, after excluding pre-term and multiple births, 76% of Aboriginal and Torres Strait Islander mothers who gave birth to a low birthweight baby reported smoking during pregnancy (Khalidi et al, 2012).
For Indigenous mothers, the percentage of low birthweight births was highest for those in the 35 years and over age group (12.5%), while for non-Indigenous mothers rates were highest for those aged less than 20 years (7.6%).
Compared with Indigenous women who received antenatal care in the first trimester of their pregnancy, those who received no antenatal care were about 4 times as likely to have a pre-term or low-weight baby. The 2014–15 Social Survey showed that women with low birthweight babies were less likely to have had regular check-ups during pregnancy that those who had babies not of low birthweight (84% and 98% respectively).
International rate comparisons should be treated with caution because of differences in methods used to classify and collect data, and the quality and reliability of data in each country. In New Zealand, 2012 data indicates the proportion of babies born with low birthweight was higher for Maori mothers than other mothers (6.8% compared with 5.8%). Similarly, in Canada, 7% of mothers of Inuit inhabited regions had babies of low
birthweight compared with 6% of all mothers (2004–08). In 2012, the proportion of low birthweight babies among American Indian and Alaska Native mothers was 7.6% compared with 8.0% for other American mothers. In Canada, high birthweight was the bigger issue among Aboriginal peoples, linked with maternal diabetes (Smylie et al, 2010). Perinatal data show that in 2014, 1.5% of babies born to Indigenous Australian mothers were of high birthweight (4,500 grams and over), as were 1.5% of babies born to non-Indigenous mothers.
Implications While there has been a long-term decline in low birthweight trends there needs to be intensified focus on reducing smoking and alcohol use during pregnancy and increasing early and regular access to antenatal care. Maternal nutrition is also an area where more work is needed (Lucas et al, 2014).
Multivariate analysis of perinatal data suggests that large improvements will result from lowering rates of smoking during pregnancy. National data on alcohol consumption would be a useful addition to this collection and analysis.
Perinatal data also indicates that the earlier a woman first accesses antenatal care, the lower the likelihood of having a baby with low birthweight (see 3.01). Research confirms that appropriate antenatal care (including improved management of high-risk pregnancies) and a healthy environment for the mother can improve the chances that the baby will have a healthy birthweight (Herceg, 2005; Taylor, LK et al, 2013).
Australian governments are investing in a range of initiatives aimed at improving child and maternal health. Detailed descriptions are included in the Policies and Strategies section and briefly include the following.
National Evidence-Based Antenatal Care Guidelines have been developed and include information to provide culturally appropriate information for the health needs of Indigenous pregnant women and their families.
The 2014–15 Budget provided funding of $94 million for the Better Start to Life approach to expand New Directions: Mothers and Babies Services, and the Australian Nurse–Family Partnership Program.
The Indigenous Australians’ Health Programme has allocated $12 million for Connected Beginnings, a programme which implements an approach to integrated childcare recommended in Creating Parity—the Forrest Review. The Department of Education has also allocated $30 million over three years to support the programme.
In SA, the Aboriginal Family Birthing Program (a partnership model between Aboriginal Maternal Infant Care Workers and midwives)

Health conditions
40
supports Aboriginal women and their families through pregnancy, childbirth and up to 6 weeks postnatally. For women in the programme, there has been a decrease in
low birthweight rates, infant mortality and the proportion of Aboriginal mothers smoking during pregnancy.
See also measures 3.01 (antenatal care) and 2.21 (health behaviours during pregnancy), particularly smoking.
Figure 1.01-1 Low birthweight per 100 live born singleton babies, by Indigenous status of mother, (NSW, Vic, Qld, WA, SA and NT), 2000 to 2014
Source: AIHW analysis of the National Perinatal Data Collection
Figure 1.01-2 Low birthweight per 100 live born singleton births, by Indigenous status of the mother and jurisdiction, 2014
Source: AIHW analysis of the National Perinatal Data Collection
Figure 1.01-3 Low birthweight per 100 live born singleton births, by maternal age and Indigenous status, 2014
Source: AIHW analysis of the National Perinatal Data Collection
Figure 1.01-4 Low birthweight per 100 live born singleton births, by Indigenous status of the mother and remoteness, 2014
Source: AIHW analysis of the National Perinatal Data Collection
0
4
8
12
16
20
00 01 02 03 04 05 06 07 08 09 10 11 12 13 14
Num
ber p
er 1
00 li
ve b
irths
Year
Babies of Aboriginal and Torres Strait Islander mothersBabies of non-Indigenous mothers
9.4
11.1
9.5
11.9 12.1
10.89.4
13.4
10.5
4.5 4.9 4.5 4.6 4.86.1
4.7 4.6 4.7
0
4
8
12
16
20
NSW Vic Qld WA SA Tas ACT NT AusN
umbe
r per
100
live
birt
hsJurisdiction
Babies of Aboriginal and Torres Strait Islander mothersBabies of non-Indigenous mothers
11.4
9.7 9.711.2
12.5
7.6
5.14.4 4.3 4.9
0
4
8
12
16
20
<20 20–24 25–29 30–34 35+
Num
ber p
er 1
00 li
ve b
irths
Age group of mother (years)
Babies of Aboriginal and Torres Strait Islander mothersBabies of non-Indigenous mothers
10.39.1
10.711.7 12.1
4.7 4.7 4.5 4.2 4.7
0
4
8
12
16
20
Major cities Innerregional
Outerregional
Remote Very remote
Num
ber
per 1
00 li
ve b
irths
Remoteness areaBabies of Aboriginal and Torres Strait Islander mothersBabies of non-Indigenous mothers

Health conditions
41
1.02 Top reasons for hospitalisation Why is it important? Hospitalisation rates indicate two main issues: the occurrence in a population of serious acute illnesses and conditions requiring admitted patient hospital treatment; and the access to and use of hospital admitted patient treatment by people with such conditions. Hospitalisation rates for a particular disease do not directly indicate the level of occurrence of that disease in the population. For diseases that usually do not cause an illness that is serious enough to require admission to hospital, a high level of occurrence will not be reflected in a high level of hospitalisations.
Hospitalisation rates are based on the number of hospital episodes rather than on the number of individual people who are hospitalised. A person who has frequent hospitalisations for the same disease is counted multiple times in the hospitalisation rate for that disease. For example, each kidney dialysis treatment is counted as a separate hospital episode, so that each person receiving 3 dialysis treatments per week contributes approximately 150 hospital episodes per year. Therefore, it is especially important to separate hospitalisation rates for dialysis from rates for other conditions. Each hospitalisation involves a principal diagnosis (i.e. the problem that was chiefly responsible for the patient's episode of care) and additional diagnoses where applicable (i.e. conditions or complaints either coexisting or arising during care). This report focuses on the principal diagnosis for each hospitalisation. Analysis of additional diagnoses is available from www.aihw.gov.au. Rates of hospitalisation are also impacted by the availability of primary care services (see measure 3.07) and other alternative services.
Findings During the two years to June 2015, there were an estimated 458,000 hospital separations for Aboriginal and Torres Strait Islander peoples (excluding dialysis). After adjusting for differences in the age structure of the two populations, Indigenous Australians were hospitalised at 1.3 times the non-Indigenous rate.
Hospital episodes of care involving dialysis accounted for 46% of all hospitalisations for Aboriginal and Torres Strait Islander peoples (compared with 12% for non-Indigenous Australians). The hospitalisation rate for dialysis among Indigenous Australians was 11 times the rate for non-Indigenous Australians (see measure 1.10). Among Indigenous Australians, injury and poisoning was the second leading cause of hospitalisation (7%), followed by pregnancy
and childbirth (6%), diseases of the respiratory system (5%) and diseases of the digestive system (5%).
Among Indigenous Australians, the highest hospitalisation rate was in the NT (517 per 1,000 population) followed by WA (470 per 1,000 population). The difference between Indigenous and non-Indigenous hospitalisation rates was highest in the NT (209 per 1,000 population) followed by WA (139 per 1,000 population). Hospitalisation rates for Indigenous Australians were highest in remote areas (597 per 1,000), lower in very remote areas (496 per 1,000) and lowest in major cities (356 per 1,000). For non-Indigenous Australians, rates were similar across geographic areas (around 316–344 per 1,000) except in very remote areas where rates were lower (291 per 1,000). The largest gaps between rates for the two populations were in remote and very remote areas.
Hospitalisation rates for Aboriginal and Torres Strait Islander peoples increased significantly over the period 2004–05 to 2014–15 (NSW, Vic, Qld, WA, SA and the NT combined). Over this period, rates increased faster for Indigenous Australians compared with non-Indigenous Australians, resulting in an increase in the difference between Indigenous and non-Indigenous hospitalisation rates. As a proportion of the increase in the numbers of Indigenous hospitalisations between the period 2004–05 to 2005–06 and the period 2013–14 to 2014–15, 53% was for dialysis. However, after excluding dialysis, 12% of the increase was for injury, followed by 12% for signs, symptoms and abnormal clinical and laboratory findings.
Hospitalisations were higher for Aboriginal and Torres Strait Islander peoples than for non-Indigenous Australians across all age groups below 65 years. The difference was greatest in the 45–54 year age group (difference of 173 separations per 1,000 population) and smallest among children aged 5–14 years (difference of 11 separations per 1,000 population). Hospitalisation rates for Indigenous Australians were highest in the 65 years and over age group. However, Indigenous rates were lower than non-Indigenous rates in this age group.
Implications In the two-year period to June 2015, there were approximately 393,200 hospital episodes for Aboriginal and Torres Strait Islander peoples for dialysis treatment. Dialysis episodes for Aboriginal and Torres Strait Islander peoples reflect the very high number of Aboriginal and Torres Strait Islander peoples with kidney failure, and the relatively low number of Aboriginal and Torres Strait Islander patients who receive kidney transplants (see measure 1.10).
Excluding dialysis, the greatest differences between hospitalisation rates for Indigenous and non-Indigenous Australians are for episodes of care due to injury and for respiratory conditions. The 30% higher overall hospitalisation rate for Aboriginal and Torres Strait Islander peoples is less than expected given the much greater occurrence of disease and injury and much higher mortality rates in this population (see measure 1.22). Until the incidence of many health problems is reduced, hospitalisation rates for Aboriginal and Torres Strait Islander peoples will not decrease. Reductions in hospitalisations will eventually occur through concerted action to reduce the incidence and prevalence of the underlying conditions, and in preventing or delaying complications, through primary health care.
State and Territory governments contribute funding for and are responsible for provision of public hospital services in Australia, including services to Indigenous Australians.
The Australian Government Indigenous Australians' Health Program (IAHP) focuses on the prevention, early detection, and management of chronic disease to help keep people out of hospital, through expanded access to and coordination of comprehensive primary health care. Other programs funded by the Australian Government that aim to reduce avoidable hospitalisations include GP health assessments for Aboriginal and Torres Strait Islander people under the MBS, which includes follow-on care. Funding is also provided for incentive payments for improved chronic disease management, and for cheaper medicines through the PBS. Hospitalisation rates will be influenced by reforms to the health system, increased rates of self-identification by Aboriginal and Torres Strait Islander people, and measures that address the social determinants of health.

Health conditions
42
Figure 1.02-1 Age-standardised hospitalisation rates (excluding dialysis) by Indigenous status, NSW, Vic, Qld, WA, SA, and the NT, 2004–05 to 2014–15
Source: AIHW analysis of National Hospital Morbidity Database
Figure 1.02-2 Age-standardised hospitalisation rates (excluding dialysis) by state/territory and Indigenous status, July 2013–June 2015
Source: AIHW analysis of National Hospital Morbidity Database
Figure 1.02-3 Age-standardised hospitalisation rates by principal diagnosis and Indigenous status, Australia, July 2013–June 2015
Source: AIHW analysis of National Hospital Morbidity Database
Figure 1.02-4 Age-specific hospitalisation rates (excluding dialysis) by Indigenous status, Australia, July 2013–June 2015
Source: AIHW analysis of National Hospital Morbidity Database
0
100
200
300
400
500
600
05 06 07 08 09 10 11 12 13 14 15
Sepa
ratio
ns p
er 1
,000
pop
ulat
ion
Year ended 30 June
Aboriginal and Torres Strait Islander peoplesNon-Indigenous Australians
0
100
200
300
400
500
600
NSW Vic Qld WA SA Tas ACT NT Aus
Sepa
ratio
ns p
er 1
,000
pop
ulat
ion
Jurisdiction
Aboriginal and Torres Strait Islander peoples Non-Indigenous Australians
134
43
25
29
17
40
18
15
19
6
6
6
44
101
59
47
41
39
38
32
28
23
15
14
11
0 50 100 150
Other
Pregnancy / childbirth
Inury
Symptoms, signs, etc.
Respiratory System
Digestive system
Circulatory system
Mental illness
Genitourinary system
Skin & tissue
Endocrine, etc
Infectious diseases
Care involving dialysis
Separations per 1,000 population
Aboriginal and Torres Strait Islander peoples Non-Indigenous Australians
472
307
100
245
354410
485
589
841
237
89
178
249 267313
469
928
0
200
400
600
800
1000
0–4 5–14 15–24 25–34 35–44 45–54 55–64 65+
Sepa
ratio
ns p
er 1
,000
pop
ulat
ion
Age group (years)
Aboriginal and Torres Strait Islander peoples Non-Indigenous Australians

Health conditions
43
1.03 Injury and poisoning Why is it important? Injuries can cause long-term disability and disadvantage including reduced opportunities in education and employment, communication impairment and burden on caregivers (Stephens et al, 2014). Indigenous Australian children suffer a disproportionately high burden of unintentional injury (Möller et al, 2017).
Findings Injury was the second leading cause of disease burden for Indigenous Australians, representing 15% of the burden; and 14% of health gap between Indigenous and non-Indigenous Australians in 2011 (AIHW, 2016f). Most injury burden was due to early death (84%); predominantly in the 15–44 year age group; and for males. Injury represented 19% of the burden for Indigenous males and 10% for Indigenous females. Suicide and self-harm accounted for 30% of the total injuries burden, followed by road traffic injuries (17%) and homicide and violence (12%).
External causes (injury and poisoning) was the third leading cause of death, accounting for 15% of deaths among Indigenous Australians in 2011–15, in the five jurisdictions with adequate data for reporting (NSW, Qld, WA, SA and the NT combined). Mortality rates for Indigenous males were twice the rate for Indigenous females. There has been no significant change since 1998. Indigenous Australians died from external causes at twice the non-Indigenous rate (after adjusting for age).
The most common external causes of Indigenous mortality were intentional self-harm (690 deaths), followed by transport accidents (434 deaths), accidental poisoning (276 deaths) and assault (200 deaths). Indigenous Australians died from intentional self-harm (suicide) and transport accidents at 2.1 and 2.6 times the rate of non-Indigenous Australians respectively. Indigenous Australians died from assault at 7.2 times the non-Indigenous rate. Aboriginal mothers died from external causes of death at rates 6.6 times non-Indigenous mothers in WA between 1983 to 2010; mainly from transport accidents (Fairthorne et al, 2016).
Based on the 2012–13 Health Survey, 19% of Indigenous Australians had experienced injuries in the 4 weeks prior to the survey, with falls (45%) and hitting or being hit by something (19%) being the most common events causing injury. The main types of injuries were open wounds (35%) and bruising (28%). Action was taken by 46% of those injured, and of those who were treated, 11% were injured while under the influence of alcohol/drugs (15 years and
over). Of those with a long-term health condition, 27% reported that it was as a result of injury or an accident. In 2012–13, Indigenous Australians (aged 15 years and over) experienced stress due to a serious accident at 1.8 times the non-Indigenous rate.
Hospitalisations for injury reflect hospital attendances for the condition rather than the extent of the problem in the community. Injury was the second most common reason for hospitalisation for Indigenous Australians (57,639 separations) in the two years to June 2015 (after dialysis). The injury hospitalisation rate among Indigenous Australians was 1.8 times the non-Indigenous rate. For non-Indigenous Australians, injury hospitalisation rates were much higher for those aged 65 years and over than in younger age groups. This reflects higher rates of falls for elderly people. There was a different pattern for Indigenous Australians: injury had a greater impact on the young and middle-aged. Rates varied across jurisdictions, with the highest rates in the NT and WA.
Injury hospitalisation rates among Indigenous Australians have increased by 38% since 2004–05 in the six jurisdictions with adequate data for trend reporting (NSW, Vic, Qld, WA, SA and the NT combined). Rates increased faster for Indigenous Australians compared with non-Indigenous Australians, resulting in an increase in the difference between the two populations.
For Indigenous males, falls were the leading cause of injury hospitalisation (20%) followed by assault (17%). For Indigenous females, assault was the leading cause (24%), followed by falls (20%). After age-standardising, hospitalisation rates for assault were much higher for Indigenous men (8.5 times as high) and Indigenous women (30 times) than for non-Indigenous men and women. Rates of hospitalisation for assault for Indigenous Australians were highest in remote (22 per 1,000) and very remote areas (21 per 1,000) and lowest in inner regional areas (3 per 1,000). Indigenous Australians are also more likely to be re-admitted to hospital as a result of interpersonal violence than other Australians (Berry, JG et al, 2009; Meuleners et al, 2008). Other leading causes of injury hospitalisation for Indigenous Australians include complications of medical care (14%), exposure to inanimate mechanical forces (13%), and transport accidents (9%). Over the period 2005–06 to 2009–10, 60% of transport-related fatal injuries among Indigenous Australians involved car occupants and 26% involved pedestrians (Henley & Harrison, 2013). Indigenous hospitalisation and mortality rates were substantially higher in Indigenous than non-Indigenous Australians, with an increase
over the period 1997–2011. This highlights the need to develop a comprehensive injury prevention strategy in the NT (Foley et al, 2014).
Based on GP survey data (2010–15), injuries accounted for 5% of all problems managed by GPs among Indigenous patients. The most common injury problems were musculoskeletal and skin injuries. After age-standardisation, the rate of injuries managed per 1,000 GP encounters was similar for Indigenous and other Australian patients (70 and 66 per 1,000 encounters respectively). While assault/harmful event accounted for only 0.2% of all problems managed by GPs for Indigenous patients, the rate per 1,000 GP encounters was 4 times that for other Australian patients.
Implications Among Indigenous Australians, suicide is the leading cause of death from external causes (see measure 1.18), followed by transport accidents (MacRae et al, 2013). Assault and falls are the most important injury Australians were 3.3 times as likely as non-Indigenous Australians to die of a transport-related injury as a car occupant.
A long-term NT study showed injury prevention issue in relation to hospitalisations (Lukaszyk et al, 2016; AIHW & Pointer, 2015). Policy responses to these varied safety issues need to be multidimensional including prevention and health care responses. Alcohol and substance use has been found to be a factor in suicide (Robinson, G et al, 2011) and transport accidents (West, C et al, 2014; Fitts et al, 2017) as well as assault (Mitchell, 2011).
An objective of the National Road Safety Strategy 2011–2020 is to ensure Indigenous Australians have access to graduated driver licensing and to safe vehicles. Most jurisdictions have either specific licensing programs for remote areas or other assistance such as mentoring and access to vehicles for learner drivers. WA has recently distributed information on safer vehicles which meet the needs of people in remote areas, online and in a brochure; and is working with Aboriginal Corporations on safer fleet vehicle purchases. There are also a number of child car safety programmes such as Buckle Up Safely (Hunter, K et al, 2016).

Health conditions
44
Figure 1.03-1 Age-standardised death rates for external causes, by Indigenous status and sex, 2011–15
Source: ABS and AIHW analysis of National Mortality Database
Figure 1.03-2 Age-specific hospitalisation rates for injury and poisoning, by Indigenous status and sex, July 2013–June 2015
Source: AIHW analysis of National Hospital Morbidity Database
Table 1.03-1 Age-standardised hospitalisations for external causes of injury and poisoning for Aboriginal and Torres Strait Islander peoples by sex and cause, July 2013–June 2015
External Cause: Males Females Persons
% Rate(a) Ratio % Rate(a) Ratio % Rate(a) Ratio
Assault 17.2 8.5 8.5 23.6 9.3 30.3 20.1 8.9 13.6
Falls 19.8 10.6 1.4 19.6 10.4 1.2 19.7 10.7 1.3
Exposure to inanimate mechanical forces 15.4 6.4 1.5 8.9 3.0 2.0 12.5 4.7 1.6
Complications of medical and surgical care 11.5 7.8 1.6 15.9 8.1 1.8 13.5 7.9 1.7
Transport accidents 11.1 4.8 1.3 6.5 2.4 1.4 9.0 3.6 1.4
Intentional self-harm 5.2 2.5 3.1 10.5 3.8 2.5 7.6 3.2 2.7
Other accidental exposures 6.8 3.3 1.0 5.7 2.4 1.2 6.3 2.9 1.0
Exposure to animate mechanical forces 5.8 2.4 2.1 3.2 1.1 1.8 4.6 1.8 2.0
Exposure to electric current/smoke/ fire/animals/nature 3.1 1.4 2.2 2.1 0.7 2.3 2.7 1.0 2.2
Accidental poisoning by and exposure to noxious substances 2.2 1.1 2.4 2.3 0.9 2.5 2.3 1.0 2.5
Other external causes 1.8 0.8 3.4 1.6 0.7 3.4 1.7 0.7 3.4
Total 100.0 49.8 1.8 100.0 43.1 2.0 100.0 46.5 1.8
Total number of hospitalisations for injury or poisoning: 31,623 26,015 57,639 (a) Per 1,000 persons, directly age-standardised using the Australian 2011 standard population. Source: AIHW analysis of National Hospital Morbidity Database
Figure 1.03-3 Age-standardised hospitalisation rates for injury and poisoning, by Indigenous status, NSW, Vic, Qld, WA, SA and the NT, 2004–05 to 2014–15
Source: AIHW analysis of National Morbidity Database
Figure 1.03-4 Age-standardised hospitalisation rates for external causes of injury and poisoning by Indigenous status and jurisdiction, July 2013–June 2015
Source: AIHW analysis of National Hospital Morbidity Database
0
5
10
15
20
25
30
35
Drowning Accidentalfalls
Assault Accidentalpoisoning
Transportaccidents
Suicide
Deat
hs p
er 1
00,0
00 p
opul
atio
n
Non-Indigenous femalesAboriginal and Torres Strait Islander femalesNon-Indigenous malesAboriginal and Torres Strait Islander males
0
10
20
30
40
50
60
05 06 07 08 09 10 11 12 13 14 15
Sepa
ratio
ns p
er 1
,000
pop
ulat
ion
Year ended 30 June
Aboriginal and Torres Strait Islander peoplesNon-Indigenous Australians
0
10
20
30
40
50
60
70
80
NSW Vic Qld WA SA Tas ACT NT Australia
Sepa
ratio
ns p
er 1
,000
pop
ulat
ion
Jurisdiction
Aboriginal and Torres Strait Islander peoples Non-Indigenous Australians
28 25
4758 64 58
4856
20 1932
26 24 24 26
52
0
20
40
60
80
0–4 5–14 15–24 25–34 35–44 45–54 55–64 65+
Males
21 16
32
51 56 49 45
58
15 12 17 14 16 1823
63
0
20
40
60
80
0-4 5-14 15-24 25-34 35-44 45-54 55-64 65+Age group (years)
Females
Aboriginal and Torres Strait Islander peoples Non-Indigenous Australians
Sepa
ratio
ns p
er 1
,000
pop
ulat
ion

Health conditions
45
1.04 Respiratory disease Why is it important? Aboriginal and Torres Strait Islander peoples experience higher mortality and morbidity from respiratory diseases such as asthma, chronic obstructive pulmonary disease (COPD) (including bronchitis and emphysema), pneumonia and invasive pneumococcal disease than other Australians.
High rates of pneumonia are associated with factors such as respiratory diseases, poor living conditions, malnutrition, smoking and alcohol misuse (Lim et al, 2014; Grau et al, 2014; Janu et al, 2014). Young children and those in older age groups are most at risk. Indigenous children in the NT have rates of radiologically confirmed pneumonia that are among the highest in the world (O'Grady, 2010).
Asthma can impact on physical functioning and attendance at school and work. It commonly coexists with other chronic conditions and low socio-economic status. Deaths due to asthma occur in all age groups, but the risk of dying from asthma increases with age.
COPD is a serious lung disease that mainly affects older people and is associated with and caused by smoking, environmental pollutants and/or childhood infectious diseases (AIHW, 2014c). Currently, 42% of Indigenous Australians aged 15 years and over smoke, 2.7 times the non-Indigenous rate (see measure 2.15). COPD is characterised by chronic obstruction of lung airflow that interferes with breathing. Previous studies have found that among Indigenous Australians aged 55 years and over hospitalised for COPD, cancer is a commonly associated condition (AIHW, 2011b; 2014c).
Findings Respiratory diseases (excluding acute infections) were responsible for 8% of the total disease burden among Indigenous Australians in 2011 (AIHW, 2016f). Asthma and COPD caused 41% and 38% of this burden respectively. The burden from respiratory diseases in Indigenous Australians occurred at a rate 2.5 times that of non-Indigenous Australians.
In 2011–15 there were 1,092 respiratory disease deaths among Indigenous Australians in NSW, Qld, WA, SA and the NT combined (8% of Indigenous deaths). This was twice the non-Indigenous rate. For respiratory deaths among Indigenous Australians, 59% were attributed to COPD, 17% to pneumonia and influenza and 4% to asthma. There has been a significant decline in respiratory disease mortality rates among Indigenous Australians since 1998.
Self-reported data on respiratory diseases is available from the 2012–13 Health Survey. In 2012–13, 31% of Indigenous Australians reported long-term respiratory diseases that had lasted 6 months or more. The most commonly reported respiratory condition was asthma (18%) followed by chronic sinusitis (8%) and COPD (4%). Asthma has increased since 2004–05 from 15% of the Indigenous population to 18% in 2012-13.
Indigenous females reported higher rates of respiratory diseases (34%) than males (28%). Indigenous Australians living in non-remote areas reported higher rates (35%) than those in remote areas (18%). Rates varied by jurisdiction from 13% in the NT to 44% in the ACT. There was also an increase with age, ranging from 21% for 0–14 year olds to 43% in the 45–54 year group.
After adjusting for differences in the age structure of the two populations, Indigenous Australians were 2.5 times as likely to report COPD and 1.9 times as likely to report asthma as non-Indigenous Australians in 2012–13.
Although hospitalisation statistics reflect separations from hospital rather than the prevalence or incidence of diseases in the community, they are a measure of the occurrence of conditions requiring acute care. Between July 2013 and June 2015, there were 43,662 hospitalisations for respiratory disease among Indigenous Australians (9.5% of Indigenous hospitalisations excluding dialysis).
After adjusting for differences in the age structure of the two populations, the Indigenous hospitalisation rate for respiratory disease was 2.4 times the non-Indigenous rate. The Indigenous hospitalisation rate was highest in the 65 years and over age group (101 per 1,000) and second highest in the 0–4 years group (78 per 1,000).
Hospitalisation rates for respiratory diseases were highest in NT (64 per 1,000) and WA (53 per 1,000). Rates in remote areas were 2.8 times the rates in major cities for Indigenous Australians but rates were similar across areas for non-Indigenous Australians. Since 2004–05, there has been an 18% increase in respiratory disease hospitalisation rates in the six jurisdictions with adequate data for trend reporting (NSW, Vic, Qld, WA, SA and the NT combined). Rates for Indigenous children aged 0–4 years increased by 24% over the same period.
In the period July 2013 to June 2015, COPD (29%) was the most common type of respiratory disease for which Indigenous Australians were hospitalised. This was followed by pneumonia (21%). The greatest differences between the two populations were for COPD and pneumonia (3.6 and 3.1 times respectively). In the period 2013–15
there were 594 notifications of invasive pneumococcal disease for Indigenous Australians, representing 13% of all cases notified.
Implications While Indigenous respiratory disease mortality rates have fallen since 1998; self-reported respiratory disease, hospitalisation and mortality rates are still twice as high for Indigenous people. Initiatives addressing smoking (including second-hand smoke), immunisation, living conditions, overcrowding, chronic disease and access to health care are likely to contribute to improvements in respiratory disease (Torzillo & Chang, 2014; Johnston et al, 2010).
A range of studies of respiratory disease services have been undertaken including a study in WA that found implementation of an integrated COPD multidisciplinary community service reduced respiratory hospitalisations in the long-term (Chung et al, 2016). A large pilot study in QLD showed the importance of working with communities and Indigenous staff in the development and delivery of a culturally appropriate and accessible specialist respiratory service (Medlin et al, 2014).
The Indigenous Australians' Health Program (IAHP) focuses on the prevention, early detection and management of chronic disease through expanded access to and coordination of comprehensive primary health care. Activities aimed at helping patients who experience respiratory disease include Tackling Indigenous Smoking and a care coordination and outreach workforce based in AMSs and mainstream services. In addition, GP health assessments for Indigenous Australians are funded under the MBS, which includes follow-on care. Funding is also provided for incentive payments for improved chronic disease management, and for cheaper medicines through the PBS. A new National Asthma Strategy is being developed which includes Indigenous Australians as a priority group.

Health conditions
46
Figure 1.04-1 Age-standardised hospitalisation rates for respiratory disease by Indigenous status and remoteness, July 2013–June 2015
Source: AIHW analysis of National Hospital Morbidity Database
Figure 1.04-2 Age-specific hospitalisation rates for respiratory disease, by Indigenous status, July 2013–June 2015
Source: AIHW analysis of National Hospital Morbidity Database
Figure 1.04-3 Age-standardised hospitalisation rates for respiratory disease, by Indigenous status, sex, and jurisdiction, July 2013–June 2015
Source: AIHW analysis of National Hospital Morbidity Database
Figure 1.04-4 Proportion reporting respiratory disease (age-standardised), by Indigenous status, 2012–13
Source: ABS and AIHW analysis of 2012-13 AATSIHS
Figure 1.04-5 Age-standardised mortality rates for respiratory diseases, by Indigenous status, NSW, Qld, WA, SA & NT, 1998 to 2015
Source: ABS and AIHW analysis of National Mortality Database
Figure 1.04-6 Deaths of Indigenous Australians by type of respiratory disease, by sex, NSW, Qld, WA, SA and the NT, 2011–15
Source: ABS and AIHW analysis of National Mortality Database
0
20
40
60
80
100
120
Majorcities
Innerregional
Outerregional
Remote Veryremote
Total
Sepa
ratio
ns p
er 1
,000
pop
ulat
ion
Remoteness area
Aboriginal and Torres Strait Islander peoples Non-Indigenous Australians
78
12 913
27
45
59
101
48
12 10 7 8 914
45
0
20
40
60
80
100
120
0–4 5–14 15–24 25–34 35–44 45–54 55–64 65+
Sepa
ratio
ns p
er 1
,000
pop
ulat
ion
Age group (years)
Aboriginal and Torres Strait Islander peoples Non-Indigenous Australians
0
10
20
30
40
50
60
70
NSW Vic Qld WA SA Tas ACT NT
Sepa
ratio
ns p
er 1
,000
pop
ulat
ion
Jurisdiction
Indigenous Males Indigenous FemalesNon-Indigenous Males Non-Indigenous Females
0
10
20
30
40
COPD Asthma Chronicsinusitis
Other Total
Per c
ent
Aboriginal and Torres Strait Islander peoples Non-Indigenous Australians
0
50
100
150
98 99 00 01 02 03 04 05 06 07 08 09 10 11 12 13 14 15
Deat
hs p
er 1
00,0
00 p
opul
atio
n
Year
Aboriginal and Torres Strait Islander peoplesNon-Indigenous Australians
336
14
10576
312
28
82 72
0
50
100
150
200
250
300
350
400
COPD Asthma Pneumonia andinfluenza
Otherrespiratory
disease
Num
ber o
f dea
ths
Cause of deathMale Female
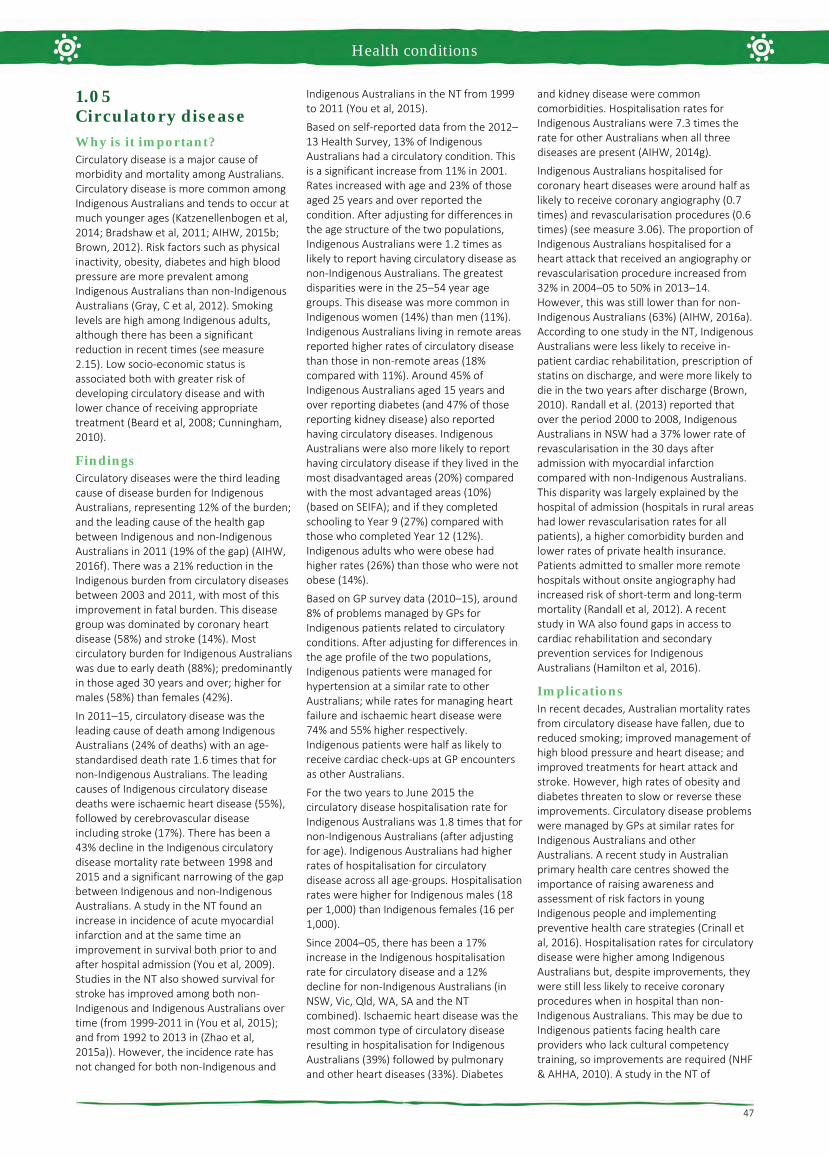
Health conditions
47
1.05 Circulatory disease Why is it important? Circulatory disease is a major cause of morbidity and mortality among Australians. Circulatory disease is more common among Indigenous Australians and tends to occur at much younger ages (Katzenellenbogen et al, 2014; Bradshaw et al, 2011; AIHW, 2015b; Brown, 2012). Risk factors such as physical inactivity, obesity, diabetes and high blood pressure are more prevalent among Indigenous Australians than non-Indigenous Australians (Gray, C et al, 2012). Smoking levels are high among Indigenous adults, although there has been a significant reduction in recent times (see measure 2.15). Low socio-economic status is associated both with greater risk of developing circulatory disease and with lower chance of receiving appropriate treatment (Beard et al, 2008; Cunningham, 2010).
Findings Circulatory diseases were the third leading cause of disease burden for Indigenous Australians, representing 12% of the burden; and the leading cause of the health gap between Indigenous and non-Indigenous Australians in 2011 (19% of the gap) (AIHW, 2016f). There was a 21% reduction in the Indigenous burden from circulatory diseases between 2003 and 2011, with most of this improvement in fatal burden. This disease group was dominated by coronary heart disease (58%) and stroke (14%). Most circulatory burden for Indigenous Australians was due to early death (88%); predominantly in those aged 30 years and over; higher for males (58%) than females (42%).
In 2011–15, circulatory disease was the leading cause of death among Indigenous Australians (24% of deaths) with an age-standardised death rate 1.6 times that for non-Indigenous Australians. The leading causes of Indigenous circulatory disease deaths were ischaemic heart disease (55%), followed by cerebrovascular disease including stroke (17%). There has been a 43% decline in the Indigenous circulatory disease mortality rate between 1998 and 2015 and a significant narrowing of the gap between Indigenous and non-Indigenous Australians. A study in the NT found an increase in incidence of acute myocardial infarction and at the same time an improvement in survival both prior to and after hospital admission (You et al, 2009). Studies in the NT also showed survival for stroke has improved among both non-Indigenous and Indigenous Australians over time (from 1999-2011 in (You et al, 2015); and from 1992 to 2013 in (Zhao et al, 2015a)). However, the incidence rate has not changed for both non-Indigenous and
Indigenous Australians in the NT from 1999 to 2011 (You et al, 2015).
Based on self-reported data from the 2012–13 Health Survey, 13% of Indigenous Australians had a circulatory condition. This is a significant increase from 11% in 2001. Rates increased with age and 23% of those aged 25 years and over reported the condition. After adjusting for differences in the age structure of the two populations, Indigenous Australians were 1.2 times as likely to report having circulatory disease as non-Indigenous Australians. The greatest disparities were in the 25–54 year age groups. This disease was more common in Indigenous women (14%) than men (11%). Indigenous Australians living in remote areas reported higher rates of circulatory disease than those in non-remote areas (18% compared with 11%). Around 45% of Indigenous Australians aged 15 years and over reporting diabetes (and 47% of those reporting kidney disease) also reported having circulatory diseases. Indigenous Australians were also more likely to report having circulatory disease if they lived in the most disadvantaged areas (20%) compared with the most advantaged areas (10%) (based on SEIFA); and if they completed schooling to Year 9 (27%) compared with those who completed Year 12 (12%). Indigenous adults who were obese had higher rates (26%) than those who were not obese (14%).
Based on GP survey data (2010–15), around 8% of problems managed by GPs for Indigenous patients related to circulatory conditions. After adjusting for differences in the age profile of the two populations, Indigenous patients were managed for hypertension at a similar rate to other Australians; while rates for managing heart failure and ischaemic heart disease were 74% and 55% higher respectively. Indigenous patients were half as likely to receive cardiac check-ups at GP encounters as other Australians.
For the two years to June 2015 the circulatory disease hospitalisation rate for Indigenous Australians was 1.8 times that for non-Indigenous Australians (after adjusting for age). Indigenous Australians had higher rates of hospitalisation for circulatory disease across all age-groups. Hospitalisation rates were higher for Indigenous males (18 per 1,000) than Indigenous females (16 per 1,000).
Since 2004–05, there has been a 17% increase in the Indigenous hospitalisation rate for circulatory disease and a 12% decline for non-Indigenous Australians (in NSW, Vic, Qld, WA, SA and the NT combined). Ischaemic heart disease was the most common type of circulatory disease resulting in hospitalisation for Indigenous Australians (39%) followed by pulmonary and other heart diseases (33%). Diabetes
and kidney disease were common comorbidities. Hospitalisation rates for Indigenous Australians were 7.3 times the rate for other Australians when all three diseases are present (AIHW, 2014g).
Indigenous Australians hospitalised for coronary heart diseases were around half as likely to receive coronary angiography (0.7 times) and revascularisation procedures (0.6 times) (see measure 3.06). The proportion of Indigenous Australians hospitalised for a heart attack that received an angiography or revascularisation procedure increased from 32% in 2004–05 to 50% in 2013–14. However, this was still lower than for non-Indigenous Australians (63%) (AIHW, 2016a). According to one study in the NT, Indigenous Australians were less likely to receive in-patient cardiac rehabilitation, prescription of statins on discharge, and were more likely to die in the two years after discharge (Brown, 2010). Randall et al. (2013) reported that over the period 2000 to 2008, Indigenous Australians in NSW had a 37% lower rate of revascularisation in the 30 days after admission with myocardial infarction compared with non-Indigenous Australians. This disparity was largely explained by the hospital of admission (hospitals in rural areas had lower revascularisation rates for all patients), a higher comorbidity burden and lower rates of private health insurance. Patients admitted to smaller more remote hospitals without onsite angiography had increased risk of short-term and long-term mortality (Randall et al, 2012). A recent study in WA also found gaps in access to cardiac rehabilitation and secondary prevention services for Indigenous Australians (Hamilton et al, 2016).
Implications In recent decades, Australian mortality rates from circulatory disease have fallen, due to reduced smoking; improved management of high blood pressure and heart disease; and improved treatments for heart attack and stroke. However, high rates of obesity and diabetes threaten to slow or reverse these improvements. Circulatory disease problems were managed by GPs at similar rates for Indigenous Australians and other Australians. A recent study in Australian primary health care centres showed the importance of raising awareness and assessment of risk factors in young Indigenous people and implementing preventive health care strategies (Crinall et al, 2016). Hospitalisation rates for circulatory disease were higher among Indigenous Australians but, despite improvements, they were still less likely to receive coronary procedures when in hospital than non-Indigenous Australians. This may be due to Indigenous patients facing health care providers who lack cultural competency training, so improvements are required (NHF & AHHA, 2010). A study in the NT of

Health conditions
48
avoidable mortality for Indigenous Australians between 1985 and 2004 found improvements in conditions amenable to medical care but marginal improvement for conditions responsive to preventative measures. The study noted the reduction of deaths from stroke was consistent with improved drug therapies and intensive care, dedicated stroke units and surgical procedures (Li, SQ et al, 2009).
The Indigenous Australians' Health Programme (IAHP) focuses on the prevention, early detection and management of chronic disease through expanded access to and coordination of comprehensive primary health care. Activities aimed at helping patients who experience circulatory disease include
Tackling Indigenous Smoking and a care coordination and outreach workforce based in AMSs and mainstream services. In addition, GP health assessments for Indigenous Australians are funded under the MBS, which includes follow-on care. Funding is also provided for incentive payments for improved chronic disease management, and for cheaper medicines through the PBS.
The Lighthouse Hospital Project, funded through the IAHP, aims to drive systemic change in the acute care sector to improve care and outcomes for Indigenous Australians who experience acute coronary syndrome. It is designed to improve governance, clinical quality, and cultural competence of the health workforce.
The National Recommendations from the May 2014 Better Cardiac Care for Aboriginal and Torres Strait Islander People Post-Forum Report focus on five priority areas for action by all jurisdictions, including: early cardiovascular risk assessment and management; early diagnosis of heart disease and heart failure; guideline-based therapy for acute coronary syndrome; the provision of ongoing preventive care; and strengthening the diagnosis, notification and follow-up of rheumatic heart disease. The second Better Cardiac Care report shows progress against 11 of the 21 recommended indicators, for which updated data were available (AIHW, 2016a).
Figure 1.05-1 Self-reported circulatory disease, Indigenous persons (2 years and over), by jurisdiction and remoteness, 2012–13
Source: ABS and AIHW analysis of 2012–13 AATSIHS
Figure 1.05-2 Self-reported heart and circulatory disease, by age and Indigenous status, 2012–13
Note: Total is for people aged 2 years and over and is age standardised Source: ABS and AIHW analysis of 2012–13 AATSIHS
Figure 1.05-3 Age-standardised death rates for circulatory disease, by Indigenous status, 1998 to 2015
Source: ABS and AIHW analysis of National Mortality Database
Figure 1.05-4 Age-specific hospitalisation rates for circulatory disease, by Indigenous status, July 2013–June 2015
Source: AIHW analysis of National Hospital Morbidity Database
13
10
12 12 13
15
9
15
11
18
13
0
5
10
15
20
Per c
ent
25
11
18
28
45
13
5
10
19
46
0
10
20
30
40
50
2–14 15–24 25–34 35–44 45–54 55+ Total
Per c
ent
Age group (years)
Aboriginal and Torres Strait Islander peoples Non-Indigenous Australians
0
100
200
300
400
500
98 99 00 01 02 03 04 05 06 07 08 09 10 11 12 13 14 15
Deat
hs p
er 1
00,0
00 p
opul
atio
n
Year
Aboriginal and Torres Strait Islander peoplesNon-Indigenous Australians
1 2 37
21
44
68
107
1 1 2 3 614
30
89
0
20
40
60
80
100
120
0–4 5–14 15–24 25–34 35–44 45–54 55–64 65+
Sepa
ratio
ns p
er 1
,000
pop
ulat
ion
Age group (years)
Aboriginal and Torres Strait Islander peoples Non-Indigenous Australians

Health conditions
49
1.06 Acute rheumatic fever and rheumatic heart disease Why is it important? Acute rheumatic fever (ARF) is a disease caused by an autoimmune reaction to an infection with the bacterium group A streptococcus (GAS). ARF is a short illness, but can result in permanent damage to the heart—rheumatic heart disease (RHD). A person who has had ARF once is susceptible to repeated episodes, which can increase the risk of RHD. Following an initial diagnosis of ARF, patients require long-term treatment, including long-term antibiotic treatment to avoid further infections that may damage the heart (RHD et al, 2012; AIHW, 2013b). Heart surgery may be required to repair heart valve damage resulting from RHD.
ARF and RHD are associated with environmental factors such as poverty and poor living conditions. ARF and RHD are now rare diseases in populations with good living conditions and easy access to quality medical care (He et al, 2016). Aboriginal and Torres Strait Islander peoples will remain at risk of ARF/RHD while socio-economic disadvantage and barriers to accessing health care persist.
Rheumatic Heart Disease Control Programme registers have been established in the NT, Qld and WA, and more recently in SA (currently under development). The NT RHD register has been operating in the Top End since 1997 and in Central Australia since 2001 and currently provides the strongest source of trend data on ARF and RHD. Comparisons between jurisdictions should not be made because registers are at different stages of coverage and completion. A number of smaller, geographically limited studies have also been conducted.
Findings Acute rheumatic fever In the period 2011–15, there were 1,204 new or recurrent cases of ARF in the NT, WA, Qld and SA combined (SA data is for 2013–15 only). The majority (approximately 94%, 1,132 cases) were for Aboriginal and Torres Strait Islander peoples. Based on data from the NT, WA and Qld combined, ARF is largely restricted to children and young adults: among Aboriginal and Torres Strait Islander peoples, 55% of cases occurred in children aged 0–14 years, with a further 26% in the 15–24 years age group. In the NT, most (67%) were new cases, while 33% were recurrent cases. Breakdowns by age are not currently available for SA.
Recorded rates of ARF for Indigenous Australians were 1.4 per 1,000 in the NT, 0.7 per 1,000 in WA and 0.3 per 1,000 in SA and
Qld. In the NT, the rate has more than doubled between 2006 and 2015.
Rheumatic heart disease In December 2015, there were 1,637 Aboriginal and Torres Strait Islander people recorded as having RHD in the NT, 985 in Qld, 378 in WA, and 129 in SA. The prevalence rate of RHD for Indigenous Australians was 22.1 per 1,000 in the NT, 4.7 per 1,000 in Qld, 3.9 per 1,000 in WA and 3.1 per 1,000 in SA. Females comprised 66% of Indigenous Australians in the NT with RHD. The prevalence of RHD was 37 times as high among Indigenous Australians as it was among other residents of the NT, 169 times higher for Indigenous Australians in Qld, and 630 times higher in WA.
A study conducted between 2006 and 2010 found large differences in RHD prevalence rates among Indigenous children in Northern Australia, ranging from 15 per 1,000 in the Top End of the NT to 4.7 per 1,000 in Far North Qld. More than half of the definite RHD cases detected were new cases, and the findings suggest that between 4 and 8 per 1,000 Indigenous children have undetected RHD. Regions with higher prevalence rates were associated with lower socio-economic conditions (Roberts et al. 2015).
Between 2006 and 2015 there was a 24% non-significant decline in new registrations of RHD among Indigenous Australians in the NT. There was an increase in new registrations of RHD in WA between 2010 and 2015, though this is likely to be at least in part due to improved diagnosis and increased registration.
An audit of control programmes in far North Queensland and the Kimberley region of WA found that 1 in 5 patients with RHD had been prescribed an anti-coagulant, 55% had received a specialist review within recommended timeframes, 61% had a timely echocardiogram and 22% had undergone valve surgery. Of patients who were recommended benzathine penicillin secondary prophylaxis, only 18% received more than 80% of scheduled doses in the 12 months prior (Remond et al, 2013).
Indigenous Australians were 5 times as likely to die from rheumatic heart disease as non-Indigenous Australians (6.4 per 100,000 compared with 1.4 per 100,000). A data linkage study in the NT found that mortality was 6.6 times higher among Indigenous than non-Indigenous RHD patients, and that 28% of this difference was explained by renal failure and hazardous alcohol use (He et al, 2016).
Indigenous Australians were hospitalised for ARF/RHD at rates of around 7 times that for other Australians (0.7 per 1,000 compared with 0.1 per 1,000 for non-Indigenous Australians in the period 2013–14 to 2014–15). Rates were highest in the NT (3.0 per
1,000) and lowest in NSW (0.2 per 1,000). Hospitalisations for Indigenous Australians were highest in the 10–14 year age group whereas for non-Indigenous Australians rates increased with age and were highest in the 65 years and over group. Indigenous Australians hospitalised for ARF/RHD were less likely than other Australians to have had at least one heart valve procedure performed (26% compared with 44%).
Implications Rates of ARF and RHD among Indigenous Australians are among the highest in the world and large inequalities exist between Indigenous and other Australians (AIHW, 2013b). Interventions that focus on improving housing, socio-economic circumstances and health care are important for preventing and managing these conditions. Improved access to appropriate treatment for GAS infections such as throat and skin infections are likely to reduce the rate of ARF. More research is needed on the association between GAS skin infections and ARF as the findings of studies to date have not been definite (RHD et al, 2012; May et al, 2016; Carapetis et al, 2007).
A study in the NT found high progression rates to RHD following the first year after ARF diagnosis, particularly among Indigenous Australians in remote areas, and those with comorbidities (He et al, 2016). Development of complications is also more likely in the first year after diagnosis. These findings suggest limitations to secondary prevention. This study also found residual disparities in Indigenous RHD survival after accounting for comorbidities (such as renal failure and alcohol use). May and others (2016) recommend preventative measures such as monitoring GAS diseases, the development of a GAS vaccine, long-acting penicillins, and note the importance of improvements in social determinants for Indigenous Australians, along with better access to health care and improved housing.
Even so, secondary prevention and treatment of ARF/RHD are essential, through the implementation of disease registers and control programmes, education of patients and their families, treatment with penicillin prophylaxis, and regular clinical review and access to specialists and hospital care (Chamberlain-Salaun et al, 2016). It has been suggested that the introduction of specialist ARF/RHD nurse practitioners in Australia could help to improve service delivery and patient outcomes (RHD & MSHR, 2015).
The May 2014 Better Cardiac Care for Aboriginal and Torres Strait Islander People Post Forum Report identifies strengthening the diagnosis, notification and follow-up of RHD as a priority for action by all jurisdictions. This forum was an initiative of the Australian Health Ministers’ Advisory Council.
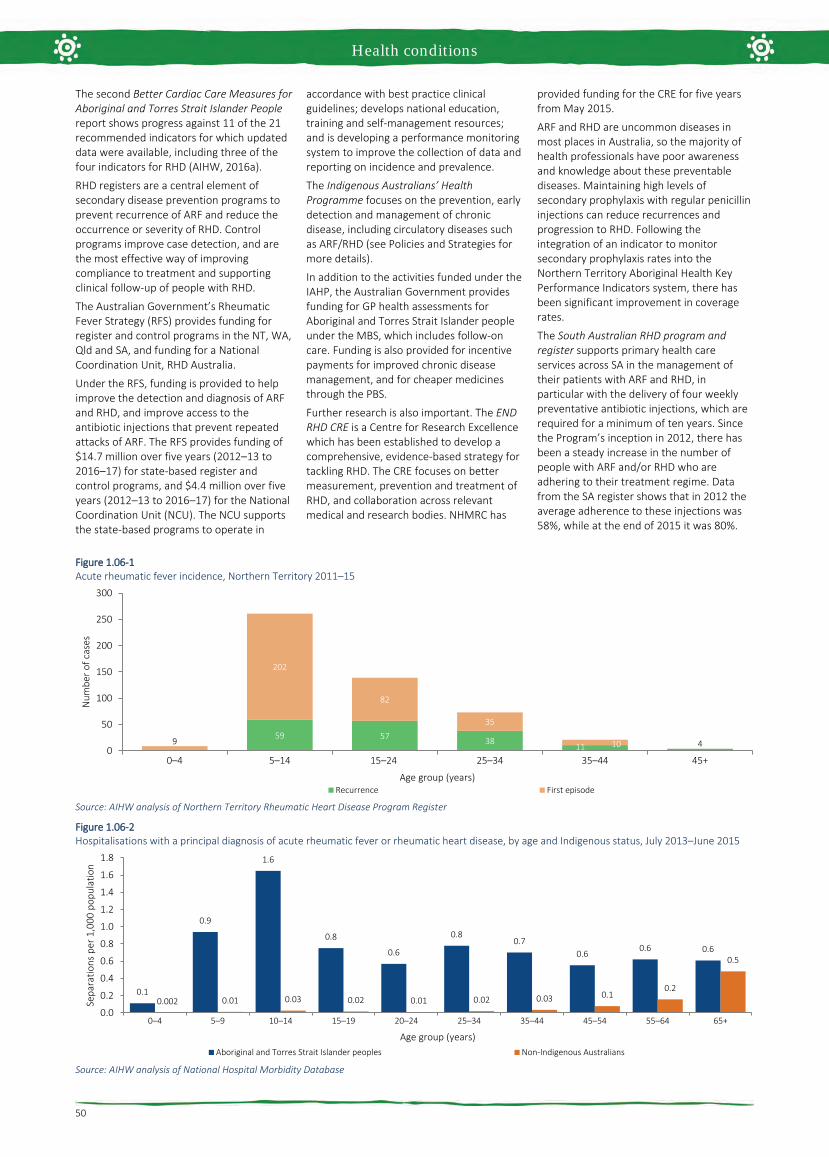
Health conditions
50
The second Better Cardiac Care Measures for Aboriginal and Torres Strait Islander People report shows progress against 11 of the 21 recommended indicators for which updated data were available, including three of the four indicators for RHD (AIHW, 2016a).
RHD registers are a central element of secondary disease prevention programs to prevent recurrence of ARF and reduce the occurrence or severity of RHD. Control programs improve case detection, and are the most effective way of improving compliance to treatment and supporting clinical follow-up of people with RHD.
The Australian Government’s Rheumatic Fever Strategy (RFS) provides funding for register and control programs in the NT, WA, Qld and SA, and funding for a National Coordination Unit, RHD Australia.
Under the RFS, funding is provided to help improve the detection and diagnosis of ARF and RHD, and improve access to the antibiotic injections that prevent repeated attacks of ARF. The RFS provides funding of $14.7 million over five years (2012–13 to 2016–17) for state-based register and control programs, and $4.4 million over five years (2012–13 to 2016–17) for the National Coordination Unit (NCU). The NCU supports the state-based programs to operate in
accordance with best practice clinical guidelines; develops national education, training and self-management resources; and is developing a performance monitoring system to improve the collection of data and reporting on incidence and prevalence.
The Indigenous Australians’ Health Programme focuses on the prevention, early detection and management of chronic disease, including circulatory diseases such as ARF/RHD (see Policies and Strategies for more details).
In addition to the activities funded under the IAHP, the Australian Government provides funding for GP health assessments for Aboriginal and Torres Strait Islander people under the MBS, which includes follow-on care. Funding is also provided for incentive payments for improved chronic disease management, and for cheaper medicines through the PBS.
Further research is also important. The END RHD CRE is a Centre for Research Excellence which has been established to develop a comprehensive, evidence-based strategy for tackling RHD. The CRE focuses on better measurement, prevention and treatment of RHD, and collaboration across relevant medical and research bodies. NHMRC has
provided funding for the CRE for five years from May 2015.
ARF and RHD are uncommon diseases in most places in Australia, so the majority of health professionals have poor awareness and knowledge about these preventable diseases. Maintaining high levels of secondary prophylaxis with regular penicillin injections can reduce recurrences and progression to RHD. Following the integration of an indicator to monitor secondary prophylaxis rates into the Northern Territory Aboriginal Health Key Performance Indicators system, there has been significant improvement in coverage rates.
The South Australian RHD program and register supports primary health care services across SA in the management of their patients with ARF and RHD, in particular with the delivery of four weekly preventative antibiotic injections, which are required for a minimum of ten years. Since the Program’s inception in 2012, there has been a steady increase in the number of people with ARF and/or RHD who are adhering to their treatment regime. Data from the SA register shows that in 2012 the average adherence to these injections was 58%, while at the end of 2015 it was 80%.
Figure 1.06-1 Acute rheumatic fever incidence, Northern Territory 2011–15
Source: AIHW analysis of Northern Territory Rheumatic Heart Disease Program Register
Figure 1.06-2 Hospitalisations with a principal diagnosis of acute rheumatic fever or rheumatic heart disease, by age and Indigenous status, July 2013–June 2015
Source: AIHW analysis of National Hospital Morbidity Database
59 57 3811 49
202
82
35
100
50
100
150
200
250
300
0–4 5–14 15–24 25–34 35–44 45+
Num
ber o
f cas
es
Age group (years)Recurrence First episode
0.1
0.9
1.6
0.8
0.6
0.80.7
0.60.6 0.6
0.002 0.01 0.03 0.02 0.01 0.02 0.03 0.10.2
0.5
0.0
0.2
0.4
0.6
0.8
1.0
1.2
1.4
1.6
1.8
0–4 5–9 10–14 15–19 20–24 25–34 35–44 45–54 55–64 65+
Sepa
ratio
ns p
er 1
,000
pop
ulat
ion
Age group (years)Aboriginal and Torres Strait Islander peoples Non-Indigenous Australians

Health conditions
51
1.07 High blood pressure Why is it important? High blood pressure, also referred to as hypertension, is a major risk factor for stroke, coronary heart disease, heart failure, kidney disease, deteriorating vision and peripheral vascular disease leading to leg ulcers and gangrene. High blood pressure is defined as a systolic blood pressure greater than 140 mmHg and/or diastolic pressure greater than 90 mmHg and/or patient receiving medication for high blood pressure (NHF, 2016). Major risk factors for high blood pressure include increasing age, poor diet (particularly high salt intake), obesity, excessive alcohol consumption, and insufficient physical activity (WHO, 2013; AIHW, 2015b) . A number of these risk factors are more prevalent among Indigenous Australians (see measures in Health Behaviours).
A study of Indigenous Australians living in urban WA found that, after controlling for other cardiovascular risk factors, those with high blood pressure were twice as likely to die or be hospitalised due to a cardiovascular event (Bradshaw et al, 2009).
While for some people, the propensity to develop high blood pressure appears to be inherited, it can often be prevented or controlled by leading an active and healthy life, remaining fit, avoiding obesity, albuminuria and diabetes and, if necessary, taking regular medication (Semlitsch et al, 2013; Bunker, 2014; Li, M & McDermott, 2015; NHF, 2016). For those with high blood pressure, treatment with long-term medication can reduce the risk of developing complications, although not necessarily to the levels of unaffected people (AIHW, 2015a). Reducing the prevalence of high blood pressure is one of the most important means of reducing serious circulatory diseases, which are the leading cause of death among Indigenous Australians (see measure 1.23).
Findings High blood pressure was responsible for 5% of the Indigenous burden of disease and 8% of the health gap between Indigenous and non-Indigenous Australians in 2011 (AIHW, 2016f). High blood pressure contributed to 64% of the burden due to hypertensive heart disease, 61% of the stroke burden, and 37% of the coronary heart disease burden. Most high blood pressure burden for Indigenous Australians was due to early death (88%), predominantly in the 45–69 year age group and higher for males (60%) than females (40%).Between 2003 and 2011 there was a 23% reduction in burden of disease attributable to high blood pressure for Indigenous Australians.
Based on both measured and self-reported data from the 2012–13 Health Survey, 27% of Indigenous adults had high blood pressure. Rates increased with age and were higher in remote areas (34%) than non-remote areas (25%). Twenty per cent of Indigenous adults were found to have high blood pressure during the survey interview. Of these adults, 21% also reported diagnosed high blood pressure. Most Indigenous Australians with measured high blood pressure in the survey (79%) had not previously been diagnosed with the condition; this proportion was similar among non-Indigenous Australians. Therefore, there are a number of Indigenous adults with undiagnosed high blood pressure who are unlikely to be receiving appropriate medical advice and treatment. The proportion of Indigenous adults with measured high blood pressure who did not report a diagnosed condition decreased with age and was higher in non-remote areas (85%) compared with remote areas (65%). In 2012–13, 10% of Indigenous adults reported they had a diagnosed high blood pressure condition. Of these, 18% did not have measured high blood pressure and therefore are likely to be managing their condition. Indigenous males were more likely to have high measured blood pressure (23%) than females (18%). The survey showed that an additional 36% of Indigenous adults had pre-hypertension (blood pressure between 120/80 and 140/90 mmHg). This condition is a signal of possibly developing hypertension requiring early intervention.
In 2012–13, after adjusting for differences in the age structure of the two populations, Indigenous adults were 1.2 times as likely as non-Indigenous adults to have measured high blood pressure. For Indigenous Australians, rates started rising at younger ages and the largest gap was in the 35–44 year age group. The 2012–13 Health Survey showed a number of associations between socio-economic status and measured and/or self-reported high blood pressure. Indigenous Australians living in the most relatively disadvantaged areas were 1.3 times as likely to have high blood pressure (28%) as those living in the most relatively advantaged areas (22%). Indigenous Australians reporting having completed schooling to Year 9 or below were 2.1 times as likely to have high blood pressure (38%) as those who completed Year 12 (18%). Additionally, those who were obese were 2 times as likely as those not obese to have high blood pressure (37% vs 18%). Those reporting fair/poor health were 1.8 times as likely as those reporting excellent/very good/good health to be have high blood pressure (41% vs 22%). Those reporting having diabetes were 2.2 times as likely to have high blood pressure (51% vs 23%), as were those reporting having kidney disease (57% vs 26%).
One study in selected remote communities found high blood pressure rates 3–8 times those in the general population (Hoy, WE et al, 2007). A long-term follow-up study in rural and remote communities in Northern Australia found the incidence of hypertension in Indigenous adults was nearly double the non-Indigenous rate. Increased incidence of obesity, diabetes and albuminuria were found to contribute to this higher rate (Li, M & McDermott, 2015).
Most diagnosed cases of high blood pressure are managed by GPs or medical specialists. When hospitalisation occurs it is usually due to cardiovascular complications resulting from uncontrolled chronic blood pressure elevation. During the two years to June 2015, hospitalisation rates for hypertensive disease were 2.3 times as high for Aboriginal and Torres Strait Islander peoples as for non-Indigenous Australians. Among Aboriginal and Torres Strait Islander peoples, hospitalisation rates started rising at younger ages with the greatest difference in the 55–64 year age group. This suggests that high blood pressure is more severe, occurs earlier, and is not controlled as well for Indigenous Australians. As a consequence, severe disease requiring acute care in hospital is more common. Based on GP survey data (2010–15), high blood pressure represented nearly 4% of all problems managed by GPs among Indigenous patients. Rates were similar for both Indigenous and other Australian patients (after adjusting for differences in the age structure of the two populations).
In May 2015, Commonwealth-funded Indigenous primary health care organisations provided national Key Performance Indicators data based on best practice guidelines. Of the 32,900 regular clients with Type 2 diabetes, 68% had their blood pressure assessed and 43% had results in the recommended range in the six months to May 2015.
Implications The prevalence of measured high blood pressure among Indigenous adults was estimated as 1.2 times as high as for non-Indigenous adults and hospitalisation rates were 2.3 times as high, but high blood pressure accounted for a similar proportion of GP consultations for both populations. This suggests that Indigenous Australians are less likely to have their high blood pressure diagnosed and less likely to have it well controlled given the similar rate of GP visits and higher rate of hospitalisations due to cardiovascular complications.
Identification and management of hypertension requires access to primary health care with appropriate systems for the identification of Aboriginal and Torres Strait Islander clients and systemic approaches to health assessments and chronic illness
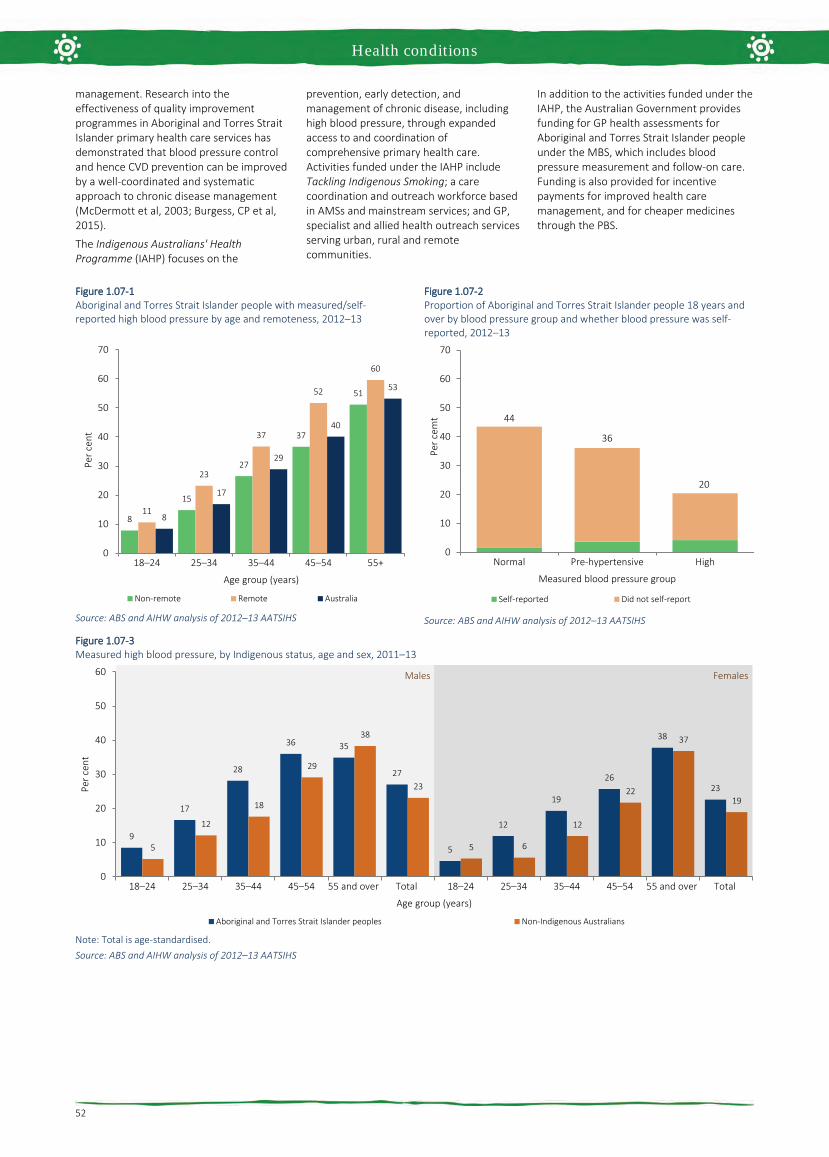
Health conditions
52
management. Research into the effectiveness of quality improvement programmes in Aboriginal and Torres Strait Islander primary health care services has demonstrated that blood pressure control and hence CVD prevention can be improved by a well-coordinated and systematic approach to chronic disease management (McDermott et al, 2003; Burgess, CP et al, 2015).
The Indigenous Australians' Health Programme (IAHP) focuses on the
prevention, early detection, and management of chronic disease, including high blood pressure, through expanded access to and coordination of comprehensive primary health care. Activities funded under the IAHP include Tackling Indigenous Smoking; a care coordination and outreach workforce based in AMSs and mainstream services; and GP, specialist and allied health outreach services serving urban, rural and remote communities.
In addition to the activities funded under the IAHP, the Australian Government provides funding for GP health assessments for Aboriginal and Torres Strait Islander people under the MBS, which includes blood pressure measurement and follow-on care. Funding is also provided for incentive payments for improved health care management, and for cheaper medicines through the PBS.
Figure 1.07-1 Aboriginal and Torres Strait Islander people with measured/self-reported high blood pressure by age and remoteness, 2012–13
Source: ABS and AIHW analysis of 2012–13 AATSIHS
Figure 1.07-2 Proportion of Aboriginal and Torres Strait Islander people 18 years and over by blood pressure group and whether blood pressure was self-reported, 2012–13
Source: ABS and AIHW analysis of 2012–13 AATSIHS
Figure 1.07-3 Measured high blood pressure, by Indigenous status, age and sex, 2011–13
Note: Total is age-standardised. Source: ABS and AIHW analysis of 2012–13 AATSIHS
8
15
27
37
51
11
23
37
52
60
8
17
29
40
53
0
10
20
30
40
50
60
70
18–24 25–34 35–44 45–54 55+
Per c
ent
Age group (years)
Non-remote Remote Australia
44
36
20
0
10
20
30
40
50
60
70
Normal Pre-hypertensive High
Per c
emt
Measured blood pressure group
Self-reported Did not self-report
9
17
28
36 35
27
5
12
19
26
38
23
5
12
18
29
38
23
5 6
12
22
37
19
0
10
20
30
40
50
60
18–24 25–34 35–44 45–54 55 and over Total 18–24 25–34 35–44 45–54 55 and over Total
Per c
ent
Age group (years)
Aboriginal and Torres Strait Islander peoples Non-Indigenous Australians
Males Females

Health conditions
53
1.08 Cancer Why is it important? Cancer is a group of diseases in which abnormal cells proliferate and spread. These cells can form a malignant tumour that can invade and damage the area around it and spread to other parts of the body through the bloodstream or the lymphatic system. If the spread of these tumours is not controlled, they may result in death. The effectiveness of treatment and survival rates can vary between different cancers and patients (AIHW, 2017a).
Risk factors for high fatality cancers remain prevalent in the Aboriginal and Torres Strait Islander population, including smoking, risky drinking and poor diet (Condon et al, 2003; AIHW & Cancer Australia, 2013). Indigenous Australians have a higher incidence of fatal, screen-detectable and preventable cancers and are diagnosed at more advanced stages, and often with more complex comorbidities (Cunningham et al, 2008). Compared with non-Indigenous Australians diagnosed with the same cancer, Indigenous Australians are doubly disadvantaged because they are usually diagnosed later with more advanced disease, are less likely to have treatment, and often have to wait longer for surgery than non-Indigenous patients (Hall, SE et al, 2004; Valery et al, 2006).
Findings Cancer was responsible for 9% of the Indigenous burden of disease and 9% of the health gap between Indigenous and non-Indigenous Australians in 2011 (AIHW, 2016f). Indigenous Australians experienced 1.7 times the burden due to cancer than non-Indigenous Australians; 2.4 times for lung cancer. Lung (24%), bowel (8%), liver (7%), breast (7%) and mouth and pharyngeal (6%) cancers accounted for half (51%) of the cancer burden among Indigenous Australians. The biggest risk factor was tobacco use (39%) and 97% of the cancer burden was due to early death. Between 2003 and 2011 there was a 6% increase in burden due to cancer for Indigenous Australians, mainly due to deaths from liver and lung cancer.
In 2008–12, cancer incidence was slightly higher for Indigenous Australians (484 per 100,000) than for non-Indigenous Australians (439 per 100,000) (age-standardised) in the jurisdictions with data of adequate quality (NSW, Vic, Qld, WA and the NT combined). For Indigenous Australians, rates for lung cancer, digestive system cancer (excluding bowel) and cervical cancer were higher and rates for bowel cancer and breast cancer in females were lower compared with non-Indigenous Australians (age-standardised). Among Indigenous Australians, incidence rates were
higher in younger age groups than for non-Indigenous Australians. Higher rates of cancer incidence were evident from 45 years onwards. In 2004–12, the 5-year crude cancer survival rate for Indigenous Australians was lower for both Indigenous males (37%) and females (47%) compared with non-Indigenous males (53%) and females (59%). A study of cancer registry data in NSW found a large number of cases with missing Indigenous status. Once imputed, an additional 12–13% of Indigenous cancer cases were identified (Morrell et al, 2012).
Cancer was the second leading cause of death among Indigenous Australians, accounting for 21% of deaths during the period 2011–15, in NSW, Qld, WA, SA and the NT combined. Over this period, cancers of the digestive organs and respiratory organs (including lung) were the most common causes of cancer death among Indigenous Australians (28% and 27% respectively). In 2011–15, after adjusting for differing population age structures, Indigenous Australians were 1.4 times as likely to die from cancer as non-Indigenous Australians. Cancer was the third leading cause of the gap in death rates between Indigenous and non-Indigenous Australians (15% of the gap). The largest gaps between the two populations were in cancers of the respiratory organs, particularly bronchus and lung cancer, followed by cancers of the digestive organs. Over the period 1998 to 2015, there has been a significant increase in cancer death rates for Indigenous Australians (21%) and a significant decline for non-Indigenous Australians (13%); therefore the gap in cancer deaths between the two populations has widened.
Research suggests that survival rates among non-Indigenous patients are up to 50% greater than those for Indigenous patients within the first 12 months of diagnosis, dropping to a similar survival rate 2 years after diagnosis. There was no evidence that the rate of five-year survival varied by remoteness or socio-economic status for Indigenous Australians (Cramb, 2012). Analysis of 1991–2006 data found that Indigenous women had, after adjusting for diagnostic period and sociodemographic factors, a risk of death from breast cancer 68% higher than other women with breast cancer (Cancer Australia, 2012). Another recent review also found an overall pattern of poorer breast cancer survival for Indigenous women and variations along the continuum of care (Dasgupta et al, 2017). A study on cancer survival in children found that Indigenous children were 1.6 times as likely to die within 5 years of diagnosis as other children and this remained significant following adjustment for socio-economic status and stage at diagnosis (Valery et al, 2011).
The rate of cancer management among Indigenous patients was slightly lower than that for other Australian patients—21 and 27 per 1,000 GP encounters respectively in 2010–15 (age-adjusted).
Implications The lower survival rate for Indigenous Australians from some cancers may be partly explained by factors such as lower likelihood of receiving treatment, later diagnoses, comorbidities, and greater likelihood of being diagnosed with cancers with poorer survival (Cunningham et al, 2008; Supramaniam et al, 2011; Moore et al, 2014; Shahid et al, 2016). Evidence suggests that improvements in cancer care for Indigenous Australians are required; including in cancer diagnosis, treatment, and health support services so they are more accessible and acceptable to Indigenous Australians (Condon et al, 2014; Meiklejohn et al, 2016). The CanDAD project is an approach whereby Aboriginal communities are working with policy makers, service providers and researchers to change the way Indigenous cancer data are collected and utilised (Brown, A et al, 2016).
Cancer Australia aims to minimise the impact of cancer, address disparities and improve outcomes for people affected by cancer. Cancer Australia's work is underpinned by a model for engaging Indigenous communities including: evidence translation, community engagement, collaboration and capacity building, message repetition and sustainability. The National Aboriginal and Torres Strait Islander Cancer Framework 2015 provides a shared agenda for improving Indigenous cancer outcomes in Australia (Cancer Australia, 2015; Zorbas & Elston, 2016).
The Indigenous Australians’ Health Programme (IAHP) focuses on the prevention, early detection and management of chronic disease, including cancer. Cancer prevention under the IAHP includes the Tackling Indigenous Smoking Program, which aims to reduce to reduce smoking rates (see measure 2.15). The IAHP also funds the National Bowel Cancer Screening pilot project, which aims to increase bowel cancer screening rates for Indigenous Australians.
The HPV Vaccination Program includes specific communication strategies for Indigenous communities such as distribution of tailored resources to schools, as well as targeted public relations activities and social media engagement. BreastScreen Australia and the National Bowel Cancer Screening Program include culturally specific advertising and stakeholder engagement. State and Territory governments provide a range of programmes. For example, in Victoria, the Strengthening Clinical Care and Pathways project aims to increase cancer treatment in public hospitals.
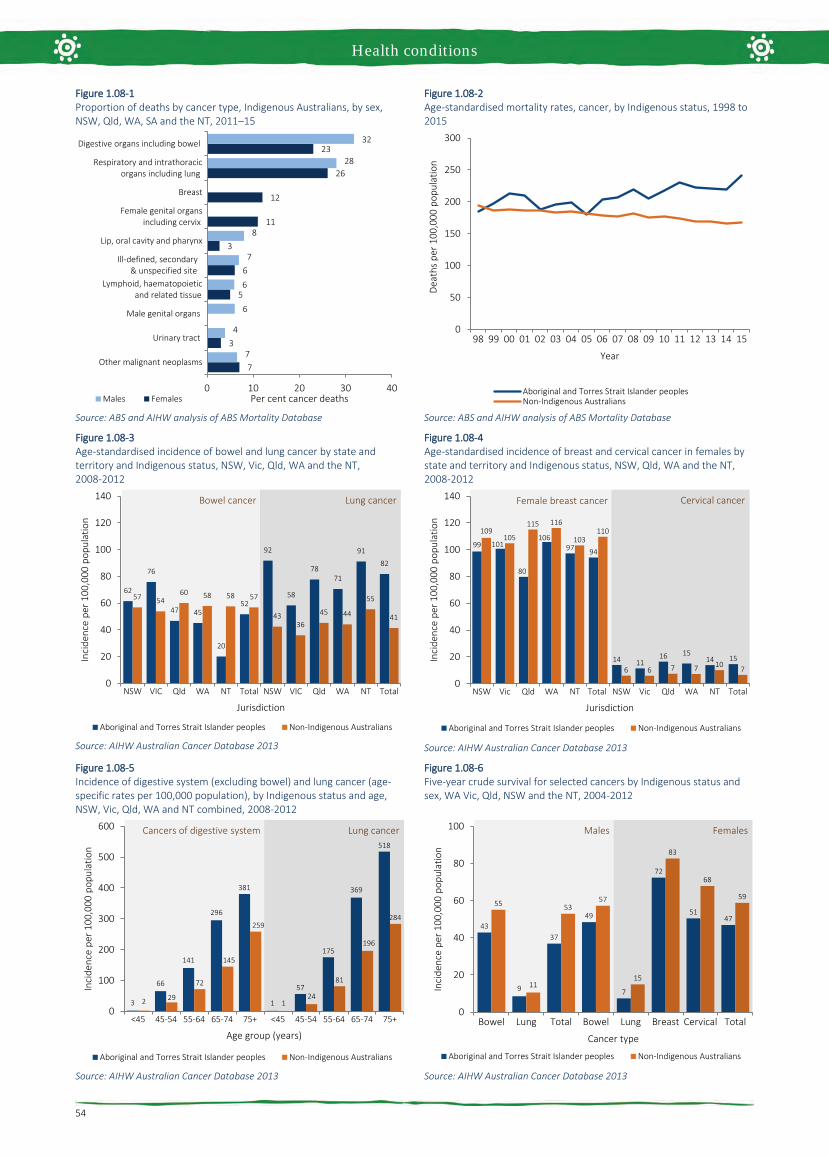
Health conditions
54
Figure 1.08-1 Proportion of deaths by cancer type, Indigenous Australians, by sex, NSW, Qld, WA, SA and the NT, 2011–15
Source: ABS and AIHW analysis of ABS Mortality Database
Figure 1.08-2 Age-standardised mortality rates, cancer, by Indigenous status, 1998 to 2015
Source: ABS and AIHW analysis of ABS Mortality Database
Figure 1.08-3 Age-standardised incidence of bowel and lung cancer by state and territory and Indigenous status, NSW, Vic, Qld, WA and the NT, 2008-2012
Source: AIHW Australian Cancer Database 2013
Figure 1.08-4 Age-standardised incidence of breast and cervical cancer in females by state and territory and Indigenous status, NSW, Qld, WA and the NT, 2008-2012
Source: AIHW Australian Cancer Database 2013
Figure 1.08-5 Incidence of digestive system (excluding bowel) and lung cancer (age-specific rates per 100,000 population), by Indigenous status and age, NSW, Vic, Qld, WA and NT combined, 2008-2012
Source: AIHW Australian Cancer Database 2013
Figure 1.08-6 Five-year crude survival for selected cancers by Indigenous status and sex, WA Vic, Qld, NSW and the NT, 2004-2012
Source: AIHW Australian Cancer Database 2013
7
3
5
6
3
11
12
26
23
7
4
6
6
7
8
28
32
0 10 20 30 40
Other malignant neoplasms
Urinary tract
Male genital organs
Lymphoid, haematopoietic and related tissue
Ill-defined, secondary & unspecified site
Lip, oral cavity and pharynx
Female genital organs including cervix
Breast
Respiratory and intrathoracic organs including lung
Digestive organs including bowel
Per cent cancer deathsMales Females
0
50
100
150
200
250
300
98 99 00 01 02 03 04 05 06 07 08 09 10 11 12 13 14 15
Deat
hs p
er 1
00,0
00 p
opul
atio
n
Year
Aboriginal and Torres Strait Islander peoplesNon-Indigenous Australians
62
76
47 45
20
52
92
58
7871
91
82
57 5460 58 58 57
4336
45 44
55
41
0
20
40
60
80
100
120
140
NSW VIC Qld WA NT Total NSW VIC Qld WA NT Total
Inci
denc
e pe
r 100
,000
pop
ulat
ion
Jurisdiction
Aboriginal and Torres Strait Islander peoples Non-Indigenous Australians
Bowel cancer Lung cancer
99 101
80
10697 94
14 1116 15
14 15
109105
115 116
103110
6 6 7 7 10 7
0
20
40
60
80
100
120
140
NSW Vic Qld WA NT Total NSW Vic Qld WA NT Total
Inci
denc
e pe
r 100
,000
pop
ulat
ion
Jurisdiction
Aboriginal and Torres Strait Islander peoples Non-Indigenous Australians
Female breast cancer Cervical cancer
3
66
141
296
381
1
57
175
369
518
2 29
72
145
259
124
81
196
284
0
100
200
300
400
500
600
<45 45-54 55-64 65-74 75+ <45 45-54 55-64 65-74 75+
Inci
denc
e pe
r 100
,000
pop
ulat
ion
Age group (years)
Aboriginal and Torres Strait Islander peoples Non-Indigenous Australians
Cancers of digestive system Lung cancer
43
9
37
49
7
72
5147
55
11
5357
15
83
68
59
0
20
40
60
80
100
Bowel Lung Total Bowel Lung Breast Cervical Total
Inci
denc
e pe
r 100
,000
pop
ulat
ion
Cancer type
Aboriginal and Torres Strait Islander peoples Non-Indigenous Australians
Males Females

Health conditions
55
1.09 Diabetes Why is it important? Diabetes is a long-term chronic condition where blood glucose levels become too high because the body produces little or no insulin, or cannot use insulin properly. Over many years, high blood glucose levels can damage various parts of the body, especially the heart and blood vessels, eyes, kidneys and nerves, resulting in permanent disability, mental health problems, reduced quality of life and premature death (Burrow & Ride, 2016; AIHW, 2016f). High blood glucose levels cause complications for both the mother and baby during pregnancy.
The most common form of diabetes is Type 2, which accounted for 85% of all diabetes in Australia in 2014–15 (ABS, 2015b). Type 2 diabetes is a significant contributor to morbidity and mortality for Indigenous Australians. It is more common in people who are physically inactive, have a poor diet, and are overweight or obese. Heredity, low birthweight, intra-uterine factors and excessive alcohol consumption are also associated with increased risk (Burrow & Ride, 2016). Type 1 diabetes is a lifelong autoimmune disease requiring management with insulin to ensure blood glucose levels remain within a safe range. In 2005–13, Indigenous Australians had a lower incidence of Type 1 diabetes (7 per 100,000) than non-Indigenous Australians (10 per 100,000) (AIHW, 2015c).
Findings Diabetes was responsible for 4.1% of the Indigenous burden of disease in 2011 (AIHW, 2016f). Diabetes accounted for 8% of the health gap between Indigenous and non-Indigenous females, and 7% of the gap between males. High body mass (64% of burden) and physical inactivity (36% of burden) were key risk factors for diabetes. Most diabetes burden for Indigenous Australians was due to early death (68%). Between 2003 and 2011 there was a small decline (10%) for diabetes, largely driven by declines in fatal burden which outweighed the increase observed in non-fatal burden. Disease burden for Indigenous Australians due to diabetes was greater in remote areas and for those with poor socio-economic status.
The 2012–13 Health Survey included blood tests for measuring diabetes prevalence (ABS, 2014e). In 2012–13, 11% of Indigenous Australians aged 18 years and over had diabetes. After adjusting for age differences in the two populations, this was more than 3 times as high as for non-Indigenous Australians. This comprised 9.6% of Indigenous adults with known diabetes and 1.5% with diabetes newly diagnosed by the blood test results, suggesting that
approximately 14% of cases of diabetes were previously undiagnosed. Of non-Indigenous adults with diabetes, 18% were previously undiagnosed. While the total diabetes rate for Indigenous adults was 3 times the non-Indigenous rate, the rate ratio for previously undiagnosed diabetes was 2 times. In addition, 5% of Indigenous Australians had blood test results showing impaired fasting plasma glucose, which means they were at high risk of developing diabetes, 1.8 times the non-Indigenous rate. Of those Indigenous adults with known diabetes, 61% had blood test results suggesting the condition was not being managed effectively. This was 1.4 times as high as for non-Indigenous Australians (44%). Half (53%) of Indigenous Australians with diabetes also had signs of chronic kidney disease (see measure 1.10).
Measured rates of diabetes for Indigenous adults were more than double in remote areas (21%) compared with non-remote areas (9%). Newly diagnosed diabetes was 5 times as high in remote as non-remote areas (4.8% compared with 0.9%). Rates of diabetes were highest in the NT (19%) and lowest in Qld (8%). Indigenous men and women had similar rates of diabetes (10% compared with 12%). Among Indigenous Australians, diabetes problems started in younger age groups than for non-Indigenous Australians. Higher rates of diabetes were evident from 35 years onwards and by 55 years and over, more than one-third of Indigenous Australians had diabetes.
There was a statistically significant relationship between the prevalence of diabetes and selected social determinants of health and risk factors such as socio-economic status, educational attainment, weight, and blood pressure.
In 2006–11, Indigenous children aged 10–14 years were 8 times as likely to have Type 2 diabetes as non-Indigenous children (AIHW, 2014d). Between 1990–2012 in WA, mean incidence of Type 2 diabetes in Indigenous children was 21 times the rate for non-Indigenous children (Haynes et al. 2016).
In 2005–07, Aboriginal and Torres Strait Islander mothers were more likely to experience pre-existing diabetes affecting pregnancy (3 to 4 times the non-Indigenous rate) and to develop gestational diabetes mellitus (GDM) (twice the non-Indigenous rate). Indigenous mothers with pre-existing diabetes were more likely to deliver pre-term (32%), compared with Indigenous mothers with GDM (14%) and Indigenous mothers without diabetes (13%) (AIHW, 2010d). Of Indigenous Australians in non-remote areas self-reporting diabetes, 69% had a blood test to check for diabetes control in the last 12 months and 68% had their feet checked in the last 12 months. In addition, 30% of Indigenous Australians with diabetes in non-remote and remote areas
combined were using insulin, 64% were taking medicine/tablets and 80% had taken lifestyle action relating to diet, weight loss and exercise.
GP survey data (2010–15) showed around 5% of all problems managed by GPs among Indigenous patients were for diabetes, with Type 2 diabetes accounting for 92% of all diabetes problems managed. After adjusting for differences in the age structure of the two populations, GPs managed diabetes problems for Indigenous Australians at nearly 3 times the rate for other Australians. In the two years to June 2015, the Indigenous hospitalisation rate for diabetes was 4.2 times the non-Indigenous rate, with the gap increasing with age. Around 61% of hospitalisations for diabetes among Indigenous Australians were for Type 2 diabetes, 18% for Type 1 diabetes and a further 19% for diabetes during pregnancy. Hospitalisation rates were higher among those living in remote and very remote areas (10 per 1,000) than those in inner regional areas and major cities (4 and 5 per 1,000 respectively). Complications of diabetes such as lower limb amputations were also more common among Indigenous Australians than non-Indigenous Australians (Burrow & Ride, 2016; Rodrigues et al, 2016) .
During the period 2011–15, 8% of Indigenous deaths were due to diabetes, and death rates from diabetes were 6 times the non-Indigenous rate. Diabetes was the second leading cause of the gap in death rates behind circulatory disease. There has been no decrease in death rates from diabetes for Indigenous Australians over the last 17 years. Diabetes does not often lead directly to death so complications associated with it are often listed as the cause of death (AIHW, 2014g). In 2011–15, in NSW, Qld, WA, SA and the NT there were 2,559 Indigenous deaths where diabetes was listed as an associated cause of death.
Implications Diabetes incidence, hospitalisations and deaths are more common among Indigenous Australians than other Australians. Challenges for decision makers include maintaining a policy emphasis on primary prevention (early detection, prenatal care, nutrition, physical activity, smoking, alcohol and post-partum screening (Chamberlain et al, 2015; Rankin et al, 2016). There are also challenges in implementing strategies to achieve effective secondary prevention (such as blood sugar control; eye and feet checks; and appropriate acute care to treat serious complications as they arise).
All the goals of the Australian National Diabetes Strategy 2016–2020 are applicable to Indigenous Australians however Goal 5 has potential areas of action which specifically aim to reduce the impact of diabetes among Indigenous Australians.

Health conditions
56
The Indigenous Australians’ Health Program (IAHP) focuses on the prevention, early detection, and management of chronic disease, including diabetes, through expanded access to and coordination of comprehensive primary health care. The Quality Assurance for Aboriginal and Torres Strait Islander Medical Services (QAAMS) Pathology Program funded since 1999, aims to supports on-site diabetes-related pathology testing. Results are available in 6 minutes, enabling patients to receive their results and more comprehensive advice and treatment plans in a single visit to the health service. Funding has also been provided from the IAHP for 2016–17 to 2018–19 to provide retinal cameras and train health professionals to use them. In November 2016, two new items were listed on the MBS
covering testing for diabetic retinopathy using a non-mydriatic retinal camera and annual checks for Indigenous Australians. Funding is also provided for incentive payments for improved chronic disease management, and for cheaper medicines through the PBS.
The National Diabetes Services Scheme aims to ensure people with diabetes have access to subsidised products and support services to help them self-manage their condition. A trial of pharmacy-based screening and referral for diabetes will commence in 2016.
Various state/territory initiatives are in place. For example, in Qld, $27m funding over 4 years has been committed to help tackle diabetes and other chronic diseases.
Indigenous Queenslanders are one of the priority groups identified.
An NT multivariate study of Indigenous diabetes patients found that those who had an adequate level of PHC visits were likely to have a lower level of hospitalisations than those with fewer PHC visits, other things being equal (Zhao et al, 2015b). A study of Indigenous Australians with diabetes living in remote NT communities found that those who visited primary care 2–11 times per year had lower rates of death and hospitalisation than those who visited less than twice a year. Preventing one hospitalisation for diabetes was cheaper ($248 for those with medium use, $739 for complicated cases) than the cost of one hospitalisation ($2,915) (Thomas, SL, 2014).
Figure 1.09-1 Proportion of Indigenous adults with diabetes by remoteness, 2012–13
Source: ABS analysis of 2012–13 AATSIHS
Figure 1.09-2 Proportion of Indigenous Australians with diabetes by selected jurisdictions, 2012–13
Source: ABS analysis of 2012–13 AATSIHS
Figure 1.09-3 Proportion of adults with diabetes, by Indigenous status and age, 2012–13
Source: ABS analysis of 2012–13 AATSIHS
Figure 1.09-4 Age-specific hospitalisation rates for diabetes, by Indigenous status, July 2013–June 2015
Source: AIHW analysis of National Hospital Morbidity Database
8 9
12
18
23
11
0
5
10
15
20
25
Majorcities
Innerregional
Outerregional
Remote Veryremote
Australia
Per c
ent
Remoteness area
12
8
18
11
19
11
0
5
10
15
20
25
NSW Qld WA SA NT Australia
Per c
ent
Jurisdiction
0.1
3
9
18
35
0.3 0.73
5
11
0
10
20
30
40
18–24 25–34 35–44 45–54 55+
Per c
ent
Age group (years)
Aboriginal and Torres Strait Islander peoples Non-Indigenous Australians
01
23
6
11
14
18
0 1 1 1 1 12
5
0
5
10
15
20
0–4 5–14 15–24 25–34 35–44 45–54 55–64 65+
Sepa
ratio
ns p
er 1
,000
pop
ulat
ion
Age group (years)
Aboriginal and Torres Strait Islander peoples Non-Indigenous Australians
Health conditions
57
1.10 Kidney disease Why is it important? The kidneys can be permanently damaged by various acute illnesses or by progressive damage from chronic conditions such as elevated blood pressure and long-standing high blood sugar levels (untreated diabetes). If the kidneys cease functioning entirely (known as end stage kidney disease, or kidney failure), waste products and excess water build up rapidly in the body. This can cause death within a few days or weeks unless a machine is used to filter the blood several times per week (kidney dialysis), or a new kidney is provided by transplant. A lower proportion of Indigenous than non-Indigenous patients receive kidney transplants, so most must have dialysis three times a week for the rest of their lives, impacting quality of life and social and emotional wellbeing for patients (Devitt et al, 2008; AIHW, 2016n; Chadban et al, 2005) and their carers (Rix et al, 2015).
Findings Chronic kidney disease was responsible for 1.9% of the Indigenous burden of disease in 2011 (AIHW, 2016f) . Note: the contribution of kidney disease as an associated cause is not captured in this data. Indigenous Australians experienced 7.3 times the burden of disease due to chronic kidney disease than non-Indigenous Australians. High body mass (37%) and high blood pressure (19%) were key risk factors for kidney and urinary diseases. Between 2003 and 2011, the Indigenous burden of disease due to kidney and urinary diseases was relatively stable. Disease burden for Indigenous Australians due to kidney and urinary diseases increased by remoteness and also with poor socio-economic status; rates were particularly high in the NT.
Based on the 2012–13 Health Survey, nearly one in five (18%) Indigenous Australian adults had blood/urine test results showing signs of kidney problems (infection, acute or chronic condition) (ABS, 2014e). The majority of these showed signs of being in Stage 1 (12%) with very few in Stages 4–5 (1%). Of those with signs of kidney disease, 89% did not have a diagnosis for chronic kidney disease (CKD). The onset of kidney disease tends to be at an earlier age in Indigenous Australians, with rates steadily increasing from the age of 18, compared with rates beginning to climb from 55 years for non-Indigenous Australians. After adjusting for age differences in the two populations, Indigenous adults were twice as likely as non-Indigenous adults to have signs of kidney disease (3 times for Stage 1 and around 5 times for Stages 4–5). Among Indigenous Australians, rates for signs of kidney disease were highest in very remote
areas (37%) compared with 12% in major cities.
In 2012–13, 38% of Indigenous Australians with kidney problems also had diabetes. Indigenous Australians with high blood pressure were twice as likely to have kidney problems as those with normal blood pressure (29% compared with 15%). Rates were also higher for those who were obese (20%) compared with underweight/normal weight (13%).
During 2011–15, 2% of deaths among Indigenous Australians (259) were due to kidney disease. After adjusting for the different age profiles of the two populations, the kidney disease mortality rate was 2.6 times the non-Indigenous rate. Kidney disease death rates significantly declined for Indigenous Australians between 2006 and 2015 (by 47%) and the gap halved with non-Indigenous Australians (declined by 54%). In 2011–15, there were also 2,268 deaths among Indigenous Australians where kidney disease was listed as an associated cause of death.
In 2013–15, care involving dialysis was the leading cause of hospitalisation (46%) for Indigenous Australians. Hospitalisation for dialysis was 11 times the non-Indigenous rate. Excluding dialysis there were also 5,790 hospitalisations for Indigenous Australians during this period for chronic kidney disease, 3.6 times the non-Indigenous rate.
The incidence of patients commencing ongoing kidney replacement therapy (KRT) (dialysis or kidney transplantation) for end stage kidney disease (ESKD) is higher for Indigenous Australians than for non-Indigenous Australians. Between 2012 and 2014, there were 777 new Indigenous patients registered as commencing KRT, accounting for 10% of all new registrations. The age-adjusted incidence rate of treated ESKD was 7 times as high for Indigenous Australians as for non-Indigenous Australians. Indigenous Australians commencing KRT were younger, with 57% aged less than 55 years compared with 31% of non-Indigenous Australians. Treated ESKD incidence rate was higher for Indigenous Australians in all adult age groups, with the greatest gap seen in the 55–64 year age group. In the period 2012–14, treated ESKD incidence rates among Indigenous Australians were highest in the NT (192 per 100,000) and lowest in NSW/the ACT (34 per 100,000). Treated ESKD incidence rates were higher in remote (132 per 100,000) and very remote areas (133 per 100,000) than major cities (29 per 100,000), with a female predominance in remote areas (Hoy et al. 2016, AIHW 2016). For non-Indigenous Australians, rates were similar across all regions.
No significant change was found in the rates of treated ESKD for Indigenous Australians between 1996 and 2014. Rates increased for
non-Indigenous males. The gap has not changed significantly.
A recent study found that Indigenous Australians on dialysis had a higher death risk than non-Indigenous Australians where diabetes was also present (1.15 times) (Khanal et al, 2016). Research in the NT found that the survival gap between Indigenous and non-Indigenous patients receiving KRT has closed between 1995–99 and 2000–04 (unadjusted), but a significant disparity in survival remained after adjusting for other variables (Lawton et al, 2015).
ESKD patients require either a kidney transplant or dialysis to maintain the functions normally performed by the kidneys. In December 2014, there were 1,771 Indigenous Australians registered for ongoing KRT. Of these, 88% were reliant on dialysis and 12% had received a kidney transplant. In comparison, 52% of non-Indigenous Australians with treated ESKD were reliant on dialysis and 48% had a kidney transplant. After adjusting for differences in the age structure of the two populations, Indigenous Australians with treated ESKD were 9 times as likely as non-Indigenous Australians with treated ESKD to be reliant on dialysis.
Implications The high level of CKD, including ESKD, among Indigenous Australians is associated with the high rates of diabetes, high blood pressure, obesity, low birthweight, and possibly the high rates of infections in childhood (AIHW, 2011d; Hoy, WE et al, 2016; Kim et al, 2017). These factors, in turn, are associated with determinants of health (see Tier 2) and access to appropriate and timely detection, diagnosis and treatment (Cass et al, 2004).
A study of Australian nephrologists found that, in the absence of robust evidence on predictors of post-transplant outcomes, decisions on which patients to refer for kidney transplantation were influenced by factors such as kidney shortages, compliance with dialysis as a predictor of compliance with transplant regimes (despite large differences in these factors), and experiences with other Indigenous patients (Anderson, K et al, 2012). Indigenous Australians have relatively poorer access to kidney transplants and addressing barriers is important (Cass et al, 2003; Yeates et al, 2009). Given the high cost of dialysis, focusing on prevention and better management of early stage CKD is vital (Reilly et al, 2016; Chen, T & Harris, 2015).
Dialysis is a tertiary hospital service, and is an ongoing state and territory government responsibility through the National Health Reform Agreement. The Commonwealth is also providing $27.5 million for a range of renal activities in the NT/tri state area from 2014–15 to 2017–18. This includes construction and refurbishment of

Health conditions
58
accommodation and infrastructure to assist renal patients to access services. In addition, mobile Dialysis Bus services offer respite dialysis to remote communities in the NT and SA. They allow Aboriginal dialysis patients to visit their home communities for significant events and to spend time on country with family and friends. Projects funded in WA include:
• $45.769 million to expand 10 hospitalsacross the Kimberley, Pilbara, Goldfieldsand Midwest; providing 17 additionalrenal dialysis chairs and 46 patientaccommodation units
• $8.6 million to establish the Derby andKununurra satellite dialysis services
• $2.552 million to expand the service atBunbury
• $0.466 million for a mobile medical teamin Kalgoorlie.
These options are important for remote communities, where people with ESKD often need to travel long distances, or permanently relocate, to receive dialysis.
Figure 1.10-1 Age-standardised incidence rates for treated end stage kidney disease, by Indigenous status, 1996 to 2014
Source: AIHW analysis ANZDATA
Figure 1.10-2 Incidence of treated end stage kidney disease by Indigenous status and age group, 2012–14
Source: AIHW analysis of ANZDATA
Figure 1.10-3 Age-standardised incidence of treated end stage kidney disease by Indigenous status and remoteness, 2012–14
Source: AIHW analysis of ANZDATA
Table 1.10-1 Prevalence of treated end stage kidney disease, by Indigenous status and treatment, 31 December 2014
Treatment: Number
Rate per 100,000 (age adjusted)
Ratio Indigenous Non-
Indigenous Indigenous Non-Indigenous
Dialysis 1,551 10,540 385 41 9.4* Transplant 220 9,756 47 40 1.2* Total 1,771 20,296 432 81 5.3*
Source: AIHW analysis of ANZDATA
Table1.10-2 Incidence of treated end stage kidney disease among Indigenous Australians, by jurisdiction, 2012–14
Jurisdiction Male Female Persons
No. Rate (a) Ratio No. Rate (a) Ratio No. Rate (a) Ratio NSW/ACT 55 30 2.6* 63 37 5.1* 118 34 3.5* Vic 26 64 5.1* 11 30 3.8* 37 47 4.5* Qld 64 38 3.4* 84 45 7.0* 148 41 4.7* WA 86 111 10.1* 82 92 14.8* 168 101 11.6* SA n.p. n.p. n.p. n.p. n.p. n.p. n.p. n.p. n.p. Tas n.p. n.p. n.p. n.p. n.p. n.p. n.p. n.p. n.p. NT 104 150 17.9* 158 229 33.9* 262 192 25.7* Australia 351 57 4.6* 426 66 10.2* 777 62 6.6*
n.p. is ‘not published’ as the rate is based on very small numbers. (a) Rate per 100,000 population (age-standardised). Source: AIHW analysis of ANZDATA
0
20
40
60
80
100
96 97 98 99 00 01 02 03 04 05 06 07 08 09 10 11 12 13 14
Inci
denc
e pe
r 100
,000
pop
ulat
ion
Year
Aboriginal and Torres Strait Islander femalesAboriginal and Torres Strait Islander malesNon-Indigenous Australians femalesNon-Indigenous Australians males
2
32
124
191
128
1 5 11 2033
0
50
100
150
200
250
300
0-24 25-44 45-54 55-64 65+
Inci
denc
e pe
r 100
,000
pop
ulat
ion
Age group (years)
Aboriginal and Torres Strait Islander peoples Non-Indigenous Australians
29 31
61
132 133
10 8 9 8 6
0
50
100
150
200
Major cities InnerRegional
OuterRegional
Remote Very RemoteInci
denc
e pe
r 100
,000
pop
ulat
ion
Remoteness area
Aboriginal and Torres Strait Islander peoples Non-Indigenous Australians

Health conditions
59
1.11 Oral health Why is it important? Oral health refers to the health of tissues of the mouth: muscle, bone, teeth, and gums. The two most frequently occurring oral diseases are tooth decay (termed ‘caries’) and gum (periodontal) disease. If not treated in a timely manner, these can cause discomfort and tooth loss, impacting a person's ability to eat, speak, and socialise without discomfort or embarrassment (Williams, S et al, 2011). Additionally, oral diseases can exacerbate other chronic diseases (Jamieson et al, 2010a) and have been found to be associated with cardiovascular diseases, diabetes, stroke and pre-term low birthweight (Williams, S et al, 2011; Roberts-Thomson et al, 2008).
Caries experience is measured by the average number of decayed, missing and filled infant/deciduous or adult/ permanent teeth. The number of teeth with caries reflects untreated dental disease, while the number of missing and filled teeth reflects the history of dental health problems and treatment. Aboriginal and Torres Strait Islander peoples are more likely than other Australians to have multiple caries, have lost all their teeth, and/or to have gum disease (Jamieson et al, 2010b). They are less likely to have received preventative dental care and more likely to have untreated dental disease and be hospitalised for dental conditions (Jamieson et al, 2010a; Kruger & Tennant, 2015).
Tooth decay can largely be prevented by diet (for example reducing intake of processed sugary foods/drinks), fluoridation of water supplies (Lalloo et al, 2015), appropriate use of fluoridated toothpaste, good oral hygiene and regular dental check-ups. The same risk factors apply to periodontal diseases as well as smoking, diabetes, stress, and substance use (particularly inhalant use). Lower levels of education and income and sub-standard living conditions are associated with oral diseases (Lalloo et al, 2016). In addition to oral hygiene and dental care, tooth loss is associated with increased age and trauma (Jamieson et al, 2010a; Williams, S et al, 2011).
Findings Based on self-reported Social Survey data, 28% of Indigenous children aged less than 15 years had teeth or gum problems in 2014–15. The most common types of problemswere with cavities or dental decay (12%), fillings due to dental decay (11%), needing braces/plate/retainer (6%) and having teeth pulled out due to dental decay (5%).
Among Indigenous children with reported teeth or gum problems, 56% experienced the problem/s for at least 12 months. Around 29% had their last dental check less
than 3 months ago. Eight per cent of Indigenous children with reported teeth or gum problems had never been to a dentist. In 2014–15, 6% of Indigenous children were reported as needing to go to the dentist in the previous 12 months but didn’t. The main reasons given by parents were cost (28%), followed by waiting time being too long or service not being available at the time required (18%).
Looking at preventative care, in 2014–15, 82% of Indigenous children aged under 15 years reported brushing their teeth daily; almost half (49%) last had a dental consultation within the previous 12 months and 31% reported having never seen a dentist. Of those who saw a dentist, 39% attended a school dental clinic (55% in remote areas), 25% a government dental clinic (including hospital) and 22% a private clinic (including specialists).
In the 2010 Child Dental Health Survey, for the states with reliable data (Qld, WA, SA, Tas, ACT and NT), the mean number of decayed or missing teeth among Indigenous children was almost twice that for non-Indigenous children in all age groups. By 14–15 years of age, Indigenous children had, on average, twice as many decayed teeth, 2.8 times the number of missing teeth and more filled teeth than non-Indigenous children. Indigenous children aged 5–10 years were less likely to have no decayed, missing or filled teeth (24%) than non-Indigenous children (45%). For those aged 6–15 years, 48% of Indigenous children had no decayed, missing or filled permanent teeth compared with 63% of non-Indigenous children.
In 2015, nearly 45,400 Indigenous children received dental services under the Child Dental Benefits Schedule (representing 20% of those eligible for these services). In comparison, 35% of eligible non-Indigenous children had received these services.
Between August 2007 and December 2015 more than 25,915 dental services were provided to over 10,939 Indigenous children in the NT under the National Partnership Agreement on Northern Territory Remote Aboriginal Investment (NTRAI), formerly Stronger Futures in the Northern Territory. The proportion of children treated for at least one dental problem was 41%, mostly for untreated tooth decay. Trend data to June 2012 shows that for children who received two or more courses of dental care, there was a 12% decline in the proportion with oral health problems (AIHW, 2012c). The proportion of dental service recipients with experience of tooth decay decreased for most age groups between 2009 and 2015. The greatest decrease was found in those aged 1-3 years old (from 73% to 42%) (AIHW, 2017c).
In the two years to June 2015, Indigenous children aged 0–4 years were hospitalised for dental conditions at twice the rate of
non-Indigenous children (6.9 per 1,000 compared with 3.6 per 1,000). This indicates poor access to, and a large unmet need for, dental care in this age group. Hospitalisation rates for dental problems declined after 14 years of age. Data on hospital dental procedures involving general anaesthesia show the highest rates were for Indigenous children in the 5–9 years age group (12 per 1,000) followed by 0–4 year-olds (8 per 1,000)—nearly twice the non-Indigenous rate (5 per 1,000). For non-Indigenous Australians, rates were highest for 15–24 year olds (17 per 1,000) compared with 4 per 1,000 for Indigenous Australians in this age group.
The 2012–13 Health Survey collected data on tooth loss, with 5% of Indigenous Australians aged 15 years and over reporting complete tooth loss and a further 47% reporting having lost at least one tooth (excluding wisdom teeth). Rates of complete tooth loss were highest for those aged 55 years and over living in non-remote areas (26%). The proportion was higher for those with: Year 9 or below as the highest Year of schooling (7 times those with Year 12); lowest income (7 times those with the highest income); diabetes (6 times those without); and heart/ circulatory problems (4 times those without).
In 2012–13, of those who had seen a dentist, 33% visited private dentists, 30% a government dental clinic, and 16% a dentist at an Aboriginal Medical Service. Around half (51%) waited less than one week to see a public dentist (non-remote areas). Nearly 14% had never seen a dentist. Nearly half (46%) of Indigenous Australians reported that they brushed their teeth 2 or more times a day and a further 35% reported that they brushed their teeth once a day.
In 2012–13, around 21% of Indigenous Australians reported that they didn’t go to a dentist when they needed to in the previous 12 months. Reasons included: cost (43%), waiting time too long or not available at time required (20%) and disliking professional/feeling embarrassed or afraid (19%).
Implications Available data indicate that dental health is worse for Indigenous Australians than for other Australians, for both children and adults. Barriers to good oral health include cost of services (see measure 3.14), healthy diets on limited budgets (see measure 2.19), attending services for pain not prevention, insufficient education about oral health and preventing disease, public dental services not meeting demand, lack of fluoridation in some water supplies, and cultural competency issues with some service providers (see measure 3.08) (Dyson et al, 2014; Durey et al, 2016; Johnson et al, 2014).
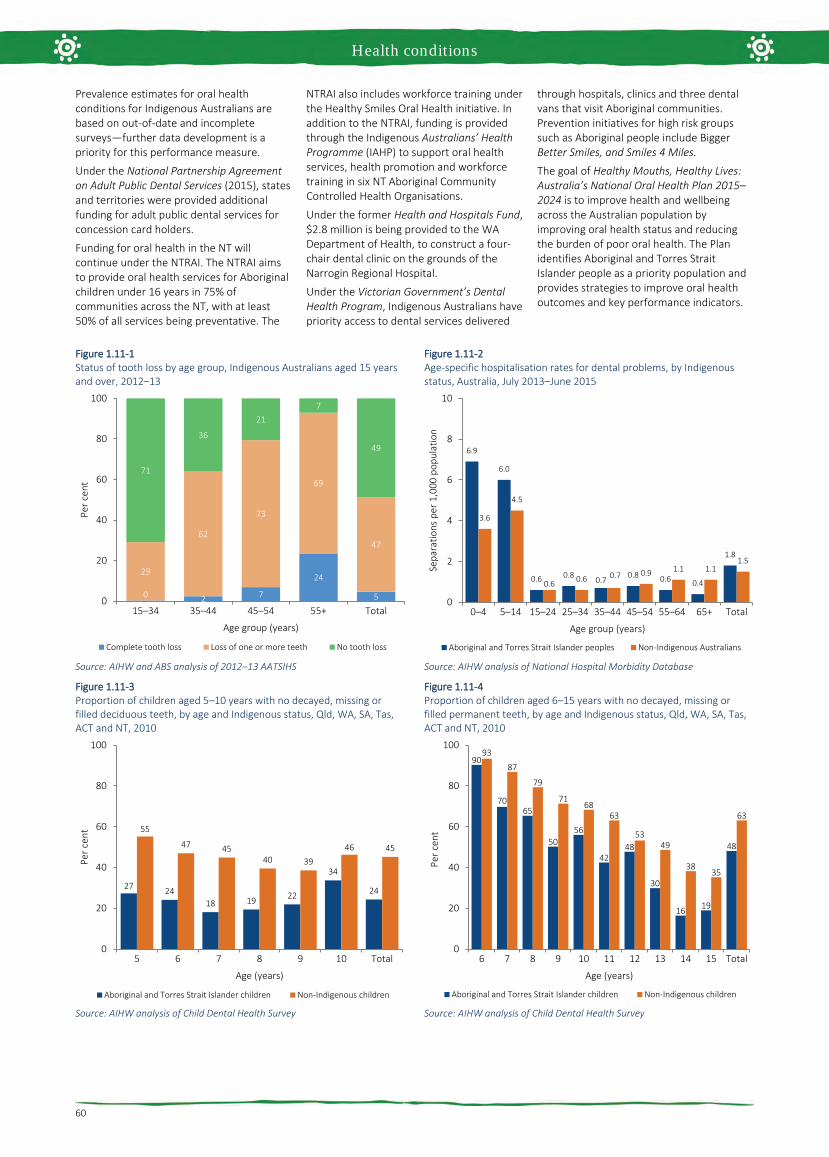
Health conditions
60
Prevalence estimates for oral health conditions for Indigenous Australians are based on out-of-date and incomplete surveys—further data development is a priority for this performance measure.
Under the National Partnership Agreement on Adult Public Dental Services (2015), states and territories were provided additional funding for adult public dental services for concession card holders.
Funding for oral health in the NT will continue under the NTRAI. The NTRAI aims to provide oral health services for Aboriginal children under 16 years in 75% of communities across the NT, with at least 50% of all services being preventative. The
NTRAI also includes workforce training under the Healthy Smiles Oral Health initiative. In addition to the NTRAI, funding is provided through the Indigenous Australians’ Health Programme (IAHP) to support oral health services, health promotion and workforce training in six NT Aboriginal Community Controlled Health Organisations.
Under the former Health and Hospitals Fund, $2.8 million is being provided to the WA Department of Health, to construct a four-chair dental clinic on the grounds of the Narrogin Regional Hospital.
Under the Victorian Government’s Dental Health Program, Indigenous Australians have priority access to dental services delivered
through hospitals, clinics and three dental vans that visit Aboriginal communities. Prevention initiatives for high risk groups such as Aboriginal people include Bigger Better Smiles, and Smiles 4 Miles.
The goal of Healthy Mouths, Healthy Lives: Australia’s National Oral Health Plan 2015–2024 is to improve health and wellbeing across the Australian population by improving oral health status and reducing the burden of poor oral health. The Plan identifies Aboriginal and Torres Strait Islander people as a priority population and provides strategies to improve oral health outcomes and key performance indicators.
Figure 1.11-1 Status of tooth loss by age group, Indigenous Australians aged 15 years and over, 2012–13
Source: AIHW and ABS analysis of 2012–13 AATSIHS
Figure 1.11-2 Age-specific hospitalisation rates for dental problems, by Indigenous status, Australia, July 2013–June 2015
Source: AIHW analysis of National Hospital Morbidity Database
Figure 1.11-3 Proportion of children aged 5–10 years with no decayed, missing or filled deciduous teeth, by age and Indigenous status, Qld, WA, SA, Tas, ACT and NT, 2010
Source: AIHW analysis of Child Dental Health Survey
Figure 1.11-4 Proportion of children aged 6–15 years with no decayed, missing or filled permanent teeth, by age and Indigenous status, Qld, WA, SA, Tas, ACT and NT, 2010
Source: AIHW analysis of Child Dental Health Survey
0 2 7
24
5
29
62
73
69
47
71
36
217
49
0
20
40
60
80
100
15–34 35–44 45–54 55+ Total
Per c
ent
Age group (years)
Complete tooth loss Loss of one or more teeth No tooth loss
6.9
6.0
0.6 0.80.7
0.8 0.6 0.4
1.8
3.6
4.5
0.6 0.6 0.7 0.9 1.1 1.11.5
0
2
4
6
8
10
0–4 5–14 15–24 25–34 35–44 45–54 55–64 65+ Total
Sepa
ratio
ns p
er 1
,000
pop
ulat
ion
Age group (years)
Aboriginal and Torres Strait Islander peoples Non-Indigenous Australians
27 2418 19 22
34
24
55
47 4540 39
46 45
0
20
40
60
80
100
5 6 7 8 9 10 Total
Per c
ent
Age (years)
Aboriginal and Torres Strait Islander children Non-Indigenous children
90
7065
5056
4248
30
16 19
48
93
87
79
7168
63
5349
3835
63
0
20
40
60
80
100
6 7 8 9 10 11 12 13 14 15 Total
Per c
ent
Age (years)
Aboriginal and Torres Strait Islander children Non-Indigenous children
Health conditions
61
1.12 HIV/AIDS, hepatitis and sexually transmissible infections Why is it important? Aboriginal and Torres Strait Islander peoples currently experience a relatively high number of notifications for bacterial sexually transmissible infections (STIs), relative to their representation in the total population (3%). In 2013–15, 13%–31% of new STI cases were for Indigenous Australians, and there were high notification rates for hepatitis B and C. Each of these infections can have potentially serious consequences if left untreated. Chronic hepatitis causes serious illness and can also progress to cirrhosis of the liver, cancer, and premature death (ASHA, 2017). It is estimated that of the 1% of the Australian population that is living with chronic hepatitis B, 9% are Aboriginal and Torres Strait Islander peoples (MacLachlan et al, 2013).
Indigenous Australians experience disease burden from unsafe sex 3.9 times that of non-Indigenous Australians (AIHW, 2016f). STIs can have serious long-term consequences, such as chronic abdominal pain or infertility in women after gonorrhoea and chlamydia, and heart and brain damage caused by syphilis (Bowden et al, 2002; Department of Health, 2014; Guy et al, 2012). Several of these infections can cause miscarriage (Campbell, S et al, 2011). The impact of HIV is well documented.
Notification data includes cases that have been tested, diagnosed and notified to health authorities, representing only a proportion of the total incidence of disease. Changes in notification rates over time are influenced by a range of factors including access to health care, improved screening programmes for Indigenous Australians and improved accuracy of tests. For Indigenous Australians, the accuracy of Indigenous identification in the data is also an issue and varies by jurisdiction. Improved primary health care can lead to increased testing and a corresponding increase in notification rates.
Findings During the three years 2013 to 2015 there were approximately 19,500 notifications among Aboriginal and Torres Strait Islander peoples for chlamydia (in Qld, WA, SA and the NT combined). After adjusting for differences in age structure, the notification rate was 4 times as high as for other Australians. Between 1996–97 and 2013–15, in WA, SA and the NT combined, the notification rate for chlamydia doubled for Indigenous Australians. While rates for other Australians also increased, they did so at a slower pace and so the gap widened.
For the period 2013–15, there were approximately 11,000 notifications of gonorrhoea among Aboriginal and Torres Strait Islander peoples (for all jurisdictions combined excluding NSW). After adjusting for differences in age structure, rates were 14 times higher than for other Australians. Between 1996–97 and 2013–15 in WA, SA and the NT combined, there was no significant change in rates for Indigenous Australians and no change in the gap. For other Australians there was a significant increase for males but no significant change for females.
There were also 1,500 notifications for syphilis among Indigenous Australians over this period (all jurisdictions). After adjusting for differences in age structure, rates were 5 times as high as for other Australians.
Between 1996–97 and 2013–15 in WA, SA and the NT combined, the notification rate for syphilis declined for Indigenous Australians. However, between 2011 and 2016, there has been an outbreak of syphilis across northern Australia, resulting in four reported deaths among Indigenous Australians (MSOWG, 2016).
During the three years 2013 to 2015 there were 308 new notifications for hepatitis B and 1,021 for hepatitis C among Indigenous Australians. Rates were 3.9 times other Australian rates for hepatitis C and 1.7 times for hepatitis B. Between 2007–09 and 2013–15 there was a decline in the hepatitis B notification rate for Indigenous Australians in WA, SA and NT combined. As at December 2015, hepatitis B vaccination rates were at 96% and 95% for Indigenous and non-Indigenous children aged two years respectively.
In 2013–15 for hepatitis C, notifications were highest in the 25–44 age groups for both populations. There has been a significant increase over time in hepatitis C notification rates for Indigenous Australians while over the same period there was a decline for other Australians and an increase in the gap (1996–97 to 2013–15 in WA, SA and the NT combined). The pattern of infection by age groups varies by disease. Those aged 15–24 years have the highest rates for chlamydia and gonorrhoea while the other diseases extend into the middle years.
There have been no significant changes detected in the notification rate of HIV infection for Aboriginal and Torres Strait Islander peoples and other Australians between 2001–03 and 2013–15. For the period 2013–15, the notification rate of HIV was 5.5 per 100,000 for Indigenous Australians and 4.5 per 100,000 for other Australians. Sexual contact between men was the highest HIV risk for both populations; however, injecting drug use represented 22% of Indigenous risk exposure, compared with 2% for other
Australians. AIDS is no longer a notifiable disease.
Implications STIs are a major health problem for Aboriginal and Torres Strait Islander peoples. Bacterial STIs are treatable through antibiotics, but if left untreated can have significant health consequences (ASHA, 2017). A range of access issues have been identified for health care (see measure 3.14) and shame has been found to be an additional factor for STIs ((MacPhail & McKay, 2016). Risky sexual behaviours, along with illicit drug use and alcohol use are important risk factors for STIs (Wand et al, 2016). Social determinants have also been linked to patterns of risky sexual behaviour (MacPhail & McKay, 2016).
High rates of infection for Indigenous Australians and disparity with rates for non-Indigenous Australians highlight the need for targeted prevention and information, along with opportunistic testing (Graham, S et al, 2015; Fairley & Hocking, 2012; O'Connor et al, 2014). Evidence suggests that comprehensive strategies including community education and health promotion are most effective in reducing STIs (Strobel & Ward, 2012). Peer education has also been noted as a potential strategy for prevention (MacPhail & McKay, 2016).
The Indigenous rate of HIV in 2013–15 was 1.2 times the non-Indigenous rate. Nevertheless, Indigenous Australians remain disproportionately vulnerable to HIV due to factors such as high rates of STIs, poorer general health, high levels of injecting drug use and also unique challenges in accessing HIV treatment and care (Templeton et al, 2015; Ward et al, 2016). A recent study found no difference in HIV clinical outcomes between Indigenous and non-Indigenous Australians, however Indigenous patients had lower rates of testing for HIV and lipid/glucose measurements at half the recommended frequency (Templeton et al, 2015).
Notification rates for chlamydia and gonorrhoea are highest in the 15–24 year age group. The value of youth having a voice in the delivery of health services, programmes and policies that affect them, is recognised in the Implementation Plan for the National Aboriginal and Torres Strait Islander Health Plan 2013–2023. A deliverable of the Implementation Plan is the development of a national health policy for Aboriginal and Torres Strait Islander young people by 2018. This policy will be developed alongside Aboriginal and Torres Strait Islander young people, and will include appropriate strategies to address STI and blood-borne viruses.
The Fourth National Aboriginal and Torres Strait Islander Blood Borne Viruses and Sexually Transmissible Infections Strategy

Health conditions
62
2014–17 is one of a set of five national strategies aimed at reducing the transmission of STIs and blood-borne viruses and the associated morbidity, mortality, personal and social impacts. Priority action areas include improving vaccination coverage for hepatitis B and HPV in adults,
increasing provider initiated testing, increasing treatment rates for people with blood-borne viruses, supporting Aboriginal community controlled health services, reducing racism, stigma and discrimination in community and health-care settings and improving prevalence and incidence data.
Previous strategies have increased testing and may account for improvements in detection and increased rates. However, under-identification of Indigenous Australians and the volatility in small numbers means that caution should be used in interpreting trends in these data.
Figure 1.12-1 Age-standardised notification rate for 5 infectious diseases, Aboriginal and Torres Strait Islander peoples, WA, SA and the NT, 1996–97 to 2013–15
Source: AIHW analysis of National Notifiable Diseases Surveillance System
Figure 1.12-2 Age-standardised notification rates for HIV, by Indigenous status, 2001–03 to 2013–15
Source: AIHW analysis of National HIV Registry
Figure 1.12-3 Notification rates for chlamydia and gonorrhoea by Indigenous status and age, selected states(a), 2013–15
(a) Totals are age-standardised. Data are reported for Qld, WA, SA and the NT for chlamydia and for Vic, WA, SA, Tas, ACT and NT for gonorrhoea. Source: AIHW analysis of National Notifiable Diseases Surveillance System
Figure 1.12-4 Notification rates for hepatitis B and C by Indigenous status and age, selected states(a), 2013–15
(a)Totals are age-standardised. Data are reported for WA, SA, NT, ACT and Tas for hepatitis B and for WA, SA, NT and Tas for hepatitis C. Source: AIHW analysis of National Notifiable Diseases Surveillance System
0
400
800
1,200
1,600
1996–97 1998–00 2001–03 2004–06 2007–09 2010–12 2013–15
Not
ifica
tions
per
100
,000
pop
ulat
ion
Year
Chlamydia Gonorrhoea SyphilisHepatitis B Hepatitis C
0.0
1.0
2.0
3.0
4.0
5.0
6.0
2001–03 2004-06 2007-09 2010-12 2013-15N
otifi
catio
ns p
er 1
00,0
00 p
opul
atio
n
Year
Aboriginal and Torres Strait Islander peoples Other Australians
196
5,269
2,248
741
253 116 30
1,580
119
2,020
1,281
596 187 75 23
732
10
1,761
766
196 79 31 7 389
1 125 130 62 35 14 3 51
0
1,000
2,000
3,000
4,000
5,000
6,000
0–14 15–24 25–34 35–44 45–54 55–64 65+ Total 0–14 15–24 25–34 35–44 45–54 55–64 65+ Total
Not
ifica
tions
per
100
,000
pop
ulat
ion
Age group (years)Aboriginal and Torres Strait Islander peoples Other Australians
GonorrhoeaChlamydia
6 34
55 77 84 78
96
43
3
204
300 302
174
76
4
147
2 31
60 43
25 16 8 26
1 29
67 72 61 42
7 38
0
100
200
300
400
0–14 15–24 25–34 35–44 45–54 55–64 65+ Total 0–14 15–24 25–34 35–44 45–54 55–64 65+ Total
Not
ifica
tions
per
100
,000
pop
ulat
ion
Age group (years)Aboriginal and Torres Strait Islander peoples Other Australians
Hepatitis B Hepatitis C
Human function
63
1.13 Community functioning Why is it important? Aboriginal and Torres Strait Islander peoples have long sought health outcomes encompassing the physical, social, cultural and emotional elements of life. This includes the ability to live proudly and freely as Aboriginal and Torres Strait Islander peoples (OATSIH, 2004). Functioning is about the things people achieve or experience, consistent with their account of wellbeing, varying from ‘being adequately nourished and being free from avoidable disease, to very complex activities or personal states, such as being able to take part in the life of the community and having self-respect’ (Sen, 1999; AIHW, 2014h). The conversion of capabilities into functioning is influenced by the values and personal features of individuals, families and communities and by the social and cultural environment in which they live. Different cultures give greater or lesser priority to different types of functioning, and do not necessarily align with Western perspectives (Sen, 1999; Taylor, J et al, 2012).
‘Community Functioning’ in the HPF is defined as the ability and freedom of community members and communities to determine the context of their lives (e.g. social, cultural, spiritual, organisational) and to translate their capability (knowledge, skills, understanding) into action (to make things happen and achieve a life they value).
To develop a picture of family and community functioning from Aboriginal and Torres Strait Islander peoples’ perspectives, workshops drawing together participants from across Australia were held in 2008 and 2010. Participants at the workshops described the various elements of family and community life essential for high levels of functioning. The workshops identified a number of key themes and weighted these functionings according to their relative value. In 2010, six themes were identified by Aboriginal and Torres Strait Islander participants and these have been used to analyse and present available data.
Participants were drawn from a number of jurisdictions and settings so the themes they identified appear to reflect widely held views among Aboriginal and Torres Strait Islander peoples.
While community functioning is a strengths-based measure, analysis of the institutional, interpersonal and internalised elements of racial discrimination suggest this factor deters and undermines community functioning and increases ill-health (Cunningham & Paradies, 2013). In 2014–15, one-third (35%) of Indigenous Australians aged 15 years and over reported being treated unfairly in the last 12 months because they were Aboriginal and/or Torres
Strait Islander. These estimates are conservative, with research specialising in racial discrimination reporting 97% of Indigenous Australians in the sample experiencing racism (Kelaher et al, 2014). For more details, see Racism in the Introduction and measure 3.08.
Findings Outlined below is a description of each of the six themes and the key findings for Aboriginal and Torres Strait Islander peoples, using data from the 2014–15 Social Survey.
Connectedness to country, land, and history; culture and identity • Being connected to country, land, family
and spirit • Strong and positive social networks with
Aboriginal and Torres Strait Islanderpeoples
• Strong sense of identity and being part ofa collective
• Sharing; giving and receiving; trust; love;looking out for others
Data from the 2014–15 Social Survey showed:
• 74% of Aboriginal and Torres StraitIslander peoples aged 15 years and overrecognised their homelands.
• 62% identified with a clan or languagegroup.
• 90% ‘feel able to have a say with familyand friends’ some, most, or all or the time.
• 95% had contact with family or friendsoutside the household at least once perweek.
• 82% had friends to confide in.• 82% were able to get support in a time of
crisis from a family member living outsidethe household.
• 63% had attended an Aboriginal andTorres Strait Islander cultural event in thelast 12 months.
Data from the 2012–13 Health Survey showed that 83% of Aboriginal and Torres Strait Islander adults reported feeling proud of who they are. Three-quarters reported that they get the emotional support and help they need from their family (75%) and that their family really tries to help them (76%).
Resilience • Coping with the internal and external
world • Power to control options and choices• Ability to proceed in public without shame • Optimising what you have • Challenge injustice and racism, stand up
when required• Cope well with difference, flexibility,
accommodating • Ability to walk in two worlds • Engaged in decision-making• External social contacts
Data from the 2014–15 Social Survey showed:
• 86% of Aboriginal and Torres StraitIslander peoples aged 15 years and overreported that they did not avoid situationsdue to past discrimination.
• 81% agreed that their doctor could betrusted and 70% agreed that the localschool could be trusted. People living inremote areas were more likely to trusttheir local school (79%) compared withpeople in non-remote areas (68%).
• 89% felt they were able to find generalsupport from outside the household.
• 59% had provided support to someoneoutside their household in the last fourweeks.
• 97% had participated in sport, social orcommunity activities in the last 12months.
• 41% of employed people said workallowed them to fulfil culturalresponsibilities. People living in remoteareas were more likely to have work thatallowed for cultural responsibilities (63%)compared with work in non-remote areas(36%).
Leadership • Strong elders in family and community,
both male and female • Role models, both male and female• Strong direction, vision• The ‘rock’, someone who has time to listen
and advise
Data from the 2014–15 Social Survey showed that 44% of children aged 4–14 years had spent time with an Indigenous leader or Elder in the last week.
Having a role, structure and routine • Having a role for self: participation,
contributing through paid and unpaid roles• Capabilities and skills derived through
social structures and experience throughnon-formal education
• Knowing boundaries and acceptablebehaviours
• Sense of place–knowing your place infamily and society
• Being valued and acknowledged• Disciplined
Data from the 2014–15 Social Survey showed:
• 59% of Aboriginal and Torres StraitIslander peoples aged 15 years and overhad not experienced being without apermanent place to live. This wasassociated with low to moderate levels ofpsychological distress and verygood/excellent health status.
• 72% were in households that had notexperienced cash flow problems in the last12 months.
• 85% were in households in which therehad been no days without money for basicliving expenses in the last two weeks.
• Most children aged 0–14 years (96%) hadparticipated in informal learning activitieswith their main carer.

Human function
64
Feeling safe • Lack of physical and lateral violence • Safe places• Emotional security• Cultural competency• Relationships that can sustain
disagreement
Data from the 2014–15 Social Survey showed:
• 78% had not experienced physical and/orthreatened violence in the last 12 months.
• 84% felt safe at home alone after dark.This was associated with excellent or verygood self-assessed health and low tomoderate levels of psychological distress.
• In the five years prior to the survey, 97%of Aboriginal and Torres Strait Islanderpeoples had not been incarcerated (91%had never been incarcerated in theirlifetime).
Vitality The final theme, vitality, covers community infrastructure, access to services, education, health, income and employment.
Data from the 2014–15 Social Survey showed:
• 66% of those aged 15 years and over hadexperienced low/moderate levels ofpsychological distress in the four weeksbefore the survey.
• 68% of children aged 0–14 years did nothave problems sleeping.
• 76% of children aged 4–14 years spent atleast 60 minutes every day beingphysically active.
• 75% of people aged 15 years and over saidthey can easily get to places as needed.This was associated with feeling able tohave a say with family and friends in thecommunity.
• Many Aboriginal and Torres Strait Islanderpeople were seeking to improve theirknowledge, skills and qualifications, withmore than half (53%) intending to study inthe future.
• 79% of those aged 15 years and overaccessed the internet in the last 12months.
New analysis prepared by Biddle (2017) looked at the relationship between measures of community functioning and measures of wellbeing using the 2014–15 Social Survey. This analysis found that community functioning was strongly associated with individual measures of wellbeing. Those with high levels of all three measures of community functioning (connectedness, resilience and safety) were more likely to be satisfied with their life, more likely to report that they were a happy person all or most of the time, and less likely to report that they felt so sad that nothing could cheer them up.
High community functioning scores were positively associated with living in remote areas, post-school qualifications and high
income. The young tended to have lower values, as did those with relatively low levels of education. Those who were not employed and those who had changed usual residence had lower values.
Living in a private rental or state housing were negatively associated with the safety measures; while living in community rentals and also overcrowded houses were positively associated with connectedness measures.
Those with higher values in the resilience and safety measures were more likely to report that they did not have any barriers to accessing services. However, controlling for those two measures and a range of demographic, socio-economic and geographic variables, there was a negative association between connectedness and service access.
One of the main findings from the analysis was that there was no single index that was able to summarise the variation in the community functioning measures. Rather, that community functioning is better thought of as a set of themes and related constructs with complex relationships with sociodemographic factors and wellbeing.
A recent qualitative study with Yaegl Indigenous community members between 2006-10, showed the importance participants placed on relationships for strength and functioning. The study found that strengths and resources of a community need to be recognised and valued in health and mental health initiatives, as tools in risk-prevention, strengthening recovery, and enhancing wellbeing (McLennan, 2015).
Lohoar and colleagues in 2014 showed the strengths of Aboriginal and Torres Strait Islander cultural practices in family life and child rearing. The study found that culture can be a protective factor for children, families and communities, dependent on necessary social conditions being in place (Lohoar et al, 2014).
Implications Community functioning underpins health outcomes encompassing the physical, social, cultural and emotional elements of life.
The Family Wellbeing program is a social and emotional wellbeing program originally developed in 1993 in SA and in over 20 years has spread to 56 sites across most states and territories. Its objective is to develop people’s skills and capacity to move from a position of disempowerment to empowerment (Monson-Wilbraham, 2014). It has been found to increase the capacity of participants to exert greater control over their health and wellbeing (Tsey & Every, 2000).
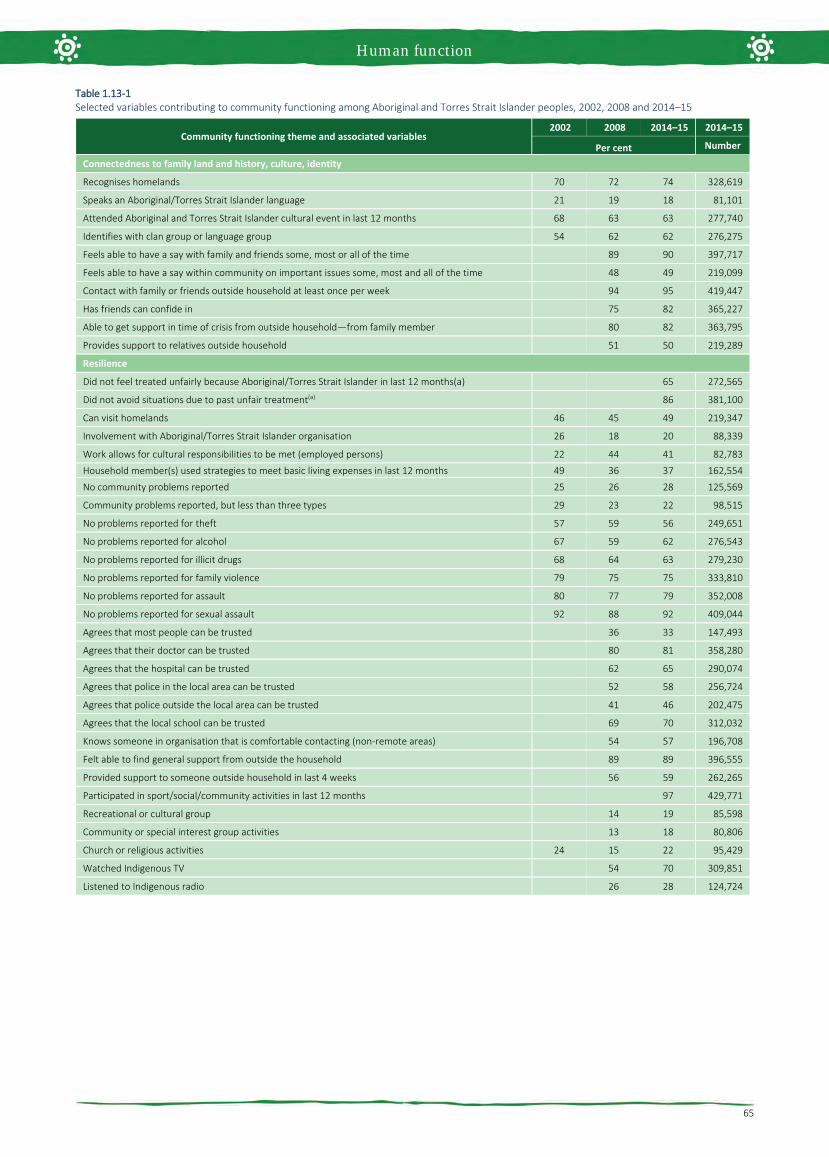
Human function
65
Table 1.13-1 Selected variables contributing to community functioning among Aboriginal and Torres Strait Islander peoples, 2002, 2008 and 2014–15
Community functioning theme and associated variables 2002 2008 2014–15 2014–15
Per cent Number
Connectedness to family land and history, culture, identity
Recognises homelands 70 72 74 328,619
Speaks an Aboriginal/Torres Strait Islander language 21 19 18 81,101
Attended Aboriginal and Torres Strait Islander cultural event in last 12 months 68 63 63 277,740
Identifies with clan group or language group 54 62 62 276,275
Feels able to have a say with family and friends some, most or all of the time 89 90 397,717
Feels able to have a say within community on important issues some, most and all of the time 48 49 219,099
Contact with family or friends outside household at least once per week 94 95 419,447
Has friends can confide in 75 82 365,227
Able to get support in time of crisis from outside household—from family member 80 82 363,795
Provides support to relatives outside household 51 50 219,289
Resilience
Did not feel treated unfairly because Aboriginal/Torres Strait Islander in last 12 months(a) 65 272,565
Did not avoid situations due to past unfair treatment(a) 86 381,100
Can visit homelands 46 45 49 219,347
Involvement with Aboriginal/Torres Strait Islander organisation 26 18 20 88,339
Work allows for cultural responsibilities to be met (employed persons) 22 44 41 82,783
Household member(s) used strategies to meet basic living expenses in last 12 months 49 36 37 162,554
No community problems reported 25 26 28 125,569
Community problems reported, but less than three types 29 23 22 98,515
No problems reported for theft 57 59 56 249,651
No problems reported for alcohol 67 59 62 276,543
No problems reported for illicit drugs 68 64 63 279,230
No problems reported for family violence 79 75 75 333,810
No problems reported for assault 80 77 79 352,008
No problems reported for sexual assault 92 88 92 409,044
Agrees that most people can be trusted 36 33 147,493
Agrees that their doctor can be trusted 80 81 358,280
Agrees that the hospital can be trusted 62 65 290,074
Agrees that police in the local area can be trusted 52 58 256,724
Agrees that police outside the local area can be trusted 41 46 202,475
Agrees that the local school can be trusted 69 70 312,032
Knows someone in organisation that is comfortable contacting (non-remote areas) 54 57 196,708
Felt able to find general support from outside the household 89 89 396,555
Provided support to someone outside household in last 4 weeks 56 59 262,265
Participated in sport/social/community activities in last 12 months 97 429,771
Recreational or cultural group 14 19 85,598
Community or special interest group activities 13 18 80,806
Church or religious activities 24 15 22 95,429
Watched Indigenous TV 54 70 309,851
Listened to Indigenous radio 26 28 124,724

Human function
66
Table 1.13-1 Selected variables contributing to community functioning among Aboriginal and Torres Strait Islander peoples, 2002, 2008 and 2014–15
Community functioning theme and associated variables 2002 2008 2014-15 2014-15
Per cent Number
Leadership
Child spent time with an Indigenous leader or elder in last week (4–14 years) 42 44 75,994 Encouragement from elders and council would help child (currently in secondary school) to complete Year 12 22 24 9,992
Structure and routine/having a role Can communicate with English speakers without difficulty (Indigenous language is main language spoken at home)
72 62 29,030
Has lived in only one dwelling for the past year or longer 69 78 77 341,689
Child involved in informal learning activities with carer in last week (0–14 years) 94 96 232,525
Feeling Safe
Felt safe at home alone after dark 80 84 372,265
Felt safe walking alone in local area after dark 53 54 237,867
Not a victim of physical or threatened violence in the last 12 months 76 75 78 344,665
Indigenous culture taught at school (children aged 2–14) 53 54 112,787
Was taught Indigenous culture at school or as part of further studies 45 47 208,374
Learnt about own Indigenous clan/language 17 17 73,385
Not incarcerated in the last 5 years 93 97 97 429,112
Never incarcerated 91 91 404,346
Vitality
Self-assessed health status excellent or very good 44 44 40 175,967
Has no disability or restrictive long term-health condition 64 50 55 243,833
Low/ moderate level of psychological distress (5–11 K5 score) 68 66 294,290
Employed (persons aged 15–64 years in the labour force) 54 48 202,098
Year 12 highest year of school completed (excluding secondary school students) 18 22 26 114,114
Has a non-school qualification (persons aged 25–64) 32 40 54 150,105
Living in a dwelling that has no major structural problems 72 317,747
Accessed internet in last 12 months 41 59 79 348,436
Has access to motor vehicles whenever needed 55 66 68 302,703
Can easily get to places needed 70 74 75 333,967
Total persons aged 15 years and over 100 100 443,419
Note: Unless otherwise indicated percentages are of the estimated total Aboriginal and Torres Strait Islander population aged 15 years and over. Where another population is indicated, this has been used to calculate the percentage. (a) Not comparable to previous years as question asked differently in 2014–15 Source: ABS and AIHW analysis of 2002, 2008 and 2014–15 NATSISS

Human function
67
1.14 Disability Why is it important? Disability may be an impairment of body structure or function, a limitation in activities and/or a restriction in a person’s participation in specific activities. A person’s functioning involves an interaction between health conditions and environmental and personal factors. Aboriginal and Torres Strait Islander peoples are at greater risk of disability due to increased exposure to factors such as low birthweight, chronic disease, infectious diseases (e.g. otitis media), injury and substance use. Along with limited access to early treatment and rehabilitation services, these factors increase the risk of a person acquiring a disability. Such factors tend to be more prevalent in populations where there are higher rates of unemployment, lower levels of income, poorer diet and living conditions, and poorer access to adequate health care.
Findings The 2014–15 Social Survey collected data for those aged 15 years and over on a broad definition of disability (i.e. those reporting a limitation, restriction, impairment, disease or disorder that has lasted, or is expected to last, for 6 months or more, which restricts everyday activities) (ABS, 2016e). Results are self-reported and therefore could be under-stated. In 2014–15, 45% of Indigenous Australians aged 15 years and over had a disability or restrictive long-term health condition. There has been a decline in this rate since 2008 (down 5 percentage points from 50%). Disability increases with age, ranging from 32% of those aged 15–24 years to 74% of those aged 65 years and over.
Around 8% of Indigenous Australians aged 15 years and over had a profound or severe core activity limitation with at least one activity of everyday living (self-care, mobility or communication). A further 6% reported a moderate core activity limitation and 9% a mild limitation. Schooling/employment restrictions only were reported by a further 6% of Indigenous Australians. Thirty-seven per cent of Indigenous students aged 15–64 years with a disability reported difficulty with pursuing their education. Difficulties with employment were reported by 42% of Indigenous Australians aged 15–64 with a disability.
Indigenous females aged 15 years and over had a higher rate of disability (47%) than Indigenous males (43%). Of those with a disability, 64% had physical disabilities, 47% sight/hearing/speech disabilities, 19% psychological and 18% intellectual disabilities. Variations in self-reported responses by jurisdiction and remoteness may be affected by factors such as perceptions of health and access to health
care for diagnosis. Self-reported rates of disability or restrictive long-term health conditions were lowest in the NT (40%) and highest in Tasmania (54%). Rates were similar in remote areas (44%) and non-remote areas (45%).
In 2014–15, after adjusting for differences in the age structure of the two populations, Indigenous Australians aged 15 years and over were 1.7 times as likely to have a disability or restrictive long-term health condition as non-Indigenous Australians, and 2.1 times as likely to have a profound/severe core activity limitation. Indigenous disability rates are higher than non-Indigenous rates for all age-groups, and particularly higher in the younger years. More than half (52%) of Indigenous Australians aged 15 years and over reporting disability were not in the labour force, compared with 33% of those without. Indigenous Australians with a disability were also more likely than those without a disability to be living in households in the lowest income quintile (43% compared with 33%) and to have had problems accessing services (29% compared with 20%).
The 2012–13 Health Survey results included data on disability and restrictive health conditions for all age groups. In 2012–13, 36% of all Indigenous Australians had a disability or restrictive long-term condition.
The 2011 Census collected data on one element of disability (i.e. those reporting the need for assistance with core activities). In the 2011 Census, 5.7% of the total Indigenous population were identified as needing assistance with a core activity (self-care, mobility or communication) some or all of the time. Rates were similar for males (6.1%) and females (5.4%). Variations in self-reported rates by jurisdiction and remoteness should be treated with caution. Rates ranged from 4.5% of Indigenous Australians in the NT to 6.9% in Victoria. In 2011, Indigenous Australians were twice as likely to have a core activity need for assistance as non-Indigenous Australians. ACT had the largest gap followed by WA. The proportion of Indigenous Australians with a core activity need for assistance was higher in all age groups; however, rates increased from 40 years on for Indigenous Australians and from around 60 years for non-Indigenous Australians. In 2011, 13% of Indigenous Australians aged 15 years and over provided unpaid care to a person with a disability, long-term illness or problems related to old age, 1.2 times the non-Indigenous proportion. Carers were less likely to be in the labour force (54%) than non-carers (59%).
In 2014–15, 19,000, or 5.9% of disability support service users under the National Disability Agreement were Indigenous (AIHW, 2016aa). In 2014–15, there were 118 Indigenous Australians who transitioned
from the disability support services to the National Disability Insurance Scheme (NDIS) (out of 1,900 who transitioned that year). For persons aged under 65 years, Indigenous Australians used disability support services at twice the rate of non-Indigenous Australians (28 per 1,000 compared with 15 per 1,000). Rates of Indigenous service users were highest in Victoria (50 per 1,000) and lowest in Tasmania (17 per 1,000). Rates were higher in non-remote areas (30 per 1,000) than remote areas (16 per 1,000). Intellectual disability was the most common primary disability group for Indigenous service users (27%), followed by physical (18%) and psychiatric disability (18%). Most commonly used were community support services (54%), followed by employment services (36%). The disability support pension was the main income source for Indigenous and non-Indigenous service users (59% and 58% respectively).
Implications Although disability prevalence varies across data sources, all show a higher rate of disability experienced by Indigenous Australians compared with non-Indigenous Australians. The high levels of disability and earlier onset of core activity restrictions experienced by Indigenous Australians are consistent with the levels of disease and injury, socio-economic and environmental factors, health risk factors and lower access to health services relative to need. There is a clear link between disability and socio-economic disadvantage and the relationship between these factors is cyclical (Kavanagh et al, 2013; VicHealth, 2012). Lower levels of educational attainment, participation in the workforce and lower income are likely to be both the cause and consequence of disability (Biddle, 2013).
The National Disability Strategy 2010–2020 provides a 10 year national policy framework for all levels of government to improve the lives of people with disability. The Strategy seeks to drive a more inclusive approach to the design of policies, programmes and infrastructure so that people with a disability can participate in all areas of Australian life. A new plan for improving outcomes for Indigenous Australians with disability will be incorporated as a component of the Strategy’s second implementation plan.
The Indigenous plan will include areas for future focus and will consist of activities across both specialist and mainstream policy areas such as education, employment, health and the National Disability Insurance Scheme (NDIS). Through the National Disability Agreement, all Australian governments developed a National Indigenous Access Framework, which aims to ensure the needs of Indigenous Australians with disability are addressed through appropriate service delivery arrangements. As at June 2016, 6% of those

Human function
68
with approved plans under the NDIS were Indigenous (1,831 people)(NDIA, 2016).
The NDIS is being gradually implemented across Australia, with trial sites since July 2013. The NDIS provides funding for long-
term, individualised care and support to meet the needs of people with permanent disability, where a person’s disability significantly affects their communication, mobility, self-care or self-management. The NDIS will be progressively rolled out from 1
July 2016, and full rollout is expected to be completed by 2019. Once the scheme is fully rolled out, it will provide support for about 460,000 people who have a significant and permanent disability.
Figure 1.14-1 Disability status for those aged 15 years and over by Indigenous status and age group, 2014–15(a)
(a) Totals are age-standardised. Source: ABS and AIHW analysis of 2014–15 NATSISS
Table 1.14-1 Disability type, by age group for those aged 15 years and over, Aboriginal and Torres Strait Islander peoples 2014–15
Disability type 15–24 25–34 35–44 45–54 55–64 65+ Total
Per cent Sight, hearing, speech 44 35 39 55 58 64 47 Physical 41 65 70 71 74 72 64 Intellectual 30 15 19 15 9 12 18 Psychological 20 23 24 18 17 9 19 Head injury, stroke or brain damage 1 2 3 5 4 5 3 Other 16 24 31 32 42 34 28 Total with a disability or long-term health condition (a) 100 100 100 100 100 100 100
(a) Note that more than one disability type may be reported and thus the sum of the components may add to more than the total. Source: ABS and AIHW analysis of 2014–15 NATSISS
Figure 1.14-2 Proportion of persons with core activity need for assistance, by Indigenous status and age group, 2011
Source: ABS and AIHW analysis of 2011 Census data
Figure 1.14-3 Proportion of Aboriginal and Torres Strait Islander peoples aged 15 years and over, with disability/long-term restrictive condition, by jurisdiction and remoteness, 2014–15
Source: ABS and AIHW analysis of 2014–15 NATSISS
5 5 8 9 1119
9
3238
4957
62
74
50
6862
5143
39
26
50
2 2 3 48 11
4
18 1723
30
45
57
30
82 8478
70
55
43
70
0
20
40
60
80
100
15–24 25–34 35–44 45–54 55-64 65+ Total 15–24 25–34 35–44 45–54 55-64 65+ Total 15–24 25–34 35–44 45–54 55-64 65+ Total
Per c
ent
Age group (years)
Aboriginal and Torres Strait Islander peoples Non-Indigenous Australians
Profound/severe core activity limitation Total with disability/long term health condition No disability or long-term health condition
0
10
20
30
40
50
Per c
ent
Age group (years)
Aboriginal and Torres Strait Islander peoplesNon-Indigenous Australians
48 49
42 4347
54
4540
45 44 45
0
10
20
30
40
50
60
Per c
ent

Human function
69
1.15 Ear health Why is it important? Hearing loss among Aboriginal and Torres Strait Islander peoples is widespread and much more common than for non-Indigenous Australians (Burns & Thomson, 2013; Darwin Ottis Guidelines Group et al, 2010).
Otitis media is an inflammation of the middle ear. Otitis media with effusion involves a collection of fluid within the middle ear space. Chronic suppurative otitis media occurs with persistent discharge through a perforation in the eardrum and active bacterial infection within the middle ear space (Dawin Ottis Guidelines Group et al, 2010). Otitis media is a significant cause of hearing loss in Indigenous children and is characterised by earlier onset, higher frequency, greater severity and greater persistence than non-Indigenous children (Jervis-Bardy et al, 2014). Several studies have found that Indigenous children living in remote communities experience high rates of severe and persistent ear infections (Edwards, J & Moffat, 2014; Morris et al, 2007; Gunasekera et al, 2009; Kong & Coates, 2009). Hearing loss, especially in childhood, can lead to linguistic, social and learning difficulties and behavioural problems in school. Such difficulties may reduce educational achievements and have lifelong consequences for wellbeing, employment, income, social success, contact with the criminal justice system and future potential (Williams, DR & Mohammed, 2009).
Otitis media is associated with poverty, crowded housing conditions and nutritional deficiencies (Burns & Thomson, 2013). Second hand smoke is a cause of middle ear infection, including otitis media (Office on Smoking & Health (US), 2006).
Findings Self-reported survey data may under-estimate health conditions as it only includes conditions diagnosed by a doctor or nurse. There has been a significant decline in the national proportion of Indigenous children aged 0–14 years with self-reported ear or hearing problems, from 11% in 2001 to 8% in 2014–15 (ABS, 2016e). In remote areas the decline was steeper, from 18% to 11%. However, in 2014–15 the proportion of Indigenous children with ear/hearing problems was still 2.9 times the rate for non-Indigenous children. The NT and WA had the highest rate for Indigenous children with hearing problems (11% and 10% respectively) and Tasmania/ACT the lowest (5%). Deafness was reported for 3.0% of Indigenous children, otitis media for 2.9% and other ear diseases 3.5%. In 2014–15, of those Indigenous children aged 0–14 years
with ear and hearing problems, 83% received some form of treatment including medication (48%), check by an ear/hearing specialist (46%) and surgery (31%); while 16% did not have any treatment for their ear and hearing problems. Note for some forms of ear disease the protocol is to ‘watch and wait’ (Darwin Ottis Guidlines Group et al, 2010).
The 2012–13 Health Survey collected comprehensive long-term health condition data for all age groups. In 2012–13, 12% of all Indigenous Australians reported an ear or hearing problem. The pattern of ear health problems varies with age. Otitis media is more prevalent in children while reported deafness increases steadily with age. In 2012–13, deafness was reported for 3% of Indigenous children, with rates rising steadily to 26% of those aged 55 years and over. In 2012–13, an ear or hearing problem was higher for Indigenous Australians than for non-Indigenous Australians in all age groups from 0–54 years of age. After adjusting for differences in the age structure of the two populations, otitis media among Indigenous Australians was 2.4 times as high as the non-Indigenous rate, with rate ratios of 1.4 for deafness and 1.3 for ear health problems overall. Indigenous Australians aged 15 years and over in the lowest household incomes were more likely to report ear/hearing problems than those in the highest incomes. Relationships were also evident for education.
Data is collected for Indigenous children and young people prioritised to receive Australian Government funded hearing outreach services in the NT. In 2015–16, 2,253 outreach audiology services were provided to 1,981 NT Indigenous children and young people, who gave consent to share the information with the AIHW through this programme. Among them, 49% had hearing loss (compared with 52% in 2012-13) and 32% had a hearing impairment (compared with 37% in 2012-13) (AIHW, 2017c). In 2015–16, of the 2,010 children and young people who received an audiology or ENT outreach service, 66% were diagnosed with at least one type of ear condition. The most common condition was otitis media with effusion (23%) followed by eustachian tube dysfunction (16%) and foreign body (16%). Among the 2,197 children who received 3 or more audiology or ENT services between August 2007 and June 2016, the proportion diagnosed with at least 1 ear condition decreased from 78% at the first service to 49% at the last service.
During the two years to June 2015, there were around 5,300 hospitalisations for Indigenous Australians for ear disease. The Indigenous rate (3.1 per 1,000) was similar to the non-Indigenous rate (2.6 per 1,000). Rates for Indigenous children aged 0–4 years
were lower than those for non-Indigenous children, while for those aged 5–14 years the Indigenous rate was twice as high. For Indigenous children aged 0–14 years, the rate was twice as high in remote and very remote areas (14 and 15 per 1,000) as in major cities (6 per 1,000). Since 2004–05, there has been a 47% increase in ear-related hospitalisations for Indigenous children aged 0–14 years (no change for non-Indigenous children) and no significant change for those aged 15 years and over (10% increase for non-Indigenous Australians) in NSW, Vic, Qld, WA, SA and the NT combined.
In 2014-15, the rate of myringotomy procedures (incision in the eardrum to relieve pressure caused by excessive fluid build-up) in hospital was 1.2 per 1,000 in the population for Indigenous Australians and 1.7 per 1,000 for other Australians (AIHW 2016). The elective surgery median wait time for myringotomy procedures was 55 days for Indigenous patients compared with 57 days for other Australian patients (public hospital waiting lists) (AIHW, 2016x). In 2015–16, the elective surgery wait time for myringoplasty (repair of middle ear perforation) was 82 days longer for Indigenous patients than other patients (SCRGSP2017). In the period from July 2013 to June 2015, Indigenous children aged 0–14 years were hospitalised for tympanoplasty procedures (a reconstructive surgical treatment for a perforated eardrum) at 4 times the rate of non-Indigenous children. One in ten children fitted with a hearing aid or cochlear implant in 2010 were Indigenous (AIHW & AIFS, 2014a).
For Indigenous children aged 0–14 years, otitis media was managed by GPs at a similar rate (67 per 1,000 encounters) to that for other Australian children (64 per 1,000). Rates were also similar for total ear problems in 2010–15 (105 compared with 98). In 2014–15, 24% of Australian Government-funded Indigenous primary health services provided access to ENT specialists on site and 78% off site. In 2008–15, data collected through the Qld Deadly Ears programme showed that of 0–4 year-old clients who received an audiology assessment (1,788 children), 24% had hearing loss in both ears and 11% in one; for clients aged 5–14 years (4,646 children), 30% had hearing loss in both ears and 21% in one ear.
Implications The current rate of GP management of ear or hearing problems for Indigenous children 0–14 years is 1.1 times the non-Indigenous rate yet the prevalence of ear disease is almost 3 times as high. The Indigenous hospitalisation rate for myringotomy is less for Indigenous Australians than non-Indigenous Australians (0.7 times) and there are longer wait times for myringoplasty procedures. Improving prevalence data
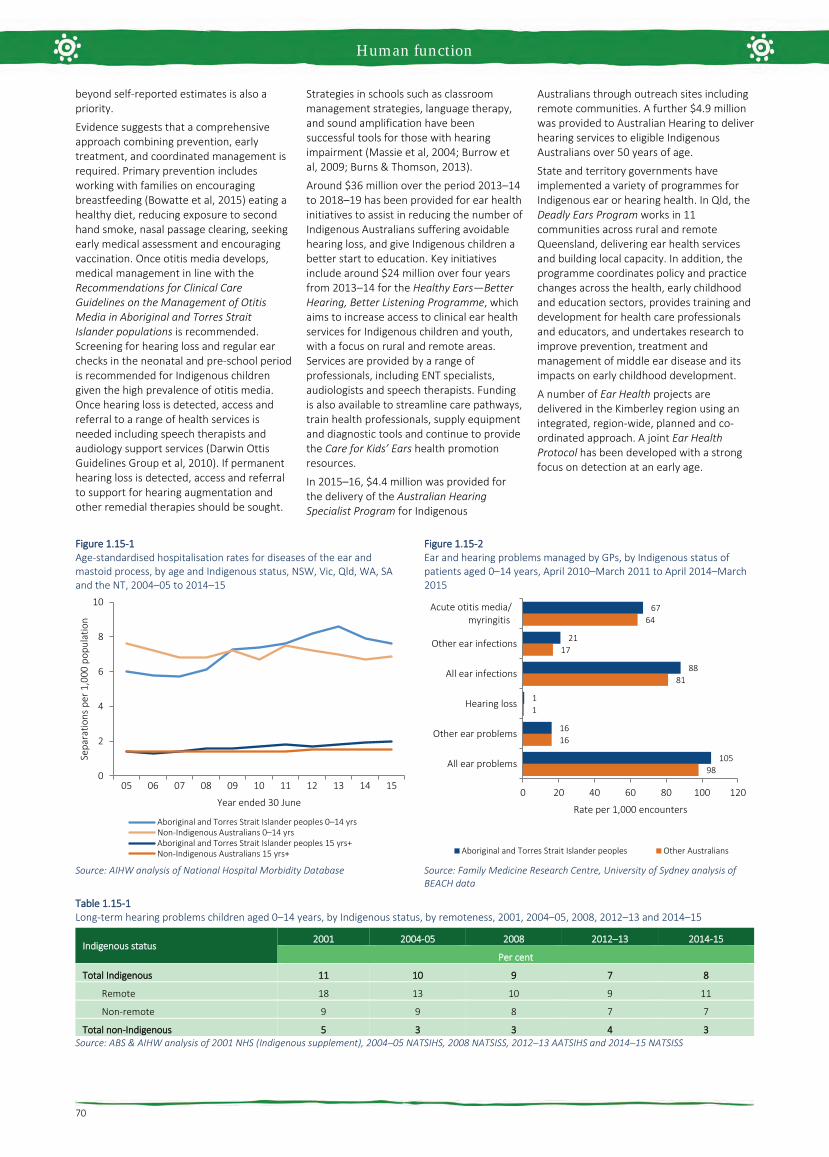
Human function
70
beyond self-reported estimates is also a priority.
Evidence suggests that a comprehensive approach combining prevention, early treatment, and coordinated management is required. Primary prevention includes working with families on encouraging breastfeeding (Bowatte et al, 2015) eating a healthy diet, reducing exposure to second hand smoke, nasal passage clearing, seeking early medical assessment and encouraging vaccination. Once otitis media develops, medical management in line with the Recommendations for Clinical Care Guidelines on the Management of Otitis Media in Aboriginal and Torres Strait Islander populations is recommended. Screening for hearing loss and regular ear checks in the neonatal and pre-school period is recommended for Indigenous children given the high prevalence of otitis media. Once hearing loss is detected, access and referral to a range of health services is needed including speech therapists and audiology support services (Darwin Ottis Guidelines Group et al, 2010). If permanent hearing loss is detected, access and referral to support for hearing augmentation and other remedial therapies should be sought.
Strategies in schools such as classroom management strategies, language therapy, and sound amplification have been successful tools for those with hearing impairment (Massie et al, 2004; Burrow et al, 2009; Burns & Thomson, 2013).
Around $36 million over the period 2013–14 to 2018–19 has been provided for ear health initiatives to assist in reducing the number of Indigenous Australians suffering avoidable hearing loss, and give Indigenous children a better start to education. Key initiatives include around $24 million over four years from 2013–14 for the Healthy Ears—Better Hearing, Better Listening Programme, which aims to increase access to clinical ear health services for Indigenous children and youth, with a focus on rural and remote areas. Services are provided by a range of professionals, including ENT specialists, audiologists and speech therapists. Funding is also available to streamline care pathways, train health professionals, supply equipment and diagnostic tools and continue to provide the Care for Kids’ Ears health promotion resources.
In 2015–16, $4.4 million was provided for the delivery of the Australian Hearing Specialist Program for Indigenous
Australians through outreach sites including remote communities. A further $4.9 million was provided to Australian Hearing to deliver hearing services to eligible Indigenous Australians over 50 years of age.
State and territory governments have implemented a variety of programmes for Indigenous ear or hearing health. In Qld, the Deadly Ears Program works in 11 communities across rural and remote Queensland, delivering ear health services and building local capacity. In addition, the programme coordinates policy and practice changes across the health, early childhood and education sectors, provides training and development for health care professionals and educators, and undertakes research to improve prevention, treatment and management of middle ear disease and its impacts on early childhood development.
A number of Ear Health projects are delivered in the Kimberley region using an integrated, region-wide, planned and co-ordinated approach. A joint Ear Health Protocol has been developed with a strong focus on detection at an early age.
Figure 1.15-1 Age-standardised hospitalisation rates for diseases of the ear and mastoid process, by age and Indigenous status, NSW, Vic, Qld, WA, SA and the NT, 2004–05 to 2014–15
Source: AIHW analysis of National Hospital Morbidity Database
Figure 1.15-2 Ear and hearing problems managed by GPs, by Indigenous status of patients aged 0–14 years, April 2010–March 2011 to April 2014–March 2015
Source: Family Medicine Research Centre, University of Sydney analysis of BEACH data
Table 1.15-1 Long-term hearing problems children aged 0–14 years, by Indigenous status, by remoteness, 2001, 2004–05, 2008, 2012–13 and 2014–15
Indigenous status 2001 2004-05 2008 2012–13 2014-15
Per cent
Total Indigenous 11 10 9 7 8
Remote 18 13 10 9 11
Non-remote 9 9 8 7 7
Total non-Indigenous 5 3 3 4 3 Source: ABS & AIHW analysis of 2001 NHS (Indigenous supplement), 2004–05 NATSIHS, 2008 NATSISS, 2012–13 AATSIHS and 2014–15 NATSISS
0
2
4
6
8
10
05 06 07 08 09 10 11 12 13 14 15
Sepa
ratio
ns p
er 1
,000
pop
ulat
ion
Year ended 30 June
Aboriginal and Torres Strait Islander peoples 0–14 yrsNon-Indigenous Australians 0–14 yrsAboriginal and Torres Strait Islander peoples 15 yrs+Non-Indigenous Australians 15 yrs+
98
16
1
81
17
64
105
16
1
88
21
67
0 20 40 60 80 100 120
All ear problems
Other ear problems
Hearing loss
All ear infections
Other ear infections
Acute otitis media/ myringitis
Rate per 1,000 encounters
Aboriginal and Torres Strait Islander peoples Other Australians

Human function
71
1.16 Eye health Why is it important? The partial or full loss of vision is the loss of a critical sensory function that has impacts across all dimensions of life. Vision loss and/or eye disease can lead to linguistic, social and learning difficulties and behavioural problems during schooling years, which can then lead to poor education outcomes and employment prospects. Visual impairment can affect health-related quality of life and independent living (West, SK et al, 2002) and the family dynamic (Alshehri, 2016).
Indigenous Australians experience higher rates of cataract, diabetic retinopathy and trachoma compared with non-Indigenous Australians.
Blindness from cataract is now rare due to a highly effective surgical procedure but remains a major cause of vision loss among Aboriginal and Torres Strait Islander peoples (Taylor, HR et al, 2015).
Without treatment, diabetic retinopathy can progress to blindness. Although diabetic retinopathy often has no early symptoms, early diagnosis and treatment can prevent up to 98% of vision loss (Taylor, HR et al, 2015). The NHMRC recommends that Indigenous Australians with diabetes should have an eye examination at diagnosis and every year thereafter (Australian Diabetes Society, 2008).
Trachoma in Australia is found almost exclusively in remote and very remote Indigenous populations, with endemic areas in WA, SA and the NT. Trachoma is associated with living in an arid dusty environment; poor waste disposal and high number of flies; lack of hand and face washing; overcrowding and low socio-economic status (NTSRU, 2017). Clean faces have been shown to have a protective effect (Warren & Birrell, 2016), but findings for swimming pools are inconclusive for eye conditions (Hendrickx et al, 2015).
Findings The 2016 National Eye Health Survey (Foreman et al, 2016) measured eye health in Indigenous Australians aged 40 years and over and non-Indigenous Australians aged over 50 years old. This was the first nationwide Australian population based eye health survey which involved clinical examination. In 2016, 11% of Indigenous Australians aged 40 years and over had Vision Impairment (VI) and 0.3% were blind. After adjusting for differences in the age structure of the two populations, the Indigenous rate of VI was 3 times the non-Indigenous rate. The Indigenous rate for blindness was also 3 times the non-Indigenous rate. An estimated 453,000
Australians were living with VI or blindness, including 18,300 Indigenous Australians aged 40 years or older. Of those with VI, the most common cause for both Indigenous and non-Indigenous Australians were uncorrected refractive error, including long and short sightedness (63% and 62%), cataract (20% and 14%), diabetic retinopathy (5.5% and 1.5%), age-related macular degeneration (1% and 9%) and glaucoma (0.6% and 1.5%). The major cause of blindness was cataract (40%) in Indigenous Australians and age-related macular degeneration in non-Indigenous Australians (71%).
In 2016, the prevalence of VI increased markedly with age in both groups and was almost 2 times higher in 50–59 year old Indigenous Australians and almost 4 times higher in 60–69 year olds compared with non-Indigenous Australians. The Indigenous rate was highest in outer regional areas (17%). For non-Indigenous Australians the rate did not differ significantly by remoteness. Half of those found to have an eye condition were previously undiagnosed (57% for Indigenous Australians and 52% for non-Indigenous Australians). Indigenous Australians with self-reported diabetes had lower rates of recommended diabetes eye checks than non-Indigenous Australians (53% compared with 78%), particularly in very remote areas (35% compared with 64% respectively).
In 2016, for those who needed cataract surgery, Indigenous Australians had a lower coverage rate than non-Indigenous Australians (61% compared with 88%). The treatment rate for refractive error was also lower for Indigenous Australians (83% compared with 94%).
For children the most recent self-reported data on eye health comes from the 2014–15 Social Survey. In 2014–15, 10% of Indigenous children aged 0–14 years were reported to have eye or sight problems, up from 7% in 2008 (ABS, 2016). The main eye or sight problems were long sightedness (5%) and short sightedness (3%). Treatment was received by 89% of Indigenous children with eyesight problems with common treatments including glasses/contact lenses (71%) and eye checks with specialists (27%). A high proportion (90%) of those living in non-remote areas received treatment and 68% received treatment in remote areas.
In the 2012–13 Health Survey across all age groups, one-third (33%) of Indigenous Australians reported eye or sight problems. In 2012–13, 79% of Indigenous Australians with eyesight problems wore glasses/contact lenses.
In 2015–16, around 63,800 Medicare health assessments (which included eye checks) were undertaken with Indigenous children aged 0–14 years, representing around 26% of children in this age group. In 2015–16
there were also around 103,600 health checks undertaken with Indigenous Australians aged 15–54 years and around 29,400 for those aged 55 years and over.
In 2015 the National Trachoma Surveillance and Reporting Unit reported the prevalence of active trachoma in children aged 5–9 years was 4.6% in 131 screened at-risk communities (including 67 screened in 2015 and 64 with data carried forward from previous years) in NSW, WA, SA and the NT combined. Prevalence was 7% in SA, 4.8% in the NT, 2.6% in WA and 0% in NSW. Around 30% of communities had endemic trachoma and 57% of communities had no trachoma detected (NTSRU, 2017). Of the cases detected, 99% received treatment in 2015. Health promotion activities were reported in 94 communities. The study also screened for clean faces, with 81% of children overall having clean faces.
Based on GP survey data, eye problems accounted for 1% of all problems managed by GPs at encounters with Indigenous patients during 2010–15. The rate of encounters for total eye problems was similar for Indigenous and other patients. For cataracts, the Indigenous rate was 3.5 times the non-Indigenous rate.
In 2014–15, 68% of Australian Government-funded Indigenous primary health services provided access to optometrists on site and 45% off site, while 35% provided access to ophthalmologists on site and 73% off site.
In the two years to June 2015, there were 6,523 hospitalisations of Indigenous Australians for diseases of the eye (mainly cataracts). The hospitalisation rate was lower for Indigenous Australians than for non-Indigenous Australians (ratio of 0.8). Between 2004–05 and 2014–15, the Indigenous hospitalisation rate for eye disease increased by 160% (from 5.4 per 1,000 to 10.7 per 1,000) in NSW, Vic, Qld, WA, SA and the NT combined. These rates reflect hospitalisations rather than the extent of the problem in the community.
In 2014–15 the cataract surgery rate for Indigenous Australians was 7.5 per 1,000 compared with 9.0 per 1,000 for other Australians (AIHW, 2016u). In 2015–16, the public hospital median wait time for cataract surgery was 140 days for Indigenous patients compared with 92 days for other patients (the gap has increased by 19 days since 2013–14) (AIHW, 2016x).
Implications Eye health can be affected by diseases such as diabetes (see measure 1.09) as well as environmental factors linked to higher rates of infection and cross-infection, geographic isolation, economic disadvantage and barriers to health care, which can limit the opportunities for detection and treatment. The 2015 Roadmap to Close the Gap for Vision Summary reported that 94% of vision

Human function
72
loss in the Indigenous population is preventable or treatable but 35% of Indigenous adults have never had an eye exam (Taylor, HR et al, 2015). A key strategy to close the gap is to ensure those with diabetes undergo annual eye screening, and receive timely treatment (Tapp et al, 2015).
The Australian Government is providing around $51 million over the period 2013–14 to 2018–19 to improve the eye health of Indigenous Australians. Around $16.6 million of this has been allocated to continue national efforts to eliminate trachoma as a public health problem by 2020. Australia is a signatory to the WHO’s Alliance for the Global Elimination of Trachoma by 2020. The WHO SAFE strategy is being implemented to eliminate trachoma. The Strategy includes surgery (to correct trichiasis), antibiotic treatment, facial cleanliness and environmental improvements (such as fly control, sewerage/rubbish removal, house maintenance). The remaining funding is
being used to address a range of activities including improved access to clinical services, streamlining of care pathways, provision of training for health professionals, supply of equipment and trachoma health promotion activities.
Approximately $25.4 million is being provided from 2013–14 to 2016–17 to support the Visiting Optometrists Scheme (VOS), which improves access to optometry services for people living in rural and remote locations. In 2015–16, around 18,979 Indigenous patients (out of 39,112 total including non-Indigenous) were seen through the VOS. The Rural Health Outreach Fund (RHOF) provides outreach initiatives aimed at supporting people living in rural and remote locations to access health care including eye health. In 2015–16, 5,317 Indigenous patients (out of 27,240) were seen by ophthalmologists through the RHOF and a further 3,948 Indigenous patients (out of 9,436) were seen by other eye health professionals.
From November 2016 an MBS rebate will be available for retinal photography screening for patients with diabetes. Indigenous Australians will be eligible for screening annually. To complement this initiative, funding has been provided to purchase retinal cameras and train staff to use the equipment.
There are a range of Indigenous eye health programs delivered by state and territory governments including an Indigenous Diabetes Eye and Screening van in regional QLD, the Outback Vision van in WA and the Collaborative Child Health project in the Pilbara region, WA. Also, the Anyinginyi Health Aboriginal Corporation in the NT coordinates eye specialist visits and runs regional clinics (AHAC, 2015). The Victorian Aboriginal Spectacle Subsidy Scheme provided 4,200 spectacles and an increase in eye services in the first 3 years (Napper et al, 2015). For more information, see the Policies and Strategies section.
Figure 1.16-1 Main causes of bilateral vision impairment, by Indigenous status, 2016
Source: National Eye Health Survey, 2016
Figure 1.16-2 Age-standardised bilateral vision impairment by Indigenous status by remoteness, 2016
Source: National Eye Health Survey, 2016
Figure 1.16-3 Adherence rates to the National Health and Medical Research Council diabetic eye examination guidelines, 2016
Source: National Eye Health Survey, 2016
Figure 1.16-4 Number of screened at-risk communities(a) according to level of trachoma prevalence in 5–9 year old children, by jurisdiction, 2015
(a) Including 67 communities screened in 2015 and 64 with data carried forward from previous years. Source: National Trachoma Surveillance and Reporting Unit, 2016
0 10 20 30 40 50 60 70
Not determinable
Other
Combined mechanisms
Glaucoma
Diabetic retinopathy
Age-related macular degeneration
Cataract
Refractive error
Per centAboriginal and Torres Strait Islander peoples Non-Indigenous Australians
0
5
10
15
20
25
30
Majorcities
Innerregional
Outerregional
Remote Veryremote
Total
Per c
ent
Remoteness areaAboriginal and Torres Strait Islander peoples Non-Indigenous Australians
0102030405060708090
100
Majorcities
Innerregional
Outerregional
Remote Veryremote
Total
Per c
ent
Remoteness area
Aboriginal and Torres Strait Islander peoples Non-Indigenous Australians
112 3
11
3 2
7
1 0
11
1 5
31
4
39
10
10
20
30
40
50
60
70
NT SA WA NSW
Per c
ent o
f scr
eene
d co
mm
uniti
es
Jurisdiction≥20% ≥10% but <20% ≥5% but <10% >0% but <5% 0%

Life expectancy and wellbeing
73
1.17 Perceived health status Why is it important? Self-assessed health status provides a measure of the overall level of a population’s health based on individuals’ personal perceptions of their own health. Health is recognised as having physical, mental, social and spiritual components. Therefore, the measurement of health must go beyond quantifying levels of morbidity and mortality. Part of this broader approach is to ask people to assess the state of their own health.
Self-assessed health status is dependent on an individual’s awareness and expectations regarding their health. It is influenced by various factors, including access to health services and information, the extent to which health conditions have been diagnosed and level of education (Delpierre et al, 2009). Social constructs of health also influence this assessment, such as culturally distinct views of health and wellbeing held by Aboriginal and Torres Strait Islander peoples, the existing level of health within a community and judgments concerning the person’s own health compared with others in their community (Vass et al, 2011; OECD, 2015).
Self-assessed health status correlates with measures of health, such as reported long-term health conditions, recent health-related actions, and the presence of disability. However, many Aboriginal and Torres Strait Islander people rate their health as good or excellent despite significant health problems. Self-assessed health status is a useful measure of overall health status and future health care use, but is not an objective measure and needs to be interpreted with caution.
Findings Based on responses from the 2014–15 Social Survey, 40% of Aboriginal and Torres Strait Islander peoples aged 15 years and over reported their health as being excellent or very good, 35% reported their health as being good, and 26% reported their health as being fair or poor (ABS, 2016e). There has been a decline in the proportion of the population rating their health as excellent/very good between 2008 (44%) and 2014–15 (40%). Older people were less likely than younger people to rate their health as excellent/very good—23% of those aged 55 years and over compared with 54% of 15–24 year olds. A smaller proportion of females than males reported excellent or very good health (37% compared with 43%). Aboriginal and Torres Strait Islander peoples were less likely than non-Indigenous Australians to report excellent or very good health, particularly among those in older age groups. After adjusting for differences in the
age structure of the two populations, Aboriginal and Torres Strait Islander peoples were twice as likely as non-Indigenous Australians to report their health as fair or poor.
The proportion of Aboriginal and Torres Strait Islander peoples reporting fair or poor health was higher in Tasmania (31%), Victoria (29%) and Qld (27%) than in the NT (18%). Indigenous Australians aged 15 years and over living in remote/very remote areas were less likely to report their health as being fair or poor (20%) compared with those living in non-remote areas (27%). Despite these results there is evidence that a number of health conditions such as circulatory disease (see measure 1.05) and kidney disease (see measure 1.10) and risk factors such as smoking (see measure 2.15) are worse in remote areas. Interpretation of the question will be influenced by the person’s view of ‘health’ and whether the concept is perceived holistically to include social, cultural, emotional and spiritual wellbeing or as a biomedical concept linked to the absence of disease and incapacity (NAHSWP, 1989; Vass et al, 2011). It can also be influenced by whether health conditions have been diagnosed. In 2015–16, there was a clear gradient, reducing by remoteness, in rates of Medicare service claims for GPs and therefore rates of diagnosis are likely to be lower in remote areas. Self-assessed health can also be influenced by how an individual assesses their own health relative to other people around them.
The proportion of Aboriginal and Torres Strait Islander peoples reporting fair or poor health increases with the number of long-term health conditions reported.
In 2014–15, 52% of Indigenous Australians living in households in the highest income quintile reported excellent/very good health status, compared with 37% of those in the lowest quintile. Approximately 50% of those who had completed Year 12 reported excellent/very good health, compared with 34% of those who had completed Year 10 or below. Note: this analysis does not control for age. In 2014–15, excellent/very good self-assessed health status was associated with feeling safe, feeling able to have a say with family or friends and within the community, having daily contact with family or friends outside the household, having friends and family outside the household to confide in, no community problems reported and agreeing that most people can be trusted (see measure 1.13).
Implications Reflecting higher prevalence and earlier onset of many chronic diseases, Aboriginal and Torres Strait Islander people are around half as likely as non-Indigenous Australians to have rated their health as excellent or very good (rate ratio 0.6). This is consistent
with other measures of overall health status. Those living in remote areas are less likely to rate their health as fair/poor than those in non-remote areas. This could be related to perceptions of ‘health’, whether health conditions have been diagnosed and also how an individual assesses their own health relative to other people around them. On some measures such as the prevalence of diabetes, end stage kidney disease, eye health and smoking there is a worsening of health by remoteness (see measures 1.09, 1.10, 1.16 and 2.15).
An evaluation of the Victorian government’s Koolin Balit investment will conclude in 2016, and is showing that there has been considerable progress in some critical areas, including:
• the gathering place model (13 examplesacross Victoria were examined) is makingsubstantial contributions to improvingtheir local communities’ health andwellbeing
• some intensive case management modelsare improving health and wellbeingoutcomes for some of the most complexchildren, families and individuals they areworking with, and include some strategiesthat are replicable to other communities
• improvements in some Victorian hospitals’cultural responsiveness and cultural safetyfor Aboriginal people.

Life expectancy and wellbeing
74
Figure 1.17-1 Self-assessed health status (age-standardised) by Indigenous status, persons aged 15 years and over, 2014–15
Source: ABS and AIHW analysis of 2014–15 NATSISS
Figure 1.17-2 Self-assessed health status by Indigenous status and age group, persons aged 15 years and over, 2014–15
Source: ABS and AIHW analysis of 2014–15 NATSISS
Figure 1.17-3 Self-assessed health status, Indigenous Australians aged 15 years and over, by remoteness, 2014–15
Source: ABS and AIHW analysis of 2014–15 NATSISS
Figure 1.17-4 Self-assessed health status, Indigenous Australians aged 15 years and over, by number of long-term health conditions, 2014–15
Source: ABS and AIHW analysis of 2014–15 NATSISS
Figure 1.17-5 Self-assessed health status, Indigenous Australians aged 15 years and over, by state/territory, 2014–15
Source: ABS and AIHW analysis of 2014–15 NATSISS
Figure 1.17-6 Self-assessed health status, Indigenous Australians aged 15 years and over, 2004–05, 2008, 2012–13 and 2014–15
Source: ABS and AIHW analysis of 2012–13 AATSIHS and 2014–15 NATSISS
0
10
20
30
40
50
60
Excellent/very good Good Fair/poor
Per c
ent
Self-assessed health status
Aboriginal and Torres Strait Islander peoples Non-Indigenous Australians
5443 35
27 23
63 66 62 5745
3337
3634
33
28 25 27 30
32
13 1929
39 45
9 9 10 1324
0
20
40
60
80
100
15–24 25–34 35–44 45–54 55+ 15–24 25–34 35–44 45–54 55+
Per c
ent
Age group (years)
Excellent/very good Good Fair/poor
Aboriginal and TorresStrait Islander peoples
Non-IndigenousAustralians
39 39 38 40 43
35 33 3338 38
26 28 29 23 19
0
20
40
60
80
100
Major cities Innerregional
Outerregional
Remote Very remote
Per c
ent
Remoteness area
Excellent/very good Good Fair/poor
5845
3217
33
36
41
32
919 27
51
0
20
40
60
80
100
0 1 2 3+
Per c
ent
Number of long-term health conditions
Excellent/very good Good Fair/poor
39 40 39 41 40 37 40 43 40
34 31 35 34 3431
3340
35
26 29 27 25 2731 26
1826
0
20
40
60
80
100
NSW Vic Qld WA SA Tas ACT NT Aus
Per c
ent
JurisdictionExcellent/very good Good Fair/poor
43 4439 40
35 34 37 35
22 22 24 26
0
20
40
60
80
100
2004–05 2008 2012–13 2014-15
Per c
ent
Survey year
Excellent/very good Good Fair/poor

Life expectancy and wellbeing
75
1.18 Social and emotional wellbeing Why is it important? Social and emotional wellbeing is a holistic concept based on connections to country, culture, community, family, spirit and physical and mental health. For Aboriginal and Torres Strait Islander peoples, health is not just the physical wellbeing of the individual but the ‘social, emotional and cultural wellbeing of the whole community’ (SHRG, 2004; Gee et al, 2014; Parker, R & Milroy, 2014; Dudgeon et al, 2014a). Social and economic disadvantage is interconnected with historical loss of land (which was the economic and spiritual base for Aboriginal and Torres Strait Islander communities); damage to traditional social and political structures and languages; child removals; incarceration rates and inter-generational trauma (NPHP, 2006; Dudgeon et al, 2014b; Zubrick et al, 2014). Experience of discrimination also leads to psychological distress and has a negative impact on health (Paradies & Cunningham, 2008). Indigenous Australians experience higher levels of morbidity and mortality from mental illness, psychological distress, self-harm and suicide than other Australians.
Findings The 2014–15 Social Survey collected information on a range of topics relevant to social and emotional wellbeing (ABS, 2016e). This survey showed that Indigenous Australians retain strong links to their culture and family connections. In 2014–15, 62% of Indigenous Australians aged 15 years and over reported they identified with a clan or language group, 74% recognised an area as homelands/traditional country and 63% were involved in cultural events, ceremonies or organisations in the last 12 months. In 2014–15, 92% of Indigenous Australians aged 15 years and over reported that they could get support in time of crisis and 97% reported that they had been involved in sporting, social or community activities in the last 12 months.
However, in 2014–15, 47% of Indigenous Australians aged 15 years and over reported that they and/or a relative had been removed from their natural family. Note: this is of those who were able to state whether family members had been removed. Those who were removed or whose relatives were removed from their family were more likely to have high levels of psychological distress (38%) than those not removed (28%).
The 2014–15 Social Survey included an overall life satisfaction measure with a scale from 0 ‘not at all satisfied’ to 10 ‘completely satisfied’ (ABS, 2016e)(ABS, 2016). More than half (53%) of Indigenous Australians aged 15 years and over reported an overall
life satisfaction rating of 8 or above (52% in non-remote areas and 58% in remote areas). A high rating of 10 was more common in remote areas (27%) than non-remote areas (14%). A high rating of 8 or above was associated with self-assessed excellent or very good health (67%) compared with 37% of those with fair/poor health; being employed (61%) compared with being unemployed (41%); not experiencing violence in the last 12 months (57%) compared with those who did (39%); being able to get support in a time of crisis compared with those who could not (55% and 38%, respectively).
Based on analysis of the 2008 Social Survey and the Household Income and Labour Dynamics in Australia Survey (HILDA), 53% of Indigenous Australians reported that they had ‘been a happy person’ all or most of the time in the previous four weeks compared with 61% of non-Indigenous Australians (AIHW, 2014h). Higher levels of education and being employed were associated with higher levels of wellbeing (Kahneman & Deaton, 2010). However, there was a weaker link between income and positive wellbeing for Indigenous Australians in remote areas compared with non-remote areas. Further analysis of HILDA results in the period 2001–12 showed that life satisfaction ratings peaked in 2003 for both Indigenous and non-Indigenous Australians, but declined significantly after that point for Indigenous Australians only (Manning et al, 2016). In a recent multivariate analysis of data from national health and social surveys of the Indigenous Australian population, conducted between 2002 and 2012–13, employment status and housing tenure were shown to be significantly associated with a range of health and wellbeing outcomes. As education levels have increased for Indigenous Australians, the association of education with health and wellbeing has weakened (Crawford & Biddle, 2017).
Psychological distress Based on the 2014–15 Social Survey, most (67%) Indigenous adults aged 18 years and over had low/moderate levels of psychological distress and 33% had high/very high levels. There was a significant 6 percentage point increase in those reporting high/very high levels of psychological distress between 2004–05 (27%) and 2014-15.
After adjusting for differences in the age structure of the two populations, Indigenous adults were 2.6 times as likely as non-Indigenous adults to experience high/very high psychological distress. For Indigenous Australians aged 15 years and over, females (39%) were significantly more likely than males (26%) to report high/very high levels of psychological distress. There was no difference by remoteness. Those with high/very high psychological distress levels
were more likely to have lower income, lower educational attainment and higher unemployment.
Life stressors In 2014–15, more than two-thirds (68%) of Aboriginal and Torres Strait Islander peoples said they had experienced one or more stressors in the last 12 months (ABS, 2016e). The most common stressors reported were the death of a family member or close friend (28%), inability to get a job (18%), serious illness (12%), and mental illness (10%).
Indigenous Australians living in both non-remote and remote areas reported on average 2 stressors. Indigenous Australians living in non-remote areas were more likely to report stressors due to serious illness, mental illness, discrimination and family stressors while those living in remote areas were more likely to report stressors such as the death of a family member or close friend, overcrowding or alcohol problems. Research has shown that parental stress caused by factors such as unemployment and financial problems is associated with emotional or behavioural difficulties in children and decreased utilisation of health services for the child's needs (Ou et al, 2010; Strazdins et al, 2010).
Depression and racism In 2014–15, 35% of Indigenous Australians aged 15 years and over felt that they had been treated unfairly in the last 12 months because they were Aboriginal and/or Torres Strait Islander. Rates of psychological distress were higher for this group (44%) than for those who reported that they had not been treated badly (27%). Research in the NT has found a significant association between interpersonal racism and depression among Aboriginal and Torres Strait Islander peoples after adjusting for sociodemographic factors. Lack of control, stress, negative social connections and reactions to racism such as feeling ashamed or powerless were each identified in the relationship between racism and depression (Paradies & Cunningham, 2012). A study of 755 Aboriginal Victorians also found an association between reported racism and psychological distress (Kelaher et al, 2014).
Social and emotional wellbeing of children In 2014–15, 67% of Indigenous children aged 4–14 years were reported to have experienced one or more stressors in the last 12 months, with death of family/friend the most commonly reported stressor (25%), followed by being scared or upset by an argument or someone’s behaviour and/or trouble keeping up with school work (both 23%) (ABS, 2016e). In addition, 40% of Indigenous children aged 4–14 years had been bullied at school and 9% had been treated unfairly at school because they were Aboriginal and/or Torres Strait Islander.

Life expectancy and wellbeing
76
The Longitudinal Study of Indigenous Children (LSIC) showed that 23% of Indigenous children were at high risk of clinically significant emotional and behavioural difficulties (Department of Families, 2012). Factors impacting on surveyed children’s social and emotional difficulties scores, were a close family member having been arrested, been in jail or had problems with the police; the children being cared for by someone else for at least a week as opposed to remaining constantly with their regular carers; and children being scared by other people’s behaviour. These intra-family factors were more significant than many commonly assumed social factors, such as illness, housing problems and money worries (Department of Families, 2013; 2015).
Mental health conditions Mental health and substance use disorders combined were the leading cause of total disease burden for Indigenous Australians, representing 19% of the burden; and 14% of the health gap between Indigenous and non-Indigenous Australians in 2011 (AIHW, 2016f). Anxiety disorders represented 23% of the total burden from mental and substance use disorders followed by alcohol use disorders (22%), depressive disorders (19%), schizophrenia (8%) and drug use disorders (6%). Non-fatal burden predominated for mental health and substance use (97%); burden was highest in younger age groups (44 years and under); and higher for males (56%) than for females (44%).
Mental health related conditions accounted for 3% of deaths among Indigenous Australians over the period 2011–15 in NSW, Qld, WA, SA and the NT combined. Of these deaths 64% were for organic mental disorders (injury or non-psychiatric illness affecting the brain) and 23% were for mental and behavioural disorders due to psychoactive substance use. After adjusting for differences in the age structure of the two populations, Indigenous Australians died from mental health-related conditions at a rate 1.1 times the non-Indigenous rate.
In the period July 2013 to June 2015, mental health related conditions were the principal reason for 7% of hospitalisations (excluding dialysis) for Indigenous Australians. Indigenous men were hospitalised for mental health related conditions at 2.1 times the rate of non-Indigenous males, and Indigenous females at 1.5 times the rate for non-Indigenous females. Between 2004–05and 2014–15, there was a 56% increase in hospitalisations for mental health related conditions among Indigenous females, and a 36% increase for Indigenous males in the six jurisdictions with adequate data for trend reporting (NSW, Vic, Qld, WA, SA and the NT combined). Rates among non-Indigenous Australians remained static over this period,
resulting in a 142% increase in the difference between Indigenous and non-Indigenous rates.
The most common reasons for mental health related hospitalisations were mental and behavioural disorders due to psychoactive substance use (38% of episodes), schizophrenia (22%), neurotic, stress-related disorders (15%), and mood disorders (14%). Indigenous hospitalisation rates for mental health related issues were highest in the 25–54 year age groups. Rates were lowest in very remote (23 per 1,000 population) and inner regional areas (24 per 1,000 population) and were highest in remote areas (33 per 1,000 population). Rates varied between jurisdictions. The highest rate was in SA (44 per 1,000).
In 2014–15, 29% of Indigenous Australians aged 15 years and over reported having a long-term mental health condition (ABS, 2016). Of those aged 18 years and over reporting a mental health condition, the main types of conditions were: depression (72%); anxiety (65%); behavioural or emotional problems (25%); and harmful use of drugs or alcohol (17%). Mental health conditions were less likely to have been reported by Indigenous males (25%) than females (34%); and young people (22%) than those in older age groups (ranging from 30% to 35%). Indigenous Australians with a mental health condition were more likely to be a daily smoker (46%) and to have used substances in the last 12 months (39%) than were people with no long-term health conditions (39% and 29% respectively). Those with a mental health condition were more likely to report experiencing one or more stressors (84%) compared with those had no long-term health conditions (60%). Those with a mental health condition were less likely to have had daily face-to-face contact with family or friends outside their household (36%) than those with no long-term health conditions (52%). They were more likely to have experienced physical violence in the last 12 months (20%) than were people with other long-term health conditions (9%) or no long-term health condition (12%). Those with a mental health condition were more likely to have experienced problems accessing health services (23%) than were people with other long-term health conditions (13%) or no long-term health conditions (10%).
Around 11% of all problems managed by GPs among Indigenous patients were mental health related (GP survey data 2010–15). Depression and anxiety were the leading problems managed for both Indigenous and other Australian patients. After adjusting for differences in the age profile of the two populations, GPs managed mental health related problems for Indigenous patients at 1.2 times the rate for other Australians. Rates of tobacco, alcohol and drug abuse
problems for Indigenous patients were 2–3 times the rates for other Australians.
Suicide For the period 2011–15, among Indigenous Australians in the jurisdictions with adequate data quality (NSW, Qld, WA, SA and the NT combined), there were 690 suicides (on average 138 suicides per year). This accounted for approximately 5% of deaths among Indigenous Australians at a rate of 23 per 100,000. Indigenous males accounted for 71% of suicides in that population. After adjusting for differences in the age profile of the two populations, the Indigenous suicide rate was twice the rate for non-Indigenous Australians. Rates for Indigenous males were highest among those aged 30–34 years (65 per 100,000 population), while rates for non-Indigenous males were highest among those aged 40–44 and 45–49 years (both 27 per 100,000). Rates for Indigenous females were highest among those aged 20–24 and 35–39 years (both 26 per 100,000), while for non-Indigenous females rates were highest among those aged 45–49 years (8.7 per 100,000). During 2011–15, the majority (87%) of Indigenous suicides occurred before 45 years of age. This pattern is different among non-Indigenous Australians, with 50% of suicides occurring at less than 45 years of age. After the age of 54, the suicide rates for Indigenous Australians are lower than those for non-Indigenous Australians. A study in WA found that Aboriginal mothers were 3.5 times as likely to commit suicide as non-Indigenous mothers (Fairthorne et al, 2016).
There was a 32% increase in Indigenous suicide rates from 1998 to 2015 (NSW, Qld, WA, SA and NT combined). For non-Indigenous Australians there was a 34% decline from 1998 to 2006 and a 22% increase from 2006 to 2015. WA had the highest Indigenous suicide rate in 2015 (41 per 100,000). Kimberley had the highest Indigenous suicide rate (61 per 100,000) of all IAS Regions and was 3 times the national Indigenous suicide rate in 2009–13. Research in the NT has shown that the Indigenous suicide rate increased significantly between 1981 and 2002 (Measey et al, 2006). More recent data from the NT shows no significant change between 2001 and 2015.
Between July 2013 and June 2015 there were 4,365 hospitalisations among Indigenous Australians for intentional self-harm, representing 1% of Indigenous hospitalisations over this period. Rates were higher for Indigenous females (3.8 per 1,000 population) compared with males (2.5 per 1,000), and were higher in remote areas (3.9 per 1,000) compared with other areas (3.3 per 1,000 in major cities, 2.9 per 1,000 in regional areas and 2.8 per 1,000 in very remote areas). After adjusting for differences in population age structures,

Life expectancy and wellbeing
77
Indigenous Australians were hospitalised for self-harm at 2.7 times the rate for non-Indigenous Australians.
In 2001–02, as part of the WAACHS, 16% of young people aged 12–17 years reported suicidal thoughts (20% of girls compared with 12% of boys). The proportion of Aboriginal children who reported suicidal thoughts was significantly higher among those who smoked regularly, used cannabis, drank to excess, were exposed to some form of family violence, or who had a friend who had attempted suicide. A large longitudinal study in New Zealand found that young suicide attempters were significantly more likely to have persistent mental health problems (e.g. depression, substance dependence) in middle age when compared to non-attempters. They were also more likely to have physical health problems (e.g. metabolic syndrome); engage in more violence (e.g. violent crime, intimate partner abuse); and needed more social support (e.g., long-term welfare receipt). Furthermore, they reported being lonelier and less satisfied with their lives (Goldman-Mellor et al, 2014).
Implications The policy responses to social and emotional wellbeing need to be multidimensional and involve a wide range of stakeholders. Strategies that build on the strengths, resilience and endurance within Indigenous communities and recognise the important historical and cultural diversity within communities are recommended (SHRG, 2004; Dudgeon et al, 2014a). Recent suicide prevention studies have identified the need to focus on protective factors, such as community connectedness, strengthening the individual and rebuilding family, as well as culturally based programmes(Tighe & McKay, 2012; Dudgeon et al, 2012; AIHW & AIFS, 2013; Clifford et al, 2012; Cox et al, 2014; Ridani et al, 2015).
The Healing Foundation funding agreement (2015–18) allocates $14 million for healing programs. This includes community healing activities, men’s healing projects, and healing projects for members of the Stolen Generations and their families. Of the 6,300 people who participated in Healing projects in 2014–15, 73% of children and young people reported an improvement in social and emotional wellbeing, 85% of Stolen Generations members reported having an increased sense of belonging and connection to culture and 85% of participants reported that they can now better manage the impacts of trauma. An additional $3.6 million has been allocated for trauma-informed Indigenous healing education and workforce development, and capacity building and knowledge creation for service providers of healing programs.
The Indigenous Advancement Strategy—Safety and Wellbeing programme provides funding for strategies to enhance community safety and support Indigenous wellbeing. In 2015–16 this included funding of $40 million for social and emotional wellbeing services and workforce support. This included Link-Up services to provide counselling, family tracing and reunion services to members of the Stolen Generations and two Indigenous suicide prevention projects run by the University of Western Australia. The Aboriginal and Torres Strait Islander Suicide Prevention Evaluation Project has identified success factors for suicide prevention and developed a suite of community tools (Dudgeon et al, 2016). The National Critical Response Project has been allocated $10 million over three years from 2016–17 to help determine the immediate needs of Aboriginal and Torres Strait Islander individuals, families and communities who have experienced traumatic events such as suicide and improve critical response services and local community capacity to meet these needs. It commenced in January 2017 and builds on the pilot project in WA. The Aboriginal and Torres Strait Islander Mental Health and Suicide Prevention Advisory Group is providing advice to Government on strategic and practical actions to prevent suicide and improve the mental health and social and emotional wellbeing.
Funding for Indigenous specific suicide prevention activity is an ongoing component of Commonwealth suicide prevention investment, as part of the new direction in suicide prevention outlined in the Government’s response to the National Mental Health Commission’s Review of Mental Health Programmes and Services. Approximately $5.6 million per annum is allocated to Primary Health Networks (PHNs) for the delivery of culturally appropriate suicide prevention services for Indigenous Australians, with approximately $0.7 million per annum to be allocated for a National Centre of Best Practice in Aboriginal and Torres Strait Islander Suicide Prevention.
In addition, an Aboriginal and Torres Strait Islander chapter in the Fifth National Mental Health Plan and a revised National Strategic Framework for Aboriginal and Torres Strait Islander Peoples’ Mental Health and Social and Emotional Wellbeing are being developed.
Various state/territory initiatives are being undertaken, including the multi-award winning Alive and Kicking Goals project in the Kimberley, which is wholly owned and led by young Aboriginal women and men. The project aims to reduce the high suicide rate among Indigenous youth through peer education workshops, one-on-one mentoring, and counselling.
Through SA Health brokerage funding, access to Traditional Healers is available at no cost to Aboriginal patients through referrals from clinicians and health practitioners. Traditional Healers play an important role in the healing process for Aboriginal people and influence and support the positive management of Aboriginal people’s emotional, spiritual and physical wellbeing. The Traditional Healers programme supports healers to continue practising an important aspect of Aboriginal culture.

Life expectancy and wellbeing
78
Figure 1.18-1 Proportion of people aged 18 years and over reporting high/very high levels of psychological distress (age-standardised), by Indigenous status, 2004–05, 2008, 2012–13 and 2014–15
Source: AIHW and ABS analysis of the 2012–13 AATSIHS and 2014–15 NATSISS
Figure 1.18-2 Proportion of Indigenous Australians aged 15 years and over reporting high life satisfaction ratings, by selected characteristics, 2014–15
Source: AIHW and ABS analysis of the 2014–15 NATSISS
Figure 1.18-3 Proportion of Indigenous Australians aged 15 years and over reporting high/very high levels of psychological distress, by selected social factors, 2014–15
Source: AIHW and ABS analysis of the 2014–15 NATSISS
Figure 1.18-4 Mortality from suicide rates per 100,000, by Indigenous status, sex and age group, NSW, Qld, WA, SA and the NT, 2011–15
Source: AIHW and ABS analysis of National Mortality Database
Figure 1.18-5Age-standardised hospitalisation rates for mental health related conditions, by Indigenous status, 2004–05 t0 2014–15
Source: AIHW analysis of National Hospital Morbidity Database
Figure 1.18-6 Age-specific hospitalisation rates for mental health related conditions, by Indigenous status, July 2013–June 2015
Source: AIHW analysis of National Hospital Morbidity Database
0
5
10
15
20
25
30
35
2004-05 2008 2012-13 2014-15
Per c
ent
Survey yearAboriginal and Torres Strait Islander peoplesNon-Indigenous Australians
67
37
61
41
57
39
0
10
20
30
40
50
60
70
80
Excellent/good
Fair/poor Employed Unemployed Did notexperience
Experienced
Per c
ent
Labour force statusHealth Status Physical or threatened violence
40
24
37
26
40
24
0
10
20
30
40
50
1stquintile(lowest)
4th/5thquintile
(highest)
Year 10 Year 12 Unemployed Employed
Per c
ent
Income Education Labour force
0
10
20
30
40
50
60
70
Deat
hs p
er 1
00,0
00 p
opul
atio
n
Age group (years)
Aboriginal and Torres Strait Islander people Non-Indigenous Australians
Males Females
0
5
10
15
20
25
30
35
05 06 07 08 09 10 11 12 13 14 15
Sepa
ratio
ns p
er 1
,000
pop
ulat
ion
Year ended 30 June
Aboriginal and Torres Strait Islander peoplesNon-Indigenous Australians
1 4
24
40
52
42
28
18
4 2
1618
22 2118
20
0
10
20
30
40
50
60
0–4 5–14 15–24 25–34 35–44 45–54 55–64 65+
Sepa
ratio
ns p
er 1
,000
pop
ulat
ion
Age group (years)
Aboriginal and Torres Strait Islander peoples Non-Indigenous Australians

Life expectancy and wellbeing
79
1.19 Life expectancy at birth Why is it important? Life expectancy at birth is widely used internationally as a measure of the general health of populations. Over the last 125 years, life expectancy at birth for the Australian population has increased by more than 30 years (from 47 years for males and 51 years for females in 1885) (ABS, 2014f). here is currently a large gap in life expectancy between Indigenous and non-Indigenous Australians. A recent study in the NT estimated that socio-economic disadvantage accounted for one-third to one-half of the gap in life expectancy (Zhao et al, 2013a). Social and economic factors such as poverty, racism, stressors, educational exposure and employment status impact on the individual’s propensity to engage in health risk behaviours and on their access to the health system. These factors combined lead to increased risk of circulatory disease (Dong et al, 2004) and cancer (Kelly-Irving et al, 2013), the leading causes of death.
Findings In 2010–12, life expectancy for Aboriginal and Torres Strait Islander males was estimated to be 10.6 years lower than that for non-Indigenous males (69.1 years compared with 79.7 years) and 9.5 years lower for females (73.7 compared with 83.1 years). For the first time, the ABS has published trend data by revising the 2005–07 estimate to provide comparable data with 2010–12. Over this five-year period life expectancy increased for both Indigenous men and women, and the life expectancy gap between Indigenous and non-Indigenous Australians reduced slightly, by
0.8 years for males and by 0.1 years for females. Four jurisdictions have populations of sufficient size to calculate Indigenous life expectancy estimates (NSW, Qld, WA and the NT). Indigenous life expectancy is estimated to be lower in the NT than in any other jurisdiction. Life expectancy for Indigenous males in the NT was estimated to be 63.4 years compared with 70.5 years for NSW (a gap of 7.1 years). Indigenous females in the NT had a life expectancy estimate of 68.7 years compared with 74.6 years for Indigenous females in NSW (a gap of 5.9 years). Life expectancy for Aboriginal and Torres Strait Islander males living in outer regional, remote and very remote areas combined was estimated to be 0.7 years lower than that of Indigenous males living in major cities and inner regional areas combined (67.3 years compared with 68.0 years) and 0.8 years lower for females (72.3 compared with 73.1 years).
Internationally, life expectancy has increased greatly over the past few decades. The OECD average is now 80.5 years and emerging countries such as Brazil and China have also achieved large gains in longevity (OECD, 2015). Methods of calculating life expectancy vary internationally so caution is needed in making comparisons. Higher income per capita is generally associated with higher life expectancy, although there are some variations across countries, for example the US had lower life expectancy than other countries with similar incomes. Life expectancy at birth for Indigenous Australians was close to that of the general populations in Brazil and Indonesia. In New Zealand, there was a life expectancy gap between the Maori and non-Maori populations of 7.3 years for males and 6.8 years for females (Statistics NZ, 2015).
Implications Closing the gap in life expectancy between Aboriginal and Torres Strait Islander peoples and other Australians within a generation has been adopted as a target by COAG.
Life expectancy estimates move slowly, currently around 0.25 years of life per year for the Australian population. The ABS estimates that life expectancy at birth for Indigenous males has increased by 0.32 years per year since 2005–07, and by 0.12 years per year for Indigenous females. To meet the target by 2031, Indigenous life expectancy needs to increase by 0.6 to 0.8 years per year. In the nine years since the target was set there have been some improvements for Aboriginal and Torres Strait Islander peoples (decline in mortality rates and life expectancy has increased). However, some health interventions which are targeted at closing the gap take time to have measurable impacts upon populations. These include interventions aimed at reductions in population level smoking rates, which take five years to impact on heart disease and up to 30 years for cancer, and improvements in educational attainment will take 20 to 30 years to impact on early deaths from chronic disease in the middle years. Most deaths for Indigenous Australians occur in the middle years. Indigenous mortality rates are 4 times the non-Indigenous rate between the ages of 35–44 years. The leading causes of death for Indigenous Australians are circulatory disease, cancer, injury, diabetes and respiratory disease. The results signal the need for significant and concerted efforts to continue improving Indigenous health outcomes, both directly through health interventions and by addressing the cultural and social determinants of health.
Figure 1.19-1 Trends in life expectancy for Indigenous males and females by state/territory, 2005–07 and 2010–12
Source: ABS (2013b)
68.3 67.1 64.5 61.5
74.0 72.7 70.0 69.470.5 68.765.0 63.4
74.6 74.470.2 68.7
0
20
40
60
80
100
NSW Qld WA NT NSW Qld WA NT
Life
exp
ecta
ncy
(yea
rs)
Jurisdiction
2005–07 2010–12
Males Females

Life expectancy and wellbeing
80
Figure 1.19-2 Life expectancy at birth, Indigenous and non-Indigenous Australians by sex, 2010–12
Source: ABS (2013b)
Figure 1.19-3 Life expectancy at birth, comparison across selected countries, 2014
Source: (OECD, 2015)
Figure 1.19-4 The gap in life expectancy between Indigenous and non-Indigenous Australians by sex, 2005–07 and 2010–12
Source: ABS (2013b)
Table 1.19-1 Life expectancy at birth and the gap in life expectancy, by Indigenous status and sex, 2005–07 and 2010–12
Males Females
Indigenous Non-Indigenous Gap Indigenous Non-
Indigenous Gap
2005–07 (revised) 67.5 78.9 11.4 73.1 82.6 9.6
2010–12 69.1 79.7 10.6 73.7 83.1 9.5 change 2005–07 to 2010–12
1.6 0.8 -0.8 0.6 0.5 -0.1
Source: ABS (2013b)
Table 1.19-2 Life expectancy at birth, by Indigenous status and sex, selected states/territories and remoteness, 2010–12
Males Females
Indigenous Non-Indigenous Gap Indigenous Non-
Indigenous Gap
New South Wales 70.5 79.8 9.3 74.6 83.1 8.5
Queensland 68.7 79.4 10.8 74.4 83.0 8.6
Western Australia 65.0 80.1 15.1 70.2 83.7 13.5
Northern Territory 63.4 77.8 14.4 68.7 83.1 14.4 Major cities & inner regional
68.0 79.9 11.9 73.1 83.0 9.9
67.3 78.5 11.2 72.3 82.5 10.2 Outer regional & remote/very remote
Source: ABS (2013b)
69.1 73.779.7 83.1
0
20
40
60
80
100
Males Females
Life
exp
ecta
cy (y
ears
)
Sex
Aboriginal and Torres Strait Islander peoples Non-Indigenous Australians
South Africa
India
Indonesia
Russia
Colombia
Latvia
Brazil
Lithuania
Mexico
Hungary
Estonia
Poland
Turkey
United States
Chile
Costa Rica
OECD
Denmark
Germany
Portugal
Slovenia
Finland
Belgium
Ireland
Greece
Austria
New Zealand
Netherlands
Israel
Korea
Norway
Luxembourg
Sweden
France
Iceland
Italy
Spain
Switzerland
Japan
0 10 20 30 40 50 60 70 80 90
Life expectancy at birth (years)
United Kingdom
Non-Indigenous Australia
Czech Republic
Slovak Republic
China (People's Republic of)
Indigenous Australia
11.4
9.610.6
9.5
0
5
10
15
Males Females
Gap
(yea
rs)
Sex
2005-07 2010-12

Deaths
81
1.20 Infant and child mortality Why is it important? Infant mortality is the death of a child less than one year of age and is a long established measure of child health, as well as the overall health of the population and its physical and social environment. COAG has committed to halving the gap in mortality rates for Aboriginal and Torres Strait Islander children under 5 years by 2018. Improvements in Australia’s infant mortality rates in the last 100 years were largely due to improved social and public health conditions such as sanitation and health education in the first half of the twentieth century, followed by the development of immunisation, and in more recent years by better treatment in neonatal intensive care and interventions for Sudden Infant Death Syndrome (SIDS).
Findings Infant deaths contribute substantially to total years of life lost (YLL) due to premature mortality for Indigenous Australians, accounting for 11% of the total YLL in 2011 (AIHW, 2016f).
Between 1998 and 2015 there has been a significant decline in Indigenous child mortality rates of 33% and a significant narrowing of the gap (by 31%) with non-Indigenous children in jurisdictions with reliable data (NSW, Qld, WA, SA and the NT). In the 5-year period 2011–15, there were 610 deaths of Aboriginal and Torres Strait Islander children aged 0–4 years, and of these, 500 were infant deaths (82%). The mortality rate for Aboriginal and Torres Strait Islander children aged 0–4 years was 2 times the non-Indigenous rate (164.9 per 100,000 compared with 80.1 per 100,000).
In the period 2011–15, the mortality rate for Indigenous infants was 1.9 times the non-Indigenous rate (6.1 per 1,000 live births compared with 3.3 per 1,000 live births). The Indigenous infant mortality rate has more than halved, from 13.5 to 6.3 per 1,000 live births, between 1998 and 2015. The gap between mortality rates for Indigenous infants and non-Indigenous infants narrowed significantly (by 84%). In 2011–15, Aboriginal and Torres Strait Islander infant mortality rates varied across jurisdictions, from 4 per 1,000 in NSW, to 14 per 1,000 in the NT. A study in Victoria involving data linkage to improve the quality of Indigenous identification found the Indigenous infant mortality rate was nearly twice the rate for non-Indigenous infants (Freemantle et al, 2014). Data on trends from 1967 to 2006 in the NT (the only jurisdiction with adequate data quality for this period) show an 81% fall in the Indigenous infant mortality rate with rapid declines until the mid-1980s, followed
by slower improvement over the past 20 years. There has been substantial improvement in the NT during the period 1967 to 2006 for both neonatal death rates (up to age 28 days) and post-neonatal death rates (from 28 days to one year) (Wang & Li, 2010).
In 2011–15 the most common causes of death for Aboriginal and Torres Strait Islander infants were conditions originating in the perinatal period (51%) such as birth trauma, fetal growth disorders, complications of pregnancy, and respiratory and cardiovascular disorders specific to the perinatal period. The second leading cause of death was signs, symptoms and ill-defined conditions (21%). This category includes SIDS, which accounted for 8% of infant deaths. The third most common cause of Indigenous infant deaths was congenital malformations accounting for 13% of infant deaths. Among older Indigenous children aged 1–4 years, injury accounted for half of the deaths, and the rate for Indigenous children was 4 times as high as the non-Indigenous rate. Nearly half of the decline in Indigenous infant mortality over the last decade is due to a reduction in deaths from signs, symptoms and ill-defined conditions (including SIDS) and certain conditions originating in the perinatal period (such as complications of pregnancy, labour and delivery, fetal growth disorders, infections and respiratory and cardiovascular disorders).
A retrospective study of infants with congenital heart defects born in WA (1980–2010) found that long-term survival was lower for Indigenous than non-Indigenous children, with increased mortality risk likely due to socio-economic and environmental factors (Nembhard et al, 2016).
International statistics show that indigenous infants in the US and New Zealand have higher mortality rates than infants in the general population and these gaps are similar to the gap between Aboriginal and Torres Strait Islander and non-Indigenous infants. In New Zealand the infant mortality rate for Maoris was 6 per 1,000 live births compared with 4 per 1,000 for other infants in 2012. In the United States, the mortality rate for American Indians/Alaskan Natives was 8 per 1,000 live births compared with 6 per 1,000 live births for the total population in 2013. Caution must be used in comparing data with other countries due to variations in data quality, methods applied for addressing data quality issues and definitions for identifying indigenous peoples.
Implications Both child and infant Indigenous mortality rates are declining. While mortality for non-Indigenous children is also declining, the gaps in mortality between Indigenous and non-Indigenous infants and children are
reducing. Deaths during the neonatal period (up to 28 days), which account for 62% of infant deaths, have also fallen significantly (see measure 1.21). This significant improvement provides opportunities to understand which aspects of Aboriginal and Torres Strait Islander lives contribute to infant and child mortality, and where the health system could be more effective in engaging with Aboriginal and Torres Strait Islander peoples to support healthy pregnancies and childhood development.
The key risk factors associated with infant and child mortality include low birthweight and pre-term births, maternal health and behaviours (nutrition during pregnancy, smoking, alcohol), socio-economic status, and access to health services (AIHW, 2014b). Studies have shown an association between inadequate antenatal care and an increase of these risk factors, so improved access to, and take up of, antenatal care services is crucial for improving child outcomes (Taylor, LK et al, 2013). There have been improvements for Indigenous Australians for several of these risk factors in recent years, for example a 13% decline in low birthweight from 2000 to 2014 (see measure 1.01). However, there remains a significant disparity between the Indigenous and non-Indigenous rates of antenatal care in the first trimester (8 percentage points less), smoking during pregnancy (4 times higher), low birthweight (2 times higher for Indigenous) and immunisation at age 1 (4 percentage points lower).
A study of avoidable mortality in the NT between 1985 and 2004 found the largest improvements in deaths were for conditions amenable to medical care such as increased number of births in hospital, improved neonatal and paediatric care and the establishment of pre-natal screening for congenital abnormalities (Li, SQ et al, 2009). The long-term study in the NT from 1967 found improvements in both neonatal deaths (usually indicative of pregnancy related health and services) and post-neonatal deaths (indicative of conditions) (Wang & Li, 2010).
In December 2007, COAG committed to closing the gap in Indigenous disadvantage and, in particular, to halving the gap in mortality rates for Aboriginal and Torres Strait Islander children under 5 years of age by 2018. Australian governments are investing in a range of initiatives to improve child and maternal health.
The 2014–15 Federal Budget provided funding of $94 million from July 2015 for the Better Start to Life approach to expand efforts in child and maternal health to support Indigenous children to be healthy and ready for school.
The Better Start to Life approach included $54 million to increase the number of New Directions: Mothers and Babies services from

Deaths
82
85 to 136. These services provide Aboriginal and Torres Strait Islander families with access to antenatal care, practical advice and assistance with parenting, and health checks for children.
This approach also provides $40 million to expand the Australian Nurse–Family Partnership Program (ANFPP) from 3 to 13 sites. The ANFPP aims to improve pregnancy outcomes by helping women engage in good preventive health practices, support parents to improve their child's health and development, and help parents develop a vision for their own future, including continuing education and finding work.
The Indigenous Australians’ Health Program has allocated $12 million over two years (from July 2016) to support the implementation of integrated early childhood services: Connected Beginnings, as recommended by the Forrest Review. The Department of Education has also allocated $30 million over three years to support the programme, which will support integrated health and education services for antenatal to school age children.
The Foetal alcohol spectrum disorder (FASD) prevention program is a project in the Kimberly region run by the Ord Valley Aboriginal Health Service. The programme applies innovative strategies in providing
education and support of antenatal clients and their families, as well as providing regular education sessions to students in the region.
In SA, the Aboriginal Family Birthing Program (a partnership model between Aboriginal Maternal Infant Care Workers and midwives) supports Aboriginal women and their families through pregnancy, childbirth and up to 6 weeks postnatally. Since its inception in 2004, SA has seen, for women in the Program, a significant decrease in low birthweight rates, infant mortality and in the proportion of Aboriginal mothers smoking during pregnancy.
Figure 1.20-1 Infant mortality rates per 1,000 live births, by Indigenous status, NSW, Qld, WA, SA and the NT, 1998 to 2015
Source: ABS and AIHW analysis of National Mortality Database
Figure 1.20-2 Infant mortality rates per 1,000 live births, by Indigenous status, NT, 1967 to 2006(a)
(a) Rates are for 4 and 5-year averages Source: Wang, 2010
Table 1.20-1 Infant mortality rates per 1,000 live births, by Indigenous status, NSW, Qld, WA, SA and the NT, 2011–15
Jurisdiction Number of deaths Rate per 1,000 live births
Ratio Rate Difference Indigenous Non-Indigenous Indigenous Non-Indigenous
NSW 118 1,581 4.0 3.3 1.2 0.6
Qld 175 1,183 6.7 4.1 1.6 2.6
WA 77 327 5.6 2.1 2.7 3.5
SA 31 257 6.5 2.7 2.4 3.8
NT 99 45 13.8 3.4 4.0 10.4
Total of 5 jurisdictions 500 3,393 6.1 3.3 1.9 2.8 Source: ABS and AIHW analysis of National Mortality Database
Table 1.20-2 Infant mortality rates per 1,000 live births, by Indigenous status, NSW, Qld, WA, SA and the NT, 2011–15
Cause of death Number of deaths Rate per 1,000 live births
Ratio Rate
difference Indigenous Non-Indigenous Indigenous Non-Indigenous
Certain conditions originating in the perinatal period 256 1,774 3.1 1.7 1.8 1.4
Signs, symptoms & ill-defined conditions 103 357 1.3 0.3 3.6 0.9
SIDS (subcategory of Signs, symptoms etc) 39 157 0.5 0.2 3.1 0.3
SUDI (subcategory of Signs, symptoms etc) 64 199 0.8 0.2 4.1 0.6
Congenital malformations 67 816 0.8 0.8 1.0 —
Other conditions 19 212 0.2 0.2 1.1 —
Diseases of the respiratory system 20 48 0.2 — 5.2 0.2
Infectious and parasitic diseases 11 51 0.1 — 2.7 0.1
Injury and poisoning 19 84 0.2 0.1 2.8 0.2
Diseases of the circulatory system 5 51 0.1 — 1.2 —
Total 500 3,393 6.1 3.3 1.9 2.8 Source: ABS and AIHW analysis of National Mortality Database
0
5
10
15
20
98 99 00 01 02 03 04 05 06 07 08 09 10 11 12 13 14 15
Deat
hs p
er 1
,000
live
birt
hs
YearAboriginal and Torres Strait Islander peoplesNon-Indigenous Australians
0
20
40
60
80
100
1967 1971 1976 1981 1986 1991 1996 2001 2006
Deat
hs p
er 1
,000
live
birt
hs
YearAboriginal and Torres Strait Islander peoplesNon-Indigenous Australians

Deaths
83
1.21 Perinatal mortality Why is it important? The perinatal mortality rate includes fetal deaths (stillbirths) and deaths of live-born babies within the first 28 days after birth. Almost all of these deaths are due to factors that occur during pregnancy and childbirth. Perinatal mortality reflects the health status and health care of the general population, access to and quality of preconception, reproductive, antenatal and obstetric services for women, and health care in the neonatal period. Broader social factors such as maternal education, nutrition, smoking, alcohol use in pregnancy, and socio-economic disadvantage are also significant.
Findings Reliable data on fetal and neonatal deaths for Aboriginal and Torres Strait Islander peoples are only available for NSW, Qld, WA, SA and the NT. Based on the combined data for these jurisdictions for the period 2011–15, the perinatal mortality rate for Aboriginal and Torres Strait Islander babies was around 9.2 per 1,000 births compared with 7.7 per 1,000 births for non-Indigenous babies. Fetal deaths (stillbirths) account for around 59% of perinatal deaths for Aboriginal and Torres Strait Islander babies and 70% of perinatal deaths for non-Indigenous Australian babies.
Due to small numbers, time-series data for perinatal mortality are volatile. The perinatal mortality rate for Aboriginal and Torres Strait Islander peoples decreased by around 56% between 1998 and 2015—an average yearly decline of 0.6 deaths per 1,000 births. The perinatal mortality rate for non-Indigenous Australians also decreased, but by a smaller amount, so that the gap between Indigenous Australians and non-Indigenous Australians decreased significantly over this period. Fetal death rates for Indigenous Australians declined by 53% and neonatal deaths by 60%.
Estimated rates for perinatal mortality vary between jurisdictions from 4.4 deaths per 1,000 births to Aboriginal and Torres Strait Islander mothers in SA, to 20 per 1,000 births in the NT. The largest gap was in the NT with Indigenous rates 2.5 times the non-Indigenous rates. Indigenous perinatal mortality rates were lower than non-Indigenous rates in NSW and SA.
The leading cause of Aboriginal and Torres Strait Islander perinatal mortality was a group of conditions originating in the perinatal period including birth trauma and disorders specific to the foetus/newborn (accounting for 44% of deaths), followed by premature birth/ inadequate fetal growth (30%). Congenital malformations,
deformations and chromosomal abnormalities were the third most common group of conditions (15%). The main conditions in the mother leading to perinatal deaths were complications of the placenta, cord and membranes, followed by complications of pregnancy (both 13%). When looking at the pattern of causes of death in the first 28 days, a higher proportion of Indigenous deaths were due to premature birth/inadequate fetal growth (30% compared with 21% non-Indigenous) and a lower proportion due to congenital malformations (15% Indigenous compared with 21% non-Indigenous).
Maternal health factors such as pre-pregnancy weight and diabetes have been linked to birth outcomes and infant mortality. A significant association between maternal obesity and risk of stillbirth has been found (Yao et al, 2014).
Implications Rates of low birthweight for Aboriginal and Torres Strait Islander babies have declined by 13% from 2000 to 2014 (see measure 1.01).
A study of avoidable mortality in the NT between 1985 and 2004 found a significant improvement in mortality for conditions amenable to medical care for Indigenous Australians in the NT, including perinatal survival. The authors noted that a broad range of medical care improvements such as an increased number of births in hospital, improved neonatal and paediatric care, and the establishment of pre-natal screening for congenital abnormalities have likely contributed to this improvement (Li, SQ et al, 2009). Due to small numbers it is not possible to detect statistically significant changes in particular causes of perinatal deaths.
Enhanced primary care services and continued improvement in antenatal care have the capacity to support improvements in the health of the mother and baby.
Recognising this, the 2014–15 Federal Budget provides funding of $94 million from July 2015, for the Better Start to Life approach to expand efforts in child and maternal health.
The Better Start to Life approach includes $54 million to increase the number of sites providing New Directions: Mothers and Babies Services from 85 to 136. These Services provide Aboriginal and Torres Strait Islander families with access to antenatal care; practical advice and assistance with parenting; and health checks for children.
This approach also provides $40 million to expand the Australian Nurse- Family Partnership Program (ANFPP) from 3 to 13 sites. The ANFPP aims to improve pregnancy
outcomes by helping women engage in good preventive health practices; supporting parents to improve their child's health and development; and helping parents develop a vision for their own future, including continuing education and finding work. A study of the impact of the US Nurse Family Partnership program, on which the ANFPP is modelled, has shown reductions in all-cause mortality among mothers and preventable-cause mortality in children in disadvantaged settings (Olds et al, 2014).
The Australian Health Ministers’ Advisory Council (AHMAC) is in the process of developing Guiding Principles for Birthing on Country Service Model and Evaluation Framework to build upon the National Maternity Plan.
The Department of Health coordinated the development of National Evidence-Based Antenatal Care Guidelines on behalf of all Australian governments. The Guidelines were developed with input from the Working Group for Aboriginal and Torres Strait Islander Women’s Antenatal Care to provide culturally appropriate guidance and information for the health needs of Aboriginal and Torres Strait Islander pregnant women and their families.
The Antenatal Care Guidelines are intended for all health professionals who contribute to antenatal care including midwives, obstetricians, general practitioners, practice nurses, maternal and child health nurses, Aboriginal and Torres Strait Islander health workers and allied health professionals. They provide consistency of antenatal care in Australia and ensure maternity services provide high-quality, evidence-based maternity care.
In 2016, the Department of Health began a review and update of the Antenatal Care Guidelines. One of the topics to be reviewed is the Antenatal Care of Aboriginal and Torres Strait Islander Women. This topic will consider how holistic antenatal care can be provided to meet the needs of Aboriginal and Torres Strait Islander women including spiritual, emotional, social and cultural as well as physical and health care needs. A draft version of the revised Antenatal Care Guidelines is expected to be released for public consultation early in 2017 with final guidelines expected to be completed in mid-2017.
The Australian Government also funds the development of nationally consistent maternal and perinatal data collections. Improving data collections is critical to informing actions to improve outcomes for mothers and babies, including reducing perinatal mortality.

Deaths
84
Figure 1.21-1 Perinatal mortality rate by Indigenous status, NSW, Qld, WA, SA, and the NT, 1998 to 2015
Source: ABS and AIHW analysis of National Mortality Database
Figure 1.21-2 Perinatal mortality rate by state/territory and Indigenous status, 2011–15
Source: ABS and AIHW analysis of National Mortality Database Table 1.21-1
Table 1.21-1 Proportion of deaths for perinatal babies by underlying cause of death and Indigenous status, NSW, Qld, WA, SA and NT, 2011–15
Cause of death
Foetal deaths Neonatal deaths Perinatal deaths
Indigenous Non-
Indigenous Indigenous Non-
Indigenous Indigenous Non-
Indigenous Per cent
Main condition in the foetus/infant:
Other conditions originating in the perinatal period 61.6 59.2 19.0 25.0 44.0 48.8
Disorders related to length of gestation and foetal growth 21.8 17.0 43.0 31.0 30.4 21.1 Congenital malformations, deformations and chromosomal abnormalities 13.9 18.8 17.0 25.0 14.9 20.7
Respiratory and cardiovascular disorders 2.3 3.5 11.0 10.0 6.0 5.6
Infections np 0.9 5.0 4.0 2.4 1.7
Other conditions — 0.6 6.0 6.0 2.3 2.1
Main condition in the mother:
Complications of placenta, cord and membranes 14.8 15.1 11.0 12.3 13.2 14.2
Maternal complications of pregnancy 8.9 8.4 18.4 14.9 12.8 10.4
Maternal conditions that may be unrelated to present pregnancy 6.8 4.9 2.9 4.4 5.2 4.7 Complications of labour and delivery and noxious influences transmitted via placenta or breast milk 5.9 4.0 7.1 6.6 6.4 4.8
Total deaths (Number) 440 5,524 310 2,407 750 7,931 Source: ABS and AIHW analysis of National Mortality Database
Figure 1.21-3 Child and infant mortality, Aboriginal and Torres Strait Islander peoples, 2011–15
Source: ABS and AIHW analysis of National Mortality Database
0
5
10
15
20
25
98 99 00 01 02 03 04 05 06 07 08 09 10 11 12 13 14 15
Deat
hs p
er 1
,000
birt
hs
Year
Aboriginal and Torres Strait Islander peoplesNon-Indigenous Australians
5.9
9.9 10.7
4.4
20.2
9.27.4
9.3
6.6 6.28.0 7.7
0
5
10
15
20
25
NSW Qld WA SA NT Total 5jurisdictions
Deat
hs p
er 1
,000
birt
hs
Jurisdiction
Aboriginal and Torres Strait Islander peoples Non-Indigenous Australians
20 weeks gestation Birth 28 days 1 year 4 years
750 perinatal deaths440 foetalAt least 20 weeks gestation
310 neonatalBirth to 27 days
500 infant deathsBirth to < 1 year
610 child deathsAges 0 to 4 years
109 child deathsAges 1 to 4 years

Deaths
85
1.22 All causes age-standardised death rates Why is it important? The mortality rate of a population provides a summary measure of the overall health status of that population. However, it has some well-known limitations. There may be delays for many years before improvements in health status lead to reductions in mortality, and mortality statistics do not reflect the burden of illness in a population for diseases that do not necessarily result in death, such as arthritis and depression. Despite these limitations, mortality rates are a useful measure with which to compare the overall health status of different populations and to monitor changes in overall health status of populations over time. The all causes mortality rate for Aboriginal and Torres Strait Islander peoples is 1.7 times that for non-Indigenous Australians, indicating that the overall health status of Aboriginal and Torres Strait Islander peoples is worse than that of non-Indigenous Australians.
Findings During the period 2011–15, in those jurisdictions with adequate quality data (NSW, Qld, WA, SA, and the NT), 13,106 deaths were identified as those of Aboriginal and Torres Strait Islander peoples. After adjusting for age differences between the two populations, the all causes mortality rate was 1.7 times as high for Aboriginal and Torres Strait Islander peoples as the rate for non-Indigenous Australians (992 versus 580 deaths per 100,000 population).
There was a 15% reduction in all cause mortality rates for Aboriginal and Torres Strait Islander peoples in the time period 1998 to 2015 (in NSW, Qld, WA, SA, and the NT). Non-Indigenous death rates also declined over this period and there was no significant change in the gap. There was no change in the relative gap.
Most deaths for Aboriginal and Torres Strait Islander peoples occur in the middle age groups, while most deaths for the non-Indigenous population occur in the older age groups. This partly reflects the younger age profile of the Indigenous population. In 2011–15, 64% of Aboriginal and Torres Strait Islander deaths occurred before the age of 65 years. The largest gaps were in the 45–64 year age groups (based on the sum of years of life lost due to premature mortality). In the 35–44 year age group the Indigenous mortality rate was 4 times the non-Indigenous rate. Within the Indigenous population males and females had different patterns of mortality by age. Indigenous males aged 15–34 years had mortality rates
around twice that of Indigenous females. For males, deaths were highest in the 45–74 years age group, while for females deaths were highest in the 55–74 years age group. In the period 2011–15, Indigenous mortality rates ranged from 810 deaths per 100,000 in NSW to 1,520 per 100,000 in the NT. Between 2001 and 2015 there has been a significant decrease in mortality rates in remote areas (remote and very remote combined) for young children and middle age groups and an increase in the 75 years and over group.
Mortality rates are also available for other countries where Indigenous peoples share a similar history of relatively recent European colonisation, such as New Zealand and the United States. In New Zealand in 2014, the age-standardised all cause mortality rate for the Maori population was 1.6 times as high as other New Zealanders (940 per 100,000, compared with 578 per 100,000). In the United States, the mortality rate for American Indians/Alaska Natives was 50% higher than the rate for non-Hispanic whites during the period 1999–2009 (Espey et al, 2014). Caution must be used in comparing Australian data with data for other countries due to variations in data quality, methods applied for addressing data quality issues and definitions for identifying indigenous peoples.
Implications The very high mortality rates for Aboriginal and Torres Strait Islander peoples, particularly in early childhood and the middle adult years, are an indication of the relatively poor overall health status of Aboriginal and Torres Strait Islander peoples and reflect the high rates of chronic disease and injury. There has been significant improvement in mortality rates for Aboriginal and Torres Strait Islander peoples in the past 15 years in the jurisdictions with adequate data for long-term analysis (NSW, Qld, WA, SA and the NT). The fact that improvements have occurred demonstrates that the severe health problems of Aboriginal and Torres Strait Islander peoples have been reduced to some extent and can be reduced further, and faster, with sustained and improved effort.
Closing the gap in life expectancy between Aboriginal and Torres Strait Islander peoples and other Australians within a generation has been adopted as a target by COAG. In the nine years since the target was set there have been some improvements for Aboriginal and Torres Strait Islander peoples (decline in mortality rates and life expectancy has increased). However, some health interventions which are targeted at closing the gap take time to have measurable impacts upon populations. These include interventions aimed at reductions in population level smoking rates, which take five years to impact on heart
disease and up to 30 years for cancer, and improvements in educational attainment will take 20 to 30 years to impact on early deaths from chronic disease in the middle years.
A recent international population study collated data on Indigenous population, life expectancy at birth, infant mortality, birthweight, maternal mortality, nutritional status, educational attainment, and economic status. The study was across a broad sample of countries and provided recommendations to national governments including developing targeted policy responses to Indigenous health, improving access to health services, and having Indigenous data within national surveillance systems (Anderson, I et al, 2016). These measures could also help address the higher all causes mortality rate in Aboriginal and Torres Strait Islander peoples.
A description of policies and strategies relating to this measure are included in the Policies and Strategies section.

Deaths
86
Figure 1.22-1 Age-standardised all-cause mortality rates, by Indigenous status, 1998 to 2015
Source: ABS and AIHW analysis of National Mortality Database
Table 1.22-1 Age-standardised all-cause mortality rates, by Indigenous status, NSW, Qld, WA, SA and the NT, 2011–15
Jurisdiction Number of deaths Deaths per 100,000
Rate ratio
Rate difference
Indigenous Non-Indigenous Indigenous Non-
Indigenous
NSW 3,730 251,226 810 585 1.4 225
Qld 3,602 136,486 960 581 1.7 380
WA 2,405 64,642 1,215 538 2.3 677
SA 805 64,638 831 603 1.4 228
NT 2,564 2,852 1,520 581 2.6 938
Total 13,106 519,844 992 580 1.7 412
Source: ABS and AIHW analysis of National Mortality Database
Figure 1.22-2 Selected age-specific mortality rates, Indigenous Australians, in remote areas, 2001 to 2015
Source: ABS and AIHW analysis of National Mortality Database
Figure 1.22-3 The gap in potential years of life lost before age 75 years (PYLL) per 1,000 population between Indigenous and non-Indigenous Australians, by age and sex, 2011–15
Note: PYLL is the number of additional years a person would have lived had they not died before age 75 years. The gap is the difference between the PYLL rate per 1,000 for Indigenous and non-Indigenous Australian populations. Source: ABS and AIHW analysis of National Mortality Database
Figure 1.22-4 Age distribution of proportion of deaths, by sex and Indigenous status, NSW, Qld, WA, SA and the NT, 2011–15
Source: ABS and AIHW analysis of National Mortality Database
0.0
200.0
400.0
600.0
800.0
1000.0
1200.0
1400.0
1600.0
98 99 00 01 02 03 04 05 06 07 08 09 10 11 12 13 14 15
Deat
hs p
er 1
00,0
00 p
opul
atio
n
YearAboriginal and Torres Strait Islander peoplesNon-Indigenous Australians
0
2000
4000
6000
8000
10000
12000
14000
01 02 03 04 05 06 07 08 09 10 11 12 13 14 15
Deat
hs p
er 1
00,0
00 p
opul
atio
n
Year
0–4 years 35–44 years 75+ years
0
50
100
150
200
Rate
diff
eren
ce (P
YLL
per 1
,000
)
Age group (years)Males Females
16.429.8
15.049.4
15 10 5 0 5 10 15
0–45–9
10–1415–1920–2425–2930–3435–3940–4445–4950–5455–5960–6465–6970–7475–7980–85
85+
Per cent deaths
Age
grou
p (y
ears
)
Non-Indigenous Australians
Males Females
15 10 5 0 5 10 15
0–45–9
10–1415–1920–2425–2930–3435–3940–4445–4950–5455–5960–6465–6970–7475–7980–85
85+
Per cent deaths
Age
grou
p (y
ears
)
Aboriginal and Torres Strait Islander peoples
Males Females

Deaths
87
1.23 Leading causes of mortality Why is it important? Mortality rates are a useful measure of the overall health status of a population, particularly to compare one population with another or to measure improvements over time. The gap between the Aboriginal and Torres Strait Islander population and the rest of the Australian population for particular causes of death provides an indication of the prevention, prevalence and management of particular diseases for Aboriginal and Torres Strait Islander peoples. This provides a useful indication of the diseases that have a greater impact on Aboriginal and Torres Strait Islander peoples. However, some significant health problems will not be reflected in mortality statistics; many conditions that cause serious health problems may not be fatal (such as depression, arthritis and disability) and so do not appear as common causes of death. As health status and health services improve for Aboriginal and Torres Strait Islander peoples, it is anticipated that premature mortality will reduce over time.
Findings During the period 2011–15, in the five jurisdictions with adequate quality data (NSW, Qld, WA, SA and the NT), the most common cause of death among Aboriginal and Torres Strait Islander peoples was circulatory diseases (24% of all deaths), followed by neoplasms (including cancer) (21%) and external causes (15%). Circulatory diseases and cancer were the most common cause of death for non-Indigenous Australians. After adjusting for age, circulatory diseases accounted for the largest gap in death rates (24% of the gap), followed by endocrine, metabolic and nutritional disorders (including diabetes) (19%); neoplasms (including cancer) (15%); and respiratory diseases (12%). Deaths due to diabetes alone were 5.6 times higher for Indigenous Australians than for non-Indigenous Australians and a leading cause of the gap for females. The pattern of the leading causes of Indigenous deaths were similar across jurisdictions. The leading cause contributing to the gap was circulatory diseases in NSW, Qld, WA and the NT, while in SA it was endocrine, metabolic and nutritional disorders (including diabetes).
For Indigenous Australians, the leading causes of death due to external causes were suicide (35%), transport accidents (22%), accidental poisoning (14%), assault (10%) and accidental drowning (5%). Around 56% of these deaths were for people aged between 15 and 39 years. For non-Indigenous Australians external causes made up 6% of all deaths. The leading external causes of death were suicide (29%), accidental falls (19%) and transport accidents (15%).
Mortality rates for circulatory diseases showed the largest decline in deaths for both Indigenous Australians and non-Indigenous Australians. Between 1998 and 2015 there was a significant decline of 43% in death rates due to circulatory diseases for Indigenous Australians. A study in the NT found that while there was an increase in incidence of acute myocardial infarction between 1992 and 2004 for Aboriginal and Torres Strait Islander peoples, at the same time there was an improvement in survival due to reductions in death both pre-hospital and after hospital admission (You et al, 2009).
Between 1998 and 2015 there was a significant decline in mortality rates due to respiratory diseases for Indigenous Australians (by 24%).
For kidney disease mortality there was a significant decrease in both the Aboriginal and Torres Strait Islander mortality rate and the gap (over the period 2006 to 2015).
Since 2006 there has been a significant increase in the age-standardised mortality gap due to cancer, reflecting an increase in mortality rates for Indigenous Australians and a decrease in rates for non-Indigenous Australians.
For injury deaths, there was no significant reduction in short-term trends, or in the longer-term. No significant changes were detected for diabetes mortality rates or the gap in diabetes mortality between Indigenous and non-Indigenous Australians.
Implications In 2015, chronic conditions accounted for approximately 70% of Indigenous deaths and 77% of the gap in mortality between Indigenous and non-Indigenous Australians (including circulatory diseases, diabetes, cancer, kidney and respiratory diseases). In the period 1998–2015 there was a significant decline in Indigenous mortality due to chronic diseases. Non-Indigenous chronic disease mortality rates also declined over this period, so there was no significant change in the gap. External causes such as suicide and transport accidents are also important contributors to the gap in mortality; however, there have been no significant changes in these deaths since 1998.
The health system can contribute to sustained improvements, in partnership with Aboriginal and Torres Strait Islander peoples, through identification of Indigenous clients, health promotion, early detection, chronic disease management and specialist and acute care to treat the more severe health outcomes. A recent study of the gap in life expectancy between Indigenous and non-Indigenous Australians in the NT found socio-economic disadvantage was the leading factor accounting for one-third to one-half of the gap (Zhao et al, 2013a). Another recent study found chronic disease mortality increased with remoteness, reflecting
differentials in health care and socio-economic status across areas. This finding was consistent across Australia and within most states and territories (Chondur et al, 2014).
Improved management of chronic diseases can prevent the development of life-threatening complications but cannot cure these diseases. For example, a study of incidence and survival of acute myocardial infarction found improvements in survival for the NT Indigenous population associated with pre-hospital management of conditions. Also within-hospital specialised coronary care services and greater emphasis on post-hospital management was a factor in improved survival rates (You et al, 2009). Another study in the NT found the largest gains for the Indigenous population in avoidable mortality were for conditions amenable to medical care, but only marginal change for potentially preventable conditions such as lung cancer, chronic liver disease and cirrhosis, and motor vehicle accidents (Li, SQ et al, 2009).
The 20–24 year age group had the highest number of deaths from suicide while deaths due to transport accidents were highest in the 25–29 year age group. Acute care services can save the lives of seriously injured people, and there is scope for improvements in timely access to life-saving emergency care for Indigenous Australians. High levels of intentional self-harm highlight the need for cross-sectoral approaches to healing, self-esteem and social and emotional wellbeing (see measure 1.18).
Closing the gap in life expectancy between Aboriginal and Torres Strait Islander peoples and other Australians within a generation has been adopted as a target by COAG. In the nine years since the target was set there have been some improvements for Aboriginal and Torres Strait Islander peoples (decline in mortality rates and life expectancy has increased). However, this target is not on track to be met. Some health interventions which are targeted at closing the gap take time to have measurable impacts upon populations, including interventions aimed at reductions in population level smoking rates, which take five years to impact on heart disease and up to 30 years for cancer. Improvements in educational attainment will take 20 to 30 years to impact on early deaths from chronic disease in the middle years.
The results signal the need for significant and concerted efforts to continue improving Indigenous health outcomes, both directly through health interventions and by addressing the cultural and social determinants of health.
A description of policies and strategies relating to this measure are included in the Policies and Strategies section.

Deaths
88
Table 1.23-1 Causes of death, by Indigenous status, NSW, Qld, WA, SA and the NT, 2011–15
Underlying cause of death Per cent of deaths Age-standardised deaths per
100,000 persons Ratio Gap % of total gap Indigenous Non-Indigenous Indigenous Non-Indigenous
Circulatory diseases 24.0 30.0 271.4 173.3 1.6 98.1 23.8
Neoplasms 21.4 29.9 232.1 171.6 1.4 60.6 14.7
External causes 15.2 6.2 81.3 38.4 2.1 42.9 10.4
Endocrine, metabolic & nutritional disorders 8.8 3.9 100.6 22.5 4.5 78.1 19.0
Diabetes 7.6 2.7 87.3 15.5 5.6 71.7 17.4
Respiratory diseases 8.3 8.7 100.6 50.3 2.0 50.3 12.2
Digestive diseases 5.5 3.5 46.0 20.2 2.3 25.8 6.3
Nervous system diseases 2.5 4.9 26.1 28.6 0.9 -2.5 -0.6
Infectious and parasitic diseases 2.5 1.8 20.8 10.3 2.0 10.6 2.6
Kidney diseases 2.0 1.6 24.0 9.2 2.6 14.8 3.6
Conditions originating in perinatal period 2.0 0.3 4.7 2.3 2.0 2.4 0.6
Other causes 7.8 9.1 84.1 53.3 1.6 30.8 7.5
All causes 100.0 100.0 991.7 580.0 1.7 411.7 100.0 Source: ABS and AIHW analysis of National Mortality Database
Figure 1.23-1 Deaths of Indigenous Australians from external causes of injury and poisoning, by age, NSW, Qld, WA, SA and the NT, 2011–15
Source: ABS and AIHW analysis of National Mortality Database
0
50
100
150
200
250
300
0 5 10 15 20 25 30 35 40 45 50 55 60 65 70 75+
Num
ber o
f dea
ths
Age group (years)
Intentional self-harm Transport accidents Accidental drowning Accidental poisoning Assault Other external causes
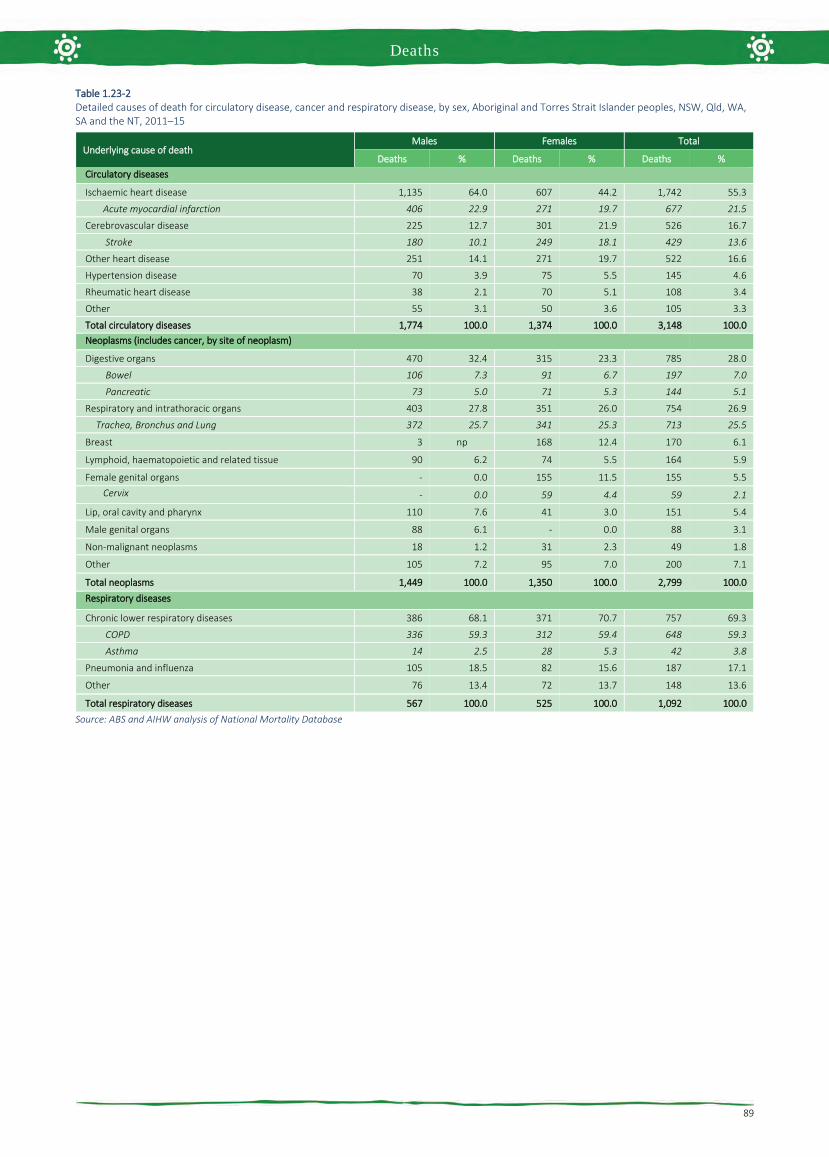
Deaths
89
Table 1.23-2 Detailed causes of death for circulatory disease, cancer and respiratory disease, by sex, Aboriginal and Torres Strait Islander peoples, NSW, Qld, WA, SA and the NT, 2011–15
Underlying cause of death Males Females Total
Deaths % Deaths % Deaths % Circulatory diseases
Ischaemic heart disease 1,135 64.0 607 44.2 1,742 55.3
Acute myocardial infarction 406 22.9 271 19.7 677 21.5
Cerebrovascular disease 225 12.7 301 21.9 526 16.7
Stroke 180 10.1 249 18.1 429 13.6
Other heart disease 251 14.1 271 19.7 522 16.6
Hypertension disease 70 3.9 75 5.5 145 4.6
Rheumatic heart disease 38 2.1 70 5.1 108 3.4
Other 55 3.1 50 3.6 105 3.3
Total circulatory diseases 1,774 100.0 1,374 100.0 3,148 100.0 Neoplasms (includes cancer, by site of neoplasm)
Digestive organs 470 32.4 315 23.3 785 28.0
Bowel 106 7.3 91 6.7 197 7.0
Pancreatic 73 5.0 71 5.3 144 5.1
Respiratory and intrathoracic organs 403 27.8 351 26.0 754 26.9
Trachea, Bronchus and Lung 372 25.7 341 25.3 713 25.5
Breast 3 np 168 12.4 170 6.1
Lymphoid, haematopoietic and related tissue 90 6.2 74 5.5 164 5.9
Female genital organs - 0.0 155 11.5 155 5.5 Cervix - 0.0 59 4.4 59 2.1
Lip, oral cavity and pharynx 110 7.6 41 3.0 151 5.4
Male genital organs 88 6.1 - 0.0 88 3.1
Non-malignant neoplasms 18 1.2 31 2.3 49 1.8
Other 105 7.2 95 7.0 200 7.1
Total neoplasms 1,449 100.0 1,350 100.0 2,799 100.0 Respiratory diseases
Chronic lower respiratory diseases 386 68.1 371 70.7 757 69.3
COPD 336 59.3 312 59.4 648 59.3
Asthma 14 2.5 28 5.3 42 3.8
Pneumonia and influenza 105 18.5 82 15.6 187 17.1
Other 76 13.4 72 13.7 148 13.6
Total respiratory diseases 567 100.0 525 100.0 1,092 100.0 Source: ABS and AIHW analysis of National Mortality Database

Deaths
90
Figure 1.23-2 Age-standardised mortality rates for selected causes of death, by Indigenous status, NSW, Qld, WA, SA and NT, 1998 to 2015
Source: ABS and AIHW analysis of National Mortality Database
0
100
200
300
400
500
98 99 00 01 02 03 04 05 06 07 08 09 10 11 12 13 14 15
Deat
hs p
er 1
00,0
00 p
opul
atio
n
Year
Circulatory disease
Aboriginal and Torres Strait Islander peoples
Non-Indigenous Australians
0
100
200
300
400
500
98 99 00 01 02 03 04 05 06 07 08 09 10 11 12 13 14 15
Deat
hs p
er 1
00,0
00 p
opul
atio
n
Year
Respiratory disease
Aboriginal and Torres Strait Islander peoples
Non-Indigenous Australians
0
100
200
300
400
500
98 99 00 01 02 03 04 05 06 07 08 09 10 11 12 13 14 15
Deat
hs p
er 1
00,0
00 p
opul
atio
n
Year
Diabetes
Aboriginal and Torres Strait Islander peoples
Non-Indigenous Australians
0
100
200
300
400
500
98 99 00 01 02 03 04 05 06 07 08 09 10 11 12 13 14 15
Deat
hs p
er 1
00,0
00 p
opul
atio
n
Year
Cancer
Aboriginal and Torres Strait Islander peoples
Non-Indigenous Australians
0
100
200
300
400
500
98 99 00 01 02 03 04 05 06 07 08 09 10 11 12 13 14 15
.
Year
Injury and poisoning
Aboriginal and Torres Strait Islander peoples
Non-Indigenous Australians
0
100
200
300
400
500
98 99 00 01 02 03 04 05 06 07 08 09 10 11 12 13 14 15
Deat
hs p
er 1
00,0
00 p
opul
atio
n
Year
Kidney disease
Aboriginal and Torres Strait Islander peoples
Non-Indigenous Australians

Deaths
91
1.24 Avoidable and preventable deaths Why is it important? Avoidable and preventable mortality refers to deaths from conditions that are considered avoidable given timely and effective health care (including disease prevention and population health initiatives) (Page et al, 2007; AIHW, 2010b). Avoidable deaths have been used in various studies to measure the quality, effectiveness and/or accessibility of the health system. Deaths from most conditions are influenced by a range of factors in addition to health system performance, including the underlying prevalence of conditions in the community, environmental and social factors and health behaviours.
Findings In the period 2011–15, there were 6,427 deaths of Aboriginal and Torres Strait Islander people aged 0–74 years from avoidable causes in NSW, Qld, WA, SA and the NT combined. This represented 61% of all deaths of Aboriginal and Torres Strait Islander peoples aged 0–74 years. In contrast, deaths from avoidable causes for non-Indigenous Australians represented 50% of all non-Indigenous deaths in this age group.
After adjusting for the difference in age structure between the two populations, Aboriginal and Torres Strait Islander peoples died from avoidable causes at 3.3 times the rate of non-Indigenous Australians. The avoidable mortality rate of Aboriginal and Torres Strait Islander peoples was higher than that of non-Indigenous Australians in all age groups, and particularly high (4 times that of non-Indigenous Australians) in the middle adult age groups (35–54 years). Indigenous avoidable mortality rates were lowest in NSW (244 per 100,000) and highest in the NT (629 per 100,000).
There was a 32% decline in the avoidable mortality rate for Aboriginal and Torres Strait Islander peoples in the period 1998 to 2015. A study in the NT found a rapid fall in avoidable mortality between 1985 and 2004 in the Indigenous population for conditions amenable to medical care. This suggests that improvements in health care have made a major contribution to the fall in death rates and is consistent with observed improvements in perinatal survival, congenital malformations, stroke and hypertensive conditions, pneumonia and asthma, and infectious diseases (Li, SQ et al, 2009).
Among Aboriginal and Torres Strait Islander peoples, the most common conditions or events causing avoidable mortality were ischaemic heart disease (22%), diabetes
(12%), suicide (11%), chronic obstructive pulmonary disease (COPD) (7%), road traffic injuries (7%) and cancer (7%). After adjusting for the difference in age structure, the conditions contributing the most to the avoidable mortality gap between Indigenous and non-Indigenous Australians were ischaemic heart disease (26% of the gap), diabetes (19% of the gap) and COPD (11% of the gap).
Implications Death rates for avoidable mortality among Aboriginal and Torres Strait Islander peoples are declining and the gap is closing. Chronic disease and injury are causing the greatest proportion of avoidable deaths for Aboriginal and Torres Strait Islander peoples and are amenable to both prevention and treatment. A study in the NT found that this decline has been greatest for conditions amenable to medical care, for example neonatal and paediatric care, antibiotics, immunisation, drug therapies, and improved intensive care and surgical procedures. Only marginal change was found for conditions responsive to public health (Li, SQ et al, 2009).
The Indigenous Australians’ Health Programme (IAHP) commenced from 1 July 2014, consolidating four existing funding streams (primary health care base funding, child and maternal health programmes, Stronger Futures in the Northern Territory and the Aboriginal and Torres Strait Islander Chronic Disease Fund), to improve the focus on local health needs, deliver the most effective outcomes, and better support efforts to achieve health equality between Aboriginal and Torres Strait Islander peoples and non-Indigenous Australians (see Policies and Strategies section).
The IAHP focuses on the prevention, early detection and management of chronic disease, including circulatory disease and diabetes through expanded access to and coordination of comprehensive primary health care. Activities funded under the IAHP include Tackling Indigenous Smoking; a care coordination and outreach workforce based in Primary Health Networks (PHNs) and Aboriginal Medical Services; and GP, specialist and allied health outreach services that support urban, rural and remote communities.
Diabetes is more common among Indigenous Australians than other Australians. Hospitalisations and death rates are both high, pointing to possible issues in secondary prevention. The Australian National Diabetes Strategy 2016–2020 seeks to prioritise Australia’s response to diabetes and its complications and comorbidities. Goal 5 is to reduce the impact of diabetes among Indigenous Australians.
Funding for Indigenous specific suicide prevention activity is an ongoing component
of Commonwealth suicide prevention investment, as part of the new direction in suicide prevention outlined in the Government’s response to the National Mental Health Commission Review of Mental Health Programmes and Services. Approximately $5.6 million per annum is allocated to PHNs for the delivery of culturally appropriate suicide prevention services for Indigenous Australians, with approximately $0.7 million per annum to be allocated for a National Centre of Best Practice in Aboriginal and Torres Strait Islander Suicide Prevention.
Alive and Kicking Goals is a multi-award winning youth suicide prevention project based in the Kimberley region. The project aims to reduce the high suicide rate among Aboriginal and Torres Strait Islander youth through peer education workshops, one-on-one mentoring, and counselling. The project is wholly owned and led by young Aboriginal women and men.

Deaths
92
Figure 1.24-1 Age-standardised mortality rates for avoidable causes of death, Indigenous and non-Indigenous Australians aged 0–74 years, 1998 to 2015
Source: ABS and AIHW analysis of National Mortality Database
Figure 1.24-2 Age-standardised mortality rates for avoidable causes of death by Indigenous status, NSW, Qld, WA, SA and NT, persons aged 0–74 years, 2011–15
Source: ABS and AIHW analysis of National Mortality Database
Table 1.24-1 Avoidable mortality, by cause of death and Indigenous status, persons aged 0–74 years, NSW, Qld, WA, SA, and the NT, 2011–15(a)
Cause of death Per cent
Age-standardised rate per 100,000
Rate ratio Rate difference
Rate difference per cent Indigenous Non-
Indigenous Indigenous Non-Indigenous
Ischaemic heart disease 21.8 19.6 83.1 19.9 4.2 63.2 26.4
Diabetes 12.0 4.6 50.6 4.7 10.8 45.9 19.2
Suicide 10.7 9.6 24.0 11.2 2.1 12.8 5.3
Chronic obstructive pulmonary disease (COPD) 7.3 7.4 34.8 7.4 4.7 27.5 11.5
Cancer 6.9 25.4 27.9 25.9 1.1 2.0 0.8
Cervical cancer 0.9 0.7 3.1 0.7 4.3 2.3 1.0
Transport accidents 6.6 4.9 15.7 5.6 2.8 10.1 4.2
Cerebrovascular diseases 4.8 6.7 20.2 6.9 2.9 13.3 5.6
Complications of the perinatal period 4.1 2.1 5.0 2.5 2.0 2.5 1.1
Selected invasive infections 4.1 3.0 14.2 3.1 4.5 11.0 4.6
Assault 3.1 0.8 7.3 1.0 7.5 6.3 2.6
Renal failure 2.5 1.3 10.9 1.3 8.6 9.7 4.0
Rheumatic and other valvular heart disease 2.1 1.3 7.6 1.3 5.7 6.2 2.6
Other 13.9 13.3 43.9 14.7 3.0 29.2 12.2
Total 100.0 100.0 345.2 105.4 3.3 239.8 100.0
Total avoidable deaths 0–74 years 6,427 87,332
Total deaths people 0–74 years 10,589 175,217
Total deaths 13,106 519,844
(a) The avoidable mortality classification includes Acute lymphoid leukaemia/Acute lymphoblastic leukaemia (C91.0) for those aged 0–44 years only. This cause has been included in only the relevant age groups and the subset included in the total. Source: ABS and AIHW analysis of National Mortality Database
0
100
200
300
400
500
600
98 99 00 01 02 03 04 05 06 07 08 09 10 11 12 13 14 15
Deat
hs p
er 1
00,0
00 p
opul
atio
n
Year
Aboriginal and Torres Strait Islander peoplesNon-Indigenous Australians
0
100
200
300
400
500
600
700
NSW Qld WA SA NT
Deat
hs p
er 1
00,0
00 p
opul
atio
n
Jurisdiction
Aboriginal and Torres Strait Islander peoples Non-Indigenous Australians

Deaths

Tier 2 Determinants of Health
Socio-economic factors 2.04 Literacy and numeracy
2.05 Education outcomes for young people
2.06 Educational participation and attainment of adults
2.07 Employment
2.08 Income
2.09 Index of disadvantage
Environmental factors 2.01 Housing
2.02 Access to functional housing with utilities
2.03 Environmental tobacco smoke
Person-related factors 2.22 Overweight and obesity
Health behaviours 2.15 Tobacco use
2.16 Risky alcohol consumption
2.17 Drug and other substance use including inhalants
2.18 Physical activity
2.19 Dietary behaviours
2.20 Breastfeeding practices
2.21 Health behaviours during pregnancy
Community capacity 2.10 Community safety
2.11 Contact with the criminal justice system
2.12 Child protection
2.13 Transport
2.14 Indigenous people with access to their traditional lands

Environmental factors
95
2.01 Housing Why is it important? Housing circumstances including overcrowding, tenure type and homelessness both directly and indirectly influence health outcomes (Andersen et al, 2016). The effects of overcrowding occur in combination with other environmental health factors such as unsafe, unclean and poor quality housing infrastructure (see measure 2.02); exposure to toxins and allergens such as smoking indoors (see measure 2.03); as well as increased risk of injury within the home (Bailie, RS & Wayte, 2006; Brackertz, 2016; Nganampa Health Council et al, 1987).
There are complex relationships between housing circumstances, health and socio-economic factors such as education, income and employment (Thomson, H et al, 2013). Overcrowding, insecure housing tenure, and homelessness adversely impact on school attendance and attainment (Brackertz, 2016; Biddle, 2014a); and housing tenure and affordability have been found to have negative impacts on childrens’ physical health, learning outcomes and social and emotional wellbeing (Dockery et al, 2013). Biddle (2011) found structural problems and missing facilities (measure 2.02) had a greater association with wellbeing outcomes than overcrowding and tenure type.
Homelessness is linked with experiences of domestic violence, alcohol and drug problems, financial hardship and unmet need for public housing (Graham, D et al, 2014; Memmott et al, 2012).
Findings The 2014–15 Social Survey collected data on a variety of housing characteristics, including overcrowding. Households requiring at least one additional bedroom are defined as overcrowded according to the Canadian National Occupancy Standard. In 2014–15, 21% of all Aboriginal and Torres Strait Islander persons were living in overcrowded households compared with 6% of non-Indigenous Australians. A large number of Indigenous Australians in both non-remote areas (82,100) and remote areas (59,400) experienced overcrowding, however it was more common in remote areas; 41% of Indigenous Australians in remote areas lived in overcrowded households, compared with 15% in major cities. In 2014–15, overcrowding was higher in the NT (53%) than any other state or territory (at least double the rate of overcrowding in any other jurisdiction). The next highest proportion was WA (25%). Of those living in remote areas, NT had a higher proportion of overcrowding (59%)
than those living in remote areas in other states and territories (43% in SA, 34% in WA and 31% in Qld). Nationally, between 2008 and 2014–15, the proportion of Indigenous Australians living in overcrowded households declined by 6.8 percentage points (from 27.5% to 20.7%) and the gap narrowed as non-Indigenous rates remained steady at around 6%.
In 2014–15, 7% of Indigenous adults reported overcrowding as a stressor, down from 21% in 2002. This change was greatest in very remote areas.
In 2014–15, 29% of Indigenous adults lived in homes that were owned or being purchased by a household member (referred to here as home owners). This comprised 10% who owned their homes outright and 19% with a mortgage. A further 35% lived in a property rented through social housing (provided by state/territory governments and community sectors to assist people who are unable to access private rentals); and 32% lived in private rentals. In contrast, 69% of non-Indigenous adults were home owners. Since 2002, the rate of Indigenous home ownership has remained stable, while renting through private or other arrangements has increased by 8 percentage points. Renting through social housing has declined between 2002 and 2014–15 (from 45% to 35%).
Housing tenure patterns are influenced by a range of factors including socio-economic status and Indigenous land arrangements in some remote areas (where there is communal tenancy arrangements). In 2014–15, home ownership by Indigenous adults was higher in non-remote areas (34%) than remote areas (12%) reflecting the barriers to home ownership in remote areas. In remote areas, the largest category of housing was rental through social housing (68%), compared with 26% in non-remote areas. Indigenous home ownership was highest in Tasmania (53%) and lowest in the NT (11%).
In 2014–15, Indigenous Australians were more than twice as likely as non-Indigenous Australians to have experienced homelessness (29% compared with 13%). In 2014–15, 41% of Indigenous Australians had experienced not having a permanent place to live. The main reasons were family/friend/relationship problems (17%) and tight housing/rental market/not enough housing (7%).
In 2011, Indigenous Australians accounted for 28% of the homeless population (based on the ABS definition of homelessness). Three-quarters of Indigenous homelessness is due to living in severely crowded dwellings while the remainder includes people living in supported accommodation for the homeless (12%); people in improvised dwellings, tents or sleeping out
(6%); and people staying temporarily in other households (4%). In 2011, 42% of Indigenous homeless people were under 18 years (AIHW, 2014i). In 2014–15, 24% of those accessing specialist homelessness services were Indigenous Australians. The rate of service use for Indigenous clients was 8.7 times the non-Indigenous rate (693 compared with 80 per 10,000). The majority of Indigenous clients were women (62%) and almost a quarter (23%) of all Indigenous clients were children aged 0–9 years. Domestic/family violence was the main reason (24%) for both Indigenous and non-Indigenous clients seeking specialist homelessness services. Indigenous clients (34%) were more likely than non-Indigenous clients (24%) to be presenting as a single person with children. Over a third (36%) of Indigenous clients were living in short term temporary accommodation prior to accessing homelessness support, and 21% of Indigenous males were living without shelter prior to accessing support.
Implications While there have been improvements in overcrowding and home ownership for Aboriginal and Torres Strait Islander households, outcomes for Indigenous Australians remain lower than those for non-Indigenous Australians. The National Affordable Housing Agreement (NAHA) (AIHW, 2014e) aims to ensure that all Australians have access to affordable, safe and sustainable housing that contributes to social and economic participation. Two of the six NAHA outcomes focus specifically on Indigenous Australians: that Indigenous Australians have the same housing opportunities (homelessness services, housing rental, housing purchase and access to housing through an efficient and responsive housing market) as other Australians; and that Indigenous Australians have improved housing amenity and reduced overcrowding.
The NAHA is supported by the National Partnership Agreement on Homelessness (NPAH) and the National Partnership Agreement on Remote Indigenous Housing (NPARIH). Specific NPAH initiatives aimed at addressing Indigenous homelessness include youth facilities, domestic and family violence support and outreach to rough sleepers.
The NPARIH was designed to help address significant overcrowding, homelessness, poor housing condition and severe housing shortages in remote Indigenous communities and committed $5.5 billion over ten years to achieve this. The NPARIH is expected to deliver up to 4,200 new houses by 2018 and has exceeded its target of rebuilding or refurbishing around 4,876 existing houses in remote Indigenous communities by 2014. The Australian Government provides direct support for

Environmental factors
96
home ownership through financial literacy support and assisted loans through Indigenous Business Australia.
The NPARIH was replaced by the National Partnership on Remote Housing (NPRH) on 1 July 2016. The NPRH provides $774 million from 1 July 2016 to 30 June 2018 to help maximise the Commonwealth investment in remote Indigenous housing and ensure Aboriginal and Torres Strait Islander people have access to safe and adequate housing. The NPRH will continue to deliver new houses and refurbishments but will also
focus on the achievement of reform. Under the NPRH, the Australian Government in partnership with state and territory governments, is:
• improving property and tenancymanagement delivery so houses lastlonger
• increasing employment of Aboriginal andTorres Strait Islander Australians
• encouraging higher levels of engagementof Indigenous businesses in the deliveryof housing and housing services
• removing barriers standing in the way ofhome ownership opportunities forAboriginal and Torres Strait IslanderAustralians, particularly those fromremote communities.
The NPRH includes a commitment to undertake a review of investment in remote housing. The review commenced in 2016 and is required to be completed at least 12 months prior to the expiry of the NPRH. The review will inform future government policy directions for remote housing when the NPRH concludes.
Figure 2.01-1 Proportion of persons living in overcrowded households, by Indigenous status, 2004–05, 2008, 2012–13 and 2014–15
Source: ABS and AIHW analysis of 2012–13 AATSIHS and 2014–15 NATSISS
Figure 2.01-2 Proportion of Indigenous Australians living in overcrowded households, by remoteness, 2004–05, 2008, 2012–13 and 2014–15
Source: ABS and AIHW analysis of 2012–13 AATSIHS and 2014–15 NATSISS
Figure 2.01-3 Use of specialist homelessness services, by Indigenous status, and age (crude rate per 10,000 population), 2014–15
Source: Specialist Homelessness Services Collection
Figure 2.01-4 Proportion of Indigenous persons 18 years and over, by tenure type, 2002, 2008, 2012–13 and 2014–15
Source: ABS and AIHW analysis of 2012–13 AATSIHS and 2014–15 NATSISS
0
10
20
30
40
50
60
70
2004–05 2008 2012–13 2014-15
Per c
ent
Survey year
Aboriginal and Torres Strait Islander peoplesNon-Indigenous Australians
15 14
26
31
64
27
1619
26
38
61
28
1713
21
28
54
23
1511
20
27
50
21
0
10
20
30
40
50
60
70
Majorcities
Innerregional
Outerregional
Remote Veryremote
Australia
Per c
ent
Remoteness area
2004-05 2008 2012-13 2014-15
738
476
709
932 942 966
675
363
183
86 67118 132
101 10568
35 150
100
200
300
400
500
600
700
800
900
1000
0–9 10–14 15–17 18–24 25–34 35–44 45–54 55–64 65+
Rate
per
10,
000
popu
latio
n
Age group (years)
Aboriginal and Torres Strait Islander peoples Non-Indigenous Australians
27 29 30 29
2429 30 32
4540 38 35
0
20
40
60
80
100
2002 2008 2012–13 2014–15
Per c
ent
Year
Total home owners Private/other renters Social housing

Environmental factors
97
2.02 Access to functional housing with utilities Why is it important? Housing is an important mediating factor for health and wellbeing. Functional housing encompasses basic services/facilities, infrastructure and habitability. These factors combined enable households to carry out healthy living practices including waste removal; maintaining cleanliness through washing people, clothing and bedding; managing environmental risk factors such as electrical safety and temperature in the living environment; controlling air pollution for allergens; and preparing food safely (Bailie, RS & Wayte, 2006; Nganampa Health Council et al, 1987; Department of Family and Community Services, 2003).
Children who live in a dwelling that is badly deteriorated have been found to have poorer physical health outcomes and social and emotional wellbeing compared with those growing up in a dwelling in excellent condition (Dockery et al, 2013). Social and emotional wellbeing is more strongly associated with external building condition than physical health, however this is likely to be due to other factors that are linked to building condition.
Comparisons between Indigenous and non-Indigenous children in the Longitudinal Study of Australian Children (LSAC) show improvements in housing can be expected to translate into gains for Indigenous children's health, social, and learning outcomes (Dockery et al, 2013). As expected, housing variables are closely associated with socio-economic status, including: overcrowding, renting rather than owning, and being in financial stress (see measures 2.01 and 2.08).
Infectious diseases are more common in households with poor housing conditions. For example, trachoma and acute rheumatic fever are present almost exclusively in remote areas (see measures 1.06 and 1.16). Domestic infrastructure, along with overcrowding and exposure to tobacco smoke increases the risk of otitis media in children (Jervis-Bardy et al, 2014) (see measures 1.15, 2.01 and 2.03).
Findings The 2014–15 Social Survey collected data on household facilities and structural problems. In 2014–15, 18% of Indigenous households were living in houses of an unacceptable standard (more than two major structural problems and less than 4 working facilities for washing people, clothes/bedding, storing/preparing food, and sewerage). There has been an increase in the proportion of Indigenous households living in houses of an acceptable standard, from
78% in 2012–13, to 82% in 2014–15. The highest proportion of people living in houses of an acceptable standard was in Qld (86%) and the lowest was in the NT (69%).
In 2014–15, around one-quarter (26%) of Indigenous households were living in dwellings with major structural problems (including problems such as sinking/moving foundations, sagging floors, wood rot/termite damage and roof defects). This was similar to 2008 (26%) and a fall from 2012–13 (34%). In very remote areas, 37% of Indigenous households were living in dwellings with major structural problems compared with 25% of households in major cities. Around one in ten (11%) of Indigenous households reported major cracks in walls/floors. In very remote areas plumbing problems (13%) and electrical problems (10%) represented major issues in terms of health and safety within homes. In 2014–15, Aboriginal and Torres Strait Islander households experienced at least one type of major structural problem at nearly twice the rate for non-Indigenous households (26% compared with 14% respectively).
Facilities that support healthy living practices include sewerage, washing (people and clothes/bedding) and food preparation/storage. In 2014–15, in remote areas one in every six (15%) households did not have working facilities for preparing food, compared with 7% in non-remote areas. Likewise, 15% of households in remote areas did not have facilities for washing clothes and bedding compared with 8% of households in non-remote areas. The NT had the highest proportions of households reporting a lack of food preparation facilities (19%) and washing facilities for clothes/bedding (18%).
Implications Improved access to functional housing is associated with better health outcomes. An evaluation of the NSW Housing for Health Program found that ‘those who received the Housing for Health intervention had a significantly reduced rate of hospital separations for infectious diseases—40% less than the hospital separation rate for the rest of the rural NSW Aboriginal population without the Housing for Health interventions’ (NSW Dept. of Health, 2010). Research suggests that housing programmes need to be accompanied by health promotion and environmental programmes to support a reduction in the occurrence of common childhood infections (Bailie, RS et al, 2011; 2012).
The National Partnership Agreement on Remote Indigenous Housing (NPARIH) was a strategy to address overcrowding, homelessness, poor housing conditions and severe housing shortages in remote Indigenous communities. Over 10 years, the agreement aimed to deliver construction of
up to 4,200 new houses, and 4,876 upgrades/repairs to existing houses. At 30 June 2016, over 3,233 new houses had been constructed and more than 7,350 houses had been refurbished under this agreement. The NPARIH reforms included standardised tenancy arrangements for all remote Indigenous housing that included repairs, ongoing maintenance and governance arrangements consistent with mainstream public housing standards.
The NPARIH was replaced by the National Partnership on Remote Housing (NPRH) on 1 July 2016. The NPRH runs until 30 June 2018 and continues to deliver new houses and refurbishments while focusing on improving property and tenancy management, increasing Indigenous employment and business engagement and removing barriers to home ownership opportunities for Aboriginal and Torres Strait Islander Australians, particularly those in remote communities.
While policy for Indigenous housing tends to focus on remote households, sub-standard housing is also a problem in non-remote areas—for example, a quarter of Indigenous households in major cities had major structural problems in 2014–15. As non-remote areas contain both the majority of Indigenous Australians and the majority of the burden of disease for Indigenous Australians (AIHW, 2016f), housing standards in non-remote areas cannot be neglected.

Environmental factors
98
Figure 2.02-1 Proportion of Indigenous households in dwellings with major structural problems by remoteness, 2008, 2012–13 and 2014–15
Note: Excludes rising damp for time series comparisons Source: ABS and AIHW analysis of 2008 NATSISS, 2012–13 AATSIHS and 2014–15 NATSISS
Figure 2.02-2 Proportion of Indigenous households in dwellings with major structural problems, by selected problems and remoteness, 2014–15
Source: ABS and AIHW analysis of 2014–15 NATSISS
Figure 2.02-3 Proportion of Indigenous households reporting lack of working facilities for each of the first 4 Healthy Living Practices, by remoteness, 2014–15
Source: ABS and AIHW analysis of 2014–15 NATSISS
Figure 2.02-4 Proportion of Indigenous households living in houses of an acceptable standard, by state/territory, 2008, 2012–13 and 2014–15
Source: ABS and AIHW analysis of 2008 NATSISS, 2012–13 AATSIHS and 2014–15 NATSISS
2421
2830
38
26
30 31
35
4447
34
2523 22 23
37
25
0
10
20
30
40
50
Majorcities
Innerregional
Outerregional
Remote Veryremote
Australia
Per c
ent
Remoteness area
2008 2012–13 2014-15
129 9 10
1311
5 5 5 5
13
64 4 5 5
10
5
0
10
20
30
40
50
Majorcities
Innerregional
Outerregional
Remote Veryremote
Australia
Per c
ent
Remoteness area
Major cracks in walls/floors Plumbing problems Electrical problems
3 34
3
6
43 3 4 3
6
3
86
9 9
19
97
5
8 8
20
8
0
5
10
15
20
25
Major cities Inner regional Outer regional Remote Very remote Australia
Per c
ent
Remoteness area
Sewerage facilties Washing people Washing clothes/bedding Preparing/storing food
83 84 8682 82
89 92
72
8378 81 79
74
83 8481
64
7882 81
8679 81 83 83
69
82
0
10
20
30
40
50
60
70
80
90
100
NSW Vic Qld WA SA Tas ACT NT Australia
Per c
ent
Jurisdiction
2008 2012-13 2014-15

Environmental factors
99
2.03 Environmental tobacco smoke Why is it important? Environmental tobacco smoke (also known as second hand smoke) is a significant cause of morbidity and mortality. The first evidence of harm to children from second hand smoke (Colley, 1974; Harlap & Davies, 1974; Leeder et al, 1976) and increased lung cancer risk in adults (Hirayama, 1981) emerged over 30 years ago. Global burden of disease analysis attributed 603,000 deaths to second hand smoke in 2004 (Öberg et al, 2011).
There is strong and consistent evidence that second hand smoke (SHS) causes lung cancer and ischaemic heart disease. It is also associated with increased risk of respiratory disease in adults, increases the risk of Sudden Infant Death Syndrome, and exacerbates asthma and ear infections such as otitis media in children (Thomas, DP & Stevens, 2014) (see measure 1.15). SHS is associated with increased risk of hospital readmission of Indigenous infants with bronchitis and hospital admission for Indigenous children for acute asthma (McCallum et al, 2016; Giarola et al, 2014). Exposure to SHS during pregnancy is also associated with an increased risk in neural tube defects (Wang, L et al, 2014).
The home is a key setting for exposure to SHS for pregnant women and young children. Exposure to parents’ smoking in childhood is found to have pervasive vascular health effects into adulthood (Gall et al, 2014). Overcrowding in housing (see measure 2.02) increases the risk of such exposure and developing asthma. Smoking in cars is also an important locus for child exposure to SHS (Agaku et al, 2014).
Smoke-free homes support successful smoking cessation (quit attempts and preventing relapse) along with a reduction in consumption of cigarettes (Thomas, DP & Stevens, 2014) (see measure 2.15). Qualitative research also suggests smoke-free homes are associated with reductions in young people taking up smoking (Thomas, DP & Stevens, 2014; Thomas, DP et al, 2015b).
Evaluation of a family-centred intervention to reduce infant exposure to SHS in Indigenous families concluded that all household members (not only the mother) should cease smoking from the time of conception (Walker et al, 2015).
Findings In 2014–15, 59% of Indigenous people were living in households with daily smokers (ABS, 2016e). An estimated 138,000 Indigenous children aged 0–14 years were living in households with daily smokers, representing
57% of all Indigenous children in this age range, compared with 21% of non-Indigenous children. Furthermore, 13% of Aboriginal and Torres Strait Islander children lived in households with people who smoked at home indoors.
Between 2004–05 and 2014–15 there was a significant reduction in the proportion of Indigenous children aged 0–14 years living in households with daily smokers, falling from 68% to 57%. There was also a significant reduction for non-Indigenous children from 35% in 2004–05 to 21% in 2014–15.
In 2014–15, the proportion of Indigenous children aged 0–14 years living in households with daily smokers was 73% in remote areas (14% for non-Indigenous) compared with 53% in non-remote areas (21% for non-Indigenous). The proportion of Indigenous children aged 0–14 year living in households where smoking occurs indoors, ranged from 11% in major cities to 20% in very remote areas.
The proportion of Indigenous children aged 0–14 years living in households with daily smokers ranged from 51% in Victoria to 71% in the NT. The proportion of Indigenous children aged 0–14 years living in households where smoking occurs indoors, ranged from 7% in ACT to 17% in the NT .
Strong associations exist between the socio-economic circumstances of Indigenous households and whether children are exposed to SHS. The 2014–15 Social Survey results indicate that Indigenous children aged 0–14 years living in households with the lowest income quintiles were 6.6 times as likely to be exposed to tobacco smoke at home indoors compared with those living in the highest income households. There is a similar relationship with housing: 15% of children living in rental households had exposure to tobacco smoke where smoking occurred indoors compared with those living in homes that are owned or being purchased (7%).
Implications The Australian Government has a range of policies and programmes in place that complement state and territory activity to reduce the harms from smoking. These policies and programmes include: excise increases on tobacco; education programmes and campaigns; plain packaging of tobacco products; labelling tobacco products with new, larger graphic health warnings; prohibiting tobacco advertising and promotion; and providing support for smokers to quit.
The National Tobacco Strategy 2012–2018 has nine priority areas for action, one being to reduce exceptions to smoke-free workplaces, public places and other settings.
Smoking is now banned in almost all indoor public places and increasingly in outdoor
spaces, particularly where children are present. Most jurisdictions prohibit smoking in cars when children are present. The Northern Territory, Qld, Victoria, NSW and Tasmania have introduced complete smoking bans in their prisons.
The policy implications for addressing the dangers of second hand smoke are similar to those for tobacco smoking in general (see measure 2.15) and tobacco smoking during pregnancy (see measure 2.21), and should be monitored in conjunction with these measures.
In 2010, the Australian Government delivered a targeted Tackling Indigenous Smoking (TIS) programme to reduce Indigenous smoking rates. Following the review of the programme in 2014, the revised TIS program now funds regional projects to deliver a range of evidence-based activities that suit the local context and the needs of the community, to prevent the uptake of smoking and support smoking cessation. The regional projects have supports to assist with best practice approaches and outcome measurement. Reducing exposure to SHS through supporting smoke-free environments is one of five nationally consistent performance indicators for organisations receiving TIS regional grant funding.
Various state/territory initiatives are in place relating to environmental tobacco smoke. For example, since 2008, in WA Tackling Smoking became a key area of initiative of the National Partnership Agreement on Closing the Gap in Indigenous Health outcomes. The development of the Midwest Region Wide Tobacco Strategy and Campaign project saw an integration of different intervention approaches, including: regulatory, structural, participative and enhancement. The multi-faceted promotional campaign used intervention approaches that included radio, newspaper, community events and the distribution of promotional materials.
Results from a short-term evaluation indicated early success and an increase in calls to the Aboriginal Quitline following the campaign. Culturally focused awareness campaigns have been shown to be effective strategies for improving the awareness of reducing the instances of SHS in the home (Maksimovic et al, 2015).

Environmental factors
100
Figure 2.03-1 Proportion of children aged 0–14 years living in households with daily smoker(s), by Indigenous status and state/territory 2014–15
Source: ABS and AIHW analysis of 2014–15 NATSISS and 2014–15 NHS
Figure 2.03-2 Proportion of children aged 0–14 years living in households with daily smoker(s), by Indigenous status and remoteness, 2004–05, 2007–08, 2012–13 and 2014–15
Source: ABS and AIHW analysis of 2004–05 NATSIHS, 2004–05 NHS, 2008 NATSISS, 2007–08 NHS, 2012–13 AATSIHS, 2014–15 NHS, 2014–15 NATSISS
Figure 2.03-3 Proportion of Indigenous children aged 0–14 years living in households where smoking occurs indoors, by remoteness, 2014–15
Source: ABS and AIHW analysis of 2014–15 NATSISS
Figure 2.03-4 Proportion of Indigenous Australians (all ages) living in households with daily smoker(s), by age, 2014–15
Source: ABS and AIHW analysis of 2014–15 NATSISS
52 5157
61 5853
56
71
57
20 2024
19 2226
15
2721
0
10
20
30
40
50
60
70
80
90
100
NSW Vic Qld WA SA Tas ACT NT Australia
Per c
ent
Jurisdiction
Aboriginal and Torres Strait Islander children Non-Indigenous children
65
74
35 38
62
76
3237
54
70
26
36
53
73
2014
0
20
40
60
80
100
Non remote Remote Non remote Remote
Per c
ent
Remoteness area
2004–05 2008/2007–08 2012–13 2014-15
Aboriginal and TorresStrait Islander peoples
Non-IndigenousAustralians
11
14 1412
20
13
0
5
10
15
20
25
30
Majorcities
Innerregional
Outerregional
Remote Veryremote
Australia
Per c
ent
Remoteness area
5763 61 64 65
48
59
13 15 1521
26 2317
0
10
20
30
40
50
60
70
80
90
100
0-14 15-24 25-34 35-44 45-54 55+ Australia
Per c
ent
Age Group (years)
Daily Smoker in Household Smoking occurs indoors

Socio-economic factors
101
2.04 Literacy and numeracy Why is it important? There is a two-way association between health and education. People with low educational attainment tend to have poorer health, fewer opportunities, lower incomes and reduced employment prospects (Johnston et al, 2009). In turn, poor health is associated with lower educational attainment (Conti et al, 2010). Vision and hearing loss (measures 1.15 and 1.16) are associated with linguistic, social and learning difficulties and behavioural problems in school. These problems can lead to reduced educational performance (Hopkins, 2014) and have lifelong consequences for employment, income, and contact with the criminal justice system (Wilkinson & Pickett, 2009) (see measure 2.11).
Early education experiences and school readiness are important as they influence future academic performance. The Australian Early Development Census measures how children are faring as they enter school. Key findings from the 2015 collection indicate that Indigenous children are more than twice as likely as non-Indigenous children to be developmentally vulnerable. In 2015, 42% of Indigenous children were vulnerable on one or more domains, a decline from 2012 (43%) (Dept. of Education & Training, 2016).
Guthridge et al.(2015) investigated the association between early life risk factors and NAPLAN results in a large cohort study of children in the NT. They found that low birthweight is associated with poorer numeracy results for Indigenous children. NAPLAN test results decline with any absence from school and this accumulates over time (Hancock et al, 2013). Low-performing students have a propensity for poor attendance in later years, and are also less likely to complete Year 12 (Hancock et al, 2013).
In December 2007, COAG agreed to a target of halving the gap between the proportion of Indigenous and non-Indigenous students achieving reading, writing and numeracy benchmarks within a decade. In May 2014, COAG agreed to a five-year target of Closing the Gap between Indigenous and non-Indigenous school attendance. School attendance is key to school outcomes for Indigenous students. Around 20% of the gap in school performance between Indigenous 15-year-olds is explained by poorer school attendance by Indigenous students (Biddle, 2014b).
The NAPLAN Minimum Standard represents a performance standard in literacy and numeracy, below which students will have difficulty progressing satisfactorily at school.
A recent study found that if Indigenous and non-Indigenous students reach the same level of academic achievement by the time they are 15, there is no significant difference in subsequent educational outcomes such as completing Year 12 and participating in university or vocational training (Mahuteau et al, 2015).
Findings Between 2008 and 2016, the proportion of Indigenous students meeting the National Minimum Standards improved significantly across four of the eight areas (reading and numeracy in Years 3, 5, 7 and 9). Improvements are evident for Years 3 and 5 reading and Years 5 and 9 numeracy.
Another way to assess progress is to see whether the latest results are consistent with the agreed trajectory points for the target. In 2016, NAPLAN results at the national level showed one of the eight areas (Year 9 numeracy) was consistent with the required trajectory points. In the other seven areas, 2016 results were below the required trajectory points.
Around 81% of Indigenous students met the Year 3 national minimum standard in reading, 71% in Year 5, 77% in Year 7, and 74% in Year 9. Around 85% of Indigenous students met the national minimum standard for writing in Year 3, 74% in Year 5, 64% in Year 7, and 53% in Year 9. Around 83% of Indigenous students met the national minimum standard for numeracy in Year 3, 76% in Year 5, 79% in Year 7, and 80% in Year 9. Around 78% of Indigenous students met the national minimum standard for spelling in Year 3, 74% in Year 5, 75% in Year 7, and 70% in Year 9. Around 82% of Indigenous students in Year 3 met the national minimum standard for grammar and punctuation, 74% in Year 5, 70% in Year 7, and 67% in Year 9. The proportion of Aboriginal and Torres Strait Islander students achieving the national minimum standards for each of these areas in all school years tested remain below corresponding proportions for non-Indigenous students.
Proportions of Aboriginal and Torres Strait Islander students achieving literacy and numeracy benchmarks remain lower for students living in remote and very remote areas. This relationship was also evident for non-Indigenous students, but was much less marked, resulting in a much larger gap between Indigenous and non-Indigenous results in remote areas than in metropolitan areas. For example, in 2016, 84% of all Indigenous students in major city areas met or exceeded the national minimum standard for Year 5 numeracy compared with only 42% of Indigenous students in very remote areas.
The 2015 Programme for International Student Assessment (PISA) is an
international survey of 15-year-olds. Across mathematical, scientific and reading literacy, Indigenous Australian students had a mean score that equated to around 2–2.5 years of schooling below non-Indigenous students. Around two-thirds of Indigenous students did not reach the national proficiency standard in scientific and reading literacy and three-quarters did not reach the standard in mathematical literacy. There was no significant change in Indigenous students’ scores between 2012 and 2015 in any domain (Thomson, S et al, 2016).
The gap in school attendance rates between Indigenous and non-Indigenous students also widens throughout high school and is significantly greater in remote and very remote areas. In Semester 1 2016, national Indigenous attendance rates were 83.4%, compared with 93.1% for non-Indigenous students. There has been little change in the Indigenous school attendance rate from 2014 (83.5%). All of the changes at the state and territory level were less than one percentage point, apart from the NT (1.6 percentage point fall). In 2014–15, Indigenous parents of children aged 4–14 years reported that their child’s school attendance was affected by bullying—9% of children in Years 1–3, 14% of children in Years 4–6 and 20% of children in Years 7–10. Around 85% of Indigenous parentsstated that they were very well/well advised on their child’s progress at school.
Hearing and vision loss due to high rates of otitis media and trachoma also impact on literacy outcomes for Indigenous students. Regardless of ear health status, Indigenous students’ literacy skills remain consistently poorer compared with non-Indigenous peers (Timms et al, 2014). Poor literacy achievement is more common among students who do not speak Standard Australian English at home, while poorer numeracy is more evident among students with parents in less skilled occupations (Purdie et al, 2011) (see measure 2.07). While the 2011 Census reports 83% of Indigenous Australians speak English at home, many Indigenous Australians use a distinctly Aboriginal form of English that differs from the Standard Australian English used in educational settings (Hall, J, 2013; Eades, D, 2013). In 2014–15, 11% of Indigenous Australians aged 15 years and over spoke an Indigenous language as their main language.
Implications Developing strong links between early childhood services, schools, parents and communities to improve attendance; providing culturally competent and quality teaching; and ensuring schools help Indigenous students to feel included and supported provides a foundation for improving literacy and numeracy outcomes
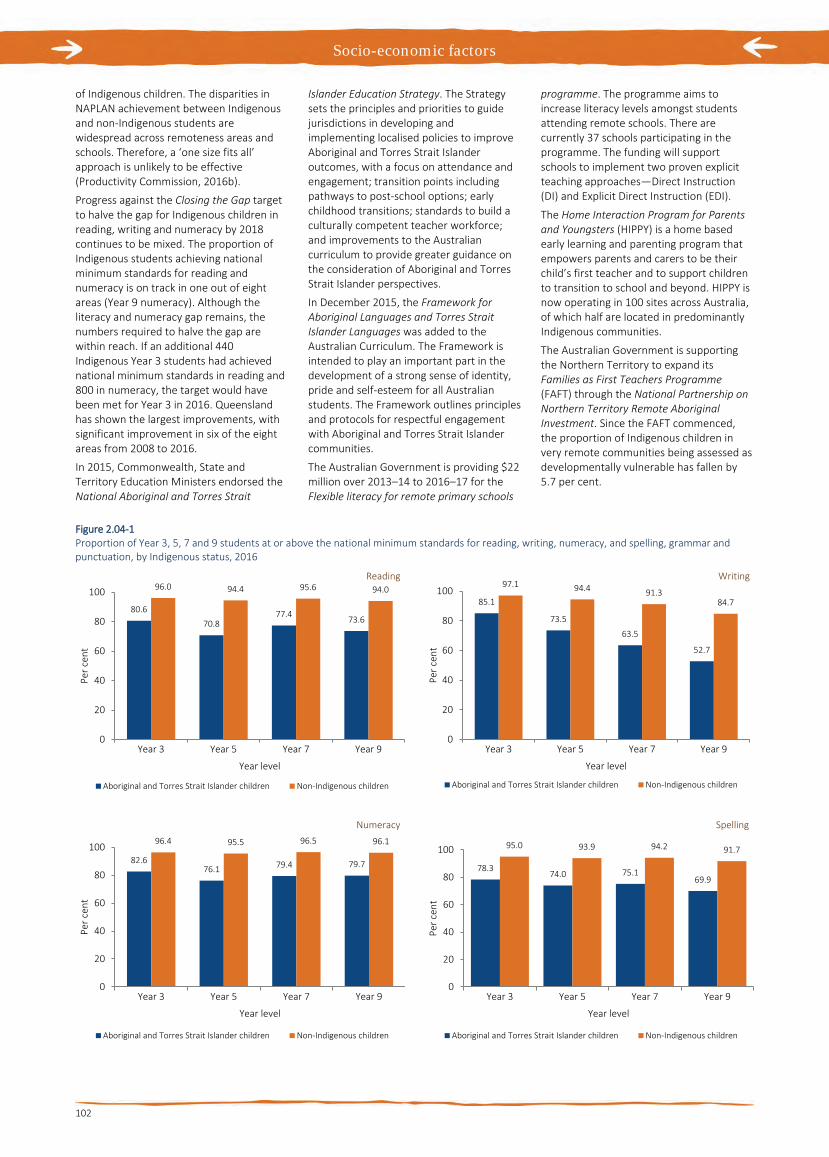
Socio-economic factors
102
of Indigenous children. The disparities in NAPLAN achievement between Indigenous and non-Indigenous students are widespread across remoteness areas and schools. Therefore, a ‘one size fits all’ approach is unlikely to be effective (Productivity Commission, 2016b).
Progress against the Closing the Gap target to halve the gap for Indigenous children in reading, writing and numeracy by 2018 continues to be mixed. The proportion of Indigenous students achieving national minimum standards for reading and numeracy is on track in one out of eight areas (Year 9 numeracy). Although the literacy and numeracy gap remains, the numbers required to halve the gap are within reach. If an additional 440 Indigenous Year 3 students had achieved national minimum standards in reading and 800 in numeracy, the target would have been met for Year 3 in 2016. Queensland has shown the largest improvements, with significant improvement in six of the eight areas from 2008 to 2016.
In 2015, Commonwealth, State and Territory Education Ministers endorsed the National Aboriginal and Torres Strait
Islander Education Strategy. The Strategy sets the principles and priorities to guide jurisdictions in developing and implementing localised policies to improve Aboriginal and Torres Strait Islander outcomes, with a focus on attendance and engagement; transition points including pathways to post-school options; early childhood transitions; standards to build a culturally competent teacher workforce; and improvements to the Australian curriculum to provide greater guidance on the consideration of Aboriginal and Torres Strait Islander perspectives.
In December 2015, the Framework for Aboriginal Languages and Torres Strait Islander Languages was added to the Australian Curriculum. The Framework is intended to play an important part in the development of a strong sense of identity, pride and self-esteem for all Australian students. The Framework outlines principles and protocols for respectful engagement with Aboriginal and Torres Strait Islander communities.
The Australian Government is providing $22 million over 2013–14 to 2016–17 for the Flexible literacy for remote primary schools
programme. The programme aims to increase literacy levels amongst students attending remote schools. There are currently 37 schools participating in the programme. The funding will support schools to implement two proven explicit teaching approaches—Direct Instruction (DI) and Explicit Direct Instruction (EDI).
The Home Interaction Program for Parents and Youngsters (HIPPY) is a home based early learning and parenting program that empowers parents and carers to be their child’s first teacher and to support children to transition to school and beyond. HIPPY is now operating in 100 sites across Australia, of which half are located in predominantly Indigenous communities.
The Australian Government is supporting the Northern Territory to expand its Families as First Teachers Programme (FAFT) through the National Partnership on Northern Territory Remote Aboriginal Investment. Since the FAFT commenced, the proportion of Indigenous children in very remote communities being assessed as developmentally vulnerable has fallen by 5.7 per cent.
Figure 2.04-1 Proportion of Year 3, 5, 7 and 9 students at or above the national minimum standards for reading, writing, numeracy, and spelling, grammar and punctuation, by Indigenous status, 2016
80.6
70.877.4 73.6
96.0 94.4 95.6 94.0
0
20
40
60
80
100
Year 3 Year 5 Year 7 Year 9
Per c
ent
Year level
Reading
Aboriginal and Torres Strait Islander children Non-Indigenous children
82.676.1 79.4 79.7
96.4 95.5 96.5 96.1
0
20
40
60
80
100
Year 3 Year 5 Year 7 Year 9
Per c
ent
Year level
Numeracy
Aboriginal and Torres Strait Islander children Non-Indigenous children
85.1
73.5
63.5
52.7
97.1 94.4 91.384.7
0
20
40
60
80
100
Year 3 Year 5 Year 7 Year 9
Per c
ent
Year level
Writing
Aboriginal and Torres Strait Islander children Non-Indigenous children
78.374.0 75.1
69.9
95.0 93.9 94.2 91.7
0
20
40
60
80
100
Year 3 Year 5 Year 7 Year 9
Per c
ent
Year level
Spelling
Aboriginal and Torres Strait Islander children Non-Indigenous children

Socio-economic factors
103
Figure 2.04-1 (continued)
Source: ACARA 2016
Figure 2.04-2 Proportion of Year 3, 5, 7 and 9 students at or above the national minimum standards for reading, writing and numeracy, by remoteness area and Indigenous status, 2016
82.473.7 70.4 67.1
96.3 94.9 93.9 92.0
0
20
40
60
80
100
Year 3 Year 5 Year 7 Year 9
Per c
ent
Year level
Grammar and punctuation
Aboriginal and Torres Strait Islander children Non-Indigenous children
8881
8682
96 95 96 9488
8085
81
96 94 95 93
82
7378
72
95 92 94 93
64
5257 55
95 9295 94
47
26
3834
9591 93 91
0
20
40
60
80
100
Year 3 Year 5 Year 7 Year 9 Year 3 Year 5 Year 7 Year 9
Per c
ent
Year level
Reading
Major Cities Inner Regional Outer Regional Remote Very Remote
Aboriginal and Torres Strait Islander students Non- Indigenous students
91
82
74
63
97 95 9286
92
82
72
58
9793
89
81
89
77
61
50
9792
87
7972
55
40
33
9793
88
79
52
32
2217
9691
86
73
0
20
40
60
80
100
Year 3 Year 5 Year 7 Year 9 Year 3 Year 5 Year 7 Year 9
Per c
ent
Year level
Writing
Major Cities Inner Regional Outer Regional Remote Very Remote
Aboriginal and Torres Strait Islander students Non- Indigenous students
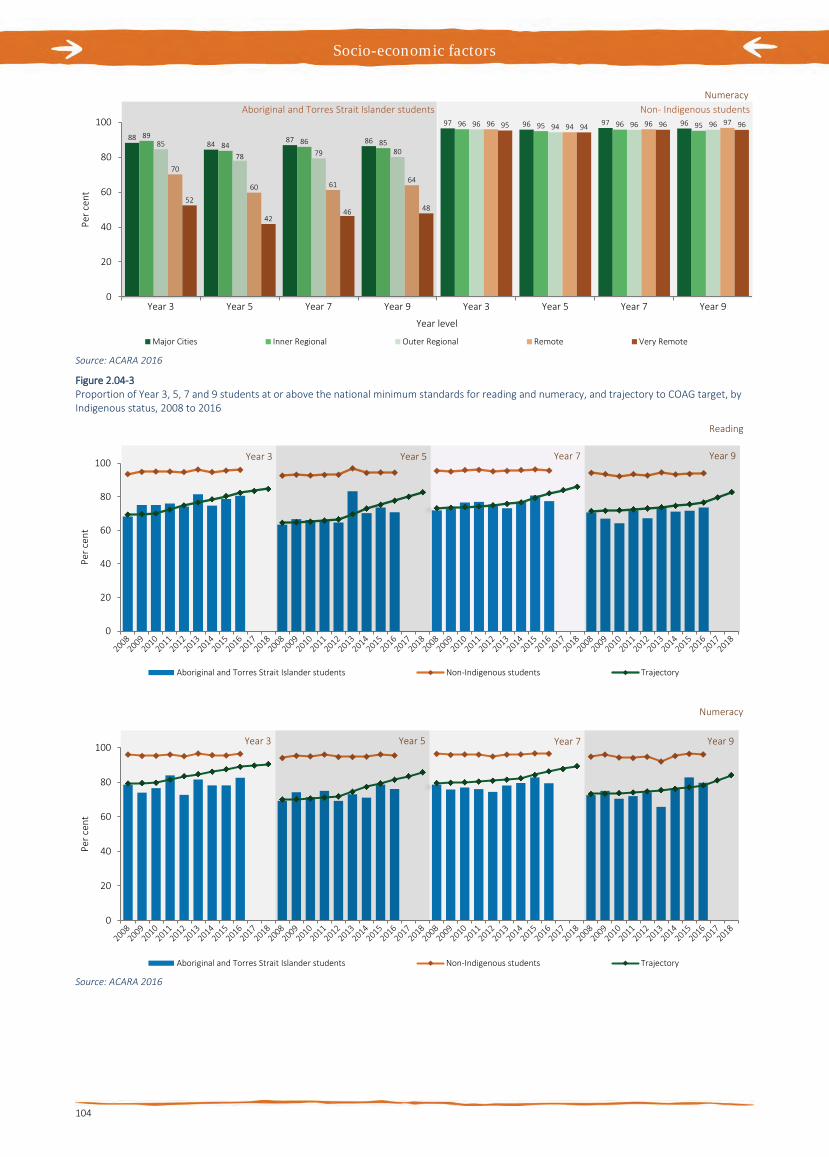
Socio-economic factors
104
Source: ACARA 2016
Figure 2.04-3 Proportion of Year 3, 5, 7 and 9 students at or above the national minimum standards for reading and numeracy, and trajectory to COAG target, by Indigenous status, 2008 to 2016
Source: ACARA 2016
8884 87 86
97 96 97 96
8984 86 85
96 95 96 95
85
78 79 80
96 94 96 96
70
60 61 64
96 94 96 97
52
4246 48
95 94 96 96
0
20
40
60
80
100
Year 3 Year 5 Year 7 Year 9 Year 3 Year 5 Year 7 Year 9
Per c
ent
Year level
Numeracy
Major Cities Inner Regional Outer Regional Remote Very Remote
Aboriginal and Torres Strait Islander students Non- Indigenous students
0
20
40
60
80
100
Per c
ent
Reading
Aboriginal and Torres Strait Islander students Non-Indigenous students Trajectory
Year 3 Year 5 Year 7 Year 9
0
20
40
60
80
100
Per c
ent
Numeracy
Aboriginal and Torres Strait Islander students Non-Indigenous students Trajectory
Year 3 Year 5 Year 7 Year 9
Socio-economic factors
105
2.05 Education outcomes for young people Why is it important? Higher levels of education are associated with improved health outcomes through greater health literacy and better prospects for socio-economic status (including income and employment) which supports increased access to safe and healthy housing (see measures 2.01 & 2.02); healthy lifestyle choices such as regularly eating fruit and vegetables; and not smoking (see measures 2.15 & 2.19) (Clark & Utz, 2014). Research in the US (Wong, MD et al, 2002) found that mortality has declined at a faster pace for those with more education, with a 7-year increase in life expectancy for college-educated students. International literature also documents improvements in child mortality associated with increased levels of maternal education and attributed this to a variety of factors, including improved understanding of and greater willingness to access health services (Gakidou et al, 2010).
The ‘retention rate’ measures the extent to which students stay on at school until Year 10, and until Year 12. Another measure is the ‘attainment rate’, the extent to which students are awarded a certificate at the end of Year 10 or Year 12. Historically, Aboriginal and Torres Strait Islander students have had lower retention and attainment rates compared with non-Indigenous students. It is also important to note that retention and completion do not reflect quality of education; NAPLAN results suggest a considerable proportion of Indigenous students are not reaching minimum standards (see measure 2.04).
Findings Data for 2015 show that the apparent retention rate of full-time Aboriginal and Torres Strait Islander students from Years 7/8 to Year 10 was 99% compared with full retention for other students. In the same year, the apparent retention rate of full-time Aboriginal and Torres Strait Islander students from Years 7/8 to Year 12 was 59% compared with 85% for other students. The apparent retention rate of full-time Aboriginal and Torres Strait Islander students from Year 11 to Year 12 was 73% compared with 89% for other students. The apparent retention rate for Aboriginal and Torres Strait Islander females was higher than for males across all year groups of school retention.
Between 1999 and 2015 there have been significant increases in Indigenous student apparent retention rates for all year groups. The largest increase was from Year 7/8 to Year 12 (75%) and from Year 7/8 to Year 11 (54%).
Between 2014 and 2015, the number of students identifying as Aboriginal and Torres Strait Islander increased by 4.2%. In 2015, Aboriginal and Torres Strait Islander students made up 5.3% of total enrolments in schools (totalling over 200,500). The majority of these students (84%) attended government schools. The largest proportion of Indigenous students were in NSW (32%) followed by Qld (30%). In the NT, 41% of all students identify as Aboriginal and/or Torres Strait Islander (ABS, 2016d).
In 2015, the majority of jurisdictions had full retention rates of Aboriginal and Torres Strait Islander students from Year 7/8 to Year 10, with the exceptions being WA (89%) and the NT (74%). Retention rates of Indigenous students from Year 7/8 to Year 12 were highest in the ACT (88%) and SA (86%) and were lowest in the NT (32%). Rates for Tasmania and the ACT should be interpreted with caution, due to small numbers.
Between 2008 and 2014–15, the gap in the Year 12 or equivalent attainment rate for those aged 20–24 years narrowed by 14.7 percentage points and the COAG target to halve the gap by 2020 is currently on track. Nationally, the proportion of Indigenous 20–24 year olds who had attained Year 12 or equivalent increased from 45.4% in 2008 to 61.5% in 2014–15. In 2014–15, Year 12 or equivalent attainment rates for Indigenous 20–24 year olds were highest in inner regional areas (69%) and lowest in remote areas (42%). The gap in attainment rates between Indigenous and non-Indigenous was smallest in regional areas.
In the 2014–15 Social Survey, Indigenous Australians aged 15–19 years identified the types of assistance that would support them completing Year 12, such as: support from family, friends and school (38%); career guidance (21%); individual tutoring (14%); greater access to apprenticeships (12%); schools being suitable for culture and/or beliefs (9%); and subsidies or grants to help affordability (8%).
Implications Various strategies are required to address the multiple and interrelated issues affecting education outcomes. These include education access and participation, family and community engagement, home learning environments, mentors and culturally inclusive support strategies. There are some gaps in the evidence on education, but the largest gap is in the evaluation of policies, programs and teaching practices to identify what works best, for whom, and in what circumstances (Productivity Commission, 2016a).
The Australian Government works collaboratively with states and territories to develop national priorities for schooling based on the best evidence of what works to
improve student outcomes and close gaps. Through COAG, governments have agreed to strategies relating to improving the quality of schools and education standards. Governments are also working to increase progress against the Closing the Gap targets for early childhood education, school attendance, literacy and numeracy achievement and Year 12 attainment.
The Australian Government provides additional recurrent funding to states and territories, which they are responsible for allocating to government schools and for passing on to approved authorities for non-government schools, to support improved service delivery and reform to meet nationally agreed outcomes. From 2014 to 2017, funding is transitioning under the Australian Education Act 2013 from levels under the previous funding arrangements towards the Schooling Resource Standard funding arrangement levels. Funding is calculated with reference to a base amount plus loadings to target student and school disadvantage. This funding must be used for the purpose of supporting the in-school costs associated with providing education. In 2015, 84% of Indigenous students attended government schools across primary and secondary levels.
The Indigenous Advancement Strategy includes funding for Indigenous communities to support a range of childhood and schooling activities designed to improve children and young people’s education engagement and outcomes. Funding is largely used to support activities ‘outside the school gate’, which aim to further build children and young people’s learning capabilities. In remote Australia, the Australian Government’s Remote School Attendance Strategy operates in 77 schools, supporting around 14,000 students to get to school every day.

Socio-economic factors
106
Figure 2.05-1 Apparent Year 10 retention rates, by Indigenous status, 1999 to 2015
Source: AIHW analysis of ABS National Schools Statistics Collection
Figure 2.05-2 Apparent Year 12 retention rates, by Indigenous status, 1999 to 2015
Source: AIHW analysis of ABS National Schools Statistics Collection
Figure 2.05-3 Year 12 or equivalent attainment, Indigenous Australians aged 20–24 years, by remoteness area, 2008 and 2014–15
Source: ABS and AIHW analysis of 2008 and 2014–15 NATSISS
Table 2.05-1 Apparent retention rates, by Indigenous status, jurisdiction and sex, 2015
Aboriginal and Torres Strait Islander peoples Other
NSW Vic Qld WA SA Tas ACT NT Australia Aust
Per cent
Year 7/8 to 10—Apparent retention rates
Males 100.0 99.8 100.0 89.3 97.7 100.0 100.0 70.4 98.0 100.0
Females 100.0 100.0 100.0 89.4 100.0 100.0 100.0 77.0 99.9 100.0
Persons 100.0 100.0 100.0 89.3 100.0 100.0 100.0 73.6 98.9 100.0
Year 7/8 to 12—Apparent retention rates
Males 46.7 65.1 70.0 48.8 76.8 48.8 77.6 27.0 54.9 82.0
Females 57.8 73.8 75.4 52.3 94.4 59.6 100.0 36.6 64.1 88.6
Persons 52.1 69.7 72.7 50.4 85.9 54.0 88.2 31.6 59.4 85.2
Year 11 to 12—Apparent retention rates
Males 63.1 72.3 82.5 63.9 77.6 73.3 71.4 52.6 70.9 86.7
Females 69.3 76.2 81.6 65.1 88.3 83.1 73.2 67.4 75.2 90.3
Persons 66.3 74.4 82.0 64.5 83.4 78.2 72.4 59.9 73.1 88.5 Note: results over 100% have been set to 100%. Source: AIHW analysis of ABS National Schools Statistics Collection
0
20
40
60
80
100
99 00 01 02 03 04 05 06 07 08 09 10 11 12 13 14 15
Per c
ent
Year
Year 10 Aboriginal and Torres Strait Islander studentsYear 10 Other students
0
20
40
60
80
100
99 00 01 02 03 04 05 06 07 08 09 10 11 12 13 14 15
Per c
ent
Year
Year 12 Aboriginal and Torres Strait Islander studentsYear 12 Other students
55.8 53.8
43.236.2
24.1
63.169.4
66.3
41.7 41.7
0
10
20
30
40
50
60
70
80
90
100
Major cities Inner regional Outer regional Remote Very remote
Per c
ent
Remoteness area
2008 2014-15
Socio-economic factors
107
2.06 Educational participation and attainment of adults Why is it important? Adult learning is a powerful tool in achieving better health, education and economic outcomes (Chandola & Jenkins, 2014). The employment gap between Indigenous and non-Indigenous Australians declines as the level of educational attainment increases. The transition from education to work is usually smoother for VET and University graduates and salary outcomes higher than for those who enter the workforce directly from school (Lamb & McKenzie, 2001). University graduates working in professional roles provide leadership and pathways to social and economic reform (Anderson, I, 2011). Health outcomes are influenced by a person’s ability to use a wide range of materials and resources to build health knowledge and support informed health decision making (ACSQHC, 2013).
Findings In 2014–15, 21% of Indigenous Australians aged 15 years and over were currently studying at an educational institution compared with 18% of non-Indigenous Australians. For those aged 15–24 years, Indigenous Australians were less likely to be currently studying (45%) than non-Indigenous Australians (63%). The main difference in this age group is the proportion of the population studying at University or other higher education facilities (6% of Indigenous Australians in this age group compared with 23% of non-Indigenous Australians).
In 2014–15, 28% of Indigenous adults (aged 18 years and over) reported that Year 12 or equivalent was the highest level of school completed compared with 58% of non-Indigenous adults. The proportion of Indigenous adults who completed Year 12 or equivalent increased from 18% in 2002 to 28% in 2014–15. Indigenous adults living in remote areas were less likely than those living in non-remote areas to have completed Year 12 or equivalent (20% compared with 31%). In 2015, a lower proportion of Indigenous young people achieved an Australian Tertiary Admission Rank sufficient for University entry than non-Indigenous (SCRGSP, 2016b).
In 2014–15, 47% of Indigenous Australians aged 20–64 years reported they either had a Certificate III or above or were studying at any level; a 21 percentage point increase from 2002. Over this period, the gap with non-Indigenous Australians has narrowed slightly. In 2014, the non-Indigenous proportion was 70%. Indigenous Australians living in major cities had a higher rate of
achieving a Certificate III or above or studying (59%) than those living in very remote areas (23%). Those living in the ACT (72%) and Victoria (60%) had higher rates than those living in the NT (25%) or WA (36%).
In 2014–15, 6% of both Indigenous and non-Indigenous Australians aged 15 years and over were studying at TAFE/VET. Fewer Indigenous Australians aged 15 years and over were currently studying at university/other higher education institutions compared with non-Indigenous Australians (4% and 7% respectively), particularly in the younger age groups. However, Indigenous Australians in the 45 years and over age group were 1.4 times as likely to be studying at higher education institutions compared with non-Indigenous Australians. Overall, much lower proportions of Indigenous adults had a bachelor degree or above as their highest level of non-school qualification (6%) compared with non-Indigenous Australians (26%) with the largest differences in the 25-44 year age groups.
VET courses are providing large numbers of Indigenous Australians with training opportunities. In 2015, there were approximately 20,400 course completions in the VET sector by Indigenous Australians aged 15 years and over. The Indigenous VET completion rate (4.2 per 100) was higher than for other Australians (2.3 per 100). Between 1996 and 2014, the Indigenous completion rate grew relatively faster than other students. In 2015, the overall VET load pass rate for Indigenous students was 77% compared with 83% for other Australian students. However, Indigenous students were half as likely as non-Indigenous students to have completed higher qualifications, such as Certificate IV, diploma or above (17% compared with 33%).
During 2015, there were also around 16,100 Indigenous higher education students. The top three fields of study for Indigenous students were Society and culture (5,300), Health (3,200) and Education (2,600). Indigenous Australians were under-represented in the higher education student population (1.6% of students) compared with their representation in the total population (3%). In 2015, there were 2,190 award course completions for Indigenous students (1% of completions). Between 1996 and 2015 the number of Indigenous students commencing at University doubled and there was a 29% increase in the rate of award course completions for those aged 20-64 years. Between 2005 and 2014, the attrition rate for Indigenous students fell from 34% to 32% (non-significant) while the non-Indigenous rate increased from 20% to 22%. Amongst Indigenous students who had
seriously considered leaving university, financial difficulty was the most commonly reported reason (44%) (Edwards, D & McMillan, 2015). Indigenous students were older (11% were aged 45 years and over compared with 7% of non-Indigenous students) and 66% were female. In 2010, 0.8% of all full-time equivalent academic staff were Indigenous Australians (Behrendt et al, 2015).
In 2014–15, Indigenous Australians aged 15–64 years who had a non-school qualification were more likely to be employed (61%) than those without a non-school qualification (36%). A recent study found that if Indigenous and non-Indigenous students reach the same level of academic achievement by 15 years of age, there is no significant difference in subsequent educational outcomes such as completing Year 12 or participating in university or vocational training (Mahuteau et al, 2015).
In 2014–15, 53% of Indigenous Australians aged 15 years and over reported that they intended to study in the future. One-quarter (25%) said they had wanted to study in the past 12 months, but for various reasons had not. Around one in five of them (19%) cited financial reasons, and 17% personal or other family reasons.
Implications Concerted efforts to increase Year 12 attainment are positively contributing to increased numbers of Indigenous students enrolling in VET and higher education. COAG set a target to halve the gap in Year 12 attainment for Indigenous Australians aged 20–24 by 2020. The current rate, 62%, is up from 45% in 2008 and the target is on track.
However, significant numbers of Indigenous young people aged 17–24 years are currently not engaged in further education, training or employment. Ensuring that these young people are supported throughout their secondary schooling to make successful post-school transitions is critical to improve their employment prospects. The gap between Indigenous and non-Indigenous Australians in higher education is linked to the relative higher cost of education to those of lower socio-economic status (Hunter, BH, 2010); disability (Biddle, 2014b); the gap in academic achievement; and factors affecting educational choices (e.g. access to information, educational aspirations) (Parker, PD et al, 2013).
A range of initiatives being implemented across government are described in detail in the Policies and Strategies section.
In line with recommendations of the 2012 Review of Higher Education Access and Outcomes for Aboriginal and Torres Strait Islander People, all Australian universities have strategies in place for improving

Socio-economic factors
108
Indigenous Australians’ access to, and outcomes from, higher education.
The Indigenous Student Success (Higher Education) Programme (ISSP), announced in the 2016–17 Budget, will combine the Commonwealth Scholarships Program, Indigenous Support Program and tutorial assistance offered under the Indigenous
Advancement Strategy into a single flexible program from 2017. Under the ISSP, universities will have greater flexibility to tailor services and support to meet the individual needs of each eligible student. The new arrangements will encourage universities to draw on the knowledge and expertise of Aboriginal and Torres Strait Islander people and support more
Indigenous students to access and achieve university qualifications.
Financial assistance is available to Indigenous young people to study or do training via ABSTUDY. In 2015, over 4,000 Indigenous secondary students received ABSTUDY Away from Home entitlements.
Figure 2.06-1 Educational institution currently attended, by Indigenous status and age group, persons aged 15 years and over, 2014–15
Source: ABS and AIHW analysis of 2014–15 NATSISS and 2014 GSS
Figure 2.06-2 Highest level of school completed, by Indigenous status, persons aged 18 years and over, 2002, 2008, 2012–13 and 2014-15
Note: Includes persons who never attended school. Source: ABS and AIHW analysis of 2002, 2008 NATSISS and 2012–13 AATSIHS and 2014-15 NATSISS
Figure 2.06-3 Higher education award course completions, Indigenous students per 10,000 population 20-64 years, 1996 to 2015
Source: AIHW analysis of Higher Education Statistics Collection
Figure 2.06-4 Total completions in the VET sector for persons aged 15 years and over, by Indigenous status, 1996 to 2014
Source: AIHW analysis of NCVER, National VET Provider Collection, 2012
Figure 2.06-5 Non-school qualifications at Certificate III level or above, by Indigenous status and age group, persons aged 18 years and over, 2014-15
Source: ABS and AIHW analysis of 2014-15 NATSISS. Non-Indigenous estimates are from the GSS 2014
6 7 2 2
23
9 5 1
9 75 2
15
96
2
25
24
0
20
40
60
15–24 25–34 35–44 45+ 15–24 25–34 35–44 45+
Per c
ent
Age group (years)University/other higher education Technical and further educationSecondary school
Aboriginal and Torres Strait Islander peoples
Non-Indigenous Australians
41 34 29 27 21 16 14 13
3130
31 3025
23 23 20
1013
13 14
1010 10 9
19 23 27 2844 51 54 58
0
20
40
60
80
100
2002 2008 2012-13 2014-15 2002 2008 2012-13 2014-15
Per c
ent
YearCompleted Year 9 or below (a) Completed Year 10Completed Year 11 Completed Year 12
Aboriginal and Torres Strait Islander peoples
Non-IndigenousAustralians
0102030405060708090
100
96 97 98 99 00 01 02 03 04 05 06 07 08 09 10 11 12 13 14 15
Rate
per
10,
000
popu
latio
n
Year
0
1
2
3
4
5
96 97 98 99 00 01 02 03 04 05 06 07 08 09 10 11 12 13 14
Per c
ent
Year
Aboriginal and Torres Strait Islander peoples Other Australians
1725
37 36 3325 31
12
2936 36 35
28 32
2
5 6 98
617
40 3725
18
26
0
20
40
60
80
18-19 20–24 25–34 35–44 45–54 55 yearsand over
Total 18-19 20–24 25–34 35–44 45–54 55 yearsand over
Total
Per c
ent
Age group (years)
Certificate III to Advanced diploma Bachelor degree or above
Aboriginal and Torres Strait Islander peoples Non-Indigenous Australians

Socio-economic factors
109
2.07 Employment Why is it important? Participation in employment has important consequences for health, social and emotional wellbeing and living standards for individuals, families and communities (Bambra, 2011; Gray, M et al, 2014). Conversely, being sick or disabled, or looking after someone in poor health acts as a barrier to labour force participation (Belachew & Kumar, 2014).
Studies of the social gradient of health demonstrate that characteristics of employment (such as occupation, job security and control) affect health outcomes (Marmot, 2015). Health risks from being unemployed include the impact on a person’s mental health and stress related health impacts such as heart disease (Wilkinson & Pickett, 2009); material deprivation for necessities such as food security, safe neighbourhoods and adequate housing (Bambra, 2011) and the effects from adopting unhealthy coping behaviours (Dooley et al, 1996). Experiencing extended and/or repeated periods of unemployment compound these effects. International studies highlight the poorer health and lower life expectancy experienced by populations experiencing high unemployment following economic slowdown (Taulbut et al, 2013).
The ‘labour force’ comprises all people who are either ‘employed’ or ‘unemployed’ (see Glossary). The ‘labour force participation rate’ is the number of people in the labour force as a proportion of the working age population (15–64 years). The ‘unemployment rate’ is the number of unemployed people as a proportion of the labour force. The ‘employment rate’, is employed people as a proportion of people aged 15–64 years.
Findings In the 2014–15 Social Survey, 61% of Indigenous Australians of working age (15–64 years) were in the labour force; compared with 77% of non-Indigenous Australians (from the 2014 Survey of Education and Work). The proportion of Indigenous Australians of working age who were not in the labour force has increased from 36% in 2008 to 39% in 2014–15.
In 2014–15, 48% of the Indigenous working age population were employed. This was a decline from 2008 where the employment rate peaked at 54% but an overall increase from 1994 (38%). The non-Indigenous employment rate also declined between 2008 and 2014 (from 75% to 73%) and the gap has not changed significantly (21 percentage points in 2008 and 24 percentage points in 2014–15). The declines since 2008 occurred in the context of a
general softening in the Australian labour market.
Trend data are also impacted by Indigenous Australians participating in the Community Development Employment Program (CDEP), which accounted for almost half of all employment in very remote areas in 2008, but by 2012–13 accounted for just over one-quarter of the total, and has now ceased. When CDEP is excluded, there is no significant change in the Indigenous employment rate nationally between 2008 and 2014–15 (48.2% and 48.4% respectively).
The employment rate for Indigenous males of working age (15–64 years) fell from 63% to 54% between 2008 and 2014–15. However, when CDEP is excluded, there was no change (55% to 54%). Over the same period, there was no change in the employment rate for Indigenous females (46% compared with 43%; and excluding CDEP: 42% compared with 43%). Employment rates were higher for Indigenous males (54%) than females (43%) in 2014–15, though the difference between Indigenous men and women has declined (from 17 percentage points in 2008 to 11 percentage points in 2014–15).
There was a decrease in employment for males in the 15–17 year old age group (from 36% in 2008 to 21% in 2014–15). The proportion of Indigenous youth aged 17–24 years who were fully engaged in study or work was 42% in 2014–15; about half the non-Indigenous rate (74%). Rates of Indigenous youth fully engaged ranged from 58% in major cities to 15% in very remote areas. There is a strong link between education and employment—at high levels of education there is virtually no employment gap between Indigenous and non-Indigenous Australians.
In 2014–15, the employment rate for Indigenous Australians was highest in major cities (58%), followed by 48% in inner regional areas. The lowest rate was in very remote areas (35%). Compared with non-Indigenous Australians, the highest overall employment gap in 2014–15 was in the NT (46 percentage points) followed by WA (37 percentage points). These jurisdictions also had the lowest Indigenous employment rates.
In 2012–13, Indigenous Australians were less likely to be employed as professionals (13% of those employed) compared with 23% of non-Indigenous; and were more likely to work as labourers (19%) or as community and personal service workers (18%). Nearly 26% of employed Indigenous Australians worked in the public sector compared to 16% of non-Indigenous Australians. Conversely, Indigenous Australians were less likely to be employed in the private sector (74% compared with 84%), accounting for essentially all of the
gap. The largest employment gaps for Indigenous Australians were in the retail and manufacturing sectors. In 2014–15, 60% of employed Indigenous Australians were employed full-time.
The unemployment rate for Indigenous Australians was 21% in 2014–15, an increase of 4 percentage points from 2008, and 3.6 times the non-Indigenous unemployment rate of 6%. Of Indigenous Australians aged 18–64 years who were unemployed in 2014–15, 37% had been unemployed long-term (12 months or more). In 2014–15, 92% of unemployed Indigenous Australians aged 15-64 years reported having difficulties finding work. Main issues reported were no jobs in local area or line of work (41%), transport problems/distance (32%), not having a driver’s licence (31%) and insufficient education/training skills (30%). For those not looking for work, the main reasons given were childcare (22%), studying or returning to study (20%) and having a long-term health condition or disability (18%). In 2014–15, 40% of unemployed Indigenous Australians reported high/very high levels of psychological distress; a higher rate than those who were employed (24%). Many of those not in the labour force are still engaged in productive activities supporting their community (Altman et al, 2005). The unemployment rate for Indigenous Australians aged 15–64 years who provided unpaid assistance to a person with a disability (24%) was almost 4 times that for non-Indigenous carers (6%).
Implications To achieve the COAG target of halving the gap in employment outcomes between Indigenous and other Australians, the gap would need to close to 10.6 percentage points by 2018. The 2014–15 data shows that this target is not on track.
A review of available evidence found that approaches with potential to increase Indigenous employment include: a strong macro economy supporting jobs growth; increasing skill levels; pre-employment assessment and training; intensive assistance for job seekers; non-standard recruitment strategies; support for retention; wage subsidies and Indigenous employment goals in government programmes ((Gray, M et al, 2012; Gray, M & Hunter, 2016).
Detailed descriptions of the following mainstream and Indigenous specific employment strategies are in the Policies and Strategies section of the report.
Mainstream employment services, in urban and regional locations, provide support and assistance to around 88,000 Indigenous job seekers through: Jobactive, DES, Transition to work and the Community Development Programme.

Socio-economic factors
110
The Jobs, Land and Economy Program complements mainstream employment services and programs, increasing employment, business and economic development through the Vocational
Training and Employment Centres initiative, the Employment Parity Initiative, and the Tailored Assistance Employment Grants. The programme also provides continued support of Indigenous rangers; Indigenous
cadetships; and Indigenous Enterprise Development. The Indigenous Procurement Policy, supports increased Government contracts with majority-owned Indigenous businesses.
Figure 2.07-1 Labour force status of persons aged 15–64 years by Indigenous status, 2014–15
Source: AIHW and ABS analysis of 2014–15 NATSISS and 2014 SEW
Figure 2.07-2 Employment rate by Indigenous status persons aged 15–64 years, by remoteness, 2014–15
Source: AIHW and ABS analysis of 2014–15 NATSISS and 2014 SEW
Figure 2.07-3 Employment rate, Indigenous Australians aged 15–64 years, by sex, 1994 to 2014–15
Source: ABS and AIHW analysis of NATSIS 1994, NATSISS 2002, 2008 and 2014–15, AATSIHS (core component) 2012–13
Figure 2.07-3 Employment rate, Indigenous Australians aged 15–64 years, 1994 to 2014–15
Source: ABS and AIHW analysis of NATSIS 1994, NATSISS 2002, 2008 and 2014–15, AATSIHS (core component) 2012–13
Table 2.07-1 Labour force status of Indigenous Australians aged 15–64 years, by remoteness, 2014–15
Labour force status Non-
remote Remote Australia
Per cent
In the labour force (participation rate) 64 51 61
Total employed 52 37 48
Employed Full-time 31 22 29
Employed Part-time 21 15 19
Unemployed (% of total population) 13 14 13 Unemployment rate (% of labour force) 20 28 21
Not in the labour force 36 49 39
Total 100 100 100
Source: ABS and AIHW analysis of 2014–15 NATSISS
Figure 2.07-5 Labour force status of persons aged 15–64 years, by Indigenous status, 2001, 2004–05, 2008, 2012–13 and 2014–15
Source: ABS and AIHW analysis of NHS/NATIHS/AATSIHS 2001, 2004–05, 2007–08, 2012–13; NATSISS, 2008, 2014–15; SEW 2012 and 2014
61
48
21
7773
6
0
20
40
60
80
100
Participation Rate Employed: % ofworking agepopulation
Unemployment Rate
Per c
ent
Aboriginal and Torres Strait Islander peoples Non-Indigenous Australians
58
48 4540
35
73 71 7483 85
0
20
40
60
80
100
Major cities Innerregional
Outerregional
Remote Very remote
Per c
ent
Remoteness area
Aboriginal and Torres Strait Islander peoples Non-Indigenous Australians
47
56
63
53 54
29
4146
42 43
0
10
20
30
40
50
60
70
1994 2002 2008 2012-13 2014-15
Per c
ent
YearMales Females
913
62
29
36
4846
38
4854
48 48
0
10
20
30
40
50
60
70
1994 2002 2008 2012-13 2014-15
Per c
ent
YearCDEP employment Non-CDEP employment Total employment
44 51 54 48 4861
74 76 76 73
79 11
13 134
3 3 4 54940 36 40 39 35
22 21 20 22
0
20
40
60
80
100
01 04–05 08 12–13 14-15 01 04–05 08 12–13 14-15
Per c
ent
Year
Employed Unemployed Not in the labour force
Aboriginal and Torres Strait Islander peoples
Non-IndigenousAustralians

Socio-economic factors
111
2.08 Income Why is it important? A range of studies across different countries have found a gradient in health outcomes associated with income (Marmot, 2002). Income itself is highly correlated with educational attainment, employment and a range of social indicators (Deaton, 2003). Therefore, the relationship between income and health is complex and linked to other factors such as the capacity to live a healthy life including being able to afford nutritious food and quality housing; cost barriers to health care including health insurance and access to transport; risk behaviours including substance use and social participation (WHO, 2017; Marmot, 2016). The level of income inequality within a society has been found to be associated with social function (e.g. levels of violence, imprisonment, levels of trust, exclusion, insecurity, stress and educational performance) which mediate the relationship between income inequality and health outcomes (Marmot, 2016; Wilkinson & Pickett, 2009; Wolfson et al, 1999). Children’s health has been found to be associated with household income, the effects of which accumulate over children’s lives (Case et al, 2002).
Biddle (2015a) found a correlation between income and measures of happiness and sadness for Indigenous males living in non-remote areas. However, relationships were weaker for females and those living in remote areas.
The statistical measure adopted here is ‘equivalised gross household income’, which adjusts reported incomes to take into account the number of people living in a household, particularly children and other dependants, as well as economies of scale within households. Household incomes are then divided into five equal groups, called ‘quintiles’.
Findings In 2014–15, more than one-third (36%) of Indigenous adults were living in households in the lowest income quintile. This was twice the proportion of non-Indigenous adults (17%). Only 6% of Indigenous adults lived in households with an equivalised gross weekly income in the highest quintile compared with 22% of non-Indigenous Australians. The proportion of Indigenous adults living in households in the lowest income quintile varied by jurisdiction: from 55% in the NT to 21% in the ACT.
Also reflecting differences in income distribution by remoteness, 61% of Indigenous adults in very remote areas lived in households in the lowest income quintile compared with 25% in major cities, and between 33% and 46% elsewhere. Conversely, major cities had the highest
proportion of Indigenous adults living in households in the highest income quintile (9%), while very remote areas had the lowest proportion (3%).
The proportion of Indigenous adults in each of the equivalised household income quintiles has not changed significantly between 2004–05 and 2014–15, though there have been fluctuations in the lowest quintiles during that time.
In 2014–15, the median equivalised gross weekly household income for Indigenous adults was $542 compared with $852 for non-Indigenous adults. After adjusting for inflation, there was a statistically significant increase from $402 per week in 2002 to $542 per week in 2014–15 for Indigenous adults, and for the first time there was a narrowing in the gap with non-Indigenous Australians (from $349 in 2002 to $310 in 2014–15).
These national estimates mask considerable geographic variation. For example, the median gross weekly equivalised income for Indigenous adults in 2014–15 ranged from $430 in the NT to $805 in the ACT. There was also variation by remoteness; from $398 in very remote areas to $633 in major cities.
Biddle (2013) examined Census personal income data for Indigenous Australians and reported variations in disposable income by age (40–44 year olds had a disposable income 3.9 times as high as 15–19 year olds) and sex (1.2 times as high for males) as well as variations in average income by region (ranging from $258 per week in Apatula, NT, to $783 per week in South Hedland, WA).
In 2014–15, 50% of Indigenous Australians were living in households reporting that they could not raise $2,000 within a week in an emergency (indicating financial stress). Households in remote areas were more likely to report that they could not raise $2,000 within a week than those in non-remote areas (64% compared with 46%). Approximately 28% of Indigenous Australians aged 15 years and over were living in households that had experienced days without money for basic living expenses in the last 12 months.
In 2012–13, more than one in five (22%) Aboriginal and Torres Strait Islander people were living in a household that in the previous twelve months had run out of food (ABS, 2014e).
An indication of the relationship between low income and poorer health is provided by the 2014–15 Social Survey. Indigenous adults living in households in the lowest income quintile were more likely to be a current smoker, to report fair/poor health, high psychological distress and three or more long-term health conditions than those in households in the highest income quintiles (see measure 1.17). Relationships between income and educational
attainment and employment are also evident.
A recent study found that Indigenous Australians had lower total personal incomes than other Australians across all labour force categories, particularly for those who were employed full-time (Howlett et al, 2015). This is partly due to lower wages (around 18% lower for Indigenous men), which can be explained by lower levels of education, poorer access to ’good’ jobs and less weeks worked per year on average. This paper finds that Indigenous Australians have considerably less income from other private sources (business and investment income) than other Australians. A higher proportion of Indigenous incomes come from government payments. Based on responses from the 2014–15 Social Survey, 47% of Indigenous Australians aged 18–64 years received a government cash pension or allowance as their main source of income, compared with 14% of non-Indigenous Australians.
Implications The disparity in incomes between Indigenous and non-Indigenous Australians has important implications for health. These implications include reduced capacity to access goods and services required for a healthy lifestyle, including adequate nutritious food, housing, transport and health care.
Other factors that may exacerbate the situation faced by low income households include resource commitments to extended families and visitors (SCRGSP, 2007). Income discrepancies may reflect uneven access to education and employment opportunities. There is evidence that labour market discrimination against Indigenous Australians exists, that is wage and employment differentials, which cannot be explained by educational gaps or other factors (CEDA, 2015).

Socio-economic factors
112
Figure 2.08-1 Proportion of persons aged 18 years and over in each equivalised gross weekly household income quintile, by Indigenous status, 2014–15
Source: ABS and AIHW analysis of 2014–15 NATSISS and 2014–15 NHS
Figure 2.08-2 Proportion of Indigenous Australians aged 18 years and over in each equivalised gross weekly household income quintile, 2004–05, 2008, 2012–13 and 2014–15
Source: ABS and AIHW analysis of 2014–15 NATSISS, 2012–13 AATSIHS, 2008 NATSISS and 2004–05 NATSIHS
Figure 2.08-3 Proportion of persons aged 18 years and over in each equivalised gross weekly household income quintile, by Indigenous status and remoteness, 2014–15
Source: ABS and AIHW analysis of 2014–15 NATSISS and 2014–15 NHS
Figure 2.08-4 Proportion of Aboriginal and Torres Strait Islander peoples aged 18 years and over in the lowest equivalised gross weekly household income quintile, 2014–15
Source: ABS and AIHW analysis of 2014–15 NATSISS
Figure 2.08-5 Median equivalised gross weekly household income, persons aged 18 years and over, by Indigenous status, 2002, 2004–05, 2008, 2012–13, 2014–15
Source: ABS and AIHW analysis of 2014–15 NATSISS, 2014–15 NHS, 2012–13 AATSIHS, 2011-13 AHS, 2007–08 NHS, 2008 NATSISS, 2004–05 NATSIHS, 20004-05 NHS, 2002 NATSISS and 2002 GSS
36
24
19
14
6
1719
21 22 22
0
10
20
30
40
50
1st quintile$435 or less
2nd quintile$436 to $675
3rd quintile$676 to $1018
4th quintile$1019 to $1550
5th quintile$1551 or more
Per c
ent
Income quintile
Aboriginal and Torres Strait Islander peoples Non-Indigenous Australians
0
10
20
30
40
50
2004–05 2008 2012–13 2014–15
Per c
ent
Survey year
Lowest quintile 2nd quintile 3rd quintile4th quintile Highest quintile
2538 33
46
61
36
15 19 21 17 17
25
23 3018
22
24
17
25 2118 19
23
20 18 18
11
19
19
24 25
20 21
1816 12 13
5
14
23
18 20
24 22
9 3 6 6 3 6
2514 14
22
np
22
0
20
40
60
80
100
Major cities Innerregional
Outerregional
Remote Veryremote
Australia Major cities Innerregional
Outerregional
Remote Veryremote
Australia
Per c
ent
Remoteness Area
Lowest quintile 2nd quintile 3rd quintile 4th quintile Highest quintile
Aboriginal and Torres Strait Islander peoples Non-Indigenous Australians
3329
34
40 41
28
21
55
37
0
10
20
30
40
50
60
NSW Vic Qld WA SA Tas ACT NT Aus
Per c
ent
Jurisdiction
–
200
400
600
800
1 000
2002 2004-05 2008 2012-13 2014-15
$/w
eek
Survey yearAboriginal and Torres Strait Islander peoplesNon-Indigenous Australians

Socio-economic factors
113
2.09 Index of disadvantage Why is it important? There is strong evidence from Australia and other developed countries that low socio-economic status is associated with poor health (Turrell & Mathers, 2000; Marmot, 2015) and that people of lower socio-economic status bear a significantly higher burden of disease (AIHW, 2016f). The links between different forms of socio-economic disadvantage such as poverty, unemployment, poor education and consequent social dysfunction, stress, social exclusion, racism and poor health are well documented (Marmot, 2015; Paradies, 2006; Saunders & Davidson, 2007; Sassi, 2009).
It has been estimated that in the NT, socio-economic status contributes to 30% to 50% of the gap in life expectancy between Indigenous and non-Indigenous Australians (Zhao et al, 2013c).
Socio-economic indexes for areas bring together a composite measure of advantage and disadvantage at the regional level. They provide a broad basis for tracking progress in addressing Indigenous disadvantage across the spectrum of determinants of health.
The ABS has developed a number of Socio-Economic Indexes for Areas (SEIFA). This measure uses the Index of Relative Socio-Economic Advantage/Disadvantage (IRSAD) which summarises a range of variables relating to people’s access to material and social resources and ability to participate in society as related to advantage/disadvantage (e.g. the proportion of families with high incomes, people with a tertiary education and employees in skilled occupations). Scores for each geographic area are produced by weighting these variables. All areas are then ordered from lowest to highest score and divided into equal-sized groups from most disadvantaged to most advantaged. The limitation with the ABS indexes is that the rankings of regions are based on the whole population in the area and will not necessarily reflect the profile for Indigenous Australians.
To address these shortcomings, Biddle (Biddle, 2009; 2013) over the last few years has constructed a number of Indigenous indexes of socio-economic outcomes. The results from this work are also included here.
Findings In 2011, Aboriginal and Torres Strait Islander peoples were over-represented in the three most disadvantaged deciles, ranked according to the ABS IRSAD SEIFA. Thirty-seven per cent of Indigenous Australians lived in areas in the most disadvantaged decile (the bottom 10%), compared with 9%
of the non-Indigenous population. Only 1.8% of Indigenous Australians lived in areas in the most advantaged decile (the top 10%).
Analysis at the jurisdictional level suggests that in all states and territories a greater proportion of the Indigenous Australian population lived in the most disadvantaged quintile (bottom 20%) compared with the non-Indigenous population. The NT had the highest proportion (74%) and the ACT the lowest proportion (2.6%) of Aboriginal and Torres Strait Islander peoples living in the most disadvantaged quintile areas. Tasmania had the lowest proportion (1%) and the ACT the highest proportion (35%) of Indigenous Australians living in the most advantaged quintile areas (top 20%).
These results need to be interpreted with caution. Indigenous Australians often represent a small proportion of the population in each area and therefore the socio-economic status of the area as a whole will not always reflect the socio-economic status of the Indigenous residents (the ‘ecological fallacy’). One study found that Indigenous Australians consistently had a lower socio-economic status than the SEIFA score for the area (Kennedy & Firman, 2004).
Biddle (2009; 2013) has constructed a number of Indigenous indexes of socio-economic outcomes based on Indigenous data from the 2001, 2006 and 2011 Censuses. These studies have consistently found that for Indigenous Australians there is a clear gradient of disadvantage by remoteness. Capital city regions ranked relatively well while remote regions ranked relatively poorly. Income, employment and education correlated geographically while other areas of wellbeing showed more complex patterns.
Within each region there was substantial variation across the smaller, underlying Indigenous Areas. For example, while Sydney was the highest ranking Indigenous Area across all of Australia, the Indigenous population in areas such as Blacktown and Campbelltown had outcomes that were closer to those found in remote Australia. Similar variation was found in remote Indigenous areas, demonstrating that any geographic strategy for addressing Indigenous disadvantage must be targeted below the regional level (Biddle, 2009).
The analysis based on the 2011 Census found that in every area, Indigenous Australians had higher levels of socio-economic disadvantage compared with the non-Indigenous population of the area. There was no single area in Australia where the Indigenous population had better or even relatively equal outcomes compared with the non-Indigenous population. The gap between the two populations was smallest in city and regional rural areas (37–38 percentage points) and highest in Indigenous
towns (89 percentage points) and remote dispersed settlements (81 percentage points) (Biddle, 2013). This study found that, over time, the ranking for most Indigenous areas remained similar, particularly for the top and bottom-ranked areas. City areas, large regional towns and remote towns remained relatively stable. There was a relative worsening of outcomes in small regional towns and rural areas and a relative improvement in Indigenous towns and remote dispersed settlements (Biddle, 2013).
Any regional level analysis of complex social and economic issues using Census data will be affected by the scope of the questions included in the Census, the ‘ecological fallacy’ and data quality issues. However, this type of analysis does provide useful insights into regional variations in outcomes and comparisons between Indigenous and non-Indigenous population groups.
Implications COAG has set targets to reduce the gap in Indigenous disadvantage across health, education and economic participation. This summary measure supplements what is known and reported in other measures about the relative disadvantage that Indigenous Australians experience across a wide spectrum of social and economic issues. This may help in identifying areas of high need.
Among Indigenous Australians, education, location, discrimination, health, disability, labour market discrimination and social norms all play a role in explaining disadvantage with no single factor dominating (Biddle, 2015b).

Socio-economic factors
114
Figure 2.09-1 Population distribution by SEIFA advantage/disadvantage decile, by Indigenous status, 2011
Source: AIHW analysis of ABS 2011 Census
Figure 2.09-2 Population distribution by SEIFA advantage/disadvantage quintiles, Indigenous population by state/territory and total population, 2011
Source: AIHW analysis of ABS 2011 Census
Figure 2.09-3 Indigenous-specific index socio-economic percentile rank and standard deviation by location type, 2011
Source: (Biddle, 2013) Indigenous Relative Socio-economic Outcomes index
Figure 2.09-4 Indigenous and non-Indigenous pooled socio-economic percentile ranks and standard deviations, by location type, 2011
Source: (Biddle, 2013) Pooled Indigenous and Non-Indigenous Relative Socio-economic Outcomes index
37.1
14.511.7
9.17.5 6.3 5.2 4.0 2.9 1.8
9.1 9.8 9.9 10.0 10.1 10.1 10.2 10.2 10.2 10.3
0
5
10
15
20
25
30
35
40
1 2 3 4 5 6 7 8 9 10
Per c
ent
Decile
Aboriginal and Torres Strait Islander peoples Non-Indigenous Australians
Most disadvantaged Most advantaged
5.3 5.3 4.3 5.9 1.9 1.1
34.8
2.5 4.78.7 12 9.2 11.1
5.6 4.8
34.6
6.69.1
13.418.7
14.215.7
10.4 13.4
18.9
9.213.7
21.6
24.5
22.821.1
23.1 25.9
9
7.8
20.8
51.039.4
49.6 46.259 54.8
2.6
73.9
51.6
0
20
40
60
80
100
NSW Vic Qld WA SA TAS ACT NT Australia
Per c
ent
JurisdictionQuintile 5 (Most advantaged) Quintile 4 Quintile 3 Quintile 2 Quintile 1 (Most disadvantaged)
0 20 40 60 80 100
Remote dispersed settlements
Indigenous towns
Remote towns
Regional rural areas
Small regional towns and localities
Large regional towns
City areas
Percentile rank most advantaged → most disadvantaged
0 20 40 60 80 100
Remote dispersed settlements
Indigenous towns
Remote towns
Regional rural areas
Small regional towns and localities
Large regional towns
City areas
Aboriginal and Torres Strait Islander peoples Non-Indigenous Australians
Percentile rank most advantaged → most disadvantaged

Community capacity
115
2.10 Community safety Why is it important? Experiencing threats of violence, being in an environment where personal safety is at risk, or in a social setting where violence is common, has negative health effects. The level of violence experienced by Indigenous Australians is also experienced in the context of colonisation, discrimination and subsequent markers of disadvantage such as low income, unemployment, lack of access to traditional lands and substance use (Day et al, 2013). Safe communities are places in which people are more likely to experience empowerment, security, pride, wellbeing and resilience (see measure 1.13).
Homicide and violence contributed 1.8% of the total burden of disease and injury for Indigenous Australians (AIHW, 2016f). A separate study on intimate partner violence found that it was responsible for 6.4% of the burden of disease and injury for Indigenous females, having its impact through anxiety, depression and suicide as well as homicide and violence (Ayre et al, 2016). Domestic/family violence is a major reason for seeking assistance from homelessness services (see measure 2.01) and also impacts child protection issues (see measure 2.12).
Findings Based on the 2014–15 Social Survey, 22% of Indigenous Australians aged 15 years and over reported they were a victim of physical or threatened violence in the last 12 months, 2.8 times the rate for non-Indigenous Australians (8%). Actual physical violence was experienced by 13% of Indigenous Australians. Of these people, 71% reported that alcohol or other substances had contributed to the most recent violent incident they had experienced. Alcohol or other substances were more likely to have contributed in remote areas (77%) than non-remote areas (69%).
There has been no significant change between 2002 (24%) and 2014–15 (22%) for Indigenous Australians aged 15 years and over. Rates were similar for Indigenous females (22%) and males (23%). However, Indigenous females were more likely than males to report that they knew the offender of the most recent physical violence (96% compared with 83%). For Indigenous females who knew the offender, 39% were subject to violence by a current or previous partner and 48% by a friend or family member. Indigenous females were less likely to feel safe walking alone in their local area after dark (51% compared with 83% of Indigenous males) and were less likely to feel safe at home alone after dark (79% compared with 95% of males).
Indigenous Australians who were unemployed were more likely to report being a victim of physical or threatened violence than those who were employed (30% compared with 19% respectively). Those who had experienced being without a permanent place to live were twice as likely to report being a victim (31%) compared with those who had not (16%); and those living in a household in the lowest income quintile (26%) were more likely to report being a victim compared with those in the highest two quintiles (19%).
In 2014–15, there were similar rates across remoteness areas for self-reported experience of physical or threatened violence in the last 12 months; however hospitalisation rates show a different pattern. Data from 2013–14 to 2014–15 shows Indigenous hospitalisation rates for assault were highest in remote and very remote areas (22 and 21 per 1,000 respectively) compared with inner regional areas (3 per 1,000) and major cities (4 per 1,000). In non-remote areas, hospitalisation rates for assault were lower for Indigenous females than males but were higher in remote areas (26 per 1,000 and 18 per 1,000 respectively) and very remote areas (25 per 1,000 for females and 17 per 1,000 for males). The non-Indigenous female rate was lower than non-Indigenous males in all remoteness areas.
After adjusting for differences in the age structure of the two populations, Indigenous Australians were hospitalised for assault at 14 times the rate of non-Indigenous Australians. Indigenous females were 30 times as likely to have been hospitalised for assault as non-Indigenous females, and Indigenous males were 9 times as likely as non-Indigenous males. The Indigenous female rate was 53 times the non-Indigenous female rate in remote areas and 38 times in very remote areas. In the NT, rates for Indigenous females were 62 times the rates for non-Indigenous females. In 2014–15, Indigenous female family violence related hospitalisation rates were 32 times the rate for non-Indigenous females and the rate for Indigenous males was 23 times the rate for non-Indigenous males (SCRGSP, 2016b).
There has been no significant change in the rate of Indigenous hospitalisations due to assault between 2004–05 and 2014–15 in NSW, Vic, Qld, WA, SA and the NT combined. Rates of hospitalisation for assault were highest for Indigenous Australians aged 25–44 years. The most common injuries requiring hospitalisation were open wounds (29%) and fractures (28%). Home was the most common place of occurrence of the assault for Indigenous females (63%), particularly in non-remote areas (73%). For Indigenous males, common places were
home (43%), street/highway (17%) or trade/service area (17%).
The 2014–15 Social Survey included questions on neighbourhood/community problems. Indigenous Australians living in remote areas were more likely to report problems involving youth (51%) than those living in non-remote areas (26%); alcohol (65% and 31% respectively); family violence (48% and 19% respectively); and assault (46% and 14% respectively).
As at 30 June 2016, the majority (63%) of Indigenous prisoners had been incarcerated due to violence related offences and offences that cause harm (see measure 2.11). In 2014–15, 48% of Indigenous males aged 15 years and over reported that they had been charged by the police in their lifetime, and 20% had been arrested by the police in the last 5 years. In 2014–15, 58% of Indigenous Australians aged 15 years and over reported they trusted the police from their local area and 46% trusted police from outside their local area, lower than the levels of trust in other sectors such as 81% of people trusting their doctor.
In 2015 (NSW, SA and the NT combined), police recorded 12,398 cases of assault where the victim was Indigenous. Indigenous females were more likely to be victims of assault than Indigenous men. Among non-Indigenous Australians, men were more likely to be victims of assault than women. For Indigenous females, partners were the most common offenders ranging from 38% of assaults in NSW to 57% in the NT. The Indigenous victimisation rate for assault was higher than non-Indigenous in all three jurisdictions, particularly for Indigenous women in the NT (11 times non-Indigenous women) and SA (9 times).
In 2011–15 there were 200 Indigenous deaths due to homicide. The mortality rate for homicide for Indigenous Australians was around 7 times the rate for non-Indigenous Australians. The Indigenous homicide mortality rate was highest among those aged 25–34 years, 10 times the non-Indigenous rate for this age group.
Between 1989–90 and 2013–14, 16% of all homicide victims were Indigenous. This is high given Indigenous Australians represent 3% of the Australian population. The majority (68%) of homicides, where both the victim and offender were Indigenous, were domestic homicides (partners or other family members). The equivalent was 44% for non-Indigenous Australians. Alcohol was involved for 68% of Indigenous victims and 70% of Indigenous offenders, much higher than for non-Indigenous victims (27%) and offenders (31%). Indigenous homicides increased by remoteness (from 76 in major cities to 509 in remote areas), while the number of homicides among non-Indigenous Australians decreased with remoteness.

Community capacity
116
Implications Having safe communities to live in is critical to closing the gap in Indigenous disadvantage. All Australian governments have endorsed the National Plan to Reduce Violence Against Women and their Children 2010–2022 (the National Plan), which includes a specific focus on domestic and family and sexual violence against Aboriginal and Torres Strait Islander women and their children through Outcome 3: Indigenous
Communities Are Strengthened. The safety of Aboriginal and Torres Strait Islander women and children is a national priority area in the Third Action Plan of the National Plan. This plan will build upon the work of the previous two Action Plans focusing on improving services for victims of domestic and family violence, supporting community-driven initiatives to reduce or prevent violence and building capacity within the sector, including through workforce development.
The Australian Government’s Indigenous Advancement Strategy’s Safety and Wellbeing Programme seeks to enhance Indigenous community safety and wellbeing by funding activities on five key outcome areas: crime prevention, diversion and rehabilitation; violence reduction and victim support; reduced substance misuse and harm; improved individual and community health, wellbeing and resilience; and safe and functional communities.
Figure 2.10-1 Age-standardised hospitalisation rates for assault, by Indigenous status and remoteness, July 2013 to June 2015
Source: AIHW analysis of AIHW National Hospital Morbidity database
Figure 2.10-2 Deaths from assault (homicide) by Indigenous status and age, NSW, Qld, WA, SA and the NT, 2011–15
Source: ABS and AIHW analysis of National Mortality Database
Table 2.10-1 Experiences of violence, proportion of Indigenous Australians aged 15 years and over, by sex and remoteness, 2014–15
Whether experienced physical or threatened violence in last 12 months Males Females Non-remote Remote Australia
Percent
Experienced physical or threatened violence 23 22 22 23 22
Experienced physical violence 13 14 13 15 13
Experienced physical violence more than once 7 9 8 9 8
Experienced threatened physical violence 17 15 16 16 16
Did not experience physical or threatened violence 77 78 78 77 78 Source: ABS analysis of 2014–15 NATSISS
Figure 2.10-3 Male victims of assault, relationship to offender, by Indigenous status, NSW, SA & NT, 2015
Source: ABS Recorded Crime —Victims, 2015 (ABS, 2016)
Figure 2.10-4 Female victims of assault, relationship to offender, by Indigenous status, NSW, SA & NT, 2015
Source: ABS Recorded Crime —Victims, 2015 (ABS, 2016)
0
5
10
15
20
25
30
Sepa
ratio
ns p
er 1
,000
pop
ulat
ion
Remoteness area
Aboriginal and Torres Strait Islander peoples Non-Indigenous Australians
Males Females
2.7
1.4
6.2
14.1
11.6
9.5
5.5
np0.5 0.2
0.91.4 1.4 1.4
0.8 0.7
0.0
2.0
4.0
6.0
8.0
10.0
12.0
14.0
16.0
0–4 5–14 15–24 25–34 35–44 45–54 55–64 65+
Deat
hs p
er 1
00,0
00 p
opul
atio
n
Age group (years)
Aboriginal and Torres Strait Islander peoples Non-Indigenous Australians
8579 82
5853
43
1521 18
4247
57
0
20
40
60
80
100
NSW SA NT NSW SA NT
Per c
ent
Jurisdiction
Offender known to victim Stranger
Aboriginal and Torres Strait Islander males
Non-Indigenous males
97 95 9486 83
73
3 5 614 17
27
0
20
40
60
80
100
NSW SA NT NSW SA NT
Per c
ent
JurisdictionOffender known to victim Stranger
Aboriginal and Torres Strait Islander females
Non-Indigenous females

Community capacity
117
2.11 Contact with the criminal justice system Why is it important? Aboriginal and Torres Strait Islander peoples experience higher rates of arrest and incarceration than non-Indigenous Australians. Imprisonment impacts on family, children and the broader community. It increases stress, affects relationships and has adverse employment and financial consequences.
The impact of child removals, poverty, unemployment, lower levels of education, higher rates of stressful life events, psychological distress, mental health issues and substance use are linked to higher rates of contact with the criminal justice system (AMA, 2015). In 2015, Indigenous prison entrants were more likely than non-Indigenous entrants to report having had parents or carers in prison during their childhood (26% and 13% respectively). Indigenous prison entrants were less likely to have completed Year 12 or equivalent than Indigenous Australians in the general community and non-Indigenous Australians (prisoners and general community). Indigenous prison entrants were also 1.4 times as likely to have been unemployed in the month prior to imprisonment in 2015 (AIHW, 2015d).
There is an over-representation in prison populations of people with mental health and substance use problems, cognitive impairment, hearing loss, learning difficulties and histories of physical and sexual abuse (Heffernan et al, 2012; Levy, 2005; AMA, 2015). Putt et al (2005) found that 69% of male Indigenous prisoners had used alcohol at the time of arrest compared with 27% of non-Indigenous prisoners; Indigenous prisoners were also more likely to attribute their crime to drug or alcohol intoxication (AMA, 2015; Kariminia et al, 2012; ANCD, 2013). In a recent survey of 5 metropolitan police stations, 41% of Indigenous detainees were methamphetamine users compared with 34% of non-Indigenous detainees (Goldsmid & Willis, 2016).
Findings Youth justice supervision During 2014–15 there were 4,741 Indigenous young people under youth justice supervision (AIHW, 2016ab).
On an average day in 2014–15, 43% of those under youth justice supervision were Indigenous (around 2,433 out of 5,629) (including estimates for WA and the NT). Given Indigenous youth only make up less than 6% of the population aged 10–17 years, they were significantly over-represented in youth justice supervision. Young people may be supervised either in their communities or
in secure detention facilities: on an average day most Indigenous youth under supervision are under community-based supervision (82%) with the remainder in detention (19%). However, of the 883 young people in detention on an average day, half (54%) were Indigenous (including estimates for WA and the NT).
In 2014–15, the rate of Indigenous 10–17 year olds under some form of supervision was 180 per 10,000 on an average day. This was 15 times as high as the non-Indigenous rate (12 per 10,000). Males made up 80% of Indigenous young people under supervision (similar to the non-Indigenous proportion). Indigenous 10–17 year olds were 14 times as likely to be in community-based supervision and 24 times as likely to be in detention as non-Indigenous young people (including estimates for WA and the NT) (AIHW, 2016ab). Rates of supervision peaked for both Indigenous and non-Indigenous young people in 2010–11, before declining in subsequent years (from 213 to 180 per 10,000 for Indigenous young people, and from 17 to 12 per 10,000 for non-Indigenous young people in 2014–15. However, there was also a decline for non-Indigenous young people and the level of Indigenous over-representation has increased from 13 to 15 times the non-Indigenous rate.
Over-representation of Indigenous young people aged 10–17 years in youth justice supervision occurred in all jurisdictions where data was available. WA had the highest level of over-representation in youth justice supervision (the Indigenous rate was 27 times higher than the non-Indigenous rate) and the highest rate of Indigenous young people under supervision (285 per 10,000 on an average day) and Tasmania the lowest Indigenous rate (32 per 10,000 and lowest level of over-representation). In the NT, Indigenous young people constitute 45% of the population aged 10–17 years, but made up 92% of those aged 10–17 years under supervision on an average day in 2014–15. Indigenous young people in the NT were about 17 times as likely as non-Indigenous young people to be under youth justice supervision (rates of 112 and 7 per 10,000).
On an average day in 2014–15, 29% of Indigenous youth under supervision were aged 10–14 years, more than twice the non-Indigenous proportion (14%).
In 2014–15, a higher proportion of Indigenous young people completed multiple periods of supervision than non-Indigenous young people (18% compared with 13%). Indigenous youth released from sentenced community-based supervision in 2013–14 were more likely than non-Indigenous to return to sentenced supervision within 12 months: 54% of Indigenous males (compared with 45% of non-Indigenous males) and 44% of
Indigenous females (compared with 42% of non-Indigenous females). Young Indigenous males released from sentenced detention were more likely to return to sentenced supervision within 12 months than non-Indigenous males (76% and 70% respectively). While for females, proportions were higher for non-Indigenous (79%) than Indigenous females (73%).
For those under supervision in 2014–15, the average length of time under supervision was a week longer for Indigenous young people (187 days) than non-Indigenous young people (180 days).
In 2014–15, on an average day there were 267 Indigenous young people in unsentenced detention. The rate of Indigenous young people on remand was 22 times the rate for non-Indigenous youth. The majority of young people in unsentenced detention (84%) were in the 14–17 year age group. Indigenous youth spent about 1 week longer in unsentenced detention during the year than non-Indigenous youth (46 days compared with 38 days, on average). Indigenous youth were 22 times as likely as non-Indigenous youth to have 6 or more completed periods of unsentenced detention during the year.
One-third (32%) of young people under youth justice community-based supervision in 2014–15 were also in the child protection system, including 44% of Indigenous females and 31% of Indigenous males. In 2014–15, 41% of young people in detention were also in the child protection system at some time that year, including 52% of Indigenous females and 36% of Indigenous males (AIHW, 2016ab).
In 2011–12 to 2014–15, Indigenous Australians represented 39% of youth who had been under youth supervision and who had also accessed specialist services.
Indigenous young people are also more likely to reappear as adults in the justice system (Chen, S et al, 2005). In NSW prisons, Aboriginal inmates were twice as likely to report a history of juvenile detention compared with non-Indigenous inmates, and Aboriginal men were more likely to have been in juvenile detention five or more times compared with non-Indigenous men (Indig & Wales, 2010). In NSW, a higher proportion of young Aboriginal youth in juvenile detention had been placed in out-of-home care as a child (38%) than non-Indigenous (17%) (Indig et al, 2011) (see measure 2.12). In the adult population, nearly half of all Aboriginal inmates in NSW prisons were placed in care as children, twice the non-Indigenous rate (Indig & Wales, 2010). Aboriginal inmates were also more likely to report their parents had been placed in care as a child (27% of Aboriginal women and 14% of Aboriginal men).
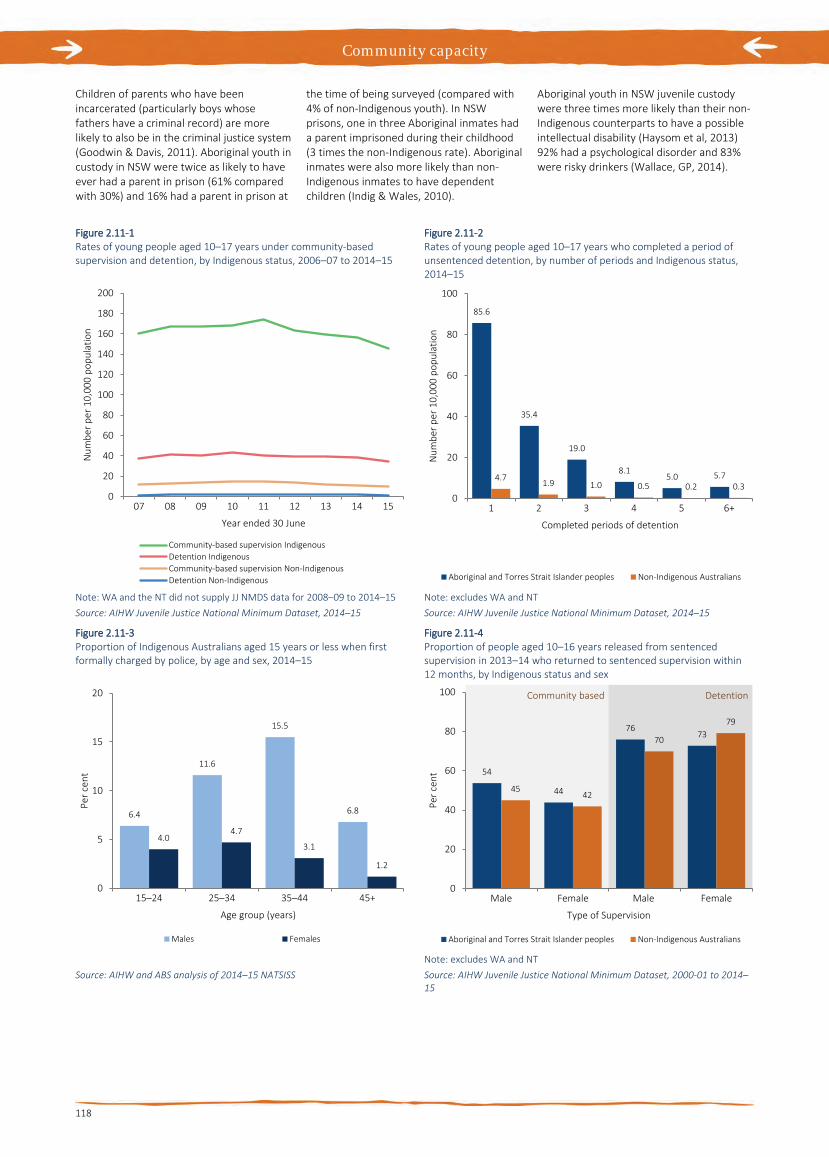
Community capacity
118
Children of parents who have been incarcerated (particularly boys whose fathers have a criminal record) are more likely to also be in the criminal justice system (Goodwin & Davis, 2011). Aboriginal youth in custody in NSW were twice as likely to have ever had a parent in prison (61% compared with 30%) and 16% had a parent in prison at
the time of being surveyed (compared with 4% of non-Indigenous youth). In NSW prisons, one in three Aboriginal inmates had a parent imprisoned during their childhood (3 times the non-Indigenous rate). Aboriginal inmates were also more likely than non-Indigenous inmates to have dependent children (Indig & Wales, 2010).
Aboriginal youth in NSW juvenile custody were three times more likely than their non-Indigenous counterparts to have a possible intellectual disability (Haysom et al, 2013) 92% had a psychological disorder and 83% were risky drinkers (Wallace, GP, 2014).
Figure 2.11-1 Rates of young people aged 10–17 years under community-based supervision and detention, by Indigenous status, 2006–07 to 2014–15
Note: WA and the NT did not supply JJ NMDS data for 2008–09 to 2014–15 Source: AIHW Juvenile Justice National Minimum Dataset, 2014–15
Figure 2.11-2 Rates of young people aged 10–17 years who completed a period of unsentenced detention, by number of periods and Indigenous status, 2014–15
Note: excludes WA and NT Source: AIHW Juvenile Justice National Minimum Dataset, 2014–15
Figure 2.11-3 Proportion of Indigenous Australians aged 15 years or less when first formally charged by police, by age and sex, 2014–15
Source: AIHW and ABS analysis of 2014–15 NATSISS
Figure 2.11-4 Proportion of people aged 10–16 years released from sentenced supervision in 2013–14 who returned to sentenced supervision within 12 months, by Indigenous status and sex
Note: excludes WA and NT Source: AIHW Juvenile Justice National Minimum Dataset, 2000-01 to 2014–15
0
20
40
60
80
100
120
140
160
180
200
07 08 09 10 11 12 13 14 15
Num
ber p
er 1
0,00
0 po
pula
tion
Year ended 30 June
Community-based supervision IndigenousDetention IndigenousCommunity-based supervision Non-IndigenousDetention Non-Indigenous
85.6
35.4
19.0
8.15.0 5.74.7 1.9 1.0 0.5 0.2 0.3
0
20
40
60
80
100
1 2 3 4 5 6+
Num
ber p
er 1
0,00
0 po
pula
tion
Completed periods of detention
Aboriginal and Torres Strait Islander peoples Non-Indigenous Australians
6.4
11.6
15.5
6.8
4.04.7
3.1
1.2
0
5
10
15
20
15–24 25–34 35–44 45+
Per c
ent
Age group (years)
Males Females
54
44
7673
4542
70
79
0
20
40
60
80
100
Male Female Male Female
Per c
ent
Type of Supervision
Aboriginal and Torres Strait Islander peoples Non-Indigenous Australians
Community based Detention

Community capacity
119
Adult imprisonment As at 30 June 2016, there were 10,596 adult prisoners who identified as Aboriginal and Torres Strait Islander in the National Prison Census, representing 27% of all prisoners (ABS, 2016b). After adjusting for differences in the age structure of the two populations, the Indigenous imprisonment rate was 13 times the rate for non-Indigenous Australians. Since 2006, there has been a 53% increase in imprisonment rates for Indigenous Australians and the gap has widened (compared with a 2% increase for non-Indigenous Australians).
At 30 June 2016, the median age of adult Indigenous prisoners was 31 years compared with 36 years for non-Indigenous prisoners. Indigenous men made up 27% of the total male prisoner population. Indigenous women were also over-represented in the prison population, representing 34% of the female prisoner population. Of all Indigenous prisoners, 90% were male.
At 30 June 2016, the highest rates of imprisonment of Indigenous Australians were reported in WA followed by the NT and with the lowest in Tasmania. In the September Quarter 2016, there were also 13,214 Indigenous Australians in community-based corrections, representing 20% of those in community-based corrections (ABS, 2016c).
At 30 June 2016, there were proportionally more Indigenous prisoners (76%) than non-Indigenous prisoners (49%) who had a prior adult imprisonment under sentence (ABS, 2016b). Longitudinal analysis shows Indigenous Australians are around 1.7 times as likely as non-Indigenous Australians to be re-imprisoned within 10 years of release (ABS, 2014d; Zhang, J & Webster, 2010).
Three-quarters (77%) of Indigenous sentences are under 5 years. The median aggregate sentence for Indigenous prisoners was lower than for non-Indigenous prisoners (2.0 years compared with 3.5 years) (ABS, 2016b).
A larger proportion of Indigenous prisoners had a most serious offence/charge of acts intended to cause injury (33%) compared with non-Indigenous prisoners (17%). As at 30 June 2016, the majority (63%) of Indigenous prisoners had been incarcerated due to violence-related offences and offences that cause harm. Indigenous prisoners were less likely than other prisoners to be in prison for illicit drug offences (3% compared with 17%) and homicide (5% compared with 9%) (ABS 2016).
In 2014–15, one in 5 (22%) of Indigenous males aged 35 years and over reported having been incarcerated at some time in their life. Proportions were highest in remote (31%) and very remote areas (27%). In addition, 48% of Indigenous males aged
15 years and over reported that they had been formally charged by the police, 20% had been arrested in the previous 5 years and 5% had been incarcerated in the previous 5 years (ABS, 2016e).
In 2014–15, Indigenous men aged 25 years and over who had been incarcerated were around twice as likely to have a below year 10 level of education (44%) as those who had never been incarcerated (21%). The equivalent proportions for Indigenous women in the same age group were 44% and 24% respectively. Only 28% of Indigenous men aged 35–64 years who had been incarcerated were employed compared with 66% of Indigenous men who had never been to jail. One study found that the differences in arrest rates between Indigenous and non-Indigenous Australians may explain around 15% of the difference in employment outcomes (Borland & Hunter, 2000). By age 23, more than three-quarters (76%) of the NSW Indigenous population have been cautioned by the police, referred to a youth justice conference or convicted of an offence in a NSW criminal court (the comparable non-Indigenous figure was 17%) (Weatherburn, 2014).
Within the prison population in 2015, 40% of Indigenous prison entrants had completed a level of schooling to Year 10 or below compared with 29% of non-Indigenous prison entrants (AIHW, 2015d). Indigenous prison entrants were more likely than non-Indigenous prison entrants to have been unemployed 30 days prior to imprisonment (60% compared with 43%), and were also more likely to be facing homelessness on release (38% compared with 28%) (see measure 2.01).
In 2015, 26% of Indigenous prison entrants reported they had a parent or carer in prison during their childhood compared with 13% of non-Indigenous entrants.
In 2015, the proportion of prison entrants who were smokers was higher than in the general population (82% of Indigenous and 72% of non-Indigenous entrants); and higher than the total Indigenous population smoking rates (45% of those aged 18 years and over in 2014–15). Half (54%) of Indigenous prison entrants reported a high risk of alcohol-related harm in the last 12 months compared with 33% of non-Indigenous prison entrants. In 2015, Indigenous prison entrants were more likely to test positive to hepatitis B virus (25%) than non-Indigenous entrants (15%) (see measure 1.12).
Notably, Indigenous prison dischargees were less likely to have visited the prison health clinic (76%) than non-Indigenous (88%). Indigenous prison dischargees were more likely to report not having a Medicare card available on release (20%) than non-Indigenous dischargees (12%) (AIHW, 2015d).
An NT study of Indigenous inmates found that 94% had significant hearing loss (Vanderpoll & Howard, 2012). Hearing loss was associated with altercations with others due to misunderstandings and difficulties communicating within the criminal justice system, including during hearings.
National Deaths in Custody data show rates of deaths in prison custody have declined for both Indigenous and non-Indigenous Australians. In 2013 there were 1.1 deaths per 1,000 Indigenous Australians in prison custody compared with 3.4 per 1,000 in 2000. For non-Indigenous Australians, rates were 2.0 per 1,000 in 2013 compared with 2.8 per 1,000 in 2000. Data from 2012–13 indicate that there were 13 deaths of Indigenous Australians in all forms of custody and 58 non-Indigenous deaths. Four of the Indigenous deaths occurred in police custody, 9 in prison and none in juvenile justice/welfare custody. Seven of these Indigenous deaths were due to natural causes, 4 were accidents and 1 was self-inflicted.
Implications Findings show a high level of inter-generational disadvantage associated with contact with the criminal justice system, including high rates of parental incarceration and experiences of being placed in care (see measure 2.12). Efforts to reduce Indigenous over-representation in the criminal justice system require recognition of the health and social issues associated with recidivism and non-compliance with court orders.
Primary responsibility for criminal justice issues sits with state and territory governments. The states and territories deliver a range of programmes to reduce levels of Indigenous incarceration and re-offending, including diversionary programmes (e.g. cautions and conferencing), ‘circle sentencing’ and Indigenous courts, and prisoner through-care arrangements. Crime prevention strategies that consider the needs of victims and communities through justice reinvestment have also been recommended (AHRC, 2013). Circle sentencing offers an inter-sectoral strategy to work with communities to address trauma, social difficulties, substance use, low self-esteem and mental health issues (Wallace, GP, 2014). There are gaps in the evidence on the effectiveness of various interventions. While not conclusive, Indigenous tailored employment and diversionary programmes could improve employment opportunities and reduce recidivism particularly for those on shorter sentences (Spiranovic et al, 2015; AMA, 2015).
The Australian Government funds a number of initiatives through its Indigenous Advancement Strategy's Safety and Wellbeing Programme designed to address

Community capacity
120
the factors contributing to Indigenous Australians’ high rates of contact with the criminal justice system. For example, the Government funds a range of prisoner through-care and youth diversion activities that seek to support safer communities by reducing Indigenous offending, targeting Indigenous youth and adults who are currently in or recently exited from the criminal justice system.
The Australian Government also funds initiatives through the Indigenous Australians’ Health Programme enabling preventive interventions to reduce the burden that trauma has on Aboriginal and Torres Strait Islander children.
The Australian Government is also working with states and territories to develop nationally comparable Indigenous offending and victimisation data sets that will assist with identifying areas of greatest need and significant trends. More evidence is required about what prevention strategies and interventions are effective in reducing victimisation, offending and reoffending, and
consequent contact with the criminal justice system. There are also a number of gaps in evidence for youth justice supervision including the reasons for detention, factors contributing to the high rate of Indigenous youth supervision, tracking movement into adult detention, and the health of those under youth justice supervision.
Weatherburn (2014) identifies four key risk factors for Indigenous offending: exposure to child neglect (see measure 2.12); school attendance and performance (see measure 2.05); unemployment (see measure 2.07); and drug and alcohol abuse (see measures 2.16 and 2.17). Findings from these measures combined show Indigenous Australians fare worse across all factors, which all play a significant role in contact with the criminal justice system. Weatherburn suggests that child and maternal health services provide opportunities to address antecedents of child neglect (substance abuse and maternal depression resulting from poor health, family violence, financial stress,
homelessness and traumatic life events). State and territory youth justice agencies provide programmes designed for Indigenous Australians focusing on family violence, alcohol and drug use, education and employment, counselling and family support (AIHW, 2014j).
For individuals in contact with the prison system, access to health services is pertinent both prior to imprisonment and post-release (Lloyd et al, 2013). Accessing health care post-imprisonment requires reapplying for a Medicare number, which creates an additional barrier to addressing health issues while managing competing priorities of re-establishing housing, employment and relationships with family and community. Some Aboriginal health organisations have developed their own health programmes for prisoners and their families (Tongs et al, 2007; Nettleton et al, 2007). In 2015, 13% of Indigenous prisons received health care from an Aboriginal health service (AIHW, 2015d).
Figure 2.11-5 Age-standardised rate of persons in prison, by Indigenous status, 2006 to 2016
Source AIHW and ABS analysis 2016 Prison Census
Table 2.11-1 People in prison custody by Indigenous status, sex and state/territory, 30 June 2016
Indigenous Number Age Standardised
rate (a)
Non-Indigenous Number Rate ratio
(b)
Rate difference
(c)Males Females Persons Males Females Persons
NSW 2,724 309 3,037 1,992 8,951 632 9,586 11.3 1,816
Vic 491 44 535 1,565 5,593 387 5,979 11.7 1,432
Qld 2,228 234 2,461 1,626 4,837 447 5,281 10.5 1,470
WA 2,109 291 2,403 3,383 3,586 337 3,927 16.4 3,177
SA 518 50 571 2,008 2,235 142 2,381 9.8 1,804
Tas 78 19 92 523 424 45 476 3.5 372
ACT 94 7 105 1,904 311 20 328 17.7 1,797
NT 1,294 108 1,393 2,504 244 20 270 13.0 2,311
Australia 9,534 1,062 10,596 2,039 26,190 2,033 28,216 12.5 1,876
(a) Number per 100,000 adult population (b) Rate ratios and differences are age-standardised (c) Rate difference is the Indigenous age-standardised rate Source AIHW and ABS analysis 2016 Prison Census
0
400
800
1,200
1,600
2,000
2,400
2006 2007 2008 2009 2010 2011 2012 2013 2014 2015 2016
Num
ber p
er 1
00,0
00 a
dult
popu
latio
n
Year
Aboriginal and Torres Strait Islander peoples Non-Indigenous Australians
Community capacity
121
2.12 Child protection Why is it important? Experience of maltreatment (physical, emotional and psychological abuse, neglect, sexual abuse and witnessing family violence) during childhood has serious and long-term impacts on social and emotional wellbeing and health (Emerson et al, 2015). Exposure to trauma, neglect and experience of out-of-home care is associated with suicidal behaviour (Atkinson, 2013; Robinson, G et al, 2011). Contact with the criminal justice system increases the risk of experiencing family violence as an adult (Guthridge et al, 2014; Wong, J & Mellor, 2014).
All jurisdictions have legislative requirements on the mandatory reporting of suspected child abuse. Child protection functions are undertaken at the state and territory level of government. Each jurisdiction has its own legislation, policies and practices in relation to child protection (Guthridge et al, 2014; AIHW, 2016z; 2016v).
Indigenous Australians’ experience of child welfare policies has historically been traumatic, with the policy of forcible removal of children known as the Stolen Generations (National Inquiry into the Separation of Aboriginal and Torres Strait Islander Children from Their Families, 1997). The consequences of these removal policies have long-term impacts, including social, physical and psychological impacts for those directly involved, as well as their families and communities (Atkinson, 2013). Child protection issues continue to be very significant for Indigenous communities, reflecting this history of trauma and stressors that have impacted on parents, parenting skills and communities. Issues such as substance abuse, poverty and family violence are also key factors (AHRC, 2015; de Bortoli et al, 2015).
In responding to situations in which Indigenous children are at risk, all states and territories have adopted the Aboriginal and Torres Strait Islander Placement Principle that requires that where Aboriginal and Torres Strait Islander children are removed from their family, the following order of preference for their placement should be followed: the child’s extended family; the child’s Indigenous community; other Indigenous Australians. Barriers to this principle include a shortage of foster and kinship carers, issues of support for kinship carers and inconsistency in child protection decision making (Arney et al, 2015; Kiraly & Humphreys, 2016).
Findings In 2014–15 there were 11,675 Indigenous children who were the subject of substantiated child protection notifications. For Indigenous children aged 0–17 years, the
rate was 40 per 1,000, or 6.7 times the rate for non-Indigenous children (6 per 1,000). Rates of children who were the subject of substantiations of notifications vary across jurisdictions, in part reflecting different legislation, policy and practices in each jurisdiction (AIHW, 2016z). While comparisons between jurisdictions should be made with care, rates of Indigenous children who were the subject of substantiations were higher than for non-Indigenous children within each jurisdiction (ranging from 2 times to 12 times). Nationally the most common reasons for substantiated child protection notifications for Aboriginal and Torres Strait Islander children aged 0–17 years were neglect and emotional abuse (both 38%) compared with 21% and 46% of substantiations respectively for non-Indigenous children. Across the majority of jurisdictions sexual abuse was the least common type of substantiation for Indigenous children (9% nationally compared with 14% for non-Indigenous children).
Nationally, between 2008–09 and 2014–15, there was an increase in the rate of children who were the subject of child protection substantiations, with Indigenous rates increasing from 29.3 to 39.8 per 1,000, and non-Indigenous rates increasing from 5.2 to 5.9 per 1,000.
As at 30 June 2015, there were 16,922 Aboriginal and Torres Strait Islander children on care and protection orders. This represents an increase from 30 June 2009 (36.6 to 57.5 per 1,000), while the non-Indigenous rate has slightly increased (5.3 to 6.3 per 1,000).
As at 30 June 2015, there were 15,455 Indigenous children in out-of-home care. Indigenous children were 9.5 times as likely as non-Indigenous children to be receiving out-of-home care (52.5 per 1,000 compared with 5.5 per 1,000). Across Australia, 66% of Indigenous children in out-of-home care were placed with either a relative/kin or an Indigenous carer or in other Indigenous care. Placements with relative/kin or an Indigenous carer were highest in NSW (79%) and lowest in the Northern Territory (35%). In 2015, 45% of 15–17 year old indigenous children in out-of-home care indicated they received inadequate assistance or require more assistance staying in touch with culture/religion (compared with 38% non-Indigenous children) (AIHW, 2016s).
Young Indigenous people aged 10–17 years who were in the child protection system in 2014–15 were more likely to be under youth justice supervision at some time in the same year: 14% of Indigenous males and 7% of Indigenous females compared with 6% of non-Indigenous males and 2% of non-Indigenous females (Malvaso et al, 2017; AIHW, 2016v).
In NSW prisons nearly half of all Aboriginal inmates were placed in care as children, twice the non-Indigenous rate. Aboriginal inmates were also more likely to report their parents had been placed in care as a child (27% of women and 14% of men) (Indig & Wales, 2010).
Implications Child protection data provide a measure of how many children come into contact with child protection services; however, these data do not capture all children who have been abused or neglected and, additionally, may include some children who have not been abused or neglected (Bromfield & Higgins, 2004).
Aboriginal and Torres Strait Islander children continue to be subject to higher rates of child protection substantiations. There is a connection between higher rates of ‘neglect’ and lower socio-economic status, alcohol and substance abuse and malnutrition or ‘failure to thrive’ (AHRC, 2015). Family violence is often categorised as ‘emotional abuse’. A recent Inquiry in Victoria has found that family violence, in combination with parental alcohol and/or drug abuse, is the leading cause for Aboriginal children’s entry into out-of-home care. Of the Aboriginal children reviewed, 88% were impacted by family violence and 87% were affected by a parent with alcohol or substance abuse issues (Commission for Children and Young People, 2016). This Inquiry also found that the child protection system had failed to preserve, promote and develop cultural safety and connection for Aboriginal children in out-of-home care.
COAG has two major commitments in the area of child protection: The National Framework for Protecting Australia’s Children 2009–2020 (COAG 2009) and the National Plan for Australia to Reduce Violence Against Women and their Children 2010–2022. These commitments recognise that everyone has a right to be free and safe from family violence and abuse and that breaking inter-generational cycles of maltreatment is best achieved by families, communities, community organisations and governments working as partners to build strong and resilient families.
In October 2016, the Australian Government committed $100 million to the Third Action Plan under the National Plan for Australia to Reduce Violence Against Women and their Children 2010–2022, including $25 million in funding for Indigenous specific activities to address family violence in Indigenous communities.
The Australian Government funds a number of initiatives through its Indigenous Advancement Strategy’s Safety and Wellbeing Programme designed to deliver a range of activities for Indigenous families whose children have come into contact with

Community capacity
122
the child protection system or are at risk of coming into contact with the child protection system.
The Australian Government is providing $35.8 million over five years to the NT Government to deliver the Remote Family Support Service under the National Partnership on Northern Territory Remote
Aboriginal Investment. This service will improve the delivery and coordination of child protection and family support services in remote areas.
The Australian Government also funds Indigenous Parenting Services that provide prevention and early intervention activities that support parents to address underlying
issues that can present barriers to effective parenting, especially for children at risk of abuse and neglect. Further evaluation is required to assess the effectiveness of Indigenous parenting programmes and how well they attract and retain participants and the cultural competence of the service (Emerson et al, 2015).
Figure 2.12-1 Children aged 0–17 years who were the subject of a substantiation: no. per 1,000 children, by Indigenous status and jurisdiction, 2014–15
Source: AIHW Child Protection Collection 2015
Figure 2.12-2 Children aged 0–17 years on care and protection orders: no. per 1,000, by Indigenous status, 30 June 2009 to 30 June 2015
Source: AIHW Child Protection Collection 2015
Table 2.12-1 Children (0–17 years) in out-of-home care, by Indigenous status and jurisdiction, 30 June 2015
NSW Vic Qld WA SA Tas ACT NT Aus
Number of Children
Indigenous 6,210 1,511 3,512 2,062 844 241 183 892 15,455
Non-Indigenous 10,631 7,049 4,879 1,890 1,949 812 482 125 27,817
Total(a) 16,843 8,567 8,448 3,954 2,838 1,061 671 1,017 43,399
Rate per 1,000 children
Indigenous 67.4 71.5 40.0 55.3 52.3 22.5 74.8 33.4 52.5
Non-Indigenous 6.6 5.5 4.7 3.4 5.7 7.9 5.7 3.4 5.5
Total(a) 9.9 6.6 7.5 6.7 7.9 9.3 7.7 16.0 8.1
Rate ratio 10.2 12.9 8.5 16.3 9.2 2.9 13.1 9.8 9.5 (a) Includes Indigenous status not known Source: AIHW Child Protection Collection 2015
Figure 2.12-3 Proportion of Indigenous child placements with relatives, kin or other Indigenous caregiver, by jurisdiction, 30 June 2015
Source: AIHW Child Protection Collection 2015
51
67
23
35 36
12
40
54
40
69
4 3 4 5 39 6
0
20
40
60
80
NSW Vic Qld WA SA Tas ACT NT Aus
Num
ber p
er 1
,000
chi
ldre
n
Jursidiction
Aboriginal and Torres Strait Islander children Non-Indigenous children
0
10
20
30
40
50
60
70
09 10 11 12 13 14 15N
umbe
r per
1,0
00 c
hild
ren
Year ended 30 June
Aboriginal and Torres Strait Islander children Non-Indigenous children
79
57 57
64 67
39
56
35
66
0
20
40
60
80
100
NSW Vic Qld WA SA Tas ACT NT Australia
Per c
ent o
f pla
cem
ents
Jurisdiction
Community capacity
123
2.13 Transport Why is it important? Transport is a key enabler for access to health care, goods and services, and supports Aboriginal and Torres Strait Islander peoples to achieve education and employment outcomes and maintain cultural obligations to travel to family commitments (Helps et al, 2010; Ivers et al, 2016)
Aboriginal and Torres Strait Islander peoples face various barriers to accessing appropriate health care (see measure 3.14) including logistics, cost and reliability of transport options. These challenges have a broader impact on the social and economic circumstances of both health service users who need to travel significant distances while unwell, and on carers who support attendance at services for antenatal care, young children, people with a disability, or people suffering from chronic health conditions, mental health or substance use issues (Lee et al, 2014). Limited or no public transport options significantly impact on the capacity to access specialist health care, particularly for patients with chronic health conditions (Teng et al, 2014) or requiring birthing services (Parker, S et al, 2014) in rural and remote areas (Kelly et al, 2014).
Findings Transport/distance was a reason 16% of Indigenous Australians reported they did not access health services when they needed to in 2012–13 (Health Survey). For specific types of services, transport/distance was a reported barrier to visiting a hospital (17%), a doctor (14%), a dentist (11%), counsellors (10%), and other health professionals (13%).
Logistical reasons (transport/distance, waiting time too long, availability of service in the area) were a greater barrier to accessing a health provider when needed (40%) than cost (36%) or cultural appropriateness of services (32%). Logistical reasons were a greater barrier to accessing hospital services (37%) than cultural appropriateness of services (27%) or cost (8%). Likewise, logistical reasons were a greater barrier to accessing a doctor (34%) than cultural appropriateness of services (23%) or cost (13%). Logistical reasons were second only to cost as a barrier to accessing dental services and other health professionals.
In 2014–15, 75% of Indigenous Australians aged 15 years and over reported they can easily get to places needed; an increase from 70% in 2002. For non-Indigenous Australians, 84% reported being easily able to get to places needed. There was a clear gradient by remoteness with the proportion of Indigenous Australians able to easily get to places when needed decreasing from 79%
in both major cities and inner regional areas down to 61% in very remote areas. Rates were highest in NSW (81%) and lowest in the NT (60%). Age also had an effect, with 70% of 15–24 year olds reporting they can easily get to places needed rising to 79% for those aged 45 years and over.
In 2014–15, 8% of Indigenous Australians reported being unable to get to places needed/never go out/housebound compared with 1% of non-Indigenous Australians.
In 2014–15, Indigenous Australians aged 15 years and over were less likely to have access to a motor vehicle than non-Indigenous Australians (75% compared with 85% respectively). The gap was widest in remote/very remote areas combined where 67% of Indigenous Australians had access to a vehicle compared with 92% of non-Indigenous Australians; in non-remote areas the gap was smaller (78% compared to 85%). Rates varied across jurisdictions, with those living in the ACT reporting the highest rates of access to a vehicle (84%) and those in the NT the lowest (66%).
In 2014–15, 29% of Indigenous Australians aged 15 years and over had used public transport in the previous two weeks. Of those who hadn’t used it, 51% lived in an area in which there was no public transport available. Use of public transport was lower in remote areas (13%) than in non-remote areas (34%). Research has found that 35% of Aboriginal and Torres Strait Islander people were subjected to racism while using public transport (Ferdinand et al. 2012). This, along with availability of public transport, impedes access to services.
In 2014–15, transport services were provided by 84% of Commonwealth-funded Indigenous primary health care services (AIHW, 2016o).
Unsurprisingly, Indigenous Australians aged 15 years and over who can easily get to places needed were less likely to report having problems accessing services. They were also less likely to have a disability/long term health condition, to report high/very high levels of psychological distress or to rate their health as fair/poor.
While transport is a key enabler of access to health services, it also poses risks to health if the mode of transport is unsafe, such as a vehicle not in good working order, or a driver operating a vehicle while under the influence of alcohol or drugs (Symons et al, 2012; Fitts et al, 2013). Hospitalisation and deaths due to injuries from transport accidents remain a concern (see measure 1.03).
Implications While public transportation may compensate for the lack of private transport in non-remote areas, a higher proportion of
Indigenous Australians in both remote and non-remote areas have less access to a motor vehicle compared with non-Indigenous Australians. Indigenous Australians also experience barriers to obtaining a driver’s licence, including financial hardship; literacy and language issues; identity requirements; driving practise requiring access to a car, an experienced driver and being able to afford petrol; and cyclical fine defaults (Cullen et al, 2016). Schemes to assist patients with travel and associated accommodation operate in the various jurisdictions. Other approaches have also been adopted, such as support for specialist services flying into remote localities.
Patient transport services designed to assist patients with chronic illnesses to access health services on a regular basis are an important aspect of health service delivery. This is particularly the case for Indigenous households where private and public transport options are often restricted. Patient transport services are provided by a broad range of services including voluntary groups, Aboriginal Community Controlled Health Organisations (ACCHOs), hospitals and ambulance services.
For example, the WA Department of Health has funded patient transport officers and patient journey officers in ACCHOs and area health services to ensure that Aboriginal patients have adequate transport to medical appointments at all levels of the health system (primary, secondary and tertiary). Unfortunately, the provision of these services varies significantly across Australia and access is not always assured.
Queensland Health provides the Indigenous Cardiovascular Outreach Program and the Indigenous Respiratory Outreach Care Program to deliver a range of primary, secondary and tertiary health care services in locations with limited access to specialist services.

Community capacity
124
Table 2.13-1 Indigenous Australians who did not access health services when needed to and reasons relating to logistics, 2012–13
Dentist Doctor Other health professional Hospital Counsellor
Per cent
Did not access service when needed to in last 12 months 21 14 9 6 9
Reason(s) did not access service
Waiting time too long or not available at time required 20 22 17 25 12
Transport/distance 11 14 13 17 10
Service not available in area 9 5 6 3 6
Logistical reasons (subtotal) 33 34 28 37 22 Source: ABS and AIHW analysis of 2012–13 AATSIHS
Figure 2.13-1 Perceived level of difficulty with transport for persons aged 15 years over, by Indigenous status, 2014–15
Source: ABS and AIHW analysis of 2014–15 NATSISS
Figure 2.13-2 Proportion of Indigenous Australians aged 15 years and over who can get to places needed, by remoteness, 2014–15
Note: Includes people who never go out and are housebound Source: ABS and AIHW analysis of 2014–15 NATSISS
Figure 2.13-3 Proportion of persons aged 15 years and over with access to a motor vehicle, by Indigenous status and remoteness, 2014–15
(a) Data not collected from Non-Indigenous Australians in very remote areas Source: ABS and AIHW analysis of 2014–15 NATSISS
Figure 2.13-4 Relationship between being easily able to get to places needed and selected health outcomes, Indigenous Australians 15 years and over, 2014–15
Source: ABS and AIHW analysis of 2014–15 NATSISS
1
3
12
84
8
3
13
75
0 20 40 60 80 100
Can't get to places needed/never go out/housebound
Often have difficulty getting to places needed
Sometimes have difficulty getting to places needed
Can easily get to places needed
Per cent
Aboriginal and Torres Strait Islander Peoples Non-Indigenous Australians
79 79 7867
61
75
0
20
40
60
80
100
Majorcities
Innerregional
Outerregional
Remote Veryremote
Australia
Per c
ent
Remoteness area
7683
76 7264
7584
89 89 93 85
0
20
40
60
80
100
Majorcities
Innerregional
Outerregional
Remote Veryremote(a)
Australia
Per c
ent
Remoteness area
Aboriginal and Torres Strait Islander peoples Non-Indigenous Australians
0
20
40
60
80
100
Low/moderate
High/very high
Excellent/good
Fair/poor No Yes No Yes
Per c
ent
Psychological distress Self-assessed health Disability/longterm condition Problems accessing services

Community capacity
125
2.14 Indigenous people with access to their traditional lands Why is it important? Connection to family and community, land and sea, culture and identity has been identified as integral to health from an Aboriginal perspective (NAHSWP, 1989). As stated by Anderson (1996): ‘Our identity as human beings remains tied to our land, to our cultural practices, our systems of authority and social control, our intellectual traditions, our concepts of spirituality, and to our systems of resources ownership and exchange. Destroy this relationship and you damage—sometimes irrevocably—individual human beings and their health’. Ongoing access to traditional lands also offers socio-political, economic and environmental benefits (Weir, 2012). Analysis of 2008 Social Survey data found a clear association between cultural attachment and positive socio-economic outcomes and wellbeing (Dockery, 2011).
For many Aboriginal and Torres Strait Islander peoples, disconnection from Country is considered a form of homelessness. Similarly, many people are less likely to perceive themselves as homeless, regardless of the adequacy of their dwelling, if they are on Country (ABS, 2014a).
Access to traditional lands is not only a determinant of health in remote contexts where Indigenous Australians are more likely to have ownership and control over their Country; it is also a determinant of health for those living in non-remote and urban areas. Research in Victoria has found the role of Country in strengthening self-esteem, self-worth, pride, cultural and spiritual connection and positive states of wellbeing (Kingsley et al, 2013).
Caring for Country means participation in activities on traditional land, with the objective of promoting ecological, spiritual and human health (Berry, HL et al, 2010). In central Arnhem Land, a cross-sectional study of almost 300 Indigenous adults aged 15–54 years found that participation in Caring for Country was associated with better health outcomes including diet, physical activity, mental health and lowered risk of diabetes, kidney disease and cardiovascular disease, after controlling for socio-economic characteristics and health behaviours (Burgess, CP et al, 2009).
Findings In 2014–15, 74% of Aboriginal and Torres Strait Islander adults reported that they recognised their homeland or traditional country. Nearly one-quarter (23%) reported they lived on their homelands, 49% did not
live on homelands but were allowed to visit, and 1% were not allowed to visit their homelands/traditional country.
Indigenous Australians in the 45–54 year age group were more likely to recognise their homelands than those in the 15–24 year age group (85% compared with 63%). Note that 11% of Indigenous Australians reported they had been removed from their family, and 36% reported that they had relatives removed from their family.
Those who lived in remote areas (89%) were more likely than those in non-remote areas (70%) to recognise homelands/traditional country, and more likely to live on homelands/traditional country (44% compared with 17% respectively). More Indigenous Australians in remote areas identified with a clan, tribal or language group (79%) compared with those in non-remote areas (58%).
The 2014–15 Social Survey provides opportunities to analyse relationships between access to lands and other factors. The analysis outlined below summarises simple associations found in the data; further multivariate analysis is needed to explore the complex interactions between these issues. Compared with those who do not recognise homelands, those who lived on homelands/traditional country were less likely to have completed Year 12 (19% compared with 26%), to be employed (39% compared with 46%), or be living in households that were able to raise $2,000 in a week (41% compared with 57%). Aboriginal and Torres Strait Islander peoples who lived on homelands were also more likely than those who do not recognise homelands to report problems accessing health services (17% compared with 12%).
In 2014–15, over 50% of Indigenous rangers and Indigenous Protected Areas projects reported an improvement in the health and overall wellbeing of their rangers (Department of the Prime Minister and Cabinet, 2016).
Implications While the evidence suggests there are health benefits in connections to Country and culture, for many people, living on Country is not an option. For those living in non-remote areas, visits may be the only realistic possibility.
Indigenous Australians’ rights and interests in land are formally recognised in around 40% of the land area of Australia. A further 37% of Australia is subject to application for recognition of native title rights.
The Government recognises the importance, to Indigenous Australians, of maintaining connection to land and waters. This connection is the basis of relationships, identities, cultural practices and Indigenous wellbeing at both the individual and community level.
The Australian Government is aiming to resolve all current native title claims within a decade as part of its comprehensive plan set out in the Developing Northern Australia White Paper. The Government will continue to provide $110 million per year over the next four years to support this aspiration.
In addition, the Commonwealth has committed $1 million in additional funding over the next four years for the Aboriginal Land Commissioner to support the resolution of remaining land claims in the Northern Territory.
As part of the Developing Northern Australia White Paper, the Government, in partnership with various state and territory governments and Indigenous organisations, is implementing a number of measures which support Indigenous peoples’ access and use of land. These measures support innovative changes that simplify land use arrangements and attract more investment across northern Australia. The Government has allocated $10.6 million for pilot projects that broaden economic activity and demonstrate the benefits of land reform. The Government also is investing $17 million for township lease negotiations and land administration measures aimed at increasing economic activity on Indigenous land in the Northern Territory, as well as $20.4 million (over four years, ongoing) to build the capacity of native title corporations across Australia.
In December 2015, COAG considered the report of the investigation into Indigenous land administration and use (‘the Investigation’). The Investigation makes recommendations to support Indigenous people to use their rights in land and waters for economic development. These include recommendations that go to supporting native title determination processes, removing legislative barriers to bankable long-term leases, and supporting the capacity and autonomy of Indigenous land owners.
COAG agreed jurisdictions would implement the recommendations of the Investigation’s report, subject to their circumstances and resource constraints. The Commonwealth Minister for Indigenous Affairs is due to report back on implementation of the recommendations after 12 months in late 2016.
South Australia has a Mobile Dialysis Unit which is a specially designed truck that has been fitted with three dialysis chairs and visits remote Aboriginal communities across SA. The Unit allows Aboriginal dialysis patients living in regional or metropolitan centres to visit their home communities. The Unit commenced operating in 2014 and has visited many communities allowing people to return home for significant community events and to spend time on Country with family and friends.

Community capacity
126
Figure 2.14-1 Access to homelands/traditional country, by remoteness area, Indigenous Australians aged 15 years and over, 2014–15
Source: AIHW and ABS analysis of 2014–15 NATSISS
Figure 2.14-2 Selected socio-economic characteristics by whether Aboriginal and Torres Strait Islander people recognised/did not recognise homelands/traditional country, 2014–15
Source: ABS and AIHW analysis of 2014–15 NATSISS
Figure 2.14-3 Long term health conditions by whether Aboriginal and Torres Strait Islander people recognised/did not recognise homelands/traditional country, 2014–15
Source: ABS and AIHW analysis of 2014–15 NATSISS
Figure 2.14-4 Highest year of school completed by whether Aboriginal and Torres Strait Islander people recognised/did not recognise homelands/traditional country, 2014–15
Source: ABS and AIHW analysis of 2014–15 NATSISS
33 3124
169
26
1 1
1
11
1
5545
52
46
41
50
1021 24
3649
23
0
20
40
60
80
100
Majorcities
Innerregional
Outerregional
Remote Veryremote
Australia
Per c
ent
Remoteness area
Recognises and lives on homelands/traditional countryRecognises and allowed to visit homelands/traditional countryRecognises but not allowed to visit homelands/traditional countryDoes not recognise homelands/traditional country
19
39 41
26
46
57
0
10
20
30
40
50
60
70
80
Completed Yr 12 Employed Able to raise $2,000in a week
Per c
ent
Lives on homelands/ traditional countryDoes not recognise homelands/ traditional country
37 38
33
26 2731
0
10
20
30
40
50
Does not recognisehomelands/
traditional country
Lives on recognisedhomelands/
traditional country
Allowed to visitrecognised homelands/traditional country but
does not live there
Per c
ent
No current long term health condition Three or more long term health conditions
26
19
29
6064
55
0
10
20
30
40
50
60
70
80
Does not recognisehomelands/
traditional country
Lives on recognisedhomelands/
traditional country
Allowed to visitrecognised homelands/traditional country but
does not live there
Per c
ent
Year 12 Year 10 or below

Health behaviours
127
2.15 Tobacco use Why is it important? The health impact of smoking is evident in the high rates of hospitalisation and deaths from tobacco-related conditions (e.g. chronic lung disease, cardiovascular disease and many forms of cancer) (Marley et al, 2014; Pircher et al, 2012).
Maternal smoking during pregnancy increases the risk of poor outcomes for babies and children (see measures 2.21 and 1.01). Second hand smoke also has adverse health effects for those exposed to it (see measure 2.03).
In Australia, up to two-thirds of deaths in current smokers can be attributed to smoking and current smokers are estimated to die an average of 10 years earlier than non-smokers. Smoking cessation reduces mortality, with earlier cessation resulting in greater reductions (Banks et al, 2015).
It has been estimated that around 18,800 Australians die prematurely from tobacco-related diseases each year (AIHW, 2016l) and that smoking imposes an estimated $31.5 billion financial burden on the community (Collins & Lapsley, 2008).
Findings Tobacco use was the leading contributor to the burden of disease among Indigenous Australians (12% of the total burden) and 23% of the gap in health outcomes between Indigenous and non-Indigenous Australians in 2011 (AIHW, 2016f). Coronary heart disease, COPD, lung cancer and stroke were key diseases attributable to tobacco use. Smoking caused 93% of the lung cancer burden and 87% of the COPD burden.
The 2014–15 Social Survey provides the latest data on Indigenous smoking rates. In 2014–15, 42% of Indigenous Australians aged 15 years and over reported being a current smoker (39% smoked daily and 3% less than daily). Indigenous Australians were 2.7 times as likely to be a current smoker as non-Indigenous Australians (age-standardised). The rate of current smokers among Indigenous adults (18 years and over) was 45% in 2014–15.
For Indigenous Australians aged 15 years and over, the rate of current smokers declined by 9 percentage points between 2002 and 2014–15. The short-term trend from 2008 to 2014–15 also declined (by 5 percentage points). Prior to 2002, rates were quite static. Over the same period, smoking rates for non-Indigenous Australians have also declined and there has been no improvement in the gap (24 percentage points in 2002 and 27 percentage points in 2014–15).
Indigenous Australians who lived in very remote areas were more likely to be current
smokers in 2014–15 (53%) than those living in major cities (36%). This reflects the declines in smoking rates in non-remote areas (from 50% in 2002 to 39% in 2014–15). In remote areas, rates have remained steady (55% in 2002 and 52% in 2014–15). In 2014–15 Indigenous smoking rates ranged from 49% (in the NT) to 38% (Tas).
In 2014-15, smoking rates for Indigenous Australian males (45%) aged 15 years and over were slightly higher than for females (40%); and rates for both sexes have declined between 2002 and 2014–15. Smoking rates for Indigenous Australians aged 15 years and over were highest among those aged between 25 and 54 years (48–50%) and lowest for 15–17 year olds (17%); this pattern was similar for non-Indigenous Australians. Between 2002 and 2014–15, the greatest decreases in smoking rates have been in the younger age groups—from 58% to 41% for 18–24 year olds and from 33% to 17% among 15–17 year olds.
Consistent with the declining smoking rates for Indigenous Australians between 2002 and 2014–15, there has been an increase in the proportion of ex-smokers (from 15% to 22%). The proportion who had never smoked remained steady (33%–36%). For young people 15–17 years, the proportion who never smoked increased from 62% in 2002 to 78% in 2014–15 and for those aged 18–24 years, from 34% to 46%. This suggests a progressive decrease in the uptake of smoking. For those who continue to smoke, the average number of cigarettes smoked daily has declined from 15 in 2008 to 13 in 2014–15, noting there is no safe level of smoking.
In 2014–15, 69% of Indigenous daily smokers had tried to quit smoking in the previous 12 months. Rates were highest for those aged 25–34 years (77%). Rates of those who tried to quit and/or reduce smoking were higher for females (72%) than for males (67%). By remoteness and jurisdiction, there were differences for those who had tried to quit (not reduce) smoking—higher in remote than non-remote areas (43% compared with 25%) and higher in the NT (43%), WA (43%) and SA (36%) compared to other states and territories.
The most common reasons for trying to quit/reduce smoking in the previous 12 months were: general health (73%), cost (56%), improve fitness (31%), encouraged by family or friends (27%), medical advice (17%), and concerned about effect on others in the household (16%). In 2014–15, 59% of Indigenous Australians were living in a household with at least one smoker (See measure 2.03).
In a 2012–13 study (Thomas, DP et al, 2015a), 70% of Indigenous Australian smokers wanted to quit; 69% of daily smokers had ever made a quit attempt; 48% had made a quit attempt in the past year;
and 47% of daily smokers who had made a quit attempt in the past 5 years had sustained an attempt for at least one month.
A 2017 study found the graphic warning labels on cigarette packaging appeared to have a positive impact on Indigenous smokers, who reported that it stopped them from having a smoke (Nicholson et al, 2017). Reasons for smoking appear to be similar for Indigenous men and women while motivations to quit differ (Knott et al, 2016). Predictors for making a quit attempt differ from predictors for sustaining a quit attempt (Nicholson et al, 2017). Predictors of smoking behaviour among adolescents differ for males and females (Mazanov & Byrne, 2008).
Smoking status is associated with socio-economic factors and smoking rates are highest for Indigenous Australians in the most disadvantaged circumstances (Thomas, DP et al, 2008). In NSW, tobacco outlet density has also been found to be higher in more disadvantaged districts and positively associated with smoking status (Marashi-Pour et al, 2015).
In 2014–15, Indigenous Australians aged 15 years and over were more likely to report being a non-smoker if they were: employed (65% compared with 47% for unemployed); in households in the highest income quintile (71% compared with 47% for the lowest); and had completed Year 12 (72% compared with 52% for those who completed Year 10 or below).
Indigenous Australians were more likely to report being a current smoker if they had: high/very high levels of psychological distress (51% compared with 38% for those with low/moderate levels); had fair/poor self-assessed health status (49% compared with 35% with excellent/very good); and had experienced one or more stressors in the previous 12 months (45% compared with 35% for those who did not).
Those who smoked were also more likely to drink at risky levels (42% exceeded short-term guidelines compared with 21% for non-smokers) and to use substances (44% compared with 21% for non-smokers). In 2015, 82% of Indigenous prison entrants were current smokers (see measure 2.11) (AIHW, 2015d).
Implications Tobacco smoking is influenced by a range of social, cultural and family factors, including normalisation of smoking in peer groups and families, positive attitudes towards smoking, and smoking as a coping mechanism (Robertson et al, 2013; Scollo & Winstanley, 2012; Johnston & Thomas, 2008; Hearn et al, 2011). Additional barriers to quitting in remote areas include underlying social disadvantage and access to and uptake of services/treatment to support quitting (Thomas, DP et al, 2015a; Sarin et al, 2015).

Health behaviours
128
The influence of these factors varies across the different community and social settings in which Aboriginal and Torres Strait Islander peoples live (Johnston & Thomas, 2008). Consequently, it is important that tobacco reduction strategies acknowledge the social exchange that occurs when smoking; the important role of family; and the high rates of stress experienced by Aboriginal people (Cosh et al, 2015; Hearn et al, 2011).
Systematic international reviews of smoking cessation intervention studies in Indigenous populations globally have found limited rigorous evidence to evaluate which interventions would be effective in reducing smoking; there is not one type of intervention or combination of activities that will reduce tobacco use in Indigenous communities (Carson et al, 2012; Minichiello et al, 2015).
What was found to have an important influence is a comprehensive approach inclusive of multiple activities (e.g. pharmacotherapies combined with culturally tailored interventions and health professional support); addressing prevention and cessation at the individual, community and legislative levels (e.g. brief interventions with community education and smoke-free policies); centred on Indigenous leadership; with long-term community investments; workforce support and development; and provision of culturally appropriate health materials and activities (Minichiello et al, 2015; Carson et al, 2012; Robertson et al, 2013; Hearn et al, 2011; Noble et al, 2016).
The research also highlighted that strategies should be evidence-based; coordinated; integrated (with each other, with mainstream smoking strategies and other Indigenous health strategies); involve Indigenous people; support, strengthen and build on existing programs; and further develop evidence (Sarin et al, 2015).
While comprehensive tobacco control programs appear to be motivating Indigenous Australians to quit, they do not appear to overcome the challenges in sustaining quit attempts, particularly for the more disadvantaged and those from remote areas (Nicholson et al, 2015).
Australian governments have worked closely with Indigenous Australians and health organisations over many years to deliver a range of approaches to address the high rates of tobacco smoking in the Indigenous population. Smoking rates are starting to decline; though are still high, particularly in remote areas. Further sustained improvements will be needed to close the gap in health outcomes.
The National Tobacco Strategy 2012–18 has nine priority areas; one building on existing programs and partnerships to reduce smoking rates among Aboriginal and Torres Strait Islander people. The Strategy includes
demand reduction, supply reduction and harm reduction approaches (IGCD, 2012). A mid-point review of the Strategy (undertaken in 2016) assessed whether Australia is on track to meet the COAG targets to reduce smoking rates (see COAG targets).
Indigenous Australians are a major target audience of the National Tobacco Campaign (NTC). In 2016, Don’t Make Smokes Your Story, specifically targeting Indigenous smokers, was developed and placed in a range of Indigenous and mainstream media channels together with Break the Chain and Quit for You, Quit for Two (targeting pregnant women and their partners). The NTC encourages Indigenous smokers to quit smoking, and recent quitters to continue not to smoke and to encourage others to quit. The More Targeted Approach campaign (aimed at high-risk and hard-to-reach groups) also includes materials developed for Indigenous Australians. Evaluation research has found the NTC effectively promoted positive attitudes and intentions towards not smoking.
Since 1 December 2012, all tobacco products have been required to be sold in plain packaging with updated and expanded graphic health warnings. Annual 12.5% increases in excise on tobacco and tobacco-related products were implemented on 1 December 2013, and 1 September 2014, 2015 and 2016. The 2016–17 Budget includes a further four annual 12.5% increases in tobacco excise and excise equivalent customs duties to be implemented from 1 September 2017.
The Australian Government delivered the Tackling Indigenous Smoking (TIS) programme, commencing with funding for Tackling Smoking and Healthy Lifestyle Teams in 2010. Following a review in 2014, the TIS programme funds regional projects to deliver a range of evidence-based activities that suit the local context and the needs of the community to prevent the uptake of smoking and support smoking cessation. The regional projects have national supports to assist with best practice approaches and outcome measurement. Five nationally consistent performance indicators have been developed for organisations receiving TIS regional grant funding: quality and reach of community engagement; building capacity to support quitting; referrals to appropriate quitting support; supporting smoke-free environments; and appropriate engagement with relevant organisations involved in tobacco reduction in the region.
Jurisdictions are also implementing strategies to reduce smoking. For example, in WA, the Tackling Smoking–a development of Midwest Region Wide Tobacco Strategy and Campaign. This campaign used intervention approaches that included radio,
newspaper, community events and the distribution of promotional materials. Results from a short-term evaluation indicated an increase in calls to the Aboriginal Quitline following the campaign.
The Aboriginal and Torres Strait Islander Smoking Cessation Program in the ACT, supports a number of smoking cessation activities in the region, with an emphasis on pregnant smokers and their families.
In Tasmania additional funds were provided to increase anti-tobacco media campaigns between 2013 and 2016. At the same time, the NTC–More Targeted Approach was implemented including materials developed for Indigenous Australians.
The Victorian Government has established key strategic partnerships with non-Government organisations, such as Quit Victoria and the Victorian Aboriginal Community Controlled Health Organisation (VACCHO), which have employed coordinators to specifically address Indigenous tobacco control initiatives.
Understanding smoking prevalence at more localised levels, among pregnant women and those living in remote areas, as well as effective strategies to maintain smoking cessation, are important.
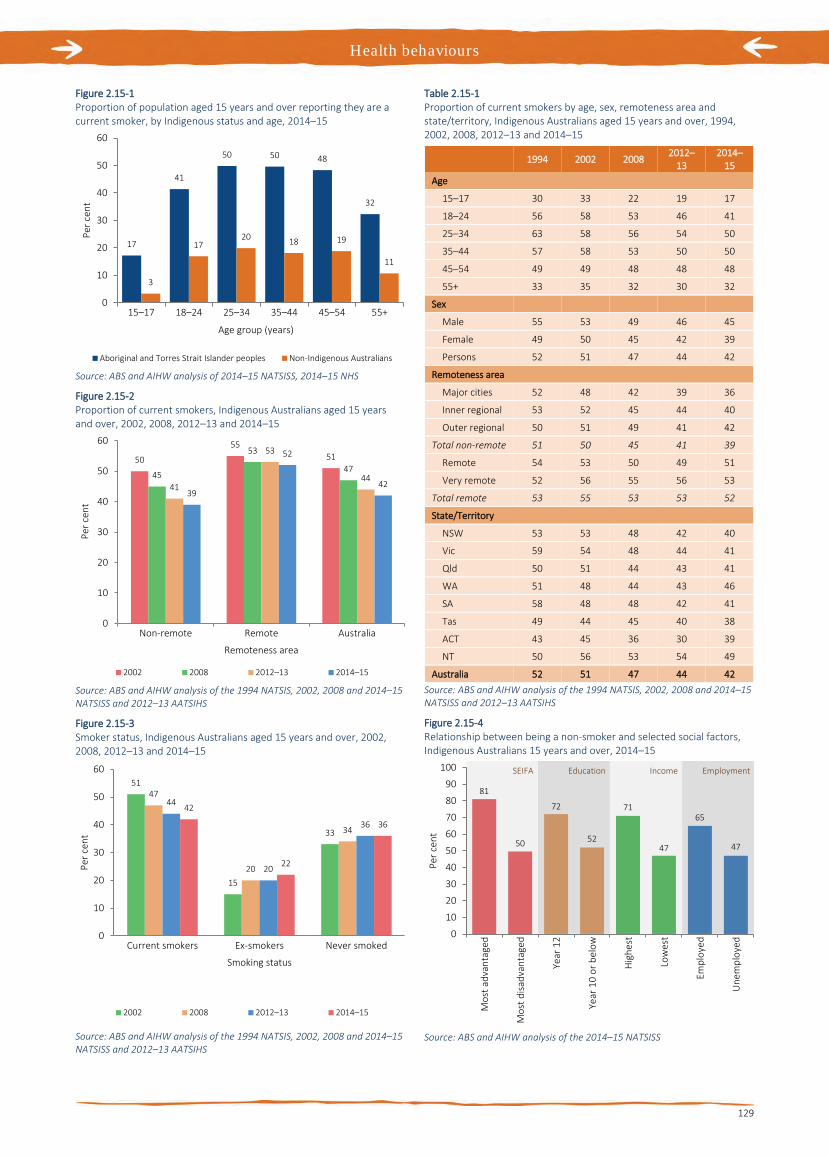
Health behaviours
129
Figure 2.15-1 Proportion of population aged 15 years and over reporting they are a current smoker, by Indigenous status and age, 2014–15
Source: ABS and AIHW analysis of 2014–15 NATSISS, 2014–15 NHS
Figure 2.15-2 Proportion of current smokers, Indigenous Australians aged 15 years and over, 2002, 2008, 2012–13 and 2014–15
Source: ABS and AIHW analysis of the 1994 NATSIS, 2002, 2008 and 2014–15 NATSISS and 2012–13 AATSIHS
Figure 2.15-3 Smoker status, Indigenous Australians aged 15 years and over, 2002, 2008, 2012–13 and 2014–15
Source: ABS and AIHW analysis of the 1994 NATSIS, 2002, 2008 and 2014–15 NATSISS and 2012–13 AATSIHS
Table 2.15-1 Proportion of current smokers by age, sex, remoteness area and state/territory, Indigenous Australians aged 15 years and over, 1994, 2002, 2008, 2012–13 and 2014–15
1994 2002 2008 2012–
13 2014–
15 Age
15–17 30 33 22 19 17
18–24 56 58 53 46 41
25–34 63 58 56 54 50
35–44 57 58 53 50 50
45–54 49 49 48 48 48
55+ 33 35 32 30 32
Sex
Male 55 53 49 46 45
Female 49 50 45 42 39
Persons 52 51 47 44 42
Remoteness area
Major cities 52 48 42 39 36
Inner regional 53 52 45 44 40
Outer regional 50 51 49 41 42
Total non-remote 51 50 45 41 39
Remote 54 53 50 49 51
Very remote 52 56 55 56 53
Total remote 53 55 53 53 52
State/Territory
NSW 53 53 48 42 40
Vic 59 54 48 44 41
Qld 50 51 44 43 41
WA 51 48 44 43 46
SA 58 48 48 42 41
Tas 49 44 45 40 38
ACT 43 45 36 30 39
NT 50 56 53 54 49
Australia 52 51 47 44 42 Source: ABS and AIHW analysis of the 1994 NATSIS, 2002, 2008 and 2014–15 NATSISS and 2012–13 AATSIHS
Figure 2.15-4 Relationship between being a non-smoker and selected social factors, Indigenous Australians 15 years and over, 2014–15
Source: ABS and AIHW analysis of the 2014–15 NATSISS
17
41
50 50 48
32
3
1720 18 19
11
0
10
20
30
40
50
60
15–17 18–24 25–34 35–44 45–54 55+
Per c
ent
Age group (years)
Aboriginal and Torres Strait Islander peoples Non-Indigenous Australians
50
5551
45
53
47
41
53
44
39
52
42
0
10
20
30
40
50
60
Non-remote Remote Australia
Per c
ent
Remoteness area
2002 2008 2012–13 2014–15
51
15
33
47
20
34
44
20
36
42
22
36
0
10
20
30
40
50
60
Current smokers Ex-smokers Never smoked
Per c
ent
Smoking status
2002 2008 2012–13 2014–15
81
50
72
52
71
47
65
47
0
10
20
30
40
50
60
70
80
90
100
Mos
t adv
anta
ged
Mos
t disa
dvan
tage
d
Year
12
Year
10
or b
elow
Hig
hest
Low
est
Empl
oyed
Une
mpl
oyed
Per c
ent
SEIFA EmploymentIncomeEducation
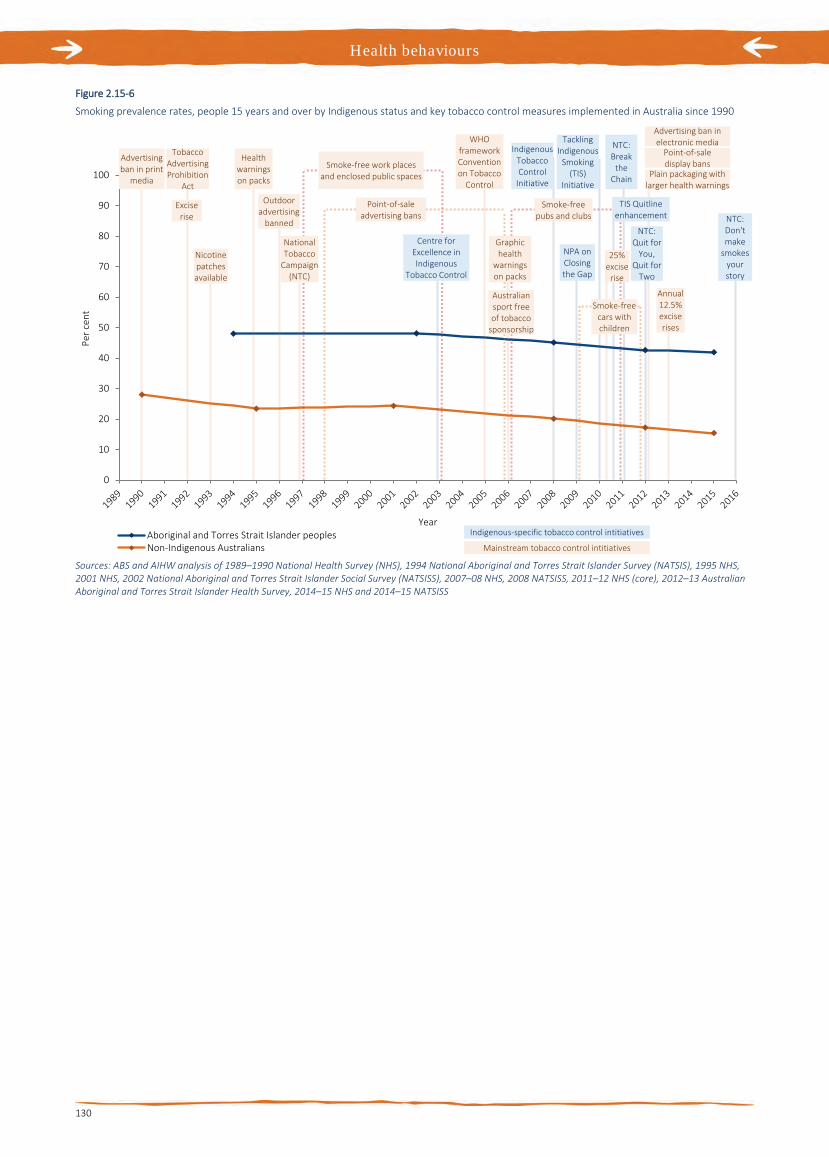
Health behaviours
130
Figure 2.15-6
Smoking prevalence rates, people 15 years and over by Indigenous status and key tobacco control measures implemented in Australia since 1990
Sources: ABS and AIHW analysis of 1989–1990 National Health Survey (NHS), 1994 National Aboriginal and Torres Strait Islander Survey (NATSIS), 1995 NHS, 2001 NHS, 2002 National Aboriginal and Torres Strait Islander Social Survey (NATSISS), 2007–08 NHS, 2008 NATSISS, 2011–12 NHS (core), 2012–13 Australian Aboriginal and Torres Strait Islander Health Survey, 2014–15 NHS and 2014–15 NATSISS
0
10
20
30
40
50
60
70
80
90
100
Per c
ent
YearAboriginal and Torres Strait Islander peoplesNon-Indigenous Australians
Advertisingban in print
media
Excise rise
Tobacco AdvertisingProhibition
Act
Nicotinepatches available
Health warningson packs
National Tobacco
Campaign (NTC)
Smoke-free work places and enclosed public spaces
Point-of-saleadvertising bans
Outdooradvertising
banned
Centre forExcellence in Indigenous
Tobacco Control
WHO framework Convention on Tobacco
Control
Indigenous Tobacco Control
Initiative
Smoke-free pubs and clubs
Graphic health
warnings on packs
Australiansport free of tobacco
sponsorship
NPA on Closing the Gap
Tackling Indigenous
Smoking (TIS)
Initiative
Smoke-free cars with children
25% excise
rise
NTC: Break
the Chain
Advertising ban in electronic media
Plain packaging with larger health warnings
Point-of-saledisplay bans
TIS Quitline enhancement
NTC: Quit for
You, Quit for
Two
Annual 12.5% excise rises
NTC: Don't make
smokes your story
Mainstream tobacco control intitiatives
Indigenous-specific tobacco control intitiatives

Health behaviours
131
2.16 Risky alcohol consumption Why is it important? Excessive consumption of alcohol is associated with health and social problems in all populations. Long-term excessive alcohol consumption is a major risk factor for conditions such as liver disease, pancreatitis, heart disease, stroke, diabetes, obesity and cancer. It is also linked to social and emotional wellbeing, mental health and other drug issues (NHMRC, 2009). Where mothers have consumed alcohol during pregnancy, babies may be born with Foetal Alcohol Spectrum Disorders (FASD) (Telethon Institute for Child Health Research, 2009).
Binge drinking contributes to injuries and death due to suicide, transport accidents, violence, burns and falls. For the general population, one-third of suicides for men and women and one-third of motor vehicle deaths for men have been linked to alcohol consumption (NHMRC, 2009). Alcohol abuse can also affect families and communities. It has the potential to lead to anti-social behaviour, violence, assault, imprisonment and family breakdown (NHMRC, 2009).
The 2011 Burden of Disease study estimated that alcohol harm accounts for 8% of the total burden of disease and injury for Indigenous Australians. Among the risk factors considered, alcohol was responsible for the greatest burden of disease and injury for Indigenous males aged 15–44 years and was also the leading cause for females aged 15–24 (AIHW, 2016f).
Findings The National Health and Medical Research Council (NHMRC) states that ‘drinking no more than two standard drinks on any day reduces the lifetime risk of harm from alcohol-related disease or injury’ and that ‘drinking no more than four standard drinks on a single occasion reduces the risk of alcohol-related injury arising from that occasion’ (NHMRC, 2009).
The 2014–15 Social Survey collected self-reported data on those who exceeded the NHMRC lifetime and single occasion risk guidelines. Based on the survey, 40% of Indigenous Australians aged 15 years and over had abstained from alcohol in the previous 12 months.
Comparisons between Indigenous and non-Indigenous Australians are only available from the 2012–13 Health Survey. After adjusting for differences in the age structure of the two populations, Indigenous Australians were 1.6 times as likely to abstain from alcohol as non-Indigenous Australians.
In 2014–15, 31% of Indigenous Australians exceeded the single occasion guidelines (binge drinking) at least once in the last two weeks. Rates of binge drinking were higher for Indigenous males (41%) than females (22%), and were similar between remote and non-remote areas (41%). The binge drinking rate for Indigenous Australians declined significantly between 2008 and 2014–15 (from 38% to 31%), following a significant increase from the 2002 rate (35%).
In 2012–13, rates of binge drinking at least once per week were 20% in remote areas and 18% in non-remote areas.
In 2014–15, 15% of Indigenous Australians aged 15 years and over drank at levels that exceeded the NHMRC lifetime risk guidelines. There was a significant decline in lifetime risky drinking between 2008 and 2014–15 (from 19% to 15%).
In the 2012–13 Health Survey, Indigenous rates for exceeding the single occasion risk guidelines were 1.1 times the non-Indigenous rates, while for the lifetime risk there was no significant difference.
The 2012–13 Health Survey data, based on 24-hour recall, shows that the median amount of alcoholic beverages consumed was more than twice as high among Indigenous consumers (equivalent to 3 bottles of beer or 1.5 bottles of wine) than non-Indigenous consumers (equivalent to 1.2 bottles of beer or almost 5 glasses of wine). The median amount of alcoholic beverages consumed by Indigenous adults was higher in remote areas (1,717 grams) than non-remote areas (1,007 grams).
Excess alcohol consumption has significant impacts on communities. In 2014–15, 19% of Indigenous Australians aged 15 years and over reported experiencing a family stressor related to alcohol problems. The rate was higher in remote areas (23%) than non-remote areas (18%). One study in NSW found that, after controlling for social and demographic variables, rates of offensive behaviour and property damage tended to be higher in areas with higher levels of alcohol sales (Stevenson et al, 1999). There is a clear link between alcohol, violence and imprisonment (see measure 2.11).
Survey data provides an indication of the prevalence of alcohol consumption, but under-estimates actual consumption. Furthermore, it cannot be assumed that patterns of consumption are uniform across geographic regions (Stockwell et al, 2004). After considering a range of evidence, a review by Wilson and colleagues estimated the prevalence of harmful alcohol use in the Aboriginal and Torres Strait Islander population at twice that of the non-Indigenous population (Wilson, M et al, 2010).
Over the period 2011–15, in NSW, Qld, WA, SA and the NT combined, Indigenous males died from alcohol-related causes at 5 times the rate of non-Indigenous males, and Indigenous females at 6 times the non-Indigenous rate. Most deaths (300 out of 441 deaths) were due to alcoholic liver disease. Indigenous females were 7 times as likely as non-Indigenous females to have died from alcoholic liver disease. The age-standardised alcohol-related death rate among Indigenous Australians fell from 32 deaths per 100,000 in 1998 to 24 deaths per 100,000 in 2015 and the gap between Indigenous Australians and non-Indigenous Australians narrowed.
Over the period July 2013 to June 2015, there were 9,816 hospitalisations of Indigenous Australians with a principal diagnosis related to alcohol use. This represented 2% of all hospitalisations of Indigenous Australians (excluding dialysis). Rates were highest in remote areas (15 per 1,000) and lowest in inner regional areas (5 per 1,000). Indigenous males and females were hospitalised for diagnoses related to alcohol use at 4 times the rate of non-Indigenous males and females respectively. Acute intoxication was the most common reason Indigenous Australians were hospitalised for alcohol use (59%), followed by dependence syndrome (12%), alcoholic liver disease (10%), and withdrawal (10%). Indigenous Australians were hospitalised for acute intoxication at 11 times the rate of non-Indigenous Australians and for alcoholic liver disease at 6 times the rate. Between 2004–05 and 2014–15 hospitalisation rates relating to alcohol use increased for Indigenous females (5 to 7 per 1,000 population) and Indigenous males (10 to 11 per 1,000 population).
Implications The health effects of excess alcohol consumption are evident in both mortality and morbidity statistics. Reducing alcohol abuse can result in fewer assaults and less disability and improve the health and wellbeing of the population.
An evaluation of NSW ‘Lockout’ laws, including earlier cessation of alcohol, at venues in Sydney’s CBD and Kings Cross entertainment precincts found a subsequent reduction in assaults in Kings Cross (down 32%) and in the Sydney CBD (down 26%) (Menéndez et al, 2015). Reducing the number of alcohol sales outlets may also be effective, with a halving in the number of assaults in Aurukun attributed to the phased closure of the Aurukun tavern (Dept. of Social Services, 2012).
The National Drug Strategy (NDS) 2010–2015 provides the framework for an integrated and coordinated approach across all levels of government to reduce

Health behaviours
132
drug-related harm and drug use in Australia. The next NDS 2016–2025 is currently under development. The National Aboriginal and Torres Strait Islander Peoples Drug Strategy (NATSIPDS) 2014–2019 has been developed as a sub-strategy of the NDS 2010–2015. The goal of the strategy is to improve the health and wellbeing of Aboriginal and Torres Strait Islander people by preventing and reducing the harmful effects of alcohol and drugs on individuals, families, and their communities. The strategy has been informed by community consultation. In addition, a National Alcohol Strategy is currently being developed, and will complement the next NDS 2016–2025.
Australian Government funding for combatting alcohol and substance misuse includes support for a range of alcohol and other drug treatment services across Australia (see measure 3.11). Funding is provided through the Substance Misuse Service Delivery Grants Fund and Non-Government Organisation Treatment Grants Programme (administered by the
Department of Health), Primary Health Networks, and the Indigenous Advancement Strategy—Safety and Wellbeing Programme (administered by the Department of the Prime Minister and Cabinet).
In addition, through the new National Partnership on Northern Territory Remote Aboriginal Investment the Australian Government is providing around $91.5 million (over 7 years) to tackle the harms caused by alcohol and other drugs in the Northern Territory.
On 25 June 2014, the Australian Government announced funding of $9.2 million for the National Fetal Alcohol Spectrum Disorders (FASD) Action Plan, which includes funding for Indigenous specific prevention and promotion activities. The FASD Action Plan is directed at the frontline of dealing with risky alcohol consumption—providing better diagnosis and management, developing best practice interventions, and services to support high-risk women. A review of 22 programmes in the US has found that pre-natal health
screening followed by empathetic interventions by health professionals was effective in reducing alcohol use during pregnancy (AIHW & AIFS, 2014b).
Various strategies are in place in states/territories across Australia. For example, the Foetal alcohol spectrum disorder (FASD) prevention program is a project in the Kimberly region run by the Ord Valley Aboriginal Health Service. The programme applies innovative strategies in providing education and support of antenatal clients and their families, as well as education sessions to students in the region.
Strong Spirits, Strong Minds is a media campaign that aims to prevent and/or delay the early uptake of alcohol and other drugs by young Aboriginal people in the Perth metropolitan area, and was developed with input from an Aboriginal youth advisory panel. The project evaluation results indicate it is a highly effective and successful strategy (Holman & Joyce, 2014).
Figure 2.16-1 Alcohol risk levels by Indigenous status, persons aged 15 years and over, age-standardised, 2012–13
Note: Alcohol consumption levels are not comparable between the 2012–13 AATSIHS and 2014–15 NATSISS Source: ABS and AIHW analysis of 2012–13 AATSIHS
Figure 2.16-2 Indigenous Australians aged 15 years and over who exceeded single occasion risk guidelines, by remoteness area and sex, 2014–15
Source: ABS and AIHW analysis of 2014–15 NATSISS
Figure 2.16-3 Alcohol risk levels, Indigenous Australians aged 15 years and over, 2002, 2008 and 2014–15
Source: ABS and AIHW analysis of 2002, 2008 and 2014–15 NATSISS
Figure 2.16-4 Age-standardised rates for deaths related to alcohol use, NSW, Qld, WA, SA and the NT, 2011–15
Source: ABS and AIHW analysis of National Mortality Database
0
20
40
60
Abstainers Exceeded singleoccasion guideline
Exceeded lifetimerisk guideline
Per c
ent
Aboriginal and Torres Strait Islander peoples Non-Indigenous Australians
3032 31
41
22
0
5
10
15
20
25
30
35
40
45
Non-remote Remote Australia Males Females
Per c
ent
Remoteness Area Sex
3835
17
3638
19
40
31
15
0
10
20
30
40
50
Abstained Exceeded singleoccasion guideline
Exceeded lifetime risk guideline
Per c
ent
2002 2008 2014-15
0
2
4
6
8
10
12
14
16
Alcoholic liverdisease
Mental & behaviouraldisorders due to
alcohol use
Poisoning byalcohol
Deat
hs p
er 1
00,0
00 p
opul
atio
n
Cause of deathAboriginal and Torres Strait Islander peoples Non-Indigenous Australians

Health behaviours
133
2.17 Drug and other substance use including inhalants Why is it important? Drug and other substance use is a contributing factor to illness and disease, accident and injury, violence and crime, family and social disruption and workplace problems (SCRGSP 2014a). Estimates of the burden of disease and injury in Aboriginal and Torres Strait Islander peoples attribute 3.7% of the total burden to drug use (AIHW, 2016f).
Substance use is often associated with mental health problems (Catto & Thomson, 2008) and has been found to be a factor in suicides (Robinson, G et al, 2011). The use of drugs or other substances including inhalants is linked to various medical conditions. Injecting drug users, for example, have an increased risk of contracting blood-borne viruses such as hepatitis or HIV (Kratzmann et al, 2011) and around half of heroin and opioid users report overdosing (Catto & Thomson, 2008).
For communities, there is increased potential for social disruption, such as that caused by domestic violence, crime and assaults. Research has identified relationships with loss of control and abusive behaviour, ranging from physical to emotional violence (Franks, 2006). Alcohol and substance use has been found to be a factor in assault (Mitchell, 2011; Mouzos & Makkai, 2004). Risky sexual behaviour is associated with alcohol and illicit drug use, leading to increased STIs among younger people (Wand et al, 2016). Drugs and other substance use play a significant role in Aboriginal and Torres Strait Islander peoples’ involvement in the criminal justice system (see measure 2.11).
Glue sniffing, petrol sniffing, inhalant abuse and solvent abuse are difficult to control because the active substances are found in many common products that have legitimate uses. People who use these products as inhalants risk long-term health problems or sudden death. Continued use can also lead to the social alienation of those who sniff, violence and reduced self-esteem (Karam et al, 2014; Midford et al, 2011). There is also reported high use of kava in some Arnhem Land communities (Clough et al, 2002).
Findings The latest data on substance use for Aboriginal and Torres Strait Islander peoples comes from the 2014–15 Social Survey. Data was collected on substance use in the last 12 months for those aged 15 years and over. In 2014–15, 31% of Indigenous
Australians aged 15 years and over reported having used drugs and other substances in the last 12 months, an increase from 2008 (23%). These increases were found in both remote areas (from 17% in 2008 to 21% in 2014–15), and non-remote areas (from 24% to 33%). Substance use was higher in non-remote areas (33%) compared with remote areas (21%). Longer time-series data between 2002 and 2014–15 is limited to non-remote areas only. Between 2002 and 2014–15, there was an increase in substance use in the last 12 months, from 26% to 33%. In 2014–15, Indigenous males had higher rates for recent use in the last 12 months (34%) compared with Indigenous females (27%).
Comparisons with non-Indigenous Australians are available from the National Drug Strategy Household Survey, which included a small sample of Indigenous Australians. According to this survey, in 2013 Indigenous Australians aged 14 years and over were 1.5 times as likely to report using substances in the last 12 months compared with non-Indigenous Australians (around 23% and 15% respectively) (AIHW, 2014f). Between 2001 and 2013 the proportion of non-Indigenous Australians who used substances in the last 12 months did not show a clear trend. There was an increase for those who had ever used substances over this period (from 37% to 41%).
Cannabis was the most common illicit substance used in the last 12 months for Aboriginal and Torres Strait Islander peoples (19%), followed by pain-killers or analgesics for non-medical use (12%) and amphetamines/speed/ice (5%). Approximately 21% of Indigenous Australians reported having used one substance in the last 12 months and 10% two or more substances.
Between 2008 and 2014–15, there was a significant increase in the proportion of the Indigenous population who had used marijuana in the last 12 months in remote areas (14% to 18%), but no change in non-remote areas or overall. In this period, there was a large increase in the use of pain-killers or analgesics for non-medical purposes (5% to 12%) and in the use of tranquilisers or sleeping pills for non-medical uses (1.4% to 3.4%). There was an increase in the use of amphetamines or speed (including ice), between 2012–13 and 2014–15 (2.4% to 4.8%).
In 2014–15, 17% of Indigenous Australians aged 15 years and over reported drug-related problems as a stressor experienced by self, family or friends in the last 12 months with rates similar for females and males (18% and 15% respectively) and across remote and non-remote areas (17% and 16%). Indigenous Australians reported alcohol or drug-related problems as a
personal stressor at 1.3 times the rate of non-Indigenous Australians.
Results from a 2011–13 Goanna study on sexual and drug-related risk among Indigenous Australians aged 16–29 years found that 37% had used an illicit substance in the last year. Cannabis was the most frequently used drug; around one-third of respondents had used this drug in the previous 12 months. Weekly or more frequent use of cannabis reported by 18% of participants in urban areas, 22% in regional and around 14% in remote areas reported (note the remote sample was small and results should be interpreted with caution). Around 10% reported using ecstasy in the last year, followed by amphetamines (9%) and cocaine (4%). Injecting drug use was reported by 3% of respondents, with methamphetamine (37%), heroin (36%) and methadone (26%) being the most commonly injected drugs. In urban and regional areas, frequent drug use was more likely among those who had been in prison, had lower levels of education and had sought advice on alcohol and other drug use (Bryant et al, 2016).
In 2014–15, a higher proportion of Indigenous Australians aged 15 years and over who were recent substance users reported they were current smokers (60%) and drank at levels exceeding the single occasion risk (45%) than Indigenous persons who had not recently used illicit substances (33% and 25% respectively). Approximately 4% of mothers with a child aged 0–3 years reported having used substances during pregnancy in 2014–15.
A 2014 study of 41 Aboriginal communities in the NT, WA and SA found 204 people were currently sniffing petrol, a decline of 29% since 2011–12 (d'Abbs & Shaw, 2013). Nearly 80% of people sniffing were male and over half were aged 15–24 years. There was a significant reduction in the prevalence of petrol sniffing in 17 communities with time-series data following the introduction of low aromatic fuel in those communities. Across the sample there were 647 people sniffing petrol in 2005–06, dropping to 98 in 2011–12 and declining to 78 by 2013–14, an 88% decrease in the number of people sniffing between baseline and the current survey. The report indicates that petrol sniffing levels have dropped in regions where there has been an uptake of low aromatic fuel and that the regions with the highest levels of sniffing are those where regular unleaded petrol is still available (d'Abbs & Shaw, 2016). Between 2007–08 and 2011–12, there was a steady decline in the number of people sniffing petrol across all age groups, and between 2011–12 and 2013–14 only among those aged 15–24 years. A very slight increase across other

Health behaviours
134
age groups occurred between 2011–12 and 2013–14.
For the period July 2013 to June 2015, there were 8,455 hospitalisations of Indigenous Australians related to substance use. Indigenous Australians were hospitalised for conditions related to substance use at rates 2.7 times as high as non-Indigenous Australians.
The Drugs Use Monitoring in Australia programme run by the Australian Institute of Criminology reports on drug use among police detainees at 5 police stations in metropolitan areas in SA, NSW, Qld and WA. In 2015, the proportion of detainees that tested positive for drugs was higher for Indigenous detainees than for non-Indigenous detainees in all police stations surveyed. Cannabis was the most frequently detected drug.
Implications In 2014–15, around 3 out of every 10 Aboriginal and Torres Strait Islander peoples aged 15 years and over had used substances in the last 12 months. Higher rates of substance use are related to a lack of housing security and low income.
The National Drug Strategy (NDS) 2010–2015 provides the framework for an integrated and coordinated approach
across all levels of government that aims to reduce drug-related harm and drug use in Australia, with the next NDS 2016–2025 currently under development. The National Aboriginal and Torres Strait Islander Peoples Drug Strategy (NATSIPDS) 2014–2019 has been developed as a sub-strategy of the NDS, and provides a guide for governments, communities, service providers and individuals to identify priority areas for action relating to the harmful use of alcohol and other drugs (AOD). The strategy builds on the national framework provided by the NDS, and has been informed by community consultation.
In 2015, all governments agreed to the National Ice Action Strategy which will see a joint national focus on tackling ice use in Australia, prioritising families and communities who are most affected. As part of the response to the National Ice Taskforce’s Final Report, $241.5 million has been allocated to Primary Health Networks to commission additional AOD treatment services. Of this, $78.6 million has been allocated specifically for AOD treatment services for Aboriginal and Torres Strait Islander people.
Other Australian Government programmes that provide funding for combatting alcohol and other substance misuse (see measure
3.11) include the Indigenous Australians’ Health Programme; the Substance Misuse Service Delivery Grants Funds; the Non-Government Organisation Treatment Programme and the Indigenous Advancement Strategy (IAS).
The IAS provides for Indigenous AOD treatment services and the continuation of the rollout of low aromatic fuel to combat the effects of petrol sniffing. In 2015, legislative changes to the Low Aromatic Fuel Act 2013 prohibited the supply and sale of regular unleaded petrol in three locations (Katherine and Tennant Creek in the NT and Palm Island in Qld) to mitigate the negative impacts of petrol sniffing and help reduce the potential harm to the health of people in those locations.
In WA, the Strong Spirits, Strong Minds campaign aims to prevent and/or delay the early uptake of alcohol and other drugs by young Aboriginal people in the Perth metropolitan area. This multi-faceted communication strategy includes mainstream mass communication channels to deliver Aboriginal specific messages. The project was developed from a strong cultural foundation with input from an Aboriginal youth advisory panel, with evaluation results indicating it is a highly effective and successful strategy.
Table 2.17-1 Aboriginal and Torres Strait Islander peoples aged 15 years and over, substance use by remoteness and sex, 2014–15
Used substances in last 12 months Non-remote
areas Remote
areas Males Females Persons
Per cent
Marijuana, hashish or cannabis resin 19.6 18.4 25.3 13.8 19.2
Pain-killers or analgesics for non-medical use 14.7 2.5 9.6 14.1 12.0
Amphetamines or speed 5.9 0.7 6.4 3.2 4.8
Tranquilisers or sleeping pills for non-medical use 4.3 0.6 3.1 3.7 3.4
Kava 1.2 0.7 1.6 0.8 1.2
Other(a) 6.0 1.0 6.8 3.4 5.0
Total used substances in last 12 months 33.2 20.9 34.2 27.3 30.6
Has not used substances in last 12 months 66.9 79.2 65.7 72.7 69.5
Total 100 100 100 100 100
Persons who accepted form ('000) 318 86 191 213 404
Persons 15 years and over ('000) 347 97 213 231 443
Source: AIHW and ABS analysis of 2014–15 NATSISS

Health behaviours
135
2.18 Physical activity Why is it important? Physical activity can be defined as a bodily movement produced by the muscles resulting in energy expenditure, and can include organised or incidental activity (AIHW, 2010a). Physical inactivity is an important modifiable risk factor associated with several potentially preventable chronic diseases that are prevalent in the Aboriginal and Torres Strait Islander population. These diseases include cardiovascular disease, cancer, stroke, hypertension and diabetes (Gray, C et al, 2013; Wilmot et al, 2012; AIHW, 2012b). Physical inactivity is also related to overweight and obesity, another important risk factor for multiple preventable diseases.
In 2011, physical inactivity accounted for 5.5% of the total burden of disease in the Indigenous population and 8.2% of the health gap with non-Indigenous Australians (AIHW, 2016f). Physical inactivity is the fourth leading risk factor in the Indigenous population, after smoking, alcohol and high body mass. Its effect is manifested through a range of diseases. Notably, this study found that 44% of the coronary heart disease burden and also 36% of the diabetes burden were attributable to physical inactivity.
Current guidelines (Dept. of Health, 2017) recommend that children aged 2–4 years are physically active for at least 3 hours every day; that children aged 5–17 years do at least 60 minutes per day of moderate to vigorous intensity physical activity; that adults aged 18–64 years accumulate 150 to 300 minutes (2 ½ to 5 hours) of moderate intensity physical activity or 75 to 150 minutes (1 ¼ to 2 ½ hours) of vigorous intensity physical activity per week; and that adults aged over 65 years accumulate at least 30 minutes of moderate intensity physical activity on most days. The guidelines also recommend minimal time spent sitting (sedentary behaviour) for all ages. Katzmarzyk et al. (2009) found an increased risk of mortality with higher levels of sitting time regardless of whether sufficient physical activity was undertaken.
Research has established inverse associations between physical activity with fat mass and biomedical risk factors for chronic disease (Ness et al, 2007; Steele et al, 2009; White, SL et al, 2011), and studies have confirmed that activity reduces the risk for heart disease (Stephenson et al, 2000; Bull et al, 2004; Sattelmair et al, 2011), high blood pressure (Kokkinos et al, 2001), diabetes (NHF, 2006) and the symptoms of depression, anxiety and stress (WHO, 2010; Moylan et al, 2013)(WHO 2010; Moylan et al. 2013). Physical activity has physical and psychological benefits for
the management and treatment of chronic conditions (Adami et al, 2010; Holmes et al, 2005; NHF, 2006).
Findings The most recent data on physical activity is from the 2012–13 Health Survey, which collected information on walking for exercise/transport and moderate and vigorous physical activity in the week prior. While information was collected in both remote and non-remote areas, results are not comparable due to differing methodologies across areas.
In 2012–13, 38% of Indigenous adults in non-remote areas had undertaken a sufficient level of physical activity in the week prior (at least 150 minutes over 5 or more sessions). Rates of sufficient activity were higher for Indigenous males (43%) than for Indigenous females (33%). After adjusting for differences in the age structure of the two populations, Indigenous adults were less likely than non-Indigenous adults to have met sufficient activity levels in the last week (rate ratio of 0.8), and more likely to be inactive (rate ratio of 1.3). Younger Indigenous Australians were more likely to be sufficiently active and activity levels declined with age; 48% aged 18–24 years were sufficiently active compared with 27% aged 55 years and over.
After adjusting for differences in the age structure between the two populations, Indigenous adults spent 1.7 times the time walking for transport than non-Indigenous adults (average of 143 minutes compared with 83 minutes per week) and less time on walking for fitness (0.8 times) and moderate or vigorous physical activity (0.7 and 0.8 times respectively). Indigenous adults spent 1.3 times the time spent by non-Indigenous adults on watching television or videos and less time using a computer/internet (0.6 times) and sitting for transport (0.8 times). In a pedometer study done as part of 2012–13 Health Survey, 17% of Indigenous adults did the required 10,000 steps per day on average. More than half (55%) of Indigenous adults in remote areas spent more than 30 minutes in the previous day undertaking physical activity/walking; 20% spent less than 30 minutes and 21% did no physical activity.
In 2012–13, 82% of Aboriginal and Torres Strait Islander children aged 2–4 years in non-remote areas met the recommendations of at least 3 hours of physical activity per day. Average time spent in physical activity was similar for Indigenous and non-Indigenous children aged 2–4 years, although Indigenous children spent more time outdoors (3.5 hours compared with 2.8 hours per day on average).
Nearly half (48%) of Indigenous children aged 5–17 years in non-remote areas met the recommended physical activity guidelines, at a much higher rate than for non-Indigenous children (35%). Indigenous children were 1.4 times as likely as non-Indigenous children to have met both the physical activity and screen-based guidelines in the three days prior (25% compared with 18%). One in four Indigenous children met the threshold of 12,000 steps per day (on average), similar to non-Indigenous children. In 2012–13, 82% of Aboriginal and Torres Strait Islander children aged 5–17 years in remote areas did more than 60 minutes of physical activity on the day prior (only 4.1% did no physical activity).
Aboriginal and Torres Strait Islander adults who were sufficiently active were less likely to be obese (31%) than those who were inactive (56%). Indigenous adults with educational qualifications of Year 12 or above were 1.5 times as likely to have done sufficient physical activity as those with below Year 10 (44% compared with 29%). Indigenous adults in non-remote areas who described their health as excellent or very good were 1.7 times as likely to have done sufficient physical activity as those with fair/poor self-assessed health.
Implications Low levels of physical activity were reported by nearly 3 in 5 Aboriginal and Torres Strait Islander people aged 18 years and over in non-remote areas in 2012–13. Higher rates of sedentary behaviours are associated with an increased risk of chronic disease. Improving levels of physical activity presents a significant opportunity for health improvements and for reducing the health gap between Indigenous and non-Indigenous Australians.
Thompson et al. (2013) found that the concept of physical activity in remote NT communities was strongly linked to land and resource management and seasonal, family and cultural activities. Several studies have shown that high levels of incidental exercise can have health benefits (Ekblom-Bak et al, 2014; Samitz et al, 2011; Duvivier et al, 2013).
Under the Safety and Wellbeing Programme (part of the Indigenous Advancement Strategy), funding is provided to support community participation in sport and active recreation activities to bolster improved health and physical wellbeing outcomes, along with broader social benefits for participants and their communities. The programme's objectives are: reduced substance misuse and harm; crime prevention, diversion and rehabilitation; violence reduction and victim support; safe and functional environments and social and emotional wellbeing.

Health behaviours
136
Participation in community sports and recreation programmes can have many positive benefits, including: improvements in school retention; attitudes towards learning, social and cognitive skills; physical and mental health and wellbeing; increased social inclusion and cohesion; increased validation of and connection to culture; and crime reduction (Ware & Meredith, 2013).
The National Aboriginal and Torres Strait Islander Health Plan (2013–2023) Implementation Plan includes identifying new evidence-based research and strategies to support physical activity choices.
The Australian Government revised physical activity and sedentary behaviour guidelines for children, young people and adults in February 2014 following a review of the recent and best available evidence concerning the relationship between physical activity, sedentary behaviour and a range of health outcome indicators, including the risk and prevention of chronic disease and obesity.
Move Well Eat Well (primary schools and early childhood settings) in Tasmania aims to improve the policies and practices in these settings to support nutrition and physical activity.
Increased physical activity opportunities are available in disadvantaged communities through implementation of the Get Active Program. A systematic review and meta-analysis demonstrated that programmes with a group delivery mode significantly increase physical activity among women experiencing disadvantage and group delivery should be considered an essential element of physical activity promotion programmes targeting this population group.
Figure 2.18-1 Persons aged 18 years and over, level of physical activity, by Indigenous status, non-remote areas, 2012–13
Source: 2012–13 AATSIHS (ABS, 2014)
Figure 2.18-2 Indigenous persons aged 18 years and over reporting a sufficient level of physical activity, by age-group and sex, non-remote areas, 2012–13
Source: 2012–13 AATSIHS (ABS, 2014)
Figure 2.18-3 Persons aged 5–17 years, whether met physical activity recommendations by Indigenous status, non-remote areas, 2012–13
Source: 2012–13 AATSIHS (ABS, 2014)
Figure 2.18-4 Persons aged 5–17 years, whether met screen-based activity recommendations by Indigenous status, non-remote areas, 2012–13
Source: 2012–13 AATSIHS (ABS, 2014)
2325
20
39 3936
3835
43
0
10
20
30
40
50
60
Indigenous Indigenous Non-Indigenous
Per c
ent
Inactive Insufficiently active Sufficiently active for health
Crude Age-standardised
48
39 39
31
27
43
33
0
10
20
30
40
50
60
18–24 25–34 35–44 45–54 55+ Males Females
Per c
ent
Age group (years) Sex
64
53
43
25
54
40
25
18
0
20
40
60
80
5–8 9–11 12–14 15–17
Per c
ent
Age group (years)
Aboriginal and Torres Strait Islander peoples Non-Indigenous Australians
53
44
38
31
56
44
33
26
0
10
20
30
40
50
60
5–8 9–11 12–14 15–17
Per c
ent
Age group (years)
Aboriginal and Torres Strait Islander peoples Non-Indigenous Australians

Health behaviours
137
2.19 Dietary behaviours Why is it important? Many of the principal causes of ill-health among Aboriginal and Torres Strait Islander peoples are nutrition-related diseases, such as heart disease, Type 2 diabetes and renal disease. While a diet high in saturated fats and refined carbohydrates increases the likelihood of developing these diseases, regular exercise and intake of fibre-rich foods, such as fruit and vegetables, can have a protective effect against disease (Wang, X et al, 2014). The National Health and Medical Research Council updated their Australian Dietary Guidelines in 2013. The guidelines specify recommendations for intake of food from the five food groups for good health, weight maintenance and the prevention of diet-related chronic diseases. They include recommendations for adequate minimum daily intake of fruit and vegetables. Recommended food consumption depends on age, and sex and life stage (e.g. pregnant, breastfeeding) (NHMRC, 2013a; ABS, 2014b).
The burden of disease study (AIHW, 2016f) attributed 9.7% of the total burden of disease in the Aboriginal and Torres Strait Islander population to 13 diet risk factors (joint effect) in 2011. Diet-related diseases are caused by combinations and interactions of environmental, behavioural, biological, social and hereditary factors. There is a substantial quantity of evidence that associates dietary excesses and imbalances with chronic disease. Of particular relevance in Indigenous communities are factors such as socio-economic status and other risk factors including insulin resistance, glucose intolerance, obesity (especially central fat deposition), hypertension, high blood triglycerides, perinatal and postnatal nutrition and childhood nutrition (NHMRC, 2000; Longstreet et al, 2008). Good maternal nutrition and healthy infant and childhood growth are fundamental to the achievement and maintenance of health throughout the life cycle. Inadequate nutrition during pregnancy is associated with low birthweight in babies (see measure 1.01). Growth retardation among Indigenous infants after the age of 4 to 6 months has consistently been noted (Bar-Zeev et al, 2013). Australian overweight/obesity rates have also increased from 56% of the adult population in 1995 to 63% in 2014–15 (ABS, 2015b).
Findings The latest data on dietary behaviours for Aboriginal and Torres Strait Islander peoples comes from the 2014–15 Social Survey. In 2014–15, 5% of Indigenous Australians aged 4–14 years and 4% of those aged 15 years
and over reported adequate daily fruit and vegetable intake.
For those aged 12 years and over, 47% were eating the recommended daily intake of fruit (2 serves) and 6% the recommended daily intake of vegetables (5–6 serves). The recommendations for minimum serves of fruit and vegetables were lower for children (around half of the adult recommendations). In 2014–15, 65% of Indigenous children aged 4–14 years met the recommended fruit intake and 6% the recommended vegetable intake.
The majority of Indigenous Australians aged 12 years and over reported eating at least one serve of vegetables daily (88%) and also at least one serve of fruit (75%). Between 2012–13 and 2014–15 (in non-remote areas), there has been an increase in the proportion of Indigenous Australians aged 12 years and over meeting the recommended daily vegetable intake (4.6% to 6.1%). There has also been an increase in adequate fruit intake, from 42% in 2012–13 to 46% in 2014–15.
In 2014–15, Indigenous children aged 2-4 years had the highest proportion of adequate daily fruit (87%) and vegetable (14%) intake. Adequate daily intake of fruit and vegetables was similar for Indigenous Australians aged 12 years and over in remote and non-remote areas. A higher proportion of Indigenous females aged 12 years and over reported adequate daily fruit and vegetable intake (6%) compared with Indigenous males (2%).
Comparisons to non-Indigenous Australians are only available through the 2012–13 Health Survey. After adjusting for differences in the age structure of the two populations, Indigenous Australians aged 12 years and over were 1.4 times as likely as non-Indigenous Australians to report less than one serve of fruit daily and 1.9 times as likely to report less than one serve of vegetables. Rates of recommended levels of daily fruit and vegetable intake were lower for Indigenous Australians than for non-Indigenous Australians (ratio of 0.9 for fruit and 0.8 for vegetables).
The nutrition component of the 2012–13 Health Survey found that 41% of total daily energy reported as consumed by Indigenous Australians was from discretionary foods, that is, foods considered to be of little nutritional value and which tend to be high in saturated fats, sugars, salt and/or alcohol (compared with 35% for non-Indigenous Australians) (ABS, 2015a). Median alcohol consumption was twice as high among Indigenous consumers than non-Indigenous consumers. Indigenous children aged 2–3 years were three times as likely as non-Indigenous children aged 2–3 years to have consumed Soft drinks, and flavoured mineral waters (18% compared with 5.8%). Indigenous
Australians in non-remote areas were more likely than those in remote areas to consume: fruit (49% compared with 35%) and soft drinks (39% compared with 32%); and less likely to consume meat dishes (74% in non-remote compared with 81% in remote areas). Indigenous Australians aged 2 years and over were more likely than non-Indigenous Australians to consume meat (76% compared with 69%), and snack foods (20% compared with 15%), soft drinks (37% compared with 29%); and less likely to consume vegetables (65% compared with 75%).
The 2014–15 Social Survey showed an association between dietary behaviour and other socio-economic and health characteristics. For example, Indigenous Australians aged 15 years and over who were employed were more likely than unemployed Indigenous Australians to report adequate fruit intake (48% compared with 39%).
Implications Evidence suggests that people living in poverty tend to maximise calories per dollar spent on food. Energy-dense foods rich in fats, refined starches and sugars represent the lowest-cost options, while healthy diets based on lean meats, whole grains and fresh vegetables and fruits are more costly (Drewnowski & Specter, 2004). People in vulnerable groups may therefore simultaneously be overweight or obese and experience food insecurity (AIHW, 2012a).
In 2012–13, 9% of Indigenous Australians aged 15 years and over went without food when they could not afford to buy more. Indigenous Australians were 7 times as likely as non-Indigenous Australians to go without food due to financial constraints in the previous 12 months. A person's access to a healthy diet can be influenced by a range of socio-economic, geographical and environmental factors. Food security, food access and food supply issues are of particular importance in rural and remote areas. Remote stores often have a limited range of foods, particularly perishable foods such as fresh fruit, vegetables and dairy foods, and purchase prices are usually higher (Pratt et al, 2014; Scelza, 2012; DAA, 2013). Low income combined with high food costs result in many Indigenous Australians spending a large proportion of their income on food and contributes to concerns about going without food (Brimblecombe & O’Dea, 2009).
In 2009–10, the National Aboriginal and Torres Strait Islander Nutrition Strategy and Action Plan (NATSINSAP) was evaluated to determine how effectively it was implemented and how it could be more effective and responsive to the current environment. The evaluation identified that the key achievements of NATSINSAP were in

Health behaviours
138
three of the seven priority action areas: food supply in remote and rural communities; disseminating and communicating good practice; and Aboriginal and Torres Strait Islander nutrition workforce. Some specific examples within these priority action areas include: the launch of the Remote Indigenous stores and takeaways resources; the development of nationally accredited nutrition training materials for Indigenous health workers; the revival of the National Nutrition Networks conference and development of an Indigenous nutrition web directory on the Australian Indigenous Health InfoNet.
The 2013 Australian Dietary Guidelines (‘the Guidelines’) provide evidence-based healthy eating advice for good health and the prevention of obesity and diet-related chronic diseases. The Guidelines apply to all population groups, including adults, children and adolescents, pregnant and breastfeeding women, older Australians, Aboriginal and Torres Strait Islander peoples and culturally and linguistically diverse groups. Supporting educational resources for consumers and health professionals include the Australian Guide to Healthy Eating for the general Australian population and the new Aboriginal and Torres Strait
Islander Guide to Healthy Eating. These resources provide visual advice on the proportion of the diet that should come from each of the five food groups each day.
In December 2014, the Australian Government launched the Health Star Rating system, which is a front-of-pack labelling system designed to help all grocery buyers make more nutritional choices when purchasing packaged foods. The system has been promoted through social marketing campaigns in December 2014, July–September 2015 and April–June 2016. All phases of the campaigns have incorporated specific media that targets Indigenous communities.
The Medical Outreach Indigenous Chronic Disease Programme (MOICDP) provides funding to support a wide range of health services that focus on the prevention, detection and management of chronic disease for Aboriginal and Torres Strait Islander people. MOICDP services include those provided by medical specialists, general practice, Aboriginal Health Workers, allied health workers and other health professionals. Access to nutrition and dietetic services in rural and remote areas are supported under the MOICDP.
In 2014, the Australian Government launched the Healthy Bodies Need Healthy Drinks resource package. This suite of culturally appropriate promotional materials encourages school-aged children, their families and communities to choose water instead of high-sugar drinks in an effort to prevent obesity, chronic disease and dental caries.
The Implementation Plan for the National Aboriginal and Torres Strait Islander Health Plan 2013–2023 recognises the importance of addressing the social and cultural determinants of health that contribute to poor dietary choices and poorer health outcomes, through coordinated whole-of-government action.
A range of state and territory initiatives are in place to address dietary behaviours. One example is the Move Well Eat Well which operates in primary schools and early childhood settings in Tasmania. This programme aims to improve the policies and practices in these settings to support nutrition and physical activity.
A description of policies and strategies relating to this measure are included in the Policies and Strategies section.
Figure 2.19-1 Whether met guidelines for adequate intake of fruit and vegetables, Indigenous Australians, by age, 2014–15(a)(b)
(a) Based on one serve of fruit for children aged 2–8 years and two serves for persons aged 9 years and over. (b) Based on two serves of vegetables for children aged 2–3 years, four serves for ages 4–8 years and five for persons aged 9 years and over with the exception of 18–49 year old males to eat six serves. Source: AIHW and ABS analysis of 2014–15 NATSISSS
Figure 2.19-2 Major food group consumption by Indigenous status, persons aged 2 years and over(a), 2012–13
(a) Alcohol data is for persons aged 19 years and over Source: ABS 2015
87
6662
56
4248
3943
52
14
5 6 4 4 6 6 6 9
0
20
40
60
80
100
Per c
ent
Age group (years)
Adequate fruit intake Adequate vegetable intake
90
69
75
46
50
60
32
32
15
87
76
65
56
54
46
25
19
20
0 10 20 30 40 50 60 70 80 90 100
Cereals
Meat
Vegetables
Fats and oils
Sugar products
Fruit
Confectionary
Alcoholic beverages
Snack foods
Per cent
Aboriginal and Torres Strait Islander peoples Non-Indigenous Australians
Health behaviours
139
2.20 Breastfeeding practices Why is it important? Breastfeeding is one of the most important human behaviours for the survival, growth, development and health of infants and young children. Early initiation (within the first hour after birth) and exclusive breastfeeding during the first month is associated with a reduced risk of neonatal morbidity and mortality (Khan et al, 2015). Breast milk is uniquely suited to the needs of newborns, providing nutrients readily absorbed by their digestive system and conferring both active and passive immunity. The National Health and Medical Research Council recommends exclusive breastfeeding for the first 6 months of life and that ideally breastfeeding continue until 12 months of age and beyond if the mother and child wish (NHMRC, 2013b).
Breastfeeding offers protection against many conditions, including sudden infant death syndrome (SIDS), diarrhoea, respiratory infections, middle ear infections and the development of diabetes in later life (Annamalay et al, 2012; Horta et al, 2015). Breastfeeding is associated with a lower risk of obesity later in childhood, and also provides health benefits for mothers including reduced risk of breast and ovarian cancer in premenopausal women (NHMRC, 2013b). Breastfeeding is associated with a reduced risk of otitis media in infants (Bowatte et al, 2015).For Aboriginal and Torres Strait Islander infants living in poor housing conditions (see measure 2.02), breastfeeding offers additional protection where hygiene practices required for sterilising bottles may not be easily achieved or maintained.
However, excessive alcohol consumption, substance use or smoking during lactation potentially pose risks to the baby and further research is needed on these relationships (Haastrup et al, 2014).
Findings New findings from the 2014–15 Social Survey show that 80% of Indigenous children aged 0–3 years have been breastfed. There has been no significant change in breastfeeding rates for Indigenous children aged 0–3 years between 2004–05 (80%) and 2014–15 (80%). Trends over time in Indigenous breastfeeding rates have ranged from 76% in 2008 to 83% in 2012–13. There is comparable data between Indigenous and non-Indigenous children for those aged 0–2 years. For this age group, 82% of Indigenous children have been breastfed compared with 86% of non-Indigenous children. Indigenous infants aged 0–2 years were 1.2 times as likely as non-Indigenous infants to have never been breastfed (18% compared with 14%).
Of those children aged 0–2 years who had been breastfed, Indigenous infants were more likely than non-Indigenous infants to have been breastfed for less than one month (15% compared with 10%). Likewise, Indigenous infants were less likely than non-Indigenous infants to have been breastfed for 12 months or more (4% compared with 12%).
The proportion of Indigenous infants aged 0–2 years who had been breastfed ranged from 98% in the NT to 75% in Victoria. In the NT the Indigenous breastfeeding rate was higher than the non-Indigenous rate (98% compared with 81%).In other jurisdictions the Indigenous rate was similar or lower than the non-Indigenous rate. For example, in Qld the proportion of Indigenous infants who had been breastfed (86%) was on par with the non-Indigenous rate (84%). In major cities, the Indigenous breast feeding rate was 73% compared with 91% in very remote areas.
It is not possible to derive exclusive breastfeeding rates from the 2014–15 Social Survey results. In 2010, the Australian National Infant Feeding Survey found comparative rates of exclusive breastfeeding between Indigenous and non-Indigenous children aged less than 1 month of age (59% of Indigenous children and 61% of non-Indigenous children). As infants increased in age the proportions of exclusive breastfeeding declined for both Indigenous and non-Indigenous children, but the Indigenous decline was steeper than the non-Indigenous one. By the recommended age of up to 6 months, only 7% of Indigenous infants were exclusively breastfed compared with 16% of non-Indigenous infants. The Infant Feeding Survey found that almost a third (31%) of Indigenous infants had received soft, semi-solid or solid food by the age of 3 months, compared with 9% of non-Indigenous infants of the same age. By age 5 months similar proportions of Indigenous and non-Indigenous infants had commenced weaning (70%).
For Indigenous infants the main reason given for ceasing breastfeeding was ‘not producing any/adequate milk supply’ (24%), followed by ‘felt it was time’ (17%) and ‘baby not satisfied’ (15%); a non-Indigenous comparison is not available. Maternal and paternal/family smoking is negatively associated with breastfeeding outcomes. Smoking affects the mother’s supply of milk, while exposure to passive smoking is also a factor in reduced duration of exclusive breastfeeding (Baheiraei et al, 2014; NHMRC, 2013b). In the 2014–15 Social Survey, 54% of Indigenous infants aged 0–3 years were living with a current daily smoker and 8% lived in a household with a daily smoker who smoked at home indoors (see measure 2.03).
Implications Opportunities to promote breastfeeding in partnership with Aboriginal and Torres Strait Islander families and communities exist in educational settings and within the health sector, particularly in antenatal and postnatal care. The Australian National Breastfeeding Strategy 2010–2015 was endorsed by Health Ministers in 2009. The strategy aims to protect, promote, support and monitor breastfeeding in Australia, and recognises the importance of breastfeeding support especially for priority groups. The Commonwealth is progressing work for renewing the breastfeeding strategy through the Council of Australian Government’s Health Council.
The strategy recognises the contribution of the New Directions: Mothers and Babies Services initiative for supporting breastfeeding and parenting skills which provides services at 136 sites across the country (see measure 3.01).
The More Targeted Approach campaign is aimed at reducing smoking prevalence among high-risk and hard-to-reach groups. Materials featuring Indigenous women have been included in the Quit For You, Quit For Two component, targeting pregnant women and their partners.
The Department of Health has coordinated the development of National Evidence-Based Antenatal Care Guidelines on behalf of all Australian governments. The Guidelines were developed for health professionals, with input from the Working Group for Aboriginal and Torres Strait Islander Women’s Antenatal Care to provide culturally appropriate guidance and information, to provide high-quality, evidence-based maternity care. The Guidelines will be updated by mid-2017.
The Australian Government provides funding for the Australian Breastfeeding Association to support the National Breastfeeding Helpline which offers a free call 24-hour service across all of Australia.
In Tasmania, the Tasmanian Breastfeeding Coalition protects, promotes and supports breastfeeding through actions based on the Australian National Breastfeeding Strategy. The Tasmanian Food and Nutrition Policy remains a relevant framework to guide action and investment for breastfeeding promotion and support.

Health behaviours
140
Figure 2.20-1 Children aged 0–2 years who were breastfed, by Indigenous status and remoteness, 2014–15
Source: AIHW and ABS analysis of 2014–15 NATSISS, 2014–15 NHS
Figure 2.20-2 Breastfeeding duration for children aged 0–2 years, by Indigenous status, 2014–15
Source: AIHW and ABS analysis of 2014–15 NATSISS, 2014–15 NHS
Figure 2.20-3 Children aged 0–2 years ever breastfed, by state/territory and Indigenous status, 2014–15
Source: AIHW and ABS analysis 2014–15 NATSISS, 2014–15 NHS
Figure 2.20-4 Exclusive breastfeeding duration to each month of age, by Indigenous status, 2010
Source: 2010 Infant Feeding Survey
Figure 2.20-5 Infants breastfed aged 0-3 years, by remoteness, Indigenous Australians, 2002, 2004-05, 2008, 2012-13 and 2014–15
Source: AIHW and ABS analysis of 2014–15 NATSISS
73
87 87
78
91
8287
78
9184
np
86
0
20
40
60
80
100
Majorcities
Innerregional
Outerregional
Remote Veryremote
Australia
Per c
ent
Remoteness area
Aboriginal and Torres Strait Islander children aged 0-2 yearsNon-Indigenous children aged 0-2 years
15
24
104
10
26
14 12
0
20
40
60
80
100
0 to less than1 month
1 to less than6 months
6 to 12months
12 monthsplus
Per c
ent
Age (months)
Aboriginal and Torres Strait Islander children aged 0–2 years Non-Indigenous children aged 0–2 years
7975
86
7783
78
98
878285 85 84 85
90
71
81
9386
0
20
40
60
80
100
NSW Vic Qld WA SA Tas NT ACT Australia
Per c
ent
Jurisdiction
Aboriginal and Torres Strait Islander children Non-Indigenous children
59
46
33
1911
7
6156
48
40
27
16
0
20
40
60
80
100
<1 <2 <3 <4 <5 <6
Per c
ent
Age (months)
Aboriginal and Torres Strait Islander children Non-Indigenous children
7985
8073
85
7682 84 83
7987
80
0
20
40
60
80
100
Non-remote Remote Australia
Per c
ent
Remoteness area
2004-05 2008 2012-13 2014-15

Health behaviours
141
2.21 Health behaviours during pregnancy Why is it important? Many lifestyle factors contribute to, and can have adverse effects on, the health and wellbeing of a woman and her baby during pregnancy and birth, as well as outcomes for children later in life.
Tobacco smoking increases the risk of pregnancy complications (e.g. miscarriage, placental abruption and premature labour); and poor perinatal outcomes such as low birthweight, intrauterine growth restriction, pre-term birth and perinatal death (Pringle et al, 2015; Hodyl et al, 2014; Wills & Coory, 2008; Laws & Sullivan, 2005; England et al, 2004). Maternal exposure to second hand smoke also increases these risks for babies (Crane et al, 2011) (see measure 2.03 for effects of second hand smoke exposure after birth). There is evidence that smoking cessation, particularly in the first trimester, can reduce these risks (Yan & Groothuis, 2015; Hodyl et al, 2014; Bickerstaff et al, 2012).
Drinking alcohol while pregnant may result in miscarriage, stillbirth, low birthweight, intrauterine growth restriction and prematurity and has been shown to result in a range of potentially lifelong physical, mental, behavioural and/or learning issues, collectively referred to as Foetal Alcohol Spectrum Disorders (FASD) (Mutch et al, 2015; Srikartika & O'Leary, 2015; France et al, 2010). Nationally, the true prevalence of FASD for Indigenous Australians is not known; estimates vary from 2.7 to 4.7 per 1,000 births (House of Representatives, 2012). A recent study in Fitzroy Valley found rates to be 120 per 1,000 children (Fitzpatrick et al, 2015). While existing research has limitations, risks of harm are said to increase with the amount and frequency of alcohol consumed (O'Leary et al, 2010). The NHMRC recommends not drinking alcohol during pregnancy as the safest option (NHMRC, 2009).
Use of illicit drugs (e.g. heroin, cannabis) and some licit drugs (e.g. medicines) during pregnancy can pose health risks to the mother (e.g. overdose and accidental injuries) as well as significant obstetric, foetal and neonatal complications (Kennare et al, 2005; Kulaga et al, 2009; Ludlow et al, 2004; Wallace, C et al, 2007) and behavioural and cognitive problems that emerge in later life (Passey et al, 2014).
Nutrition before and during pregnancy is also critical to foetal development (McDermott et al, 2009; Wen et al, 2010). Pregnant women and women considering pregnancy are advised to have a balanced diet. Maintenance of folate levels are particularly important to decrease risk of
neural tube defects such as spina bifida (AHMAC, 2012), which is twice as common among babies born to Indigenous women as those born to non-Indigenous women (AIHW NPSU, 2011). In addition to adverse birth outcomes, poor maternal nutrition has been linked with increased risk of developing insulin resistance and obesity in their children (Drake & Reynolds, 2010; Nelson, SM et al, 2010).
Findings According to 2014 perinatal data, 46% of Aboriginal and Torres Strait Islander mothers smoked during pregnancy. Nationally (excluding Vic), between 2006 and 2014 the smoking rates among Indigenous mothers declined by 13% (from 54% to 46% respectively). After adjusting for the different age structures of the two populations, Indigenous mothers were 3.6 times as likely to smoke during pregnancy as non-Indigenous mothers. In 2014, Indigenous mothers were half as likely to stop smoking during pregnancy as non-Indigenous mothers (12% compared with 24%).
Further to this, 2014 perinatal data showed no clear pattern of smoking by age group for Indigenous mothers (and teenage mothers were not the group with the highest rate). For non-Indigenous mothers, those under 20 years of age had the highest rate of smoking (30%), followed by 20–24 year olds (20%) and was between 6% and 10% for the age groups 25 years and over. For Indigenous mothers smoking rates were lower in major cities (41%) compared with 51% in very remote areas.
A multivariate analysis of 2012–14 perinatal data indicates that, excluding pre-term and multiple births, 51% of low birthweight babies born to Indigenous mothers were attributable to smoking during pregnancy, compared with 16% for other mothers. After adjusting for age differences and other factors, it was estimated that if the Indigenous maternal smoking rate was the same as that of other mothers, the proportion of low birthweight babies could be reduced by 40% (see measure 1.01). Babies born to Indigenous mothers who smoked were 1.5 times as likely to be pre-term as those who did not smoke.
Studies have found that smoking during pregnancy among Indigenous women is associated with low socio-economic status; stress; social norms, including number of smokers in the household; and lack of knowledge regarding consequences of smoking during pregnancy, which in turn influence incentives and support to quit (Johnston et al, 2011; Wood et al, 2008; Passey et al, 2012; Thrift et al, 2011). Social Survey data from 2014–15 showed that 39% of Indigenous mothers of children aged 0–3 years smoked during pregnancy. This rate is
lower than the rate from perinatal data, however it should be noted that the survey data is self-reported and subject to sample error.
Based on self-reported data for Indigenous mothers of children aged 0–3 years (2014–15 Social Survey), the vast majority reported that they did not consume alcohol (91%) or use illicit drugs (96%) during pregnancy. In 2014–15, the proportion of Indigenous children aged 0–3 years who had a birth mother who drank alcohol during pregnancy halved from 20% in 2008 to 10% in 2014–15, with the largest decline in non-remote areas (10 percentage points). On average, 60% of Indigenous mothers took folate before or during pregnancy, dropping to 33% in very remote areas.
According to 2014 perinatal data, Indigenous mothers were 1.7 times as likely to be obese, 3 times as likely to have pre-existing diabetes and more than twice as likely to have pre-existing hypertension than non-Indigenous mothers.
A study of 476 Aboriginal and Torres Strait Islander women attending 34 Indigenous community health centres across Australia found that 46% of those who smoked received documented advice about smoking cessation (Rumbold et al, 2011). Only 27% of women in this study were prescribed folic acid prior to 20 weeks gestation and even fewer (8%) prior to conception. These findings may be influenced by later presentation for antenatal care (see measure 3.01) (Robinson, P et al, 2012).
Implications Expanding national data on health behaviours during pregnancy will be an important element of monitoring progress in this area.
There is little evidence on cessation or education strategies that work (Eades, S et al, 2012; Hefler & Thomas, 2013; Lucas et al, 2014; Bower et al, 2004). Recommended approaches are those that: consider social and environmental contexts; increase knowledge of harm and cessation methods; are tailored to clients’ needs; are provided in a way that does not cause embarrassment or distress or deter further antenatal care; are culturally targeted with Indigenous health worker involvement; include partners, families and communities; are provided before, during and after pregnancy; and include alternative stress reduction and coping strategies (Bond et al, 2012; Gould et al, 2013; van der Sterren & Fowlie, 2015; France et al, 2010; Bridge, 2011; Elliott & Silverman, 2013; Wood et al, 2008; Marley et al, 2014)
Concurrent use of multiple substances and clustering of risk factors, particularly for women of lower socio-economic status, also need to be considered and addressed through holistic approaches (Passey et al,

Health behaviours
142
2014; Wen et al, 2010; Eades, S et al, 2012; Brown, SJ et al, 2016a).
The 2014–15 Budget provided funding of $94 million over three years from July 2015, for the Better Start to Life approach to expand efforts in child and maternal health. This included expanding New Directions: Mothers and Babies Services and the Australian Nurse Family Partnership Program (ANFPP). As part of the Women’s Safety Package, the Australian Government has also committed $1.1 million to enhance the ability of the ANFPP to support families who might be experiencing domestic violence.
The Indigenous Australians’ Health Programme includes $12 million over two years (from July 2016) to support the implementation of integrated early childhood services: Connected Beginnings, as recommended by the Forrest Review. The Department of Education has also allocated $30 million over three years to support the program.
National Evidence-Based Antenatal Care Guidelines have been developed, with advice specific to meeting the needs of Aboriginal and Torres Strait Islander pregnant women and advice on health behaviours during pregnancy.
The National Tobacco Campaign, Quit for You, Quit for Two is aimed at reducing smoking prevalence among pregnant women, their partners and women who are contemplating pregnancy. Materials feature Indigenous women (see 2.15). In Tasmania, the Smoke Free Pregnancies Working Group has implemented A Smoke Free Start for Every Tasmanian Baby: A Plan for Action—2014 to 2017. The Aboriginal and Torres Strait Islander Smoking Cessation Program supports a number of smoking cessation activities in the ACT, with an emphasis on pregnant smokers and their cohabitants.
Under the Tackling Indigenous Smoking (TIS) program (see measure 2.15), regional grants allow for focused work on priority groups such as pregnant women and relationships
with other programs for mothers and babies. Grants for three projects specifically targeting pregnant women have been awarded under the TIS innovation grant scheme.
In the 2014–15 Budget, the National Foetal Alcohol Spectrum Disorders (FASD) Action Plan was allocated $9.2 million, with an additional $10.5 million over four years allocated in 2016–17. Various activities are being undertaken across jurisdictions. For example, in WA, the FASD Prevention Program in the Kimberly region, run by the Ord Valley Aboriginal Health Service, provides education and support of antenatal clients and their families, as well as education sessions to students in the region.
The Pregnancy, Birth and Baby helpline and website, provides a range of support to women, partners and families in relation to pregnancy and parenting.
See the Policies and Strategies section for full details.
Figure 2.21-1 Age-standardised proportion of mothers who smoked during pregnancy, by Indigenous status and remoteness, 2014
Source: AIHW analysis of the 2014 National Perinatal Data Collection.
Figure 2.21-2 Proportion of mothers who smoked during pregnancy, by Indigenous status and age of mother, 2014
Source: AIHW analysis of the 2014 National Perinatal Data Collection
Figure 2.21-3 Age-standardised percentage of mothers who smoked during pregnancy by Indigenous status, 2006 to 2014
Source: AIHW/NPESU analysis of 2014 National Perinatal Data Collection
Figure 2.21-4 Use of tobacco, alcohol and illicit drugs during pregnancy, mothers of Indigenous children (0–3 years), 2014–15
Source: ABS and AIHW analyses of 2014–15 NATSISS
np0
102030405060708090
100
Majorcities
Innerregional
Outerregional
Remote Veryremote
Australia
Per c
ent
Remoteness area
Aboriginal and Torres Strait Islander mothers Non-Indigenous mothers
45 47 47 45 46 43
30
20
10 6 6 7
0
20
40
60
80
100
<20 20–24 25–29 30–34 35–39 40+
Per c
ent
Age of mother (years)
Aboriginal and Torres Strait Islander mothers Non-Indigenous mothers
0
20
40
60
80
100
2006 2007 2008 2009 2010 2011 2012 2013 2014
Per c
ent (
mot
hers
)
Year
Aboriginal and Torres Strait Islander peoplesNon-Indigenous Australians
39
104
61
90 96
0
20
40
60
80
100
Tobacco use Alcohol consumption Illicit drug use
Per c
ent
Yes No

Person-related factors
143
2.22 Overweight and obesity Why is it important? Overweight and obesity is a global health problem (OECD, 2014)(OECD 2014). Being overweight or obese increases the risk of a range of health conditions, including coronary heart disease, Type 2 diabetes, some cancers, respiratory and joint problems, sleep disorders and social problems (. The excess burden of obesity in the Indigenous population is estimated to explain 1 to 3 years (9% to 17%) of the life expectancy gap in the NT (Zhao et al, 2013a). High body mass was the second leading risk factor contributing to the health gap between Indigenous and non-Indigenous Australians in 2011, accounting for 14% of the gap (AIHW, 2016f). High body mass contributed to 64% of the burden of diabetes for Indigenous Australians, 46% of the chronic kidney disease burden and 39% of the coronary heart disease burden.
Findings There is no new data for overweight/obesity available from the 2014–15 Social Survey. In 2012–13 the Health Survey included height and weight measurements to allow body mass index (BMI) scores to be calculated. In 2012–13, 66% of Indigenous Australians aged 15 years and over had a BMI score in the overweight or obese range (29% overweight and 37% obese). Indigenous adults were 1.6 times as likely to be obese as non-Indigenous Australians (after adjusting for differences in the age structure of the two populations).
Indigenous obesity rates varied geographically. Obesity was highest in inner regional areas (40%) and lowest in very remote areas (32%). Rates were similar in major cities (37%) and in outer regional and remote areas (38%). By jurisdiction, obesity rates ranged from 41% in NSW to 29% in the NT. Indigenous women had higher rates of obesity (40%) and lower rates of overweight (26%) compared with Indigenous men (34% and 31% respectively). Of those adult Indigenous women who had an underweight or normal measured BMI, 44% had a waist circumference of 80cm or more, indicating increased risk of developing chronic disease. For both Aboriginal and Torres Strait Islander males and females, the rates for overweight/obesity increased with age, with 80% of the population aged 55 years and over being overweight or obese. Higher proportions of Torres Strait Islanders were overweight/obese than in the Aboriginal population (73% versus 65%).
The 2012–13 Health Survey showed obesity was strongly associated with chronic disease biomarkers (being obese increased the risk of abnormal test results for nearly every chronic disease tested for in the survey). Indigenous obese adults were 7 times more
likely to have diabetes than those of normal weight/ underweight (17% compared with 2%). Those who did not meet the physical activity guidelines were more likely to be obese (44%) than those who met the guidelines (36%).
Childhood is a critical period in which inequalities in health determinants such as socio-economic status and overweight/obesity emerge (Jansen et al, 2013; Thurber et al, 2014; Kim et al, 2017). In 2012–13, Aboriginal and Torres Strait Islander children aged 2–14 years were more likely than non-Indigenous children to be underweight (8% compared with 5%); were less likely to be in the normal weight range (62% compared with 70%); and more likely to be overweight or obese (30% compared with 25%). Obesity rates for Indigenous children increased from the age of 5, with the highest rates at 10–14 years of age (12%). High BMI is found to be a predictor of short sleep duration and sleep apnoea for children (Magee et al, 2014; Kassim et al, 2016), which impacts on school performance (measure 2.04) and engagement in physical activity (measure 2.18). It is not possible to compare 2012–13 Health Survey results with previous surveys as the latest results are based on measured BMI rather than self-reported height and weight (as was done before). Research shows rates of overweight/ obesity have increased more rapidly in Aboriginal than non-Aboriginal school-aged children in NSW (Hardy et al, 2014).
In May 2015, national Key Performance Indicators data from 214 Commonwealth-funded Indigenous primary health care organisations, found that 27% of regular clients aged 25 years and over were overweight, and 43% were obese.
Obesity is associated with other health risk factors and social determinants of health. One example is prolonged financial stress, which is a predictor of obesity (Siahpush et al, 2014) (see measure 2.08). Low income is associated with food security problems (Markwick et al, 2014) and subsequent dietary behaviour (see measure 2.19). Evidence also shows that incarceration is associated with weight gain and obesity in Indigenous youth (Haysom et al, 2013) (see measure 2.11).
Implications Given the health risks associated with being obese or overweight, the situation for Aboriginal and Torres Strait Islander peoples requires urgent attention. It is second only to tobacco use in terms of contribution of modifiable risk factors to the health gap experienced by Aboriginal and Torres Strait Islander peoples (AIHW, 2016f).
An evaluation of a school-based health education programme for urban Indigenous youth found promising results in physical activity, breakfast intake and fruit and
vegetable consumption (Malseed et al, 2014), all of which are core components of healthy weight management. Likewise, opportunities exist for obesity prevention in young children through practice-nurse brief interventions (Denney-Wilson et al, 2014).
Reversal of obesity is difficult even in the absence of environmental and social barriers. Therefore, early intervention to prevent the onset of excessive weight gain is likely to be the most effective strategy (Thurber et al, 2014). Studies reporting success in reducing obesity have a number of common characteristics, including: a focus on physical activity and diet opposed to diet alone; the ability to accommodate the preferences of participants; a group focus; and choice between a number of physical activities. Programmes must also be culturally acceptable, conveniently located, easily incorporated into the daily schedule and show goal attainment that is realistic and appropriate (Canuto et al, 2011).
The Implementation Plan for the National Aboriginal and Torres Strait Islander Health Plan 2013–2023 identifies the importance of addressing the social and cultural determinants of health to accelerate reducing the inequalities that lead to poorer health outcomes, including unhealthy weight and obesity.
In addition, in 2016 the Australian Government released the Healthy Weight Guide which provides information about healthy weight, physical activity and healthy eating; tips and tools to assist with achieving and maintaining a healthy weight; and a registered area where users can record and track their weight and progress. The Healthy Weight Guide has an area dedicated to Aboriginal and Torres Strait Islander people.
In 2014 the Australian Government launched the Healthy Bodies Need Healthy Drinks resource package. This suite of promotional materials encourages school-aged children, their families and communities to choose water instead of high-sugar drinks in an effort to prevent obesity, chronic disease and dental caries. There is international evidence that the consumption of sugar-sweetened drinks leads to weight gain. Aboriginal and Torres Strait Islander children consume higher quantities of soft drink per person compared with non-Indigenous children (Thurber et al, 2014). The odds of consuming sugar-sweetened drinks are significantly higher for Aboriginal and Torres Strait Islander children whose mothers have lower levels of education, who experience housing instability, who are living in urban areas and who are living in disadvantaged neighbourhoods.
Move Well Eat Well (primary schools and early childhood settings) in Tasmania aims to improve the policies and practices in these settings to support nutrition and physical activity.

Person-related factors
144
Figure 2.22-1 Proportion of persons aged 15 years and over (age-standardised) by BMI category and Indigenous status, 2012–13
Source: ABS and AIHW analysis of 2012–13 AATSIHS
Figure 2.22-2 Proportion of Indigenous persons aged 15 years and over by BMI category, by sex, 2012–13
Source: ABS and AIHW analysis of 2012–13 AATSIHS
Figure 2.22-3 Proportion of children aged 2–14 years by BMI category and Indigenous status, 2012–13
Source: ABS and AIHW analysis of 2012–13 AATSIHS
Figure 2.22-4 Proportion of persons aged 15 years and over who were overweight or obese, by Indigenous status and age, 2012–13
Source: ABS and AIHW analysis of 2012–13 AATSIHS
0
10
20
30
40
50
Underweight Normal weight Overweight Obese
Per c
ent
BMI category
Aboriginal and Torres Strait Islander peoples Non-Indigenous Australians
3
32 3134
4
2926
40
0
10
20
30
40
50
Underweight Normal weight Overweight Obese
Per c
ent
BMI category
Males Females
8
62
20
105
70
18
7
0
20
40
60
80
100
Underweight Normal weight Overweight Obese
Per c
ent
BMI category
Aboriginal and Torres Strait Islander peoples Non-Indigenous Australians
35
55
66
75 7780
24
36
54
6571 73
0
20
40
60
80
100
15–17 18–24 25–34 35–44 45–54 55+
Per c
ent
Age group (years)
Aboriginal and Torres Strait Islander peoples Non-Indigenous Australians

Person-related factors
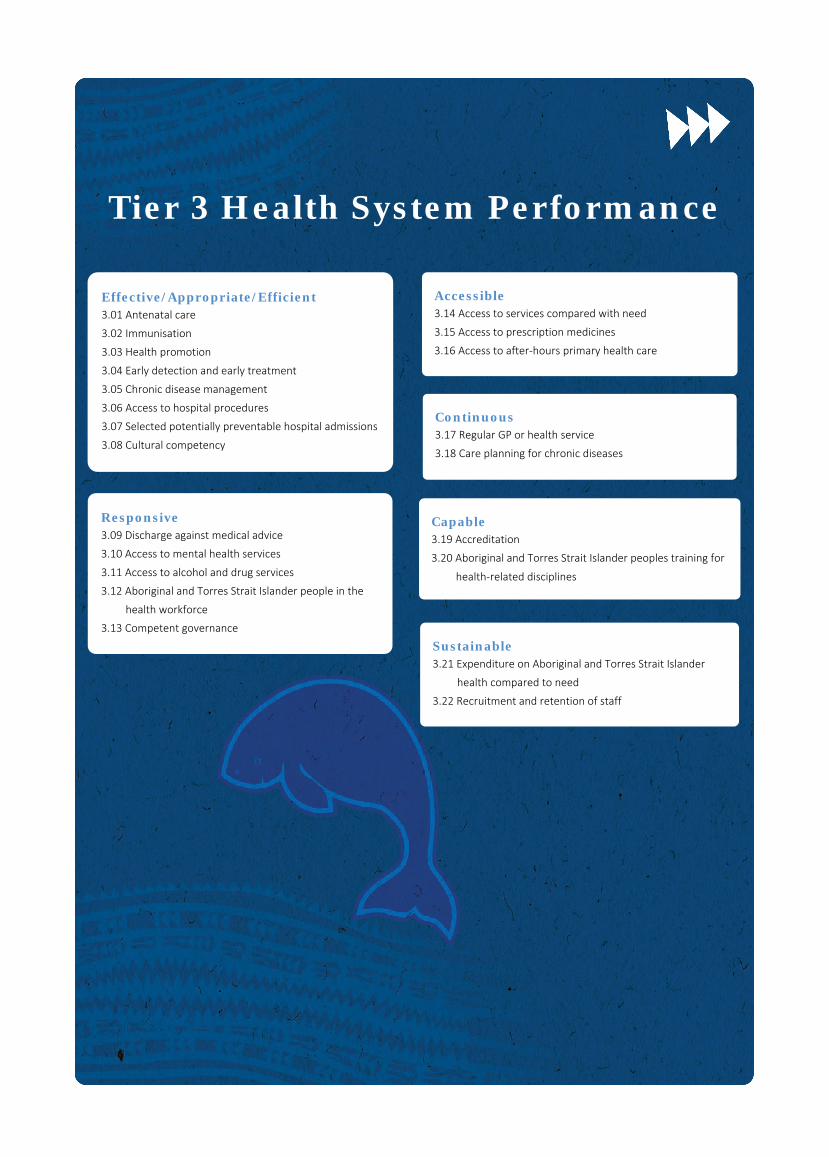
Tier 3 Health System Performance
Responsive 3.09 Discharge against medical advice
3.10 Access to mental health services
3.11 Access to alcohol and drug services
3.12 Aboriginal and Torres Strait Islander people in the
health workforce
3.13 Competent governance
Effective/Appropriate/Efficient 3.01 Antenatal care
3.02 Immunisation
3.03 Health promotion
3.04 Early detection and early treatment
3.05 Chronic disease management
3.06 Access to hospital procedures
3.07 Selected potentially preventable hospital admissions
3.08 Cultural competency
Sustainable 3.21 Expenditure on Aboriginal and Torres Strait Islander
health compared to need
3.22 Recruitment and retention of staff
Capable 3.19 Accreditation
3.20 Aboriginal and Torres Strait Islander peoples training for
health-related disciplines
Continuous 3.17 Regular GP or health service
3.18 Care planning for chronic diseases
Accessible 3.14 Access to services compared with need
3.15 Access to prescription medicines
3.16 Access to after-hours primary health care

Effective/Appropriate/Efficient
147
3.01 Antenatal care Why is it important? Antenatal care involves recording medical history; undertaking regular clinical assessments to identify individual needs; screening for a range of infections and abnormalities; providing support and information; offering social, lifestyle and self-care advice; and providing first-line management and referral if necessary (AHMAC, 2012; WHO, 2007). Regular antenatal care that commences early in pregnancy has been found to have a positive effect on good health outcomes for mothers and babies (Eades, S, 2004; AHMAC, 2012; Arabena et al, 2015). Well-managed discharge processes and programmes that continue after birth have also shown benefits for child health, development and family wellbeing (Sivak et al, 2008).
Antenatal care may be especially important for Indigenous women as they are at higher risk of giving birth to pre-term and low birthweight babies and have greater exposure to other risk factors and complications such as anaemia, poor nutritional status, chronic illness, hypertension, diabetes, genital and urinary tract infections, smoking, and high levels of psychosocial stressors (de Costa & Wenitong, 2009; AHMAC, 2012).
The Clinical Practice Guidelines: Antenatal Care—Module 1 (AHMAC, 2012) and Module 2 (AHMAC, 2014) provide recommendations to support high-quality antenatal care and contribute to improved outcomes for all mothers and babies. The guidelines take a woman-centred approach and include specific discussion of antenatal care for Aboriginal and Torres Strait Islander women to improve their experience and outcomes of care.
Presentation for antenatal care within the first 10 weeks of gestation is suggested due to the high information needs early in pregnancy and to allow for timely assessment of risk factors. Depending on need, a schedule of 10 visits is recommended for a woman’s first pregnancy, and 7 visits for subsequent uncomplicated pregnancies.
Many factors influence an Indigenous woman’s engagement with, and early presentation for, antenatal care including availability of culturally appropriate services, the frequency (or absence) of local clinics, transport, and educational, socio-economic and financial issues (Arnold, JL et al, 2009; de Costa & Wenitong, 2009).
Findings Perinatal data show that in 2014, 99% of Aboriginal and Torres Strait Islander mothers accessed antenatal care services at least once during their pregnancy, which is similar
to non-Indigenous mothers. However, Aboriginal and Torres Strait Islander mothers, on average, accessed services later in the pregnancy and had fewer antenatal care sessions than non-Indigenous mothers.
The majority of Indigenous mothers (54% in 2014) attended antenatal care in the first trimester of pregnancy and 86% attended five or more times during their pregnancy. From 2011 to 2014, the proportion of Indigenous mothers who attended antenatal care in the first trimester of pregnancy increased by 13%. However, in 2014 the age-standardised proportion of Indigenous mothers who attended antenatal care in the first trimester was still lower than for non-Indigenous mothers (by 7 percentage points, 53% compared with 60% respectively). For Indigenous mothers the rate was highest in outer regional areas (60%) and lowest in major cities (47%) (AIHW, 2016y).
The Indigenous rate was lowest in Vic (37%); while both the NT and SA had the largest gaps (31 and 24 percentage points respectively).
Compared with women who received care in the first trimester, women who received no antenatal care were about 4 times as likely to have a pre-term or low birthweight baby.
In 2014, for women who gave birth at 32 weeks gestation or more, 86% of Indigenous mothers had attended 5 or more antenatal sessions compared with 95% for non-Indigenous mothers.
In the 2014–15 Social Survey, the vast majority (94%) of mothers of Indigenous children aged 0–3 years reported that they had regular pregnancy check-ups.
The national Key Performance Indicators data collection includes items on antenatal care provided by Indigenous primary health care organisations. In May 2015, of the 5,160 Indigenous mothers who were regular clients of these organisations, 37% attended their first antenatal visit in the critical first trimester (note these data report <13 weeks rather than <14 weeks). Attendance rates were highest in remote and inner regional areas (41% and 40% respectively) and lowest in major cities (30%).
Implications Continued improvements in the quality of antenatal care received, earlier and more regular attendance for antenatal care, along with programs after birth are required to improve outcomes for Aboriginal and Torres Strait Islander mothers and their babies. The features that have been identified for quality primary maternity services in Australia include high quality care that is enabled by evidence-based practice, coordinated according to the woman’s clinical needs and preferences, based on collaborative multidisciplinary approaches, woman-
centred, culturally appropriate and accessible at the local level (AHMAC, 2012).
Reviews of the literature have identified the following key success factors in Aboriginal and Torres Strait Islander maternal health programmes to complement the features detailed above: a safe/welcoming environment; outreach and home visiting; flexibility in service delivery and appointment times; access to transport; continuity of care and carer integration with other services (e.g. AMS or hospital); a focus on communication, relationship building and trust; involvement of women in decision making; respect for Aboriginal and Torres Strait Islander culture; respect for privacy, dignity and confidentiality; family involvement and childcare; appropriately trained workforce; Indigenous staff and female staff; informed consent and right of refusal; and tools to measure cultural competency (Dudgeon et al, 2010; Reibel & Walker, 2010; Herceg, 2005; AHMAC, 2012; Bertilone & McEvoy, 2015; Kildea & Van Wagner, 2013; Kildea et al, 2012; Murphy & Best, 2012; Wilson, G, 2009).
Australian governments are investing in a range of initiatives aimed at improving child and maternal health. These are described in detail in the Policies and Strategies section and briefly below.
The Better Start to Life approach, was allocated Australian Government funding New Directions: Mothers and Babies Services and the Australian Nurse Family Partnership Program, which was also allocated $1.1 million under the Women’s Safety Package to help support families experiencing domestic violence.
The Indigenous Australians’ Health Programme has allocated $12 million for Connected Beginnings, a programme which implements an approach to integrated childcare recommended in Creating Parity—the Forrest Review. The Department of Education has also allocated $30 million over three years to support the program.
In the 2014–15 Budget, the National Fetal Alcohol Spectrum Disorders (FASD) Action Plan was allocated $9.2 million.
National Evidence-Based Antenatal Care Guidelines have been developed to help ensure women are provided consistent, quality, evidence-based maternity care. Advice specific to meeting the needs of Aboriginal and Torres Strait Islander pregnant women is included.
The Pregnancy, Birth and Baby helpline and website, provides a range of support to women, partners and families in relation to pregnancy and parenting.
Community based pregnancy support and hospital antenatal services for young Aboriginal women and their families have continued in Tasmania. In particular, the state-wide Aboriginal Midwifery Outreach

Effective/Appropriate/Efficient
148
Project, with midwives based in Aboriginal health services, provides holistic antenatal and postnatal care and support, including home visits to Aboriginal women and women having Aboriginal babies.
The Koori Maternity Services programs, operating at 14 sites across Victoria, continue to increase the participation of Aboriginal women in antenatal and postnatal care services.
Strategies operating in WA include Collaborative Child Health, a birth to school entry project in the Pilbara region. Wirraka Maya allocated funding to primary prevention in Aboriginal communities, which included an alcohol in pregnancy intervention, and also implemented the ‘0–5 High Risk Program’ across the Pilbara for children aged 0–5 years living within high risk environments.
In SA, the Aboriginal Family Birthing Program (a partnership model between Aboriginal Maternal Infant Care Workers and midwives) supports Indigenous women and their families through pregnancy, childbirth and up to 6 weeks postnatally, improving outcomes for mothers and babies in the programme.
Figure 3.01-1 Age-standardised percentage of mothers who attended at least one antenatal care session during the first trimester, by Indigenous status, Vic, Qld, WA, SA, Tas, ACT and NT, 2011 to 2014
Source: AIHW analysis of the National Perinatal Data Collection
Figure 3.01-2 Age-standardised percentage of mothers whose first antenatal care session occurred in the first trimester, by Indigenous status and remoteness, 2014
Source: AIHW (unpublished) National Perinatal Data Collection
Figure 3.01-3 Age-standardised percentage of mothers whose first antenatal care session occurred in the first trimester, by Indigenous status and jurisdiction, 2014
Note: Australia includes ACT and Tas Source: AIHW/NPESU analysis of National Perinatal Data Collection
Figure 3.01-4 Relationship for Indigenous mothers between duration of pregnancy at first antenatal care session and low birthweight babies, 2014
Source: AIHW/NPESU analysis of National Perinatal Data Collection
40
45
50
55
60
65
70
2011 2012 2013 2014
Per c
ent
Year
Aboriginal and Torres Strait Islander mothers Non-Indigenous mothers
0
20
40
60
80
100
Majorcities
Innerregional
Outerregional
Remote Veryremote
Australia
Per c
ent
Remoteness area
Aboriginal and Torres Strait Islander mothers Non-Indigenous mothers
0
20
40
60
80
100
NSW Vic Qld WA SA NT Australia
Per c
ent
Jurisdiction
Aboriginal and Torres Strait Islander mothers Non-Indigenous mothers
911 12
37
0
10
20
30
40
50
<14 14–19 20+ no attendance
Per c
ent (
mot
hers
)
Gestation at first antenatal session (weeks)
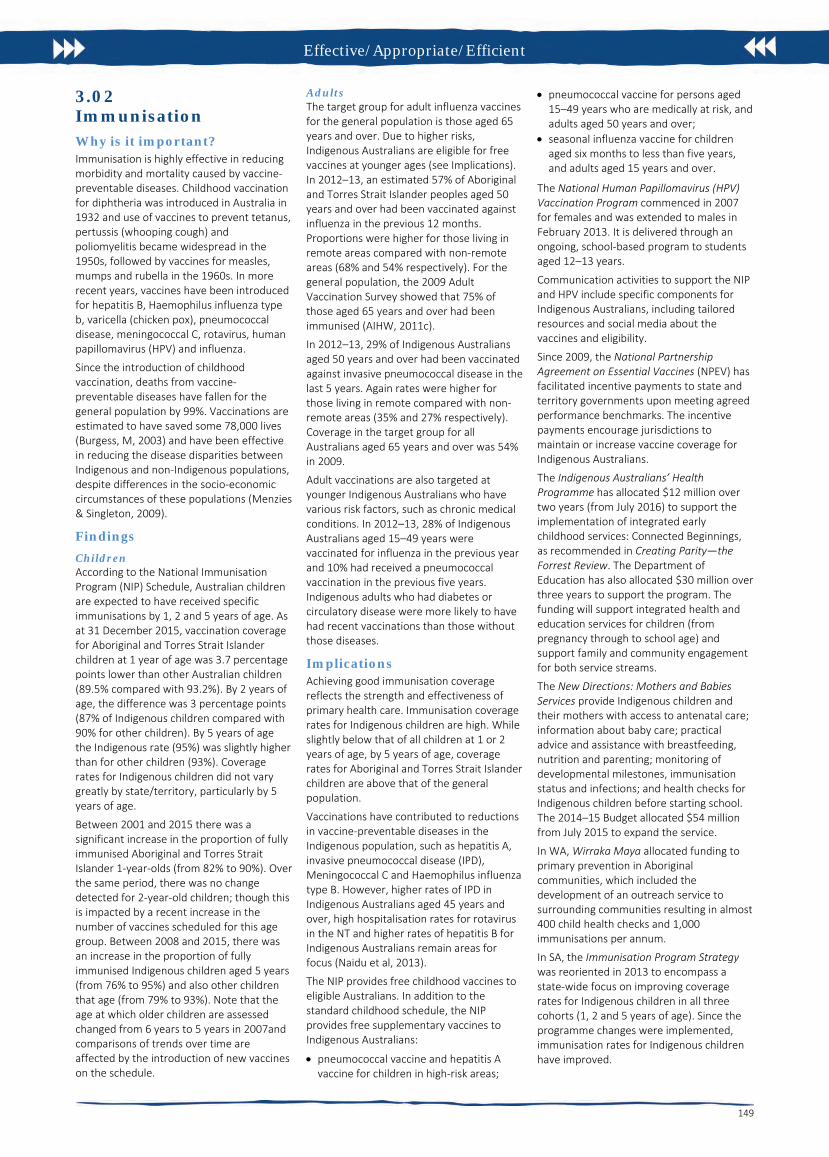
Effective/Appropriate/Efficient
149
3.02 Immunisation Why is it important? Immunisation is highly effective in reducing morbidity and mortality caused by vaccine-preventable diseases. Childhood vaccination for diphtheria was introduced in Australia in 1932 and use of vaccines to prevent tetanus, pertussis (whooping cough) and poliomyelitis became widespread in the 1950s, followed by vaccines for measles, mumps and rubella in the 1960s. In more recent years, vaccines have been introduced for hepatitis B, Haemophilus influenza type b, varicella (chicken pox), pneumococcal disease, meningococcal C, rotavirus, human papillomavirus (HPV) and influenza.
Since the introduction of childhood vaccination, deaths from vaccine-preventable diseases have fallen for the general population by 99%. Vaccinations are estimated to have saved some 78,000 lives (Burgess, M, 2003) and have been effective in reducing the disease disparities between Indigenous and non-Indigenous populations, despite differences in the socio-economic circumstances of these populations (Menzies & Singleton, 2009).
Findings Children According to the National Immunisation Program (NIP) Schedule, Australian children are expected to have received specific immunisations by 1, 2 and 5 years of age. As at 31 December 2015, vaccination coverage for Aboriginal and Torres Strait Islander children at 1 year of age was 3.7 percentage points lower than other Australian children (89.5% compared with 93.2%). By 2 years of age, the difference was 3 percentage points (87% of Indigenous children compared with 90% for other children). By 5 years of age the Indigenous rate (95%) was slightly higher than for other children (93%). Coverage rates for Indigenous children did not vary greatly by state/territory, particularly by 5 years of age.
Between 2001 and 2015 there was a significant increase in the proportion of fully immunised Aboriginal and Torres Strait Islander 1-year-olds (from 82% to 90%). Over the same period, there was no change detected for 2-year-old children; though this is impacted by a recent increase in the number of vaccines scheduled for this age group. Between 2008 and 2015, there was an increase in the proportion of fully immunised Indigenous children aged 5 years (from 76% to 95%) and also other children that age (from 79% to 93%). Note that the age at which older children are assessed changed from 6 years to 5 years in 2007and comparisons of trends over time are affected by the introduction of new vaccines on the schedule.
Adults The target group for adult influenza vaccines for the general population is those aged 65 years and over. Due to higher risks, Indigenous Australians are eligible for free vaccines at younger ages (see Implications). In 2012–13, an estimated 57% of Aboriginal and Torres Strait Islander peoples aged 50 years and over had been vaccinated against influenza in the previous 12 months. Proportions were higher for those living in remote areas compared with non-remote areas (68% and 54% respectively). For the general population, the 2009 Adult Vaccination Survey showed that 75% of those aged 65 years and over had been immunised (AIHW, 2011c).
In 2012–13, 29% of Indigenous Australians aged 50 years and over had been vaccinated against invasive pneumococcal disease in the last 5 years. Again rates were higher for those living in remote compared with non-remote areas (35% and 27% respectively). Coverage in the target group for all Australians aged 65 years and over was 54% in 2009.
Adult vaccinations are also targeted at younger Indigenous Australians who have various risk factors, such as chronic medical conditions. In 2012–13, 28% of Indigenous Australians aged 15–49 years were vaccinated for influenza in the previous year and 10% had received a pneumococcal vaccination in the previous five years. Indigenous adults who had diabetes or circulatory disease were more likely to have had recent vaccinations than those without those diseases.
Implications Achieving good immunisation coverage reflects the strength and effectiveness of primary health care. Immunisation coverage rates for Indigenous children are high. While slightly below that of all children at 1 or 2 years of age, by 5 years of age, coverage rates for Aboriginal and Torres Strait Islander children are above that of the general population.
Vaccinations have contributed to reductions in vaccine-preventable diseases in the Indigenous population, such as hepatitis A, invasive pneumococcal disease (IPD), Meningococcal C and Haemophilus influenza type B. However, higher rates of IPD in Indigenous Australians aged 45 years and over, high hospitalisation rates for rotavirus in the NT and higher rates of hepatitis B for Indigenous Australians remain areas for focus (Naidu et al, 2013).
The NIP provides free childhood vaccines to eligible Australians. In addition to the standard childhood schedule, the NIP provides free supplementary vaccines to Indigenous Australians:
• pneumococcal vaccine and hepatitis Avaccine for children in high-risk areas;
• pneumococcal vaccine for persons aged15–49 years who are medically at risk, andadults aged 50 years and over;
• seasonal influenza vaccine for childrenaged six months to less than five years,and adults aged 15 years and over.
The National Human Papillomavirus (HPV) Vaccination Program commenced in 2007 for females and was extended to males in February 2013. It is delivered through an ongoing, school-based program to students aged 12–13 years.
Communication activities to support the NIP and HPV include specific components for Indigenous Australians, including tailored resources and social media about the vaccines and eligibility.
Since 2009, the National Partnership Agreement on Essential Vaccines (NPEV) has facilitated incentive payments to state and territory governments upon meeting agreed performance benchmarks. The incentive payments encourage jurisdictions to maintain or increase vaccine coverage for Indigenous Australians.
The Indigenous Australians’ Health Programme has allocated $12 million over two years (from July 2016) to support the implementation of integrated early childhood services: Connected Beginnings, as recommended in Creating Parity—the Forrest Review. The Department of Education has also allocated $30 million over three years to support the program. The funding will support integrated health and education services for children (from pregnancy through to school age) and support family and community engagement for both service streams.
The New Directions: Mothers and Babies Services provide Indigenous children and their mothers with access to antenatal care; information about baby care; practical advice and assistance with breastfeeding, nutrition and parenting; monitoring of developmental milestones, immunisation status and infections; and health checks for Indigenous children before starting school. The 2014–15 Budget allocated $54 million from July 2015 to expand the service.
In WA, Wirraka Maya allocated funding to primary prevention in Aboriginal communities, which included the development of an outreach service to surrounding communities resulting in almost 400 child health checks and 1,000 immunisations per annum.
In SA, the Immunisation Program Strategy was reoriented in 2013 to encompass a state-wide focus on improving coverage rates for Indigenous children in all three cohorts (1, 2 and 5 years of age). Since the programme changes were implemented, immunisation rates for Indigenous children have improved.
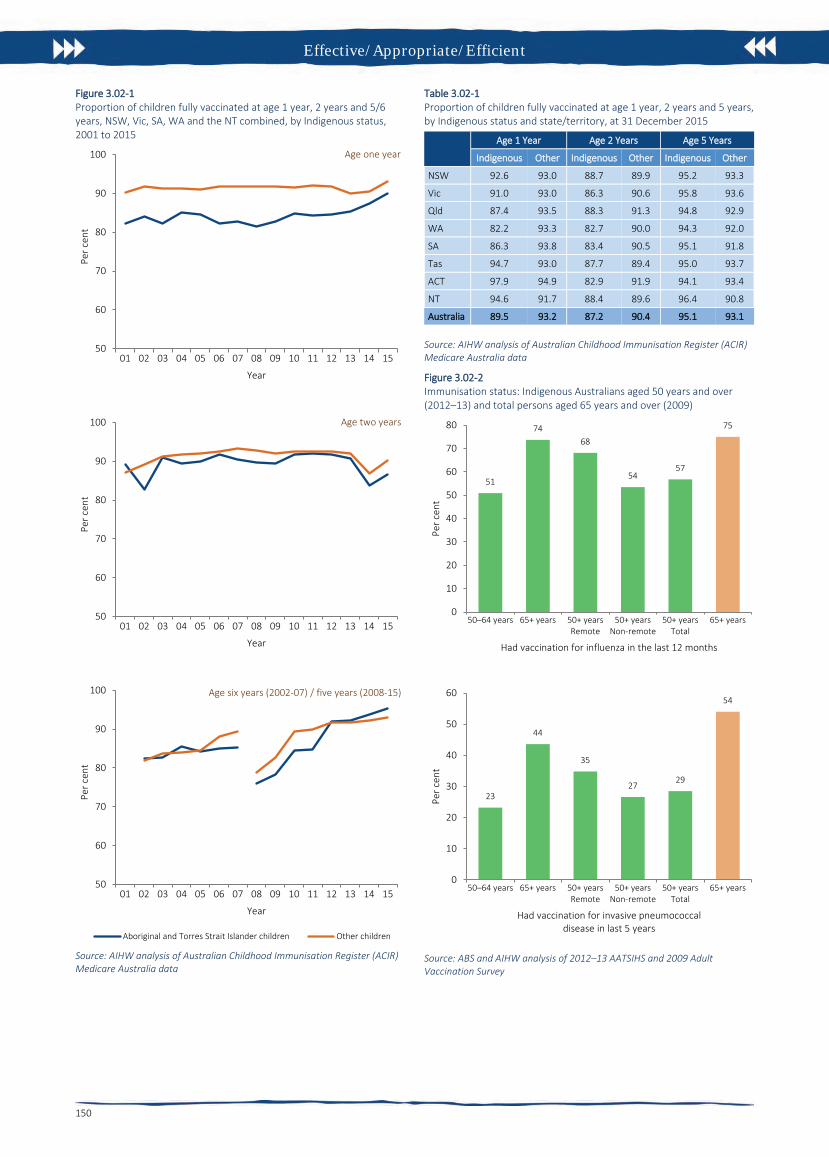
Effective/Appropriate/Efficient
150
Figure 3.02-1 Proportion of children fully vaccinated at age 1 year, 2 years and 5/6 years, NSW, Vic, SA, WA and the NT combined, by Indigenous status, 2001 to 2015
Source: AIHW analysis of Australian Childhood Immunisation Register (ACIR) Medicare Australia data
Table 3.02-1 Proportion of children fully vaccinated at age 1 year, 2 years and 5 years, by Indigenous status and state/territory, at 31 December 2015
Age 1 Year Age 2 Years Age 5 Years
Indigenous Other Indigenous Other Indigenous Other
NSW 92.6 93.0 88.7 89.9 95.2 93.3
Vic 91.0 93.0 86.3 90.6 95.8 93.6
Qld 87.4 93.5 88.3 91.3 94.8 92.9
WA 82.2 93.3 82.7 90.0 94.3 92.0
SA 86.3 93.8 83.4 90.5 95.1 91.8
Tas 94.7 93.0 87.7 89.4 95.0 93.7
ACT 97.9 94.9 82.9 91.9 94.1 93.4
NT 94.6 91.7 88.4 89.6 96.4 90.8
Australia 89.5 93.2 87.2 90.4 95.1 93.1
Source: AIHW analysis of Australian Childhood Immunisation Register (ACIR) Medicare Australia data
Figure 3.02-2 Immunisation status: Indigenous Australians aged 50 years and over (2012–13) and total persons aged 65 years and over (2009)
Source: ABS and AIHW analysis of 2012–13 AATSIHS and 2009 Adult Vaccination Survey
50
60
70
80
90
100
01 02 03 04 05 06 07 08 09 10 11 12 13 14 15
Per c
ent
Year
Age one year
50
60
70
80
90
100
01 02 03 04 05 06 07 08 09 10 11 12 13 14 15
Per c
ent
Year
Age two years
50
60
70
80
90
100
01 02 03 04 05 06 07 08 09 10 11 12 13 14 15
Per c
ent
Year
Age six years (2002-07) / five years (2008-15)
Aboriginal and Torres Strait Islander children Other children
51
7468
5457
75
0
10
20
30
40
50
60
70
80
50–64 years 65+ years 50+ yearsRemote
50+ yearsNon-remote
50+ yearsTotal
65+ years
Per c
ent
Had vaccination for influenza in the last 12 months
23
44
35
2729
54
0
10
20
30
40
50
60
50–64 years 65+ years 50+ yearsRemote
50+ yearsNon-remote
50+ yearsTotal
65+ years
Per c
ent
Had vaccination for invasive pneumococcal disease in last 5 years

Effective/Appropriate/Efficient
151
3.03 Health promotion Why is it important? Aboriginal and Torres Strait Islander peoples currently experience higher levels of morbidity and mortality from potentially avoidable conditions than other Australians. In 2011–15, 61% of Indigenous deaths before the age of 75 years were potentially avoidable. The Indigenous avoidable mortality rate was 3 times the non-Indigenous rate (see measure 1.24). Exposures to risk through behaviours such as smoking were also higher (see Health Behaviour measures).
Health promotion is the process of enabling people to increase control over their health and its determinants, and thereby improve their health (WHO, 2005). Health promotion activities are designed to improve or protect health within social, physical, economic and political contexts. Health promotion includes public policy interventions (e.g. packaging of tobacco products, seat belt laws), information to support healthy lifestyles (e.g. smoking, alcohol and drug use, physical activity, diet), social marketing (e.g. sunscreen, safe sex) and mass media campaigns (e.g. drink-driving, road safety). Health promotion also includes empowering individuals, strengthening community capacity and addressing determinants of health.
Currently there are limited methods for measuring the nature, level, and reach of health promotion programmes and activities.
Findings Estimating expenditure on health promotion for Indigenous Australians is difficult as it is often embedded within other funding sources and programs (e.g. funding for GPs, primary health care and mainstream health promotion activities). In 2013–14, state and territory government expenditure on public health for selected health promotion activities was estimated to be around $15 for each Indigenous Australian and $16 for each non-Indigenous Australian. In addition, expenditure for the prevention of hazardous and harmful drug use was estimated to be $5.90 per Indigenous Australian and $6.20 per non-Indigenous Australian. Australian Government funding for public health services was $120 per person for Indigenous Australians; however, this includes a broad set of activities from which health promotion could not be separated out.
In the 2012–13 Health Survey, 46% of Indigenous Australians aged 15 years and over who had consulted a doctor in the last 12 months reported discussing lifestyle issues. These included reaching a healthy weight (50%), improving diet (44%), reducing or quitting smoking (43%), increasing
physical activity (30%), drinking alcohol in moderation (16%), safe sexual practices (12%) and family planning (10%).
Indigenous Australians in the NT and in remote areas were less likely to have accessed a doctor in the last 12 months and also less likely to have discussed lifestyle issues than those living in other areas. Females were more likely to have discussed lifestyle issues with a doctor than males (50% and 41% respectively), while discussions on drinking alcohol in moderation were more common for males (26%) than for females (8%).
Based on GP survey data (2010–15), 32% of all clinical and therapeutic treatments provided by GPs to Indigenous patients related to health promotion. General ‘advice/education’ accounted for 9% of all clinical and therapeutic treatments, followed by ‘advice/education treatment’ and ‘counselling/advice for nutrition and weight’ (both 6%) and ‘counselling/advice for smoking’ (3%). After adjusting for differences in the age structure of the two populations, the rate at which GPs provided counselling and advice about smoking was nearly 3 times as high, and for both alcohol and lifestyle advice almost twice as high, at encounters with Indigenous patients than other Australian patients. The total rates of GP clinical treatments relating to health promotion were slightly higher for Indigenous patients (204 per 1,000 GP encounters) than for other Australian patients (178 per 1,000 encounters).
In 2014–15, all Commonwealth-funded Indigenous primary health care organisations provided a range of health promotion programs and activities. These included immunisation services to children (81%) and to adults (79%); healthy lifestyle programs (81%), sexual health promotion (67%) and mental health promotion activities (47%). Most (89%) of these organisations also provided group activities. These included promotion of physical activity/healthy weight (73%) tobacco use treatment/prevention (56%), alcohol use treatment/prevention (40%), and living skills (such as cooking and nutrition) (61%).
Health promotion activities were also a key feature of programs run by Aboriginal and Torres Strait Islander substance-use specific services, with 76% running living skills groups, 70% running group activities on physical activity/healthy weight, 69% running men’s groups and 58% women’s groups in addition to substance-specific group activities for alcohol (81%) and tobacco (67%) treatment/prevention.
Implications Not all health campaigns are effective. Evidence on the effectiveness of health promotion is mixed across a range of settings and disease types with some
approaches more effective than others for different population groups (Liu et al, 2012; Jackson & Waters, 2005). Factors that influence health behaviour and health behaviour change among Indigenous Australians are also complex and poorly understood (Waterworth et al, 2015).
A recent literature review found that while Indigenous health promotion tools were widely available, only 15% had been evaluated, and only half of these evaluations were considered comprehensive (McCalman et al, 2014). Programmes that were more successful had allowed local communities to determine the end product by asking them what type of health promotion they would like, on what topic and how they would like it delivered (Charles, 2016; Schoen et al, 2010).
While studies can model the continued effectiveness of health promotion interventions, there is limited evidence on long-term behavioural change (Merkur et al, 2013). A small study of urban Indigenous young people found no change in behaviours but some change in knowledge and attitudes following health promotion interventions in school (Malseed et al, 2014). At the heart of health promotion is effective communication that takes into account language and world view to support people to live healthy lives (Vass et al, 2011).
Features of effective health promotion interventions for Indigenous communities include: involving local Indigenous people in design and implementation of programs; acknowledging different drivers that motivate individuals; building effective partnerships between community members and the organisations involved; cultural understanding and mechanisms for effective feedback to individuals and families; developing trusting relationships, community ownership and support for interventions (Black, 2007). Family-centred approaches across the life course have also been recommended in the prevention of chronic disease (Griew et al, 2007).
Don’t Make Smokes Your Story (Dept. of Health, 2016) is the latest phase of the National Tobacco Campaign using an empowering and positive approach to encourage quit attempts among Indigenous smokers. Break the Chain and Quit for You, Quit for Two, are part of an integrated strategy utilising mainstream mass media, local and targeted channels, digital and social media, and below the line activities.
The Australian Government’s Tackling Indigenous Smoking (TIS) programme funds regional projects to deliver a range of evidence-based activities that suit the local context and the needs of the community to prevent the uptake of smoking and support smoking cessation.
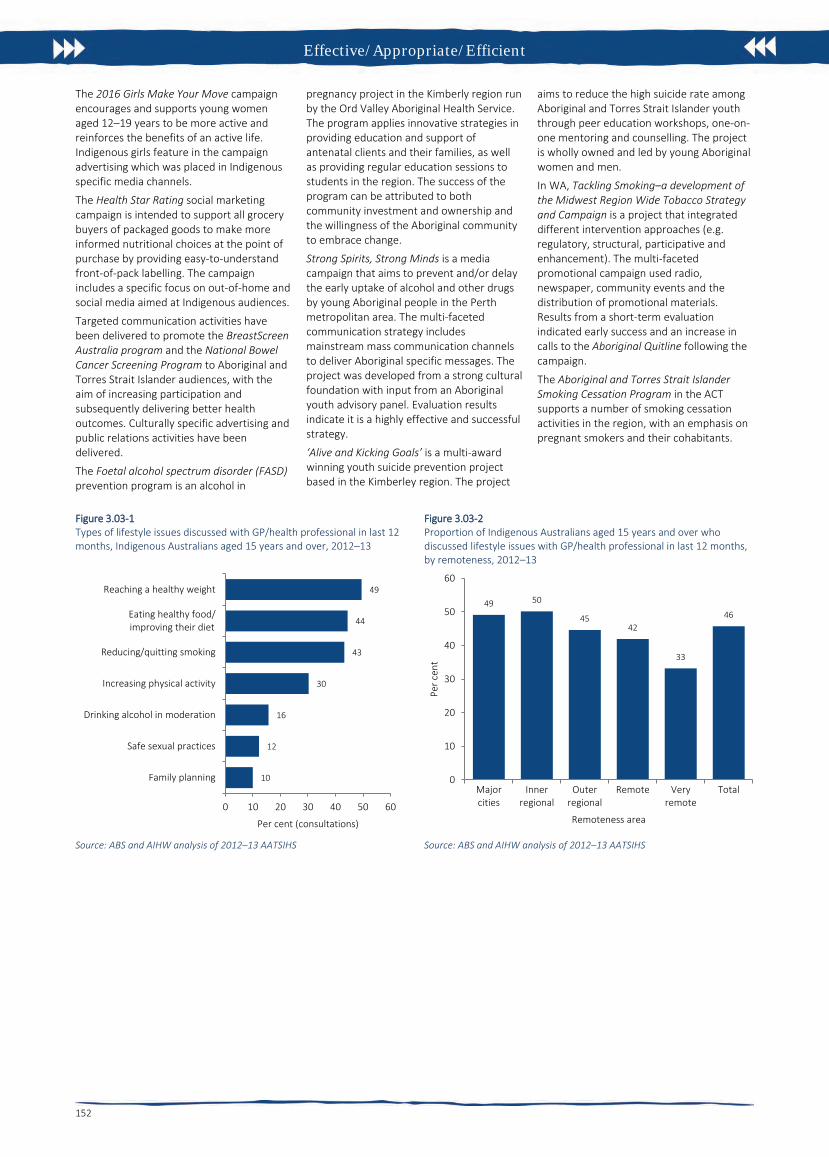
Effective/Appropriate/Efficient
152
The 2016 Girls Make Your Move campaign encourages and supports young women aged 12–19 years to be more active and reinforces the benefits of an active life. Indigenous girls feature in the campaign advertising which was placed in Indigenous specific media channels.
The Health Star Rating social marketing campaign is intended to support all grocery buyers of packaged goods to make more informed nutritional choices at the point of purchase by providing easy-to-understand front-of-pack labelling. The campaign includes a specific focus on out-of-home and social media aimed at Indigenous audiences.
Targeted communication activities have been delivered to promote the BreastScreen Australia program and the National Bowel Cancer Screening Program to Aboriginal and Torres Strait Islander audiences, with the aim of increasing participation and subsequently delivering better health outcomes. Culturally specific advertising and public relations activities have been delivered.
The Foetal alcohol spectrum disorder (FASD) prevention program is an alcohol in
pregnancy project in the Kimberly region run by the Ord Valley Aboriginal Health Service. The program applies innovative strategies in providing education and support of antenatal clients and their families, as well as providing regular education sessions to students in the region. The success of the program can be attributed to both community investment and ownership and the willingness of the Aboriginal community to embrace change.
Strong Spirits, Strong Minds is a media campaign that aims to prevent and/or delay the early uptake of alcohol and other drugs by young Aboriginal people in the Perth metropolitan area. The multi-faceted communication strategy includes mainstream mass communication channels to deliver Aboriginal specific messages. The project was developed from a strong cultural foundation with input from an Aboriginal youth advisory panel. Evaluation results indicate it is a highly effective and successful strategy.
‘Alive and Kicking Goals’ is a multi-award winning youth suicide prevention project based in the Kimberley region. The project
aims to reduce the high suicide rate among Aboriginal and Torres Strait Islander youth through peer education workshops, one-on-one mentoring and counselling. The project is wholly owned and led by young Aboriginal women and men.
In WA, Tackling Smoking–a development of the Midwest Region Wide Tobacco Strategy and Campaign is a project that integrated different intervention approaches (e.g. regulatory, structural, participative and enhancement). The multi-faceted promotional campaign used radio, newspaper, community events and the distribution of promotional materials. Results from a short-term evaluation indicated early success and an increase in calls to the Aboriginal Quitline following the campaign.
The Aboriginal and Torres Strait Islander Smoking Cessation Program in the ACT supports a number of smoking cessation activities in the region, with an emphasis on pregnant smokers and their cohabitants.
Figure 3.03-1 Types of lifestyle issues discussed with GP/health professional in last 12 months, Indigenous Australians aged 15 years and over, 2012–13
Source: ABS and AIHW analysis of 2012–13 AATSIHS
Figure 3.03-2 Proportion of Indigenous Australians aged 15 years and over who discussed lifestyle issues with GP/health professional in last 12 months, by remoteness, 2012–13
Source: ABS and AIHW analysis of 2012–13 AATSIHS
10
12
16
30
43
44
49
0 10 20 30 40 50 60
Family planning
Safe sexual practices
Drinking alcohol in moderation
Increasing physical activity
Reducing/quitting smoking
Eating healthy food/improving their diet
Reaching a healthy weight
Per cent (consultations)
49 50
4542
33
46
0
10
20
30
40
50
60
Majorcities
Innerregional
Outerregional
Remote Veryremote
Total
Per c
ent
Remoteness area

Effective/Appropriate/Efficient
153
3.04 Early detection and early treatment Why is it important? Early detection is the discovery of a disease or condition at an early stage of its development or onset, usually before symptoms occur. Early detection may occur for individual patients, where clinically indicated, or for targeted populations through screening programmes. Early detection and treatment programmes are most effective when there are systematic approaches to ensuring assessment and screening occurs regularly and at recommended intervals. In Australia, primary health care providers, including Aboriginal and Torres Strait Islander health services and GPs, have a key role.
Screening programmes are designed to detect cancer early (breast and bowel) or prevent its occurrence in the first place (bowel and cervical). National programmes for breast and cervical screening were implemented in Australia in the early 1990s. The National Cervical Screening Program (NCSP) currently recommends regular screening for women aged 18–69 years. BreastScreen Australia recommends two-yearly screening for women aged 50–74 years. The National Bowel Cancer Screening Program (NBCSP) began in 2006 and is working towards biennial screening for those aged 50 to 74 years. Research suggests that biennial bowel cancer screening can save up to 500 lives annually (Pignone et al, 2011).
While cancer mortality is higher among Indigenous Australians (see measure 1.08), participation rates in the NBCSP and BreastScreen Australia have been lower than non-Indigenous rates (AIHW, 2016w; AIHW, 2014a) and Indigenous women appear to be under-screened in the NCSP (AIHW, 2016t; Whop et al, 2016).
Findings Health checks Medicare Benefits Schedule (MBS) health assessment items for Aboriginal and Torres Strait Islander peoples aim to encourage early detection, diagnosis and intervention for common and treatable conditions that cause morbidity and early mortality. Health assessment items for Indigenous Australians aged 55 years and over were introduced in 1999, for those aged 15–54 years in 2004, and in 2006 for 0–14 year-olds. In 2009–10, measures to increase take-up of health assessments by those aged 15 and over were introduced.
Trend analysis shows a statistically significant increase in health assessments for all ages between 2009–10 and 2015–16 (the rate has more than tripled). There has been acceleration in the rate of change since
2009–10 (annual average change of 33 per 1,000, compared with 27 per 1,000 for the period 2006–07 to 2015–16).
In 2015–16, around 63,800 health assessments were undertaken for children aged 0–14 years, representing around 26% of children in the target group. There were about 103,600 health assessments provided for Indigenous Australians aged 15–54 years (25% of this population) and 29,400 for those aged 55 years and over (representing 38% of this population). Health assessments through Medicare are also available to all Australians aged 75 years and over, with 33% of this population having an assessment in 2015–16.
In Commonwealth-funded Indigenous primary health care organisations, 33% of Indigenous children aged 0–4 years (who were regular clients) had received an MBS health assessment in the 12 months to May 2015. For eligible adults who are regular clients, 44% of those aged 25–54 years had received a health check in the previous 24 months as had 52% of those aged 55 years and over.
In the 2012–13 Health Survey, Indigenous Australians aged 50 years and over with no current diagnosis for diabetes were 1.2 times as likely as non-Indigenous Australians to have been tested for diabetes/high sugar levels in the last three years (67% compared with 55%).
Cancer screening In the latest BreastScreen Australia data, which covers the two calendar years 2013–14, 37% of Indigenous Australian women aged 50–69 years had been screened (nearly 16,000 women) compared with 54% of non-Indigenous women (age-standardised). Participation ranged from 28% in the NT to 47% in Qld. Over the period 1999–2000 to 2013–14, there has been a 12% increase in the proportion of Indigenous women screened (and a 20% increase for non-Indigenous women). In the 2012–13 Health Survey, 79% of Indigenous women aged 50–69 years reported having ever had a mammogram.
Based on 2014–15 Social Survey self-reported data, 55% of Aboriginal and Torres Strait Islander women aged 20–69 years had a pap test at least every two years. Women living in major cities were more likely to report two-yearly screening than those living in very remote areas (53% and 51% respectively).
In 2015, Commonwealth-funded Indigenous primary health care organisations reported that 30% of regular female clients had a cervical screening in the previous 2 years, 39% in the previous 3 years and 48% in the previous 5 years. Proportions were highest in the NT and very remote areas (66% and 62% respectively for those screened in the last 5 years).
For all Australian women aged 20–69, 57% were recorded in the national cervical screening register in 2014–15 (AIHW, 2016r).
In 2014, around 487,700 Australians participated in the NBCSP, with just under 3,900 (0.8%) identifying as Indigenous. Participants recorded as Indigenous were more likely to receive a positive (i.e. potentially abnormal) test result than non-Indigenous participants (11% and 7% respectively). Yet Indigenous participants with a positive result had lower rates of follow-up colonoscopy (59% compared with 74%) and a longer median time between a positive screen and assessment (83 days compared with 54) (AIHW, 2016q).
In the 2012–13 Health Survey, for those aged 50–74 years, 18% of Indigenous males and 11% of Indigenous females reported having ever participated in bowel cancer screening tests. For Indigenous males aged 50 years and over, 64% reported having ever been tested for prostate cancer in 2012–13.
Implications Early detection and early treatment through primary health care has significant benefits for those at risk of disease. Identification of Indigenous patients is the first step in providing access to Aboriginal and Torres Strait Islander specific health initiatives, including the additional MBS, Pharmaceutical Benefits Scheme (PBS), and immunisation. Improving follow-up of abnormal clinical findings/results and access to referral services is also critical to achieving the benefits of health assessments and screening programmes (Bailie, J et al, 2014; Spurling et al, 2009; Whop et al, 2016).
The Australian Government provides GP health assessments for Aboriginal and Torres Strait Islander peoples under the MBS, along with follow-on care and incentive payments for improved chronic disease management and cheaper medicines through the PBS. The Practice Incentives Program—Indigenous Health Incentive aims to support general practices and Indigenous health services to provide better health care for Indigenous patients including identifying the Indigenous status of patients and best practice management of chronic disease.
Chronic disease strategies are included in the Implementation Plan for the National Aboriginal and Torres Strait Islander Health Plan 2013–2023 and the Indigenous Australians’ Health Programme (see Policies and Strategies section). Under the Plan, the rate of health assessments for those aged 0-4, 5-14, 15-24, and 25-54 years is being monitored. For trend analysis of these groups see the AIHW Detailed Analyses.
Given the lower Indigenous participation rates in breast, bowel and cervical cancer screening programmes, better ways of

Effective/Appropriate/Efficient
154
encouraging regular screening are needed (Christou et al, 2010). In the 2014–15 Budget, the Australian Government committed to accelerate the roll-out of a biennial bowel screening interval for all Australians aged 50–74 years of age from 2015 to 2020.
Three years of funding from 2016–17 has been allocated to pilot and evaluate a range of strategies to increase NBCSP participation in up to 50 Indigenous primary health care services to determine the most effective model/strategies for potential national implementation. The pilot will have screening kits offered by health
professionals as an alternative to the usual direct mail approach and test different levels of implementation support and training for participating services.
Communication activities encouraging Aboriginal and Torres Strait Islander people to participate in both breast screening and bowel screening has been ongoing since 2014.
The Wirraka Maya Health Service funds primary prevention in Aboriginal communities (e.g. child health checks, hygiene sessions, ear health education, an alcohol in pregnancy intervention and development of an outreach service to
surrounding communities), which has resulted in an estimated 400 child health checks and 1,000 immunisations per annum. Cancer Council Victoria’s Under Screened Recruitment Program targets Indigenous Australian participation in breast, cervical and bowel screening.
Cervical screening will remain vital for many decades as the current HPV vaccines are not effective against all types of the virus that cause cervical cancer. A barrier to reporting on cervical screening is that pathology request forms do not include provision for Indigenous status to be recorded in all jurisdictions.
Figure 3.04-1 MBS health assessment rates, by selected age groups, Indigenous Australians, 2006–07 to 2015–16
Source: AIHW analysis of Medicare Australia data
Figure 3.04-2 Participation rates for BreastScreen Australia, women aged 50–69 years, by Indigenous status, 1999–2000 to 2013–14
Source: AIHW analysis of BreastScreen Australia data
Figure 3.04-3 Proportion of Indigenous women aged 20–69 years reporting having at least 2 yearly pap test, by remoteness, 2012–13
Source: ABS and AIHW analysis of 2012–13 AATSIHS
Table 3.04-1 Summary of NBCSP screening, results and assessments, people aged 50–74, by Indigenous status, 2014
Indigenous Non-Indigenous
Numbers
Screened 3,888 473,702
Positive FOBT result 407 33,007
Diagnostic assessment (colonoscopy) 239 24,438
Rates (%)
FOBT positivity rate 10.5 7
Diagnostic assessment rate 58.7 74
Time between positive screen and assessment (days)
Median 83 54
90th percentile 196 154
Source: National Bowel Cancer ScreeningProgram Register as at 31 December 2015
0
50
100
150
200
250
300
350
400
Rate
per
1,0
00 p
opul
atio
n
Year
0–14 years 15–54 years 55 years and over
0
20
40
60
80
100
00 01 02 03 04 05 06 07 08 09 10 11 12 13 14
Per c
ent (
part
icip
atio
n)
Year ending 30 June
Indigenous women Non-Indigenous women
5358 57 56
5155
0
20
40
60
80
100
Majorcities
Innerregional
Outerregional
Remote Veryremote
Australia
Per c
ent
Remoteness area
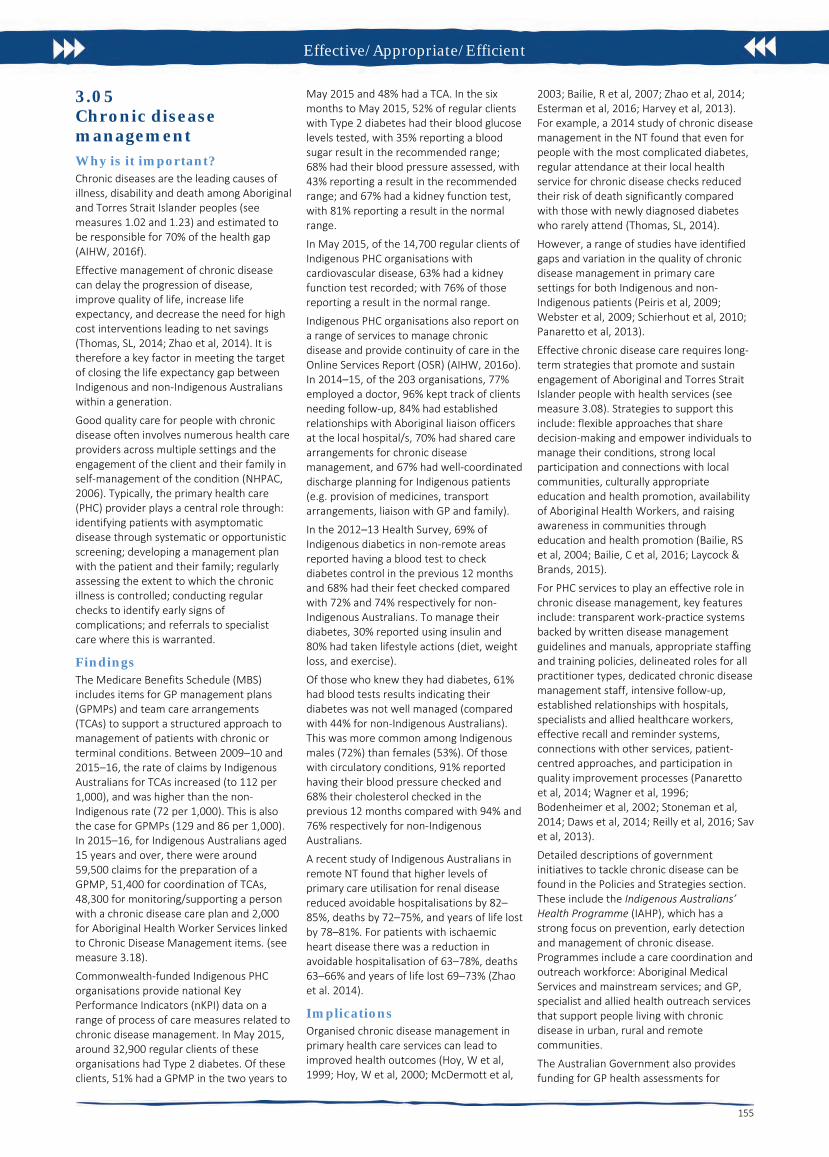
Effective/Appropriate/Efficient
155
3.05 Chronic disease management Why is it important? Chronic diseases are the leading causes of illness, disability and death among Aboriginal and Torres Strait Islander peoples (see measures 1.02 and 1.23) and estimated to be responsible for 70% of the health gap (AIHW, 2016f).
Effective management of chronic disease can delay the progression of disease, improve quality of life, increase life expectancy, and decrease the need for high cost interventions leading to net savings (Thomas, SL, 2014; Zhao et al, 2014). It is therefore a key factor in meeting the target of closing the life expectancy gap between Indigenous and non-Indigenous Australians within a generation.
Good quality care for people with chronic disease often involves numerous health care providers across multiple settings and the engagement of the client and their family in self-management of the condition (NHPAC, 2006). Typically, the primary health care (PHC) provider plays a central role through: identifying patients with asymptomatic disease through systematic or opportunistic screening; developing a management plan with the patient and their family; regularly assessing the extent to which the chronic illness is controlled; conducting regular checks to identify early signs of complications; and referrals to specialist care where this is warranted.
Findings The Medicare Benefits Schedule (MBS) includes items for GP management plans (GPMPs) and team care arrangements (TCAs) to support a structured approach to management of patients with chronic or terminal conditions. Between 2009–10 and 2015–16, the rate of claims by Indigenous Australians for TCAs increased (to 112 per 1,000), and was higher than the non-Indigenous rate (72 per 1,000). This is also the case for GPMPs (129 and 86 per 1,000). In 2015–16, for Indigenous Australians aged 15 years and over, there were around 59,500 claims for the preparation of a GPMP, 51,400 for coordination of TCAs, 48,300 for monitoring/supporting a person with a chronic disease care plan and 2,000 for Aboriginal Health Worker Services linked to Chronic Disease Management items. (see measure 3.18).
Commonwealth-funded Indigenous PHC organisations provide national Key Performance Indicators (nKPI) data on a range of process of care measures related to chronic disease management. In May 2015, around 32,900 regular clients of these organisations had Type 2 diabetes. Of these clients, 51% had a GPMP in the two years to
May 2015 and 48% had a TCA. In the six months to May 2015, 52% of regular clients with Type 2 diabetes had their blood glucose levels tested, with 35% reporting a blood sugar result in the recommended range; 68% had their blood pressure assessed, with 43% reporting a result in the recommended range; and 67% had a kidney function test, with 81% reporting a result in the normal range.
In May 2015, of the 14,700 regular clients of Indigenous PHC organisations with cardiovascular disease, 63% had a kidney function test recorded; with 76% of those reporting a result in the normal range.
Indigenous PHC organisations also report on a range of services to manage chronic disease and provide continuity of care in the Online Services Report (OSR) (AIHW, 2016o). In 2014–15, of the 203 organisations, 77% employed a doctor, 96% kept track of clients needing follow-up, 84% had established relationships with Aboriginal liaison officers at the local hospital/s, 70% had shared care arrangements for chronic disease management, and 67% had well-coordinated discharge planning for Indigenous patients (e.g. provision of medicines, transport arrangements, liaison with GP and family).
In the 2012–13 Health Survey, 69% of Indigenous diabetics in non-remote areas reported having a blood test to check diabetes control in the previous 12 months and 68% had their feet checked compared with 72% and 74% respectively for non-Indigenous Australians. To manage their diabetes, 30% reported using insulin and 80% had taken lifestyle actions (diet, weight loss, and exercise).
Of those who knew they had diabetes, 61% had blood tests results indicating their diabetes was not well managed (compared with 44% for non-Indigenous Australians). This was more common among Indigenous males (72%) than females (53%). Of those with circulatory conditions, 91% reported having their blood pressure checked and 68% their cholesterol checked in the previous 12 months compared with 94% and 76% respectively for non-Indigenous Australians.
A recent study of Indigenous Australians in remote NT found that higher levels of primary care utilisation for renal disease reduced avoidable hospitalisations by 82–85%, deaths by 72–75%, and years of life lost by 78–81%. For patients with ischaemic heart disease there was a reduction in avoidable hospitalisation of 63–78%, deaths 63–66% and years of life lost 69–73% (Zhao et al. 2014).
Implications Organised chronic disease management in primary health care services can lead to improved health outcomes (Hoy, W et al, 1999; Hoy, W et al, 2000; McDermott et al,
2003; Bailie, R et al, 2007; Zhao et al, 2014; Esterman et al, 2016; Harvey et al, 2013). For example, a 2014 study of chronic disease management in the NT found that even for people with the most complicated diabetes, regular attendance at their local health service for chronic disease checks reduced their risk of death significantly compared with those with newly diagnosed diabetes who rarely attend (Thomas, SL, 2014).
However, a range of studies have identified gaps and variation in the quality of chronic disease management in primary care settings for both Indigenous and non-Indigenous patients (Peiris et al, 2009; Webster et al, 2009; Schierhout et al, 2010; Panaretto et al, 2013).
Effective chronic disease care requires long-term strategies that promote and sustain engagement of Aboriginal and Torres Strait Islander people with health services (see measure 3.08). Strategies to support this include: flexible approaches that share decision-making and empower individuals to manage their conditions, strong local participation and connections with local communities, culturally appropriate education and health promotion, availability of Aboriginal Health Workers, and raising awareness in communities through education and health promotion (Bailie, RS et al, 2004; Bailie, C et al, 2016; Laycock & Brands, 2015).
For PHC services to play an effective role in chronic disease management, key features include: transparent work-practice systems backed by written disease management guidelines and manuals, appropriate staffing and training policies, delineated roles for all practitioner types, dedicated chronic disease management staff, intensive follow-up, established relationships with hospitals, specialists and allied healthcare workers, effective recall and reminder systems, connections with other services, patient-centred approaches, and participation in quality improvement processes (Panaretto et al, 2014; Wagner et al, 1996; Bodenheimer et al, 2002; Stoneman et al, 2014; Daws et al, 2014; Reilly et al, 2016; Sav et al, 2013).
Detailed descriptions of government initiatives to tackle chronic disease can be found in the Policies and Strategies section. These include the Indigenous Australians’ Health Programme (IAHP), which has a strong focus on prevention, early detection and management of chronic disease. Programmes include a care coordination and outreach workforce: Aboriginal Medical Services and mainstream services; and GP, specialist and allied health outreach services that support people living with chronic disease in urban, rural and remote communities.
The Australian Government also provides funding for GP health assessments for

Effective/Appropriate/Efficient
156
Aboriginal and Torres Strait Islander people under the MBS, including follow-up care. The Medicare Chronic Disease Management items, including GPMPs and TCAs, are used by doctors to plan and coordinate the care of patients who have chronic or terminal medical conditions. From 1 July 2017, the Health Care Homes initiative will roll out in selected PHNs. Eligible patients can enrol with a participating medical practice (‘home base’) for the ongoing coordination, management and support of their conditions.
The Practice Incentives Program—Indigenous Health Incentive (PIP–IHI) supports general practices and Indigenous health services to provide better health care for Indigenous patients, including best
practice management of chronic disease. GPs receive payments for registering with the programme, for registering Indigenous patients with chronic disease and for providing best practice management of chronic disease.
The Medical Outreach Indigenous Chronic Disease Program aims to improve access to medical specialist, GP, allied and other health services for Aboriginal and Torres Strait Islander peoples. A total of $121.17 million from 2013–14 to 2016–17 has been committed for this measure.
The Quality Assurance for Aboriginal and Torres Strait Islander Medical Services program supports culturally appropriate and clinically effective management of diabetes patients in Indigenous communities. This
occurs through training, technical support and quality assurance for ‘point of care’ pathology testing (e.g. HbA1c).
A National Strategic Framework for Chronic Conditions is being developed to provide guidance to all levels of government and health professionals to work towards the delivery of a more effective and coordinated national response to chronic conditions. The Framework moves away from a disease-specific approach recognising that there are often similar underlying principles for the prevention and management of many chronic conditions. It will better cater for shared health determinants, risk factors and multi-morbidities across a broad range of chronic conditions.
Figure 3.05-1 Age-standardised rates of selected GPMPs and TCAs claimed through Medicare by Indigenous status, 2005–06 to 2015–16
Source: Medical Benefits Division, Department of Health
Figure 3.05-2 Age-standardised rate of selected MBS services claimed, by Indigenous status, 2015–16
Source: Medical Benefits Division, Department of Health
Figure 3.05-3 Tests and results for regular clients with Type 2 diabetes, Commonwealth-funded Indigenous primary health care services, as at May 2015
Source: AIHW analysis of national Key Performance Indicator data
0
50
100
150
06 07 08 09 10 11 12 13 14 15 16
Num
ber p
er 1
,000
pop
ulat
ion
Year ended 30 June
Indigenous services GPMPs Indigenous services TCAsNon-Indigenous services GPMPs Non-Indigenous services TCAs
129 112
413
607
86 72
447
1,061
0
200
400
600
800
1,000
1,200
GPMP TCA Allied Health Specialists
Serv
ices
per
1,0
00 p
opul
atio
n
Selected MBS services
Aboriginal and Torres Strait Islander peoples Non-Indigenous Australians
Regular clients with Type 2 diabetes
32,930
Blood pressure recorded in previous 6 months
22,45668%
Kidney function test recorded in previous 12 months
21,65667%
HbA1c result recorded in previous 6 months
17,275 52%
Blood pressure result ≤ 130/80mmHg
9,56543% of those recorded
Kidney function result in normal range
16,73581% of those recorded
HbA1c result ≤ 7% 6,106
35% of those recorded

Effective/Appropriate/Efficient
157
3.06 Access to hospital procedures Why is it important? Studies have shown that while Indigenous Australians are more likely to be hospitalised than other people they are less likely to receive a medical or surgical procedure while in hospital (Cunningham, 2002; ABS & AIHW, 2008). The disparities are not explained by diagnosis, age, sex or place of residence (Cunningham, 2002). For patients admitted to hospital with coronary heart disease, access to coronary angiography can be important in diagnosis and establishment of a course of treatment. Coronary heart disease may be treated with medicines or through repairing the heart’s blood vessels, either using a medical procedure (percutaneous coronary interventions) or a surgical procedure (coronary artery bypass grafts). A study of patients admitted to Qld hospitals for acute myocardial infarction (heart attack) between 1998 and 2002 found that rates of coronary procedures among Indigenous Australian patients were 22% lower than rates for other patients (Coory & Walsh, 2005). A recent study in SA found that Indigenous patients were less likely to receive angiography after controlling for age, comorbidities and remoteness (Tavella et al, 2016).
Several studies have shown Aboriginal and Torres Strait Islander peoples have poorer survival rates for cancer. This is partly explained by later diagnosis and referral for specialist treatment (Condon et al, 2006; Valery et al, 2006). However, after controlling for stage of diagnosis Indigenous Australians are less likely to have treatment for cancer (surgery, chemotherapy, radiotherapy), tend to wait longer for surgery and have lower survival rates for many cancers (Valery et al, 2006; Hall, SE et al, 2004).
The proportion of Aboriginal and Torres Strait Islander people with end stage renal failure who received a kidney transplant was lower (11%) than other Australians (47%) (see measure 1.10).
Findings In the two years to June 2015, excluding care involving dialysis, 62% of hospital episodes for Aboriginal and Torres Strait Islander peoples had a procedure recorded, compared with 81% of hospital episodes for non-Indigenous Australians. There has been a significant increase in Indigenous hospitalisation rates with a procedure recorded between 2004–05 and 2014–15 in NSW, Vic, Qld, WA, SA and the NT combined. Over the same period there was a smaller significant increase in non-Indigenous rates, resulting in a significant decrease in the gap.
For Indigenous Australians, 7% of procedures were performed in private hospitals compared with 42% for non-Indigenous Australians in the two years to June 2015. There are many factors associated with the likelihood of receiving a procedure when admitted to hospital. An analysis of the combined impact of a range of factors found that between July 2013 and June 2015 the most significant factors (in order or importance) were:
• whether the hospital was a public orprivate hospital
• the number of additional diagnosesrecorded for a patient
• the principal diagnosis for which a personwas admitted
• state/territory of usual residence • Indigenous status• age group• remoteness of usual residence • sex.
Across all age groups, Indigenous Australians were less likely to receive a procedure. Analysis by remoteness showed a decrease in hospitalisations with a procedure recorded as remoteness increased. The gap between the proportions of Indigenous and non-Indigenous Australians receiving a hospital procedure was highest in remote areas and lowest in major cities.
Between July 2013 and June 2015, among those hospitalised with coronary heart disease, Aboriginal and Torres Strait Islander people were around two-thirds as likely to receive coronary procedures such as coronary angiography and revascularisation procedures, compared with non-Indigenous Australians.
For hospitalisations related to diseases of the digestive tract between July 2013 and June 2015, the odds of Aboriginal and Torres Islander patients receiving a corresponding procedure were significantly lower than for non-Indigenous patients when the principal diagnosis was: complicated or uncomplicated hernias; diseases of the extrahepatic biliary tree; non-neoplastic diseases of the anus or rectum; and malignant neoplasms of the large intestine/rectum. There was no significant difference where the principal diagnosis was appendicitis.
Implications Disparities in hospital procedures are likely to reflect a range of factors, including ‘systemic practices, not ill-intentioned but still discriminatory, and almost invisible in the patient provider encounter’ (Fisher & Weeramanthri, 2002). An adequate primary health care system is also a prerequisite for effective hospital and specialist services.
In the 2014–15 Social Survey, 36% of Indigenous adults had incomes in the bottom 20% of Australian incomes. In the
2012–13 Health Survey, 20% of Indigenous Australians in non-remote areas reported they had private health insurance with the main barrier being affordability (72%). The lower proportion of procedures per hospitalisation is likely to be associated with private health insurance coverage and lower access to private hospitals. This may have impacts on the rate of preventative hospital treatments. A recent study found that, after adjusting for other factors, the strongest association with coronary angiography rates was admissions to private hospitals (Chew et al, 2016).
Aboriginal and Torres Strait Islander patients with chronic disease sometimes present later in the course of these illnesses, compared with non-Indigenous Australians, which affects treatment options (Valery et al, 2006). Other factors that have been suggested include: that the presence of comorbidities limits treatment options (although this does not explain the difference in coronary procedures outlined above); clinical judgments concerning post-procedural compliance; communication issues, such as for patients whose main language is not English; and patient knowledge and attitudes, e.g. fatalistic attitudes towards cancer. Physical, social and cultural distance from health services also play a role, along with financial issues patients and their families may face when seeking treatment in specialist referral services (Shahid et al, 2009; Miller et al, 2010). Analysis of 2015–16 Medicare data shows that the rate of claims for specialist services for Aboriginal and Torres Strait Islander peoples was below national averages for both in and out of hospital care. Effective strategies will require a better understanding of the factors leading to the observed disparities.
The measures presented here suggest that under-provision of specialist services for Indigenous Australians persists, and that further efforts are required to improve access. In addition to governments, clinicians and clinical colleges could also play a role in reviewing decision-making processes and relevant data to identify what drives differential access to procedures and develop strategies to address these issues (Fisher & Weeramanthri, 2002).
Heart and cardiovascular conditions make the greatest contribution to the life expectancy gap. The National Recommendations for Better Cardiac Care for Aboriginal and Torres Strait Islander People and the Lighthouse Hospital Project (see measure 1.05) aim to address the disparities in cardiovascular care. Under the former Health and Hospitals Fund, funding was provided to the NT Government for three projects to improve access to hospital procedures, including: $13.6 million for an Emergency Department at the Alice Springs
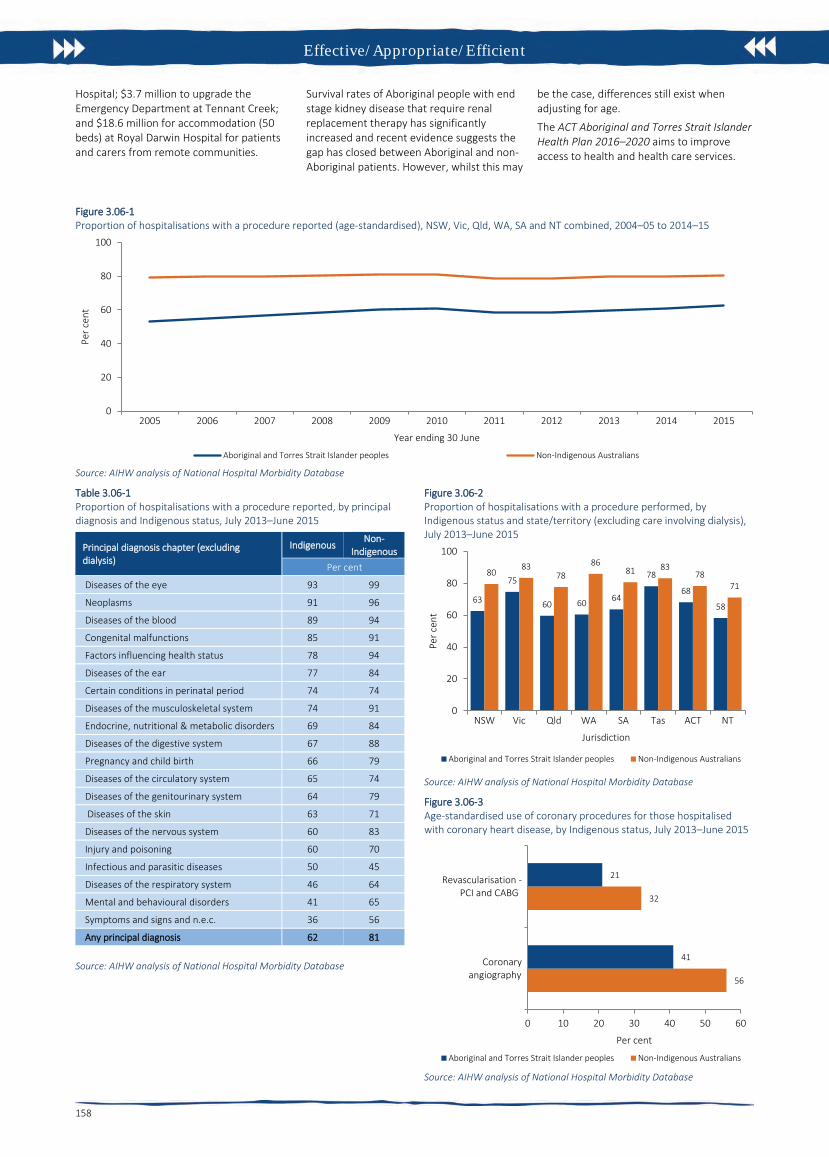
Effective/Appropriate/Efficient
158
Hospital; $3.7 million to upgrade the Emergency Department at Tennant Creek; and $18.6 million for accommodation (50 beds) at Royal Darwin Hospital for patients and carers from remote communities.
Survival rates of Aboriginal people with end stage kidney disease that require renal replacement therapy has significantly increased and recent evidence suggests the gap has closed between Aboriginal and non-Aboriginal patients. However, whilst this may
be the case, differences still exist when adjusting for age.
The ACT Aboriginal and Torres Strait Islander Health Plan 2016–2020 aims to improve access to health and health care services.
Figure 3.06-1 Proportion of hospitalisations with a procedure reported (age-standardised), NSW, Vic, Qld, WA, SA and NT combined, 2004–05 to 2014–15
Source: AIHW analysis of National Hospital Morbidity Database
Table 3.06-1 Proportion of hospitalisations with a procedure reported, by principal diagnosis and Indigenous status, July 2013–June 2015
Principal diagnosis chapter (excluding dialysis)
Indigenous Non-
Indigenous Per cent
Diseases of the eye 93 99
Neoplasms 91 96
Diseases of the blood 89 94
Congenital malfunctions 85 91
Factors influencing health status 78 94
Diseases of the ear 77 84
Certain conditions in perinatal period 74 74
Diseases of the musculoskeletal system 74 91
Endocrine, nutritional & metabolic disorders 69 84
Diseases of the digestive system 67 88
Pregnancy and child birth 66 79
Diseases of the circulatory system 65 74
Diseases of the genitourinary system 64 79
Diseases of the skin 63 71
Diseases of the nervous system 60 83
Injury and poisoning 60 70
Infectious and parasitic diseases 50 45
Diseases of the respiratory system 46 64
Mental and behavioural disorders 41 65
Symptoms and signs and n.e.c. 36 56
Any principal diagnosis 62 81
Source: AIHW analysis of National Hospital Morbidity Database
Figure 3.06-2 Proportion of hospitalisations with a procedure performed, by Indigenous status and state/territory (excluding care involving dialysis), July 2013–June 2015
Source: AIHW analysis of National Hospital Morbidity Database
Figure 3.06-3 Age-standardised use of coronary procedures for those hospitalised with coronary heart disease, by Indigenous status, July 2013–June 2015
Source: AIHW analysis of National Hospital Morbidity Database
0
20
40
60
80
100
2005 2006 2007 2008 2009 2010 2011 2012 2013 2014 2015
Per c
ent
Year ending 30 June
Aboriginal and Torres Strait Islander peoples Non-Indigenous Australians
63
75
60 60 64
78
68
58
8083
7886
81 8378
71
0
20
40
60
80
100
NSW Vic Qld WA SA Tas ACT NT
Per c
ent
Jurisdiction
Aboriginal and Torres Strait Islander peoples Non-Indigenous Australians
56
32
41
21
0 10 20 30 40 50 60
Coronaryangiography
Revascularisation - PCI and CABG
Per cent
Aboriginal and Torres Strait Islander peoples Non-Indigenous Australians
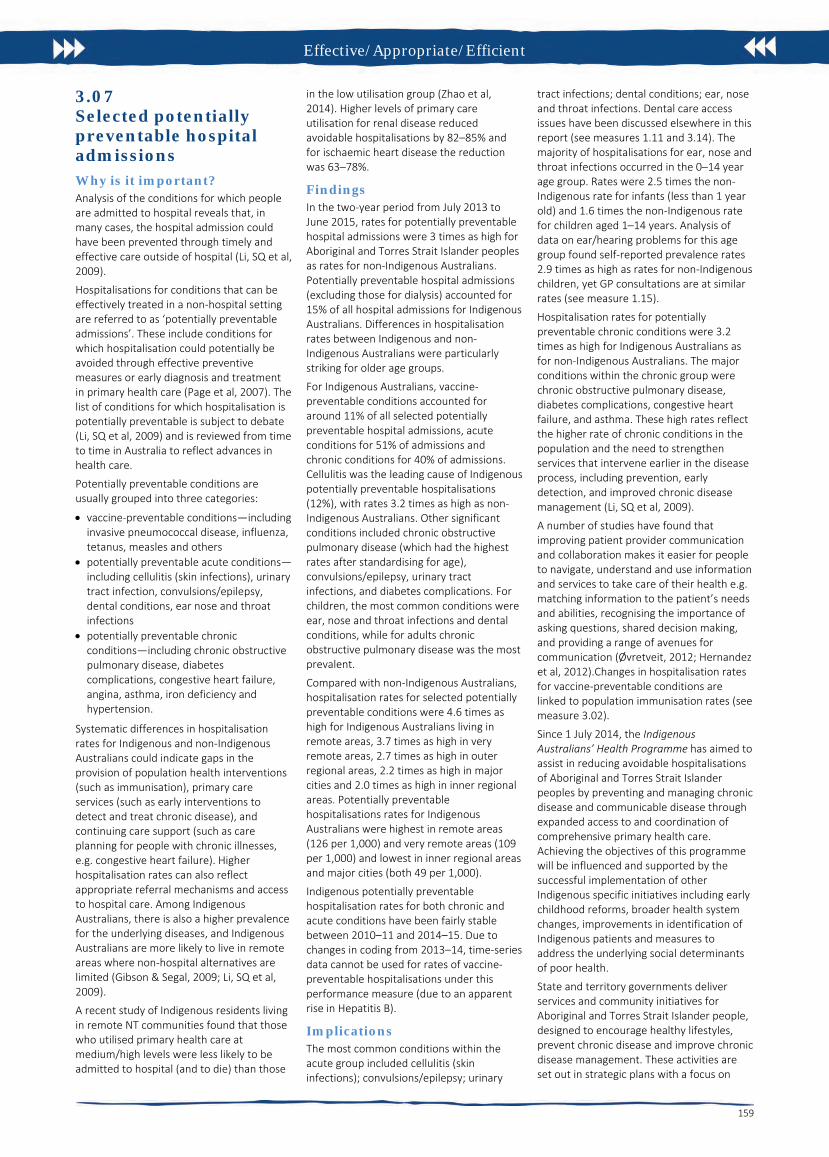
Effective/Appropriate/Efficient
159
3.07 Selected potentially preventable hospital admissions Why is it important? Analysis of the conditions for which people are admitted to hospital reveals that, in many cases, the hospital admission could have been prevented through timely and effective care outside of hospital (Li, SQ et al, 2009).
Hospitalisations for conditions that can be effectively treated in a non-hospital setting are referred to as ‘potentially preventable admissions’. These include conditions for which hospitalisation could potentially be avoided through effective preventive measures or early diagnosis and treatment in primary health care (Page et al, 2007). The list of conditions for which hospitalisation is potentially preventable is subject to debate (Li, SQ et al, 2009) and is reviewed from time to time in Australia to reflect advances in health care.
Potentially preventable conditions are usually grouped into three categories:
• vaccine-preventable conditions—includinginvasive pneumococcal disease, influenza,tetanus, measles and others
• potentially preventable acute conditions—including cellulitis (skin infections), urinarytract infection, convulsions/epilepsy,dental conditions, ear nose and throatinfections
• potentially preventable chronicconditions—including chronic obstructivepulmonary disease, diabetescomplications, congestive heart failure,angina, asthma, iron deficiency andhypertension.
Systematic differences in hospitalisation rates for Indigenous and non-Indigenous Australians could indicate gaps in the provision of population health interventions (such as immunisation), primary care services (such as early interventions to detect and treat chronic disease), and continuing care support (such as care planning for people with chronic illnesses, e.g. congestive heart failure). Higher hospitalisation rates can also reflect appropriate referral mechanisms and access to hospital care. Among Indigenous Australians, there is also a higher prevalence for the underlying diseases, and Indigenous Australians are more likely to live in remote areas where non-hospital alternatives are limited (Gibson & Segal, 2009; Li, SQ et al, 2009).
A recent study of Indigenous residents living in remote NT communities found that those who utilised primary health care at medium/high levels were less likely to be admitted to hospital (and to die) than those
in the low utilisation group (Zhao et al, 2014). Higher levels of primary care utilisation for renal disease reduced avoidable hospitalisations by 82–85% and for ischaemic heart disease the reduction was 63–78%.
Findings In the two-year period from July 2013 to June 2015, rates for potentially preventable hospital admissions were 3 times as high for Aboriginal and Torres Strait Islander peoples as rates for non-Indigenous Australians. Potentially preventable hospital admissions (excluding those for dialysis) accounted for 15% of all hospital admissions for Indigenous Australians. Differences in hospitalisation rates between Indigenous and non-Indigenous Australians were particularly striking for older age groups.
For Indigenous Australians, vaccine-preventable conditions accounted for around 11% of all selected potentially preventable hospital admissions, acute conditions for 51% of admissions and chronic conditions for 40% of admissions. Cellulitis was the leading cause of Indigenous potentially preventable hospitalisations (12%), with rates 3.2 times as high as non-Indigenous Australians. Other significant conditions included chronic obstructive pulmonary disease (which had the highest rates after standardising for age), convulsions/epilepsy, urinary tract infections, and diabetes complications. For children, the most common conditions were ear, nose and throat infections and dental conditions, while for adults chronic obstructive pulmonary disease was the most prevalent.
Compared with non-Indigenous Australians, hospitalisation rates for selected potentially preventable conditions were 4.6 times as high for Indigenous Australians living in remote areas, 3.7 times as high in very remote areas, 2.7 times as high in outer regional areas, 2.2 times as high in major cities and 2.0 times as high in inner regional areas. Potentially preventable hospitalisations rates for Indigenous Australians were highest in remote areas (126 per 1,000) and very remote areas (109 per 1,000) and lowest in inner regional areas and major cities (both 49 per 1,000).
Indigenous potentially preventable hospitalisation rates for both chronic and acute conditions have been fairly stable between 2010–11 and 2014–15. Due to changes in coding from 2013–14, time-series data cannot be used for rates of vaccine-preventable hospitalisations under this performance measure (due to an apparent rise in Hepatitis B).
Implications The most common conditions within the acute group included cellulitis (skin infections); convulsions/epilepsy; urinary
tract infections; dental conditions; ear, nose and throat infections. Dental care access issues have been discussed elsewhere in this report (see measures 1.11 and 3.14). The majority of hospitalisations for ear, nose and throat infections occurred in the 0–14 year age group. Rates were 2.5 times the non-Indigenous rate for infants (less than 1 year old) and 1.6 times the non-Indigenous rate for children aged 1–14 years. Analysis of data on ear/hearing problems for this age group found self-reported prevalence rates 2.9 times as high as rates for non-Indigenous children, yet GP consultations are at similar rates (see measure 1.15).
Hospitalisation rates for potentially preventable chronic conditions were 3.2 times as high for Indigenous Australians as for non-Indigenous Australians. The major conditions within the chronic group were chronic obstructive pulmonary disease, diabetes complications, congestive heart failure, and asthma. These high rates reflect the higher rate of chronic conditions in the population and the need to strengthen services that intervene earlier in the disease process, including prevention, early detection, and improved chronic disease management (Li, SQ et al, 2009).
A number of studies have found that improving patient provider communication and collaboration makes it easier for people to navigate, understand and use information and services to take care of their health e.g. matching information to the patient’s needs and abilities, recognising the importance of asking questions, shared decision making, and providing a range of avenues for communication (Øvretveit, 2012; Hernandez et al, 2012).Changes in hospitalisation rates for vaccine-preventable conditions are linked to population immunisation rates (see measure 3.02).
Since 1 July 2014, the Indigenous Australians’ Health Programme has aimed to assist in reducing avoidable hospitalisations of Aboriginal and Torres Strait Islander peoples by preventing and managing chronic disease and communicable disease through expanded access to and coordination of comprehensive primary health care. Achieving the objectives of this programme will be influenced and supported by the successful implementation of other Indigenous specific initiatives including early childhood reforms, broader health system changes, improvements in identification of Indigenous patients and measures to address the underlying social determinants of poor health.
State and territory governments deliver services and community initiatives for Aboriginal and Torres Strait Islander people, designed to encourage healthy lifestyles, prevent chronic disease and improve chronic disease management. These activities are set out in strategic plans with a focus on

Effective/Appropriate/Efficient
160
Aboriginal and Torres Strait Islander people, for example the Western Australia Aboriginal Health and Wellbeing Framework 2015–2030 and the ACT Aboriginal and Torres Strait Islander Health Plan 2016–2020. The ACT plan specifically seeks to improve access
to health and health care services. This includes continued support for Winnunga Nimmityjah Aboriginal Health Service to deliver primary health services, Gugan Gulwan Youth Aboriginal Corporation to provide health and support services for
young people and an additional funding commitment in 2016–17 to support additional specialist outreach programs and extension of selected existing programs.
Figure 3.07-1 Potentially preventable hospital admissions (age-standardised rates), by Indigenous status and remoteness, July 2013–June 2015
Source: AIHW Analysis of National Hospital Morbidity Database
Figure 3.07-2 Potentially preventable hospital admissions, by Indigenous status and age group, July 2013–June 2015
Source: AIHW Analysis of National Hospital Morbidity Database
Figure 3.07-3 Top 10 potentially preventable hospital admissions (age-standardised rates), by Indigenous status, July 2013–June 2015
Source: AIHW Analysis of National Hospital Morbidity Database
0
20
40
60
80
100
120
140
Majorcities
Innerregional
Outerregional
Remote Veryremote
Australia
Num
ber p
er 1
,000
pop
ulat
ion
Remoteness area
Aboriginal and Torres Strait Islander peoples Non-Indigenous Australians
49
23 21
36
62
89
113
171
27
14 11 10 12 1726
78
0
20
40
60
80
100
120
140
160
180
0–4 5–14 15–24 25–34 35–44 45–54 55–64 65+N
umbe
r per
1,0
00 p
opul
atio
n
Age group (years)
Aboriginal and Torres Strait Islander peoples Non-Indigenous Australians
0
5
10
15
ChronicObstructivePulmonary
Disease
Cellulitis Urinary tractinfections incl.Pyelonephritis
Diabetescomplications
Other VaccinePreventable
Convulsionsand epilepsy
CongestiveHeart Failure
Dentalconditions
ENT infections Asthma
Num
ber p
er 1
,000
pop
ulat
ion
Aboriginal and Torres Strait Islander peoples Non-Indigenous Australians
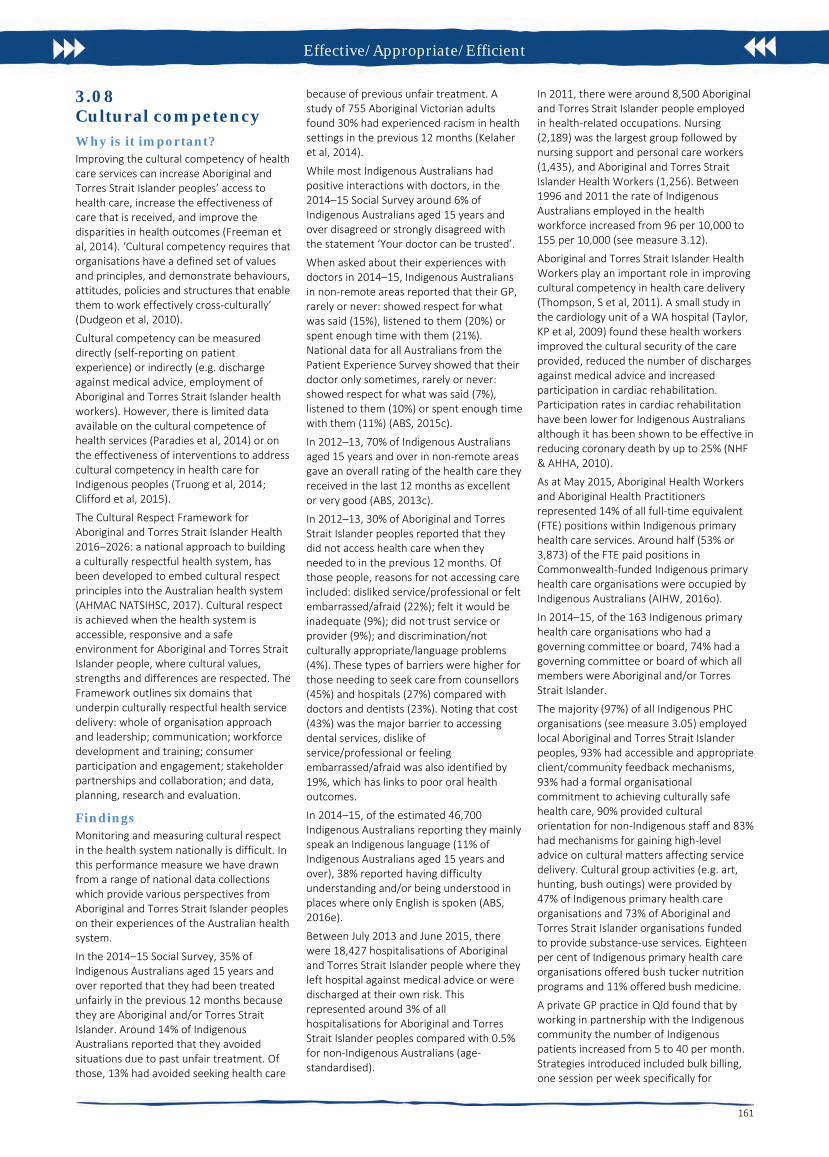
Effective/Appropriate/Efficient
161
3.08 Cultural competency Why is it important? Improving the cultural competency of health care services can increase Aboriginal and Torres Strait Islander peoples’ access to health care, increase the effectiveness of care that is received, and improve the disparities in health outcomes (Freeman et al, 2014). ‘Cultural competency requires that organisations have a defined set of values and principles, and demonstrate behaviours, attitudes, policies and structures that enable them to work effectively cross-culturally’ (Dudgeon et al, 2010).
Cultural competency can be measured directly (self-reporting on patient experience) or indirectly (e.g. discharge against medical advice, employment of Aboriginal and Torres Strait Islander health workers). However, there is limited data available on the cultural competence of health services (Paradies et al, 2014) or on the effectiveness of interventions to address cultural competency in health care for Indigenous peoples (Truong et al, 2014; Clifford et al, 2015).
The Cultural Respect Framework for Aboriginal and Torres Strait Islander Health 2016–2026: a national approach to building a culturally respectful health system, has been developed to embed cultural respect principles into the Australian health system (AHMAC NATSIHSC, 2017). Cultural respect is achieved when the health system is accessible, responsive and a safe environment for Aboriginal and Torres Strait Islander people, where cultural values, strengths and differences are respected. The Framework outlines six domains that underpin culturally respectful health service delivery: whole of organisation approach and leadership; communication; workforce development and training; consumer participation and engagement; stakeholder partnerships and collaboration; and data, planning, research and evaluation.
Findings Monitoring and measuring cultural respect in the health system nationally is difficult. In this performance measure we have drawn from a range of national data collections which provide various perspectives from Aboriginal and Torres Strait Islander peoples on their experiences of the Australian health system.
In the 2014–15 Social Survey, 35% of Indigenous Australians aged 15 years and over reported that they had been treated unfairly in the previous 12 months because they are Aboriginal and/or Torres Strait Islander. Around 14% of Indigenous Australians reported that they avoided situations due to past unfair treatment. Of those, 13% had avoided seeking health care
because of previous unfair treatment. A study of 755 Aboriginal Victorian adults found 30% had experienced racism in health settings in the previous 12 months (Kelaher et al, 2014).
While most Indigenous Australians had positive interactions with doctors, in the 2014–15 Social Survey around 6% of Indigenous Australians aged 15 years and over disagreed or strongly disagreed with the statement ‘Your doctor can be trusted’.
When asked about their experiences with doctors in 2014–15, Indigenous Australians in non-remote areas reported that their GP, rarely or never: showed respect for what was said (15%), listened to them (20%) or spent enough time with them (21%). National data for all Australians from the Patient Experience Survey showed that their doctor only sometimes, rarely or never: showed respect for what was said (7%), listened to them (10%) or spent enough time with them (11%) (ABS, 2015c).
In 2012–13, 70% of Indigenous Australians aged 15 years and over in non-remote areas gave an overall rating of the health care they received in the last 12 months as excellent or very good (ABS, 2013c).
In 2012–13, 30% of Aboriginal and Torres Strait Islander peoples reported that they did not access health care when they needed to in the previous 12 months. Of those people, reasons for not accessing care included: disliked service/professional or felt embarrassed/afraid (22%); felt it would be inadequate (9%); did not trust service or provider (9%); and discrimination/not culturally appropriate/language problems (4%). These types of barriers were higher for those needing to seek care from counsellors (45%) and hospitals (27%) compared with doctors and dentists (23%). Noting that cost (43%) was the major barrier to accessing dental services, dislike of service/professional or feeling embarrassed/afraid was also identified by 19%, which has links to poor oral health outcomes.
In 2014–15, of the estimated 46,700 Indigenous Australians reporting they mainly speak an Indigenous language (11% of Indigenous Australians aged 15 years and over), 38% reported having difficulty understanding and/or being understood in places where only English is spoken (ABS, 2016e).
Between July 2013 and June 2015, there were 18,427 hospitalisations of Aboriginal and Torres Strait Islander people where they left hospital against medical advice or were discharged at their own risk. This represented around 3% of all hospitalisations for Aboriginal and Torres Strait Islander peoples compared with 0.5% for non-Indigenous Australians (age-standardised).
In 2011, there were around 8,500 Aboriginal and Torres Strait Islander people employed in health-related occupations. Nursing (2,189) was the largest group followed by nursing support and personal care workers (1,435), and Aboriginal and Torres Strait Islander Health Workers (1,256). Between 1996 and 2011 the rate of Indigenous Australians employed in the health workforce increased from 96 per 10,000 to 155 per 10,000 (see measure 3.12).
Aboriginal and Torres Strait Islander Health Workers play an important role in improving cultural competency in health care delivery (Thompson, S et al, 2011). A small study in the cardiology unit of a WA hospital (Taylor, KP et al, 2009) found these health workers improved the cultural security of the care provided, reduced the number of discharges against medical advice and increased participation in cardiac rehabilitation. Participation rates in cardiac rehabilitation have been lower for Indigenous Australians although it has been shown to be effective in reducing coronary death by up to 25% (NHF & AHHA, 2010).
As at May 2015, Aboriginal Health Workers and Aboriginal Health Practitioners represented 14% of all full-time equivalent (FTE) positions within Indigenous primary health care services. Around half (53% or 3,873) of the FTE paid positions in Commonwealth-funded Indigenous primary health care organisations were occupied by Indigenous Australians (AIHW, 2016o).
In 2014–15, of the 163 Indigenous primary health care organisations who had a governing committee or board, 74% had a governing committee or board of which all members were Aboriginal and/or Torres Strait Islander.
The majority (97%) of all Indigenous PHC organisations (see measure 3.05) employed local Aboriginal and Torres Strait Islander peoples, 93% had accessible and appropriate client/community feedback mechanisms, 93% had a formal organisational commitment to achieving culturally safe health care, 90% provided cultural orientation for non-Indigenous staff and 83% had mechanisms for gaining high-level advice on cultural matters affecting service delivery. Cultural group activities (e.g. art, hunting, bush outings) were provided by 47% of Indigenous primary health care organisations and 73% of Aboriginal and Torres Strait Islander organisations funded to provide substance-use services. Eighteen per cent of Indigenous primary health care organisations offered bush tucker nutrition programs and 11% offered bush medicine.
A private GP practice in Qld found that by working in partnership with the Indigenous community the number of Indigenous patients increased from 5 to 40 per month. Strategies introduced included bulk billing, one session per week specifically for
Effective/Appropriate/Efficient
162
Indigenous patients and a bus to the clinic. In addition, cultural safety training was undertaken by staff and an Indigenous health worker attended the clinic to assist with cultural safety and referrals (Johanson & Hill, 2011).
Implications There are key gaps in the evidence on the cultural competency of health services in Australia.
To Aboriginal and Torres Strait Islander peoples the term ‘health’ means not just the physical wellbeing of an individual but refers to the social, emotional and cultural wellbeing of the whole community in which each individual is able to achieve their full potential as a human being thereby bringing about the total wellbeing of their community. Australian governments have focused on improving the cultural competency of health services in several ways.
The National Aboriginal and Torres Strait Islander Health Plan 2013–2023 (NATSIHP) draws attention to ‘the centrality of culture in the health of Aboriginal and Torres Strait Islander peoples and the rights of individuals to a safe, healthy and empowered life’. Achieving improvements in health outcomes for Indigenous Australians means working towards fulfilling the vision of the NATSIHP; a health system that is free of racism and inequality and where all Aboriginal and Torres Strait Islander people have access to health services that are effective, high quality, appropriate and affordable.
In 2015, the Australian Government released the Implementation Plan for the NATSIHP, which includes activities intended to deliver against the following strategy: Mainstream health services are supported to provide clinically competent, culturally safe, accessible, accountable and responsive services to Aboriginal and Torres Strait Islander peoples in a health system that is free of racism and inequality.
The development and delivery of well-designed and implemented cultural safety training programs can assist in the aim of achieving a health system that is a safe environment for Aboriginal and Torres Strait Islander peoples and where cultural differences are respected. The Department of Health funded the development of the Aboriginal and Torres Strait Islander Health Curriculum Framework. The framework supports higher education providers to implement Aboriginal and Torres Strait Islander health curricula across their health professional training programs. Developed with extensive input and guidance from a wide range of stakeholders around Australia, the framework aims to prepare graduates across health professions to provide culturally safe health services to Aboriginal and Torres Strait Islander peoples through
the development of cultural capabilities during their undergraduate training.
Aboriginal and Torres Strait Islander health professional organisations are funded to support and increase the capacity of the Aboriginal and Torres Strait Islander health workforce and contribute to promoting a culturally appropriate health care system with improved access to services and improved health outcomes for Aboriginal and Torres Strait Islander peoples. They contribute to increasing the number of health care providers delivering culturally appropriate care by providing advice, cultural safety training and practical support for employers, as well as providing advice to Government and other stakeholders on issues affecting the Aboriginal and Torres Strait Islander health workforce.
Australian Government funding is also provided to the Leaders in Indigenous Medical Education Network, which focuses on improving the quality and effectiveness of teaching and learning of Indigenous health in medical education through a nationally agreed curriculum framework, and for promoting best practice in the recruitment and retention of Indigenous medical students.
A key document to guide national Aboriginal and Torres Strait Islander health workforce policy and planning in relation to providing culturally safe and responsive health care is the National Aboriginal and Torres Strait Islander Health Workforce Strategic Framework (2016–2023), which has been developed within the overall policy context of the NATSIHP.
The Practice Incentives Program—Indigenous Health Incentive (PIP–IHI) supports general practices and Indigenous health services to provide better health care for Aboriginal and Torres Strait Islander patients. Payments are made to practices that register for the PIP–IHI and meet certain requirements, one of which is having at least two staff members from the practice (one of whom must be a GP) completing appropriate cultural awareness training. In 2014–15, about 3,700 general practices and Indigenous health services had signed on to the incentive and around 64,700 patients were registered.
The Australian Commission of Safety in Health Care is developing a guide on strategies and best practice for mainstream services (including acute care) in the delivery of care for Indigenous Australians.
The Australasian College for Emergency Medicine has developed a series of educational tools and resources designed for doctors to enhance culturally competent communication and overall care for Aboriginal and Torres Strait Islander patients in the emergency department.
The Aboriginal and Torres Strait Islander Healing Foundation found that understanding and addressing trauma can have a positive effect on people’s lives, relationships and workplaces. Since 2012, the Foundation has supported 62 community education and workforce development projects around Australia. One of the key aims of the projects is to build a workforce with increased capacity to recognise and respond to trauma, loss and grief. The current funding agreement (2015–18) allocates $3.6 million for trauma-informed Indigenous healing education and workforce development; and capacity building and knowledge creation for service providers of healing programmes. In 2014–15, 84.5% of all participants in trauma education projects reported that they can now better manage the impact of trauma. A further $14 million has been allocated for other healing programmes.
A WA report on cancer care (Thompson, S et al, 2011) made several practical recommendations to improve the cultural competency of care for Aboriginal patients including: providing a welcoming environment through welcome to country services, yarning places and access to traditional foods; facilitating the return of Aboriginal patients to their homelands for continued care where possible; ensuring that there is access to Aboriginal interpreters for Aboriginal people who are not confident speakers of English, and that staff understand differences in Aboriginal verbal and non-verbal communication styles; and ensuring service providers are familiar with, acknowledge and respect Aboriginal family structures, culture and life circumstances.
An evaluation of the Victorian government’s Koolin Balit investment is showing improvements in cultural responsiveness and cultural safety for Aboriginal people in some Victorian hospitals.
The ACT Health Aboriginal and Torres Strait Islander Health Impact Statement is a tool to assess the needs of Aboriginal and Torres Strait Islander peoples in relation to policies as they are in development.

Effective/Appropriate/Efficient
163
Figure 3.08-1 Aboriginal and Torres Strait Islander primary health care organisations, by proportion of services with cultural safety policies or processes in place, 2014–15
Source: AIHW analyses of 2014–15 OSR data collection
Figure 3.08-2 Aboriginal and Torres Strait Islander people employed in select health-related occupations, rates (per 10,000), 1996, 2001, 2006 and 2011
Source: AIHW analysis of ABS Census data
Figure 3.08-3 Reasons Indigenous Australians did not access health services when needed to, 2012–13
Note: more than one response allowed, sum may exceed 100% Source: ABS and AIHW analysis of 2012–13 AATSIHS
97
93
93
90
83
66
57
0 10 20 30 40 50 60 70 80 90 100
Employs local Aboriginal and Torres Strait Islander peoples
Client and community feedback mechanisms
Formal organisational commitment to culturally safe health care
Cultural orientation for non-Indigenous staff
Mechanisms for gaining high level advice on cultural matters affecting service delivery
Formal cultural safety policies developed in consultation with communities and staff
Cultural competence a part of staff performance appraisal
Per cent of Indigenous primary health care organisations
0
10
20
30
40
50
Nurses Aboriginal andTorres Strait Islander
Health Workers
Nursing support &personal care
workers
Health diagnosticand promotionprofessionals
Allied healthprofessionals
Dental/dental alliedworkforce
Medical practioners
Rate
per
10,
000
popu
latio
n
1996 2001 2006 2011
32
18
23
23
27
45
36
35
13
43
8
16
40
28
34
33
37
22
54
48
57
30
53
57
0 20 40 60 80 100 120 140 160 180
Total Services
Other health professional
Doctor
Dentist
Hospital
Counsellor
Per centCultural appropriateness of service Cost Logistical reasons Personal reasons

Effective/Appropriate/Efficient
164
Table 3.08-1 Indigenous Australians who did not access health services when needed to, and reasons relating to cultural appropriateness,2012–13
Dentist Doctor Other health professional Hospital Counsellor
Total health services
Per cent
Did not access service when needed to in last 12 months 21 14 9 6 6 30
Reason(s) did not access service
Discrimination/ not culturally appropriate/ language problems 2† 3† 2† 4† 4† 4
Dislikes service/professional, embarrassed, afraid 19 14 13 14 27 22
Felt it would be inadequate 1† 9 5 9 18 9
Does not trust service provider 4 6 3 8 12 9
Cultural appropriateness of service (subtotal) 23 23 18 27 45 32 † Estimate has a relative standard error between 25% and 50% and should be used with caution. Source: ABS and AIHW analysis of 2012–13 AATSIHS
Figure 3.08-4 Patient experience, Indigenous Australians aged 15 years and over who saw a doctor or specialist, non-remote areas, 2014–15
Source: ABS and AIHW analysis of 2014–15 NATSISS
8085
79
2015
21
0
20
40
60
80
100
GP listened carefully GP showed respect for what was said GP spent enough time with person
Per c
ent
Always/often Sometimes/rarely/never

Responsive
165
3.09 Discharge against medical advice Why is it important? Indigenous Australians are more likely than non-Indigenous Australians to leave hospitals without completing treatment. Patient experiences of health care services impact on health-related behaviours and health outcomes. People who take their own leave from hospital are more likely to re-present to emergency departments and have higher mortality rates (Shaw, 2016).
The measure reported here is based on the extent to which Aboriginal and Torres Strait Islander people ‘vote with their feet’ (i.e. in discharging themselves from hospital against medical advice). The measure provides indirect evidence of the extent to which hospital services are responsive to Indigenous Australian patients’ needs. There have been a limited number of studies on the reasons Indigenous Australians take their own leave from hospital. However common factors include: institutionalised racism; a lack of cultural safety; a distrust of the health system; miscommunication; family and social obligations; isolation and loneliness; a lack of understanding of the treatment they were receiving and feeling that the treatment had finished; and communication and language barriers between staff and patient (Shaw, 2016).
Findings Between July 2013 and June 2015, there were 18,427 hospitalisations where Aboriginal and Torres Strait Islander people left hospital against medical advice or were discharged at their own risk. After adjusting for age, this represented 3.4% of all hospitalisations for Aboriginal and Torres Strait Islander peoples compared with 0.5% for non-Indigenous Australians. Indigenous Australians were discharged from hospital against medical advice at 7 times the rate of non-Indigenous Australians.
Discharges from hospital against medical advice are most common for Aboriginal and Torres Strait Islander peoples aged 25–54 years. They are also more common for Indigenous Australians living in remote and very remote areas. The proportion of discharge against medical advice for Aboriginal and Torres Strait Islander peoples was highest in the NT (10% of all hospitalisations) and lowest in Tasmania, and the ACT (both less than 2%).
Among Indigenous Australians who were discharged against medical advice, the most common principal diagnoses for hospitalisations were injury and poisoning (4,019 hospitalisations), followed by symptoms, signs and abnormal clinical and laboratory findings not elsewhere classified (2,322 hospitalisations) and respiratory
disease (2,098 hospitalisations). These three groups of diagnoses represented 46% of all hospitalisations for which Indigenous patients were discharged against medical advice. As a proportion of all hospitalisations of Indigenous Australians for each specific diagnoses group, discharge against medical advice was highest for endocrine, nutritional and metabolic disorders (including diabetes) (7.4%), followed by injury and poisoning and external causes (7.0%).
An analysis of the relative impact of a range of factors over the period July 2013 to June 2015 found that Indigenous status was the single most significant variable contributing to whether a patient would discharge themselves from hospital against medical advice, even after controlling for the other factors. Other factors that were significant in order of importance after Indigenous status were:
• sex• principal diagnosis• age group• remoteness of hospital• state/territory of hospital• remoteness of usual residence • state/territory of usual residence.
In 2015–16, there were around 12,000 Emergency Department presentations for Indigenous Australians where the patient left at own risk. After adjusting for age, Indigenous patients were more likely than non-Indigenous patients to leave at their own risk (2.3% of presentations compared with 1.7%). There were around 27,000 Emergency Department presentations for Indigenous Australians where the patient did not wait. Indigenous patients were more likely than non-Indigenous patients to not wait (5.2% of presentations compared with 3.5%).
Implications The elevated levels of discharge against medical advice suggest that there are significant issues in the responsiveness of hospitals to the needs and perceptions of Aboriginal and Torres Strait Islander peoples (see measure 3.08). Mechanisms for obtaining feedback from Aboriginal and Torres Strait Islander patients will assist in responding and planning in relation to these rates of discharge against medical advice. The data suggest these issues are important for all age groups, although the issues are most evident for those aged 25–54 years.
There are several questions for health service researchers and health service managers to tackle in devising strategies to achieve more responsive and respectful service delivery. More needs to be known about the reasons for the high rates of discharge against medical advice across individual factors (such as personal circumstances, health and wellbeing, and cultural issues); community level factors
(such as levels of trust or mistrust in the health system); and hospital level factors (such as staff attitudes, hospital policies and the environment). Historical issues, such as segregation and hospitals being seen as a place to go to die are also factors to be investigated. Hospitals and health services that have implemented successful programs to reduce discharge against medical advice need to be studied and lessons disseminated.
AHMAC has funded work to develop a national framework to address key contributing and protective factors to reduce the rates of Aboriginal and Torres Strait Islander people ‘taking their own leave’ and ‘discharging against medical advice’ from Australian hospitals. This includes addressing factors that impact on access to hospital services by Aboriginal and Torres Strait Islander people, developing consumer-centred approaches that improve the health journey and the hospital environment, and improving the capability of hospitals to deliver culturally appropriate care for Aboriginal and Torres Strait Islander people.
The Australian Government through the Implementation Plan for the National Aboriginal and Torres Strait Islander Health Plan 2013–2023, has committed to reducing discrimination in the health system and improve the accessibility of health services for Aboriginal and Torres Strait Islander people. This includes funding for projects that improve Indigenous patient outcomes, such as the Lighthouse Hospital Project, which aims to drive systemic change in the acute care sector to improve care and outcomes for Aboriginal and Torres Strait Islander people who experience acute coronary syndrome.

Responsive
166
Figure 3.09-1 Proportion of hospitalisations ending in discharge against medical advice, by Indigenous status and age group, July 2013–June 2015
Source: AIHW National Hospital Morbidity Database
Figure 3.09-2 Proportion of hospitalisations ending in discharge against medical advice, by Indigenous status and jurisdiction, July 2013–June 2015
Source: AIHW National Hospital Morbidity Database
Figure 3.09-3 Proportion of hospitalisations ending in discharge against medical advice, by Indigenous status and remoteness, July 2013–June 2015
Source: AIHW National Hospital Morbidity Database
Figure 3.09-4 Proportion of hospitalisations ending in discharge against medical advice, by Indigenous status and principal diagnosis, July 2013–June 2015
Source: AIHW National Hospital Morbidity Database
1.1 0.9
4.5
6.6
8.1
6.0
3.1
1.2
0.3 0.2
1.0 0.9 0.8 0.70.4 0.2
0
1
2
3
4
5
6
7
8
9
0–4 5–14 15–24 25–34 35–44 45–54 55–64 65+
Per c
ent (
sepa
ratio
ns)
Age group (years)
Aboriginal and Torres Strait Islander peoples Non-Indigenous Australians
2.52.1 2.3
3.84.2
0.5
1.8
9.7
3.4
0.6 0.3 0.5 0.3 0.4 0.2 0.31.0
0.5
0
2
4
6
8
10
12
NSW Vic Qld WA SA Tas ACT NT Aus
Per c
ent (
sepa
ratio
ns)
Jurisdiction
Aboriginal and Torres Strait Islander peoples Non-Indigenous Australians
2.51.8
3.3
4.8
6.4
0.5 0.4 0.6 0.6 0.7
0
2
4
6
8
10
Major cities InnerRegional
OuterRegional
Remote Very Remote
Per c
ent (
sepa
ratio
ns)
Remoteness area
Aboriginal and Torres Strait Islander peoples Non-Indigenous Australians
0.5
0.1
0.1
0.4
0.3
0.6
0.3
0.4
0.5
0.6
1.0
0.8
1.1
1.0
0.9
3.4
0.8
1.2
1.9
3.1
2.6
3.3
3.6
3.6
4.0
4.4
5.4
5.2
5.6
6.4
0 1 2 3 4 5 6 7
Total
Other
Factors influencing health status
Pregnancy and child birth
Genitourinary system
Circulatory system
Musculoskeletal system
Digestive system
Nervous system
Respiratory system
Symptoms and signs etc
Infectious and parasitic diseases
Injury and poisoning
Diseases of the skin
Endocrine etc
Per cent of separations
Aboriginal and Torres Strait Islander peoples Non-Indigenous Australians
Responsive
167
3.10 Access to mental health services Why is it important? Aboriginal and Torres Strait Islander people experience higher rates of mental health issues than other Australians with deaths from suicide twice as high; hospitalisation rates for intentional self-harm 2.7 times as high; and rates of high/very high psychological distress 2.6 times as high as for other Australians (see measure 1.18). While Indigenous Australians use mental health services at higher rates than other Australians, it is hard to assess whether this use is as high as the underlying need.
Social, historical and economic disadvantage contribute to high rates of physical and mental health problems, high adult mortality, high suicide rates, child removals and incarceration rates, which in turn lead to higher rates of grief, loss and trauma (see measure 1.18). Most mental health services address mental health conditions once they have emerged rather than addressing the underlying causes of distress. Even so, early access to effective services can help diminish the effects of these problems and help restore people’s emotional and social wellbeing.
Mental health care may be provided by specialised mental health care services (e.g. private psychiatrists, and specialised hospital, residential or community services), or by general health care services that supply mental health related care (e.g. GPs and Indigenous primary health care organisations).
Findings In the 2012–13 Health Survey, 27% of Indigenous Australian adults with high/very high levels of psychological distress had seen a health professional about their distress in the previous 4 weeks. Rates were higher for females (30%), and those living in non-remote areas (29%).
The latest available data on Medicare-subsidised mental health care services, (provided by consultant psychiatrists, clinical psychologists, GPs and allied health professionals) are from 2014–15. In that year, 10% of Indigenous Australians accessed Medicare-subsidised clinical mental health care services, as did 9% of non-Indigenous Australians (SCRGSP, 2017).
Based on GP survey data (2010–15), 11% of all problems managed by GPs among Indigenous patients were related to mental health. Depression (47 per 1,000 encounters) and anxiety (23 per 1,000 encounters) were the main mental health related problems managed. After adjusting for differences in the age profiles of the two populations, GPs managed mental health
problems for Indigenous Australians at 1.2 times the rate for other Australians.
Most of the 203 Commonwealth-funded Indigenous primary health care (PHC) organisations provided care in relation to social and emotional wellbeing (SEWB) and mental health issues. As at 31 May 2015, these organisations employed 440 FTE SEWB staff (49% Indigenous). In 2014–15, these staff provided 189,900 client contacts. Depression (76%), anxiety/stress (71%), grief and loss issues (70%), family/relationship issues (63%) and family/community violence (56%) were the most common SEWB related issues managed in terms of staff time and organisational resources (AIHW, 2016o).
In 2014–15, there were 97 organisations funded by the Commonwealth to provide SEWB or Link Up counselling services to Indigenous Australians (82 of which were also funded for PHC and included above). Within these organisations, 221 counsellors provided about 100,150 client contacts to over 21,100 clients (an average of 4–5 contacts for each client) (AIHW, 2016o).
State/territory-based specialised community mental health services reported 744,900 service contacts for Indigenous clients in 2014–15 (10% of client contacts). Rates for Indigenous Australians were 4 times the rates for non-Indigenous Australians and were higher across all age groups, particularly those aged 25–44 years. Community mental health care contact rates for Indigenous Australians were highest in the ACT (2,604 per 1,000) and lowest in Tas (293 per 1,000). The rate of residential mental health care episodes in the same period was 62 per 100,000 for Indigenous Australians—1.9 times the rate for non-Indigenous Australians.
Access to specialist psychiatry in rural and remote Australia is particularly problematic (Hunter, E, 2007). In 2014, for clinical psychologists, there were 31 FTE per 100,000 people in remote/very remote areas compared with 102 per 100,000 in major cities.
In 2015–16, Indigenous Australians were less likely than non-Indigenous Australians to have claimed through Medicare for psychologist care (133 compared with 200 per 1,000) and also psychiatric care (52 compared with 97 per 1,000). In addition, Indigenous Australians utilised the Access to Allied Psychological Services programme at 3.5 times the rate of non-Indigenous Australians (AIHW, 2016k).
In the two years to June 2015, the hospitalisation rate for mental health issues for Indigenous males was 2.1 times the rate for non-Indigenous males, and the rate for Indigenous females was 1.5 times the rate for non-Indigenous females. Rates were highest among those aged 35–44 years (52
per 1,000 population) which was 2.3 times the non-Indigenous rate.
Between 2004–05 and 2014–15 (for NSW, Vic, Qld, WA, SA and NT), hospitalisation rates for mental health related conditions significantly increased for Indigenous Australians—by 56% for females, 36% for males and 46% overall.
Hospitalisations for mental health care can be divided into two main categories: ambulatory-equivalent (comparable to care provided by community mental health care services) and admitted patient care. In the two years to June 2015, ambulatory-equivalent separation rates were lower for Indigenous Australians than for non-Indigenous Australians where separations involved specialised psychiatric care (rate ratio of 0.3) and 3 times the rate for separations without specialised psychiatric care. For admitted patient mental health care, separation rates for Indigenous Australians were twice as high with specialised psychiatric care and 3.2 times as high without, compared with non-Indigenous patients.
The rate of available psychiatric beds in public psychiatric hospitals ranged from 9.5 per 100,000 in major cities to 1.3 per 100,000 in outer regional areas and none in remote and very remote areas. For mental health care provided in hospitals, the average length of stay was 10 days for Indigenous patients and 12 days for non-Indigenous Australians. In 2013–15, 5% of all emergency department presentations for Indigenous patients were mental health related, as were 3% for other patients (AIHW, 2016j).
Barriers to accessing mental health services include perceived potential for unwarranted intervention from government organisations, long wait times (more than one year), lack of inter-sectoral collaboration and the need for culturally competent approaches including in diagnosis (Williamson et al, 2010; McGough et al, 2017).
In a Qld study (Hepworth et al, 2015), culturally safe mental health services were integrated into primary health care by including a psychologist and social worker as core members of the primary health team. This resulted in additional client services and referrals. Key themes identified for increasing access were: responsiveness to community needs; trusted relationships; and shared cultural background and understanding.
In 2014–15, Indigenous Australians with psychiatric disability used both residential and non-residential disability support services at more than twice the rate of non-Indigenous Australians.
In 2014–15, the rate of Aboriginal and Torres Strait Islander Specialist Homelessness

Responsive
168
Services clients with a current mental health issue was more than 6 times that of non-Indigenous Australians (1,451 and 227 per 100,000 population respectively) (AIHW, 2017b).
Implications These findings suggest that Indigenous Australians are accessing primary care level mental health services more readily than specialist services, particularly in comparison to non-Indigenous Australians.
In response to the Mental Health Review in November 2015, the Australian Government committed $85 million over three years to increase culturally sensitive, integrated mental health services specifically for Aboriginal and Torres Strait Islander peoples. The funding is being provided to Primary Health Networks to plan, commission and
implement mental health services joining up closely related services such as SEWB, suicide prevention, and alcohol and other drug treatment.
The funding complements other initiatives announced under the Government’s mental health reform package which are also accessible to Indigenous Australians. These include integrated team care packages tailored to individual needs, suicide prevention activities focused on local needs, coordinated services for children and youth to achieve better mental health promotion, and prevention and early intervention.
Improving the mental health system and outcomes for people with mental illness can only be done in partnership with consumers, carers, mental health stakeholders and state and territory governments. The
Commonwealth is committed to continued consultation and engagement as reforms are implemented.
Commonwealth and state and territory governments are developing the Fifth National Mental Health Plan, which includes information specific to meeting the needs of Indigenous Australians. The Aboriginal and Torres Strait Islander Social and Emotional Wellbeing Framework is also being renewed to better acknowledge the importance of culture and identity to the health and wellbeing of Indigenous Australians.
Other mental health care and suicide prevention initiatives are detailed in measure 1.18 and the Policies and Strategies section.
Figure 3.10-1 Age-standardised mental health related problems managed by GPs per 1,000 encounters, by Indigenous status of the patient, April 2010–March 2015
Source: University of Sydney analysis of BEACH data
Figure 3.10-2 Age-standardised community mental health care service contacts per 1,000 population, by Indigenous status, 2014–15
Source: AIHW analysis of National Community Mental Health Care Database
Figure 3.10-3 Age-standardised hospitalisation rates for mental health related conditions, by Indigenous status, 2004–05 to 2014–15
Source: AIHW analysis of National Hospital Morbidity Database
Figure 3.10-4 Age-standardised hospitalisation rates for mental health related conditions, by Indigenous status and jurisdiction, July 2013–June 2015
Source: AIHW analysis of National Hospital Morbidity Database
0
40
80
120
160
200
Aboriginal and Torres StraitIslander peoples
Other Australians
Num
ber p
er 1
,000
GP
enco
unte
rs
0
200
400
600
800
1000
1200
Aboriginal and Torres StraitIslander peoples
Non-Indigenous Australians
Num
ber p
er 1
,000
GP
enco
unte
rs
0
10
20
30
40
50
05 06 07 08 09 10 11 12 13 14 15
Num
ber p
er 1
,000
pop
ulat
ion
Year ended 30 June
Aboriginal and Torres Strait Islander peoplesNon-Indigenous Australians
0
10
20
30
40
50
NSW Vic Qld WA SA Tas ACT NT Aus
Num
ber p
er 1
,000
pop
ulat
ion
Jurisdiction
Aboriginal and Torres Strait Islander peoples Non-Indigenous Australians

Responsive
169
3.11 Access to alcohol and drug services Why is it important? The 2014–15 Social Survey found that 31% of Indigenous Australians aged 15 years and over reported exceeding the alcohol guidelines for single occasion drinking and 31% reported using substances in the previous 12 months (see measures 2.16 and 2.17). The range of harms from alcohol and substance misuse includes chronic disease (e.g. liver disease), blood borne virus spread, injuries from motor vehicle accidents and assaults, incarceration, and social disruptions including family breakdown. Mental health issues are a common comorbidity and, along with poly-drug use, means that people presenting to alcohol and drug services typically have complex, multiple needs (NIDAC, 2014).
Alcohol and substance-use services provide a variety of interventions and support that seek to address harmful alcohol and other drug use, and restore the physical, social and emotional wellbeing of clients and their families (NIDAC, 2014). Services are delivered in residential and non-residential settings, in stand-alone facilities or as part of primary care services.
Access to these services by Indigenous Australians may be impacted by geography (e.g. distance to services, transport availability and road quality); the cultural competency of services (see measure 3.08); affordability (e.g. service, pharmaceutical and travel costs); and the availability of health professionals. Additional barriers include cultural beliefs and attitudes, such as shame associated with seeking treatment, concern about getting into trouble with the law and fear of losing their children (NIDAC, 2014).
Findings The 2014–15 Online Services Report (OSR) included data from 67 Commonwealth-funded organisations that provided substance-use services for Indigenous Australians. These organisations provided 151,000 episodes of care to 25,196 clients, 84% of whom were Indigenous Australians. The distribution of clients in inner regional areas was 2% compared with 38% in major cities, 25% in remote, 22% in very remote and 13% in outer regional areas (AIHW, 2016o).
For Indigenous clients, these services provided around 2,400 residential episodes of care, 13,900 sobering-up, residential respite episodes of care, and 116,200 non-residential, follow-up and aftercare episodes of care.
Most organisations reported alcohol as one of their five most common substance use
issues (96%), followed by cannabis (88%), amphetamines (70%), multiple drug use (64%) and tobacco (57%). For amphetamine use, this was an increase from 45% in 2013–14.
Treatment types used by nearly all organisations included information and education (97%), support and case management (96%) and counselling (88%). Organisations provided a wide range of drug and alcohol programmes and activities, with the most common being community education (82%), group counselling (79%), crisis intervention (75%), cultural groups (73%) and support groups (64%). For most organisations, depression (78%), anxiety/stress (73%) and grief/loss (72%) were key social and emotional wellbeing issues reported in terms of staff time and organisational resources, highlighting the known inter-relationship between substance use and mental health.
The 2014–15 Alcohol and Other Drug Treatment Services National Minimum Data Set included data from around 850 publicly funded drug and alcohol services (including some which also reported to the OSR). These services provided around 25,100 episodes of care to 17,400 Indigenous clients (representing 16% of total episodes and 15% of total clients). The Indigenous rate (3,140 clients per 100,000) was 7 times the non-Indigenous rate (457 clients per 100,000).
Indigenous clients tended to be younger than non-Indigenous clients, with the proportion of episodes in the 10–19 and 20–29 year age groups higher for Indigenous clients. The average distance travelled for treatment was greater for Indigenous clients (123km) than for non-Indigenous clients (53km) (AIHW, 2016i).
Alcohol was the principal drug of concern for 46% of Indigenous clients compared with 36% for non-Indigenous clients. The Indigenous rate for alcohol use was 9 times the non-Indigenous rate. For both Indigenous and non-Indigenous clients, the main drugs treated following alcohol were cannabis, amphetamines and then heroin (with Indigenous rates 5–7 times the non-Indigenous rates).
The main treatment types involved in episodes for Indigenous clients were counselling (42%), assessment only (18%), information and education only (10%), support and case management only (9%), rehabilitation (8%), withdrawal management (8%) and pharmacotherapy (2%) (AIHW, 2016i).
The majority of the 203 Commonwealth-funded Indigenous primary health care organisations provided care in relation to drug and alcohol issues. Alcohol, tobacco, cannabis, amphetamines and multiple drug use were the most common conditions
managed in terms of staff time and organisational resources.
Based on GP survey data (2010–15), the rate at which GPs managed mental health related problems for drug abuse and alcohol misuse at encounters with Indigenous Australians was 2 and 3 times the rate respectively of other patients (after adjusting for differences in the age profile of the two populations). In the same period, GPs offered Indigenous patients counselling or advice on alcohol at 2 times the rate for other patients. Alcohol counselling or advice represented 1.3% of all clinical and therapeutic treatments provided to Indigenous Australians (compared with 0.7% of advice to other Australians).
During the period July 2013 to June 2015, there were approximately 9,800 hospitalisations related to alcohol use for Indigenous Australians and 8,500 due to drug use. After adjusting for difference in the age structure of the two populations, Indigenous males were 4 times as likely to be hospitalised for alcohol use as non-Indigenous males and Indigenous females were 3.6 times as likely as non-Indigenous females. Indigenous Australians were also 2.7 times as likely to be hospitalised for diagnoses related to drug use as non-Indigenous Australians.
In 2015, on a ‘snapshot day’, over 3,200 Indigenous clients received pharmacotherapy treatment for opioid dependence (NSW, Qld, SA, Tas, ACT and the NT combined), accounting for 10% of all clients. Indigenous clients were around 3 times as likely to have received pharmacotherapy treatment as non-Indigenous clients and tended to be younger, with higher proportions of clients in the age groups between 15 and 39 years (AIHW, 2016h). While 60% of Indigenous prison entrants had used illicit drugs in the previous 12 months and 54% reported a high risk of alcohol-related harm in the previous 12 months in 2015, 2% of Indigenous prisoners in custody received medication for opioid dependence and 9% accessed an alcohol treatment program while in prison (AIHW, 2015d).
Implications Due to the complex, often chronic and relapsing nature of drug and alcohol conditions, a greater intensity of treatment services are required and these need to have a long-term focus, be broader than clinical responses and include the provision of social support services (Gray, D et al, 2014). Mental health and social and emotional wellbeing issues are common comorbidities.
Key themes identified for effective alcohol treatment for Indigenous Australians included: individual engagement, flexibility, assessment of suitability, Aboriginal staff, community engagement, practical support,

Responsive
170
counselling, coping with relapse, and contingency planning (Brett et al, 2014). A recent literature review found no evidence on effective methamphetamine treatments for Indigenous Australians (MacLean et al, 2015).
The National Drug Strategy 2010–2015 (NDS) (currently being updated) provides the framework for an integrated and coordinated approach across all levels of government to reduce drug-related harm and use in Australia. Under the NDS, the National Aboriginal and Torres Strait Islander Peoples Drug Strategy 2014–19 aims to improve health and wellbeing by preventing and reducing the harmful effects of alcohol and drugs on individuals, families, and communities.
The Indigenous Advancement Strategy–Safety and Wellbeing Programme provides funding for strategies to enhance wellbeing and community safety. This includes funding support for a range of alcohol and other drug treatment services across Australia. In 2015–16, funding was provided to over 80 alcohol and other drug service providers to
improve access to culturally appropriate treatment, prevention, rehabilitation, education and aftercare services for Indigenous Australians, particularly in rural and remote areas.
In 2015–16, 25 Aboriginal and Torres Strait Islander service providers were funded through the Commonwealth Substance Misuse Service Delivery Grants Fund and Non-Government Organisation Treatment Grants Programme to deliver a range of alcohol and other drug treatment and rehabilitation services. In addition, the majority of Indigenous Primary health care organisations funded through the Indigenous Australians’ Health Programme provided care in relation to alcohol and drugs.
As part of the December 2015 response to the National Ice Taskforce’s Final Report, $241.5 million was allocated to Primary Health Networks (PHNs) to commission additional drug and alcohol treatment services with $78.6 million allocated specifically for treatment services for Indigenous Australians. PHNs are to pursue holistic approaches to Indigenous drug and
alcohol treatment that are culturally safe, competent and respectful in both Indigenous specific and mainstream services.
In recognition of the acute need in the NT, the Commonwealth supports additional effort such as dry community declarations (Alcohol Protected Areas) and the power to amend liquor licenses and permits. The Commonwealth is also providing around $91.5 million over 7 years (to 2022) to tackle the harms caused by alcohol under the new National Partnership on Northern Territory Remote Aboriginal Investment.
The Strong Spirits, Strong Minds media campaign, developed from a strong cultural foundation with input from an Aboriginal youth advisory panel, aims to prevent and/or delay the early uptake of alcohol and other drugs by young Aboriginal people in Perth. The Ngunnawal Bush Healing Farm will provide a culturally appropriate alcohol and other drug residential rehabilitation facility for adult Aboriginal and Torres Strait Islander people in the ACT.
See also measures 2.16 and 2.17.
Table 3.11-1 Episodes of care provided to Indigenous clients of Commonwealth-funded Indigenous substance-use services, 2014–15
Episode type Number
Residential treatment/ rehabilitation episodes of care 2,400
Sobering-up/residential respite episodes of care 13,900
Non-residential/follow-up/ aftercare episodes of care
116,200
Source: AIHW 2016
Figure 3.11-1 Common substance use issues reported by Commonwealth-funded Indigenous substance-use services, 2014–15
Source: AIHW 2016
Figure 3.11-2 Alcohol and other drug services treatment episodes by Indigenous status and age group, 2014–15
Source: AODTS NMDS (AIHW 2016)
Figure 3.11-3 Age-standardised hospitalisations with principal diagnoses related to alcohol use and drug use, by Indigenous status and sex, July 2013–June 2015
Source: AIHW analysis of National Hospital Morbidity Database
57
64
70
88
96
0 20 40 60 80 100
Tobacco/nicotine
Multiple drug use
Amphetamines
Cannabis/Marijuana
Alcohol
Per cent (Services)
21.9
29.6
25
16.8
5.3
1.3
11.8
27.0 27.4
19.8
9.7
4.3
0
10
20
30
40
10–19 20–29 30–39 40–49 50–59 60+
Per c
ent
Age groupAboriginal and Torres Strait Islander peoples Non-Indigenous Australians
0
2
4
6
8
10
12
Males Females Persons Persons
Sepa
ratio
ns p
er 1
,000
pop
ulat
ion
Aboriginal and Torres Strait Islander peoples Non-Indigenous Australians
Alcohol use Drug use

Responsive
171
3.12 Aboriginal and Torres Strait Islander people in the health workforce Why is it important? Aboriginal and Torres Strait Islander peoples are significantly under-represented in the health workforce. This potentially contributes to reduced access to health services for the broader Indigenous Australian population. Various studies have found people prefer seeing health professionals from the same ethnic background and that improved health outcomes result (Powe & Cooper, 2004; LaVeist et al, 2003). The gender of the health provider is also important (Ware, 2013).
The Indigenous workforce is integral to ensuring that the health system has the capacity to address the needs of Aboriginal and Torres Strait Islander peoples. Indigenous health professionals can align their unique technical and sociocultural skills to improve patient care, improve access to services and ensure culturally appropriate care in the services that they and their non-Indigenous colleagues deliver (Anderson, I et al, 2009; West, R et al, 2010).
In a Queensland clinic, Aboriginal and Torres Strait Islander patient attendance increased markedly following the arrival of an Aboriginal doctor and in response to other changes in the service designed to make it more welcoming. An Indigenous doctor was said to be ‘more understanding of their needs’ (Hayman, N, 1999).
Findings Analysis of the 2011 Census indicates that, at that time, there were around 8,500 Aboriginal and Torres Strait Islander people employed in health-related occupations. Between 1996 and 2011 the rate of Indigenous Australians employed in the health workforce increased from 96 per 10,000 to 155 per 10,000. In 2011, about 1.6% of the Indigenous population was employed in health-related occupations. However, this is below the proportion of the non-Indigenous population employed in the health workforce (approximately 3.4%).
In 2011, the health occupations with the largest number of Indigenous employees were nursing (2,189), followed by nursing support and personal care workers (1,435), and Aboriginal and Torres Strait Islander Health Workers (AHWs) (1,256). The health occupations with the largest gap between rates of Indigenous and non-Indigenous employees were nurses, medical practitioners and allied health professionals.
South Australia had the highest proportion of its Indigenous population employed in the health workforce (2%) and the NT had the
lowest (1%). The 35–44, 45–54 and 55–64 year age groups had the highest rates of Indigenous Australians in the health workforce. Females accounted for 76% of the Indigenous health workforce—similar to the proportion of females in the total health workforce (75%).
Excluding visiting staff, Aboriginal and Torres Strait Islander peoples made up 53% of the workforce in Indigenous primary health care organisations as at May 2015. The proportion of staff who were Indigenous was less in some professions, for example doctors (7%) and nurses (14%). The occupations with the highest proportions of Indigenous staff were Aboriginal health workers and practitioners (99%) and field officers (88%) (AIHW, 2016o).
Under the National Registration and Accreditation Scheme, Aboriginal and/or Torres Strait Islander Health Practitioners commenced registration on 1 July 2012. By December 2015 there were 558 registered Aboriginal and/or Torres Strait Islander Health Practitioners in Australia, with the majority in the NT (219), followed by NSW (91), Qld (72), WA (71) and SA (27).
In 2015 workforce data, 409 employed medical practitioners (representing 0.5%) identified as being Aboriginal and/or Torres Strait Islander (AIHW, 2016g). The proportion of medical practitioners that identified as Indigenous was highest in the NT (1.5%) and lowest in Tasmania (0.2%). For nurses and midwives, the proportion was 1% (3,187). The NT (2.4%) and Tasmania (2.2%) had the highest proportion of nurses and midwives who identified as Indigenous, while Victoria had the lowest (0.5%).
In 2014, there were 818 employed Indigenous allied health professionals, which represented 0.7% of all allied health professionals. Aboriginal and Torres Strait Islander health practitioners had the largest numbers (266), followed by psychologists (136). In 2014, there were also 72 Indigenous dental practitioners, representing 0.4% of this profession.
Implications Indigenous patients have identified the absence of Indigenous workers as a barrier to the availability of health care (Lawrence et al, 2009). Increasing the number of Indigenous Australians in the health workforce is fundamental to closing the gap in Indigenous life expectancy. While numbers have increased in the past decade, Indigenous Australians remain under-represented.
The National Aboriginal and Torres Strait Islander Health Workforce Strategic Framework (2016–2023) provides a guide to assist planning, prioritising, target setting, monitoring and reporting of progress in Aboriginal and Torres Strait Islander health workforce capacity building. A key aim of the
Framework is to improve recruitment and retention of Aboriginal and Torres Strait Islander health professionals in clinical and non-clinical roles across all health disciplines, including through ensuring workplace environments are culturally safe for Aboriginal and Torres Strait Islander health workers. The Framework also suggests strategies for increasing the number of Aboriginal and Torres Strait Islander people studying and completing qualifications in health.
The Commonwealth funds four Aboriginal and Torres Strait Islander health professional organisations to support the Indigenous workforce and culturally appropriate health care services. This includes:
• improving retention rates of Indigenoushealth professionals
• increasing the number of health careproviders delivering culturally appropriatecare
• increasing the number of Aboriginal andTorres Strait Islander students studying forqualifications in health
• improving completion rates for Aboriginaland Torres Strait Islander health students
• providing advice to Government andother stakeholders on issues affecting theAboriginal and Torres Strait Islanderhealth workforce.
The Indigenous Employment Initiatives provides funding to Indigenous specific aged care services to employ Aboriginal and Torres Strait Islander aged care workers in rural and remote areas. Over 100 participating aged care services are funded directly for wages and are able to allocate this funding to full or part-time personal aged care workers according to the workforce needs of individual health services.
Access to employment in a broad range of settings and occupations is needed to avoid under-representation in better remunerated, more skilled and managerial positions for Indigenous health professionals. It is also important for the non-Indigenous workforce to receive enhanced training programs in cultural awareness (Aspin et al).
The Indigenous Remote Service Delivery Traineeship NT Program provides a Diploma of Leadership and Management contextualised to the remote NT setting and has assisted to develop a remote NT-based pool of potential future health service managers and CEOs.
Improving the representation of Indigenous Australians in the health workforce will require collaboration between the health and education sectors and success across a range of fronts. Addressing educational disadvantages faced by Indigenous children can assist them to develop skills and be ready to pursue a career in the health sector

Responsive
172
(see measures 2.04 and 2.05). Strategies to address barriers, highlight pathways into health careers, and strengthen support for
and retention rates of Indigenous students while studying and training, need to be implemented (see measure 3.20). Improved
opportunities for employment, advancement, and retention also require attention.
Table 3.12-1 Employed persons aged 15 years and over, by selected health related occupation, by Indigenous status, Australia, 1996, 2001, 2006 and 2011
Occupation
No. Rate (per 10,000) Rate difference
(per 10,000)
Period linear % change
2011 1996 2001 2006 2011 2011
Indigenous Non-
Indigenous
Aboriginal and Torres Strait Islander health workers 1,256 19.1 21.0 21.3 23.0 0.1 -23.0 19.1*
Nurses 2,189 35.9 27.6 32.0 40.1 129.0 88.9 16.1
Registered nurses 1,713 18.3 20.5 24.5 31.4 103.0 71.6 75.9*
Nurse managers and nursing clinical directors 94 0.6 0.9 1.3 1.7 7.5 5.7 204.2*
Midwives 76 0.8 1.0 1.1 1.4 7.0 5.7 77.2*
Enrolled and mothercraft nurses 284 16.1 5.0 4.8 5.2 8.8 3.6 -77.7
Nurse educators and researchers 22 0.2 0.3 0.4 0.4 2.6 2.2 104.6*
Medical practitioners 171 1.7 2.2 2.3 3.2 35.0 31.8 78.2*
Generalist medical practitioners 123 1.2 1.4 1.8 2.3 21.8 19.5 103.3*
General medical practitioners 93 0.8 1.2 1.3 1.7 16.9 15.2 100.5*
Resident medical officers 30 0.3 0.2 0.5 0.6 4.9 4.3 112.1
Other medical practitioners 48 0.6 0.8 0.4 0.9 13.2 12.3 31.3
Allied health professionals 724 5.1 6.7 9.7 13.3 43.9 30.6 179.9*
Dieticians 25 n.p. 0.4 0.2 0.5 1.8 1.4 n.a.
Optometrists 6 n.p. n.p. 0.2 0.1 1.8 1.7 n.a.
Psychologists 82 0.4 0.5 1.0 1.5 9.3 7.8 478.9*
Physiotherapist 75 0.5 0.7 1.2 1.4 8.0 6.6 215.3*
Podiatrists 6 0.2 0.2 0.1 0.1 1.4 1.3 -39.2
Speech professionals and audiologists 17 0.2 0.2 0.4 0.3 3.4 3.1 62.8*
Occupational therapists 24 n.p. n.p. 0.3 0.4 4.6 4.2 n.a.
Social workers 463 3.2 4.1 5.9 8.5 8.3 -0.2 189.6*
Other health therapy professionals 26 0.3 0.3 0.5 0.5 5.2 4.8 60.5
Dental and dental allied workforce 323 4.2 3.8 4.5 5.9 18.0 12.1 46.4
Dental practitioners 24 0.3 0.3 0.4 0.4 5.5 5.1 34.7*
Dental hygienists, technicians and therapists 32 0.5 0.4 0.3 0.6 3.2 2.6 7.4
Dental assistants 267 3.3 3.1 3.8 4.9 9.3 4.4 54.2*
Health diagnostic and promotion professionals 981 4.7 4.6 14.1 18.0 29.6 11.6 510.2
Medical imaging professionals 21 0.2 0.3 0.4 0.4 6.6 6.3 77.9*
Pharmacists 29 0.2 0.2 0.2 0.5 10.0 9.5 237.1*
Occupational health and safety advisers 193 0.6 0.6 1.1 3.5 7.6 4.0 3114.4*
Health promotion officers 567 n.a. n.a. 9.7 10.4 2.2 -8.2 n.a.
Environmental health officers 104 3.5 2.8 2.2 1.9 1.7 -0.2 -47.5*
Other health diagnostic & promotion professionals 67 0.2 0.5 0.5 1.2 1.5 0.2 573.6*
Other 2,812 25.6 32.6 43.4 51.6 88.4 36.8 106.9*
Health service managers 54 0.6 n.p. 0.4 1.0 1.3 0.3 n.a.
Nursing support worker and personal care workers 1,435 16.5 19.9 21.7 26.3 34.5 8.2 56.9*
Ambulance officers and paramedics 216 1.4 2.0 3.4 4.0 5.9 1.9 201.6*
Drug and alcohol counsellor 156 2.3 2.4 2.6 2.9 0.7 -2.2 26.2*
Others 951 4.7 6.8 15.3 17.4 46.0 28.5 342.6*
Total health occupations 8,456 96.3 98.6 127.3 155.1 344.1 189.0 69.5* *represents results that are statistically significant n.p. data not available for publication but included in totals n.a. data not availableSource: ABS and AIHW analysis of ABS Census

Responsive
173
3.13 Competent governance Why is it important? ‘Governance’ refers to the evolving processes, relationships, institutions and structures by which a group of people, community or society organise themselves collectively to achieve things that matter to them (Hunt et al, 2008). ‘Competent governance’ requires legitimacy, leadership, power, resources and accountability (Dodson & Smith, 2003). Governance enables the representation of the welfare, rights and interests of constituents, the administration and delivery of programs and services, the management of resources, and negotiation with governments and other groups (Hewitt de Alcántara, 1998; Hawkes, 2001; Westbury, 2002). The manner in which governance functions are performed has a direct impact on the wellbeing of individuals and communities.
The governance model of Aboriginal Community Controlled Health Services (ACCHSs) was first established in the 1970s, and by the 1990s, ACCHSs were an important provider of comprehensive primary health care services for Aboriginal and Torres Strait Islander peoples (Larkins et al, 2006; Department of Health and Ageing, 2001). While the capabilities and capacity of ACCHSs vary, this model of care provides important options for Indigenous Australians (Moran et al, 2014).
Competent governance includes mainstream service delivery for Indigenous clients and effective participation of Indigenous people on decision-making boards, management committees and other bodies, as relevant (see measure 3.08). The stewardship role of governments to improve the health of Aboriginal and Torres Strait Islander peoples is also critical. Attention should be given to assessing not only the levels of access to appropriate care but also the experiences of Aboriginal and Torres Strait Islander peoples in receiving care.
Findings The Office of the Registrar of Indigenous Corporations (ORIC) administers the Corporations (Aboriginal and Torres Strait Islander) Act 2006 (CATSI Act). The legislation sets out governance standards, with special measures to suit the needs of Indigenous Australians. In 2014–15, 86 Indigenous health corporations were incorporated under the CATSI Act and registered with ORIC. All 85 corporations required to submit annual reports to ORIC complied with their obligations under the CATSI Act.
In the 2014–15 Online Services Report (OSR), 163 of the 203 Commonwealth-funded Indigenous primary health care organisations (80%) reported having a
governing committee/board. Of these, 98% reported that their committee/board had met as frequently as required of the constitution; 98% had presented income/expenditure reports to the committee/board on at least two occasions during the year; 74% had a committee/board who were all Aboriginal and/or Torres Strait Islander peoples; and 79% had committee/board members who had received training related to governance issues.
In 2014–15, 65 of the 67 Commonwealth-funded organisations providing substance-use services for Aboriginal and Torres Strait Islander people reported having a governing committee/board. Of these, 99% reported that the governing committee/board met as frequently as required of the constitution; 100% had income/expenditure statements presented to the committee or board on at least two occasions; 55% had a governing committee/board comprised entirely of Aboriginal and/or Torres Strait Islander peoples; and 82% had governing committee/board members who had received training related to governance issues.
Of all the 203 Commonwealth-funded Indigenous primary health care organisations in the 2014–15 OSR, 93% reported having accessible and appropriate client/community feedback mechanisms in place, 63% had representatives on external boards (e.g. hospitals) and 86% had participated in regional health planning processes.
From the patient perspective, the 2012–13 Health Survey included questions on reasons for not accessing specific health care services when needed in the previous 12 months. According to these data, 21% of Indigenous Australians reported needing to, but not, going to a dentist, 14% to a doctor, 9% to a counsellor, 9% to other health professionals, and 6% to hospital (see measure 3.14).
Some of the reasons people did not access services reflect failures in health services to adequately address the needs of these patients. For example, 13–27% did not attend services because they disliked the service/professional or felt embarrassed/afraid, 1–18% felt the service would be inadequate and 2–4% were concerned about discrimination and cultural appropriateness. These reasons were highest for those needing to, but not accessing counsellors. In addition, a range of other reasons people did not access health care when they needed to reflect potential failures in the governance of the health system as a whole (e.g. cost, transport/distance, or the service was not available in the area).
The 2014–15 Social Survey included questions on discrimination and patient
experience. In 2014–15, 35% of Indigenous Australians reported that they had been treated unfairly in the previous 12 months because they are Aboriginal and/or Torres Strait Islander. Around 14% of Indigenous Australians reported that they avoided situations due to past unfair treatment. Of those, 13% had avoided seeking care from doctors, nurses or other staff at hospitals or doctor’s surgeries because of previous unfair treatment.
When asked about their experiences with doctors in 2014–15, Indigenous Australians in non-remote areas reported that their GP only sometimes, rarely or never: showed respect for what was said (15%), listened to them (20%) or spent enough time with them (21%). Around 6% of Indigenous Australians aged 15 years and over disagreed or strongly disagreed with the statement ‘Your doctor can be trusted’. In addition, 13% disagreed or strongly disagreed with the statement ‘Hospitals can be trusted to do the right thing by you’.
An evaluation of a community engagement strategy, applied across five districts in Perth, found that actively engaging Indigenous communities in decisions about their health care resulted in stronger relationships between community members and health services, improved health services that were more culturally appropriate, and increased access to, and trust in services (Durey et al, 2016).
Implications Organisations are more effective in delivering services and achieving development outcomes when there is strong governance in place. Key challenges include the demands placed on Indigenous health services by their constituents and their funders (Moran et al, 2014).
Under the Indigenous Advancement Strategy (IAS), Aboriginal and Torres Strait Islander organisations receiving significant Commonwealth funding are required to transfer their incorporation to the CATSI Act to strengthen governance.
Under the IAS, the Culture and Capability Programme supports Indigenous Australians to maintain their culture, participate equally in the economic and social life of the nation and aims to ensure that Indigenous organisations are capable of delivering quality services to their clients. The programme funds a range of activities designed to:
• improve the leadership and governancecapacity of Indigenous people, families,organisations and communities
• strengthen the capacity of Indigenousorganisations so that they are able toeffectively deliver Government services toIndigenous people and communities
• engage Indigenous Australians ondecisions over matters that affect them.
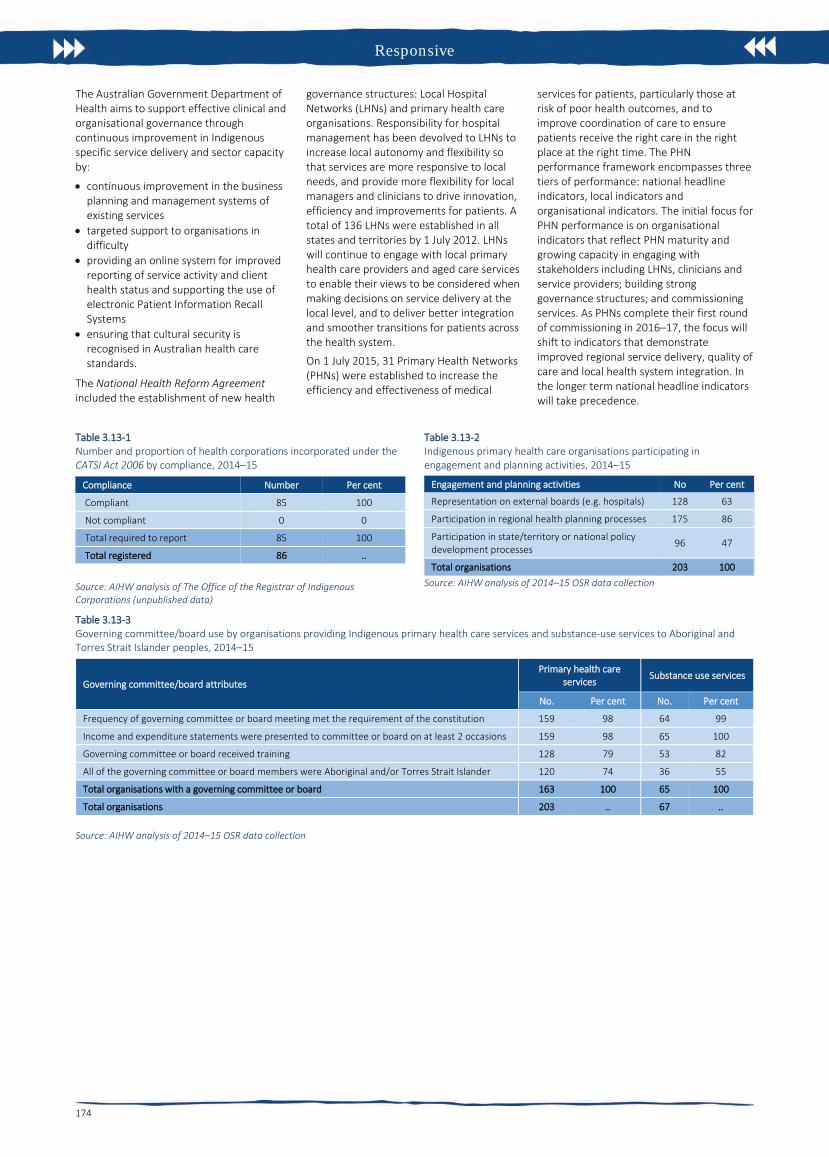
Responsive
174
The Australian Government Department of Health aims to support effective clinical and organisational governance through continuous improvement in Indigenous specific service delivery and sector capacity by:
• continuous improvement in the businessplanning and management systems ofexisting services
• targeted support to organisations indifficulty
• providing an online system for improvedreporting of service activity and clienthealth status and supporting the use ofelectronic Patient Information RecallSystems
• ensuring that cultural security isrecognised in Australian health carestandards.
The National Health Reform Agreement included the establishment of new health
governance structures: Local Hospital Networks (LHNs) and primary health care organisations. Responsibility for hospital management has been devolved to LHNs to increase local autonomy and flexibility so that services are more responsive to local needs, and provide more flexibility for local managers and clinicians to drive innovation, efficiency and improvements for patients. A total of 136 LHNs were established in all states and territories by 1 July 2012. LHNs will continue to engage with local primary health care providers and aged care services to enable their views to be considered when making decisions on service delivery at the local level, and to deliver better integration and smoother transitions for patients across the health system.
On 1 July 2015, 31 Primary Health Networks (PHNs) were established to increase the efficiency and effectiveness of medical
services for patients, particularly those at risk of poor health outcomes, and to improve coordination of care to ensure patients receive the right care in the right place at the right time. The PHN performance framework encompasses three tiers of performance: national headline indicators, local indicators and organisational indicators. The initial focus for PHN performance is on organisational indicators that reflect PHN maturity and growing capacity in engaging with stakeholders including LHNs, clinicians and service providers; building strong governance structures; and commissioning services. As PHNs complete their first round of commissioning in 2016–17, the focus will shift to indicators that demonstrate improved regional service delivery, quality of care and local health system integration. In the longer term national headline indicators will take precedence.
Table 3.13-1 Number and proportion of health corporations incorporated under the CATSI Act 2006 by compliance, 2014–15
Compliance Number Per cent
Compliant 85 100
Not compliant 0 0
Total required to report 85 100
Total registered 86 ..
Source: AIHW analysis of The Office of the Registrar of Indigenous Corporations (unpublished data)
Table 3.13-2 Indigenous primary health care organisations participating in engagement and planning activities, 2014–15
Engagement and planning activities No Per cent
Representation on external boards (e.g. hospitals) 128 63
Participation in regional health planning processes 175 86
Participation in state/territory or national policy development processes 96 47
Total organisations 203 100 Source: AIHW analysis of 2014–15 OSR data collection
Table 3.13-3 Governing committee/board use by organisations providing Indigenous primary health care services and substance-use services to Aboriginal and Torres Strait Islander peoples, 2014–15
Governing committee/board attributes Primary health care
services Substance use services
No. Per cent No. Per cent
Frequency of governing committee or board meeting met the requirement of the constitution 159 98 64 99
Income and expenditure statements were presented to committee or board on at least 2 occasions 159 98 65 100
Governing committee or board received training 128 79 53 82
All of the governing committee or board members were Aboriginal and/or Torres Strait Islander 120 74 36 55
Total organisations with a governing committee or board 163 100 65 100
Total organisations 203 .. 67 ..
Source: AIHW analysis of 2014–15 OSR data collection

Accessible
175
3.14 Access to services compared with need Why is it important? Data presented in this measure examine the level of access to health care for Aboriginal and Torres Strait Islander peoples compared with their need for health care. Indigenous Australians currently experience significantly poorer health status than non-Indigenous Australians. Their life expectancy at birth is 10.6 years less for males and 9.5 years less for females, and they are twice as likely to rate their health as ‘fair’ or ‘poor’ than non-Indigenous Australians.
While the causes of illness and injury for any community operate within broad environmental, social and personal factors, the health system can: assist with prevention through population health programmes (see measure 3.03); provide an immediate response to acute illness and injury (see measure 1.02); and protect good health through screening, early intervention and treatment (see measures 3.04 and 3.05) (Dwyer et al, 2004). Evidence from Australia, the United States and New Zealand indicate that health care can contribute to closing the gap in life expectancy between Indigenous and non-Indigenous populations (Griew, 2008). Inequalities in health care access and use may act to further exacerbate inequalities in health status (OECD, 2009). Access to health care when needed is therefore essential to closing the gap in life expectancy.
Findings Self-reported use of services The 2012–13 Health Survey provides the most recent and comprehensive picture of the whole health system. In 2012–13, 44% of Indigenous Australians accessed health care in the previous two weeks (or 12 months for hospital). In these two weeks, 22% of Indigenous Australians had consulted a doctor or specialist, 19% had consulted other health professionals, 5% had visited casualty/outpatient services and 5% had seen a dentist. In the previous 12 months, 18% had been admitted to hospital. Around 83% of Indigenous Australians had consulted a GP in the previous 12 months.
Indigenous Australians with a disability, multiple long-term health conditions and/or high/very high psychological distress were more likely to have visited a doctor/hospital than those without these conditions.
Services claimed through Medicare In 2015–16, Indigenous Australians made nearly 8.7 million Medicare claims, of which 4.2 million were for GP services (note: not all care delivered through Indigenous primary health care (PHC) services can be claimed through Medicare). Between 2003–04 and
2015–16, the rate of GP Medicare items claimed by Indigenous Australians increased by 39% and is now higher than the non-Indigenous rate. The rate of claims for health assessment items have also increased since 2009–10, as have claims for team care arrangement (TCA) and GP management plan (GPMP) services. In 2015–16, rates for these chronic disease management items were higher for Indigenous Australians (1.5 to 1.6 times) than for non-Indigenous Australians.
In 2015–16, the two most common Medicare items claimed by Indigenous Australians were for standard GP consultations (2.4 million) and pathology (2.9 million). Out-of-pocket costs for services claimed through Medicare were lower for Indigenous Australians (8% of fees claimed) than non-Indigenous Australians (23% of fees claimed). For Indigenous Australians, out-of-pocket costs were minimal for Aboriginal Health Worker (AHW) items, Indigenous health checks, TCAs and GPMPs and higher for specialists (22%),diagnostics (9%), allied health (9%) and imaging (6%).
Indigenous Australians were more likely than non-Indigenous Australians to have long or complex GP consultations, TCAs and GPMPs. Service claims for specialist and psychologist items were lower for Indigenous Australians.
There was a clear gradient, reducing by remoteness, in rates of Medicare service claims for GP, allied health and specialist services for both Indigenous and non-Indigenous Australians. Against this gradient, rates of claims for nurse/AHW services increased by remoteness for Indigenous Australians. This also reflects types of services available in remote areas.
Medicare claim rates for private specialist care among Indigenous Australians were highest in major cities (582 per 1,000) and lowest in very remote areas (140 per 1,000). For GP services, Indigenous Australians claimed at a higher rate across all remoteness areas compared with non-Indigenous Australians (with the greatest difference in major cities and the smallest in very remote areas).
Indigenous women had higher rates of total services claimed through Medicare than Indigenous men (1.6 times).
Indigenous primary health care services There has been an overall increase in the number of Commonwealth-funded Indigenous PHC organisations from 108 in 1999–2000 to 203 in 2014–15. Over that period, episodes of health care for clients of these organisations have almost tripled (from 1.2 million to 3.5 million) and equivalent full-time staff (both paid by the service and visiting) tripled. Organisations were asked to select the top 5 service gaps faced by their patients. Access to health
services (including transport) was reported as a service gap by 28% of organisations providing PHC services, 29% providing social and emotional wellbeing services and 37% providing substance-use services.
Hospital care During the two years to June 2015, there were an estimated 499,000 hospital separations for Indigenous Australians (excluding dialysis). After adjusting for age, Indigenous Australians were hospitalised at 1.3 times the rate of non-Indigenous Australians. Hospital separation rates for Indigenous Australians were highest in remote areas, lower in very remote areas and lowest in major cities (see measure 1.02).
Elective surgery In the two years to June 2015, the overall rate of elective surgery for Indigenous Australians (53 per 1,000 persons) was markedly lower than for non-Indigenous Australians (85 per 1,000 persons). In 2015–16, there were 24,800 hospitalisations from public hospital elective surgery waiting lists (excluding the ACT) for patients identified as Aboriginal and/or Torres Strait Islander (representing 3.5%). The median waiting time for Indigenous Australians (43 days) was higher than for other Australians (37 days) as was the proportion of Indigenous Australians who waited more than a year for elective surgery (2.3% compared with 2.0% for other Australians) (AIHW, 2016x).
Emergency care In 2015–16, around 6% of emergency department presentations (462,000) were reported for Indigenous Australians (excludes the ACT). The median waiting time for Indigenous Australians (18 minutes) was similar to that for other Australians (19 minutes). The proportion of Indigenous Australian presentations seen on time (75%) was also similar to that for other Australians (74%). Across triage categories, 100% of Indigenous Australians were seen on time for triage category 1 (resuscitation), 77% for category 2 (emergency), 68% for urgent and 75% for semi-urgent. For non-urgent patients, 93% were seen on time (within 2 hours) (AIHW, 2016e).
The Royal Flying Doctor Service (RFDS) provides emergency and other health care for those living in remote and very remote areas. Between July 2013 and December 2015, the RFDS conducted 17,606 aeromedical retrievals for Indigenous Australians (one-third of all retrievals) (Bishop et al, 2016).
Palliative care Between July 2013 and June 2015, Indigenous Australians were hospitalised for palliative care at nearly twice the rate of non-Indigenous Australians (2.7 per 1,000 and 1.5 per 1,000 respectively). Indigenous patients accounted for 2% of all

Accessible
176
hospitalisations for palliative care. Around 59% of the 203 Commonwealth-funded Indigenous PHC organisations provided palliative care in 2014–15 (AIHW, 2016o).
Self-reported barriers In 2012–13, 30% of Indigenous Australians reported that they needed to, but did not see a health care provider in the previous 12 months. This varied by type of service with 21% not going to a: dentist, 14% a doctor, 9% a counsellor, 9% other health professional and 6% to hospital when needed. Indigenous Australians living in non-remote areas (32%) were more likely to report not seeking care when needed than those living in remote areas (22%).
Reasons for not seeking health care when needed varied by type of service. Cost was the main reason for not seeking care for some services, for others waiting time was more of a barrier. Reasons for not going to a doctor included: being too busy (30%); waiting too long/service not available at time required (22%); transport/distance (14%); dislikes service/professional or is embarrassed/afraid (14%); cost of service (13%); felt service would be inadequate (9%); does not trust service provider (6%); service not available in area (5%); and discrimination/not culturally appropriate/language problem (3%).
Cost was a major barrier to accessing dentists (43% overall and 32% in relation to children). For the total population, a higher proportion of adults with insurance made a dental visit in the previous 12 months (71%) than adults without insurance (48%) (Brennan et al. 2012) (see measure 1.11).
Private health insurance In 2012–13, in non-remote areas, 20% of Indigenous Australians were covered by private health insurance (up from 15% in 2004–05). The most common reason reported by Indigenous Australians for not having private health insurance was that they could not afford it (72%); up from 65% in 2004–05. In the two years to June 2015, 7% of procedures recorded for Indigenous Australians occurred in private hospitals compared with 42% for non-Indigenous Australians.
Service/provider availability In 2015, full-time equivalent (FTE) rates for medical practitioners working as clinicians declined by remoteness (from 442 FTE per 100,000 population in major cities to 263 in remote/very remote areas). This reflects the pattern for specialists; for GPs, rates were highest in remote/very remote areas (135 FTE per 100,000 population) declining to 112 in major cities (AIHW, 2016g). For nurses, FTE per 100,000 population ranged from 1,219 in remote areas to 1,083 in outer regional areas (AIHW, 2016d) (see measure 3.22). AIHW (2016p) analysis of the distribution of the clinical health workforce
in relation to the Indigenous Australian population found that a higher proportion of Indigenous Australians live in areas with lower health workforce access scores than non-Indigenous Australians. It was estimated that approximately 46,200 Indigenous Australians live in areas of low relative supply of GPs (6.9% of the Indigenous population compared with 0.5% of the non-Indigenous population).
Patient experience In the 2014–15 Social Survey, 35% of Indigenous Australians reported they had been treated unfairly in the previous 12 months because they are Aboriginal or Torres Strait Islander. Around 14% of Indigenous Australians reported that they avoided situations due to past unfair treatment. Of those, 13% had avoided seeking care from doctors, nurses or other staff at hospitals or doctor’s surgeries because of previous unfair treatment.
In 2014–15, Indigenous Australians in non-remote areas reported their GP or specialist in the previous 12 months always or often: showed them respect (85%), listened carefully to them (80%), and spent enough time with them (79%).
Implications Access rates vary by type of care. GP care now shows similar rates for Indigenous and non-Indigenous Australians while for hospital care, rates for Indigenous Australians are higher. Indigenous Australians currently experience significantly poorer health and therefore we should expect to see rates of access to health services 2–3 times the non-Indigenous rate. The data also showed that people who did not access their PHC service at all in the previous 12 months were more likely to be hospitalised. Reduced rates of hospitalisation were seen for those with four or more clinic visits per year (Zhao et al, 2013b).
Analysis of available data uncovers an increase in health assessments, GP management plans, team care arrangements and allied health items claimed through Medicare since the implementation of enhanced Indigenous chronic disease initiatives in 2009. There have also been increases in episodes of care provided through Indigenous PHC services. The data also shows that Indigenous Australians have lower levels of private health insurance, are more likely to use public hospital services and have lower rates of elective and preventative surgery.
Barriers to accessing care when needed vary between remote and non-remote areas and service types, suggesting that strategies need to be context-specific and adapted for local circumstances. To be accessible, health care services need to be available,
affordable, appropriate and acceptable (Ware, 2013).
Supporting this, there is a need to address recruitment and retention of staff in rural and remote areas (see measure 3.22), ensure the cultural competency of services (see measure 3.08), and consider service delivery options to overcome distance, cost and complicated referral processes. Having Aboriginal and Torres Strait Islander peoples employed within health care services has been identified as an enabler to developing relationships with patients and promoting access (Askew et al, 2014) (see measure 3.12).
Government initiatives to better support efforts to achieve health equality between Indigenous and non-Indigenous Australians are detailed in the Policies and Strategies section. These include the Australian Government Indigenous Australians’ Health Programme, National Aboriginal and Torres Strait Islander Health Plan 2013–2023 and associated Implementation Plan and state and territory initiatives.
The Australian Government provides subsidised GP services and cheaper medicines through the MBS and PBS. The Practice Incentives Program—Indigenous Health Incentive supports Indigenous health services and general practices to provide better health care for their Indigenous patients.
As announced in the 2014–15 Budget, from 1 July 2015, Medicare Locals have been replaced by Primary Health Networks (PHNs). PHNs are provided flexible funding to enable them to respond to identified national priorities as determined by the Commonwealth, one of which is Aboriginal and Torres Strait Islander health. PHNs are informed by regional needs assessments to prioritise the activities to be funded and will work closely with local Indigenous and mainstream PHC organisations to support the delivery of culturally appropriate health services (see also measure 3.08). From 1 July 2016, PHNs have also had responsibility for further investment of $241.5 million to commission additional drug and alcohol treatment services; with $78.6 million specifically for Indigenous Australians (see measure 3.11).
The Rural Health Outreach Fund (RHOF) consolidates rural health outreach programmes (including the Medical Specialist Outreach Assistance Program) to provide a large flexible funding pool for initiatives aimed at improving access to medical specialists, GPs, allied health and other health providers in regional, rural and remote locations. Up to $121.3 million will be provided under the RHOF from 2013–14 to 2016–17. In 2015–16, more than 247,000 Australians accessed services through this program.

Accessible
177
The Australian Government will provide up to $124.51 million under the Medical Outreach Indigenous Chronic Disease Program from 2013–14 to 2016–17 to deliver a wide range of medical specialist, general practice and allied health outreach services to Indigenous Australians, with a focus on regional, rural and remote Australians who are living with a chronic disease. In 2015–16, 209,360 patients
accessed a service in more than 390 locations nationally (Department of Health unpublished).
Under the former Health and Hospitals Fund, a number of health service infrastructure projects were funded in states and territories. These included: the construction of 11 remote health centres in the NT; provision of new and improved PHC facilities
for AMSs across Australia; construction of a dedicated network of hospital and community based medical education facilities at the Royal Darwin Hospital and a training facility at Alice Springs Hospital; a replacement paediatric unit at the Broome Hospital WA; and construction of a PHC centre with training facilities in Toowoomba Qld.
Figure 3.14-1 Comparing mortality rate ratios (2011-15) with accessing MBS GP services rate ratio (2015–16) by age group(a)
(a) mortality rate ratio includes people aged 0–74 years, NSW, Qld, WA, SA and NT. Source: AIHW analysis of National Mortality Database and Medical Benefits Division, Department of Health
Figure 3.14-2 Age-standardised rates of GP MBS services claimed through Medicare, by Indigenous status, 2003–04 to 2015–16
Source: Medical Benefits Division, Department of Health
Figure 3.14-3 Age-standardised rate of GP MBS services claimed through Medicare, by Indigenous status and remoteness area, 2015–16
Source: Medical Benefits Division, Department of Health
Figure 3.14-4 Age-standardised rate of specialist MBS services claimed through Medicare, by Indigenous status and remoteness area, 2015–16
Source: Medical Benefits Division, Department of Health
Figure 3.14-5 Cumulative per cent changes to Indigenous primary health care organisations, 1999–2000 to 2014–15
Sources: SAR, DSR and OSR data collections
Figure 3.14-6 Age-standardised hospitalisation rates (excluding dialysis) by Indigenous status and remoteness, July 2013–June 2015
Source: AIHW analysis of National Hospital Morbidity Databas
0
1
2
3
4
5
6
Rate
ratio
(Ind
igen
ous/
non-
Indi
geno
us)
Age group (years) - accessing GPsAccessing MBS GP services rate ratio mortality rate ratio
0
2,000
4,000
6,000
8,000
04 05 06 07 08 09 10 11 12 13 14 15 16Se
rvic
es p
er 1
,000
pop
ulat
ion
Year ended 30 JuneAboriginal and Torres Strait Islander peoplesNon-Indigenous Australians
010002000300040005000600070008000
Majorcities
Innerregional
Outerregional
Remote Veryremote
AustraliaServ
ices
per
1,0
00 p
opul
atio
n
Remoteness Area
Aboriginal and Torres Strait Islander peoples Non-Indigenous Australians
0
200
400
600
800
1000
1200
Majorcities
Innerregional
Outerregional
Remote Veryremote
AustraliaServ
ices
per
1,0
00 p
opul
atio
n
Remoteness Area
Aboriginal and Torres Strait Islander peoples Non-Indigenous Australians
0
50
100
150
200
250
00 01 02 03 04 05 06 07 08 09 10 11 12 13 14 15
Per c
ent
Year ended 30 June
FTE staff (both paid by the service and visiting) Episodes of care
0
200
400
600
800
Major cities InnerRegional
OuterRegional
Remote VeryRemote
Num
ber p
er 1
,000
sep
arat
ions
Remoteness areaAboriginal and Torres Strait Islander peoples Non-Indigenous Australians

Accessible
178
Table 3.14-1 Selected health services by reasons for not going to health care provider when needed, Indigenous Australians aged 2 years and over, 2012–13
Doctor Other health professional Hospital
Non-remote Remote Total
Non-remote Remote Total
Non-remote Remote Total
Per cent
Needed to go to health provided in last 12 months but didn't 15 9 14 10 4 9 6 5 6
Reasons for not going to health care provider
Cost of service 15 4 13 39 5 35 8 6† 8
Waiting time too long or service not available at time required 23 19 22 16 † 19 17 25 22 25
Transport/distance 14 17 14 12 19† 13 16 19 17
Service not available in area 4† 7† 5 † 6 9† 6† 2# 8† 3† Discrimination / not culturally appropriate / language
problems 3† 2# 3† 3 † 2# 2† 4† 3# 4†
Dislikes services/professional, embarrassed, afraid 15 10 14 13 8† 13 16 8† 14
Felt would be inadequate 9 6 † 9 5 4† 5 10 8† 9
Does not trust service/ provider 6 4# 6 3† 4# 3 8 7† 8
Too busy (work, personal or family responsibilities) 31 25 30 32 36 33 24 18 23
Decided not to seek care 34 34 34 19 24 20 37 31 36
Dentist Counsellors Total health services
Non-remote Remote Total Non-
remote Remote Total Non-remote Remote Total
Percent
Needed to go to health provided in last 12 months but didn't 22 15 21 10 4 9 32 22 30
Reasons for not going to health care provider
Cost of service 47 25 43 16 15† 16 39 19 36
Waiting time too long or service not available at time required 20 24 20 11 26† 12 27 27 27
Transport/distance 9 22 11 11 7† 10 15 22 16
Service not available in area 5 31 9 5† 14† 6 6 25 9 Discrimination / not culturally appropriate / language
problems 2† 1# 2† 3† 8# 4† 4 3'† 7
Dislikes services/professional, embarrassed, afraid 19 16 19 28 18† 27 23 17 22
Felt would be inadequate 1† 1† 1† 19 12† 18 10 6 9
Does not trust service/ provider 4 4† 4 12† 14† 12 9 7 9
Too busy (work, personal or family responsibilities) 21 19 21 35 29† 34 34 28 33
Decided not to seek care 11 10 11 31 40 32 29 26 29 † Estimate has a relative standard error between 25% and 50% and should be used with caution. # Estimate has a relative standard error greater than 50% and is considered unreliable for general use Source: ABS & AIHW analysis of 2012–13 AATSIHS

Accessible
179
3.15 Access to prescription medicines Why is it important? Essential medicines save lives and improve health when they are available, affordable, quality-assured and properly used (WHO, 2004). Affordable access to medicines is important for many acute and chronic illnesses. For chronic illnesses such as diabetes, hypertension, heart disease and renal failure, multiple medications may be required for many years to avoid complications (WHO, 2004). It is important to ensure that Aboriginal and Torres Strait Islander peoples, who experience high rates of acute and chronic illnesses, are able to access appropriate prescription medications when they are required. In Australia, the main mechanism for ensuring reliable, timely and affordable access to a wide range of prescription medications is the Australian Government’s Pharmaceutical Benefits Scheme (PBS). In 2014–15, the PBS subsidised the cost of 211.4 million prescriptions, at a cost of approximately $9.07 billion.
Findings In 2013–14, total expenditure on pharmaceuticals per Aboriginal and Torres Strait Islander person was around two-thirds of the amount spent per non-Indigenous person ($579 compared with $857). In 2013–14, average expenditure per person for mainstream PBS benefits was $112 for Indigenous Australians and $338 for non-Indigenous Australians (in constant prices based on 2014-15 dollars). In 2011–12, average PBS expenditure per person for Indigenous Australians was estimated to be 23% of the amount spent for non-Indigenous Australians. In 2013–14 this was 33%. This suggests that the gap in spending between Indigenous and non-Indigenous Australians is closing. Note that changes over time may partly be explained by methodological changes and increases in Indigenous identification.
In 2013–14, mainstream arrangements accounted for 65% of benefits paid for Aboriginal and Torres Strait Islander peoples. The remainder were Section 100 and other special supply PBS drugs. The gaps between expenditures for Aboriginal and Torres Strait Islander peoples and non-Indigenous Australians were greatest in non-remote areas. In 2013-14, benefit-paid pharmaceutical expenditures for Aboriginal and Torres Strait Islander peoples were $131 per person in major cities, $137 for inner and outer regional areas and $305 for remote and very remote areas.
In 2014, the number of full-time equivalent pharmacists per 100,000 population declined with remoteness, from 84 per
100,000 in major cities to 51 per 100,000 in remote areas (AIHW, 2016c).
Results from a recent study show a reduction in hospitalisations for chronic conditions in areas with higher uptake of the PBS Co-Payment incentive (Trivedi et al, 2016). A multi-system coordinated approach through the including clinical care programmes is necessary for improving access to health care and reducing chronic disease (Bailie, J et al, 2015; Reed, 2017).
Implications There is a large gap between PBS pharmaceutical expenditures for Aboriginal and Torres Strait Islander peoples and non-Indigenous Australians, although this gap appears to have reduced between 2011–12 and 2014–15. Estimation of this gap is complicated by the absence of high-quality data sources on Indigenous pharmaceutical usage and expenditures.
Access needs to be addressed at multiple levels. Prescription medicines are prescribed by primary care and specialist practitioners, and barriers to accessing these services in the first place may result in under use of medications. In 2012–13, 14% of Indigenous Australians reported that they needed to see a doctor but did not in the previous 12 months (see measure 3.14). Once a prescription has been issued, access to pharmacies may be limited, particularly in rural and remote areas. Financial barriers, particularly for people on low incomes, can be important, despite safety net schemes. It is estimated that in 2012–13, 34% of Indigenous Australians who did not fill a prescription gave cost as a reason. Ongoing compliance is important for all patients with chronic illnesses.
The following range of programmes and special arrangements allow intervention at multiple levels to improve access to PBS pharmaceuticals for Aboriginal and Torres Strait Islander peoples in both remote and non-remote areas.
Special supply arrangements administered under Section 100 of the National Health Act 1953 allow for PBS medicines to be provided to remote area Aboriginal and Torres Strait Islander primary health care services. The PBS medicines are dispensed to patients of the health care service by a suitably qualified and approved health professional, without the need for a prescription and at no cost. In 2015–16, $57.32 million was allocated towards Section 100 arrangements. This programme has played an important role in addressing medicines access problems in remote areas.
The PBS Co-payment Measure was introduced under the former Indigenous Chronic Disease Package on 1 July 2010 and continues to help address the financial barriers Aboriginal and Torres Strait Islander people may face in accessing PBS medicines in non-remote locations. These
arrangements provide assistance with the cost of PBS medicines for eligible Aboriginal and Torres Strait Islander people living with, or at risk of, chronic disease. The identification of Indigenous clients is an important step in reaching the target population. The measure has been very successful to date, providing co-payment subsidies for a total of 407,861 eligible patients between 1 July 2010 and 30 June 2016, against an initial estimate of 76,000 patients, and subsidising 17.9 million PBS prescriptions.
Medicines are listed on the PBS on recommendation of the Pharmaceutical Benefits Advisory Committee (PBAC). The PBS listing process is based on evidence. Under the National Health Act 1953, the PBAC must consider each PBS listing application having regard to the clinical effectiveness and cost effectiveness of the medicine for the intended medical use. Availability of PBS medicines is for all Australians but can vary, where some medicines can be restricted access.
Under the relevant regulations, cost recovery fees for applications to the PBAC may be waived when the application is in respect of medicines for Aboriginal and Torres Strait Islander peoples.
Under the 6th Community Pharmacy Agreement funding is provided to assist pharmacies operating in rural and remote areas through the Rural Pharmacy Maintenance Allowance. Programmes specific to Indigenous health have also been funded including the Quality Use of Medicines Maximised for Aboriginal and Torres Strait Islander People program. The primary aim of this programme is to improve medication compliance and quality use of medicines and consequently the health outcomes of Aboriginal and Torres Strait Islander people that attend participating Aboriginal Community Controlled Health Organisations in rural and urban areas of Australia.
The Pharmaceutical Society of Australia’s Guide to providing pharmacy services to Aboriginal and Torres Strait Islander people (PSA, 2014) was released in 2014 to assist pharmacists and pharmacy staff to be responsive to health beliefs, practices, culture and linguistic needs of Aboriginal and Torres Strait Islander people, families and communities. The guide encourages increased engagement with Indigenous health services and key Indigenous organisations and includes an overview of Aboriginal and Torres Strait Islander specific medicine programmes and a resource list from which pharmacists can gather more in-depth information.
It is important to develop a better understanding of how the various barriers impact on Indigenous Australians to better target strategies. As data improve, better analysis of gaps in the PBS arrangements will
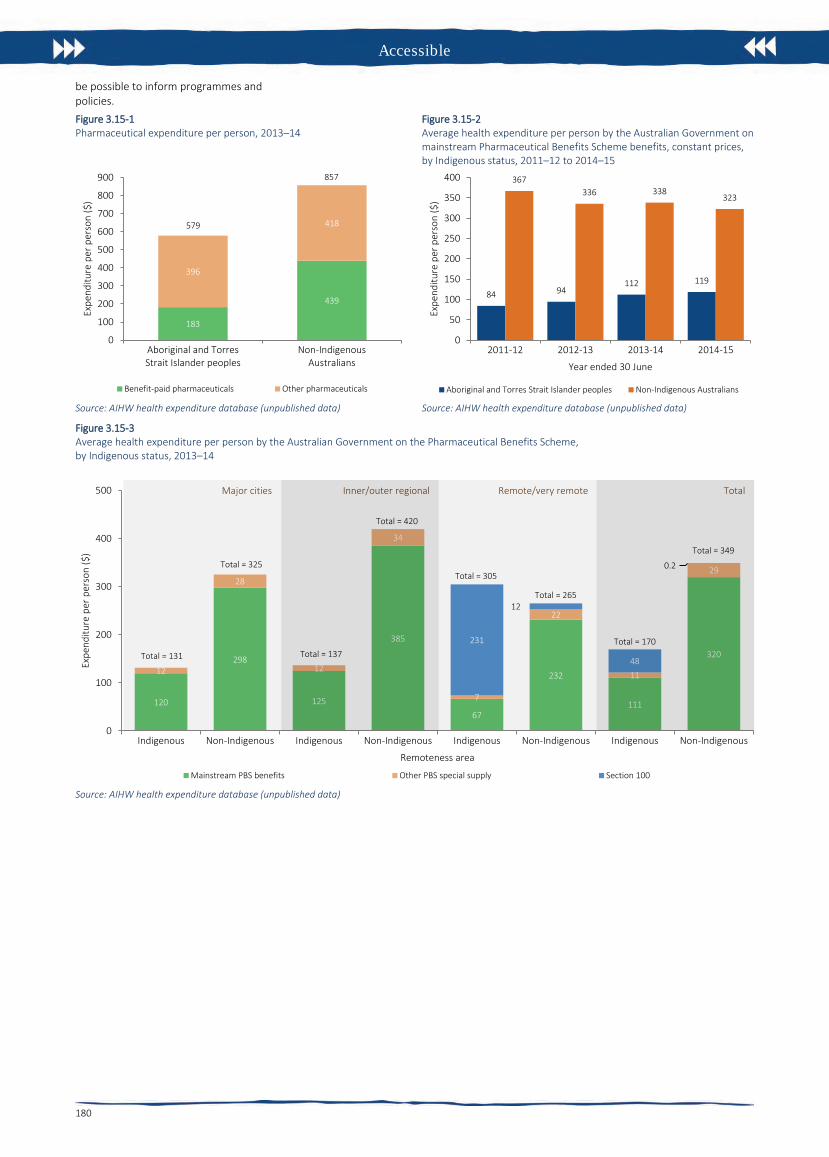
Accessible
180
be possible to inform programmes and policies. Figure 3.15-1 Pharmaceutical expenditure per person, 2013–14
Source: AIHW health expenditure database (unpublished data)
Figure 3.15-2 Average health expenditure per person by the Australian Government on mainstream Pharmaceutical Benefits Scheme benefits, constant prices, by Indigenous status, 2011–12 to 2014–15
Source: AIHW health expenditure database (unpublished data)
Figure 3.15-3 Average health expenditure per person by the Australian Government on the Pharmaceutical Benefits Scheme, by Indigenous status, 2013–14
Source: AIHW health expenditure database (unpublished data)
183
439
396
418
0
100
200
300
400
500
600
700
800
900
Aboriginal and TorresStrait Islander peoples
Non-IndigenousAustralians
Expe
nditu
re p
er p
erso
n ($
)
Benefit-paid pharmaceuticals Other pharmaceuticals
579
857
84 94112 119
367336 338
323
0
50
100
150
200
250
300
350
400
2011-12 2012-13 2013-14 2014-15
Expe
nditu
re p
er p
erso
n ($
)
Year ended 30 June
Aboriginal and Torres Strait Islander peoples Non-Indigenous Australians
120
298
125
385
67
232
111
320
12
28
12
34
7
22
11
29
231
12
48
0.2
0
100
200
300
400
500
Indigenous Non-Indigenous Indigenous Non-Indigenous Indigenous Non-Indigenous Indigenous Non-Indigenous
Expe
nditu
re p
er p
erso
n ($
)
Remoteness area
Mainstream PBS benefits Other PBS special supply Section 100
Major cities Inner/outer regional Remote/very remote Total
Total = 131
Total = 325Total = 349
Total = 170
Total = 265
Total = 305
Total = 420
Total = 137

Accessible
181
3.16 Access to after-hours primary health care Why is it important? ‘After-hours’ refers to services provided on Sundays, before 8 am and/or after 12 pm on a Saturday, or at any time other than 8 am to 6 pm on weekdays. An important component of comprehensive primary health care services is the capacity for patients to access services after hours. In the absence of after-hours primary health care, patients with more urgent needs may delay seeking care.
It is often preferable for after-hours primary care to be provided by a patient’s usual GP, as they are more likely to know about the patient’s condition and history, and be able to make an informed judgement about the treatment required. Many patients are provided with after-hours primary care services by their regular GP or at their usual health service through extended hours clinics, on-call arrangements, the provision of home visits, and cooperative arrangements that involve GPs from several practices participating in a shared roster system.
As this is not always possible, a number of other after-hours primary care arrangements exist. These include medical deputising services (where GPs contract another service to provide after-hours services on their behalf), dedicated after-hours services (GP and/or nurse-led clinics that only open during the after-hours period) and telephone triage and advice services (which involve telephone based nurses and/or GPs providing advice and directing people to the most appropriate point of care). Many patients also attend emergency departments during the after-hours period.
The Medicare Benefits Schedule (MBS) includes after-hours items that provide increased benefit rates to medical practitioners. Rates are highest for urgent after-hours consultations where practitioners are required to provide a home visit, or return to the clinic specifically for that consultation.
Findings Self-reported data from the 2012–13 Health Survey indicate 9% of Indigenous Australians living in non-remote areas reported accessing a doctor outside normal business hours in the previous 12 months.
According to 2015–16 Medicare data on MBS services claimed for after-hours care items, there were around 295,000 after-hours services provided to Indigenous Australians, representing 2.6% of all services (note these data may double-count after-hours care provided in selected emergency
departments). After adjusting for the age differences in the two populations, the Indigenous rate was 390 per 1,000 population compared with 474 per 1,000 population for non-Indigenous Australians.
For Aboriginal and Torres Strait Islander peoples, claims for after-hours services ranged from 169 per 1,000 population in remote areas to 656 per 1,000 in major cities. Rates were lowest in the NT (155 per 1,000) and highest in SA (727 per 1,000). Indigenous rates were 1.5 times as high as non-Indigenous rates in very remote areas and only 34% as high in the NT.
From GP survey data (2010–15) it is estimated that 84% of GP encounters for Indigenous patients were with practices that had after-hours care arrangements in place (compared with 96% for other Australian patients).
In the 2014–15 Online Services Report 49% of Commonwealth-funded Indigenous primary health care organisations provided after-hours services (AIHW, 2016o). The main types of services provided after hours were transport (66%), followed by treatment of injury (61%), diagnosis and treatment of infectious illness/disease (54%), and social and emotional wellbeing/mental health/counselling services (46%). Other services provided include: diagnosis and treatment of chronic illness/disease (41%), antenatal care (36%), care in police station/lock-up (34%), maternal and childcare (25%), and substance use/drug and alcohol programs (17%).
Data on services provided by emergency departments are limited to large public hospitals, mainly located in major cities. In these hospitals, in the period 2014–15 to 2015–16, there were about 875,300 emergency department presentations by Aboriginal and Torres Strait Islander patients, representing 6% of all presentations. Around 59% (513,600) of these episodes occurred after hours. This proportion was similar for non-Indigenous patients (56%). For Aboriginal and Torres Strait Islander patients, around 55% (281,700) of emergency department presentations provided after-hours were classified as semi-urgent or non-urgent (triage categories 4 and 5) as were 50% of non-Indigenous after-hours emergency department episodes of care.
Implications Aboriginal and Torres Strait Islander peoples have a lower rate of MBS after-hours services claimed than non-Indigenous Australians (rate ratio of 0.8). Rates were particularly low in remote and very remote areas for Indigenous and non-Indigenous Australians and the largest gap was in the NT (rate ratio of 0.3). Note: not all care delivered through Indigenous primary health
care services can be claimed through Medicare.
While Indigenous Australians make up 3% of the population, they represent 6% of emergency department presentations in hospitals for which data are collected. Over half of these presentations occurred after-hours. A better understanding is required of the needs of Aboriginal and Torres Strait Islander peoples for health services after-hours, and the best ways of providing coverage.
Following the Review of after-hours primary health care, new After-Hours Primary Health Care arrangements were implemented on 1 July 2015 and include:
• a new Practice Incentives Program (PIP)after-hours incentive payment available toeligible accredited general practicesregistered for the PIP
• funding to Primary Health Networks(PHNs) to support locally tailored after-hours services
• the new after-hours GP advice andsupport line to better support allAustralians who do not have access toface to face GP services in the after-hoursperiod.
The PIP after-hours incentive is designed to provide a nationally consistent model for access to after-hours primary health care for the majority of Australia. Recognising that the PIP after-hours incentive is not a one-size-fits-all solution, PHNs are being funded to address gaps in after-hours service provision, including where there is unmet need. PHNs will focus on access to care for ‘at-risk’ or vulnerable populations (such as Aboriginal and Torres Strait Islander people) and improving service integration, particularly where gaps exist due to a lack of access to general practices registered for the PIP after-hours incentive.

Accessible
182
Figure 3.16-1 Age-standardised rate of MBS services claimed for after-hours care, by Indigenous status and remoteness, 2015–16
Source: Medical Benefits Division, Department of Health
Figure 3.16-2 Age-standardised rate of MBS services claimed for after-hours care, by Indigenous status and state/territory, 2015–16
Source: Medical Benefits Division, Department of Health
Figure 3.16-3 Rate of GP encounters, by whether the GP has after-hours arrangements in place, by Indigenous status of the patient, April 2010–March 2015
Source: Family Medicine Research Centre, University of Sydney analysis of BEACH data
Figure 3.16-4 Non-admitted patient emergency care episodes for triage categories 4 (semi-urgent) and 5 (non-urgent) by time of day and Indigenous status, July 2014–June 2016
Note: Data are limited to public hospitals, mainly in major cities classified as principal referral, specialist women’s and children’s hospitals or large hospitals. Source: AIHW analysis of National Non-admitted Patient Emergency Department Care Database
Table 3.16-1 Emergency Department presentations after-hours, by Indigenous status, July 2014–June 2016
Time of presentation Number Percent
Indigenous Non-Indigenous Indigenous Non-Indigenous
All emergency department presentations
On Sundays 130,543 2,105,451 15 15
Before 8am or after 12pm on Saturday 103,574 1,554,515 12 11
Before 8am or after 6pm on a weekday 284,318 4,098,874 32 30
Total after hours 518,435 7,758,840 59 56
Not after hours 365,270 6,100,229 41 44
Total 883,705 13,859,069 100 100
Semi-urgent or non-urgent (triage category 4 and 5) emergency department presentations
On Sundays 76,243 1,134,573 15 16
Before 8am or after 12pm on Saturday 57,580 794,372 12 11
Before 8am or after 6pm on a weekday 150,496 1,960,792 30 27
Total after hours 284,319 3,889,737 57 54
Not after hours 214,290 3,260,971 43 46
Total 498,609 7,150,708 100 100
Proportion of all after hours presentations 55 50 Note: These data are limited to large public hospitals mainly located in major cities. Source: AIHW analysis of National Non-admitted Patient Emergency Department Care Database
0
100
200
300
400
500
600
700
Major cities Innerregional
Outerregional
Remote Very remote
Num
ber p
er 1
,000
pop
ulat
ion
Remoteness area
Aboriginal and Torres Strait Islander peoples Non-Indigenous Australians
0
100
200
300
400
500
600
700
800
NSW Vic Qld WA SA Tas ACT NT Aus
Num
ber p
er 1
,000
pop
ulat
ion
Jurisdiction
Aboriginal and Torres Strait Islander peoples Non-Indigenous Australians
29
13
2920
84
16
31
13
55
9
96
4
0
20
40
60
80
100
Own Deputising service Total after hours
Num
ber p
er 1
00 e
ncou
nter
s
Aboriginal and Torres Strait Islander peoples Other Australians
0
1
2
3
4
5
6
7
8
Midnight 2 4 6 8 10 Noon 14 16 28 20 22
Per c
ent
TimeAboriginal and Torres Strait Islander peoplesNon-Indigenous Australians

183
3.17 Regular GP or health service Why is it important? Having a usual primary health care provider is associated with good communication between the patient and provider, greater levels of trust and satisfaction with providers (Mainous et al, 2001; Schers et al, 2005), and better health outcomes for patients (Starfield, 1998; Starfield & Shi, 2004). Those with a usual primary care provider are more likely to receive: care based on guidelines, preventative care, and better coordination of care with other providers to meet patient need (Forrest & Starfield, 1996; Atlas et al, 2009). Other benefits of having a continuous doctor–patient relationship include improved diagnoses, better medication management, avoidance of repeat tests or other interventions, and fewer hospitalisations, particularly for people with complex health care needs (Hollander et al, 2009).
Findings Based on self-reported 2012–13 Health Survey data, 86% of Aboriginal and Torres Strait Islander peoples have a usual place to go for health problems and advice. Most Indigenous Australians usually went to a doctor if they had a problem with their health (54%), followed by Aboriginal Medical Services (AMS) (17%), community clinics (10%) and hospitals (5%). Note: some caution is needed as respondents may not clearly differentiate between an AMS and a community clinic (ABS, 2013c) or between a doctor at an AMS or another practice (it is estimated that 3% of those that usually went to a ‘doctor’ went to an AMS doctor).
In 2012–13, 14% of Indigenous Australians had no regular source of health care. Use of AMSs and community clinics increased by remoteness, from 13% in major cities to 66% in very remote areas.
The survey asked where people would like to go if they were sick or needed advice about their health. In 2012–13, 53% of Indigenous Australians reported they would prefer to go to a doctor, 26% to an AMS, and 9% to a community clinic. In most instances Indigenous Australians expressed a preference for the services they currently use and services available in their local area. Preferences varied by remoteness with GPs preferred mostly by Indigenous Australians in major cities (68% compared with 10% in very remote areas) and community clinics preferred mostly by Indigenous Australians in very remote areas (50% compared with 2% in major cities). Nationally, 27% of Indigenous Australians who said they would like to go to an AMS did not have an AMS available in their local area.
Availability of services varied across Australia. Around 95% of those living in major cities reported GPs being available compared with 31% in very remote areas. AMSs were reported as being locally available by 61% of those living in outer regional areas and 26% of those in very remote areas. In 2012–13, 77% of Indigenous Australians living in very remote areas reported that there were community clinics available compared with 33% of those living in major cities.
Nationally, 5% of Aboriginal and Torres Strait Islander peoples usually go to hospital if there is a problem with their health. See measure 3.07 for analysis of hospitalisations for conditions that could be prevented if primary health care services were better able to meet the needs of Aboriginal and Torres Strait Islander peoples. A higher use of hospitals for regular health care was reported in WA and Qld (both 10%) than in other jurisdictions (1%–3%).
In 2012–13, 70% of Aboriginal and Torres Strait Islander peoples rated their health care experience as ‘excellent’ or ‘very good’ in the previous 12 months. Indigenous Australians with no usual GP/medical service reported lower rates of satisfaction than those with a regular doctor/GP (61% reporting excellent or very good compared with 73%).
In 2012–13, the majority of Indigenous Australians aged 15 years and over living in non-remote areas reported that doctors listened to them (89%), explained things in a way that could be understood (87%), showed respect for what was said (89%) and spent enough time with them (85%). National data for all Australians from the Patient Experience Survey showed that GPs always or often listened carefully (89%), showed respect (93%) and spent enough time with them (88%) (SCRGSP, 2013).
In the 2014–15 Social Survey, 35% of Indigenous Australians reported they had been treated unfairly in the previous 12 months because they are Aboriginal or Torres Strait Islander. Around 2% of Indigenous people avoided seeking care from doctors, nurses or other staff at hospitals or doctor’s surgeries because of previous unfair treatment.
In 2014–15, around 81% of Indigenous Australians aged 15 years and over agreed/strongly agreed that their doctor can be trusted. Further analysis of this issue is discussed in the context of cultural competency (see measure 3.08).
Implications Most Aboriginal and Torres Strait Islander peoples have a usual source of health care. This finding is encouraging as access to a usual source of care is one of the foundations for a good primary health care system. The main sources of primary health
care for Indigenous Australians are GPs, AMSs and community clinics. While mainstream general practice is a significant source of care for Indigenous Australians, for most GPs, Indigenous clients will remain a small proportion of their clients. Some mainstream practices have implemented strategies explicitly focused on their Indigenous patients (Hayman, NE et al, 2009; Spurling et al, 2009).
Australian Government initiatives include the Practice Incentives Program—Indigenous Health Incentive (PIP–IHI) to support general practices and Indigenous health services to provide better health care for Aboriginal and Torres Strait Islander patients. Payments are made to practices that register for the PIP–IHI and meet certain requirements, including establishing and using a mechanism to ensure Indigenous patients aged 15 years and over with a chronic disease are followed up (e.g. use of a recall/reminder system or staff actively seeking out patients to ensure they return for ongoing care), and at least two staff members from the practice (one of whom must be a GP) completing appropriate cultural awareness training. In 2014–15, about 3,700 general practices and Indigenous health services had signed on to the incentive. Around 64,700 patients were registered in 2014–15 (Department of Health unpublished).
The Australian Government is continuing to ensure high quality training is provided to GP registrars under the Australian General Practice Training Program, and supports 1,500 commencing GP registrars each year as well as ongoing participants. At least 50% of all GP training is undertaken in rural and regional areas.
Accessible

Continuous
184
Figure 3.17-1 Usual source of health care by type, Indigenous Australians, by remoteness, 2012–13
Source: ABS and AIHW analysis of 2012–13 AATSIHS
Figure 3.17-2 Preferred source of health care by type, Indigenous Australians, by remoteness, 2012–13
Source: ABS and AIHW analysis of 2012–13 AATSIHS
Figure 3.17-3 Available sources of health care by type, Indigenous Australians, by remoteness, 2012–13
Source: ABS and AIHW analysis of 2012–13 AATSIHS
Figure 3.17-4 Patient experience by usual source of health care, Indigenous Australians 15 years and over who saw a doctor or specialist (non-remote) 2012–13
Source: ABS and AIHW analysis of 2012–13 AATSIHS
54
7
31
60
61
68
17
11
29
21
21
11
10
54
10
3
2
2
5
16
13
5
3
2
1
1
1
1
1
1
14
10
16
11
13
16
0 10 20 30 40 50 60 70 80 90 100
Australia
Very remote
Remote
Outer regional
Inner regional
Major cities
Per cent
Rem
oten
ess
area
Doctor/GP
AMS
Community clinic
Hospital
Other
No usual provider
53
10
32
57
59
68
26
16
36
29
31
23
9
50
9
3
3
2
10
23
20
10
5
5
2
2
3
2
2
2
0 10 20 30 40 50 60 70 80 90 100
Australia
Very remote
Remote
Outer regional
Inner regional
Major cities
Per cent
Rem
oten
ess
area
Doctor/GP
AMS
Community clinic
Hospital
Other
95 94 88
71
31
83
41
58 61 58
26
48
3340 37 36
77
42
70
8277 76
42
71
5 613 11
189
0
20
40
60
80
100
Major cities Inner regional Outer regional Remote Very remote Australia
Per c
ent
Remoteness area
Doctor/GP
AMS
Community clinic
Hospital
Other
90 88 84 85 8988 8880 81
8790 9080
86 8986 87 85 80 8573 69 65 61
70
0
20
40
60
80
100
Doctor/GP AMS/Cmty clinic Hospital No usual provider Total
Per c
ent
Health care service
Felt listened to
Felt explanations wereclearFelt respected
Felt enough time spentwith themOverall ratingexcellent/very good

Continuous
185
3.18 Care planning for chronic diseases Why is it important? Chronic diseases are the major causes of illness, disability and death among Aboriginal and Torres Strait Islander peoples (see measures 1.02 and 1.23) and are estimated to be responsible for 70% of the health gap (AIHW, 2016f).
Effective management of chronic disease can delay the progression of disease, decrease the need for high-cost interventions, improve quality of life, and increase life expectancy. As good quality care for people with chronic disease generally involves multiple health care providers across multiple settings, the development of care plans is one way in which the client and primary health care (PHC) provider can ensure appropriate care is arranged and coordinated.
A care plan is a written action plan containing strategies for delivering care that address an individual’s specific needs, particularly patients with chronic conditions and/or complex care needs. A care plan can be used to record information about the patient’s condition, actions the patient needs to take and the various services required to achieve management goals for the patient. Development of a care plan can also help encourage the patient to take informed responsibility for their care, including actions to help achieve the treatment goals. A care plan may involve one health professional (usually a GP or other PHC doctor), or may be negotiated with several service providers (e.g. GP, nurse, Aboriginal health worker, allied health professionals, community services providers) in consultation with the patient.
A number of reviews have found that the chronic disease interventions most likely to be effective in the Australian context include: engaging primary care services in self-management support through education and training for GPs and practice nurses, and including self-management support in care plans linked to multidisciplinary team support (Kowanko et al, 2012; Dennis et al, 2008).
GPs are encouraged to develop care plans through a number of items under the Medicare Benefits Schedule. In July 2005, Chronic Disease Management items were introduced specifically focused on patients with chronic or terminal conditions who will benefit from a structured approach to management of their care needs. These include an item related to the development of a GP Management Plan (GPM), an item for a Team Care Arrangements (TCA) where planning involves a broader team, and items for where GPs contribute to care plans
developed by another service provider or to a review of those plans.
Findings In 2015–16, there were nearly 66,100 Medicare GPMP claims and 56,400 TCA claims for Indigenous Australians—a steady increase in uptake since these items were introduced in July 2005. In the period 2009–10 to 2015–16, rates of services claimed by Indigenous Australians have doubled for TCAs (from 55 to 112 per 1,000) and almost doubled for GPMPs (from 70 to 129 per 1,000).
In 2015–16, the Indigenous rate was higher than the non-Indigenous rate for both GPMPs (129 per 1,000 compared with 86 per 1,000) and TCAs (112 per 1,000 compared with 72 per 1,000). This higher rate for Indigenous Australians has been particularly noticeable from 2009–10 when the Indigenous chronic disease initiatives were introduced.
Commonwealth-funded Indigenous PHC organisations provide national Key Performance Indicators (nKPI) data on a range of process of care measures related to chronic disease management. In May 2015, around 32,900 regular Indigenous clients of these organisations had Type 2 diabetes. Of these clients, 51% had a GPMP in the two years to May 2015. This was an increase of 10 percentage points from December 2012. Improvements were seen in all jurisdictions and remoteness areas. Of clients with diabetes, 48% had a TCA in the two years to May 2015. This was an increase of 12 percentage points from December 2012. Improvements were again seen nation-wide.
In 2014–15, Commonwealth-funded Indigenous PHC organisations provided organisation-level data on chronic disease management. All 203 organisations provided some form of care planning. In particular, 67% reported that discharge planning was well coordinated and 70% provided or facilitated shared-care arrangements for managing people with chronic conditions.
Key elements of effective asthma management include a written asthma action plan and regular use of medications that control the disease and prevent exacerbations of the condition (AIHW, 2011b). Based on self-reported data from the 2012–13 Health Survey, 29% of Indigenous Australians with asthma living in non-remote areas had a written asthma action plan (similar to the proportion for non-Indigenous Australians, after adjusting for differences in the age structures of the two populations). Rates were highest for children aged 0–14 years. Indigenous Australians were more likely to go to hospital or an emergency department due to their asthma than non-Indigenous Australians, particularly in the age groups over 25 years. In 2012–13, an estimated 18%
of Indigenous Australians had asthma—twice the non-Indigenous rate.
Implications As discussed in relation to measure 3.05, organised chronic disease management in Aboriginal and Torres Strait Islander primary health care services has been demonstrated to result in improvement in various health outcomes (Hoy, W et al, 2000; Hoy, W et al, 1999; Rowley et al, 2000; McDermott et al, 2003; Bailie, R et al, 2007). Working with clients and their families to support proactive management of health conditions is vital (Griew et al, 2007).
A study of general practice patients with Type 2 diabetes found that, following implementation of care plans, the proportion of patients involved in multidisciplinary care and in the adherence to diabetes care guidelines increased. There were also improvements in patient metabolic control and cardiovascular risk factors (Zwar et al, 2007). Another study found an association between completing an annual cycle of care with good glycaemic control among diabetic patients (Esterman et al, 2016).
Barriers/enablers of chronic condition management strategies include: access to appropriate and affordable health services; effective clinical information management systems; coordination and TCAs; peer support; staff capacity and training in chronic condition management; engagement with clients and community; encouragement and support for clients; client knowledge of chronic conditions and their management; commitment to lifestyle change and family/peer support (Kowanko et al, 2012).
Negative experiences with specialists (e.g. discrimination, feeling patronised, judged and blamed) have influenced participants’ decisions not to follow up on doctor referrals, with these having negative implications for continuity and coordination of care (Aspin et al, 2012).
A range of government initiatives to tackle chronic disease and provide coordinated, effective care planning are covered in detail in the Policies and Strategies section.
The Australian Government provides funding through the Practice Incentives Program—Indigenous Health Incentive, to support general practices and Indigenous health services to provide better health care for Aboriginal and Torres Strait Islander patients, including best practice management of chronic disease.

Continuous
186
Figure 3.18-1 Age-standardised rates of selected GPMPs and TCAs claimed through Medicare by Indigenous status, 2005–06 to 2015–16
Source: Medical Benefits Division, Department of Health
Figure 3.18-2 Proportion of people with asthma reporting having a written asthma action plan, by Indigenous status and age group, non-remote areas, 2012–13
Source: ABS and AIHW analysis of 2012–13 AATSIHS
Figure 3.18-3 Proportion of Indigenous regular clients with type 2 diabetes who had a GPMP and TCA in the last 2 years, by remoteness area, Indigenous primary health care organisations, December 2012, June 2013, December 2013, June 2014, December 2014 and May 2015
Source: AIHW analysis of national Key Performance Indicators for Aboriginal and Torres Strait Islander primary health care data collection
Figure 3.18.4 Proportion of Indigenous regular clients with type 2 diabetes who had a GPMP and TCA in the last 2 years, by jurisdiction, Indigenous primary health care organisations, December 2012, June 2013, December 2013, June 2014, December 2014 and May 2015
Source: AIHW analysis of national Key Performance Indicators for Aboriginal and Torres Strait Islander primary health care data collection
0
50
100
150
06 07 08 09 10 11 12 13 14 15 16
Num
ber p
er 1
,000
pop
ulat
ion
Year ended 30 June
Indigenous services GPMPs Indigenous services TCAsNon-Indigenous services GPMPs Non-Indigenous services TCAs
44
53
18
1318
2429
3841
1916 17
23 24
0
10
20
30
40
50
60
0–4 5–14 15–24 25–34 35–44 45–54 55+
Per c
ent
Age group (years)
Aboriginal and Torres Strait Islander peoples Non-Indigenous Australians
0
20
40
60
80
100
Major cities Innerregional
Outerregional
Remote Veryremote
Total
Per c
ent
Remoteness area
GP Management Plans
Dec-12 Jun-13 Dec-13 Jun-14 Dec-14 May-15
Majorcities
Innerregional
Outerregional
Remote Veryremote
Total
Team Care Arrangements
0
20
40
60
80
100
NSW/ACT Vic/Tas Qld WA SA NT Total
Per c
ent
Remoteness area
GP Management Plans
Dec-12 Jun-13 Dec-13 Jun-14 Dec-14 May-15
NSW/ACT Vic/Tas Qld WA SA NT Total
Team Care Arrangements

Capable
187
3.19 Accreditation Why is it important? Accreditation is a process, usually voluntary, through which a recognised external body assesses the extent to which a health care organisation meets applicable quality standards. Quality standards typically address issues such as governance of the organisation, management of safety issues such as infection control, handling of care processes such as discharge planning, general management issues such as human resource management, quality of the physical infrastructure, and issues such as handling of patient complaints. Assessments of quality often result in recommendations for action. The assessment outcome may also be reported publicly in a summarised form.
The services accessed by Aboriginal and Torres Strait Islander peoples should be able to demonstrate a comparable level of quality when compared with other health services in Australia. While accreditation status is a broad measure, it provides one measure of the capability of services, based on their skills and knowledge, to provide quality health services to Aboriginal and Torres Strait Islander peoples.
In Australia, there are accreditation systems for both hospitals and general practice. Public and private hospitals are accredited against the National Safety and Quality Health Service Standards (NSQHSS). There are nine organisations approved by the Australian Commission on Safety and Quality in Health Care (ACSQHC) to asses to the NSQHSS. There are currently 1,342 public and private hospitals and day procedure services in Australia eligible to be assessed against the NSQHSS. Of these health service organisations, 743 (55%) are in the public sector and 599 (45%) are in the private sector.
In 2014–15, 93% of public hospitals, were accredited (AIHW, 2016b). For small hospitals located in regional and remote areas, accreditation is less common. Achieving accreditation generally requires a considerable ongoing investment of time and resources, which is not always easy for smaller hospitals. It is not possible to draw conclusions about the quality of care in hospitals that do not have accreditation.
Accreditation in general practice involves assessment against standards set by the Royal Australian College of General Practitioners (RACGP) in five key areas: practice services; rights and needs of patients; safety, quality improvement and education; practice management; and physical factors (RACGP, 2010). There are two registered accreditation providers: Australian General Practice Accreditation
Limited (AGPAL) and General Practice Accreditation Plus (GPA+). In addition to patient safety and service quality, there is evidence that the process of accreditation encourages quality improvement and continuing professional development (URBIS, 2014). It is likely that more practices are using the standards than are actually accredited at any one time (SCRGSP, 2016a).
The Practice Incentives Program (PIP) has helped increase rates of general practice accreditation (ANAO, 2010). Note, though that Aboriginal Medical Services and other practices in remote locations or with specialist interests are often not eligible for accreditation against RACGP Standards or find the process of accreditation difficult.
Findings Between July 2014 and June 2015, 92% of public hospital separations for Aboriginal and Torres Strait Islander peoples occurred in accredited hospitals (as did 93% of public hospital separations for non-Indigenous Australians). Rates were lowest in outer regional areas, and highest in remote areas.
In most jurisdictions over 90% of public hospital separations for Indigenous Australians occurred in accredited hospitals. The exceptions were Qld (74%) and Tas (59%). In Qld the proportion of accredited separations was over 10 percentage points lower for Indigenous patients than for non-Indigenous patients; however in WA the Indigenous proportion was over 10 percentage points higher. In the other jurisdictions Indigenous and non-Indigenous proportions were similar.
In 2014–15, 92% of general practices registered with GPA+ or AGPAL were fully accredited by the respective organisation. The proportion of practices that were accredited ranged from 92% for practices in areas where Aboriginal and Torres Strait Islander peoples make up less than 2% of the population, to 95% in areas where 10% or more of the population is Indigenous.
The 2014–15 Online Services Report (OSR) includes data on the accreditation status of Commonwealth-funded Indigenous primary health care organisations.
Of the 203 organisations, 157 employed a GP and of those, 91% reported having a current clinical RACGP and/or organisational accreditation. The 203 organisations included 138 Commonwealth-funded Aboriginal and Community Controlled Health Organisations, of which 129 employed a GP. 98% of those 129 organisations reported RACGP and/or organisational accreditation.
Implications By achieving accreditation, health service organisations can monitor, evaluate and improve the quality of health services they provide.
In 2014–15 the Australian Government expanded the Healthy for Life (HfL) programme to build continuous quality improvement (CQI) into clinical practice and service delivery within Aboriginal Community Controlled Health Organisations (ACCHOs). Funding was also provided to the Aboriginal Community Controlled Health Sector peak bodies to support ACCHOs in implementing best practice clinical, governance and business systems and to provide training and support to ACCHOs in the use of CQI to achieve improved clinical outcomes.
The ACSQHC is undertaking a project to improve the care provided to Aboriginal and Torres Strait Islander people in health service organisations, using the framework of the NSQHSS. Now underway, the next stage of this project aims to:
• raise awareness of the issues facingAboriginal and Torres Strait Islanderpatients in mainstream health serviceorganisations
• improve the safety and quality of care forAboriginal and Torres Strait Islanderpatients by supporting mainstreamorganisations to implement the NSQHSS,using resources that contain effective,evidence-based strategies to addressIndigenous health issues
• improve the Aboriginal and Torres StraitIslander cultural awareness skills of thesurveyor workforce whose membersassess health service organisations to theNSQHSS.

Capable
188
Figure 3.19-1 Proportion of public hospital separations in accredited hospitals, by Indigenous status and state/territory, 2014–15
Note: Data are from public hospitals only. Data for the ACT individually were not available. Source: AIHW analysis of National Hospital Morbidity Database, National Public Hospitals Establishment Database and ACSQHC unpublished data
Figure 3.19-2 Proportion of public hospital separations in accredited hospitals, by Indigenous status and remoteness, Australia, 2014–15
Note: Data are from public hospitals only. Source: AIHW analysis of National Hospital Morbidity Database, National Public Hospitals Establishment Database and ACSQHC unpublished data
Figure 3.19-3 Proportion of general practices accredited through AGPAL and GPA+, by proportion of the population that is Indigenous, 2014–15
Source: AIHW analysis of AGPAL and GPA+ data
9991
74
97 97
59
10092
9994
87 86
97
57
10093
0
20
40
60
80
100
NSW Vic Qld WA SA Tas NT Australia
Per c
ent (
sepa
ratio
ns)
JurisdictionAboriginal and Torres Strait Islander peoples Non-Indigenous Australians
95 95
81
100 999295 91
85
100 9893
0
20
40
60
80
100
Major cities Inner regional Outer regional Remote Very remote Australia
Per c
ent (
sepa
ratio
ns)
Remoteness areaAboriginal and Torres Strait Islander peoples Non-Indigenous Australians
92 92 91 92 93 95 92
0
20
40
60
80
100
<1% 1–2% 2–3% 3–4% 4–10% >10% Total
Per c
ent
Proportion of population that is Indigenous

Capable
189
3.20 Aboriginal and Torres Strait Islander peoples training for health-related disciplines Why is it important? Aboriginal and Torres Strait Islander peoples are significantly under-represented in the health workforce (see measure 3.12). Improving and supporting the participation of Aboriginal and Torres Strait Islander people in tertiary education for health-related disciplines is vital to increasing Aboriginal and Torres Strait Islander participation in the health workforce.
Findings In the Higher Education Student Statistics collection for 2015, an estimated 2,475 current enrolments for health-related courses were for Aboriginal and Torres Strait Islander tertiary students, as were 416 health-related course completions. Enrolment rates for Indigenous university students have increased from 29 per 10,000 in 2001 to 51 per 10,000 in 2015. There has also been an increase in completion rates over this period, from 5.6 per 10,000 to 8.6 per 10,000. Enrolment rates increased at a faster rate than completion rates (101% compared with 85%). Between 2001 and 2015 there was also an increase in enrolment and completion rates for non-Indigenous students. This has led to a widening in the gap between Indigenous and non-Indigenous enrolment rates.
The success rate for Indigenous university students studying health-related courses in 2015 was 81% compared with 92% for non-Indigenous students. Health-related course enrolments for Indigenous undergraduate students in 2015 were highest for nursing (1,269 enrolments and 150 completions). In the same year, there were 225 Indigenous students enrolled in public health courses (of these, 112 were in a specific Indigenous health course) and there were 30 completions. There were an estimated 214 Indigenous enrolments for medicine with the proportion of enrolments for Indigenous undergraduates in medical studies comparable to that for non-Indigenous students. Indigenous student enrolments rates for health-related courses were lower than non-Indigenous student rates in the younger age groups, but exceeded non-Indigenous student rates in the older age groups (35 plus years).
Vocational Education and Training (VET) attracts the highest proportion of Indigenous students studying and completing health-related courses. In 2015 there were 5,910 Indigenous student enrolments in health-related courses in the VET sector and 1,275 completions. Indigenous students were
around 1.5 times more likely to be enrolled in health-related courses as non-Indigenous students (123 per 10,000 compared with 79 per 10,000). Rates for completions were also higher for Indigenous students (27 per 10,000 compared with 19 per 10,000).
The Indigenous completion rate has improved significantly between 2003 and 2014 (from 7.8 per 10,000 to 21.6 per 10,000); and this rate of improvement was faster than for non-Indigenous completions.
The most common type of health-related course for Aboriginal and Torres Strait Islander VET students was public health (2,795 enrolments and 766 completions) followed by nursing (791 enrolments and 142 completions).
In 2015, there were 297 VET sector completions for the Aboriginal and Torres Strait Islander Health Worker course in Australia. Women accounted for 64% of the student completions in this course. The VET load pass rate for Indigenous students studying health-related courses was 75% compared with 80% for non-Indigenous students.
Implications Trends to 2014 show significant success in the VET sector. There has also been a significant improvement in higher education; however, the gap has not improved.
Aboriginal and Torres Strait Islander health professional organisations are funded to support the Indigenous health workforce and promote a culturally appropriate health care system. They support the training of Indigenous Australians in health-related professions through mentoring, professional development, advice and practical support for students and prospective students.
Funding is provided for the Leaders in Indigenous Medical Education (LIME) Network to promote and support effective teaching and learning about Aboriginal and Torres Strait Islander health in medical education, and the successful participation of Indigenous Australians in medical education programmes. The LIME Network facilitates key relationships between ACCHOs and medical schools to improve collaboration, student placement opportunities and research initiatives.
Support has been provided to assist 169 Aboriginal and Torres Strait Islander Health Workers to obtain the Certificate IV required for Practitioner registration, and 95 were trained to supervise and assess those undertaking this course.
The Puggy Hunter Memorial Scholarship Scheme continues to provide scholarships for Aboriginal and Torres Strait Islander students in most health disciplines. Since 2002, more than 1,540 scholarships have been awarded. In 2016, there were 363 participants completing their courses.
Indigenous aged care workforce training programmes—the Rural and Remote Training Program (RRTP), NT Training Program (NTTP) and Indigenous Remote Service Delivery Traineeships (IRSDT)—provide culturally appropriate, relevant, and accredited entry-level certificates through to an advanced diploma to Aboriginal and Torres Strait Islander aged care workers, chiefly for those employed in Indigenous health and aged care services.
Strategies are required to increase enrolment in courses for the health disciplines in which Indigenous students are under-represented. Some medical schools have been significantly more successful in attracting and retaining Indigenous medical students. These schools have adopted comprehensive approaches including: locally based strategies involving personal contact and community engagement, building relationships with potential students and their families and communities, and Indigenous medical or health support units. Indigenous Australian medical students reported the presence of a support unit as their main reason for choosing a university (57%). The presence of Indigenous staff within the school was also important, along with mentoring, curriculum and cultural safety (Minniecon & Kong, 2005). Similarly for nursing, appointing Indigenous nursing academics, building partnerships between nursing schools and Indigenous Education Support Units, and implementing tailored cross-cultural awareness programs for nurse academics have been proposed to enable successful course completions by Indigenous nursing students (West, R et al, 2014).
Improvements in secondary school educational retention and attainment are also necessary (see measure 2.05).

Capable
190
Table 3.20-1 Undergraduate domestic enrolments and completions in health-related courses by Indigenous status, 2015
Enrolments Completions
Number Number per 10,000 Number Number per 10,000
Indigenous Non-
Indigenous Indigenous Non-
Indigenous Indigenous Non-
Indigenous Indigenous Non-
Indigenous Nursing 1,269 52,518 26.4 27.9 150 10,168 3 5
Public health 225 10,214 4.7 5.4 30 1,854 1 1
Indigenous health 112 32 2.3 0.0 21 6 0 0
Medical studies 214 10,571 4.4 5.6 n.p. 2,511 n.p. 1
Rehabilitation therapies 205 19,727 4.3 10.5 38 3,403 1 2
Dental studies n.p. 2,472 n.p. 1.3 < 5 n.p. n.p. n.p.
Pharmacy 25 5,334 0.5 2.8 < 5 n.p. n.p. n.p.
Radiography n.p. 3,128 n.p. 1.7 n.p. 578 n.p. 0
Optical science < 5 n.p. n.p. n.p. < 5 n.p. n.p. n.p.
Total domestic undergraduates(a) 2,001 102,670 41.6 54.5 270 19,709 6 10
Total(b) 2,476 164,061 . . . . 416 39,206 . . . . (a) Only the major course of each student is counted, so a student studying multiple courses is only counted once. (b) Includes undergraduate, postgraduate, domestic and international students n.p. not published Source: AIHW analysis of Higher Education Student Statistics Collection
Figure 3.20-1 Indigenous Australian university student enrolments and completions in health-related courses, 2001 to 2015
Source: AIHW analysis of Higher Education Student Statistics Collection
Figure 3.20-2 Undergraduate domestic health-related course enrolments by Indigenous status and age group, 2015
Source: AIHW analysis of Selected Higher Education Statistics
Table 3.20-2 Vocational education and training (VET) sector student enrolments and completions in health-related courses, 2015
Enrolments Completions
Number Rate (per 10.000) Number Rate (per 10,000)
Indigenous Non-
Indigenous Indigenous Non-
Indigenous Indigenous Non-
Indigenous Indigenous Non-
Indigenous Public health 2,795 44,990 58.1 23.9 766 10,965 15.9 5.8
Nursing 791 27,688 16.4 14.7 142 6,699 3.0 3.6
Dental studies 199 5,750 4.1 3.1 65 2,290 1.4 1.2
Complementary therapies 385 18,940 8.0 10.1 69 5,908 1.4 3.1
Rehabilitation therapies 26 98 0.5 0.1 18 33 0.4 0.0
Medical studies 16 1,668 0.3 0.9 - 112 - 0.1
Optical science 9 621 0.2 0.3 2 273 0.0 0.1
Pharmacy 5 1,197 0.1 0.6 1 523 0.0 0.3
Other health 2,325 70,291 48.3 37.3 212 8,301 4.4 4.4
Total 5,910 148,595 122.8 78.9 1,275 35,104 26.5 18.6 Students may enrol in more than one course Source: AIHW and NCVER analysis of National VET Provider Collection 2015 and National VET in Schools Collection 2015.
0
10
20
30
40
50
60
01 02 03 04 05 06 07 08 09 10 11 12 13 14 15
Num
ber p
er 1
0,00
0 po
pula
tion
Year
Enrolments Completions
74
4632
183
236
56
2713
10
50
100
150
200
250
15–24 25–34 35–44 45–54 55+
Num
ber p
er 1
0,00
0 po
pula
tion
Age group (years)
Aboriginal and Torres Strait Islander peoples Other Australians

Sustainable
191
3.21 Expenditure on Aboriginal and Torres Strait Islander health compared to need Why is it important? A basic principle of equity is that health expenditure should reflect the relative needs for health services (Whitehead 1992; Braveman 2003). Health expenditure for population groups with higher levels of need should be proportionately higher. A broad assessment of how well this principle is implemented is provided by comparing differentials in health status with differences in per capita health expenditure.
Findings From 2010–11 to 2014–15 Australian governments’ health expenditure per Indigenous Australian grew by 23%. Detailed expenditure data is available for 2013-14. On a per person basis, average health expenditure for Aboriginal and Torres Strait Islander peoples in 2013–14 was estimated to be $8,515, which was $1.38 for every $1.00 spent per non-Indigenous Australian.
During 2013–14, Australian governments provided an estimated 77% of the funding used to pay for health goods and services for Aboriginal and Torres Strait Islander peoples compared with 68% for non-Indigenous Australians. Those on lower incomes rely more on publicly provided services and spend less money on private services than people with higher incomes, and are much more likely to present to hospitals, even for primary health care (Deeble 2009). For Indigenous Australians, expenditure on hospitals was 6 times the expenditure for medical services (e.g. MBS services provided by a medical practitioner) compared with 2 times for non-Indigenous Australians. This reflects different usage patterns and costs.
In 2013-14, the proportion of total Australian Government health funding for Indigenous Australians use of medical services and medication was low compared to non-Indigenous Australians and higher for community health services. Per-person funding provided by the Australian Government for Aboriginal and Torres Strait Islander peoples was $3,261 compared with $2,698 for non-Indigenous Australians, a ratio of 1.21 to 1. Per-person expenditure provided by state and territory governments for Aboriginal and Torres Strait Islander peoples was $4,889 compared with $2,425 for non-Indigenous Australians, a ratio of 2.0:1, with the greatest expenditure in public hospitals followed by community health services.
Estimated expenditure per Aboriginal and/or Torres Strait Islander person by state and territory governments varies across
jurisdictions, with the highest expenditures per person in the NT. Most variation between jurisdictions may be explained by differences in the proportion of Indigenous Australians within the jurisdiction living in remote and very remote areas. For the main health programmes, in 2013–14, expenditures were an estimated $7,604 per Indigenous Australian in remote and very remote areas compared with $3,991 in outer and inner regional areas and $3,987 in major cities. The higher expenditures in rural and remote areas are largely related to hospital services and grants to Indigenous health services, and partly reflects higher costs of delivering health care services in those areas (AIHW 2013d).
In 2013-14, MBS and PBS expenditure per person was higher for non-Indigenous Australians than for Indigenous Australians across all remoteness areas. The gap for expenditure between Indigenous and non-Indigenous Australians was greatest in outer and inner regional areas and was smallest in remote and very remote areas. (see measure 3.15).
Hospitals separations expenditure by disease is available for 2012–13. The Indigenous per person expenditure was higher than non-Indigenous for hospital separations due to mental and behavioural disorders; endocrine, nutritional and metabolic diseases; and injuries. However, expenditure for non-Indigenous Australians was higher than for Indigenous Australians for treatment of musculoskeletal and connective tissue disorders; and neoplasms (including cancer). For expenditure on potentially preventable hospital separations, the greatest difference is attributable to diabetes, cellulitis, chronic obstructive pulmonary disease and convulsions and epilepsy.
In 2013–14, expenditure for primary health care services was $3,496 per person for Aboriginal and Torres Strait Islander peoples compared with $2,451 for non-Indigenous Australians. Primary health care expenditure on medical services, including those paid through the MBS, was $271 per person for Aboriginal and Torres Strait Islander peoples compared with $302 for non-Indigenous Australians. Per person expenditure on pharmaceuticals in the primary care sector was also much lower for Aboriginal and Torres Strait Islander peoples ($471 versus $741). Per person expenditure on community health services was 3.6 times higher for Indigenous Australians—$1,114 per person compared with $312 per person for non-Indigenous Australians. Community health expenditure accounted for $786 million in 2013–14 or 32% of total primary health care expenditure for Indigenous Australians.
Australian Government Indigenous specific health programme expenditure through the
Department of Health has increased from $115 million in 1995–96 to $727 million in 2015–16, a growth in real terms of 284%.
In 2013–14, expenditure for secondary and tertiary health care services was $4,539 per person for Indigenous Australians compared with $3,200 for non-Indigenous Australians. Hospital expenditure is the largest single expenditure item in secondary/tertiary health care services, accounting for $3,858 per Indigenous Australian. Expenditure on secondary/tertiary care medical services (mainly specialist care) was estimated to be $315 per person for Aboriginal and Torres Strait Islander peoples compared with $705 per person for non-Indigenous Australians.
Implications In 2013–14, 77% of Indigenous health funding was from Australian governments (39% state and territory and 38% Australian Government). On a per person basis, average health expenditure for Indigenous Australians in 2013–14 was 1.38 times that for non-Indigenous Australians. However, Indigenous Australians are currently experiencing a burden of disease and illness 2.3 times the rate of non-Indigenous Australians.
Funding levels for Indigenous health care will continue to grow over the next four years. From 2016–17 to 2019–20, the Australian Government will invest $3.4 billion in Indigenous specific health programmes and activities—an increase of over $600 million compared with 2012–13 to 2015–16. In 2016–17 more than $780 million will be spent on the provision of health programmes specifically for Aboriginal and Torres Strait Islander people.

Sustainable
192
Figure 3.21-1 Estimated per person health expenditure ratio of Indigenous to non-Indigenous Australians, 1995–96 to 2014-15
Source: AIHW Indigenous health expenditure database
Figure 3.21-2 Estimated state and territory health expenditure per person, by Indigenous status, 2013–14
Source: AIHW Indigenous health expenditure database
Figure 3.21-3 Expenditure by the Australian Government on Indigenous specific health programs, nominal $m, 1995–96 to 2015–16
Source: Australian Government Department of Health
1.08
1.22
1.18 1.17
1.251.20 1.21
1.31
1.39
1.47
1.24
1.30
1.40 1.38 1.40
1
1.1
1.2
1.3
1.4
1.5
1.6
1995-96 1998-99 2001-02 2004-05 2006-07 2008-09 2010-11 2011-12 2012-13 2013-14 2014-15
Ratio
Year
Including high care residential aged care (2006 Census based population) Excluding high care residential aged care (2006 Census based population)Excluding high care residential aged care (2011 Census based population)
3,515
4,473 4,386
6,4106,770
2,041
8,544
4,889
2,374 2,1442,563 2,477
2,9002,154
3,735
2,425
0
2,000
4,000
6,000
8,000
10,000
NSW Vic Qld WA SA Tas NT Total
Expe
nditu
re p
er p
erso
n ($
)
Jurisdiction
Aboriginal & Torres Strait Islander peoples Non-Indigenous Australians
115 113131
155 162185
202 210
245265
298
371
472
514
586
624
682 693725
657
727
0
100
200
300
400
500
600
700
800
96 97 98 99 00 01 02 03 04 05 06 07 08 09 10 11 12 13 14 15 16
$ m
illio
n
Year ending 30 June

Sustainable
193
Figure 3.21-4 Average health expenditure per person for primary health care and secondary/tertiary health care services, by Indigenous status, 2013–14 Source
Source: AIHW Indigenous health expenditure database
Figure 3.21-5 MBS expenditure per person, Indigenous and non-Indigenous Australians, by remoteness areas of patient’s residence, 2013–14
Note: excludes allied health services, optometry and dental services. Source: AIHW Indigenous health expenditure database
271 302
1114312
471
741
1640
1095
0.0
1,000.0
2,000.0
3,000.0
4,000.0
5,000.0
Aboriginal and Torres StraitIslander Peoples
Non-Indigenous
Expe
nditu
re p
er p
erso
n ($
)
Primary
Medical Services Community health services Pharmaceuticals Other
3,496
2,451
315705
733393
3125
1674
366
429
0
1,000
2,000
3,000
4,000
5,000
Aboriginal and Torres StraitIslander Peoples
Non-Indigenous
Expe
nditu
re p
er p
erso
n ($
)
Secondary/tertiary
Medical services Hospitals - non-admitted Hospitals - admitted Other
4,539
3,200
211 227170
216
121157 174
223
66 49
76
53
7731
73
49
77109
68
106
75 72
73
108
82
128
69
129
34 82
66
12749
93
40
88
26
56
40
91163
239
148
242
146
169
200
239
0
100
200
300
400
500
600
700
800
900
Indigenous Non-Indigenous Indigenous Non-Indigenous Indigenous Non-Indigenous Indigenous Non-Indigenous
Expe
nditu
re p
er p
erso
n ($
)
GP Other unreferred Pathology Imaging Specialist Operations and other
649
845
571
834
479
566
837
626
Major Cities Inner/outer regional Remote/very remote All regions

Sustainable
194
Figure 3.21-6 Health expenditure per person on selected health services(a), Indigenous and non-Indigenous Australians, by remoteness area of patient’s residence, 2013–14
(a) Excludes health expenditure on non-admitted patient services, patient transport, dental services, community health services other than ACCHOs, other professional services, public health, aids and appliances, research and health administration. (b) MBS excludes allied health services, optometry and dental services. (c) PBS includes expenditure on benefit paid pharmaceuticals only and excludes highly specialised drugs dispensed from public and private hospitals.
Source: AIHW Indigenous health expenditure database
2056
1131
2444
1609
4366
3158
2706
1293
772
505
232
627
1049
368
590
535
380
1
608
7
1405
52745
3
649
845
571
834
479
566
626
837
131
325
137
420
305
265
170
349
0
1,000
2,000
3,000
4,000
5,000
6,000
7,000
8,000
Indigenous Non-Indigenous Indigenous Non-Indigenous Indigenous Non-Indigenous Indigenous Non-Indigenous
Expe
nditu
re p
er p
erso
n ($
)
Public hospital services (Admitted) Private hospitals (Admitted) Dept of Health grants to ACCHOs MBS (b) PBS (c)
3,987
2,807
3,991
3,497
7,604
4,409
4,836
3,017
Major Cities Inner/outer regional Remote/very remote All regions

Sustainable
195
3.22 Recruitment and retention of staff Why is it important? The capacity to recruit and retain appropriate staff is critical to the appropriateness, continuity and sustainability of health services including Aboriginal and Torres Strait Islander primary health care services. Staff recruitment and retention is particularly important in rural and remote areas as 65% of Indigenous Australians live outside the major cities.
Findings In 2015, there were 97,466 medical practitioners registered in Australia (excluding provisional registrants), with 86% employed as clinicians. Many of those not working in medicine were overseas, retired or on extended leave. The supply of practitioners working as clinicians increased between 2005 and 2015 (from 298 to 375 FTE per 100,000 population). Supply was not uniform across the country; it was greater in major cities (421 FTE per 100,000) than in remote/very remote areas (251 FTE per 100,000). While GP rates per 100,000 were similar across geographic areas, the supply of specialists was much lower in remote/very remote areas (AIHW, 2016g). Rural outreach is provided by specialists who periodically visit the same community over time. In a 2014 study, 19% of specialist doctors provided outreach. Three-quarters of these were metropolitan-based (O’Sullivan et al, 2014).
A national survey of the rural workforce in November 2015 found that of the 7,841 GPs working in rural Australia, an estimated 48% had been in their current practice for less than 3 years (56% in remote and very remote areas). A 2015 study on GP mobility found that GPs working in small communities and those in rural locations for less than 3 years are most at risk of leaving rural practice (McGrail & Humphreys, 2015). Younger rural GPs were also more likely to leave rural practice than older rural GPs.
A 2007 study identified doctors who were satisfied with their current medical practice intended to remain in rural practice for 40% longer than those who were not satisfied (11.5 years compared with 8.2 years). GPs content with their life as a rural doctor intended to remain in rural practice 51% longer than those who were not content (11.8 compared with 7.8 years) (Alexander & Fraser, 2007).
For other health professions, National Health Workforce Data indicate that 85% of trained nurses were currently working in the nursing sector in 2015 (AIHW, 2016d). In 2014, 89% of dental practitioners were employed in dentistry. For other health professionals, the proportions working in their field were as
follows: physiotherapists (83%), pharmacists (85%), psychologists (86%), Aboriginal and Torres Strait Islander health practitioners (83%), optometrists (89%), chiropractors (88%), osteopaths (89%), and podiatrists (92%).
In 2014, the number of employed psychologists was lowest in areas with high proportions of Indigenous Australians in the population (44 per 100,000 in areas with 20% or more Indigenous Australians in the population compared with 115 per 100,000 in areas with less than 1%). The pattern was similar for pharmacists.
As at 31 May 2015, there were around 4,700 FTE health (clinical) staff and 2,900 FTE administrative and support staff positions within Commonwealth-funded Indigenous primary health care (PHC) organisations. In the period 1999–2000 to 2014–15, there was an increase of 331% in the number of FTE staff in these organisations. Despite this growth, the vacancy rate has improved with an estimated 5% of health positions and 1% of administrative and support staff positions vacant at 31 May 2015, compared with 7% and 3% at June 2000.
Vacancies in Commonwealth-funded Indigenous PHC organisations were highest for Aboriginal Health Workers (64 vacant FTEs) followed by nurses (34 FTE), social and emotional wellbeing workers (25 FTE) and Aboriginal Health Practitioners (23 FTE) in 2015. The proportion of health staff positions that were vacant ranged from 8% in very remote areas to 3% in major cities. For administrative/support positions, vacancies were also highest in very remote areas (3%) while less than 2% elsewhere (AIHW, 2016o).
In 2014–15, 66% of Commonwealth funded Indigenous organisations reported the recruitment, training and support of Aboriginal and Torres Strait Islander staff as one of the top five challenges in providing quality care to clients. In remote areas, this was as high as 85%. Among all staff, retention and turnover was reported as a challenge by 54% of organisations—highest in remote (58%) and very remote areas (67%) where staff housing was also a challenge (54% and 51% respectively compared with 28% overall) (AIHW, 2016o).
A senate inquiry into factors affecting the supply of health services and medical professionals in rural areas (SCACS, 2012) has identified a complex interplay between environmental, personal and work-related factors. These include access to professional development and career progression; remuneration; heavy workloads; on-call hours; loss of anonymity; social barriers and professional isolation; opportunities for spouses and children; and access to appropriate, affordable and secure accommodation. A growing trend towards medical specialisation was identified as
reducing generalist training pathways—the area of medical practice most required in rural and regional areas. Conversely rural lifestyle, diverse caseloads, autonomy and community connectedness have been cited as positive influences (Campbell, N et al, 2012).
A study of drug and alcohol workers found that Indigenous workers experienced above average levels of job satisfaction and relatively low levels of exhaustion; however, they also experienced lower levels of mental health and wellbeing and greater work/family imbalance. The report highlighted the importance of workforce development strategies that focus on culturally appropriate, equitable and supportable organisational conditions including addressing stress, salaries, benefits and opportunities for career and personal growth (Roche et al, 2013).
Implications Better national data are needed on this important issue. The statistics analysed focus on a few aspects of a complex set of issues. Recruitment and retention issues are significant for health services located in rural and remote Australia. Little is known about the turnover of staff in Indigenous primary health care services and how this compares with mainstream services. Another issue is achieving incomes for doctors in rural and remote locations that are competitive with incomes earned by GPs in metropolitan private practice.
The National Aboriginal and Torres Strait Islander Health Workforce Strategic Framework (2016–2023) provides a guide to assist planning, prioritising, target setting, monitoring and reporting of progress in Aboriginal and Torres Strait Islander health workforce capacity building. A key aim of the Framework is to improve recruitment and retention of Aboriginal and Torres Strait Islander health professionals in clinical and non-clinical roles across all health disciplines, including through ensuring workplace environments are culturally safe for Aboriginal and Torres Strait Islander health workers (see measure 3.12).
In 2015, the Australian Government released the Implementation Plan for the National Aboriginal and Torres Strait Islander Health Plan, which includes activities intended to deliver against the following strategy: Mainstream health services are supported to provide clinically competent, culturally safe, accessible, accountable and responsive services to Aboriginal and Torres Strait Islander peoples in a health system that is free of racism and inequality.
Aboriginal and Torres Strait Islander health professional organisations are funded to support and increase the capacity of the Indigenous workforce and contribute to promoting a culturally-appropriate health
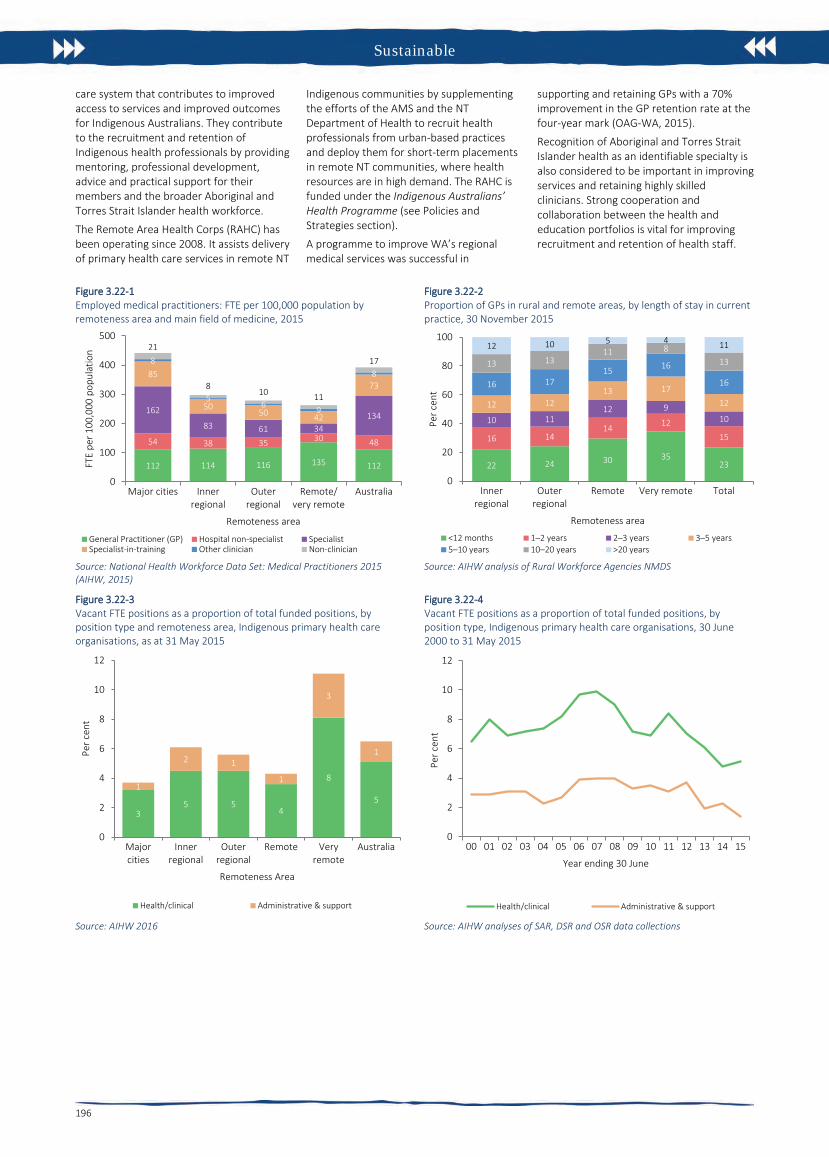
Sustainable
196
care system that contributes to improved access to services and improved outcomes for Indigenous Australians. They contribute to the recruitment and retention of Indigenous health professionals by providing mentoring, professional development, advice and practical support for their members and the broader Aboriginal and Torres Strait Islander health workforce.
The Remote Area Health Corps (RAHC) has been operating since 2008. It assists delivery of primary health care services in remote NT
Indigenous communities by supplementing the efforts of the AMS and the NT Department of Health to recruit health professionals from urban-based practices and deploy them for short-term placements in remote NT communities, where health resources are in high demand. The RAHC is funded under the Indigenous Australians’ Health Programme (see Policies and Strategies section).
A programme to improve WA’s regional medical services was successful in
supporting and retaining GPs with a 70% improvement in the GP retention rate at the four-year mark (OAG-WA, 2015).
Recognition of Aboriginal and Torres Strait Islander health as an identifiable specialty is also considered to be important in improving services and retaining highly skilled clinicians. Strong cooperation and collaboration between the health and education portfolios is vital for improving recruitment and retention of health staff.
Figure 3.22-1 Employed medical practitioners: FTE per 100,000 population by remoteness area and main field of medicine, 2015
Source: National Health Workforce Data Set: Medical Practitioners 2015 (AIHW, 2015)
Figure 3.22-2 Proportion of GPs in rural and remote areas, by length of stay in current practice, 30 November 2015
Source: AIHW analysis of Rural Workforce Agencies NMDS
Figure 3.22-3 Vacant FTE positions as a proportion of total funded positions, by position type and remoteness area, Indigenous primary health care organisations, as at 31 May 2015
Source: AIHW 2016
Figure 3.22-4 Vacant FTE positions as a proportion of total funded positions, by position type, Indigenous primary health care organisations, 30 June 2000 to 31 May 2015
Source: AIHW analyses of SAR, DSR and OSR data collections
112 114 116 135 112
54 38 35 30 48
162
83 61 34134
85
5050 42
73
8
56 9
8
21
810 11
17
0
100
200
300
400
500
Major cities Innerregional
Outerregional
Remote/very remote
Australia
FTE
per 1
00,0
00 p
opul
atio
n
Remoteness area
General Practitioner (GP) Hospital non-specialist SpecialistSpecialist-in-training Other clinician Non-clinician
22 24 30 3523
16 1414 12
15
10 1112 9
10
12 1213 17
12
16 1715 16
16
13 1311 8
13
12 10 5 4 11
0
20
40
60
80
100
Innerregional
Outerregional
Remote Very remote Total
Per c
ent
Remoteness area
<12 months 1–2 years 2–3 years 3–5 years5–10 years 10–20 years >20 years
35 5
4
8
51
2 1
1
3
1
0
2
4
6
8
10
12
Majorcities
Innerregional
Outerregional
Remote Veryremote
Australia
Per c
ent
Remoteness Area
Health/clinical Administrative & support
0
2
4
6
8
10
12
00 01 02 03 04 05 06 07 08 09 10 11 12 13 14 15
Per c
ent
Year ending 30 June
Health/clinical Administrative & support

Sustainable

198
Technical Appendix
The technical appendix includes:
- Statistical terms and methods
- Main data sources
- Data development
- Notes to tables and figures
- Abbreviations
- Glossary
- References

Technical appendix
199
Statistical terms and methods Aboriginal and Torres Strait Islander peoples and non-Indigenous population descriptors ‘Aboriginal and Torres Strait Islander peoples’ is the preferred descriptor used throughout the report. ‘People’ is an acceptable alternative to ‘peoples’ depending on context, but in general, the collective term ‘peoples’ is used. The ‘Indigenous Australians’ descriptor is inclusive of all Aboriginal and Torres Strait Islander groups, and is also used where space is limited.
The ‘non-Indigenous’ descriptor is used where the data collection allows for the separate identification of people who are neither Aboriginal nor Torres Strait Islander. The label ‘other Australians’ is used to refer to the combined data for non-Indigenous people, and those for whom Indigenous status was not stated.
Crude rates A crude rate is defined as the number of events over a specified period (for example, a year) divided by the total population at risk of the event.
Age-specific rates An age-specific rate is defined as the number of events for a specified age group over a specified period (for example, a year) divided by the total population at risk of the event in that age group. Age-specific rates in this report were calculated by dividing, for example, the number of deaths in each specified age group by the corresponding population in the same age group.
Age-standardisation Age-standardisation controls for the effect of age, to allow comparisons of summary rates between two populations that have different age structures. Age-standardisation is used throughout this report when comparing Aboriginal and Torres Strait Islander peoples with non-Indigenous Australians for a range of variables where age is a factor e.g. health-related measures. The main disadvantages with age-standardisation are that the resulting rates are not the real or ‘reported’ rates for the population. Age-standardised rates are therefore only meaningful as a means of comparison.
Age-standardised rates are generally derived using all age groups. However, in some cases in the Health Performance Framework report, the age-standardised rates were calculated for a particular age range in order to support study of a specific population group (for instance, the age-standardised data for some mortality indicators were derived for the age range 0–74).
Unless otherwise specified, the direct method of age-standardisation was used – see Glossary.
Rate ratio Rate ratios are calculated by dividing the rate for Indigenous Australians with a particular characteristic by the rate for non-Indigenous Australians with the same characteristic.
A rate ratio of 1 indicates that the prevalence/incidence of the characteristic is the same in the Indigenous and non-Indigenous populations. Rate ratios of greater than 1 suggest higher prevalence/incidence in the Indigenous population and rate ratios of less than 1 suggest higher prevalence/incidence in the non-Indigenous population.
Rate difference Rate difference is calculated by subtracting the rate for Indigenous Australians from the rate for non-Indigenous Australians for the characteristic of interest.
Rounding Decimal points on percentages and rates are rounded to whole numbers by rounding down where the decimal is less than 0.5 and up where the decimal is above 0.5. Where the decimal point is
exactly 0.5, the underlying estimates are used (where available) to calculate additional decimal points to determine whether to round up or down e.g. 0.49 is rounded down.
Relative standard error Relative standard error (RSE) is a measure of sampling error which is obtained by expressing the standard error as a percentage of the estimate.
𝑅𝑅𝑅𝑅𝑅𝑅(𝑒𝑒𝑒𝑒𝑒𝑒𝑒𝑒𝑒𝑒𝑒𝑒𝑒𝑒𝑒𝑒) = 100 �𝑅𝑅𝑅𝑅(𝑒𝑒𝑒𝑒𝑒𝑒𝑒𝑒𝑒𝑒𝑒𝑒𝑒𝑒𝑒𝑒)
(𝑒𝑒𝑒𝑒𝑒𝑒𝑒𝑒𝑒𝑒𝑒𝑒𝑒𝑒𝑒𝑒)�
The ABS considers that only estimates with relative standard errors of less than 25%, and percentages based on such estimates, are sufficiently reliable for most analytical purposes. Relative standard errors between 25% and 50% should be used with caution. Estimates with relative standard errors greater than 50% are considered too unreliable for general use.
Confidence intervals The observed value of a rate may vary due to chance even where there is no variation in the underlying value of the rate. A 95% confidence interval (CI) for an estimate is a range of values which is very likely (95 times out of 100) to contain the true unknown value. CIs have not been presented for all administrative datasets as investigative work is underway into the validity of using CIs for these datasets.
Where the 95% CIs of two estimates do not overlap it can be concluded that there is a statistically significant difference between the two estimates.
As with all statistical comparisons, care should be exercised in interpreting the results of the comparison. If two rates are statistically significantly different from each other, the difference is unlikely to have arisen by chance. Judgement should, however, be exercised in deciding whether or not the difference is of any practical significance.
The standard method of calculating CIs has been used in this report. Typically, in the standard method, the observed rate is assumed to have natural variability in the numerator count (for example, deaths) but not in the population denominator count. Also, the rate is assumed to have been generated from a normal distribution (‘Bell curve’). Random variation in the numerator count is assumed to be centred around the true value; that is, there is no systematic bias.
The formulas used to calculate 95% confidence intervals using the standard method are:
Crude rate:
𝐶𝐶𝐶𝐶(𝐶𝐶𝑅𝑅)95% = 𝐶𝐶𝑅𝑅 ± 1.96 ×𝐶𝐶𝑅𝑅
�∑ 𝑑𝑑1𝑖𝑖=1
Where d = the number of deaths or other events
Age-standardised rate:
𝐶𝐶𝐶𝐶(𝐴𝐴𝑅𝑅𝑅𝑅)95% = 𝐴𝐴𝑅𝑅𝑅𝑅 ± 1.96 × ��𝑤𝑤𝑖𝑖2𝑑𝑑𝑖𝑖𝑛𝑛𝑖𝑖2
𝐼𝐼
𝑖𝑖=1
Where wi = the proportion of the standard population in age group i
di = the number of deaths or other events in age group i
ni = the number of people in the population in age group i
Significance testing Annual change and percent change were only calculated for series of 4 or more data points. The 95% confidence intervals (CIs) for the standard error of the slope estimate (annual change) based on linear regression are used to determine whether the apparent increases or decreases in the data are statistically significant at the p
Technical appendix
200
< 0.05 level. The formula used to calculate the CIs for the standard error of the slope estimate is:
95% 𝐶𝐶𝐶𝐶(𝑥𝑥) = 𝑥𝑥 ± 𝑒𝑒 ∗(𝑛𝑛−2)× 𝑅𝑅𝑅𝑅(𝑥𝑥)where x is the annual change (slope estimate)
t* (n-2) is the 97.5th quantile of the tn-2 distribution.
If the upper and lower 95% confidence intervals do not include zero, then it can be concluded that there is statistical evidence of an increasing or decreasing trend in the data over the study period.
Significant changes are denoted with a * against the annual change statistics included in relevant tables.
Only sentences including data with significant differences have been used in the report. However, not all relationships in the AIHW online tables have been tested for significance (or shown with the * symbol).
Testing rate differences and rate ratios If the 95% CIs of the difference in rates do not include zero, then it can be concluded that there is statistical evidence of a difference in rates. If the 95% CIs of the rate ratio do not include 1, then it can be concluded that there is statistical evidence of a difference in the rates contributing to the rate ratio.
Tables include a * next to the rate ratio and rate difference to indicate that rates for the Indigenous and non-Indigenous populations are statistically different from each other at the p < 0.05 level (based on 95% CIs). Where results of significance testing differed between rate ratios and rate differences, caution should be exercised in the interpretation of the tests.
The word ‘significant’ Statistically significant differences, for example between jurisdictions or over time, are denoted as ‘significant’. The word ‘significant’ is not used outside its statistical context.
Significance of trends rate ratios In the HPF, time series analyses use linear regression analysis to determine whether there have been significant increases or decreases in the observed rates. Linear regression was only used where the rate ratio trend was linear.
Annual change and per cent change The annual change in rates and rate differences are calculated using linear regression, which uses the ‘least squares’ method to calculate a straight line that best fits the data. The simple linear regression line (Y = a + bX, or ‘slope’ estimate) was used to determine the annual change in the data over the period.
Per cent change is calculated taking the difference between the first and last points on the regression line, dividing by the first point on the line and multiplying by 100.

Technical appendix
201
Main data sources The data in this report are mainly drawn from national data collections and surveys. These include the following:
Australian Aboriginal and Torres Strait Islander Health Survey The 2012–13 Australian Aboriginal and Torres Strait Islander Health Survey AATSIHS included a sample of 13,000 Aboriginal and Torres Strait Islander people for the core sample and sub-samples for various components of the survey such as voluntary biomedical data for adults. The AATSIHS sample was specifically designed to select a representative sample of Aboriginal and Torres Strait Islander peoples and therefore overcome the problem inherent in most national surveys (i.e. small and unrepresentative Indigenous samples). Survey results are subject to sampling errors as only a small proportion of the population is used to produce estimates that represent the whole population—see RSEs above. Non-sampling errors may occur where there is non-response to the survey or questions in the survey, misunderstanding of questions or errors in recording, coding or processing the survey. Information recorded in this survey is ‘as reported’ by respondents. Responses may be affected by imperfect recall or individual interpretation of survey questions. Any data that are self-reported are also likely to underestimate circumstances about which the respondent is unaware, or may be reluctant to report (e.g. certain health conditions, weight, drug use). Selected non-Indigenous comparisons are available from the 2011–12 Australian Health Survey (AHS). The AHS was conducted in major cities, regional and remote areas, but very remote areas were excluded from the sample. Further information on AATSIHS data quality issues can be found in the User Guide for the survey ABS cat. no. 4727.0 (ABS, 2013c). Time series comparisons for some indicators are available from the 2004–05 NATSIHS, 2008 NATISS, 2002 NATSISS, 2001 NHS and the 1994 National Aboriginal and Torres Strait Islander Survey (NATSIS).
The National Aboriginal and Torres Strait Islander Social Survey The 2014–15 National Aboriginal and Torres Strait Islander Social Survey (NATSISS) was conducted from September 2014 to June 2015. Information was collected by personal interview from approximately 11,000 Aboriginal and Torres Strait Islander people living in private dwellings in both non-remote and remote parts of Australia. The NATSISS sample was specifically designed to select a representative sample of Aboriginal and Torres Strait Islander peoples. The NATSISS uses the standard Indigenous status question to identify Aboriginal and Torres Strait Islander households from which the sampling process is then undertaken. Information recorded in this survey is ‘as reported’ by respondents, or from child proxies (usually parents), on behalf of selected children aged 0–14 years. Data may differ from those that might be obtained from other sources or by using other collection methodologies. Responses may also be affected by imperfect recall or individual interpretation of survey questions. Selected non-Indigenous comparisons are available from the 2014 General Social Survey and the 2014–15 National Health Survey. Further details can be obtained from ABS cat. no. 4714.0 (ABS, 2016). Time series comparisons for some indicators are available from the 2002 and 2008 NATSISS and the 1994 National Aboriginal and Torres Strait Islander Survey (NATSIS).
Census The Census uses the standard Indigenous status question and it is asked for each household member.
There are 4 principal sources of error in Census data: respondent error, processing error, partial response and undercount. Quality management of the Census programme aims to reduce error as
much as possible, and to provide a measure of the remaining error to data users, to allow them to use the data in an informed way.
The Census form may be completed by one household member on behalf of others. Incorrect answers can be introduced to the Census form if the respondent does not understand the question or does not know the correct information about other household members. Many of these errors remain in the final data.
The processing of information from Census forms is now mostly automated. Quality assurance procedures are used during Census processing to ensure processing errors are minimised. Sample checking is undertaken during coding operations, and corrections are made where necessary.
When completing their Census form, some people do not answer all the questions that apply to them. In these instances, a ‘not stated’ code is allocated during processing, with the exception of non-response to age, sex, marital status and place of usual residence. These variables are needed for population estimates, so they are imputed using other information on the Census form, as well as information from the previous Census.
Other Census data issues relate to the accuracy of the Census count itself, e.g. whether people are counted more than once, or not at all.
The significant volatility in Aboriginal and Torres Strait Islander Census counts and the variable quality of data on births, deaths and migration of Aboriginal and Torres Strait Islander peoples do not support the use of the standard approach to population estimation. Due to the inherent uncertainties in estimating the Aboriginal and Torres Strait Islander population, data which use these estimates should be interpreted with caution (e.g. life expectancy estimates, mortality rates). Given these uncertainties, changes in health outcomes such as mortality rates are difficult to assess.
Following each Census, assumptions are made about past levels of mortality to produce back cast population estimates.
In the 2011 Census, the ABS implemented improvements to the 2011 Census Indigenous enumeration procedures and enhanced the Census Post Enumeration Survey. There was a 30% increase in the estimate of the Indigenous population between the 2006 and 2011 Censuses. The trends involving population rates have needed to be revised for this edition of the HPF based on these updated population estimates (ABS, 2014).
National Perinatal Data Collection Birth notification forms are completed for all births of 20 weeks or more gestation, or a birthweight of 400 grams or more. The Perinatal National Minimum Data Set includes all births in Australia in hospitals, birth centres and the community. Jurisdictional level data in the HPF are based on place of mother’s usual residence rather than place where birth occurred. A standard data item for Indigenous status is specified in the Perinatal National Minimum Data Set for the mother and now also for the baby. Data on Indigenous status are not reported for Tasmania prior to 2005, as the ‘not stated’ category for Indigenous status was included with the non-Indigenous category. Numbers are small in jurisdictions such as ACT and Tasmania and therefore need to be interpreted with caution.
Studies in Australia linking perinatal data with birth registration data and hospital admissions show that Aboriginal and Torres Strait Islander data are under-reported (Taylor, 2000; Comino, 2007; Kennedy, 2009). In 2007, the AIHW completed an assessment of the quality of Indigenous status information in perinatal data in each state and territory. This involved a survey that was sent to the midwifery managers across Australia to determine how many hospitals in each jurisdiction obtain Indigenous status information of mothers giving birth from admission records and how many collect this information independently. The assessment also involved analysis of the variability in the number and proportion of mothers recorded as Aboriginal and/or Torres Strait Islander in the perinatal

Technical appendix
202
data collection over time and across jurisdictions for the period 1991–2004. The outcomes of this assessment showed that Indigenous status data from NSW, Vic, Qld, WA, SA and the NT are suitable for trends analysis and national reporting. Perinatal data from Tasmania, although improving, were deemed to be of insufficient quality. Although the most recent data in the ACT were of publishable quality, the data were not yet of sufficient stability to support trends analysis (Leeds, 2007).
All jurisdictions are working towards improving the quality of Indigenous status in perinatal data collections. States and territories have agreed to improve Aboriginal and Torres Strait Islander data collection procedures in key data collections including implementation of the Best Practice Guidelines for the collection of Indigenous status in health data sets.
AIHW has worked with the states and territories in the development of an enhanced Perinatal National Minimum Data Set (NMDS) to include nationally consistent data items on antenatal care, smoking and alcohol use during pregnancy, and Indigenous status of the baby. Nationally consistent data items on smoking during pregnancy, gestational age at first antenatal visit, and Indigenous status of the baby have been added to the Perinatal NMDS (from 1 July 2009, 1 July 2010, and 1 July 2012 respectively). A data item on number of antenatal visits was included in the Perinatal NMDS from 1 July 2013, although Victoria was not able to commence collection until 1 January 2015.
Analysis of perinatal data between jurisdictions and over time requires some caution due to definitional changes, changing models of care (e.g. antenatal care being increasingly provided outside of hospitals) and changes to reporting systems.
National Hospital Morbidity Data This data collection includes all completed admitted patient episodes in public and private hospitals across Australia. For 2014–15, almost all public hospitals provided data for the NHMD. The exception was a mothercraft hospital in the ACT. The great majority of private hospitals also provided data, the exceptions being the private free-standing day hospital facilities in the ACT, the single private free-standing day hospital in the NT, and a private free-standing day hospital in Victoria.
The number and pattern of hospitalisations can be affected by differing admission practices among the jurisdictions and from year to year, and differing levels and patterns of service delivery. Some jurisdictions have slightly different approaches to the collection and storage of the standard Indigenous status question and categories in their hospital collections. The incompleteness of Indigenous identification means the number of hospital separations recorded as Aboriginal and Torres Strait Islander is an underestimate of hospitalisations involving Aboriginal and Torres Strait Islander people.
Between 2006 and 2008, the AIHW completed an assessment of the level of Indigenous under-identification in selected public hospitals in all states and territories. Results from this assessment indicated that NSW, Vic, Qld, WA, SA and the NT have adequate Indigenous identification (20% or less overall under-identification of Aboriginal and Torres Strait Islander patients) in their hospital separations data. Historically, Indigenous hospitalisation data from 1998 was reported only for the four jurisdictions with the best quality identification (NT, WA, SA and Qld). In 2011–12, the AIHW completed another study to re-assess the level of under-identification in public hospitals data. The study found that all jurisdictions now have sufficient quality Indigenous identification for reporting and a correction factor of 1.09 is used at the national level to adjust for under-identification in hospital data.
Interpretation of results should take into account the relative quality of the data from the jurisdictions. Time series analyses may be affected by changes in the quality of Indigenous identification over
time. An AIHW study estimated that 89% of Indigenous patients were correctly identified in Australian public hospital admission records in 2007-08 (AIHW, 2010). A more recent study of public hospital data from 2011–12 found no statistically significant change in identification rates at the national level, although there were some changes at the jurisdictional level (AIHW, 2013). Time series presentations in this report include data from both public and private hospitals across several jurisdictions, so the overall effect of changes in Indigenous identification over time is unclear. This should be taken into account when interpreting time series data.
Between 2009–10 and 2010–11, there were significant changes in the coding of diagnoses for diabetes and obstetrics and for imaging procedures. There were also significant changes made to coding practices for diabetes and related conditions for the 2012–13 year, resulting in increased counts for these conditions. There have also been changes in the hepatitis coding. Caution should be used in comparing 2011–12 and 2012–13 data with data from previous HPF reports. For more information about these issues, please refer to Database quality statement summaries in the ‘Australian Hospital Statistic 2012–13’ report, available at www.aihw.gov.au.
For more information on the quality of emergency department care data, please refer to the data quality statement in the ‘Australian hospital statistics 2012–13: emergency department care’ report, available at www.aihw.gov.au.
Hospitalisations for which the Indigenous status of the patient was not reported are excluded from hospitalisations data for non-Indigenous Australians.
National Mortality Database The count of deaths for Aboriginal and Torres Strait Islander peoples can be influenced by the accuracy of identification of Aboriginal and Torres Strait Islander deaths, late registration of deaths, as a result of coronial inquiry, and changes to death forms and/or processing systems. Due to the small size of the Aboriginal and Torres Strait Islander population, these factors can significantly impact on trends over time and between jurisdictions.
All jurisdictions broadly comply with the standard wording for the Indigenous status question for their death registration forms. However, the response categories tend to differ between a number of jurisdictions, most notably WA provides an additional 'Unknown' response category and the NT does not provide clear instructions on how to select both Aboriginal and Torres Strait Islander origin (e.g. by ticking both boxes) (ABS & AIHW, 2005).
Almost all deaths in Australia are registered. However, the Indigenous status of the deceased is not always recorded/reported and/or recorded correctly. The incompleteness of Indigenous identification means the number of deaths registered as Aboriginal and Torres Strait Islander is an underestimate of deaths occurring in the Aboriginal and Torres Strait Islander population (ABS, 2013b). As a result, the observed differences between Aboriginal and Torres Strait Islander and non-Indigenous mortality are underestimates of the true differences. While the identification of Aboriginal and Torres Strait Islander peoples in deaths data is incomplete in all state and territory registration systems, 5 jurisdictions (NSW, Qld, WA, SA and the NT) have been assessed by the ABS and the AIHW as having adequate identification. Longer term mortality trend data are presented for these jurisdictions from 1998 onwards. The ABS calculated the identification rate of Aboriginal and Torres Strait Islander deaths for the period 2011–12 through data linkage between the Census and death registration records to examine differences in reporting of Indigenous status across the two datasets (ABS, 2013b).
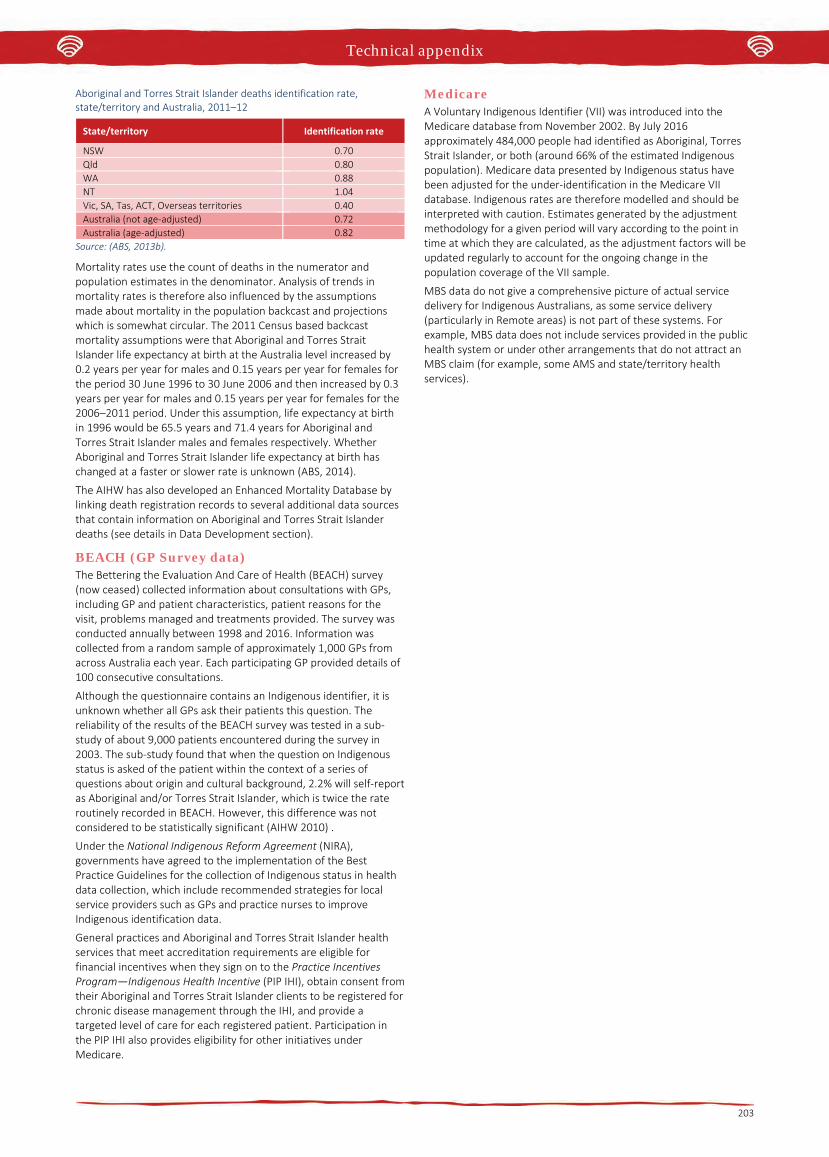
Technical appendix
203
Aboriginal and Torres Strait Islander deaths identification rate, state/territory and Australia, 2011–12
State/territory Identification rate
NSW 0.70 Qld 0.80 WA 0.88 NT 1.04 Vic, SA, Tas, ACT, Overseas territories 0.40 Australia (not age-adjusted) 0.72 Australia (age-adjusted) 0.82
Source: (ABS, 2013b).
Mortality rates use the count of deaths in the numerator and population estimates in the denominator. Analysis of trends in mortality rates is therefore also influenced by the assumptions made about mortality in the population backcast and projections which is somewhat circular. The 2011 Census based backcast mortality assumptions were that Aboriginal and Torres Strait Islander life expectancy at birth at the Australia level increased by 0.2 years per year for males and 0.15 years per year for females for the period 30 June 1996 to 30 June 2006 and then increased by 0.3 years per year for males and 0.15 years per year for females for the 2006–2011 period. Under this assumption, life expectancy at birth in 1996 would be 65.5 years and 71.4 years for Aboriginal and Torres Strait Islander males and females respectively. Whether Aboriginal and Torres Strait Islander life expectancy at birth has changed at a faster or slower rate is unknown (ABS, 2014).
The AIHW has also developed an Enhanced Mortality Database by linking death registration records to several additional data sources that contain information on Aboriginal and Torres Strait Islander deaths (see details in Data Development section).
BEACH (GP Survey data) The Bettering the Evaluation And Care of Health (BEACH) survey (now ceased) collected information about consultations with GPs, including GP and patient characteristics, patient reasons for the visit, problems managed and treatments provided. The survey was conducted annually between 1998 and 2016. Information was collected from a random sample of approximately 1,000 GPs from across Australia each year. Each participating GP provided details of 100 consecutive consultations.
Although the questionnaire contains an Indigenous identifier, it is unknown whether all GPs ask their patients this question. The reliability of the results of the BEACH survey was tested in a sub-study of about 9,000 patients encountered during the survey in 2003. The sub-study found that when the question on Indigenous status is asked of the patient within the context of a series of questions about origin and cultural background, 2.2% will self-report as Aboriginal and/or Torres Strait Islander, which is twice the rate routinely recorded in BEACH. However, this difference was not considered to be statistically significant (AIHW 2010) .
Under the National Indigenous Reform Agreement (NIRA), governments have agreed to the implementation of the Best Practice Guidelines for the collection of Indigenous status in health data collection, which include recommended strategies for local service providers such as GPs and practice nurses to improve Indigenous identification data.
General practices and Aboriginal and Torres Strait Islander health services that meet accreditation requirements are eligible for financial incentives when they sign on to the Practice Incentives Program—Indigenous Health Incentive (PIP IHI), obtain consent from their Aboriginal and Torres Strait Islander clients to be registered for chronic disease management through the IHI, and provide a targeted level of care for each registered patient. Participation in the PIP IHI also provides eligibility for other initiatives under Medicare.
Medicare A Voluntary Indigenous Identifier (VII) was introduced into the Medicare database from November 2002. By July 2016 approximately 484,000 people had identified as Aboriginal, Torres Strait Islander, or both (around 66% of the estimated Indigenous population). Medicare data presented by Indigenous status have been adjusted for the under-identification in the Medicare VII database. Indigenous rates are therefore modelled and should be interpreted with caution. Estimates generated by the adjustment methodology for a given period will vary according to the point in time at which they are calculated, as the adjustment factors will be updated regularly to account for the ongoing change in the population coverage of the VII sample.
MBS data do not give a comprehensive picture of actual service delivery for Indigenous Australians, as some service delivery (particularly in Remote areas) is not part of these systems. For example, MBS data does not include services provided in the public health system or under other arrangements that do not attract an MBS claim (for example, some AMS and state/territory health services).
Technical appendix
204
Data development There are well documented problems with the quality and availability of data about Aboriginal and Torres Strait Islander health issues. These limitations include the quality of data on all key health measures including mortality and morbidity, uncertainty about the size and composition of the Aboriginal and Torres Strait Islander population and a paucity of available data on other health-related issues such as access to health services.
The following information has been provided by the jurisdictions to provide information on action being undertaken in relation to data development.
Australian Government The Australian Government is committed to improving the availability of good quality Aboriginal and Torres Strait Islander health data. Through the National Advisory Group on Aboriginal and Torres Strait Islander Health Information Development (NAGATSIHID), the Australian Government is actively engaged with key stakeholders, state and territory Governments, the ABS and the AIHW to improve the availability of quality Aboriginal and Torres Strait Islander health data. Further, the Health Performance Framework has established priorities for data development linked to policy objectives.
In July 2009, COAG committed to a range of activities to improve the quality of Aboriginal and Torres Strait Islander data, including an Australian Government commitment of $46.4 million over four years to June 2013 under the NIRA (COAG, 2008). This work covers the key datasets required for NIRA Indigenous reporting, e.g. mortality, morbidity, perinatal data and population estimates. Jurisdictions have committed to undertaking the work outlined under Schedule F to the NIRA, in liaison with the AIHW and the ABS.
Data development projects already completed The 2016 Census of Population and Housing has continued the 2011 targeted strategy of improved identification and enumeration of the Aboriginal and Torres Strait Islander population. This included strong engagement prior to the Census event through the ABS’ established Indigenous Engagement Managers/Officers network and use of local Aboriginal and Torres Strait Islander regional champions to encourage high levels of participation. Field staff recruitment processes also targeted local people with local knowledge and strong ties to their communities.
Although the Census ‘digital first’ strategy was rolled out across Australia, Aboriginal and Torres Strait Islander people living in remote towns with large Indigenous populations and those living in discrete Indigenous communities were generally counted through a personal interview process. Various support arrangements were also provided to populations living in other places to ensure everyone had the opportunity to be counted.
The Post Enumeration Survey (PES) provides a national process to assess the efficacy and coverage of the Census count. In 2016, the PES sample was increased by 20% in general population areas. This is expected to deliver an improvement to net under or over count statistics for both the general population and the Aboriginal and Torres Strait Islander population. The PES sample also included dwellings from remote communities in NSW, Qld, SA, WA and NT, similar to the numbers collected in the 2011 PES.
The PES will consolidate the 2011 methodological innovation including: continuing use of Automated Data Linkage; and effective collection of Indigenous status of all persons living in the responding dwelling.
The ABS currently has a 6-yearly cycle for the Indigenous Social Surveys and Health Surveys. The timing of these surveys is scheduled in order to provide 3-yearly estimates for key statistics collected in both surveys. The ABS has released findings from the 2014–15 NATSISS. Analytical commentary, an Infographic highlighting
summary results, EXCEL data tables of key results, and a range of explanatory materials are available on the ABS website (www.abs.gov.au) free of charge. Microdata has also been released through a Confidentialised Unit Record File and a Survey TableBuilder product. Information about these products are also available on the ABS website.
The AIHW released the National best practice guidelines for collecting Indigenous status in health data sets in April 2010. The AIHW’s National Indigenous Data Improvement Support Centre (NIDISC) was established to support jurisdictions and service providers to implement the guidelines.
The AIHW has also published reports on the assessment of the quality of Indigenous identification in labour force data collections, community services data collections, the National Cancer Registry, the National Diabetes Register, the national Key Performance Indicator data collection and in hospital separations data.
The AIHW’s 2013 report The inclusion of Indigenous status on pathology request forms outlines work towards the inclusion of Indigenous status on pathology request forms as a way to improve Indigenous identification in national cancer, communicable disease and cervical screening registries.
The ABS and AIHW in partnership with jurisdictions developed national best practice guidelines for linking data relating to Indigenous people. The guidelines for linking Indigenous data covered linkage methods and protocols, privacy protocols, quality standards, and procedures. The National Best Practice Guidelines for Data Linkage Activities Relating to Aboriginal and Torres Strait Islander People (AIHW & ABS, 2012) were released on 9 July 2012. Two attachments to the Guidelines were released on 14 June 2013. The attachments review the current and recent body of data linkage activities relating to Aboriginal and Torres Strait Islander people, along with a thematic listing of these activities. In describing and comparing data linkage practices to date, these documents provide an evidence base for the national data linkage guidelines.
Updated posters and brochures encouraging Aboriginal and Torres Strait Islander identification in response to the Standard Indigenous question are available from the ABS. Requests can be made using the following email ([email protected]). Separate materials have been developed for service providers, as well as for the Aboriginal and Torres Strait Islander population.
ABS remains committed to a program of strong engagement with Aboriginal and Torres Strait Islander communities and representative bodies which directly impacts the quality of data outputs. The ABS Indigenous Community Engagement Strategy (ICES) is the main vehicle for delivering this program. Within ICES, the Indigenous Engagement Managers (IEMs) and Officers (IEOs) play a central role in:
• engaging with urban and remote Aboriginal and Torres StraitIslander communities to improve understanding and participationin ABS household surveys to maintain high quality data outputs
• returning survey information to communities to grow theirstatistical literacy and enhance their recognition and value of ABS activities
• improving the quality and relevance of Aboriginal and Torres StraitIslander statistics to the needs of their communities
• encouraging and supporting access to and usage of ABSinformation sources.
Ongoing data development projects ABS and AIHW work in partnership with jurisdictions to lead analysis of the level of Indigenous identification in key datasets, including a baseline report and ongoing five-yearly studies to monitor identification over time. States and territories have agreed to adopt the standard Indigenous status question and recording categories on data collection and information systems for key data sets. States and territories have agreed to improve Aboriginal and Torres Strait
Technical appendix
205
Islander data collection procedures in key data collections including implementation of the Best Practice Guidelines.
States and territories have agreed to develop and implement a programme to raise the Aboriginal and Torres Strait Islander community’s awareness about the importance of identifying as Indigenous.
The ABS works with the Registries of Births, Deaths and Marriages (RBDMs) through the National Civil Registration and Statistics Improvement Committee (NCR SIC). The aim of this committee is to improve harmonisation of data collection across jurisdictions, improve coordination between agencies and connect more strongly with other stakeholders. Information on vital events from the RBDMs is an important input to Australia’s demographic statistics.
The NCR SIC has engaged with government (Department of Human Services and Digital Transformation Office) around opportunities to enhance capture of birth registrations through inter-agency cooperation and potentially through data sharing. Strengthening cross-sectoral coordination between government agencies (including information sharing) would enhance registration coverage, and population counts for Aboriginal and Torres Strait Islander people as well as reduce the overall administrative burden on new parents.
The ABS will again link 2016 Census records with death registrations to improve the level of Aboriginal and Torres Strait Islander identification in death records. Past linkage projects have underpinned more accurate estimates of Aboriginal and Torres Strait Islander life expectancy.
Funding has been secured for the next National Aboriginal and Torres Strait Islander Health Survey which will collect data through the 2018–19 financial year on the health outcomes of Aboriginal and Torres Strait Islander peoples. First results are scheduled to be released in December 2019.
Under Schedule F of the National Indigenous Reform Agreement (NIRA), jurisdictions undertook to implement the National best practice guidelines for collecting Indigenous status in health data sets (the Guidelines) across the health sector by December 2012.
The AIHW conducted an extensive investigation of the implementation of the Guidelines and published its findings in the Towards Better Indigenous health data report in 2013. The report documented implementation activities across jurisdictions and sectors, collected status information about the sectors and datasets in scope, and identified barriers and facilitators to implementation.
As part of this investigation, the AIHW identified the general practice sector as a high priority for efforts to improve the recording of Indigenous status, because it has a unique role in providing access to health measures specific to Aboriginal and Torres Strait Islander people, as well as in providing input to data collections. The AIHW conducted national stakeholder workshops on the identification of Indigenous status in general practice in 2011 and 2012, and published its consolidated findings in the Taking the next steps: identification of Aboriginal and Torres Strait Islander status in general practice report in 2013.
The AIHW has advanced the recommendations of the Taking the next steps report through its development of the online Indigenous health check (MBS 715) data tool. This innovative tool draws together 715 MBS billing data and Indigenous population data to show numbers of health checks and usage rates (the proportion of Indigenous people who have had a health check). These are presented at national, jurisdiction, Primary Health Network, peer group and Medicare Local levels, and the tool displays make it easy to compare numbers and rates across different areas and over time.
The AIHW provides continuing support for better Indigenous identification through NIDISC. The NIDISC helpdesk provides advice and assistance to health providers on issues relating to the collection and recording of Indigenous status. NIDISC also supports better
Indigenous data collection by providing resources and training materials.
As part of the NIRA, the Council of Australian Governments (COAG) agreed that the Australian Department of Health in partnership with the state and territory health departments and in collaboration with the AIHW, would develop a set of national key performance indicators (KPIs) for Indigenous specific primary health care services. The AIHW receives funding from the Department of Health to collect, manage and report on the nKPIs.
The scope of services providing nKPI data has increased over time. In the trial collection in February 2012, only services participating in the Australian Government’s Healthy for Life programme submitted data (about 80 services). In January 2013, the scope expanded to include all Indigenous primary health services funded by the Australian Government. Data from over 200 organisations are now collected every six months.
The nKPIs are designed to enable monitoring of the contribution of Indigenous primary health care services in achieving Closing the Gap targets. They can also be used to help improve the delivery of primary health care for Aboriginal and Torres Strait Islander people and to improve health outcomes. The nKPIs focus on the processes of care provided by health services and clinical outcomes.
Twenty-four indicators were given in-principle endorsement by AHMAC in early 2011. Implementation and collection of these indicators has been staged over a three-year period, with 11 indicators implemented in 2011–12 and further eight in 2012–13. By December 2015, data were collected against 22 indicators with the remaining 2 indicators are planned for implementation in 2017.
The AIHW in collaboration with the Australian Institute of Family Studies delivered the Closing the Gap Clearinghouse. The Clearinghouse is an online collection of research and evaluation evidence on what works to overcome Indigenous disadvantage, focusing on 7 subject areas: early childhood; schooling; health; economic participation; healthy homes; safe communities; and governance and leadership. It supported policy-makers and service providers involved in overcoming Indigenous disadvantage by providing access to and synthesising the evidence on particular topics. The contract for the Clearinghouse ended in June 2014. All resources and publications currently on the website continue to be publicly available, however no new material is being added.
The AIHW’s Enhanced Mortality Database (EMD) project aimed to improve information on Indigenous status on the registered deaths data set by linking it to several additional data sources that contain information on deaths and Indigenous identification—namely admitted hospital records, perinatal records and residential aged care data. The enhanced data enable more accurate estimates of Aboriginal and Torres Strait Islander mortality and life expectancy, to be made.
A final report on the results of the project, Trends in Indigenous mortality and life expectancy: evidence from the Enhanced Mortality Database, 2001–2013, was published by the AIHW in December 2016. A permanent and ongoing AIHW data collection, the Enhanced Indigenous Mortality Data Collection, is now being established based on the EMD project methodology to extend and continue this work.
The AIHW Linked Perinatal, Births, Deaths Dataset Project aims to create a national, ongoing, linked perinatal, birth and death dataset for the purposes of obtaining more accurate estimates of Indigenous infant and child mortality and analysing the factors affecting infant and child health outcomes in Australia. Infant and child mortality rates are important markers of population health.
At the national level, aggregate data demonstrate that there are significant differences in infant and child mortality rates within Australia by factors such as Indigenous status, socio-demographics and maternal health status, but these factors are not able to be
Technical appendix
206
analysed simultaneously as they are dispersed across a range of different data sources.
An initial dataset is being created by linking unit record level data across jurisdictions from perinatal data collections, birth records, and death records covering all births from 2003 to 2010, and deaths within this birth cohort occurring up to age 5 years. National linkage including all relevant births and all deaths occurring up to mid-2016 was completed in late 2016 and the resulting data are now being analysed. The first report from the project, which uses unlinked perinatal data to examine factors associated with poor birth outcomes, will be published by the AIHW in early 2017.
The National Prisoner Health Data Collection was first conducted in 2009, based on a set of indicators aligned to the National Health Performance Framework, and designed to monitor the health of prisoners. Subsequent data collections were held in 2010, 2012 and 2015. The collection provides information on the health of people entering prison (prison entrants), health conditions managed at prison clinics, medications administered at the clinics, the health of people about to be released from prison (prison dischargees), and operations of the clinics. Major reports relating to each data collection have been released by the AIHW, supplemented by smaller bulletins focused on important topics such as mental health. All of these reports include analysis of the health of Aboriginal and Torres Strait Islander prisoners.
AIHW is working with the states and territories in the development of an enhanced Perinatal National Minimum Data Set:
• Nationally consistent data items on smoking during the first 20weeks of her pregnancy and after the first 20 weeks of herpregnancy until the birth, were included in the Perinatal NMDSfrom 1 July 2010.
• A data item for the Indigenous status of the baby was added to thePerinatal NMDS from 1 July 2012.
• A data item on the estimated duration of pregnancy at the firstvisit for antenatal care was added to the Perinatal NMDS from 1July 2010 and a data item on number of antenatal visits wasincluded in the Perinatal NMDS from 1 July 2013.
• The following data items are new voluntary data items appearingin the Perinatal DSS (birth year)
- Reasons for Caesarean section (2014–15)
- Maternal height and weight (2014–15)
- Diabetes, diabetes mellitus during pregnancy, and type of diabetes (2014–15)
- Hypertensive disorder during pregnancy (2014–15)
- Primary postpartum haemorrhage, Blood transfusion for PPH, and Estimated PPH blood loss (2014–15)
- Indication for induction of labour (2015–16)
- Head circumference (2016–17).
• The AIHW is currently consulting jurisdictions about the inclusionand development of psychosocial data items related to screeningduring antenatal, that may include information about alcohol useduring pregnancy, antenatal anxiety and depression, and illicitsubstance use in pregnancy.
• The Maternity Model of Care Data Set Specification (DSS) wasapproved by NHIPPC and added to the National Health DataDictionary in May 2015. AIHW commenced collecting maternitymodels of care data from 91 registered users from participatingmaternity services in Australia.
The Implementation Plan for the National Aboriginal and Torres Strait Islander Health Plan commits to the development and implementation of a data development plan to establish new measures. The data development is to occur during the lifetime of the Implementation Plan, with the new measures to be monitored in future Implementation Plans.
The AIHW has provided the Australian Government Department of Health with advice regarding potential data development, and what work may be required to establish new measures for monitoring and goal setting for the Implementation Plan.
The Australian Capital Territory ACT Health continues to work to strengthen Aboriginal and Torres Strait Islander health data quality. Activities include:
A policy and data standard mandating that staff ask patients if they wish to identify as Aboriginal and/or Torres Strait Islander, based on the AIHW’s ‘one simple question could help you close the gap’ campaign were updated in 2015.
The ACT Patient Administration System has the Aboriginal and Torres Strait Islander identification question as a mandatory field. All pathology forms and all out patient collection stations within the hospital collect the information. A process to capture complaint statistics from Aboriginal and/or Torres Strait Islander patients of the Canberra Hospital has been developed.
The Patient Master Index (PMI) supports the use of a single unique patient identifier across all ACT Health service areas. This helps to ensure patient records can be linked across services to provide continuity of care. Aboriginal and Torres Strait Islander identification data is collected and stored within the PMI, and historical information is retained for management and reporting purposes.
New South Wales Under the NIRA, NSW has committed to data quality improvement activities that will improve the accuracy and reliability of Closing the Gap reporting.
A summary of key activities includes:
NSW Health has adopted the standard ABS Indigenous status question and recording categories, and has issued this revision to the NSW Health system to mandate that the standard question is incorporated into all data collection forms and information systems for key data sets.
NSW Health has employed a Project Officer Aboriginal Data Quality to the Health Systems Information & Performance Reporting Branch. The position supports the development of policies, protocols and strategies to enhance the quality of health data pertaining to the Aboriginal population of NSW. The position is responsible for routine data profiling of data collections to identify data quality issues. It is also responsible for supporting the State-wide implementation of data quality processes and programmes and will support the development of data collection standards.
Respecting the Difference: An Aboriginal Cultural Training Framework for NSW Health outlines a mandatory cultural training framework for all staff working in health, and includes information on collecting Indigenous status information.
NSW Health has completed a project titled Improved Reporting of Aboriginal and Torres Strait Islander people on population datasets using record linkage. The project:
1. developed methods for improving reporting of Aboriginal andTorres Strait Islander peoples on population datasets using recordlinkage
2. described the improvements in reporting achieved by recordlinkage; and
3. explored the impact of any changes in reporting due to recordlinkage on a selection of indicators of health status and healthservice utilisation.
The method is being used to monitor the level of reporting of Aboriginal people on selected administrative datasets. Information on the quality of reporting of Aboriginal people is available on the Health Stats NSW website for public and private hospital morbidity data (www.healthstats.nsw.gov.au/Indicator/dqi_era_apd/dqi_era_apd), the Emergency Department Data Collection

Technical appendix
207
(www.healthstats.nsw.gov.au/Indicator/dqi_era_eddc/dqi_era_eddc) and the Perinatal Data Collection (www.healthstats.nsw.gov.au/Indicator/dqi_era_pdc/dqi_era_pdc).
Local Health Districts (LHDs) are implementing initiatives to raise awareness about the importance of identifying as an Aboriginal person. The programmes are designed and implemented locally. An example includes:
The Mid-North Coast LHD has implemented the MTEC ‘Closing the Gap’—Innovation in Emergency Departments project that aims to create a better patient journey for Aboriginal people using the hospital and to reduce the number of ‘Did Not Wait’ patients. It is focused on the Emergency Department (ED) environment, training of staff on identification, getting clinicians involved in cultural awareness programmes, and addressing barriers that prevent people from waiting. Various strategies are included e.g. amusements for children, information on why identification is important, resources, posters including a triage poster, DVD, and cultural awareness information. The District has also established a new ‘ALERT’ system, where the Aboriginal Liaison Officer receives a message that an Aboriginal patient is in ED. The programme has shown a reduction of ‘Did Not Wait’ patients in ED by about 50%.
The Northern Territory The Northern Territory (NT) Department of Health (DoH) has rolled out a number of eHealth initiatives that will have major implications for the use and collection of data. These improvements assist in the provision of seamless care for health consumers. Brief outlines for these initiatives are as follows:
NT My eHealth Record service transition to national My Health Record The NT My eHealth Record service has been operating since 1st July, 2005 and ensured access to important health information was available with consent 24 hours daily and is still operating today. As of 30 June 2016 over 71,000 consumers have been registered, including an estimated 85 percent of Aboriginal and Torres Strait Islander peoples living in rural and remote communities in the NT. Currently 132 health centres participate and contribute to the NT My eHealth Record including correctional facilities and public hospitals in the NT, Aboriginal Community Controlled Health Organisations (ACCHOs) in South Australia and public hospitals in the Kimberley region of WA. As of June 2016, Kimberley hospitals only send data to the national My Health Record.
NT My eHealth Record statistics for June 2016—1,448 authorised clinical users accessed, over 81,000 documents viewed and 121,773 events sent, as part of providing ongoing health care.
The NT My eHealth Record has been transitioning to the national My Health Record (previously known as the Personally Controlled eHealth Record PCEHR) for the last few years, with all NT Health health care facilities and majority of NT Aboriginal Medical Services registered to participate in the national My Health Record. Documents that can be sent from NT health care facilities include Shared Health Summaries, Event Summaries, ED Discharge and Inpatient Discharge Summaries, Diagnostic Imaging Reports (first jurisdiction in Australia) and Specialist Letters. Projects are underway to send public hospital pathology reports and the ability to view prescription and dispense information.
The national My Health Record statistics for June 2016—536 clinical users accessed, 536 documents viewed and 21,250 events sent, as part of providing ongoing health-care. As of 30 June 2016, 37,535 individuals registered for a national My Health Record and 188 sites registered for My Health Record in the NT, with 48 sites recording activity.
Due to the current status of private pathology negotiations at the national level, the NT will continue to utilise the My eHealth Record service (which currently receives NT private pathology reports) for the benefit of consumers and clinical users until such time that
private pathology can be sent to the national My Health Record. Once available the NT will consider transitioning to national My Health Record system.
Both eHealth records have proven to be of major benefit for mobile populations, and people from rural and remote areas accessing services in regional towns or cities. This is achieved by ensuring up-to-date information is easily accessible at the point of care, regardless of whether that is at a remote health centre operated by DoH or an ACCHO, or at a public hospital in a regional or major urban centre. Urban GP’s, allied health professionals and pharmacies have also commenced participating in the national My Health Record.
Secure Electronic Messaging Service Secure Electronic Messaging Service (SEMS) ensures that specific information regarding clinical referrals can be communicated electronically securely between service providers. This assists in a seamless care in relation to managing transition from GPs/health centres to appointments with specialists or hospital outpatient clinics. Electronic medications and discharge summary information is forwarded by hospitals to communities of residence, so that information is available locally for consumers on their return to country.
In early 2016, a project was successfully completed to improve outpatient referral and appointment management at Alice Springs Hospital with the aim of all referrals being undertaken electronically using SEMS. In April 2013, DoH commenced using the National Health Services Directory (NHSD) as its electronic address book for secure messaging. The NHSD directories provide information for a range of health services including allied health, hospital and community services to support health professionals to coordinate ongoing care for patients with chronic and complex conditions. Currently, DoH is in the process of updating the NHSD with outpatient clinic information collected from the five DoH public hospitals starting with Gove District Hospital and is soon to be followed by Tennant Creek Hospital.
Primary Care Information System In 2013–14, Primary Care Information System (PCIS) was implemented into the DoH Alcohol Mandatory Treatment Facilities in Central Australia followed by those in the Top End to follow early in 2014–15. In 2013–14, PCIS was also implemented in Renal Services with the Chronic Disease Nurses in the Top End and Central Australia being the first users in December 2013, followed by the Peritoneal Dialysis unit in April 2014 and Hemodialysis units in Tiwi and Palmerston throughout 2015, Nightcliff in January, and Katherine May, of 2016.
Healthy School Age Kids Care Plan In partnership with Primary Care Information System (PCIS), Central Australian Health Services have developed a new care plan for school age children in remote communities, Healthy School Age Kids (HSAK) Care Plan. It provides the recalls in the PCIS electronic health record for annual preventative health checks for school kids aged five to 14 years. The plan has progressed from an idea in early December 2015 to roll out in July 2016 with trials by all NTG clinics in Central Australia and Barkly by the end of 2016. There are 1,800 children throughout Central Australia and Barkly to be commenced on the HSAK Care Plan in July in one of the fastest roll outs of a new Care Plan.
NT Cardiac The NT Integrated Cardiac Network is one component of the Australian Government’s Health and Hospitals Fund Program, which has the aim of improving access to essential services for as many people as possible living in rural, regional and remote areas, and to help close the gap in health outcomes between city and country populations. DoH has been working with NT Cardiac on the Integrated Cardiac Network Project (ICN). The ICN project seeks to provide an easily accessible, high quality, patient focused, specialist

Technical appendix
208
cardiac service in the NT through the purchase, installation and integration of specialised cardiac equipment across NT Health and AMSANT member health networks.
The broad DoH project objectives are:
• deploy ECG machines to DoH health clinics (57+ locations)—COMPLETED
• deploy Holter Monitors to subset of clinics (limited to smallergroup of 15+ clinics)—COMPLETED
• connect the ECG machines to the NTG network allowing clinic staffto electronically transfer ECG scans/results to NT cardiac forreview by cardiologist—COMPLETED PENDING PCISENHANCEMENT
• implement mechanism for ECG and cardiologist reports to beelectronically uploaded into PCIS—COMPLETED PENDING PCISUPGRADE
The Pen Computer Systems Clinical Audit Tool (Pen CAT) has been integrated with PCIS data in the DoH data warehouse. The Pen CAT is used to analyse and report on clinical information from primary health care systems. It translates data into statistical and graphical information that is easy to understand and action. This allows practitioners to assess and improve both the quality and completeness of patient information. This benefits a primary health care practice by assisting with ongoing accreditation and providing opportunities to grow practice income. The emphasis of the tool is to enable practice staff to take specific action to improve patient coverage in chronic disease management and prevention.
Other benefits of the Pen CAT include:
• targeting patients with particular needs• targeting patients with specific health risk profiles• improved compliance with statistical data collection requirements • extracting data to meet a specific need• meeting statutory reporting requirements.
Statistics required for the Australian Primary Care Collaboratives (APCC) Programme and the Commonwealth Department of Health Future Directions Key Performance Indicators for Divisions are able to be easily identified and collated by the Pen CAT.
The PCIS Team works closely with clinical reference groups and programme areas to continually develop new and update existing care plans to reflect best practice standards and Central Australian Rural Practitioners Association (CARPA) protocols. PCIS facilitates extensive coded clinical data collection for each service episode with the capacity to capture all required national Aboriginal and Torres Strait Islander health performance indicator data. These data sets are used to improve the delivery of primary health care services by supporting continuous quality improvement (CQI) activity among service providers. These data sets also support policy and planning at the national and state/territory level by monitoring progress and highlighting areas for improvement.
Aboriginal Health Key Performance Indicator (AHKPI) project Initiated by the Northern Territory Aboriginal Health Forum (NTAHF), the aim of the AHKPI project is to develop a structure for collection and reporting of 21 agreed Key Performance Indicators (KPIs) that cover both Department of Health (DoH) Remote Health Centres and ACCHOs. The project is managed co-operatively by DoH, the Commonwealth Department of Health and Aboriginal Medical Services Alliance Northern Territory (AMSANT) under the auspices of the NTAHF banner and maintains the NT Aboriginal Health KPI collection covering the government and non-government sectors to improve the quality and robustness of data for use in service planning and management through continuous quality improvement.
The goal of the system is to contribute to improving primary health care services for Aboriginal Australians in the NT by building capacity at the service level and the system level to collect, analyse and interpret data that will:
• inform understanding of trends in individual and population healthoutcomes
• identify factors influencing these trends• inform appropriate action, planning and policy development.
Processes for data collection from the various organisations information systems have been defined and developed, and data delivery from all NT community health centres commenced on 1 July 2009. Reports are produced bi-annually, six weeks after end-of-financial and calendar years. The AHKPI definitions go through continuous cycles of quality improvement with approved changes to the existing NT AHKPI definitions, or new KPIs completed twice a year.
East Arnhem Health Services Delivery Area (EAHSDA) Communicare Project Between August 2011 and January 2012 the Commonwealth and NT Department of Health jointly funded the implementation of Communicare (now known as HealthConnex) into the four EAHSDA centres of Yirrkala, Ramingining, Milingimbi and Gapuwiyak. Yirrkala health centre transitioned to Miwatj Aboriginal Health 1 July 2012 and remains on the DoH Central East Arnhem Database in support of a central East Arnhem database and the spirit of regionalisation. On 30 June 2016 Miwatj Health assumed operational and administrative responsibility for Milingimbi Health Centre now known as Malmaldharra Health Centre. In the interest of continuity and improvement in health care provision to the patients of the clinic, NT Health has agreed to provide Miwatj Health with a copy of the electronic patient records from the NT Systems which pertain to patients of the clinic.
TeleHealth NT TeleHealth NT is a comprehensive telehealth network with over 62 telehealth enabled health centres in major cities and towns, regional areas and remote locations. The model of care for TeleHealth NT is enabling equitable access to integrated telehealth services to be delivered across the Northern Territory.
• A review of the Patient Travel Assistance Scheme (PATS) wasconducted by Northern Territory Department of Health in July2013. This review identified telehealth services should be utilisedas a mechanism to improve access to services and reduce costsand improve the patient experience. In 2014 a telehealth pilot waslaunched, the final report was released in December 2015. Theevidence showed high levels of staff and patient satisfaction aswell as a significant uptake in services in remote and regionallocations. PATS guidelines have since been amended to includetelehealth as a primary option to be considered for specialistconsults. The project demonstrated over 1.1 million dollars in costavoided by reducing patient travel and delivering tele-specialistservices.
• NT Health have identified Telehealth occasions of service beingprovided and Key Performance Indicators to monitor ongoinggrowth and trends. There is continued support to compare thenumber of specialist services providing face to face (with patienttravel required) with those that are provided by telehealth as anongoing performance measure.
• The National Telehealth Connection Service (NTCS) pilot wasestablished in 2014 with the intention of providing a secure healthplatform to connect health services regardless of technical standard or video conferencing platforms being used. In 2016 theproject has been deemed as successful and a bespoke commercialmodel has been developed with the vendor. The NTCS pilotdemonstrates that platforms that support non-governmentservices connecting with main stream providers allows for thefootprint telehealth to expand to many primary health careservices and Aboriginal Medical Services.

Technical appendix
209
Queensland Burden of Disease and Injury in Aboriginal and Torres Strait Islander People in Queensland The Queensland Government has a bipartisan commitment to closing the gap in health status and life expectancy between Aboriginal and Torres Strait Islander peoples and non-Indigenous Australians and much work has been undertaken on this path.
In recent years in Queensland, significant effort has been directed to quantify and understand the characteristics of the health gap between Aboriginal and Torres Strait Islander peoples and other Australians. Measuring improvement in health outcomes against established benchmarks and better targeting health services and interventions have been the primary objectives of this work.
The first complete national assessment of the burden of disease in the Aboriginal and Torres Strait Islander population was released in 2007 (reference year 2003) (Vos et al. 2007). Equivalent results have been generated for Queensland by combining burden of disease analysis for whole-of-Queensland (Qld Health et al. 2008a; Qld Health 2008b) with the results of the national Indigenous study (Vos et al. 2007) to provide 2003 and 2006 broad estimates for Aboriginal and Torres Strait Islander Queenslanders (Qld Health et al. 2008a; Qld Health et al. 2008b).
The 2008 Queensland Government commitment to close the gap in health status and life expectancy between Aboriginal and Torres Strait Islander peoples and non-Indigenous Queenslanders (Queensland Government, 2008), along with the recent development of experimental life tables for Indigenous Queenslanders by remoteness for 2005–07 (unpublished), provided the impetus to refresh the burden of disease and injury estimates for Queensland’s Aboriginal and Torres Strait Islander peoples.
In 2012, Queensland Health undertook a refresh of burden of disease and injury results specifically for Queensland’s Aboriginal and Torres Strait Islander people (reference year 2007). This study is the first comprehensive description of the burden of disease in Queensland’s Aboriginal and Torres Strait Islander population. The results aid prioritisation of health programmes, services and policies by highlighting areas with the largest health loss and those with the largest potential for health gain.
Queensland is currently finalizing a 2011 update of the 2003 and 2012 study. This update includes revised mortality inputs utilizing updated cause and sex specific mortality inputs and life tables at a remoteness level for Queensland. This study also includes revised risk factor modelling utilizing output from the 2012–13 National Aboriginal and Torres Strait Islander Health Survey. Estimates for the 2007 study have been backcast based on new inputs for the 2011 study to create to comparative time points. Additionally, the 2011 study has estimates available at sub-jurisdictional level (Queensland Hospital and Health Service region). There is also scope to derive estimates from any geography which can be aggregated from SA2. The 2011 small area Indigenous Burden of Disease estimates for Queensland are due for release in early 2017.
Quantifying the cost of excess hospitalisations for Indigenous Queenslanders Aboriginal and Torres Strait Islander people in Queensland have higher morbidity and mortality rates compared with the non-Indigenous population. Higher rates of morbidity and mortality are present and have been since an Indigenous identifier has been included in Queensland morbidity and mortality data collections in the mid-1990s.
Significant work from researchers working outside Queensland Health, and from public and population health staff from within Queensland Health, has gone into quantifying the health gap for Aboriginal and Torres Strait Islander peoples in Queensland using morbidity and mortality data sets. This has included publicly accessible research that clearly documents morbidity and mortality
differentials for Aboriginal and Torres Strait Islander peoples across a wide variety of conditions including chronic disease, namely cardiovascular disease, chronic respiratory disease, Type 2 diabetes, mental illness, accident and injury and child and maternal health.
However, less work has been undertaken around quantifying the financial impact of the burden of disease for Aboriginal and Torres Strait Islander peoples. Queensland Health is currently undertaking a project to estimate the cost of excess hospital separations for Aboriginal and Torres Strait Islander people in Queensland (who are hospitalised at almost twice the rate of non-Indigenous Australians).
Due to differences in casemix cost weights, the key drivers of the health gap (mental disorders, cardiovascular disease, diabetes mellitus, chronic respiratory disease and cancer) may not necessarily equal the key drivers of excess hospital cost, hence the need to understand cost implications of excess hospitalisations.
The key aim of this work is to support the focused purchasing of activity which addresses both the health gap and the key drivers of excess cost to ensure that Department of Health in Queensland is in a position where it could significantly reduce health disadvantage for Aboriginal and Torres Strait Islander people.
The analysis will also contribute to meeting the two key COAG targets of closing the gap in life expectancy by 2033 and halving the gap in child mortality by 2018, as well as reducing the financial impact of the health gap on the system.
Small area estimates at a Hospital and Health Service region were released in October 2016 and will be available for downloading from the Queensland Health website in late 2016.
Indigenous health performance management
Queensland Hospital and Health Service Performance Management The Queensland Department of Health has for the last four years managed the performance of its Hospital and Health Services (HHS) through service level agreements which contain a suite of health performance indicators across a number of domains, including two Aboriginal and Torres Strait Islander health indicators—Discharge Against Medical Advice (DAMA) and Potentially Preventable Hospitalisations (PPH).
From 2016–17 onwards all key performance indicators across all domains in HHS service agreements (where data are of sufficient quality) will be disaggregated by Indigenous status. This will provide the Queensland Government with a significant opportunity to fine tune efforts to close the gap in Indigenous health outcomes.
Strategic policy performance monitoring: The Queensland Government has developed a number of strategy/policy documents targeting specific disease priority areas over the last two years:
• The Queensland Aboriginal and Torres Strait Islander Cardiac Care Strategy—https://www.health.qld.gov.au/publications/portal/health-strategies/cardiac-health-strategy.pdf
• The Indigenous Mental Health Strategy—https://www.health.qld.gov.au/atsihealth/documents/qhatsi-mental-health-strategy.pdf
• The Far North Queensland STI Strategy—https://www.health.qld.gov.au/atsihealth/documents/sti-action-plan-2016-21.pdf
Each of these strategies has significant performance reporting components across a number of tiers. An essential component of all Queensland Government strategy and policy documents which aim to address Indigenous health differentials is the need for robust evaluation of the impact of policies and investment through appropriate performance frameworks.

Technical appendix
210
Aboriginal and Torres Strait Islander Better Cardiac Care Collaborative Data Linkage Project Queensland There are disproportionately higher rates of cardiac disease risk factors, more complex health needs, higher hospitalisation rates and poorer health outcomes for Aboriginal and Torres Strait Islander people compared with other Australians. Despite a greater burden of cardiac disease, Aboriginal and Torres Strait Islander people have lower usage rates of primary and secondary preventive and acute cardiac care services. As a result, cardiovascular disease is the leading cause of fatal burden, contributing 22% to Aboriginal and Torres Strait Islander mortality in Queensland.
By linking Queensland and Commonwealth health administrative datasets, this project aims to:
• Identify gaps in the cardiac care continuum for Aboriginal andTorres Strait Islander people with cardiac disease.
• We will retrospectively describe the patient journey, quality ofcare and impact on health outcomes for people with cardiacdisease (specifically those diagnosed with Ischaemic Heart Disease(IHD), Congestive Heart Failure (CHF), stroke or Acute RheumaticFever/Rheumatic Heart Disease (ARF/RHD)) over the last six years(2010–11 to 2015–16). The study cohort includes patients of allages who were first hospitalised in Queensland during the period2010–11 to 2015–16 with a diagnosis of the conditions above.Records of these patients from the Queensland Health AdmittedPatient Data Collection (QHAPDC) and the Queensland RHDRegister will be linked to the relevant Medicare Benefits Schedule(MBS), Pharmaceutical Benefits Scheme (PBS), National DeathIndex (NDI), iPharmacy, AusLAB (Queensland Pathology) andEmergency Department Information System (EDIS) to assess thecontinuum of care provided against clinical guidelines and bestpractice standards.
• Examine the epidemiology of ARF/RHD in Queensland over asixteen-year period (2000–16).
• We will retrospectively describe long-term trends and outcomes ofARF/RHD in Queensland to examine disease burden andprogression over time. The study cohort includes patients of allages who were hospitalised or notified with a diagnosis ofARF/RHD in Queensland during the period 2000 to 2016. Recordsof these patients from the QHAPDC and the Queensland RHDRegister will be linked to the NDI to examine the prevalence,incidence and progression of disease over time.
It is proposed that these investigations will also include comparison of service delivery and health outcomes based on patient:
• location• age• sex• Indigenous status.
Purpose: The purpose of the project is to: identify gaps within the continuum of care across the primary, secondary and acute health sectors for Aboriginal and Torres Strait Islander people with IHD (ICD-10-AM code: I20-I25), stroke (ICD code: I63), CHF (ICD Code: I50), ARF/RHD (ICD code: I00-I02, I05-I09); and describe the epidemiology of ARF/RHD within Queensland over an extended period. This information will be used for health service planning and establishment of targets for future evaluation and monitoring purposes.
Aims: Over the period 2010–11 to 2015–16:
• Describe access to primary and secondary preventive care, acuteand post-acute care for Aboriginal and Torres Strait Islanderpeople hospitalised with cardiovascular disease.
• Describe delays and disruptions in the continuum of care based onbest practice standards.
• Analyse the variation in patterns of care geographically andbetween Indigenous and non-Indigenous populations (whererelevant).
• Examine the impact of the variation in patterns of care on adversepatient outcomes (such as level of comorbidity, hospitalreadmissions and survival time) to inform improvements incoordination across the care continuum.
Over the period 2000 to 2016:
• Describe the incidence, prevalence, disease progression andoutcomes of ARF/RHD.
South Australia Improving Aboriginal and Torres Strait Islander Identification The ABS was funded through SA Health’s Council of Australian Governments investment to develop a training package for recording the Indigenous identifier in health data collections; as well as training staff who manage data and/or perform data entry about the importance of collecting the Indigenous identifier information; the correct way of asking the standard question and recording the response; and strategies for dealing with special circumstances, such as determining the Indigenous status of children and patients who are unconscious. The training targeted frontline staff working across hospital sites in metropolitan Adelaide and regional communities, as well as various mainstream primary care services throughout SA. This training approach was informed by the AIHW’s Best Practice Guidelines for Collecting Indigenous Status. The first state-wide training programme concluded in late 2011. Over 430 frontline staff attended training sessions held in 40 locations spread through the state.
SA Health has also indicated that it supports feeding this initiative into the AIHW and ABS National Data Linkage Project on Indigenous identification. SA Health continues to operate a case mix payment system, which applies a 30% loading to hospital separations of Aboriginal and Torres Strait Islander peoples, and this provides an incentive for improved Indigenous identification.
SA Pathology (trading as IMVS Pathology) provides a comprehensive diagnostic pathology service delivered via a network of 18 state-wide laboratories and more than 71 patient collection centres. It is the sole provider of pathology in the public hospital sector and a major provider to the private GP and specialist market. The SA Department for Health and Ageing and SA Pathology have recently completed the first part of the project to address ‘Aboriginal Identification Requirements in Pathology Systems’.
The initial emphasis of the project has been to ensure the Indigenous Identifier is included on pathology forms. This involved extensive consultation with SA Pathology providers and other jurisdictional providers. This enabled information sharing and identifying lessons learnt from other jurisdictions implementing similar projects, and resulted in the Indigenous Identifier being introduced into pathology forms as well as metropolitan-based hospital systems. While pathology forms have been addressed, a greater emphasis is now on linking the Indigenous identification data to an IT solution, as this is a significant gap requiring attention. The procurement of SA Pathology’s new Laboratory Information System, which aims to be implemented from early 2016, is a key IT solution that will integrate the Indigenous Identifier information, and enable the appropriate use of captured data.
Further project work is being undertaken to review the downstream impacts on affected registries, which include input and advice from ACCHOs, GP Clinics, Medicare Locals and Well Women’s Screening programmes. SA Health is determining how best to ensure systems provide consistent and continuous transfer of Aboriginal identification data across SA Health. Additional systems training will be required to support staff to collect information.
Technical appendix
211
In 2007, SA participated in the National Audit of Indigenous Identification in Public Hospitals project, coordinated by the AIHW. Surveys were conducted in metropolitan and regional hospitals across SA, and the results contributed to reports from other jurisdictions to calculate adjustment factors to be applied to hospital separations data for Expenditure on Health reporting. A follow-up audit was conducted in 2011. The audit independently verified the Indigenous status of a sample of patients in selected metropolitan and country hospitals through face-to-face interviews. The results were matched against data held in hospital systems, to assess the quality of identification by hospital staff. More than 1,250 patient interviews were conducted during the audit. An estimated 91% of Indigenous patients were correctly identified, an increase of 4 percentage points compared with the 2007 audit. SA’s completeness rate of 91% was the third highest nationally, behind the NT and WA. SA was only one of four state/territories to report an improvement in the identification of Indigenous people between the two audits.
Aboriginal and Torres Strait Islander Life Expectancy Measures The SA Strategic Plan tracks improvements in key outcomes over time. Life expectancy for Aboriginal South Australians continues to be one of these key outcomes. SA Health produces a life expectancy estimate for SA, in the absence of the AIHW and ABS producing an estimate.
Data sets Having identified the need for improvements in the way that the health sector describes and measures primary health care activities, SA has established an Out-of-Hospital Services Minimum Data Set, which includes the National Data Dictionary definition of ‘Indigenous status’, represents the agreed core elements that are collected for describing out-of-hospital care services in SA. A central repository of out-of-hospital services data has been operational for several years covering: community health, community mental health, public dental services, drug and alcohol services, child and family services, district nursing services and palliative care. One use is the measurement of the use of the above services by Aboriginal and Torres Strait Islander peoples.
SA has recently established a patient level collection on outpatient department services. The collection includes the Indigenous Status data item as per the national standard.
Cancer Data and Aboriginal Disparities (CanDAD) The University of South Australia; South Australian Health and Medical Research Institute (SAHMRI); Aboriginal Health Council of South Australia; Cancer Council SA; Beat Cancer Project; SA NT DataLink; and SA Health are partnering in research that addresses the related issues of CanDAD. Governance for this important initiative is led by Professor Alex Brown, a prominent Aboriginal health researcher, Professor David Roder, an eminent cancer epidemiologist, and an Aboriginal Community Reference Group who are resolved that the data be used for health and health-system improvement.
CanDAD has two components, the first of which is the Advanced Cancer Data System Pilot (ACaDS). ACaDS seeks to develop an integrated, comprehensive cancer monitoring system with a particular focus on Aboriginal people in SA. This brings together cancer registry, hospital, radiotherapy, clinical and screening data to comprehensively monitor cancer trends, cancer management and survival. In collaboration with AIHW the integration of PBS data from the Commonwealth is also being sought.
Uniquely, CanDAD is also striving to incorporate Aboriginal patients' experiences with cancer and cancer services to guide continuous service improvement, community engagement, advocacy and outcomes research, providing data infrastructure for health services, population research, and for training Aboriginal (and non-Aboriginal) researchers.
The purposeful relating of accurate registry and administrative data alongside narratives of Aboriginal people with cancer will facilitate assessment of existing service quality and appropriateness, secular trends in cancer risk, burden and determinants will highlight areas of immediate need and provide a robust system for performance monitoring and evaluation. Even at an early stage in its course, CanDAD is providing Aboriginal specific input to the developing Statewide Cancer Control Plan 2016–2020.
The Aboriginal Health Landscape: Identifying and monitoring Aboriginal health disparities in South Australia The Aboriginal Health Landscape is a population health initiative funded by the Wardliparingga Aboriginal Research Unit of SAHMRI. The aim of Landscape is to provide and report on health-related risk factor prevalence, health outcomes and social determinants of health of Aboriginal people compared with non-Aboriginal people at small area levels of geography that combined comprise the state of SA. Recent reports on health outcomes and the social determinants of health for Aboriginal people in SA, present only state or regional level information. Information related to more localised areas may be more meaningful and useful to local needs.
Broad questions:
• What is the demographic profile of Aboriginal people within eachcluster and where, within each cluster, are health services locatedrelative to where people live?
• Are there disparities in health status and outcomes, socialdeterminants of health and burden of disease in the Aboriginalpopulation compared with the non-Aboriginal population in SA,between clusters?
• Are there disparities in health status and outcomes, socialdeterminants of health and burden of disease in the Aboriginalpopulation compared with the non-Aboriginal population in SA,within clusters?
This piece of work will provide an up-to-date baseline health profile so we can collaboratively target and monitor our efforts in service provision, research, and policy settings. The information would be available to assist Aboriginal communities, government and non-government service providers with:
• setting targets for better health outcomes in local areas • determining funding priorities for a fairer distribution of health
programmes • advising partners and responsible organisations on gaps to target
their efforts• prioritising health and health-related research based on health
needs and gaps • advocating for health improvements in an informed way, by
Aboriginal communities and organisations on behalf of Aboriginalcommunities
• fostering informed debate on the work needed to achieveAboriginal health equity
• informing policy• monitoring and reporting against targets.
It will also assist communities and organisations with determining research priorities.
An Advisory Group will govern the Landscape project. It will comprise of Aboriginal people in SA who can provide advice and guidance on what and how health information is reported and interpreted from a health service, local community or local government perspective. A Technical Panel will be formed to provide advice and guidance on technical aspects of data analysis and reporting for the Landscape project. Both will be convened prior to 2015 and data custodian representation will be sought from SA Health.
Twenty individual Landscapes have been defined based on where Aboriginal and non-Aboriginal people in SA live. Each Landscape has between 1,000–2,000 Aboriginal residents, as identified in the 2011

Technical appendix
212
census. Several custodians in SA Health have provided data and negotiations are continuing and will commence with additional custodians.
Data sharing The Aboriginal Health Council of South Australia (AHCSA) Inc. has been funded since 2010 for two data sharing initiatives under SA Health’s COAG investment: the Enhancement of Information and Management in the Aboriginal Community Controlled Health Sector in SA; and the Audit and Best Practice for Chronic Disease (ABCD) project (funded since 2011). AHCSA is the peak body for Aboriginal health in SA representing Aboriginal Community Controlled Health and Substance Misuse Organisations and Aboriginal Health Advisory Committees at a state and national level.
The Enhancement of Information and Management in the Aboriginal Community Controlled Health Sector in SA was initially used to develop a set of standard Patient Information Management System procedures and templates across ACCHOs to achieve standardised and consistency of data. This project included the investigation and implementation of methods for cross-sectoral data sharing between the ACCH Sector.
This programme continued to receive further funding in 2013–14 and 2014–16 and specifically targets patient information systems at the local health service level to lead to better patient outcomes. The programme will continue to provide health information support to the AHCSA Public Health and Primary Health Care programmes with implementation of processes relating to PIMS across the ACCH Sector to enable continuous quality improvement and programme evaluation. AHCSA will continue to advise ACCHOs on how to best optimise their PIMS supportive of clinical governance, including AGPAL Accreditation, reporting obligations, accessing Medicare revenue, quality improvement initiatives and aspects of health service management.
Some of the Key Performance Indicators include:
• support for the development of Health Information Management Systems in the Aboriginal Community-Controlled Sector throughprovision of orientation and training sessions for ACCH Sector staff
• support a consistent approach to health information management in terms of building capacity across the health system to providecomprehensive information management systems to contribute toimproved Aboriginal health outcomes
• contribute to the development of a state wide Aboriginal healthinformation initiative to inform cross sectoral Aboriginal healthplanning and priority setting.
• The ABCD project was funded to enhance the capacity of AHCSA tosupport the ACCHOs participating in the ABCD National ResearchPartnership. The funding worked to achieve the following:
- building the capacity to provide services, including the acquisition of the One21Seventy tool for ABCD auditing
- facilitation of ABCD audit training to ACCHOs staff.
The ABCD project was initially funded from 2011–13 then 2013–14 and funding ceased from SA Health although the National Research Partnership has continued.
ABCD NRP background Over the past two decades there has been growing use of continuous quality improvement (CQI) initiatives within Australian Aboriginal and Torres Strait Islander primary health care with the aim of improving the quality of care and improving health outcomes.
Fifteen SA primary health care services participated in the ABCD National Research Partnership (2010–14), and supported to implement a CQI initiative and to participate in a regionally relevant research project that supports the process of embedding CQI in every day practice. Since its inception (2011), the SA project was set up to conduct research around local CQI implementation activities. A regional research project emerged from these initial activities with
the participating primary health care services that aimed to understand the barriers and enablers to CQI to identify strategies to strengthen its effectiveness in the South Australian setting.
Tasmania Recording Indigenous status information is mandatory in core Tasmanian hospital administration systems, including for admitted, emergency department, non-admitted and maternity patients. The National best practice guidelines for collecting Indigenous status in health data sets is the primary resource used in Tasmania to support data recording, collection and reporting practices.
Caution must be exercised in comparing Tasmanian Indigenous identification with that of other jurisdictions due to variations in data quality, particularly hospitalisations data. The Tasmanian Perinatal Data Collection now contains good quality data on Indigenous identification, with the proportion of mothers to be identified as Indigenous matching the proportion of women identifying as Indigenous in population estimates in the community. Tasmania’s main challenge in monitoring improvements in Indigenous health continues to focus on data quality issues for hospitalisation records, and work on improving Indigenous identification in hospital datasets is ongoing. Indigenous identification in Tasmanian private hospitals remains very low.
The tripartite Framework Agreement Tasmanian Aboriginal Health and Wellbeing 2016–2020 was finalised in early 2017 pending endorsement from all parties, the Tasmanian and Australian Governments and the Tasmanian Aboriginal Centre. The Framework Agreement will provide a platform for all partners to work together on shared priorities to improve the health and wellbeing of Tasmanian Aboriginal people.
A Tasmanian Aboriginal Health Forum, consisting of the parties to the Framework Agreement, has been established. The Forum is a key mechanism to deliver on the aims of the Framework Agreement and to foster collaborative planning, information sharing and partnership approaches to improve Aboriginal health outcomes.
Annual work plans will be developed under the Framework Agreement, which will set priorities for collaboration to be progressed by the Forum. Members of the Forum have agreed that one of the key priorities for collaboration is to improve health data for Tasmanian Aboriginal people. Tasmania is working toward the ability to measure and improve employment opportunities and outcomes for Aboriginal and Torres Strait Islander people. In the Department of Health and Human Services, a data improvement program has re-established opportunities for new employees to identify as being of Aboriginal and/or Torres Strait Islander origin through the job application process in Page-Up. Further opportunities for existing employees to make such an identification will become available when the self-service module of the human resource information system, Empower, is implemented in the near future.
The Department of Health and Human Services (DHHS) has two full-time equivalent Priority Populations Officers who work as part of the Health Improvement team. The Priority Population Officers work to support those groups in the community more likely to suffer poorer health outcomes when compared with other groups, with a particular focus on Aboriginal health and multicultural health. Workforce development is one key focus area of the roles, and includes providing access to cultural competency training. In 2014, an E-learning Aboriginal & Torres Strait Islander Cultural Competency training module was launched for all DHHS and Tasmanian Health Service employees. This resource is designed to help develop cultural competency of the department and staff and support cultural safety for Aboriginal clients accessing health and human services. The module includes a section dedicated to the collection of Indigenous status information.

Technical appendix
213
Victoria Data collection In Victoria, Aboriginal and Torres Strait Islander status is a mandatory field in all major health datasets. The Victorian Admitted Episodes Dataset (VAED), the Victorian Emergency Minimum Dataset (VEMD), and the Victorian Perinatal Data Collection (VPDC) contain good-quality data on Indigenous identification. Aboriginal identification is also collected through the Alcohol and Drug Information System (ADIS), infectious diseases (PHESS), aged care (Commonwealth Home Support and ACAS) and community health direct care databases.
The Aboriginal population of Victoria forms a small proportion of a large, mainly urban population. Correct identification of Aboriginal people in Victoria is challenging in all datasets.
Measures to improve data Improving Care for Aboriginal and Torres Strait Islander Patients (ICAP) programme includes 30% case-mix co-payment to hospitals for acute, sub-acute and mental health patients identified as Aboriginal. The programme encourages an outcomes focus leading to improved identification and health care.
Victorian hospital datasets include two additional fields in the standard Indigenous status question: ‘Question unable to be asked' and 'Patient refused to answer’. The addition of these fields has enabled the Department of Health to identify instances of misuse of either field very quickly. This has contributed to the improving rate of Aboriginal identification.
Changes in access to data systems have also meant that more frequent monitoring of Aboriginal hospital separations is possible, and errors can be discovered and rectified.
In January 2009, the VPDC allowed the recording of the Indigenous status of babies as separate from the mother. This has enabled the large proportion of Aboriginal babies born in Victoria who have an Aboriginal father and non-Aboriginal mother to be recorded as Aboriginal. The quality of the data recorded in this dataset has been improving each year. In 2014 the Aboriginal Newborn Identification Project targeted particular maternity hospitals to improve identification of Aboriginal mothers and babies.
The Cancer Underscreened Recruitment Program aims to increase the participation and recording of Aboriginal people in cervical, breast and bowel screen programs. The Department of Health and Human Services and PapScreen Victoria have developed a system for recording and reporting the Aboriginal status of women participating in pap screens. A pilot study has been completed and was successful in training nurses to collect Aboriginal status. The system will be extended to GP providers. The identification of Aboriginal status in all cancer screening systems is being investigated.
Work to encourage GPs to record Aboriginal status has continued. This has been assisted by the use of the Aboriginal health check, Medicare item 715, which requires identification as Aboriginal.
Victoria participated in the audit of hospital inpatient data coordinated by AIHW in 2011. The same methodology has since been used subsequently to audit 2 individual hospitals and assist them to develop strategies for improvement. A large scale audit is planned for 2016.
New measures for monitoring Victorian health services’ cultural responsiveness and cultural safety for Aboriginal people have been developed through the Koolin Balit Evaluation (2015–16) and are being implemented from 2016, both by individual hospitals and state-wide by government.
Research is being conducted to develop methods for measuring and monitoring two critical areas identified through the Koolin Bali Evaluation as critical for Aboriginal health improvement: Aboriginal people’s experience of care (work is investigating expanding upon the long-running Victorian Healthcare Experience Survey); and
Aboriginal people and communities’ connection to place and culture as a critical social determinant of health.
The Victorian Aboriginal Community Controlled Health Organisation has reached formal agreement with all of its member organisations to contribute to a central data warehouse which will be used to monitor client outcomes and inform service development within ACCHOs, amongst other applications.
Data improvement across multiple government departments The Victorian Aboriginal Child Mortality Study, based at the University of Melbourne, has brought together birth and death information from the VPDC and the RBDM to ascertain the number of Aboriginal babies born between 1988 and 2008, and the number and causes of death for Aboriginal children who died during this period. The linked datasets have also provided an assessment of the coverage of the individual datasets. The final Report was released in December 2015. There is scope for the same methodology to be used as part of a continuing process of improving identification of Aboriginal child deaths.
The Victorian Auditor-General’s Office reviewed the access of Aboriginal people to mainstream services in Victoria and recommended improvements in data and reporting, which will be implemented by the relevant departments.
The Department of Health and Human Services and the Commission for Aboriginal Children and Young People conducted a project examining the needs of Aboriginal children in out-of-home care, which will include a review of the datasets relevant to these children and their ability to identify Aboriginal children in out-of-home care. All health datasets are included.
The Victorian Aboriginal Affairs Report provides an update on progress against specific targets and measures within the Victorian Aboriginal Affairs Framework 2013–18. Health-related targets include perinatal mortality, low birthweight, smoking in pregnancy, self-reported health status, psychological distress, obesity, current tobacco use, intentional self-harm, and alcohol consumption.
Western Australia “Data, evidence and research” are identified as one of the six priority areas in the WA Aboriginal Health and Wellbeing Framework 2015–2030. Under this priority area, a number of strategic activities were identified. These include: improving data and evidence about what works in Aboriginal health; involving Aboriginal people and communities in the research agenda; and implementing strategies to address the under-identification of Aboriginal people.
In WA, Aboriginal and Torres Strait Islander status is collected in a range of health data collections, including the Admitted Patient Data Collection, the Emergency Department Data Collection, the Non-admitted Data Collection (which includes data on outpatient care), the Notifiable Disease Data Collection, the WA Health and Well Being Surveillance System, the Midwives Data Collection, the Breast Screening Data Collection, the Mental Health Data Collection and the Cancer Registry. It is also stored on ABS Mortality data held by the Department of Health. The data item that identifies Aboriginal and Torres Strait Islander people is a mandatory part of the data provision specification.
The Western Australian Department of Health (WA Health) collects data on Indigenous status in accordance with the ABS Indigenous status question, under the National best practice guidelines for collection Indigenous status in health datasets. The basis for the question is the national standards set out in the National Health Data Dictionary, Metadata Online Registry (METeOR) and the WA Health Hospital Morbidity Data System Reference Manual.
The WA Health Hospital Morbidity Data System Reference Manual, which sets out the rules for collection of inpatient data, states the following:
Technical appendix
214
• Indigenous identification is extremely important in health datacollections throughout Australia. It is used not only to direct fundsinto Aboriginal medical programs, but also to identify causes ofperinatal and adult mortality within the Aboriginal population.
• There are three components to this definition: descent, self-identification and community acceptance. All three should besatisfied for a person to be Aboriginal. However, it is not possibleto collect proof of descent or community acceptance in thehospital setting. If a person identifies himself or herself asAboriginal, then assign the most appropriate code (1–3).
• The following question must be asked of all patients:
- ‘Are you of Aboriginal or Torres Strait Islander origin?’
- In circumstances where it is impossible to ask the patient directly, such as in the case of death or lack of consciousness, the question should be asked of a close relative or friend if available to do so.
- If the Admission Clerk is unable to speak directly with the patient, the ward staff should ask the patient the above question, or ask a close relative or friend if the patient is not able to provide the information.
To improve and maintain the quality of information entering into the hospital morbidity data collection system, each WA Health Service Provider will have a Patient Administration System administrator, and a liaison office whose role is to train staff on how to interpret data elements for entry to the system. This includes training staff on how to properly ask the Indigenous status question.
The current redevelopment of the Mental Health Data Collection also offers opportunities to enable better identification of Aboriginal people in the Patient administration system that underpins this Collection.
WA Health has adopted two items in its Midwives Data Collection i.e. smoking during pregnancy and antenatal care. These two data items will be available for reporting by Aboriginality in 2016. Furthermore, a chapter on Aboriginal mothers and babies has now been included as a regular part of WA Health Mothers and Babies Annual Report.
WA Health and the Australian Bureau of Statistics, together with the Telethon Kids Institute conducted a cross agency data linkage and analysis project “Getting Our Story Right” (GOSR) to explore and develop different methods for deriving Indigenous status from multiple data sources. Using the resources of the WA Data Linkage System, the project examined the impact of these methods on a sample of health and educational outcomes among the Indigenous population.
The study compared various methods of calculating Indigenous status across multiple data sources and made recommendations about the best use of existing information resources as it pertains to measuring the gap in Indigenous disadvantage. Linked data was drawn from collections held by WA Health, WA Department of Education, the Registry of Births, Deaths and Marriages and the Telethon Kids Institute. Representatives from these organisations were consulted and gave their support. The study also received endorsement from the WA Health Human Research Ethics Committee and the Western Australian Aboriginal Health Ethics Committee.
Based on the work of the GOSR project, the WA Health Data Linkage Branch has created an Indigenous Status Flag. A validated algorithm was used to create this flag for each individual with one or multiple data records held in one or multiple WA government administrative datasets. Data recipients must note that their project could receive data for an individual where data sets provided report an Indigenous Status of NO but the Indigenous Status Flag is YES. The Indigenous Status Flag indicates what status is indicative of a person from all available collections or records and therefore may be different to what is reported in a specific record or collection.
WA Health has used the GOSR Indigenous status flag in the epidemiological and statistical analysis and reporting. Such a flag is also made available to researchers who have applied to have access to WA Data Linkage System.
From 2017–18, WA Health has agreed to the inclusion of Discharge Against Medical Advice (DAMA) as a new performance indicator into its mainstream reporting cycle. The DAMA indicator measures the proportion of Aboriginal patients who leave hospital without being formally discharged by a physician. The proportion for Aboriginal patients is much higher than for the non-Aboriginal patients. Surveillance of this indicator will also enable monitoring of the related data quality.

Technical appendix
215
Notes to tables and figures Introduction Figures 2 and 3: For 2015 data, the Queensland Registry of Births, Deaths and Marriages included Medical Certificate of Cause of Death information for the first time to contribute to the Indigenous status data item. This was associated with a decrease in the number of deaths for which the Indigenous status was ‘not stated’ and an increase in the number of deaths identified as Indigenous in Queensland. Although the Indigenous child mortality rate was higher in Queensland in 2015, for New South Wales, Western Australia and South Australia the rates were lower in 2015 than in 2014. This change in method means that time series data for Queensland are not directly comparable and caution should be used in interpreting the trend.
Figures 20, 21 and 22: Indigenous Region and Indigenous Area are based on the ABS’ 2011 Australian Standard Geography Standard (ASGS): Volume 2 – Indigenous Structure.
Health Status and Outcomes (Tier 1) 1.01 Low birthweight Data on birthweight is collected as part of the Perinatal National Minimum Data Set. Low birthweight data are reported for live births of 20 weeks’ gestation or more and less than 400 grams’ birthweight. Low birthweight is defined as less than 2,500 grams. Data excludes babies with unknown birthweight. Unless otherwise stated, Indigenous and non-Indigenous data exclude births where the mother’s or babies’ Indigenous status is not stated. Data excludes Australian non-residents, residents of external territories and records where state/territory of residence was not stated.
Figure 1.01-1: Data are by place of usual residence of the mother. Excludes non-residents, external territories and not stated state/territory of residence. Time series rates are calculated for low birthweight singleton babies (as inclusion of multiple births in trend analysis could confound results) and are presented for single years from 2000 to 2014.
Figure 1.01-2: Data are by place of usual residence of the mother. Excludes non-residents, external territories and not stated state/territory of residence. Includes all live-born low birthweight babies.
Figure 1.01-3: Data are presented by age of mother. Indigenous and non-Indigenous data exclude women with not stated age/date of birth. Includes all live-born low birthweight babies.
Figure 1.01-4: Data are presented by remoteness category. Indigenous and non-Indigenous data exclude women with a not stated state/territory of residence. Includes all live-born low birthweight babies.
1.02 Top reasons for hospitalisation Data for this measure come from the AIHW’s analysis of the National Hospital Morbidity Database. Data are from public and most private hospitals in all jurisdictions. Care types 7.3, 9 & 10 (Newborn—unqualified days only; organ procurement; hospital boarder) have been excluded from analysis.
Rates have been directly age-standardised using the 2001 Australian standard population. Rates for Indigenous Australians are calculated using backcast population estimates and projections (Series B) based on the 2011 Census.
Categories are based on the ICD-10-AM eighth edition (National Centre for Classification in Health 2013). Data related to principal diagnosis are reported by state/territory of usual residence of the patient hospitalised. Unless otherwise stated, hospital separations for dialysis are excluded from the analysis.
For total separations at a national level, the jurisdictions’ hospitalisation numbers and rates have been adjusted for Indigenous under-identification using a national adjustment factor
of 1.09. This factor was derived from a study undertaken by the AIHW in 2011 and 2012 which assessed the level of Indigenous under-identification in hospital data in all states and territories by comparing information gathered from face-to face interviews in public hospitals with results from hospital records. By applying this factor, the number of Indigenous hospitalisations was increased by 9% and these additional hospitalisations were then subtracted from the number of hospitalisations for non-Indigenous Australians. For further information, see AIHW, 2013. This adjustment factor cannot be applied to separations presented by cause as identification may vary by principal diagnosis.
Current period data are presented from July 2013 to June 2015. Data are combined for two years due to small numbers when disaggregating separation data (e.g. by principal diagnoses, age or jurisdiction).
For jurisdictional breakdowns age-standardised rates for NSW, Vic, Qld, WA, SA, the NT and Australia have been calculated using the direct method, age-standardised by 5-year age groups to 75+ years. Age-standardised rates for Tasmania and the ACT have been calculated using the direct method, age-standardised by 5-year age group to 65+. As different age-groupings were used, caution must be used when comparing rates for Tasmania and the ACT, with rates for NSW, Vic, Qld, WA, SA, the NT and Australia.
Time series rates are age-standardised using the 2001 standard population and are presented for single years. Long-term trends are reported from 2004–05 to 2014–15 and include NSW, Victoria, Qld, WA, SA and the NT combined. The jurisdictions included differ between trends due to historical data quality issues.
Remoteness area is based on the ABS’ 2011 Australian Statistical Geography Standard (ASGS) and relates to the patient’s usual residence. Total includes hospitalisations where remoteness area of residence is unknown. Rates by remoteness are calculated using AIHW derived populations using ABS population estimates and projections based on the 2011 Census.
Figure 1.02-3: ‘Other’ includes: diseases of the musculoskeletal system and connective tissue; neoplasms; diseases of the nervous system; certain conditions originating in the perinatal period; diseases of the ear and mastoid process; diseases of the eye and adnexa; diseases of the blood and blood-forming organs and certain disorders involving the immune system; congenital malformations, deformations and chromosomal abnormalities; and factors influencing health status and contact with health services (except dialysis).
1.03 Injury and poisoning Data for this measure come from the AIHW’s analysis of the National Hospital Morbidity Database. Refer to notes for measure 1.02 regarding these data. Cause of injury is based on the first reported external causes where the principle diagnosis was injury, poisoning and certain other consequences of external causes (ICD-10-AM codes S00-T98).
Table 1.03.1: ‘Other accidental exposures’ includes: exposure to electrical current, radiation and extreme ambient air temperature and pressure (W85–W99), smoke, fire and flames (X00–X09), contact with heat and hot substances (X10–X19), contact with venomous animals and plants (X20–X29), exposure to forces of nature (X30–X39). ‘Other external causes’ includes: event of undetermined intent (Y10–Y34), legal intervention and operation of war (Y35–Y36), sequelae of external causes of morbidity and mortality (Y85–Y89), supplementary factors classified elsewhere (Y90–Y98).
Figure 1.03-4: Data are reported by state/territory of usual residence of the patient hospitalised. Age-standardised rates for NSW, Vic, Qld, WA, SA, the NT and Australia have been calculated using the direct method, age-standardised by 5-year age groups to 75+. Age-standardised rates for Tasmania and the ACT have been
Technical appendix
216
calculated using the direct method, age-standardised by 5-year age group to 65+. As different age-groupings were used, rates for Tasmania and the ACT cannot be compared with the rates for NSW, Vic, Qld, WA, SA, the NT and Australia. In addition, rates for the ACT and Tasmania will fluctuate from year to year due to small number of hospitalisations for some conditions and should therefore be interpreted with caution.
1.04 Respiratory disease Data for this measure mainly come from the ABS and AIHW analysis of 2012–13 AATSIHS and the AIHW’s analysis of the National Hospital Morbidity Database. Refer to notes for measure 1.02 regarding these data. Exceptions are noted below. Categories are based on the ICD-10-AM eighth edition (ICD-10-AM codes J00–J99).
For this measure data from the 2012–13 AATSIHS was used rather than the 2014–15 NATSISS, in which long-term health condition data were only collected in a short module, and as such, are not considered to be the best estimates of prevalence for long-term health conditions.
Figure 1.04-1: ‘Outer regional’ includes remote Victoria. ‘Remote’ excludes remote Victoria. Remoteness area is based on the ABS’ 2011 Australian Statistical Geography Standard ASGS and relates to the patient’s usual residence. Rates by remoteness are calculated using AIHW derived populations using ABS population estimates and projections (Series B) based on the 2011 Census.
Figure 1.04-3: Rates for NSW, Vic, Qld, WA, SA and the NT have been age-standardised by 5-year age groups to 75+. Age-standardised rates for Tasmania and the ACT have been calculated by 5-year age groups to 65+. Comparisons between jurisdictions should therefore be interpreted with caution.
Figure 1.04-4 includes a non-Indigenous comparison between the AHS collected in 2011–12 and the AATSIHS collected in 2012–13.
Figures 1.04-5 and 1.04-6: Mortality data are derived from the ABS National Mortality Database. See technical appendix entry for measure 1.22 for more information.
1.05 Circulatory disease Data for this measure come from the ABS and AIHW analysis of 2012–13 AATSIHS, AIHW’s analysis of the National Hospital Morbidity Database, and ABS and AIHW analysis of the National Mortality Database. Refer to notes for measure 1.02 regarding hospitalisation data and notes for measure 1.22 and 1.23 regarding mortality data.
Data from the 2012–13 AATSIHS was used as it was measured through blood pressure tests rather than relying on diagnosed self-reported conditions as in the 2014-15 NATSISS.
Categories for hospitalisations and mortality are based on the ICD-10-AM eighth edition (National Centre for Classification in Health 2013): ICD-10-AM codes I00–I99.
Figure 1.05-1 and 1.05-2: Data reported in these figures is for people who reported having a current heart/circulatory problem which has lasted, or is expected to last, for 6 months or more. Data is from the AATSIHS core sample, which consists of the NATSIHS and NATSINPAS.
Figure 1.05-2 includes a non-Indigenous comparison between the AHS collected in 2011-2012 and the AATSIHS collected in 2012-13.
1.06 Acute rheumatic fever and rheumatic heart disease Data for this measure come from the NT, Qld, WA and SA Rheumatic Heart Disease Control Program registers. Data from the SA register are only recently available and subject to some limitations, including no breakdowns available by age or sex. The NT RHD register has been operating in the Top End since 1997 and in Central Australia since 2001 and currently provides the strongest source of data on ARF and RHD. Comparisons between jurisdictions should not be made given registers are at different stages of coverage and completion. Indigenous status unknown is included in non-
Indigenous numbers and rates. Crude rates per 1,000 for NT, Qld and WA are calculated using the total number of registrations for 2011–15 divided by the summed 30 June 2011, 2012, 2013, 2014 and 2015 populations based on the 2011 Census (series B estimates and projections). For SA, crude rates per 1,000 are calculated using the total number of registrations for 2013–15 divided by the summed 20 June 2013, 2014 and 2015 populations.
Figure 1.06-2: Hospitalisations with a principal diagnosis of acute rheumatic fever (I00–I02) or rheumatic heart disease (I05–I09).
1.07 High blood pressure The majority of the data in this measure is from the 2012–13 AATSIHS. This survey collected both measured blood pressure and self-reported blood pressure. The total prevalence of high blood pressure is the total people who reported having high blood pressure/hypertension (regardless of measured blood pressure) plus people who did not report having high blood pressure/hypertension but who had a measured blood pressure of 140/90 mmHg or above. The denominators used in calculating prevalence rates exclude those persons who did not report having high blood pressure/hypertension whose blood pressure was not measured.
Data from the 2012–13 AATSIHS was used as it was measured through blood pressure tests rather than relying on diagnosed self-reported conditions as in the 2014–15 NATSISS.
Refer to notes for measure 1.02 for information on hospitalisation data. ICD-10-AM codes I10–I15.
Figure 1.07-2: This figure presents the percentage Indigenous adults with a measured blood pressure of 140/90 mmHg or above (the number above each bar), and splits this into the percentage of those who reported having high blood pressure and those that did not.
Figure 1.07-3: This figure presents age-specific rates of those who had measured blood pressure of 140/90 mmHg or above and does not include self-report data. Total is age-standardised.
Figure 1.07-3 includes a non-Indigenous comparison between the AHS collected in 2011–12 and the AATSIHS collected in 2012–13.
1.08 Cancer Data for this measure come from the AIHW Australian Cancer Database and from ABS and AIHW analysis of the National Mortality Database. For information on the National Mortality Database, see notes for measure 1.22 and 1.23. For the AIHW Australian Cancer Database, data are reported for NSW, Vic, Qld, WA and the NT only. These five states and territories are currently considered to have adequate levels of Indigenous identification in cancer registry data for these periods. Data are presented in five-year groupings because of small numbers each year. Victorian data are of suitable quality from 2008 onwards so are only included for these years. The other four states and territories are included for all the years presented.
Figure 1.08-1: ICD-10 Codes for malignant neoplasms (cancer) include: C00–C97, D45, D46, D47.1, D47.3. Other malignant neoplasms include neoplasms of bone and articular cartilage (C40–C41); melanoma & other neoplasms of skin (C43–C44); neoplasms of mesothelial and soft tissue (C45–C49); neoplasms of eye, brain and other parts of central nervous system (C69–C72); neoplasms of thyroid and other endocrine glands (C73–C75); malignant neoplasms of independent (primary) multiple sites (C97).
Figure 1.08-2: Refer to notes for measure 1.22 for information on mortality time series data.
Figures 1.08-3 and 1.08-4: Results reported in this table may differ from those in jurisdictional reports because the underlying data may have been extracted from the master databases at different times. Jurisdictional results reported in these figures may be affected by variations in self-reported Indigenous status. Incidence rates are directly age-standardised using the 2001 Australian Standard Population, by 5 year age group to 75+.

Technical appendix
217
Figure 1.08-6: The 5-year crude survival rate is the percentage of people who are still alive 5 years after their cancer diagnosis. The rates were calculated by the period method using the period 2004–12.
1.09 Diabetes Data for this measure come from the 2012–13 AATSIHS and the 2014–15 National Hospital Morbidity Database. Data from the 2012–13 AATSIHS was used as it was measured through blood tests rather than relying on diagnosed self-reported conditions as in the 2014–15 NATSISS.
Figure 1.09-3 includes a non-Indigenous comparison between the AHS collected in 2011–12 and the AATSIHS collected in 2012–13.
1.10 Kidney disease The key data for this measure come from the Australian and New Zealand Dialysis and Transplant Registry. Indigenous identification in the Registry is based on self-identification in hospital records. However, because of the heightened awareness of the extent of renal disease in Aboriginal and Torres Strait Islander peoples and the prolonged and repeated contact with renal units in hospitals, it is believed that Indigenous identification in the Registry is more complete than in general hospital data. Uses calendar year reporting. Total rates are directly age-standardised using the Australian 2001 standard population. Age-standardised rates have been calculated using the direct method, age-standardised by 5-year age groups to 65 years and over (except for time series which use 5-year age groups to 75 years and over). Data are presented in 3-year groupings because of small numbers each year, except for time series in which single years are reported.
1.11 Oral health Data for this measure come from the 2012–13 AATSIHS, 2014–15 NATISS, the National Hospital Morbidity Database and the 2010 Child Dental Health Survey.
Figure 1.11-1: Data are from the 2012–13 AATSIHS. Self-reported data, consisting of persons reporting whether they have lost any of their adult teeth (excluding wisdom teeth), and if so, how many. ‘Complete tooth loss’ is comprised of persons who responded they have lost all of their adult teeth. ‘Loss of one or more teeth’ doesn’t include complete tooth loss. Excludes not stated responses.
Figure 1.11-2: Refer to notes for measure 1.02 for information on hospitalisation data. Dental problem categories are based on ICD-10-AM codes K02, K81, Z012. Data includes public and private hospitals in all jurisdictions. Data are directly age-standardised using the Australian 2001 standard population. Rates calculated based on 2011 Census. Excludes separations with care types 7.3, 9 and 10.
Figures 1.11-3 and 1.11-4: Data are from the 2010 Child Dental Health Survey. Data are for NT, Qld, SA, Tas, WA and ACT. Data for NSW and Vic not available.
1.12 HIV/AIDS, hepatitis and sexually transmissible infections Data for this measure (except for HIV/AIDS data) come from the National Notifiable Disease Surveillance System. A major limitation of the notification data is that, for most diseases, they represent only a proportion of the total cases occurring in the community, that is, only those cases for which health care was sought, a test conducted and a diagnosis made, followed by a notification to health authorities. The degree of under-representation of all cases is unknown and is most likely variable by disease and jurisdiction. ‘Diagnosis date’ was used to define the period of analysis. This date represents either the onset date or where the date of onset was not known, the earliest of the specimen collection date, the notification date, or the notification received date. In interpreting these data, it is important to note that changes in notifications over time may not solely reflect changes in disease prevalence or incidence. Changes in testing policies; screening programmes, including the preferential
testing of high risk populations; the use of less invasive and more sensitive diagnostic tests; and periodic awareness campaigns may influence the number of notifications that occur over time. Rates have been directly age-standardised using the Australian 2001 standard population using 5-year age groups up to age 65+. Uses calendar year reporting. Data are presented in two-year or three-year groupings due to small numbers each year. ‘Other Australians’ includes notifications for non-Indigenous Australians and those for whom Indigenous status was not stated.
Not all notifications of chlamydial infection, gonococcal infection, and syphilis are sexually acquired. The national case definitions for these infections do not specifically distinguish between sites of infection or modes of transmission.
Figure 1.12-1: The supplied data for Chlamydia for NT is for genital infections only. From 1 July 2013, the national case definition for Chlamydia excludes ocular infections. Hepatitis C data includes ‘newly acquired’ and ‘unspecified’ infections identified under two disease codes ‘040’ and ‘053’. Hepatitis B data includes ‘newly acquired’ and ‘unspecified’ infections identified under two disease codes ‘039’ and ‘052’. Hepatitis B data is presented from 2007–09—prior to 2005 data is considered insufficient quality for reporting.
Figure 1.12-2: Data are from the National HIV Registry. Data are presented in three-year groupings because of small numbers each year. Rates have been directly age-standardised using the 2001 Australian population.
Figure 1.12-3: Chlamydia data are reported for Qld, WA, SA and the NT. Gonorrhoea data are reported for Victoria, Qld, WA, SA, the NT, Tasmania and the ACT. These jurisdictions are considered to have adequate levels (>50% identification) of Indigenous identification in the respective data. They do not represent a quasi-Australian figure.
Figure 1.12-4: Hepatitis B data are reported for WA, SA, the NT, the ACT and Tasmania and includes ‘newly acquired’ and ‘unspecified’ infections identified under two disease codes (‘039’ and ‘052’). Hepatitis C data are reported for WA, SA, the NT and Tasmania (>50% identification) and includes ‘newly acquired’ and ‘unspecified’ infections identified under two disease codes (‘040’ and ‘053).
1.13 Community functioning Data for this measure come from the 2002, 2008 and 2014–15 NATSISS.
Table 1.13-1: Unless otherwise indicated percentages are of the estimated total Aboriginal and Torres Strait Islander population aged 15 years and over. Note that for some data items the HPF differs from the Overcoming Disadvantage Report due to the HPF excluding not stated responses from the denominator.
1.14 Disability The key data for this measure come from the 2014–15 Social Survey, the 2012–13 Health Survey, and the 2011 Census. The Surveys collected data on a broad definition of disability (i.e. those reporting a limitation, restriction, impairment, disease or disorder that has lasted, or expected to last, for 6 months or more which restricts everyday activities). Results are self-reported and therefore could be under-stated.
The 2011 Census collected data on one element of disability—those reporting the need for assistance with core activities. Results therefore may understate the proportion of people with a disability. The Census measure of ‘need for assistance with core activities’ is conceptually comparable to the SDAC measure of severe or profound core or activity limitation.
The 2014–15 Social Survey, 2012–13 Health Survey, 2011 Census and 2012 Survey of Disability, Ageing and Carers data provide prevalence rates while the Disability Services NMDS is service use rate.

Technical appendix
218
Figure 1.14-1: Data for this figure come from the self-reported data from the 2014–15 Social Survey. Totals are directly age-standardised.
Table 1.14-1: Note that more than one disability type may be reported and thus the sum of the components may add to more than the total.
1.15 Ear health For this measure data from the 2012–13 AATSIHS was used rather than the 2014–15 NATSISS, in which long-term health condition data were only collected in a short module, and as such, are not considered to be the best estimates of prevalence for long-term health conditions.
For this measure, deafness comprises complete deafness, partial deafness and hearing loss not elsewhere classified.
Ear or hearing problems comprise diseases of the ear and mastoid including deafness, otitis media, other diseases of the middle ear and mastoid, Meniere’s disease, other diseases of the inner ear and other diseases of the ear.
Figure 1.15-1: Refer to notes for measure 1.02 for information on hospitalisation data. ICD-10-AM codes H60–H95.
Figure 1.15-2: Data come from the annually conducted Bettering the Evaluation And Care of Health (BEACH) survey (now discontinued). Data include five combined BEACH years April 2010–March 2011 to April 2014–March 2015 inclusive. Classified according to the International Classification of Primary Care (ICPC-2) codes: H00–H99—Acute otitis media/myringitis = H71; other ear infections = H70, H72, H73, H74; hearing loss = H28, H84, H85, H86; other diseases of the ear = H01–H27, H29–H69, H75–H83, H87–H99.
Table 1.15-1 includes non-Indigenous data from the 2011–12 AHS and Indigenous data from the 2012–13 AATSIHS.
1.16 Eye health Data in this measure are mainly from self-reported data from the 2012–13 AATSIHS and from eye examinations from the 2016 National Eye Health survey.
For this measure adult data from the 2012–13 AATSIHS was used rather than the 2014–15 NATSISS, in which long-term health condition data were only collected in a short module, and as such, are not considered to be the best estimates of prevalence for long-term health conditions.
The National Eye Health survey was conducted from March 2015 to April 2016 by the Centre for Eye Research Australia and Vision 2020 Australia. The survey was designed to assess the prevalence of the main eye conditions causing vision loss including cataract, diabetic retinopathy, refractive error and trachoma/trichiasis, as well as the prevalence of glaucoma and age-related macular degeneration. This survey included a sample of 4,836 people in private dwellings across Australia, including 3,098 non-Indigenous Australians aged 40 years and over and 1,738 Indigenous Australians aged 50 years and over, across 30 geographic areas.
Additionally, data are used from the previously annually conducted GP survey (BEACH) (now ceased). Classified according to ICPC-2 chapter codes: F01–99. Data from five combined BEACH years April 2010–March 2011 to April 2014–March 2015 inclusive.
Medicare data has also been explored in relation to eye health services for Indigenous Australians with diabetes. Medicare data are adjusted for under-identification of Indigenous Australians in the Voluntary Indigenous Identifier (VII) database. MBS data excludes eye examinations and procedures provided in the public health system or under other arrangements that do not attract an MBS claim (e.g. some AMS and state/territory health services) and MBS items for eye health services may be used for a range of conditions besides diabetes (and reasons are not reported). Additionally, there is no specific MBS item to identify all people with diabetes and the proxy measure used only captures those who claimed a specific
diabetes test within a two-year period. For example, in 2013–15, an estimated 28,400 Indigenous Australians claimed the MBS diabetes test, which is lower than the AATSIHS 2012–13 estimate of 49,100 Indigenous Australians having diabetes.
Figure 1.16-1: Data come from the 2016 National Eye Health Survey by cause of bilateral vision impairment for Indigenous adults 40 years and over and non-Indigenous adults 50 years and over.
Figure 1.16-2: Data come from the 2016 National Eye Health Survey by bilateral vision impairment by remoteness for Indigenous adults 40 years and over and non-Indigenous adults 50 years and over.
Figure 1.16-3: Data come from the 2016 National Eye Health Survey for adherence rates to the National Health and Medical Research Council diabetic eye examination guidelines by Indigenous status and remoteness. Current NHMRC guidelines recommend a diabetic eye examination annually for Aboriginal or Torres Strait Islander persons with diabetes and at least every 2 years for non-Indigenous Australians with diabetes.
Figure 1.16-4: Data come from the National Trachoma Surveillance and Reporting Unit (NTSRU) and was collected from screening in remote Aboriginal communities during 2014 in the NT, SA, WA and NSW. Caution must be taken when interpreting trachoma prevalence as screening was undertaken in predominantly remote and very remote communities designated as being at risk of endemic trachoma.
1.17 Perceived health status Data from this measure are based on self-report data from ABS and AIHW analysis of the 2014–15 NATSISS.
Figures 1.17-1, 1.17-2 data includes non-Indigenous data from the 2014–15 NHS and Indigenous data from the 2014–15 NATSISS.
Figure 1.17-4: Long-term health conditions is based on self-reported data consisting of persons reporting a current medical condition which has lasted, or is expected to last, for six months or more.
1.18 Social and emotional wellbeing Data for this measure come from the 2014–15 NATSISS, AIHW’s analysis of the National Hospital Morbidity Database and ABS and AIHW analysis of the ABS National Mortality database.
Figure 1.18-1: Level of psychological distress is based on the Kessler-5 (K5) measure of psychological distress. Overall levels of distress are based on frequency responses to the following five questions about feelings in the last 4 weeks:
1. About how often did you feel nervous?2. About how often did you feel without hope?3. About how often did you feel restless or jumpy?4. About how often did you feel everything was an effort?; and 5. About how often did you feel so sad that nothing could cheer you
up?As per the standard approach to scoring K-6 and K-10 items, the five psychological distress items are then scored from 1 for ‘none of the time’ to 5 for ‘all of the time’. These scores are then summed, yielding a scale with a minimum score of 5 (where response was ‘none of the time’ to all five questions) and a maximum score of 25 (where response was ‘all of the time’ to all five questions). The data are usually presented as two dichotomous groups—‘low/moderate’ (scores of 5 to 11.9) and ‘high/very high’ (scores of 12.0 to 25).
Figure 1.18-1: includes non-Indigenous data from the 2011–12 AHS and Indigenous data from the 2012–13 AATSIHS.
Figure 1.18-4: See measure 1.22 for notes. ICD-10 codes: X60-X84, Y87.0
Figures 1.18-5 and 1.18-6: Categories are based on the ICD-10-AM eighth edition (National Centre for Classification in Health 2013) and previous editions: ICD-10-AM codes F00–F99, G30, G47.0, G47.1, G47.2, G47.8, G47,9, 099.3, R44, R45.0, R45.1, R45.4, R48, Z00.4, Z03.2, Z04.6, Z09.3, Z13.3, Z50.2, Z50.3, Z54.3, Z61.9, Z63.1, Z63.8,

Technical appendix
219
Z63.9, Z65.8, Z65.9, Z71.4, Z71.5, Z76.0. Refer to notes for measure 1.02 regarding hospital data.
1.19 Life expectancy at birth Data for this measure is sourced from ABS Life Tables for Aboriginal and Torres Strait Islander Australians, 2010–12, Cat. no. 3302.0.55.003.
Life expectancy at birth is the average number of years that a group of newborn babies would be expected to live if current death rates remain unchanged. This is a modelled estimate and serves as a guide to the health of the population.
Almost all deaths in Australia are registered; however, the quality of Indigenous status in deaths data varies over time and between jurisdictions. The volatility of Indigenous status recording in the Census also contributes to uncertainty in population estimates. These data issues, together with the small size of the Indigenous population, have led to problems calculating accurate Indigenous life expectancy estimates. As a result of improvements in methods of addressing data quality issues, there have been different estimates of the gap in life expectancy over the last decade, including 20 years, 17 years and 10–12 years. The latest publication includes revised estimates for 2005–07 and for the first time a time series. For details of technical issues refer to the ABS publication.
1.20 Infant and child mortality For 2015 mortality data, the Queensland Registry of Births, Deaths and Marriages included Medical Certificate of Cause of Death information for the first time to contribute to the Indigenous status data item. This was associated with a decrease in the number of deaths for which the Indigenous status was ‘not stated’ and an increase in the number of deaths identified as Indigenous in Queensland. Although the Indigenous child mortality rate was higher in Queensland in 2015, for New South Wales, Western Australia and South Australia the rates were lower in 2015 than in 2014. This change in method means that time series data for Queensland are not directly comparable and caution should be used in interpreting the trend.
Data for this measure come from the ABS National Mortality Database (see notes for measure 1.22). Infant mortality rates are per 1,000 live births. ‘Infant’ includes persons with an age at death of under 1 year. For child mortality tables (0–4 years), the denominator for single year time series data is a three-year rolling average to account for an anomaly in the 2011 Indigenous population estimate for this age group. For current period reporting (2011–15), the denominator is the average of the population estimates for these five years.
Table 1.20-2: ‘Other conditions’ include: neoplasms; diseases of blood and blood-forming organs; endocrine, nutritional and metabolic diseases; mental and behavioural disorders; diseases of the nervous system; diseases of the eye and adnexa; diseases of the ear and mastoid process; diseases of the digestive system; diseases of the musculoskeletal system and connective tissues; diseases of the genitourinary system; and diseases of the skin and subcutaneous tissue.
1.21 Perinatal mortality Data for this measure come from the ABS National Mortality Database. This database contains details of all deaths registered in Australia including information on fetal (stillbirths) and neonatal deaths (deaths occurring in live births up to 28 days of age) by age of the baby, sex, state/territory of birth, Indigenous status and cause of death (ICD-10). Also, refer to notes for measure 1.22 for more information on mortality data. Perinatal deaths are all fetal deaths (at least 20 weeks’ gestation or at least 400 grams birthweight) plus all neonatal deaths (death of a live-born baby within 28 days of birth). Perinatal death rates are calculated per 1,000 births for the calendar year.
Figure 1.21-3: From 2014, cells with small values have been randomly adjusted to protect confidentiality. Some totals will not equal the sum of their components. Cells with 0 values have not been affected by confidentialisation.
1.22 All causes age-standardised death rates Mortality data are derived from the ABS National Mortality Database. Current period data cover the period 2011–15 and are reported for NSW, Qld, WA, SA and the NT combined. Data are presented in 5-year groupings because of small numbers each year. Time trends are also presented for the five jurisdictions for 1998–2015. These states and territories are considered to have adequate levels of Indigenous identification in mortality data for these periods. Time series data are presented for single years.
For 2015 mortality data, the Queensland Registry of Births, Deaths and Marriages included Medical Certificate of Cause of Death information for the first time to contribute to the Indigenous status data item. This was associated with a decrease in the number of deaths for which the Indigenous status was ‘not stated’ and an increase in the number of deaths identified as Indigenous in Queensland. Although the Indigenous child mortality rate was higher in Queensland in 2015, for New South Wales, Western Australia and South Australia the rates were lower in 2015 than in 2014. This change in method means that time series data for Queensland are not directly comparable and caution should be used in interpreting the trend.
Death rates are age-standardised death rates per 100,000 population using the 2001 Australian Estimated Resident population, by 5-year age group to 75 years and over. Non-Indigenous estimates are available for Census years only. In the intervening years, Indigenous population figures are derived from assumptions about past and future levels of fertility, mortality and migration. In the absence of non-Indigenous population figures for these years, it is possible to derive denominators for calculating non-Indigenous rates by subtracting the projected Indigenous population from the total population. Non-Indigenous population estimates have been derived by subtracting the 2011 Census-based Indigenous population projections from the 2011 Census-based total persons estimated resident population (ERP). Such figures have a degree of uncertainty and should be used with caution, particularly as the time from the base year of the projection series increases.
Age-specific death rates per 100,000 are not age-standardised. Care should be taken when interpreting mortality rates for Qld due to recent changes in the timeliness of birth and death registrations. Qld deaths data for 2010 have been adjusted to minimise the impact of late registration of deaths on mortality indicators.
Although most deaths of Aboriginal and Torres Strait Islander peoples are registered, it is likely that some are not accurately identified as Indigenous. Therefore, these statistics are likely to underestimate the Indigenous mortality rate. Time series analysis may also be affected by variations in the recording of Indigenous status over time. It is also difficult to identify the exact difference between the Indigenous and non-Indigenous mortality rates because of these data quality issues. Deaths prior to 2007 are by year of registration and state/territory of usual residence. Deaths from 2007 onwards are by reference year and state/territory of usual residence. Registration year prior to 2007 is equivalent to reference year from 2007 onwards. All causes of death data from 2007 onward are subject to a revisions process; once data for a reference year are ‘final’, they are no longer revised. Affected years are: 2011–12 (final), 2013 (revised), and 2014–15 (preliminary).
Table 1.22-1: Data for these five jurisdictions over-represent Indigenous populations in less urbanised and more remote locations. Mortality data for the five jurisdictions should not be assumed to represent the experience in the other jurisdictions.
Figure 1.22-2: Data are reported for Australia-level remoteness areas as a breakdown of remoteness areas by state/territory is not

Technical appendix
220
available for Aboriginal and Torres Strait Islander population estimates or projections. Remote areas include very remote and remote areas of Australia.
Figure 1.22-3: Potential years of life lost (PYLL) is an estimate of the number of additional years a person would have lived had they not died before a certain age, such as 75 years. Consequently, PYLL give greater weight to deaths in younger age groups. The impact these early deaths have at the population level can be measured by the PYLL number per 1,000 people, which totals all the potential years of life lost for all the deaths at each age group, divided by the number of people in that age group. The ‘gap’ is the difference between the PYLL rate for Indigenous and non-Indigenous populations.
1.23 Leading causes of mortality Refer to notes for measure 1.22 for more information on mortality data. Causes of death are based on the tenth revision of the International Classification of Diseases (ICD-10). It should be noted that different causes may have different levels of under-identification that differ from the ‘all-cause’ coverage rates. It should also be noted that the quality of the cause of death data depends on every step of the process of recording and registering deaths (including the documentation available at each step of the process) from certification of death to coding of cause of death.
Chronic conditions are select ICD-10-AM mortality groups as defined by the Office for Aboriginal and Torres Strait Islander Health, 2009 and includes circulatory disease, cancer, endocrine/metabolic/nutritional disorders (including diabetes), respiratory diseases, digestive diseases, kidney diseases and nervous system diseases. The gap in mortality due to chronic conditions is for 2015 and is calculated as the difference in the rate of chronic disease between Indigenous and non-Indigenous Australians as a proportion of the rate difference for all causes. Chronic conditions accounted for 70% of Indigenous deaths in the time period 2011–15.
Table 1.23-1: Data for lung cancer, cervical cancer and digestive organ cancers are a subset of the data presented for all cancers. Data for diabetes are a subset of data presented for all endocrine, metabolic and nutritional disorders. Data for cervical cancer are for females only. ‘Other causes’ includes: diseases of the blood and blood-forming organs and certain disorders involving the immune system, mental & behavioural disorders, diseases of the eye and adnexa, diseases of the ear and mastoid process, diseases of the skin & subcutaneous tissue, diseases of the musculoskeletal system and connective tissue, diseases of the genitourinary system (excluding kidney diseases), pregnancy, childbirth & the puerperium, congenital malformations, deformations and chromosomal abnormalities; and symptoms, signs and abnormal clinical findings not elsewhere classified.
Figure 1.23-1: Some of the cells within this figure have been randomised to ensure confidentiality of data. ABS recommends cells with small values be interpreted with caution. ICD-codes for external causes cover V01–Y98 with the categories: Intentional self-harm (X60–X84, Y87.0), Transport accidents (V01–V99), Accidental drowning or accidental threats to breathing (W65–W84), Accidental poisoning by and exposure to noxious substances (X40–X49), and Assault (X85–Y09, Y87.1). ‘Other external causes’ includes all other external causes of death not presented elsewhere in this table.
Table 1.23-2: Data presented for acute myocardial infarction are a subset of data presented for ischaemic heart disease. Data presented for stroke are a subset of data presented for cerebrovascular disease in this table. Data presented for bowel cancer are a subset for all cancers of the digestive organs. Data presented for bronchus and lung cancer are a subset of data presented for all respiratory and intrathoracic organs. Data presented for cancer of the cervix are a subset of data presented for all cancers of the female genital organs in this table. ‘Other
malignant neoplasms’ includes neoplasms of bone and articular cartilage; melanoma and other neoplasms of skin; neoplasms of mesothelial and soft tissue; neoplasms of eye, brain and other parts of central nervous system; neoplasms of thyroid and other endocrine glands; and malignant neoplasms of independent (primary) multiple sites. Data presented for COPD and asthma are a subset of data presented for all chronic lower respiratory diseases.
1.24 Avoidable and preventable deaths Refer to notes for measure 1.22 and 1.23 for information on mortality data. This measure presents data for Potentially Avoidable Deaths as defined in the National Healthcare Agreement PI 16 for 2015. It includes deaths from conditions that are potentially preventable through individualised care and/or treatable through existing primary or hospital care. Due to changes in the specification of the indicator, data presented here are not comparable with that in previous HPF reports.
Table 1.24-1: Selected invasive infections consists of ICD-10 codes A38–A41, A46, A48.1, G00, G03, J02.0, J13–J16, J18, L03. The avoidable mortality classification includes Acute lymphoid leukaemia/Acute lymphoblastic leukaemia (C91.0) for those aged 0–44 years only. This cause has been included in only the relevant age groups and the subset included in the total.
Determinants of Health (Tier 2) 2.01 Housing Households are considered overcrowded if one or more additional bedrooms are required to satisfy the Canadian National Occupancy Standard. Proportions have been calculated on all occupied private dwellings excluding those where number of bedrooms was not stated and includes not stated state/territory if the categorisation is not based on state/territory. Persons exclude visitors and persons in households for which housing utilisation could not be determined.
Figure 2.01-4: ‘Private/other’ renter includes dwellings being rented from a real estate agent, parent/other relative or other person, dwellings being rented through a Residential park (includes caravan parks and marinas), government employer (includes Defence Housing Authority) and other employer (private).
2.02 Access to functional housing with utilities Data for this measure are derived from the 2014–15 National Aboriginal and Torres Strait Islander Social Survey (NATSISS).
Figure 2.02-1: Note that rising damp has been excluded from major structural problems to enable time series comparisons.
Figure 2.02-3: Indigenous households reporting a lack of working facilities for each of the first 4 Healthy Living Practices: ‘Washing people’ comprises households lacking a working bath or shower. ‘Washing clothes/bedding’ comprises households lacking washing machine and/or laundry tub. ‘Storing/preparing food’ comprises households without working stove/oven/cooking facilities or a kitchen sink or a working refrigerator. ‘Sewerage facilities’ comprises households lacking a working toilet. Excludes households for which information about working facilities was not reported.
There were differences in the question methodology between NATSISS 2002, 2008, 2014-15 and AATSIHS 2012–13 when asking about functional household facilities. In 2002, households were asked about the presence of working facilities and in 2008, 2012–13 and 2014–15 households were asked about the absence of working facilities.
In 2002, households were asked if they had adequate kitchen cupboard space as part of the food preparation facilities question. Households were not asked this in 2008, 2012–13 and 2014–15. Therefore, when comparing the proportion of households with working facilities for preparing food between 2002 and 2008, 2012–13 and 2014–15, caution should be used.
Figure 2.02-4: An acceptable standard of housing is defined as a household with four working facilities (for washing people, for

Technical appendix
221
washing clothes/bedding, for storing/preparing food and sewerage) and not more than two major structural problems.
2.03 Environmental tobacco smoke Table 2.03-1: The question of ‘Whether any regular smokers smoke at home indoors’ was only asked of respondents with a daily smoker in the household. Therefore, the ‘No’ category for ‘Whether any regular smokers smoke at home indoors’ does not include non-smoking households or households where smoking occurs less than daily.
All figures exclude households in which the smoking status of members was not stated. Results only represent daily smokers in household (do not include smoking that is less than daily).
2.04 Literacy and numeracy The data from this measure are from the National Assessment Program—Literacy and Numeracy (NAPLAN). Equating one test with another is a complex procedure and involves some degree of statistical error. For this reason, there may be minor fluctuations in the average NAPLAN test results from year to year when, in reality, the level of student achievement has remained essentially the same. It is only when there is a meaningful change in the results from one year to the next, or when there is a consistent trend over several years, that statements about improvement or decline in levels of achievement can be made confidently.
Some caution is required when interpreting changes in the performance across years as a new persuasive writing scale was introduced in 2011. The persuasive writing results for 2011 should not be directly compared with the narrative writing results from earlier years. Therefore, writing results are not reported toward the Closing the Gap target for reading, writing and numeracy, as they cannot be compared to the 2008 baseline.
Data for this report have been based on the annual NAPLAN results for 2008 to 2016. It is important to note that trends in results for Indigenous students will be impacted by changes in the levels of participation in NAPLAN. Participation rates are generally lower for Indigenous students, particularly in jurisdictions with more people living in remote areas.
2.05 Education outcomes for young people Data for this measure come from the AIHW analysis of the ABS National Schools Statistics Collection (NSSC). Apparent retention rate is Year 10 or 12 students as a proportion of the corresponding cohort from the first year of secondary schooling (Year 7/8). NSSC data is sourced from the administrative records of relevant state and territory education systems. Accordingly, changes in administrative methods and systems can impact on the coherence of these statistics over time. In particular, the accuracy of identification of Aboriginal and Torres Strait Islander students can vary significantly between jurisdictions and over time. The following factors have not been taken into account in these statistics: students repeating a year of education; migration and other net changes to the school population, enrolment policies (including year starting high school which contributes to different age/grade structures between states and territories); and inter-sector transfer and interstate movements of students. In small jurisdictions, relatively small changes in student numbers can create apparently large movements in retention rates.
Table 2.05-1: The inclusion or exclusion of part-time students can also have a significant effect on apparent retention rates, especially in SA, Tasmania and the NT, which have relatively large proportions of part-time students. Data in various jurisdictions may be affected by changes in scope and coverage or processing methodology over time. Some rates, particularly those in the ACT may exceed 100%, largely reflecting the movement of students from non-government to government schools in Years 11 and 12, and of residents who choose to enrol in a school in a different state or territory to which
they reside e.g. NSW residents from surrounding areas enrolling in ACT schools. Note results over 100% have been set to 100%.
2.06 Educational participation and attainment of adults Figure 2.06-1: ‘Technical or Further Education’ includes TAFE/VET/technical college, business college, and industry skills centre. Data comes from the 2014–15 NATSISS for the Indigenous Australian results and 2014 GSS for the non-Indigenous data.
Figure 2.06-2: ‘Completed year 9 or below’ includes persons never attended school. Excludes those still attending secondary school.
Figure 2.06-3: The data come the Higher Education Statistics Collection which records details of students enrolled and completing courses in higher education institutions.
Figure 2.06-4: The data come from the National Centre for Vocational Education Research. Non-identification rates for Aboriginal and Torres Strait Islander status in these data are high. Care also needs to be taken when comparing data across jurisdictions for load pass rates, as average module durations vary across jurisdictions. Percentages are calculated using the Indigenous and non-Indigenous estimated resident populations for 2011. Data represent number of completions and students may complete more than one course. Includes statements of attainment. The 2013 completions data was affected by under-reporting of completions in NSW due to reporting issues associated with the implementation of a new student administration and learning management system at TAFE NSW.
Figure 2.06-5: Qualifications are as classified under the ABS Classification of Qualifications. ‘Bachelor degree or above’ includes bachelor degree, doctorate, masters, graduate diploma, graduate certificate.
2.07 Employment The labour force comprises all people contributing to, or willing to contribute to, the supply of labour. This includes the employed (people who have worked for at least 1 hour in the reference week) and the unemployed (people who are without work, but have actively looked for work in the last four weeks and are available to start work). The remainder of the population is not in the labour force. The labour force participation rate is the number of people in the labour force as a proportion of the working age population (15–64 years). The unemployment rate is the number of unemployed people as a proportion of the labour force. The employment to population ratio, also referred to as the employment rate, is employed people as a proportion of the population aged 15–64 years.
The Community Development Employment Program (CDEP) was included in the ABS classification of employment for the period that it operated.
‘Not stated’ responses are excluded.
2.08 Income Figure 2.08-1: Equivalised household income quintile boundaries for the total population were derived from the 2014–15 National Health Survey and adjusted for Consumer Price Index (CPI) increases between the 2014–15 enumeration period of the National Health Survey and the 2014–15 enumeration period of the National Aboriginal and Torres Strait Islander Social Survey. These are lowest quintile $0–$435 per week; second quintile $436–$675 per week; third quintile $676–$1,018 per week; fourth quintile $1,019–$1,550 per week; highest quintile $1,551 or more per week. These have been applied to both the Indigenous and non-Indigenous populations.
Figure 2.08-2: Equivalised household income quintile boundaries for the total population as derived from the 2004–05 National Health Survey are: lowest quintile less than $295 per week; second quintile $295–$478 per week; third quintile $479–$688 per week; fourth

Technical appendix
222
quintile $689–$996 per week; highest quintile $997 or more per week. These have been applied to both the Indigenous and non-Indigenous populations.
Equivalised household income quintile boundaries for the total population as derived from the 2008–09 Survey of Income and Housing are: lowest quintile less than $330 per week; second quintile $330–$561 per week; third quintile $562–$835 per week; fourth quintile $836–$1,240 per week; highest quintile $1,241 or more per week. These have been applied to both the Indigenous and non-Indigenous populations.
Non-Indigenous: Equivalised household income quintile boundaries for the total population as derived from the 2011–13 Australian Health Survey are: lowest quintile less than $399 per week; second quintile $399–$638 per week; third quintile $639–$958 per week; fourth quintile $959–$1,437 per week; highest quintile $1,438 or more per week. Indigenous: Equivalised household income quintile boundaries for the total population were derived from the 2011–13 Australian Health Survey and adjusted for Consumer Price Index (CPI) increases between the 2011–12 enumeration period of the National Health Survey and National Nutrition and Physical Activity Survey and the 2012–13 enumeration period of the National Aboriginal and Torres Strait Islander Health Survey. These are: lowest quintile less than $407 per week; second quintile $407-$651 per week; third quintile $652-$978 per week; fourth quintile $979-$1,467 per week; highest quintile $1,468 or more per week.
Figures 2.08-3 and 2.08-4—see notes for Figure 2.08-1.
Figure 2.08-5: Adjusted for changes in the Consumer Price Index. Factors applied to change nominal dollar values to 2014–15 dollars for data collected earlier than 2014–15 are as follows: For all 2002 data, the adjustment is 1.373340. For all 2004–05 data, the adjustment is 1.306023. For all 2008 data, the adjustment is 1.154179. For 2011–13, adjustment for data from the 2011–12 Australian Health Survey is 1.071478, and 1.044499 for data from the 2012–13 Australian Aboriginal and Torres Strait Islander Health Survey.
2.09 Index of Disadvantage The population of some states/territories was unable to be split into exact quintiles based on the SEIFA index of advantage/disadvantage. In all except one of these cases, the best approximate quintiles were calculated. Approximate population quintiles based on the SEIFA index of advantage/disadvantage were unable to be calculated for Tasmania because of the population spread.
2.10 Community safety Figure 2.10-1: Data are from the AIHW’s analysis of the National Hospital Morbidity Database. Refer to notes for measure 1.02 regarding these data. Causes of injury are based on the first reported external cause as ‘assault’ (ICD-10-AM codes X85–Y08), where the principal diagnosis was ‘injury and poisoning’ (S00–T98).
Figure 2.10-2: Refer to notes for measure 1.22 for information on mortality data. ICD–10 codes X85–Y09 and Y87.1.
Figures 2.10-3 and 2.10-4: sourced from Recorded Crime—Victims, Australia 2015 (ABS cat. no. 4510.0) published in June 2016. This publication presents national statistics relating to victims of crime for a selected range of offences as recorded by police. Offences are classified according to the Australia and New Zealand Standard Offence Classification (ANZSOC). Relationship of offender to victim information is not currently available for WA, and there are some inconsistencies in relationship of offender to victim data across jurisdictions. All family and domestic violence related assaults are recorded even if the victim does not want to proceed with an assault charge.
2.11 Contact with the criminal justice system Figures 2.11-1, 2.11-2 and 2.11-4: Data are from the AIHW Juvenile Justice National Minimum Dataset. Rates are based on AIHW
juvenile justice data. Aboriginal and Torres Strait Islander peoples in juvenile justice are calculated using population estimates based on the 2006 Census (Series B). Age is calculated at the start of the financial year if the period of detention began before the start of the financial year. Otherwise age is calculated as at the start of the period of detention. For the ACT, single year of age population data was not available for rate calculations. Excludes WA and the NT.
Figure 2.11-5 and Table 2.11-1: Data are from the ABS National Prison Census. The ABS collects data from administrative records on people in prison custody on 30 June each year in all jurisdictions. This Census includes all prisoners in adult corrective services, but not persons in juvenile institutions, psychiatric care or police custody. These data provide a picture of persons in prison at a point in time and does not represent the flow of prisoners during the year.
Table 2.11-1: Rates are number per 10,000 adult population.
Figure 2.1-5: Age-standardised to the 2001 Australian population. In June 2013, the ABS ‘recast’ the historical ERP data for the September 1991 to June 2011 period, as a response to a methodological improvement in the Census Post-Enumeration Survey. In April 2014, the ABS ‘recast’ the historical estimates for Aboriginal and Torres Strait Islander populations. As a result, the rates per 100,000 adult persons in the source table have been recast, and all now use final ERP data based on the 2011 Census. In all states and territories except Qld, persons remanded or sentenced to adult custody are aged 18 years and over. Persons under 18 years are treated as juveniles in most Australian courts and are only remanded or sentenced to custody in adult prisons in exceptional circumstances. Prior to 2006, in Victoria, an adult referred to persons aged 17 years and over. Prior to 2000, in Tasmania, an adult referred to persons aged 17 years and over. In Qld, adult continues to be defined as persons aged 17 years and over. Individual state and territory data and national data reflect the age scope that applied to these jurisdictions in the relevant years. Apparent increases in 2006 may be due to changes in collecting and recording Indigenous information, or in the willingness of Indigenous people to self-identify.
2.12 Child protection Rates are calculated using Indigenous projections based on the 2011 Census of Population and Housing and should not be compared with rates calculated using ERPs or projections based on previous Censuses.
Figure 2.12-1: WA is currently unable to report a child’s characteristics based on their first substantiation. As a result, a small number of children may be double-counted in this table where they have more than one substantiation and the notifications had differing characteristics such as age or abuse type. In WA, Tasmania and the ACT, the proportion of substantiations for children with an unknown Indigenous status affects the reliability of these data. Indigenous populations sourced from ABS’ 2014 Estimates and Projections, Aboriginal and Torres Strait Islander Australians, 2001–2026 Series B. (ABS cat. no. 3238.0). December Indigenous populations are calculated as the average of the June population projections either side of the December. For example, the December 2012 population for Indigenous children is the average of the June 2012 and June 2013 population projections. All children populations are derived from the ABS’ 2014 Australian Demographic Statistics, December 2013 release (ABS cat. no. 3101.0). Non-Indigenous populations are derived by subtracting the Indigenous projection count from the ‘all children’ ERP. Data produced from the CP NMDS based on nationally agreed specifications may not match Queensland figures published elsewhere. Queensland data for 2014–15 onward are not comparable with data for previous years.
Figure 2.12-2 and Table 2.12-1: Indigenous populations sourced from ABS’ 2014 Estimates and Projections, Aboriginal and Torres Strait Islander Australians, 2001–2026 Series B. (ABS cat. no. 3238.0). All children counts are derived from the ABS’ 2013

Technical appendix
223
Australian Demographic Statistics, June 2013 release (ABS cat. no. 3101.0). Non-Indigenous counts are derived by subtracting the Indigenous projection count from the ‘all children’ ERP.
Figure 2.12-3: This figure does not include Aboriginal and Torres Strait Islander children who were living independently or whose living arrangements were unknown. Family group homes and residential care are reported under ‘other caregiver’.
2.13 Transport Table 2.13-6: ‘Total’ for Psychological distress excludes a small number of people for whom level of psychological distress was unable to be determined. Tables 2.13-7, 2.13-8, and 2.13-9, 2: ‘Total’ includes those who never go out or are housebound. Table 2.13-10: ‘Total’ includes not known and those who never go out or are housebound. Main reason for not using public transport was asked of people who had not used public transport in last 2 weeks but who had access to public transport in their area and were not housebound. ‘Other reasons’ includes takes too long, concerned about personal safety, costs too much, treated badly/discrimination and other reasons not further defined.
2.14 Indigenous people with access to their traditional lands Data for this measure are derived from the 2014–15 NATSISS. Results represent only those people who answered on behalf of themselves, and excludes refusals and not asked. Estimates have been rounded and discrepancies may occur between sums of component items and totals.
Figure 2.14-1: excludes refusals and not asked.
2.15 Tobacco use This measure presents self-reported data for Aboriginal and Torres Strait Islander peoples, the most recent source being the 2014–15 Social Survey. ‘Current smoker’ includes persons who smoke daily, weekly or other regular pattern (but less than weekly). Data are presented for those aged 15 years and over.
Figure 2.15-1: Data for non-Indigenous Australians are sourced from the 2014–15 NHS. Proportions have been directly age-standardised to the 2001 Australian ERP (based on the 2001 Census, using 10-year age groups to 55+) to account for differences in the age structure of the two populations. Rate differences between Indigenous and non-Indigenous Australians were statistically significant across all age groups.
Figure 2.15-2: Also includes data from the 2002 and 2008 NATSISS and the 2012–13 AATSIHS. Rate differences between 2002 and 2014–15 were statistically significant for Non-remote areas and Australia but not for Remote areas.
Figure 2.15-3: Also includes data from the 2002 and 2008 NATSISS and the 2012–13 AATSIHS. Data are presented for current smokers (as defined above), ex-smokers (don’t currently smoke, but had regularly smoked daily, or had smoked at least 100 cigarettes, or smoked pipes/cigars at least 20 times in their lifetime) and non-smokers (never smoked, never smoked regularly, smoked less than 100 cigarettes in their lifetime). Rate differences between 2002 and 2014–15 were significant for current smokers and ex-smokers but not for those who never smoked.
Figure 2.15-4: This figure presents relationships between being a non-smoker and selected socio-economic factors:
• SEIFA (Index of Advantage/Disadvantage)• Education (Highest year of school completed). Note Year 10 or
below includes those who never attended school.• Income (equivalised gross household income). Quintile
boundaries for total population were derived from the 2014–15NHS and adjusted for CPI increases between the enumerationperiods for the 2014–15 NHS and NATSISS. The first/lowestquintile: $0–435 per week; second quintile: $436–$675 per week;third quintile $676–$1,018 per week; fourth quintile: $1,019-
$1,550 per week and fifth/highest quintile: $1,551 or more per week).
• Employment status (unemployed/employed).
Table 2.15-1: Also includes data from the 1994 NATSIS, the 2002 and 2008 NATSISS and 2012–13 AATSIHS. For the 1994 NATSIS, respondents were not asked how frequently they smoked cigarettes; for the other years presented, data are based on current smokers as defined above. Data is only available for those aged 18 years and over in the 2004–05 Health Survey, so it has been excluded.
Figure 2.15-5: Data are presented by Indigenous Region. For the Alice Springs Indigenous Region, 2012–13 AATSIHS data has been used because the Alice Springs sample used in the 2014–15 Social Survey was too small.
Figure 2.15-6: Time-series data for Indigenous Australians sourced from 1994 NATSIS, 2002, 2008 and 2014–15 NATSISS and 2012–13 AATSIHS. For Non-Indigenous Australians, data sourced from the 1989–90, 1995, 2001, 2007–08, 2011–12 (core), and 2014–15 National Health Surveys. The rate differences between Indigenous and non-Indigenous Australians are statistically significant at each time point. The declines for both Indigenous and non-Indigenous Australians over the periods presented are also statistically significant. This figure also includes key tobacco control measures, both Indigenous-specific and mainstream; though state/territory legislation (often introduced over a span of years) have mostly been excluded (e.g. smoke-free outdoor dining and pubs; smoke free cars)
2.16 Risky alcohol consumption Data from this measure are sourced from the 2014–15 Social Survey, 2012–13 Health Survey and 2011–12 National Health Survey component. Risk level calculated on exceeding the NHMRC Australian Alcohol Guidelines 2009. For short-term/single occasion risk this is 5 or more standard drinks on any day over the last 12 months. For lifetime risk, this is consuming more than two standard drinks per day on average.
Figure 2.16-4: Refer to notes for measure 1.22 regarding mortality data. ICD-10 codes: K70, F10, X45, X65, Y15, E24.4, G31.2, G62.1, G72.1, I42.6, K29.2, K86.0
2.17 Drug and other substance use including inhalants Data for this measure come from the 2014–15 Social Survey, 2012–13 Health Survey, non-Indigenous data from the 2013 AIHW National Drug Strategy Household Survey, and various other sources including the Drugs Use Monitoring in Australia (DUMA) programme run by the Australian Institute of Criminology (AIC) with funding by the Australian Government. The DUMA programme data used in this publication were made available through the AIC and were originally collected by the AIC by an independent data collector with the assistance of the NSW, Qld, SA and WA Police. Neither the collectors, the police, nor the AIC bear any responsibility for the analyses or interpretations presented herein.
Table 2.17-1: In non-remote areas substance use questions were self-completed by respondents whereas in remote areas respondents were asked questions in a personal interview. Proportions exclude not stated responses (people who accepted the substance use form but did not state if they had ever used substances) and 9% of Aboriginal and Torres Strait Islander people who did not complete the substance use module. ‘Total used substances in last 12 months’ includes heroin, cocaine, petrol, LSD/synthetic hallucinogens, naturally occurring hallucinogens, ecstasy/designer drugs, other inhalants and methadone. Sum of components may be more than total as the same person may have reported more than one type of substance used in the last 12 months.

Technical appendix
224
2.18 Physical activity The most recent data on physical activity come from the National Aboriginal and Torres Strait Islander Nutrition and Physical Activity Survey (NATINPAS) and the NATSIHS, collected through the AATSIHS 2012–13. Comparison data for non-Indigenous have been sourced from the National Nutrition and Physical Activity Survey (NNPAS), 2011–12 component of the AHS.
Current physical activity guidelines (released by the Department of Health) recommend the following:
Supervised floor-based play in safe environments should be encouraged from birth to one year. Toddlers (1–3 years) and pre-schoolers (3–5 years) should be physically active every day for at least three hours, spread throughout the day. Children aged 5–17 years should accumulate at least 60 minutes of moderate to vigorous intensity physical activity every day. Adults aged 18–64 years should accumulate 150 to 300 minutes (2 ½ to 5 hours) of moderate intensity physical activity or 75 to 150 minutes (1 ¼ to 2 ½ hours) of vigorous intensity physical activity, or an equivalent combination of both moderate and vigorous activities, each week. Adults aged 65 years and over should aim to be physically active for 30 minutes every day.
The Guidelines also provide recommendations around sedentary behaviours:
Children younger than 2 years of age should not spend any time watching television or using other electronic media (DVDs, computer and other electronic games). For children 2 to 5 years of age, sitting and watching television and the use of other electronic media should be limited to less than one hour per day. Infants, toddlers and pre-schoolers (all children birth to 5 years) should not be sedentary, restrained, or kept inactive, for more than one hour at a time, with the exception of sleeping. Children aged 5–17 years should limit the use of electronic media to no more than two hours a day. It is recommendations that adults break up long periods of sitting as often as possible.
Definitions of physical activity levels:
In the AATSIHS 2012–13, respondents are classified as inactive if no walking, moderate or vigorous intensity physical activity was reported in the week prior to interview. Insufficiently active is defined as some activity but not enough to reach the levels required for ‘sufficiently active’; and ‘sufficiently active (for health)’ is defined as 150 minutes of moderate/vigorous physical activity from five or more sessions over a seven-day period.
Figure 2.18-3: The physical activity recommendation for children aged 5–17 years is 60 minutes or more per day. This figure shows the proportion of children who met the recommendations on all 3 days prior to interview.
Figure 2.18-4: The screen-based recommendation for children aged 5–17 years is no more than 2 hours per day for entertainment purposes. This figure shows the proportion of children who met the recommendations on all 3 days prior to interview.
2.19 Dietary behaviours The National Health and Medical Research Council revised their Australian Dietary Guidelines in 2013. The guidelines specify recommendations for adequate minimum daily intake of fruit and vegetables according to age and sex. Where the guidelines specify ½ serves, respondents in the 2014–15 NATSISS must have stated that they consumed the next whole number of serves per day in order to meet the guidelines. Note this is different to the AATSIHS 2012–13 where the respondents were only required to meet the serving as rounded down to the closest full serve. Only full serves were collected. The following table summarises the NATSISS variation to the NHMRC Australian Dietary Guidelines:
NATSIS variation to the NHMRC Australian Dietary Guidelines
Age groups Recommended daily serves of vegetables
Recommended daily serves of fruit
2-3 years 2.51 1 4-8 years 4.51 1.51 9-17 years 52 2 18 years and over (excl. males 18–49)
5.53 2
18–49 year-old males 6 2 1 In the 2014–15 NATSISS, the respondent must have stated they consume at least the next whole number of serves per day to have reached the guidelines. 2 Actual guidelines for males aged 12–17 years have an additional ½ serve. 3 Actual guidelines exclude males aged 19–50 years and males 51–70 years have an additional ½ serve.
See NATSISS: Users Guide for further information (ABS, 2016). For the purposes of time series analysis, the definition of ‘recommended daily vegetable/fruit intake’ is calculated in accordance with the guidelines that are current for the relevant time period. AATSIHS data has been classified in line with the NATSISS to ensure consistency over time.
2.20 Breastfeeding practices Data for this measure (except exclusive breastfeeding) are derived from the 2014–15 NATSISS.
Data for exclusive breastfeeding come from the AIHW analysis of the 2010 Australian National Infant Feeding Survey. The sample size for this survey was 28,759 mothers/carers, including 401 (1.4%) mothers/carers who identified as Aboriginal and Torres Strait Islander; 28,214 who identified as non-Indigenous; and 144 (0.5%) whose Indigenous status was missing. The survey was a national survey, and as such no population sub-group was oversampled (e.g. Aboriginal and Torres Strait Islander peoples). The sampling frame for the survey was Medicare enrolment database. If there was a delay in infants or children to enrol for Medicare, these infants/children were excluded from the population. The survey used mail survey method to collect data (with an option of online completion). The survey instrument was in English language only. Mothers/carers who could not read or write and did not seek help from others could not participate in the survey.
Figure 2.20-4: ‘Age (months)’ indicates an infant’s age in the months before a fluid other than breast milk was introduced. This is effectively the month before another fluid was introduced. For example, a child who was introduced to water when they were aged 4 months (in their fifth month of life) was exclusively breastfed to 4 months of age (that is, they had 4 completed months of exclusive breastfeeding). Similarly, a child who was introduced to water at age 1 month (in their second month of life) was exclusively breastfed to 1 month. Or, a child who was introduced to water at 0 months (in their first month of life) was exclusively breastfed to 0 months (or less than 1 month).
Figure 2.20-5: Includes children for whom breastfeeding status was not known.
2.21 Health behaviours during pregnancy Figures 2.21-1 and 2.21-2 are from the 2014 National Perinatal Data Collection (Refer to notes for measure 1.01 regarding perinatal data). Data include women who gave birth in the period, whether resulting in a live or stillbirth, if the birthweight is at least 400 grams or the gestational age is 20 weeks or more. Provisional data were provided by Victoria. Mother’s tobacco smoking status during pregnancy is self-reported. Percentages are calculated after excluding records with missing or null values. Excludes data where Indigenous status not stated.
Figure 2.21-1: Data are directly age-standardised using the Australian female population who gave birth in 2011 as the standard

Technical appendix
225
population. Data exclude non-residents, external territories and not-stated residence.
Figure 2.21-2: Data exclude mothers for whom maternal age was not stated.
Figure 2.21-3: Excludes data for Victoria, as these data were not available before 2009. Data are based on state/territory of birth.
Figure 2.21-4 are from the 2014–15 NATSISS. Data are collected for mothers of Indigenous children aged 0–3 years.
2.22 Overweight and obesity All figures published by ABS in Australian Aboriginal and Torres Strait Islander Health Survey: Updated results, released 6 June 2014 (ABS cat. no. 4727.0.55.006). Measured BMI data are only available for 2012–13.
Proportions exclude those for whom BMI was unknown or not stated (16.2% for Aboriginal and Torres Strait Islander peoples and 15.7% for non-Indigenous Australians aged 15 years and over).
Figure 2.22-1: Directly age-standardised proportions to the Australian 2001 standard population.
Figure 2.22-3: For information on the calculation of BMI scores for children see the ABS publication glossary.
The AATSIHS 2012–13 also collected data on waist circumference and waist-to-hip ratio of adults. These measurements can indicate the amount of excess fat carried around the abdomen, which indicates potential for developing certain chronic diseases related to overweight and obesity. The AATSIHS found 62% of Indigenous Australian men and 81% of Indigenous Australian women were considered to be at increased risk of developing chronic disease based on their waist circumference. Refining the risk assessment by using waist circumference in addition to BMI suggests that 85% of Indigenous Australian men who were overweight or obese and 97% of Indigenous Australian women who were overweight or obese were considered to be at increased risk of developing chronic disease.
Health System Performance (Tier 3) 3.01: Antenatal care Data for this measure come from the National Perinatal Data Collection (see measure 1.01 for more information). Data represent one calendar year. Data includes women who gave birth in the period to a live or stillborn baby who weighed at least 400 grams and/or whose gestational age was 20 weeks or more. Data exclude births where the mother’s Indigenous status was not stated. Antenatal visits relate to care provided by skilled birth attendants for reasons related to pregnancy. Data on care in the first trimester excludes women whose gestation at first antenatal visit was not stated. First trimester is up to and including 13 completed weeks. Data on antenatal care provided in the first trimester is likely to be under reported for WA and ACT
Figure 3.01-1 uses age-standardised data. This time series excludes data from NSW due to a change in data collection practices from 2011. Data are based on place of usual residence of mother. The collection of data on the number of antenatal visits is not part of the Perinatal NMDS. The current question is not consistent across jurisdictions; therefore, caution should be used when interpreting the data. Rates are per 100 women who gave birth in the relevant period directly age-standardised using the Australian female population who gave birth in 2001
Figures 3.01-2, 3.01-3 and 3.01-4: Data are directly age-standardised using the Australian female population who gave birth in 2014 as the standard population. For figures 3.01-2 and 3.01-3: Data are by place of usual residence of the mother. Excludes Australian non-residents, residents of external territories and not stated state/territory of residence.
Additionally, for Figure 3.05-3 For WA and ACT the first antenatal visit is reported by birth hospital or first hospital visit (respectively); therefore, data may not be available for women who attend their first antenatal visit outside the birth hospital or GP.
3.02 Immunisation Data in this measure are based on the Australian Childhood Immunisation Register (ACIR), which is managed by Medicare Australia and holds information on childhood immunisation coverage. All children under seven years of age who are enrolled in Medicare are automatically included on the ACIR. Children who are not eligible to enrol in Medicare can be added to the ACIR when details of a vaccination are received from a doctor or immunisation provider.
Coverage estimates for Aboriginal and Torres Strait Islander children include only those who identify as such and are registered on the ACIR. Children identified as Aboriginal and Torres Strait Islander on the ACIR may not be representative of all Aboriginal and Torres Strait Islander children, and thus coverage estimates should be interpreted with caution. Children for whom Indigenous status was not stated are included with the non-Indigenous children under the ‘other’ category.
Vaccination coverage is a measure of the proportion of people in a target population who have received the recommended course of vaccinations at a particular age as specified in the National Immunisation Program (NIP) Schedule. Since 2001, there have been changes in the definitions used to determine whether a child is considered to be fully immunised. The age at which older children are assessed has also changed from 6 years to 5 years of age. As a result, some trends should be interpreted with caution.
Vaccination coverage data from the ACIR and the 2012–13 AATSIHS results are not directly comparable because of the differences in the cohort used, population coverage, data collection method, method of calculating ‘fully immunised’ and vaccines included.
Figure 3.02-1: Data not available for children at age 6 years for 2001. From 2008, fully vaccinated status for 5 year olds is reported in place of that for 6 year olds, due to changes to NCIR reporting practices. From December 2013 the definition of the term ‘fully immunised’ includes pneumococcal for ACIR coverage reporting purposes, for those in the ‘Age 1 year’ cohort.
Table 3.02-1: Age calculated as at 30 September 2015; 1 year includes children aged 12–<15 months; 2 year includes children aged 24–<27 months and 5 year include children aged 60–<63 months.
Figure 3.02-2: Data for Indigenous Australians sourced from the 2012–13 AATSIHS. For the total population, data sourced from the 2009 Adult Vaccination Survey.
3.03 Health promotion Figure 3.03-1 and 3.03-2: These data come from the 2012–13 AATSIHS. Proportions are of those who consulted a doctor in the previous 12 months. Given multiple response was allowed, the sum of components may exceed the total.
3.04 Early detection and early treatment Figure 3.04-1: Rates were calculated using ABS backcast population estimates and projections based on the 2011 Census. MBS item 715 commenced May 2010—MBS codes 704, 706, 708 and 710 were reclassified as 715 for prior years. Financial year reporting.
Figure 3.04-2: Data are from BreastScreen Australia. For each period presented (two combined calendar years), rates are the number of women screened as a percentage of the eligible female population calculated as the average of the current and previous year’s ABS estimated resident population. Rates are directly age-standardised to the Australian 2001 standard population in 5-year age groups up to 69 years. ‘Other women’ includes women in the ‘not stated’ category for Aboriginal and Torres Strait Islander status. Indigenous

Technical appendix
226
status is self-reported; therefore, accuracy of Indigenous participation rates will be affected if women choose not to identify as Indigenous at the time of screening. These rates are likely to differ from Indigenous population data used by individual states and territories; this may result in different participation rates for Indigenous women between this report and state and territory data. Small numbers in individual states and territories will exacerbate any differences in published rates based on different population data.
Figure 3.04-3: Self-reported data from the 2012–13 AATSIHS. Proportion of women reporting that they have regular pap smear tests (frequency not qualified/quantified). Excludes not stated responses and ‘form not answered’.
Table 3.04-1: Data sourced from National Bowel Cancer Screening Program Register as at 31 December 2015. The FOBT positivity rate is the proportion of those with a valid screening test that had a positive FOBT result. The diagnostic assessment rate is the proportion of those with a positive FOBT result that received a follow-up diagnostic assessment (colonoscopy). Diagnostic assessment rate relies on information being reported back to the Register. As NBCSP forms are not mandatory there may be incomplete form return and incomplete data.
3.05 Chronic disease management Figure 3.05-1 and 3.05-2: Medicare data presented by Indigenous status have been adjusted for under-identification in the Medicare Australia Voluntary Indigenous Identifier (VII) database. The methodology for this adjustment was developed and verified by the AIHW and the Department of Health for assessment of MBS and PBS service use and expenditure for Aboriginal and Torres Strait Islander peoples. Data are directly age-standardised using the 2001 Australian standard population, by 5-year age group up to 75 years and over. Data are based on date-of-processing (rather than date-of-service).
Figure 3.05-3: Sourced from May 2015 national Key Performance Indicator data. Data presented for around 32,930 Aboriginal and Torres Strait Islander peoples aged 15 years and over who are regular clients of Indigenous primary health care organisations. A regular client is defined as a person who has an active medical record—that is, a client who attended the primary health care organisation at least 3 times in the last 2 years. (Note limitation for clients who attend multiple health organisations). Valid data for this indicator were provided by around 210 organisations. Data indicate blood pressure and HbA1c (glycosylated haemoglobin) recorded in previous 6 months and kidney function tests (estimated glomerular filtration rate (eGFR) and/or albumin/creatinine ratio (ACR) tests) in previous 12 months to May 2015. The normal range for eGFR is ≥60 mL/min/173m2.
3.06 Access to hospital procedures Data for this measure come from the AIHW’s analysis of the National Hospital Morbidity Database. Refer to notes for measure 1.02 regarding hospital data. Data in this measure are presented as a proportion of hospital separations and not as a population rate. Proportions are age-standardised.
Table 3.06-1: Hospitalisations with a principal diagnosis of dialysis (Z49) have been excluded.
Figure 3.06-2: Hospitalisations with a principal diagnosis of dialysis (Z49) or diagnosis not stated have been excluded.
Figure 3.06-3: Percentages are the proportion of hospitalisations with coronary heart disease as the principal diagnosis receiving either coronary angiography or coronary revascularisation.
3.07 Selected potentially preventable hospital admissions Data for this measure come from the AIHW’s analysis of the National Hospital Morbidity Database. Refer to notes for measure 1.02 regarding hospital data. Rates in the figures are age-standardised.
Categories are based on the ICD-10-AM eighth edition (National Centre for Classification in Health 2013): codes J10, J11, J13, J14, A08.0, A35, A36, A37, A80, B01, B05, B06, B16.1, B16.9, B18.0, B18.1, B26, J45, J46, I50, I11.0, J81, E10.0–E10.9, E11.0–E11.9, E13.0–E13.9, E14.0–E14.9, J20, J41, J42, J43, J44, J47, J20, I20, I24.0, I24.8, I24.9, D50.1, D50.8, D50.9, I10, I11.9, E40, E41, E42, E55.0, E64.3, I00, I01, I02, I05, I06, I07, I08, I09, J15.3, J15.4, J15.7, J16.0, N10, N11, N12, N13.6, N15.1, N15.9, N28.9, N39.0, K25.0, K25.1, K25.2, K25.4, K25.5, K25.6, K26.0, K26.1, K26.2, K26.4, K26.5, K26.6, K27.0, K27.1, K27.2, K27.4, K27.5, K27.6, K28.0, K28.1, K28.2, K28.4, K28.5, K28.6, L02, L03, L04, L08, L88, L98.0, L98.3, N70, N73, N74, H66, J02, J03, J06, J31.2, K02, K03, K04, K05, K06, K08, K09.8, K09.9, K12, K13, K14.0, G40, G41, R56, O15, R02, I70.24, E09.52. Note some of these codes are for principal diagnosis only, some are for principal or additional diagnosis, and some are principal diagnosis with the exclusion of some procedure codes.
For more information on coding used, refer to the AIHW National Healthcare Agreement, PI-18 Selected potentially preventable hospitalisations, 2015.
Due to coding changes in the 8th edition there may be a large increase in separations with a diagnosis of Hepatitis B, therefore time series data for vaccine-preventable conditions are not presented.
3.08 Cultural competency Figure 3.08-1: These data come from the Online Service Reporting (OSR) data collection. 2014–15 OSR data count all auspice services individually when calculating rates, therefore caution should be exercised when comparing rates with earlier data collection periods. Valid data on health activities were provided by 203 Indigenous primary health care organisations. The percentages supplied in this table are calculated as a proportion of these 203 services. Mechanisms for gaining high level advice on cultural matters affecting service delivery include local cultural advisory body, Board sub-committee that includes Aboriginal staff/local community members and/or Board members. Multiple response item, sum is greater than total.
Figure 3.08-2: Rate per 10,000 measures the health workforce available (numerator) to service the population (denominator). Denominator used in rates is the relevant Census count by Indigenous status minus those where occupation is not stated.
Figure 3.08-3: More than one response was allowed; therefore, the sum may exceed 100%. Estimates for access to dentists were asked of persons aged 2 years and over and estimates for access to mental health services were asked of persons aged 18 years and over.
Table 3.08-1: Self-reported data from the 2012–13 AATSIHS. More than one response allowed for ‘reason for not going to health care provider’; sum of components may exceed total. ‘Other health professional’ include: nurse, sister, and Aboriginal (and Torres Strait Islander) health worker. For ‘Dentist’ data includes persons aged 2 years and over. For ‘Counsellor’ data includes persons aged 18 years and over; data excludes ‘not asked’. ‘Total Health Services’ includes persons who reported that they needed to go to a dentist (persons aged 2 years and over), Doctor, other health professional, hospital, or counsellor (persons aged 18 years and over) in the last 12 months, but did not go.
Figure 3.08-4: Self-reported data from the 2014–15 Social Survey. People aged 15 years and over who consulted a doctor or specialist in the previous 12 months. Note an additional response category (‘rarely’) was included in the 2014–15 Social Survey, so data should not be compared with previous years.
3.09 Discharge against medical advice Data for this measure come from AIHW’s analysis of the National Hospital Morbidity Database. Refer to notes for measure 1.02 regarding hospital data. Data in this measure are presented as a proportion of hospital separations and not as a population rate.

Technical appendix
227
Proportions are age-standardised. Hospitalisations with a principal diagnosis of dialysis (Z49) or mental and behavioural disorders (F00–F99, R44, R48, G30) have been excluded.
Figure 3.09-4: ‘Other’ includes: neoplasms, certain conditions originating in the perinatal period, diseases of the ear and mastoid process, diseases of the eye and adnexa, diseases of the genitourinary system, diseases of the musculoskeletal system, diseases of the blood and blood-forming organs and certain disorders involving the immune system, and congenital malformations and deformations and chromosomal abnormalities.
3.10 Access to mental health services Figure 3.10-1: Data from five combined BEACH years (April 2010–March 2011 to April 2014–March 2015 inclusive). ‘Mental health-related problems’ classified according to ICPC-2 codes (Classification Committee of the World Organization of Family Doctors (WICC) 1998) and/or ICPC-2 PLUS codes. Data for Aboriginal and Torres Strait Islander peoples and other Australians have not been weighted. Rates were directly age-standardised (number per 1,000 encounters) using total BEACH encounters in the period as the standard. ‘Other Australians’ includes non-Indigenous patients and patients for whom Indigenous status was not stated. ICPC–2 codes: P04–P05, P07–P13, P18, P20, P22-P25, P27–P69, P71, P75, P77–P82, P85–P86, P98–P99.
Figure 3.10-2: The data for this figure come from the AIHW National Community Mental Health Care Database (NCMHCD). The quality of the Indigenous identification in this database varies by jurisdiction and should be interpreted with caution. Rates were directly age-standardised using the Australian 2001 standard population. Number per 1,000 population based on estimated resident population as at 30 June 2014.
Figures 3.10-3 and 3.10-4: Refer to notes for measure 1.02 regarding hospitalisation data. Mental health related conditions included are based on the ICD-10-AM eighth edition (National Centre for Classification in Health 2013) and previous editions: ICD-10-AM codes F70–F79; F20–F29; F00–F09; F99; F50–F59; F30–F39; F60–F69; F10–F19; F80–F89; F40–F49; F90–F98; F00–F99; G30, G47.0, G47.1, G47.2, G47.8, G47.9, O99.3, R44, R45.0, R45.1, R45.4, R48, Z00.4, Z03.2, Z04.6, Z09.3, Z13.3, Z50.2, Z50.3, Z54.3, Z61.9, Z63.1, Z63.8, Z63.9, Z65.8, Z65.9, Z71.4, Z71.5, Z76.0. Principal diagnosis code used.
3.11 Access to alcohol and other drug services Table 3.11-1: Refer to notes for measure 3.03 for information on the OSR data collection. 27 of the 63 respondent Indigenous substance-use services provided valid data for the number of residential treatment/rehabilitation episodes of care. Twelve services provided valid data for the number of sobering-up/residential respite episodes of care; 57 services provided valid data for the number of non-residential/follow-up/aftercare episodes of care. Excludes 466 episodes of care that had unknown Indigenous status. Substance-use clients and episodes of care for 2014–15 are lower than those reported for 2012–13 in the previous HPF report. One type of Patient Information and Recall System was not extracting correct substance-use data for non-residential services in some organisations. Substance-use clients and episodes of care in the previous report were over-estimated as a result of this.
Figure 3.11-1: Refer to notes for measure 3.03 for information on the OSR data collection. Of the 63 respondent Aboriginal and Torres Strait Islander substance use services, 27 provided valid data for the number of residential treatment/ rehabilitation episodes of care; 12 services provided valid data for the number of sobering-up/residential respite episodes of care; and 57 services provided valid data for the number of non-residential/follow-up/aftercare episodes of care. Excludes 466 episodes of care that had unknown Indigenous status (3 for residential treatment/rehabilitation, 298 for sobering-up/residential respite and 165 for non-residential/follow-up/aftercare).
Substance-use clients and episodes of care for 2014–15 are lower than those reported for 2012–13 in the previous HPF report. One type of Patient Information and Recall System was not extracting correct substance-use data for non-residential services in some organisations. Substance-use clients and episodes of care in the previous report were over-estimated as a result of this.
Figure 3.11-2: Sourced from the national AODTS NMDS.
Figure 3.11-3: Refer to notes for measure 1.02 regarding hospitalisation data. For principal diagnoses related to alcohol use, includes ICD-10-AM codes: F10, K70, T51, K75, X65, X45, Y15. For principal diagnoses related to drug use, includes ICD-10-AM codes: T36–T40, T42–T43, T52, F11–F15, F18–F19, P961, C171 and 0355.
3.12 Aboriginal and Torres Strait Islander people in the health workforce Table 3.12-1: Self-reported data from the 2011 Census. The table includes a detailed breakdown of occupations as defined by the Australian and New Zealand Classification of Occupations (ANZSCO). ‘n.a.’ means data not available. ‘n.p.’ refers to data not published (data cannot be released due to quality issues and confidentiality). Numbers less than 10 are considered too unreliable for general use due to the impact of randomisation of small cell values to avoid the release of confidential data. Per cent change between the reporting periods 1996 and 2011 based on the average annual change over the period. (Average period change of Indigenous health workforce numbers determined using regression analysis). Rate per 10,000 measures the health workforce available (number) to service the population (denominator). Denominator used in rates is the 2011 Census count by Indigenous status minus those where occupation is not stated. Rate difference is non-Indigenous rate minus Indigenous rate.
Both 2001 and 2006 figures for ‘Registered Nurses’ include Midwifery and Nursing Professionals not further defined (nfd).
‘Generalist Medical Practitioners’ includes General Medical Practitioner and Resident Medical Practitioner, and Specialist Physician (general medicine).
The 2006 data for ‘Other medical practitioners’ includes Anaesthetist, Pathologist, Psychologist, Neurosurgeon, and Medical Practitioners nfd. The 2001 figure includes Emergency Medical Specialist, Obstetrician and Gynaecologist, Pathologist, Radiologist, Psychiatrist, Surgeon (General), Medical Practitioners nfd and the 1996 figure includes Specialist Medical Practitioner.
The 2006 data for ‘Psychologist’ includes Clinical Psychologist, Psychotherapist, Educational Psychologist, Organisational Psychologist, Psychologist nfd and Psychologist nec. However, both the 1996 and 2001 figures are Clinical Psychologist and Psychotherapist combined.
The 2006 data for ‘Other health therapy professionals’ includes Chiropractor, Osteopath, Homeopath, Naturopath, Complementary Health Therapists not elsewhere classified (nec). The 2001 figure includes Chiropractor and Naturopath and the 1996 figure includes Chiropractor and Natural Therapy Professionals.
‘Health Promotion Officers’ could not be identified separately in 2001 and 1996 due to different occupation classifications. These were included in Community Workers in 2001 and 1996 and not included in the table.
The 2006 data for ‘Other health diagnostic and promotion professionals’ includes Health Professionals nfd and Health Diagnostic and Promotional Professionals nfd.
The 2006 data for ‘Health services managers’ includes Medical Administrators only. Health and Welfare Services Managers nec and Health and Welfare Services Managers nfd were included in Other. The 2001 data for Medical Administrators could not be published separately due to quality issues and has been included in Other. The 1996 figure is for Medical Administrators.

Technical appendix
228
‘Nursing Support Worker and Personal Care Workers’ includes Therapy Aide, and in 2006 includes Hospital Orderly, which in 2001 and 1996 was grouped with Nursing Assistants and Personal Care Assistants occupations because there was no such category.
In 2006, ‘Other’ includes Medical Laboratory Scientist, Counsellors nec, Medical Laboratory Technician, Anaesthetic Technician, Cardiac Technician, Operating Theatre Technician, Pharmacy Technician, Medical Technicians nec, Optical Dispenser, Optical Mechanic, Diversional Therapist, Massage Therapist, Personal Carers and Assistants nfd, Special Care Workers nfd, Natural Remedy Consultant. The 2001 figure includes Health Information Manager, Medical Laboratory Scientist, Medical Technical Officer, Primary Products Inspector, Anatomist or Physiologist, Safety Inspector, Admissions Clerk, Weight Loss Consultant, Massage Therapist, Natural Remedy Consultant. The 1996 figure includes Health Information Manager, Medical Laboratory Scientist, Medical Laboratory Technician, Medical Technicians nec, Primary Products Inspector, Safety Inspector, Admissions Clerk, Weight Loss Consultant, Massage Therapist, Natural Remedy Consultant.
For some occupations, such as Nurses, Medical Practitioners, and Pharmacists, there are slight differences between the 2006 figures in this table and those in the Health and Community Services Labour Force 2006, and the Aboriginal and Torres Strait Islander Health Labour Force Statistics and Data Quality Assessment reports. These discrepancies are due to the impact of aggregating randomised data from data sets with different small cell distributions and the use of different occupation classifications (in the case of the second report).
3.13 Competent governance Table 3.13-1: The data for this table come from the Office of the Registrar of Indigenous Corporations (ORIC). In 2014–15, compliance analysis was able to be completed for 86 companies incorporated under the Corporations (Aboriginal and Torres Strait Islander) Act 2006 and registered with ORIC.
Table 3.13-2 and Table 3.13-3: Refer to notes for measure 3.03 for information on the OSR data collection.
Table 3.13-3: Questions were not applicable for all services. Percentage was calculated based on the number of services that have a governing committee or board (163 of the 203 organisations providing primary health care services and 65 of the 67 organisations providing substance use services).
3.14 Access to services compared with need Figure 3.14-1: Data come from the ABS and AIHW analysis of the ABS National Mortality Database and the 2015–16 Medicare data. Rate ratios for avoidable mortality (Refer to measure 1.22 for further notes and rate ratios for avoidable mortality data). Medicare data is for non-referred GP (total) claims. Indigenous data has been adjusted for under-identification in the Medicare Australia Voluntary Indigenous Identifier (VII) database. Data have been directly age-standardised using the 2001 Australian standard population, by 5-year grouping up to 75 years and over. Rate ratio is the rate for Indigenous Australians divided by the rate for non-Indigenous Australians. The data show that although Indigenous Australians are up to around 4 times as likely to die from causes considered potentially avoidable given effective and timely health care, they are only accessing health care at slightly higher rates than non-Indigenous Australians. This reflects a potentially large unmet need for health care among Indigenous Australians.
Figure 3.14-2 and 3.14-3: See notes for measure 3.05 for information on Medicare data. Indigenous rates have been adjusted for under-identification in the Medicare Australia VII database. Data directly age-standardised using the 2001 Australian standard population, by 5-year age group up to 75+. Financial year data presented. Each year the Indigenous time-series will be re-based using the VII patients up to June of the current year. Rebasing is
seen as improving the time-series as the weighting sample size is increased each year and each patient identified will have all their MBS data flagged and weighted. If data is not rebased, then over time the comparison between time periods will become skewed.
Figure 3.14-3: Refer to notes for measure 3.03 for information on the OSR data collection. Average period change determined using regression analysis. Per cent change between 1999–2000 and 2014–15 based on the average annual change over the period. 2008–09 OSR data counts all auspice services individually when calculating rates, therefore caution should be exercised when comparing rates with earlier data collection periods. Eligible services only for 2007–08 services.
3.14-6: Refer to notes for measure 1.02 regarding hospitalisation data. Data includes public and private hospitals in all jurisdictions. Directly age-standardised using the Australian 2001 standard population. ‘Outer regional’ includes remote Victoria. ‘Remote’ excludes remote Victoria. Disaggregation by remoteness area is based on the ABS’ 2011 ASGS and relates to the patient’s usual residence. Rates by remoteness are calculated using the AIHW derived populations using the ABS population estimates and projections based on the 2011 Census.
Table 3.14-1: Self-reported data from the 2012–13 AATSIHS. More than one response allowed for ‘reason for not going to health care provider’; sum of components may exceed total. ‘Other health professionals’ include: nurse, sister, and Aboriginal (and Torres Strait Islander) health worker. For ‘Dentists’ data includes persons aged 2 years and over. For ‘Counsellors’ data includes persons aged 18 years and over; data excludes ‘not asked’. ‘Total Health Services’ includes persons who reported that they needed to go to a dentist (persons aged 2 years and over), Doctor, other health professional, hospital, or counsellor (persons aged 18 years and over) in the last 12 months, but did not go.
3.15 Access to prescription medicines Figure 3.15-2: Constant price health expenditure for 2011–12 to 2014–15 is expressed in terms of 2013–14 prices. Indigenous population estimates used to estimate the expenditure figures are all derived from 2011 Census base. For Pharmaceutical Benefits Scheme (PBS) data, improvements in the quality of the voluntary Indigenous identifier (VII) has resulted in a change of methodology. In the previous report, the VII data was adjusted for under identification based on patient counts (e.g. in the previous report the adjusted identification for PBS expenditure was 1.5% Indigenous). For the 2013-14 data it was assumed that the VII was complete enough to use and no adjustment was done. This accounts for the drop in PBS Indigenous expenditure when comparing results from the previous report.
Figure 3.15-3: Per person expenditure in Remote/Very remote & All regions varies due to the different populations in these regions. Expenditure per person in All regions is based on the Australia-wide population. ‘Other PBS special supply’ includes all other Australian Government benefits paid on pharmaceuticals that have not been classified to the other categories, including S100 drugs (excluding the Aboriginal health services component) and other programmes such as the Community Pharmacy and Pharmacy Awareness and Targeted Assistance Pharmaceutical Aids and Appliances.
3.16 Access to after-hours primary care Figures 3.16-1 and 3.16-2: Refer to notes for measure 3.05 for information on Medicare data. Data are directly age-standardised using the 2001 Australian standard population, by 5-year age group up to 75+. MBS items for after-hours care: 597, 598, 599, 600, 5000–5067 and 5200–5267. These data may double count after hours care provided in selected Emergency Departments claiming Medicare through Section 19.2.
Figure 3.16-3: Data from five combined BEACH years (April 2010–March 2011 to April 2014–March 2015 inclusive). ‘Other Australians’

Technical appendix
229
includes non-Indigenous patients and patients for whom Indigenous status was not stated. ‘Other’ arrangements also include ‘referral to other services’ which was removed as an option from April 2009 onwards. Subtotal is less than the sum of the components as GPs can have more than one type of after-hours arrangement. There were 2,900 encounters with after-hours arrangements missing (230 with Indigenous patients and 2,670 with Other patients).
Figure 3.16-4 and Table 3.16-1: The data come from the National Non-Admitted Patient Emergency Department Care Database (NNAPEDCD). As the scope of the NNAPEDCD has changed since 2013–14, comparison with earlier years should be with caution. Data include all types of visits at emergency departments. For 2014–15, it is estimated that about 88% of emergency occasions of service were reported to the NNAPEDCD (based on emergency occasions of service reported to the NNAPEDCD for 2013–14). An estimate of coverage for 2015–16 has not been calculated as the most recent data on emergency services were for 2013–14, and are hence now two years out of date. In 2014–15, coverage varied and it was estimated to range from 100% in Major cities to 18% in Very remote areas.
The quality of the data reported for Indigenous status in emergency departments has not been formally assessed. In addition, the scope of the NNAPEDCD may not include some emergency services provided in areas where the proportion of Indigenous people (compared with other Australians) may be higher than average. Therefore, the information on Indigenous status presented should be used with caution. Please refer to Appendix A of Emergency department care 2015–16: Australian hospital statistics for more details. Data for the Australian Capital Territory were not available at the time the tables were prepared. After hours is defined as on Sunday, before 8am or from 12pm on a Saturday, or before 8am or from 6pm on a weekday.
3.17 Regular GP or health service Self-reported data from the 2012–13 AATSIHS.
Figure 3.17-1 and 3.17-2: Excludes ‘don’t know’. ‘Other’ includes traditional healer and other health care provider. The list of specific health care providers may have posed problems for those who were confused between an Aboriginal Medical Service and a Community Clinic, or for those who simply did not know the kind of provider they usually visited.
Figure 3.17-3: Multiple response item. Proportions will not add to total. Some respondents may not have known which providers were available in their local area. The list of specific health care providers may have posed problems for those who were confused between an Aboriginal Medical Service and a Community Clinic. ‘Other’ includes Traditional Healer and other health care provider.
Figure 3.17-4: Patient experience reported by non-remote respondents aged 15 years and over who had seen a doctor or specialist in the previous 12 months. Regular source of health care category ‘Doctor/GP’ excludes doctors/GPs at an AMS or hospital, which are reported under their own category. AMS/CC represents Aboriginal Medical Service/Community Clinic.
3.18 Care planning for clients with chronic diseases Figure 3.18-1: For information on Medicare data, refer to notes for measure 3.05.
Figure 3.18-2: Self-reported data from the AATSIHS (2012–13 NATSIHS component) and, for non-Indigenous Australians, the AHS (2011–12 NHS component).
Figures 3.18-3 and 3.18-4: Sourced from national Key Performance Indicators (nKPI) for Aboriginal and Torres Strait Islander primary health care data collection. Presents proportion of regular clients who have Type 2 diabetes and for whom a GP Management Plan (MBS item 721) was claimed within the previous 24 months and for whom a Team Care Arrangement (MBS item 723) was claimed within the previous 24 months Some results may differ to nKPI
results published elsewhere due to revisions to the national database.
3.19 Accreditation Figure 3.19-1: Data are from public hospitals only. Jurisdiction based on location of hospital. Data are reported for Qld, WA, SA and NT only. These four jurisdictions are considered to have adequate levels of Indigenous identification over the time period reported, although the level of accuracy varies by jurisdiction and hospital. Hospitalisation data for these jurisdictions should not be assumed to represent the hospitalisation experiences in other jurisdictions. ‘Other’ includes hospitalisations for non-Indigenous Australians and those for whom Indigenous status was not stated. The proportion is the number of separations in accredited hospitals by Indigenous status and state/territory divided by the total number of separations by Indigenous status and state/territory. Hospitals’ accreditation status may change over time. Interpretation of changes in hospital separations in accredited hospitals over time needs to be cautious. Excludes care types 7.3, 9 and 10 (newborn—unqualified days only, organ procurement, hospital boarder).
Figure 3.19-2: Data are from public hospitals only. Remoteness category based on location of hospital. Total includes 7,532 separations from hospitals where remoteness area was unknown/not stated. The proportion is the number of separations in accredited hospitals by Indigenous status and remoteness category divided by the total number of separations by Indigenous status and remoteness category.
Figure 3.19-2: Aboriginal and Torres Strait Islander proportions are based on Medicare Local populations. GPA+ data is for the period 2013 while AGPAL data is financial year 2012–13.
3.20 Aboriginal and Torres Strait Islander people training for health-related disciplines Table 3.20-1 and Figures 3.20-1 and 3.20-2: These data come from the Higher Education Collections. Includes undergraduate, postgraduate, domestic and international university students. The data take into account the coding of Combined Courses to two fields of education. As a consequence, counting both fields of education for Combined Courses means that the totals may be less than the sum of detailed fields of education. For Table 3.20-1, ‘other’ includes those whose Indigenous status is unknown. Excludes unknown age group. Data published in corresponding tables in previous cycles incorrectly described completions for all courses rather than health-related courses only.
Table 3.20-2: Data sourced from NCVER National VET Provider collection. (Refer to notes for measure 2.06 regarding VET data). ‘Completions’ represents number of completions; students may complete more than one course. ‘Enrolled’ represents number of enrolments; students may be enrolled in more than one course. ‘Other’ includes those whose Indigenous status is unknown. Rates are calculated using Indigenous 2012 population projections based on the 2011 census for ages 15–64 years and for other Australians using the Australian 2012 population projections based on the 2011 census for ages 15–64. ‘n.p.’ means data not published (data cannot be released due to quality issues and confidentiality).
3.21 Expenditure on Aboriginal and Torres Strait Islander health compared to need Figure 3.21-1: Some of the increase in Indigenous health expenditure per person may have been due to improvements in data collection rather than actual change. Due to the change in methodology from 2006 Census based population estimates to 2001 Census based population there has been a break in the time series from 2010-11 onwards. This has reduced per person health expenditure. This can be seen by comparing the result for 2010-11 using the 2006 based population with the lower finding for 2010-11 using the 2011 based population.

Technical appendix
230
Figure 3.21-2: ACT per person expenditure estimates are not calculated because estimates for the ACT include substantial expenditures for NSW residents. As a result, the ACT population is not an appropriate denominator. Admitted patient expenditure adjusted for Aboriginal and Torres Strait Islander under-identification. Includes other recurrent expenditure on health, not elsewhere classified, such as family planning previously reported under ‘Other health services (n.e.c.)’. Health administration costs for NSW, Vic, SA and Tas are zero, as these jurisdictions have allocated administrative expenses into the functional expenditure categories.
Figure 3.21-3: Nominal expenditure in $m per year.
Figure 3.21-4: ‘Primary care’ is defined as services that are provided to the whole population and initiative by a patient. ‘Secondary and tertiary services’ are those generated within the health system through a referral such as specialist services. ‘Community health services’ includes other recurrent expenditure on health, not elsewhere classified, such as family planning previously reported under ‘Other health services (nec)’.
Figure 3.21-5: ‘GP’ includes general practitioners and vocationally registered general practitioners. ‘Other unreferred’ includes enhanced primary care, practice nurses and other unreferred services. For Medicare benefits (MBS) data, improvements in the quality of the voluntary Indigenous identifier (VII) has resulted in a change of methodology. In the previous report, the VII data was adjusted for under identification based on patient counts. For the 2013-14 data it was assumed that the VII was complete enough to use and no adjustment was done.
3.22 Recruitment and retention of staff Figure 3.22-1: Data is from the National Health Workforce Data Set (NHWDS) medical practitioners 2015 (AIHW publication). FTE is based on total weekly hours worked. Standard working week is 40 hours. Data excludes provisional registrants.
Figure 3.22-2: Data from the Rural Workforces Agencies National Minimum Data Set. Excludes 815 GPs for whom remoteness category or length of stay in current practice was unknown. Remoteness categories based on 2011 Australian Statistical Geography Standard (ASGS).
Figures 3.22-3 and 3.22-4: Refer to notes for measure 3.03 for information on the OSR data collection. Figure 3.22-3: Data sourced from OSR data collection 2014–15 (AIHW publication Table B36). The 2014–15 collection includes 203 primary health-care organisations. Vacancies are calculated as a proportion of total funded FTE for health/clinical positions and administrative/support positions.
Figure 3.22-4: Data sourced from SAR, DSR and AIHW OSR data collections. Number of vacant FTE positions as a proportion of total funded FTE positions (both occupied and vacant). Since 2008–09, OSR data counts all auspice services individually when calculating rates, therefore caution should be exercised when comparing rates with earlier data collection periods.

Abbreviations
231
Abbreviations AATSIHS Australian Aboriginal and Torres Strait Islander Health Survey ABS Australian Bureau of Statistics ACARA Australian Curriculum, Assessment and Reporting Authority ACCHO Aboriginal Community Controlled Health Organisation ACHS Australian Council of Healthcare Standards ACIR Australian Childhood Immunisation Register ACT Australian Capital Territory AGPAL Australian General Practice Accreditation Limited AHF Aboriginal Health Forum AHMAC Australian Health Ministers’ Advisory Council AHS Australian Health Survey AHW Aboriginal health worker AIC Australian Institute of Criminology AIDS Acquired Immune Deficiency Syndrome AIHW Australian Institute of Health and Welfare AMS Aboriginal Medical Service AMSANT Aboriginal Medical Services Alliance ANFPP Australian Nurse-Family Partnership Program ANZDATA Australian and New Zealand Dialysis and Transplant Registry APDC Admitted Patient Data Collection ARF Acute Rheumatic Fever ATSIHW Aboriginal and Torres Strait Islander Health Worker BBV Blood Borne Virus BEACH (see GP Survey data) Bettering the Evaluation and Care of Health BMI Body Mass Index CAI Computer Assisted Interview CanDAD Cancer Data and Aboriginal Disparities CATSI Act Corporations (Aboriginal and Torres Strait Islander) Act 2006 CBDS Child Dental Benefits Scheme CDEP Community Development Employment Projects
CHC Council of Australian Governments Health Council COAG Council of Australian Governments COPD Chronic Obstructive Pulmonary Disease CPI Consumer Price Index CVD Cardiovascular Disease DMFT Decayed, Missing, Filled Teeth (Adult—permanent) Dmft decayed, missing, filled teeth (Infant—deciduous) ENT Ear Nose and Throat specialist ESKD End stage Kidney Disease ESRD End Stage Renal Disease FASD Fetal Alcohol Spectrum Disorder FTE Full-Time Equivalent GAS Group A Streptococcal Bacterium GDM Gestational Diabetes Mellitus GP General Practitioner GPA+ General Practice Accreditation Plus GPMP General Practitioner Management Plan GP Survey data Bettering the Evaluation and Care of Health (BEACH) survey data HbA1c Haemoglobin A1c — a measurement that acts as an indicator of time-averaged blood glucose levels used as a marker of long-term diabetes control. Health Department of Health Health Survey Australian Aboriginal and Torres Strait Islander Health Survey and Australian Health Survey HIV Human Immunodeficiency Virus HPF Aboriginal and Torres Strait Islander Health Performance Framework HPV Human Papilloma Virus IAS Indigenous Advancement Strategy IHD Ischaemic Heart Disease IPD Invasive Pneumococcal Disease KRT Kidney Replacement Therapy LHNs Local Hospital Networks LSAC Longitudinal Study of Australian Children

Abbreviations
232
LSIC Longitudinal Study of Indigenous Children MBS Medicare Benefits Scheme/Schedule NACCHO National Aboriginal Community Controlled Health Organisation NAGATSIHID National Advisory Group on Aboriginal and Torres Strait Islander Health Information and Data NAHA National Affordable Housing Agreement NAPLAN National Assessment Program – Literacy and Numeracy NATSIHSC National Aboriginal and Torres Strait Islander Health Standing Committee NATSIHS National Aboriginal and Torres Strait Islander Health Survey NATSINSAP National Aboriginal and Torres Strait Islander Nutrition Strategy and Action Plan NATSIPDS National Aboriginal and Torres Strait Islander Peoples Drug Strategy NATSIS National Aboriginal and Torres Strait Islander Survey NATSISS National Aboriginal and Torres Strait Islander Social Survey NCSP National Cervical Screening Program NBCSP National Bowel Cancer Screening Program NHMRC National Health and Medical Research Council NHS National Health Survey NHPA National Health Performance Authority NHWDS National Health Workforce Data Set NIP National Immunisation Program NIRA National Indigenous Reform Agreement nKPI national Key Performance Indicators (Indigenous primary health care organisations) NMDS National Minimum Data Set NPESU National Perinatal Epidemiology and Statistics Unit NSW New South Wales NT Northern Territory NTC National Tobacco Campaign OECD Organisation for Economic Co-operation and Development ORIC Office of the Registrar of Indigenous Corporations OSR Online Services Report
PATS Patient Assistance Travel Schemes PBAC Pharmaceutical Benefits Advisory Committee PBS Pharmaceutical Benefits Scheme PCIS Primary Care Information System PHC Primary Health Care PHN Primary Health Networks PIP Practice Incentives Program PYLL Potential Years of Life Lost QAAMS The Quality Assurance for Aboriginal and Torres Strait Islander Medical Services program QIC Quality Improvement Council Qld Queensland RACGP Royal Australian College of General Practitioners RHD Rheumatic Heart Disease SA South Australia SCRGSP Steering Committee for the Review of Government Service Provision SEIFA Socio-Economic Indexes for Areas SIDS Sudden Infant Death Syndrome SLA Statistical Local Area Social Survey National Aboriginal and Torres Strait Islander Social Survey and General Social Survey STI Sexually Transmissible Infection TAFE Technical and Further Education TCA Team Care Arrangement VAED Victorian Admitted Episodes Dataset VEMD Victorian Emergency Minimum Dataset VET Vocational Education and Training VI Visual Impairment VII Voluntary Indigenous Identifier WA Western Australia WAACHS Western Australia Aboriginal Child Health Survey WHO World Health Organization

Glossary
233
Glossary Aboriginal Community Controlled Health Organisation (ACCHO) Community control is a process that allows the local Aboriginal community to be involved in its affairs in accordance with whatever protocols or procedures are determined by the community.
Aboriginal community control has its origins in Aboriginal peoples’ right to self-determination. This includes the right to be involved in health service delivery and decision making according to protocols or procedures determined by Aboriginal communities based on the Aboriginal holistic definition of health.
An ACCHO is:
• an incorporated Aboriginal organisation• initiated by a local Aboriginal community• based in a local Aboriginal community• governed by an Aboriginal body which is elected by the local
Aboriginal community• delivering a holistic and culturally appropriate health service to
the community that controls it.
Acute rheumatic fever (ARF) ARF is a disease caused by an auto-immune reaction to a bacterial infection with Group A streptococcus. ARF is a short illness, but can result in permanent damage to the heart — rheumatic heart disease (RHD). A person who has had ARF once is susceptible to repeated episodes, which can increase the risk of RHD. Following an initial diagnosis of RHD, patients require long-term treatment, including long-term antibiotic treatment to avoid infections that may damage the heart (Steer, 2009).
Admission The formal process, using registration procedures, under which a person is accepted by a hospital or an area or district health service facility as an inpatient.
Age-adjusted rate See age-standardised rate.
Age-specific rate Rate for a specified age group. Both numerator and denominator refer to the same age group.
Age-standardised rate Rate adjusted to take account of differences in age composition when rates for different populations are compared. The direct method of standardisation is used for the HPF. To calculate age-standardised rates using the direct method:
𝐴𝐴𝑅𝑅𝑅𝑅 =(𝑅𝑅𝑆𝑆𝑆𝑆(𝑟𝑟𝑖𝑖 × 𝑃𝑃𝑖𝑖)
𝑅𝑅𝑆𝑆𝑆𝑆 𝑃𝑃𝑖𝑖Where:
• ASR is the age-standardised rate for the population being studied• ri is the age-group specific rate for age group i in the population
being studied• Pi is the population for age group i in the standard population.
Also called age-adjusted rate.
Albuminuria The presence of the protein albumin in the urine, typically as a symptom of kidney disease.
Angioplasty Angioplasty is procedure to widen narrowed or obstructed arteries or veins, typically to treat arterial atherosclerosis. An empty, collapsed balloon is passed over a wire into the narrowed arteries or veins and then inflated to a fixed size. The balloon forces expansion of the vessel and the surrounding muscular wall, opening up the blood vessel for improved flow, and the balloon is then deflated and
withdrawn. A stent may or may not be inserted at the time of ballooning to ensure the vessel remains open.
Antenatal care Includes recording medical history, assessment of individual needs, advice and guidance on pregnancy and delivery, screening tests, education on self-care during pregnancy, identification of conditions detrimental to health during pregnancy, first-line management and referral if necessary.
Antepartum haemorrhage An antepartum haemorrhage (APH) is bleeding from the vagina after 20 weeks of pregnancy and before the birth of the baby. The common causes of bleeding include: cervical ectropion (when the cells on the surface of the cervix change in pregnancy, the tissue is more likely to bleed), vaginal infection, placental edge bleed (when the lower-half of the uterus begins to stretch and grow, the edge of the placenta can separate from the wall of the uterus), placenta praevia (when the placenta covers all or part of the cervix) or placental abruption (when the placenta detaches from the uterus). The latter two conditions can lead to death of the foetus and/or mother.
At-risk communities (regarding trachoma) The National Trachoma Surveillance and Reporting Unit analysed jurisdictional trachoma screening and management data for 2014 in 125 communities in the NT, SA, WA and NSW at risk of endemic trachoma.
Australian Statistical Geography Standard — Remoteness Area (ASGS–RA) The Australian Statistical Geography Standard (ASGS) is the Australian Bureau of Statistics geographical framework effective from July 2011. The ASGS replaces the Australian Standard Geographical Classification (ASGC). It classifies data from Statistical Areas Level 1 (SA1s) into broad geographical categories, called Remoteness Areas (RAs). The RA categories are defined in terms of ‘remoteness’ — the physical distance of a location from the nearest Urban Centre (based on population size). Remoteness is calculated using the road distance to the nearest Urban Centre (access to goods and services) for five categories:
• RA1 — Major Cities of Australia • RA2 — Inner Regional Australia • RA3 — Outer Regional Australia• RA4 — Remote Australia• RA5 — Very Remote Australia.
Australian 2001 standard population The 2001 Australian population has been used as the standard population for calculation of directly age-standardised rates. This is the estimated resident population based on the 2001 Census.
Avoidable mortality Refers to deaths from certain conditions that are considered avoidable given timely and effective health care. Avoidable mortality measures premature deaths (for those aged 0–74 years) for specific conditions defined internationally and nationally as potentially avoidable given access to effective health care.
Body Mass Index (BMI) Used to assess overweight and obesity levels. BMI is calculated as follows: BMI = weight (kg) / height (m)²:
• Underweight: BMI below 18.5 • Normal weight: BMI from 18.5 to 24.9• Overweight: BMI from 25.0 to 29.9• Obese: BMI of 30.0 and over.
The BMI cut-off points are derived from mainly European populations and can vary for other groups, including Aboriginal and Torres Strait Islander peoples.

Glossary
234
Cataract Cataract is a degenerative condition in which the lens of the eye clouds over, obstructing the passage of light and affecting vision. The most common type of cataract is associated with ageing. Other causes of cataract include:
• smoking• alcohol consumption• sunlight exposure• facial trauma • diabetes• arthritis• short-sightedness• some blood pressure lowering medications.
Cerebrovascular disease Disease of the blood vessels, especially the arteries that supply the brain. It is usually caused by hardening of the arteries (atherosclerosis) and can lead to a stroke.
Chlamydia A sexually transmissible infection (STI) that can affect women and men. Chlamydia is caused by the bacterium Chlamydia trachomatis. If left untreated, chlamydia can cause pelvic inflammatory disease in women, which can lead to chronic pain and infertility.
Chronic obstructive pulmonary disease (COPD) COPD is a serious long-term lung disease that mainly affects older people and is often difficult to distinguish from asthma. It is characterised by chronic obstruction of lung airflow that interferes with normal breathing and is not fully reversible. COPD includes bronchitis or emphysema.
Circulatory disease Any disease of the circulatory system, namely the heart (cardio) or blood vessels (vascular). Includes heart attack, angina, stroke and peripheral vascular disease. Also known as cardiovascular disease.
Closing the Gap A commitment made by Australian governments to improve the lives of Aboriginal and Torres Strait Islander Australians.
The Council of Australian Governments (COAG) has set seven targets on closing the gap between Aboriginal and Torres Strait Islander peoples and non-Indigenous Australians:
• closing the life expectancy gap within a generation (2006 to 2031)• halving the gap in mortality rates for Indigenous children under
five within a decade (2008 to 2018)• 95 per cent of all Indigenous four year olds enrolled in preschool
by 2025.• close the gap between Indigenous and non-Indigenous school
attendance within five years (2014 to 2018)• halving the gap for Indigenous students in reading, writing and
numeracy within a decade (2008 to 2018)• halving the gap for Indigenous Australians aged 20-24 in Year 12
attainment or equivalent attainment rates (by 2020)• halving the gap in employment outcomes between Indigenous
and non-Indigenous Australians within a decade (2008 to 2018).
Congenital malformations Physical or anatomical abnormalities present in a baby at birth. Examples include heart defects, spina bifida, limb defects, cleft lip and palate, and Down syndrome. Congenital malformations can be genetic or caused by environmental factors (such as alcohol), or be of unknown origin.
Coronary heart disease Coronary heart disease, also known as ischaemic heart disease, is the most common form of heart disease. There are two major clinical forms — heart attack (often known as acute myocardial infarction) and angina.
Crude rate An estimate of the proportion of a population that experiences an outcome during a specified period. It is calculated by dividing the number of people with an outcome in a specified period by the defined population during that period.
Crude death rate An estimate of the proportion of a population that dies in a specified period. It is calculated by dividing the number of deaths in a specified period by the defined population during that period.
Deafness Hearing impairment, deafness or hearing loss refers to the inability to hear things, either totally or partially. Symptoms can range from mild to profound and it is caused by many different events including injury, disease and genetic defects. In this report, it comprises complete deafness, partial deafness and hearing loss not elsewhere classified.
Decayed, missing, or filled teeth scores Oral health outcomes are usually measured in terms of the number of decayed, missing or filled baby or deciduous (dmft) and adult or permanent (DMFT) teeth. The dmft score measures decay experience in deciduous teeth, and the DMFT score measures decay experience in permanent teeth.
Diabetes mellitus A chronic condition marked by high levels of glucose in the blood. This condition is caused by the inability to produce insulin (a hormone produced by the pancreas to control blood glucose levels), or the insulin produced becomes less effective, or both. The three main types of diabetes are: Type 1, Type 2 and gestational diabetes.
• Type 1 diabetes, an auto-immune condition, is marked by theinability to produce any insulin and those affected need insulinreplacement for survival. Type 1 diabetes is rare amongIndigenous Australians.
• Type 2 diabetes (non-insulin dependent) is the most commonform of diabetes. Those with Type 2 diabetes produce insulin butmay not produce enough or cannot use it effectively. There is ahigh prevalence of Type 2 diabetes among Indigenous Australians,who tend to develop it earlier than other Australians and die fromthe disease at younger ages.
• Gestational diabetes occurs during pregnancy and usuallydisappears after birth.
Diabetic retinopathy Diabetic retinopathy occurs when the tiny blood vessels inside the retina at the back of the eye are damaged as a result of diabetes. This can seriously affect vision and in some cases may even cause blindness.
Dialysis A medical procedure for the filtering and removal of waste products from the bloodstream. Dialysis is used to remove urea, uric acid and creatinine (a chemical waste molecule that is generated from muscle metabolism) in cases of chronic end-stage renal disease. Two main types are:
• haemodialysis — blood flows out of the body into a machine thatfilters out the waste products and returns the cleansed bloodback into the body.
• peritoneal dialysis — fluid is injected into the peritoneal cavityand wastes are filtered through the peritoneum, the thinmembrane that surrounds the abdominal organs.
Ear or hearing problems Diseases of the ear and mastoid including deafness, otitis media, other diseases of the middle ear and mastoid, Meniere’s disease, other diseases of the inner ear and other diseases of the ear.

Glossary
235
Ectopic pregnancy Ectopic pregnancy is a pregnancy that develops outside the uterus, usually in one of the fallopian tubes. In almost all cases, the embryo dies as the developing placenta can’t access a rich blood supply and the fallopian tube is not large enough to support the growing embryo. Implantation can also occur in the cervix, ovaries, and abdomen, but this is rare.
Employed The term ‘employed’ includes people who have worked for at least 1 hour in the reference week.
End-stage renal disease Chronic irreversible renal failure. The most severe form of chronic kidney disease where kidney function deteriorates so much that dialysis or kidney transplantation is required to survive.
Equivalised gross household income In measuring and comparing income, equivalised gross household income adjusts for various factors, such as the number of people living in a household, particularly children and other dependants.
Fetal alcohol spectrum disorders Conditions that may result from fetal exposure to alcohol during pregnancy. Disorders include fetal alcohol syndrome, alcohol-related neurodevelopmental disorder and alcohol-related birth defects. These disorders include antenatal and postnatal growth retardation, specific facial dysmorphology and functional abnormalities of the central nervous system.
Glaucoma Glaucoma is a common form of eye disease that often runs in families. It affects the optic nerve connecting the eye to the brain. Glaucoma is usually caused by high intraocular pressure as a result of a blockage in the eye’s drainage system, which can lead to irreversible vision loss and blindness. Early detection and treatment can prevent vision loss in most cases.
Gonorrhoea Gonorrhoea is a common sexually transmissible infection that affects men and women. Gonorrhoea is caused by bacteria known as Neisseria gonorrhoea. It usually affects the genital area, although the throat or anus may also be affected. It can cause pelvic inflammatory disease and infertility in women. Gonorrhoea can be treated with antibiotics.
Haemodialysis A process used to treat kidney failure. A machine is connected to the patient’s bloodstream and then filters the blood externally to the body, removing water, excess substances and waste from the blood as well as regulating the levels of circulating chemicals. In doing this the machine takes on the role normally played by the kidneys (see also dialysis).
High blood triglycerides Triglycerides make up about 95 per cent of all dietary fats. In many cases, regular overeating leading to obesity causes a person to have raised triglycerides, which are linked with an increased risk of health conditions including diabetes and heart disease. High triglyceride levels in the blood are also known as hypertriglyceridemia.
Hospital separation or hospitalisation See Separation.
Hypertension/hypertensive disease High blood pressure, defined as a repeatedly elevated blood pressure exceeding 140 over 90 mmHg — a systolic pressure above 140 with a diastolic pressure above 90.
Illicit drugs Illicit drugs include illegal drugs (amphetamine, cocaine, marijuana, heroin, hallucinogens), pharmaceuticals when used for non-medical
purposes (pain-killers, sleeping pills) and other substances used inappropriately (inhalants such as petrol or glue).
Incidence The rate at which new events or cases occur during a certain period of time.
Indigenous deaths identification rate Almost all deaths in Australia are registered. However, the Indigenous status of the deceased may not be recorded correctly or reported. This means that the identification of Indigenous Australians in deaths data is incomplete. The number of deaths registered as Indigenous may therefore be an underestimate of deaths occurring among the Aboriginal and Torres Strait Islander population (ABS, 1997). As a result, the observed differences between Indigenous and non-Indigenous mortality are underestimates of the true differences.
Infant death The death of a child before one year.
Invasive pneumococcal disease A more serious form of pneumococcal disease, an infection caused by the Streptococcus pneumoniae bacterium. It occurs inside a major organ or in the blood and can result in pneumonia, sepsis, middle-ear infection (otitis media), or bacterial meningitis.
Ischaemic heart disease Ischaemic heart disease, or myocardial ischaemia, is a disease characterised by reduced blood supply (ischaemia) of the heart muscle, usually due to coronary artery disease. See also coronary heart disease.
Kessler Psychological Distress Scale (K5) A measure of psychological distress in people aged 16 years and over. K5 is a 5-item questionnaire that measures the level of psychological distress in the most recent 4-week period. At both the population and individual level, the K5 measure is a brief and accurate screening scale for psychological distress.
Labour force The labour force comprises all people who are either employed or unemployed.
Life expectancy The average number of years of life remaining to a person at a particular age. Life expectancy at birth is an estimate of the average length of time (in years) a person can expect to live, assuming that the currently prevailing rates of death for each age group will remain the same for the lifetime of that person.
Live birth The birth of a child who after delivery, breathes or shows any other evidence of life, such as a heartbeat. For calculation of perinatal death rates only infants weighing at least 400 grams at birth or, where birthweight is unknown, of at least 20 weeks gestation is included.
Low birthweight babies Infants born weighing less than 2,500gm.
Mastoid process The mastoid process — a bony protrusion located behind the ear in the lower part of the skulls — contains mastoid cells (small air-filled cavities) that communicate with the middle ear. Infection of the mastoid process can lead to hearing loss and other complications.
Meningococcal disease Meningococcal disease describes infections caused by the bacterium Neisseria meningitidis (meningococci bacteria). These bacteria can cause meningitis (an inflammatory response to an infection of the membranes covering the brain and spinal cord) and sepsis (an infection in the bloodstream). Meningitis can lead to

Glossary
236
deafness, epilepsy, cognitive defects and death. Sepsis can lead to organ dysfunction or failure and death.
Multivariate analysis A set of statistical techniques used to analyse data with more than one variable.
Myocardial infarction Myocardial infarction or acute myocardial infarction are terms commonly used to refer to a heart attack, but more correctly refer only to those heart attacks that have caused some death of heart muscle.
Myopia Myopia or near-sightedness is a type of refractive error of the eye, in which the eye does not focus light correctly. This makes distant objects appear blurred.
Myringotomy procedures Incision in eardrum to relieve pressure caused by excessive build-up of fluid.
National Indigenous Reform Agreement (NIRA) The NIRA is an agreement between the Commonwealth and state and territory Governments that provides the framework for Closing the Gap in Indigenous disadvantage. It sets out the objectives, outcomes, outputs, performance indicators and performance benchmarks agreed by COAG.
Neonatal death Death within 28 days of birth of any child who, after delivery, breathed or showed any other evidence of life, such as a heartbeat.
Neoplasm An abnormal growth of tissue. Can be ‘benign’ (not a cancer) or ‘malignant’ (a cancer). Same as a tumour.
Nephritis Nephritis is an inflammation of the kidneys. It is often caused by toxins, infections, and auto-immune diseases.
Nephrosis Nephrosis is a condition of the kidneys. It is usually caused by diseases that damage the kidneys' filtering system, allowing a protein called albumin to be filtered out into the urine (albuminuria). Symptoms include protein in the urine, high triglyceride levels, high cholesterol levels, low blood protein levels, and swelling.
Non-ambulatory care Care provided to a patient, whose condition requires admission to hospital or other inpatient facility.
Notification In this report, notifications are cases of communicable diseases reported by general practitioners, hospitals and pathology laboratories to the relevant authorities.
Otitis media Middle ear infection. In severe or untreated cases, otitis media can lead to hearing loss.
Overweight and obesity Overweight and obesity are measured using height and weight to calculate Body Mass Index (BMI). BMI scores in the range 25.00 to 29.99 are classified as ‘overweight’ and scores 30.00 or more as ‘obese’.
Perinatal death A fetal death (death of a foetus at 20 or more weeks of gestation, or at least 400 grams birthweight) or neonatal death within 28 days of birth. See also live birth and neonatal death.
Post-Enumeration Survey (PES) The PES is a short survey run in the month after each Census, to determine how many people were missed or counted more than once. It collects information about where people were on Census night and their characteristics. The PES provides information on the population and dwelling characteristics of the net undercount in the Census of Population and Housing.
Potentially avoidable hospital admissions See Selected potentially avoidable hospital admissions.
Preterm labour Preterm labour is defined as birth before 37 completed weeks of gestation.
Prevalence The rate at which existing events or cases are found at a given point or in a period of time.
Primary health care Primary health care usually is the first point of contact a person encounters with the health care system. In mainstream health throughout Australia primary health care is normally provided by general practitioners, community health nurses, pharmacists, environmental health officers etc., although the term usually means medical care. Primary health care may be provided through an ACCHO or satellite clinic (AH&MRC, 1999).
Primary Health Networks (PHN) Primary Health Networks (PHNs) have been established with the key objectives of increasing the efficiency and effectiveness of medical services for patients, particularly those at risk of poor health outcomes, and improving coordination of care to ensure patients receive the right care in the right place at the right time.
Refractive error A refractive error, or refraction error, is an error in the focusing of light by the eye and a frequent reason for blurred vision. It may lead to visual impairment.
Respiratory disease Respiratory disease includes conditions affecting the respiratory system—which includes the lungs and airways—such as asthma, COPD and pneumonia (see also Chronic Obstructive Pulmonary Disease).
Rheumatic heart disease (RHD) RHD may develop after illness with rheumatic fever, usually during childhood. Rheumatic fever can cause damage to various structures of the heart including the valves, lining or muscle and this damage is known as RHD (see also acute rheumatic fever).
Rheumatoid arthritis Rheumatoid arthritis is an autoimmune disease. In rheumatoid arthritis, the immune system attacks the body’s own tissues, specifically the synovium, a thin membrane that lines the joints. As a result of the attack, fluid builds up in the joints causing pain in the joints and inflammation throughout the body.
Rotavirus Globally, rotavirus is the most common cause of severe gastroenteritis in early childhood. Almost all children in Australia have been infected by the time they reach five years of age.
Secondary health care Secondary health care refers to particular services provided by hospitals, such as acute care, as well as services provided by specialists.
Glossary
237
Selected potentially avoidable hospital admissions Selected potentially preventable hospital admissions refers to admissions to hospital that are considered sensitive to the effectiveness, timeliness and adequacy of non-hospital care. This includes conditions for which hospitalisation could potentially be avoided through effective preventive measures or early diagnosis and treatment (Page, 2007).
Separation The formal process whereby an in-patient leaves a hospital or other health care facility after completing an episode of care. For example, a discharge to home, discharge to another hospital, nursing home, other care facility, or death. The hospital separation rate is the average number of hospital separations per 1,000 population.
Statistically significant An indication from a statistical test that an observed difference or association may be significant or ‘real’ because it is unlikely to be due just to chance.
Substantiated child protection notifications A child protection notification is substantiated where it is concluded that the child has been, is being, or is likely to be, abused, neglected or otherwise harmed.
Sudden infant death syndrome (SIDS) The sudden and unexpected death of a baby with no known illness, typically affecting sleeping infants between the ages of 2 weeks to 6 months.
Syphilis Syphilis is a sexually transmissible infection caused by a bacterium called Treponema pallidum. It can affect both men and women. Syphilis is transmitted through close skin-to-skin contact and is highly contagious when the syphilis sore (chancre) or rash is present. If untreated, syphilis can damage the internal organs, such as heart and brain and can result in death.
Tertiary health care Tertiary health care refers to highly specialised or complex services provided by specialists or allied health professionals in a hospital or primary health care setting, such as cancer treatment and complex surgery.
Trachoma Trachoma is an eye infection that can result in scarring, in-turned eyelashes and blindness. Australia is the only developed country where trachoma is still endemic and it is found almost exclusively in remote and very remote Aboriginal and Torres Strait Islander populations. Trachoma is associated with living in an arid environment (including the impact of dust); lack of access to clean water for hand and face washing; and overcrowding and low socio-economic status (Taylor, 2008).
Trichiasis Trichiasis involves the misdirection of eyelashes toward the eyeball, causing irritation and, if untreated, corneal scarring and vision loss. The misdirected lashes may be diffuse across the entire lid or in a small segmental distribution.
Tympanoplasty A surgical intervention to reconstruct a perforated eardrum.
Unemployed The term ‘unemployed’ refers to people who are without work, but have actively looked for work in the last four weeks and are available to start work.
Unemployment rate The number of unemployed people expressed as a proportion of the labour force (i.e., employed and unemployed).
Vocational Education and Training (VET) load pass rate The VET load pass rate is a ratio of hours of supervision in assessable modules or units that students have completed to the hours of supervision in assessable modules or units that students have either completed, failed or withdrawn from.

References
238
References Adami, PE, Negro, A, Lala, N & Martelletti, P 2010. The role of
physical activity in the prevention and treatment of chronic diseases, La Clinica Terapeutica, vol. 161, no. 6, pp. 537-541.
Agaku, IT, Odukoya, OO, Olufajo, O, Filippidis, FT & Vardavas, CI 2014. Support for smoke-free cars when children are present: a secondary analysis of 164,819 U.S. adults in 2010/2011, European Journal of Pediatrics, vol. 173, no. 11, pp. 1459-1466.
Akar, H, Akar, GC, Carrero, JJ, Stenvinkel, P & Lindholm, B 2011. Systemic consequences of poor oral health in chronic kidney disease patients, Clinical Journal of the American Society of Nephrology, vol. 6, no. 1, pp. 218-226.
Alexander, C & Fraser, JD 2007. Education, training and support needs of Australian trained doctors and international medical graduates in rural Australia: a case of special needs, Rural and Remote Health, vol. 7, no. 2, p. 681.
Alshehri, F 2016. Impacts of visual impairment on quality of life and family functioning in adult population, International Journal of Biomedical Research, vol. 7, no. 2, pp. 44-46.
Altman, JC, Buchanan, G & Biddle, N 2005. The real 'real' economy in remote Australia, from Assessing The Evidence on Indigenous Socioeconomic Outcomes: A Focus on the 2002 NATSISS,edited by Hunter, BH, ANU E Press: Canberra, pp. 139-152.
Andersen, MJ, Williamson, AB, Fernando, P, Redman, S & Vincent, F 2016. "There's a housing crisis going on in Sydney for Aboriginal people": focus group accounts of housing and perceived associations with health, BMC public health, vol. 16, p. 429.
Anderson, I, Ewen, SC & Knoche, DA 2009. Indigenous medical workforce development: current status and future directions, The Medical Journal of Australia, vol. 190, pp. 580-581.
Anderson, I 2011. Indigenous pathways into the professions, University of Melbourne, unpublished report to the Review of Higher Education Access and Outcomes for Aboriginal and Torres Strait Islander People, Department of Education, Employment and Workplace Relations: Canberra.
Anderson, I, Robson, B, Connolly, M, Al-Yaman, F, Bjertness, E, King, A, Tynan, M, Madden, R, Bang, A, Coimbra, CEA, Jr., Pesantes, MA, Amigo, H, Andronov, S, Armien, B, Obando, DA, Axelsson, P, Bhatti, ZS, Bhutta, ZA, Bjerregaard, P, Bjertness, MB, Briceno-Leon, R, Broderstad, AR, Bustos, P, Chongsuvivatwong, V, Chu, J, Deji, Gouda, J, Harikumar, R, Htay, TT, Htet, AS, Izugbara, C, Kamaka, M, King, M, Kodavanti, MR, Lara, M, Laxmaiah, A, Lema, C, Taborda, AML, Liabsuetrakul, T, Lobanov, A, Melhus, M, Meshram, I, Miranda, JJ, Mu, TT, Nagalla, B, Nimmathota, A, Popov, AI, Poveda, AMP, Ram, F, Reich, H, Santos, RV, Sein, AA, Shekhar, C, Sherpa, LY, Skold, P, Tano, S, Tanywe, A, Ugwu, C, Ugwu, F, Vapattanawong, P, Wan, X, Welch, JR, Yang, G, Yang, Z & Yap, L 2016. Indigenous and tribal peoples' health (The Lancet - Lowitja Institute Global Collaboration): a population study, The Lancet, vol. 388, no. 10040, pp. 131-157.
Anderson, K, Devitt, J, Cunningham, J, Preece, C, Jardine, MJ & Cass, A 2012. If you can't comply with dialysis, how do you expect me to trust you with transplantation? Australian nephrologists' views on indigenous Australians' 'non-compliance' and their suitability for kidney transplantation, International Journal for Equity in Health, vol. 11, no. 1, p. 21.
Anderson, P 1996, Priorities in Aboriginal Health, G Robinson (ed), Aboriginal Health: Social and cultural transitions: Proceedings of a conference at the Northern Territory University, Darwin, September 1995. Northern Territory University Press, Darwin.
Annamalay, AA, Khoo, SK, Jacoby, P, Bizzintino, J, Zhang, G, Chidlow, G, Lee, WM, Moore, HC, Harnett, GB, Smith, DW, Gern, JE, LeSouef, PN, Laing, IA & Lehmann, D 2012. Prevalence of and risk factors for human rhinovirus infection in healthy aboriginal and non-aboriginal Western Australian children, The Pediatric Infectious Disease Journal, vol. 31, no. 7, pp. 673-679.
Anyinginyi Health Aboriginal Corporation 2015. 2014/2015 Anyinginyi Annual Report, Anyinginyi Health Aboriginal Corporation, AHAC: Tennant Creek, NT.
Arabena, K, Howell-Muers, S, Ritte, R, Munro-Harrison, E & Onemda VicHealth Koori Health Unit 2015. Making a World of Difference - The First 1,000 Days Scientific Symposium report by Indigenous Health Equity Unit, Onemda VicHealth Group, Melbourne School of Population and Global Health, presented at Making a World of Difference: The First 1,000 Days Scientific Symposium 2015, University of Melbourne: Melbourne.
Arcos Holzinger, L & Biddle, N 2015. The relationship between early childhood education and care (ECEC) and the outcomes of Indigenous children: evidence from the Longitudinal Study of Indigenous Children (LSIC), Centre for Aboriginal Economic Policy Research, Australian National University, CAEPR Working Paper, no. 103/2015, CAEPR: Canberra.
Arney, F, Iannos, M, Chong, A, McDougall, S & Parkinson, S 2015. Enhancing the implementation of the Aboriginal and Torres Strait Islander Child Placement Principle Policy and practice considerations, Australian Institute of Family Studies, CFCA Paper no. 34, AIFS: Canberra.
Arnold, JL, De Costa, CM & Howat, PW 2009. Timing of transfer for pregnant women from Queensland Cape York communities to Cairns for birthing, The Medical Journal of Australia, vol. 190, no. 10, pp. 594-596.
Arnold, L, Hoy, W & Wang, Z 2016. Low birthweight increases risk for cardiovascular disease hospitalisations in a remote Indigenous Australian community – a prospective cohort study, Australian & New Zealand Journal of Public Health, vol. 40, no. S1, pp. S102-S106.
Askew, D, Brady, J, Brown, A, Cass, A, Davy, C, DeVries, J, Fewquandie, B, Hackett, M, Howard, M, Ingram, S, Liu, H, Mentha, R, Peiris, D, Simon, P, Rickards, B & Togni, SJ 2014. To your door: Factors that influence Aboriginal and Torres Strait Islander peoples seeking care, Kanyini Vascular Collaboration, Kanyini Qualitative Study Monograph Series: No.1, KVC: Sydney.

References
239
Aspin, C, Brown, N, Jowsey, T, Yen, L & Leeder, S 2012. Strategic approaches to enhanced health service delivery for Aboriginal and Torres Strait Islander people with chronic illness: a qualitative study, BMC Health Services Research, vol. 12, p. 143.
Atkinson, J 2013. Trauma-informed services and trauma-specific
care for Indigenous Australian children, Australian Institute of Health and Welfare & Australian Institute of Family Studies, Resource Sheet, no. 21, Closing the Gap Clearinghouse: Canberra.
Atlas, SJ, Grant, RW, Ferris, TG, Chang, Y & Barry, MJ 2009. Patient-
physician connectedness and quality of primary care, Annals of Internal Medicine, vol. 150, no. 5, pp. 325-335.
Australasian Sexual Health Alliance 2017. Australian STI
Management Guidelines for use in Primary Care, ASHA, 'viewed' November 2016, http://www.sti.guidelines.org.au/.
Australian Bureau of Statistics & Australian Institute of Health and
Welfare 2008. The health and welfare of Australia's Aboriginal and Torres Strait Islander peoples 2008, Cat. no. IHW 21, ABS & AIHW: Canberra.
Australian Bureau of Statistics 2013a. Estimates of Aboriginal and
Torres Strait Islander Australians June 2011, Cat. no. 3238.0.55.001, ABS: Canberra.
Australian Bureau of Statistics 2013b. Australian Bureau of Statistics
2013, Life Tables for Aboriginal and Torres Strait Islander Australians ABS Cat. no. 3302.0.55.003, ABS: Canberra.
Australian Bureau of Statistics 2013c. Australian Aboriginal and
Torres Strait Islander Health Survey: First Results Australia 2012-13, Cat. no. 4727.0.55.001 ABS: Canberra.
Australian Bureau of Statistics 2014a. Information Paper: Aboriginal
and Torres Strait Islander Peoples Perspectives on Homelessness 2014, Cat. no. 4736.0, ABS: Canberra.
Australian Bureau of Statistics 2014b. Australian Aboriginal and
Torres Strait Islander Health Survey: Updated Results 2012–13, Cat. no. 4727.0.55.006 ABS: Canberra.
Australian Bureau of Statistics 2014c. Estimates and Projections:
Aboriginal and Torres Strait Islander Australians 2001 to 2026, Cat. no. 3238.0, ABS: Canberra.
Australian Bureau of Statistics 2014d. Australian Social Trends 2014,
Cat. no. 4102.0, ABS: Canberra. Australian Bureau of Statistics 2014e. Australian Aboriginal and
Torres Strait Islander Health Survey: Biomedical Results 2012–13, Cat. no. 4727.0.55.003, ABS: Canberra.
Australian Bureau of Statistics 2014f. Australian Historical
Population Statistics 2014, Cat. no. 3105.0.65.001, ABS: Canberra.
Australian Bureau of Statistics 2015a. Australian Aboriginal and
Torres Strait Islander Health Survey: Nutrition Results - Food and Nutrients 2012-13, Cat. no. 4727.0.55.005 ABS: Canberra.
Australian Bureau of Statistics 2015b. National Health Survey: First
Results 2014-15, Cat. no. 4364.0.55.001, ABS: Canberra.
Australian Bureau of Statistics 2015c. Patient Experiences in Australia: Summary of Findings 2014-15, Cat. no. 4839.0, ABS: Canberra.
Australian Bureau of Statistics 2016a. Births Australia 2015, Cat. no.
3301.0, ABS: Canberra. Australian Bureau of Statistics 2016b. Prisoners in Australia 2016,
Cat. no. 4517.0, ABS: Canberra. Australian Bureau of Statistics 2016c. Corrective Services Australia
September quarter 2016, Cat. no. 4512.0, ABS: Canberra. Australian Bureau of Statistics 2016d. Schools Australia 2016 Cat.
no. 4221.0, ABS: Canberra. Australian Bureau of Statistics 2016e. National Aboriginal and Torres
Strait Islander Social Survey 2014-15, Cat. no. 4714.0, ABS: Canberra.
Australian Bureau of Statistics 2016f. Causes of Death Australia
2015, Cat. no. 3303.0, ABS: Canberra. Australian Commission on Safety and Quality in Health Care 2013.
Consumers, the health system and health literacy: taking action to improve safety and quality, Australian Commission on Safety and Quality in Health Care, ACSQHC: Sydney.
Australian Diabetes Society 2008. Guidelines for the Management of
Diabetic Retinopathy, National Health and Medical Research Council, NHMRC: Canberra.
Australian Health Ministers’ Advisory Council 2012. Clinical Practice
Guidelines: Antenatal Care – Module 1, Department of Health and Ageing, AHMAC: Canberra.
Australian Health Ministers’ Advisory Council 2014. Clinical Practice
Guidelines Antenatal Care — Module 2, Department of Health, AHMAC: Canberra.
Australian Health Ministers’ Advisory Council’s National Aboriginal
and Torres Strait Islander Health Standing Committee (2016) 2017. Cultural Respect Framework 2016-2026 for Aboriginal and Torres Strait Islander health, Council of Australian Governments, 1, AHMAC: Canberra.
Australian Human Rights Commission 2013. The Social Justice and
Native Title Report 2013, Aboriginal and Torres Strait Islander Social Justice Commissioner, AHRC.
Australian Human Rights Commission 2015. The Social Justice and
Native Title Report 2015, Aboriginal and Torres Strait Islander Social Justice Commissioner, AHRC: Sydney.
Australian Institute of Health and Welfare 2010a. Australia's health
2010, Australia's health no. 12, Cat. no. AUS 122, AIHW: Canberra.
Australian Institute of Health and Welfare 2010b. National
Healthcare Agreement: P20-Potentially avoidable deaths 2010, AIHW: Canberra.
Australian Institute of Health and Welfare 2010c. National best
practice guidelines for collecting Indigenous status in health data sets, Cat. no. IHW 29, AIHW: Canberra.

References
240
Australian Institute of Health and Welfare 2010d. Diabetes in pregnancy: its impact on Australian women and their babies, Diabetes series no. 14, Cat. no. CVD 52, AIHW: Canberra.
Australian Institute of Health and Welfare 2011a. Headline indicators for children's health, development and wellbeing 2011, Cat. no. PHE 144, AIHW: Canberra.
Australian Institute of Health and Welfare 2011b. Asthma in Australia 2011, Asthma Series no. 4, Cat. no. ACM 22, AIHW: Canberra.
Australian Institute of Health and Welfare 2011c. 2009 Adult Vaccination Survey: summary results, Cat. no. PHE 135, AIHW: Canberra.
Australian Institute of Health and Welfare 2011d. Chronic kidney disease in Aboriginal and Torres Strait Islander people 2011, Cat. no. PHE 151, AIHW: Canberra.
Australian Institute of Health and Welfare 2012a. Australia's food and nutrition 2012, Cat. no. PHE 163, AIHW: Canberra.
Australian Institute of Health and Welfare 2012b. Risk factors contributing to chronic disease, Cat. no. PHE 157, AIHW: Canberra.
Australian Institute of Health and Welfare 2012c. Northern Territory Emergency Response Child Health Check Initiative: follow-up services for oral and ear health: final report 2007-2012, Cat. no. DEN 223, AIHW: Canberra.
Australian Institute of Health and Welfare 2013a. Expenditure on health for Aboriginal and Torres Strait Islander people 2010-11, Health and welfare expenditure series no. 48, Cat. no. HWE 57, AIHW: Canberra.
Australian Institute of Health and Welfare 2013b. Rheumatic heart disease and acute rheumatic fever in Australia: 1996-2012, Cardiovascular disease series no. 36, Cat. no. CVD 60, AIHW: Canberra.
Australian Institute of Health and Welfare 2013c. Report on the use of linked data relating to Aboriginal and Torres Strait Islander people, Cat. no. IHW 92, AIHW: Canberra.
Australian Institute of Health and Welfare & Cancer Australia 2013. Cancer in Aboriginal and Torres Strait Islander peoples of Australia: an overview, Cancer series 78, Cat. no. CAN 75, AIHW: Canberra.
Australian Institute of Health and Welfare 2014a. National Bowel Cancer Screening Program: monitoring report 2012-2013, Cancer series 84, Cat. no. CAN 81, AIHW: Canberra.
Australian Institute of Health and Welfare 2014b. Timing impact assessment of COAG Closing the Gap targets: Child mortality, Cat. no. IHW 124, AIHW: Canberra.
Australian Institute of Health and Welfare 2014c. Coronary heart disease and chronic obstructive pulmonary disease in Indigenous Australians, Cat. no. IHW 126, AIHW: Canberra.
Australian Institute of Health and Welfare 2014d. Type 2 diabetes in Australia's children and young people: a working paper, Diabetes series 21, Cat. no. CVD 64, AIHW: Canberra.
Australian Institute of Health and Welfare 2014e. Housing assistance in Australia 2014, Cat. no. HOU 275, AIHW: Canberra.
Australian Institute of Health and Welfare 2014f. National Drug Strategy Household Survey, Drug statistics series no. 28, Cat. no. PHE 183, AIHW: Canberra.
Australian Institute of Health and Welfare 2014g. Cardiovascular disease, diabetes and chronic kidney disease: Australian facts: morbidity—hospital care, Cardiovascular, diabetes and chronic kidney disease series no. 3, Cat. no. CDK 3, AIHW: Canberra.
Australian Institute of Health and Welfare 2014h. Determinants of wellbeing for Indigenous Australians, Cat. no. IHW 137, AIHW: Canberra.
Australian Institute of Health and Welfare 2014i. Homelessness among Indigenous Australians, Cat. no. IHW 133, AIHW: Canberra.
Australian Institute of Health and Welfare 2014j. Youth justice in Australia 2013–14, Bulletin no. 127, Cat. no. AUS 188, AIHW: Canberra.
Australian Institute of Health and Welfare & Australian Institute of Family Studies 2013. Strategies to minimise the incidence of suicide and suicidal behaviour, AIHW & AIFS, Resource Sheet, no. 18, Closing the Gap Clearinghouse: Canberra.
Australian Institute of Health and Welfare & Australian Institute of Family Studies 2014a. Ear disease in Aboriginal and Torres Strait Islander children, AIHW & AIFS, Resource Sheet, no. 35, Closing the Gap Clearinghouse: Canberra.
Australian Institute of Health and Welfare & Australian Institute of Family Studies 2014b. Fetal alcohol spectrum disorders: a review of interventions for prevention and management in Indigenous Communities, AIHW & AIFS, Resource Sheet, no. 36, Closing the Gap Clearinghouse: Canberra
Australian Institute of Health and Welfare 2015a. Cardiovascular disease, diabetes and chronic kidney disease—Australian facts: risk factors, Cardiovascular, diabetes and chronic kidney disease series no. 4, Cat. no. CDK 004, AIHW: Canberra.
Australian Institute of Health and Welfare 2015b. Cardiovascular disease, diabetes and chronic kidney disease—Australian facts: Aboriginal and Torres Strait Islander people, Cardiovascular, diabetes and chronic kidney disease series no. 5, Cat. no. CDK 5, AIHW: Canberra.
Australian Institute of Health and Welfare 2015c. Incidence of type 1 diabetes in Australia 2000–2013, Diabetes series no. 23, Cat. no. CVD 69, AIHW: Canberra.
Australian Institute of Health and Welfare 2015d. The health of Australia's prisoners 2015, Cat. no. PHE 207, AIHW: Canberra.
Australian Institute of Health and Welfare & Pointer, S 2015. Trends in hospitalised injury Australia: 1999–00 to 2012–13, Injury research and statistics series no. 95, Cat. no. INJCAT 171, AIHW: Canberra.

References
241
Australian Institute of Health and Welfare 2016a. Better Cardiac Care measures for Aboriginal and Torres Strait Islander people: second national report 2016, Cat. no. IHW 169, AIHW: Canberra.
Australian Institute of Health and Welfare 2016b. Hospital resources 2014–15: Australian hospital statistics, Health services series no. 71, Cat. no. HSE 176, AIHW: Canberra.
Australian Institute of Health and Welfare 2016c. Pharmacy Workforce 2014 Detailed Tables National Health Workforce Data Set http://www.aihw.gov.au/workforce/pharmacy/, AIHW: Canberra.
Australian Institute of Health and Welfare 2016d. Nurses and Midwives Detailed Tables, National Health Workforce Data Set 2015, , http://aihw.gov.au/workforce/nursing-and-midwifery/additional/, AIHW: Canberra.
Australian Institute of Health and Welfare 2016e. Emergency department care 2015–16: Australian hospital statistics, Health services series no. 72, Cat. no. HSE 182, AIHW: Canberra.
Australian Institute of Health and Welfare 2016f. Australian Burden of Disease Study 2011: impact and causes of illness and death in Aboriginal and Torres Strait Islander people 2011, Australian Burden of Disease Study series no. 6, Cat. no. BOD 7, AIHW: Canberra.
Australian Institute of Health and Welfare 2016g. Medical Practitioners Detailed Tables 2015 National Health Workforce Data Set 2015, http://www.aihw.gov.au/workforce/medical/additional/, AIHW: Canberra.
Australian Institute of Health and Welfare 2016h. National Opioid Pharmacotherapy Statistics (NOPSAD) 2015, http://www.aihw.gov.au/alcohol-and-other-drugs/data-sources/nopsad-2015/, AIHW: Canberra.
Australian Institute of Health and Welfare 2016i. Alcohol and other drug treatment services in Australia 2014–15, Drug treatment series no. 27, Cat. no. HSE 173, AIHW: Canberra.
Australian Institute of Health and Welfare 2016j. Mental health services provided in emergency department - Table ED: Services provided in emergency departments, https://mhsa.aihw.gov.au/services/emergency-departments/ AIHW: Canberra.
Australian Institute of Health and Welfare 2016k. Mental health services—in brief 2016, Mental health series, Cat. no. HSE 180, AIHW: Canberra.
Australian Institute of Health and Welfare 2016l. Australian Burden of Disease Study: impact and causes of illness and death in Australia 2011, Australian Burden of Disease Study series no. 3, Cat. no. BOD 4, AIHW: Canberra.
Australian Institute of Health and Welfare 2016m. Medical Practitioners Overview Tables 2015 National Health Workforce Data Set 2015, http://aihw.gov.au/workforce/medical/additional/, AIHW: Canberra.
Australian Institute of Health and Welfare 2016n. Australia's health 2016, Australia's health no. 15, Cat. no. AUS 199, AIHW: Canberra.
Australian Institute of Health and Welfare 2016o. Aboriginal and Torres Strait Islander health organisations: Online Services Report—key results 2014–15, Online Services Report, Cat. no. IHW 168, AIHW: Canberra.
Australian Institute of Health and Welfare 2016p. Spatial distribution of the supply of the clinical health workforce 2014: relationship to the distribution of the Indigenous population, Cat. no. IHW 170, AIHW: Canberra.
Australian Institute of Health and Welfare 2016q. National Bowel Cancer Screening Program: monitoring report 2016, Cancer series no. 98, Cat. no. CAN 97, AIHW: Canberra.
Australian Institute of Health and Welfare 2016r. Participation in Cervical Cancer Screening Data Tables 2014-2015, Cervical screening data 2014–2015, AIHW: Canberra.
Australian Institute of Health and Welfare 2016s. The views of children and young people in out-of-home care: overview of indicator results from a pilot national survey 2015, AIHW bulletin no. 132, Cat. no. AUS 197, AIHW: Canberra.
Australian Institute of Health and Welfare 2016t. Cervical screening in Australia 2013–2014, Cancer series no. 97, Cat. no. CAN 95, AIHW: Canberra.
Australian Institute of Health and Welfare 2016u. Admitted patient care 2014–15: Australian hospital statistics, Health services series no. 68, Cat. no. HSE 172, AIHW: Canberra.
Australian Institute of Health and Welfare 2016v. Young people in child protection and under youth justice supervision 2014–15, Data linkage series no. 22, Cat. no. CSI 24, AIHW: Canberra.
Australian Institute of Health and Welfare 2016w. BreastScreen Australia monitoring report 2013–2014, Cancer series no. 100, Cat. no. CAN 99, AIHW: Canberra.
Australian Institute of Health and Welfare 2016x. Elective surgery waiting times 2015–16: Australian hospital statistics, Health services series no. 73, Cat. no. HSE 183, AIHW: Canberra.
Australian Institute of Health and Welfare 2016y. Australia's mothers and babies 2014-in brief, Perinatal statistics series no. 32, Cat. no. PER 87, AIHW: Canberra.
Australian Institute of Health and Welfare 2016z. Child protection Australia 2014–15, Child welfare series no. 63, Cat. no. CWS 57, AIHW: Canberra.
Australian Institute of Health and Welfare 2016aa. Disability support services: services provided under the National Disability Agreement 2014–15, AIHW bulletin no. 134, Cat. no. AUS 200, AIHW: Canberra.
Australian Institute of Health and Welfare 2016ab Youth justice in Australia 2014-15, AIHW bulletin no. 133, Cat. no. AUS 198, AIHW: Canberra.

References
242
Australian Institute of Health and Welfare 2017a. Cancer in Australia 2017, Cancer series no. 101, Cat. no. CAN 100, AIHW: Canberra.
Australian Institute of Health and Welfare 2017b. Specialist homelessness services 2015–16, AIHW, 'viewed' November 2016 http://aihw.gov.au/homelessness/specialist-homelessness-services-2015-16/.
Australian Institute of Health and Welfare 2017c. Northern Territory Remote Aboriginal Investment: Oral Health Program—July 2012 to December 2015, Cat. no. IHW 175, AIHW: Canberra.
Australian Institute of Health and Welfare, NPSU 2011. Neural tube defects in Australia: prevalence before mandatory folic acid fortification, Cat. no. PER 53, AIHW: Canberra.
Australian Medical Association 2015. 2015 AMA Report Card on Indigenous Health - Closing the Gap on Indigenous Imprisonment Rates, Australian Medical Association, Aboriginal and Torres Strait Islander Health Report Cards, https://ama.com.au/2015-ama-report-card-indigenous-health-closing-gap-indigenous-imprisonment-rates, AMA.
Australian National Audit Office 2010. ANAO Audit Report No.5 2010–11 Practice Incentives Program, Department of Health and Ageing, Medicare Australia, Australian National Audit Office, Performance Audit, ANAO: Canberra.
Australian National Council on Drugs 2013. An economic analysis for Aboriginal offenders: prison vs residential treatment, National Indigenous Drug and Alcohol Committee, A report prepared for the National Indigenous Drug and Alcohol Committee, Australian National Council on Drugs, ANCD Research Paper 24, ANCD: Canberra.
Ayre, J, On, ML, Webster, K, Gourley, M & Moon, L 2016. Examination of the burden of disease of intimate partner violence against women in 2011: Final report, Australia’s National Research Organisation for Women’s Safety Limited, Horizons Report, Issue 6, ANROWS: Sydney.
Baheiraei, A, Ghafoori, F, Foroushani, AR & Nedjat, S 2014. The effects of maternal exposure to second-hand smoke on breast-feeding duration: A prospective cohort study, Journal of Public Health, vol. 22, no. 1, pp. 13-22.
Bailie, C, Matthews, V, Bailie, J, Burgess, P, Copley, K, Kennedy, CM, Moore, L, Larkins, S, Thompson, S & Bailie, RS 2016. Determinants and Gaps in Preventive Care Delivery for Indigenous Australians: A Cross-sectional Analysis, Frontiers in Public Health, vol. 4, p. 34.
Bailie, J, Schierhout, GH, Kelaher, MA, Laycock, AF, Percival, NA, O’Donoghue, LR, McNeair, TL, Chakraborty, A, Beacham, BD & Bailie, RS 2014. Follow-up of Indigenous-specific health assessments — a socioecological analysis, The Medical Journal of Australia, vol. 200, no. 11, pp. 653-657.
Bailie, J, Schierhout, G, Laycock, AF, Kelaher, M, Percival, N, O’Donoghue, LR, McNeair, TL & Bailie, R 2015. Determinants of access to chronic illness care: a mixed-methods evaluation of a national multifaceted chronic disease package for Indigenous Australians, BMJ open, vol. 5, p. e008103.
Bailie, R, Si, D, Dowden, M & Lonergan, K 2007. Audit and Best Practice for Chronic Disease: Project Final Report, Menzies School of Health Research & Cooperative Research Centre for Aboriginal Health, Audit and Best Practice for Chronic Disease Menzies SHR: Darwin.
Bailie, RS, Si, D, Robinson, GW, Togni, SJ & d'Abbs, PH 2004. A multifaceted health-service intervention in remote Aboriginal communities: 3-year follow-up of the impact on diabetes care, The Medical Journal of Australia, vol. 181, no. 4, pp. 195-200.
Bailie, RS & Wayte, KJ 2006. Housing and health in Indigenous communities: key issues for housing and health improvement in remote Aboriginal and Torres Strait Islander communities, Australian Journal of Rural Health, vol. 14, no. 5, pp. 178-183.
Bailie, RS, McDonald, EL, Stevens, M, Guthridge, S & Brewster, DR 2011. Evaluation of an Australian indigenous housing programme: community level impact on crowding, infrastructure function and hygiene, Journal of Epidemiology and Community Health, vol. 65, no. 5, p. 432.
Bailie, RS, Stevens, M & McDonald, EL 2012. The impact of housing improvement and socio-environmental factors on common childhood illnesses: a cohort study in Indigenous Australian communities, Journal of Epidemiology and Community Health, vol. 66, no. 9, pp. 821-831.
Bambra, C 2011. Work, worklessness, and the political economy of health, Oxford University Press.
Banks, E, Joshy, G, Weber, MF, Liu, B, Grenfell, R, Egger, S, Paige, E, Lopez, AD, Sitas, F & Beral, V 2015. Tobacco smoking and all-cause mortality in a large Australian cohort study: findings from a mature epidemic with current low smoking prevalence, BMC Medicine, vol. 13, no. 1, p. 38.
Bar-Zeev, SJ, Kruske, SG, Barclay, LM, Bar-Zeev, N & Kildea, SV 2013. Adherence to management guidelines for growth faltering and anaemia in remote dwelling Australian Aboriginal infants and barriers to health service delivery, BMC Health Services Research, vol. 13, no. 1, p. 250.
Barker, DJ 1990. The fetal and infant origins of adult disease, British Medical Journal, vol. 301, no. 6761, p. 1111.
Beard, JR, Earnest, A, Morgan, G, Chan, H, Summerhayes, R, Dunn, TM, Tomaska, NA & Ryan, L 2008. Socioeconomic disadvantage and acute coronary events: a spatiotemporal analysis, Epidemiology, vol. 19, no. 3, pp. 485-492.
Behrendt, L, Larkin, S, Griew, R & Kelly, P 2015. Review of Higher Education Access and Outcomes for Aboriginal and Torres Strait Islander People: Final Report 2012, Panel of the Review of Higher Education Access and Outcomes for Aboriginal and Torres Strait Islander People, www.innovation.gov.au/IHER, Department of Education and Training: Canberra.
Belachew, TA & Kumar, A 2014. Examining Association Between Self-Assessed Health Status and Labour Force Participation Using Pooled NHS Data, Australian Bureau of Statistics, Cat. no. 1351.0.55.049, ABS: Canberra.

References
243
Berger, M, Leicht, A, Slatcher, A, Kraeuter, AK, Ketheesan, S, Larkins, S & Sarnyai, Z 2017. Cortisol Awakening Response and Acute Stress Reactivity in First Nations People, Scientific Reports, vol. 7, p. 41760.
Berry, HL, Butler, JR, Burgess, CP, King, UG, Tsey, K, Cadet-James, YL, Rigby, CW & Raphael, B 2010. Mind, body, spirit: co-benefits for mental health from climate change adaptation and caring for country in remote Aboriginal Australian communities, New South Wales Public Health Bulletin, vol. 21, no. 5-6, pp. 139-145.
Berry, JG, Harrison, JE & Ryan, P 2009. Hospital admissions of indigenous and non-indigenous Australians due to interpersonal violence, July 1999 to June 2004, Australian & New Zealand Journal of Public Health, vol. 33, no. 3, pp. 215-222.
Bertilone, C & McEvoy, S 2015. Success in Closing the Gap: favourable neonatal outcomes in a metropolitan Aboriginal Maternity Group Practice Program, The Medical Journal of Australia, vol. 203, no. 6.
Beyond Blue 2014. Discrimination against Indigenous Australians: A snapshot of the views of non-Indigenous people aged 25–44, Beyond Blue: www.beyondblue.org.au.
Bickerstaff, M, Beckmann, M, Gibbons, K & Flenady, V 2012. Recent cessation of smoking and its effect on pregnancy outcomes, Australian & New Zealand Journal of Obstetrics and Gynaecology, vol. 52, no. 1, pp. 54-58.
Biddle, N 2009. Ranking regions: Revisiting an index of relative Indigenous socioeconomic outcomes, Centre for Aboriginal Economic Policy Research, Australian National University, CAEPR Working Paper, no. 50/2009, CAEPR: Canberra.
Biddle, N 2011. Skills and Learning, presented at 2011 Centre for Aboriginal Economic Policy Research Lecture Series - Australian National University, CAEPR: Canberra.
Biddle, N 2013. CAEPR Indigenous Population Project 2011 Census Papers, Centre for Aboriginal Economic Policy Research, Australian National University, Income, Paper 11, CAEPR: Canberra.
Biddle, N 2014a. Developing a behavioural model of school attendance: Policy implications for Indigenous children and youth, presented at 2014 Centre for Aboriginal Economic Policy Research Seminar Series - Australian National University, CAEPR: Canberra, 12th March 2014.
Biddle, N 2014b. Developing a Behavioural Model of School Attendance: Policy Implications for Indigenous Children and Youth, Centre for Aboriginal Economic Policy Research, Australian National University, no. 94/2014, CAEPR: Canberra.
Biddle, N 2015a. Indigenous Income, Wellbeing and Behaviour: Some Policy Complications, Economic Papers: A journal of applied economics and policy, vol. 34, no. 3, pp. 139-149.
Biddle, N 2015b. Entrenched Disadvantage in Indigenous Communities, from Addressing Entrenched Disadvantage in Australia, CfEDo, CEDA: Melbourne, pp. 63-80.
Biddle, N & Crawford, H 2015. The changing Aboriginal and Torres Strait Islander population: Evidence from the 2006–11 Australian Census Longitudinal Dataset, Centre for Aboriginal Economic Policy Research, Australian National University, CAEPR Indigenous Population Project 2011 Census Papers, Paper 18, CAEPR: Canberra.
Biddle, N & Meehl, A 2016. The Gendered Nature of Indigenous Education Participation and Attainment, Centre for Aboriginal Economic Policy Research, Australian National University, CAEPR Working Paper, no. 106/2016, CAEPR: Canberra.
Biddle, N 2017. Community functioning for Aboriginal and Torres Strait Islander Australians: Analysis using the 2014/15 National Aboriginal and Torres Strait Islander Social Survey, Centre for Aboriginal Economic Policy Research, Australian National University, CAEPR Working Paper, (unpublished): Canberra.
Bishop, L, Laverty, M & Gale, L 2016. Providing aeromedical care to remote Indigenous communities, Royal Flying Doctor Service of Australia, RFDS: Canberra.
Black, A 2007. Evidence of effective interventions to improve the social and environmental factors impacting on health: Informing the development of Indigenous Community Agreements, Department of Health and Ageing, DoHA: Canberra.
Bodenheimer, T, Lorig, K, Holman, H & Grumbach, K 2002. Patient self-management of chronic disease in primary care, JAMA, vol. 288, no. 19, pp. 2469-2475.
Bond, C, Brough, M, Spurling, G & Hayman, N 2012. ‘It had to be my choice’ Indigenous smoking cessation and negotiations of risk, resistance and resilience, Health, Risk & Society, vol. 14, no. 6, pp. 565-581.
Booth, A & Carroll, N 2005. The Health Status of Indigenous and Non-Indigenous Australians, Centre for Aboriginal Economic Policy Research, Australian National University, Discussion Paper, no. 486, CAEPR: Canberra.
Borland, J & Hunter, B 2000. Does Crime Affect Employment Status? The Case of Indigenous Australians, Economica, vol. 67, no. 265, pp. 123-144.
Bowatte, G, Tham, R, Allen, KJ, Tan, DJ, Lau, M, Dai, X & Lodge, CJ 2015. Breastfeeding and childhood acute otitis media: a systematic review and meta-analysis, Acta Paediatrica, vol. 104, no. 467, pp. 85-95.
Bowden, FJ, Tabrizi, SN, Garland, SM & Fairley, CK 2002. MJA Practice Essentials — Infectious Diseases Chapter 6: Sexually transmitted infections: new diagnostic approaches and treatments, The Medical Journal of Australia, vol. 176, no. 11, pp. 551-557.
Bower, C, Eades, S, Payne, J, D’Antoine, H & Stanley, F 2004. Trends in neural tube defects in Western Australia in Indigenous and non-Indigenous populations, Paediatric and Perinatal Epidemiology, vol. 18, no. 4, pp. 277-280.
Brackertz, N 2016. Indigenous Housing and Education Inquiry: Discussion Paper for Department of the Prime Minister and Cabinet, Australian Housing and Urban Research Institute, AHURI Research Service: Melbourne.

References
244
Bradshaw, PJ, Alfonso, HS, Finn, J, Owen, J & Thompson, PL 2009. Coronary heart disease events in Aboriginal Australians: incidence in an urban population, The Medical Journal of Australia, vol. 190, no. 10, pp. 583-586.
Bradshaw, PJ, Alfonso, HS, Finn, J, Owen, J & Thompson, PL 2011. A comparison of coronary heart disease event rates among urban Australian Aboriginal people and a matched non-Aboriginal population, Journal of Epidemiology and Community Health, vol. 65, no. 4, pp. 315-319.
Braveman, P & Gruskin, S 2003. Defining equity in health, Journal of Epidemiology and Community Health, vol. 57, no. 4, pp. 254-258.
Brett, J, Lawrence, L, Ivers, R & Conigrave, K 2014. Outpatient alcohol withdrawal management for Aboriginal and Torres Strait Islander Australians, Australian Family Physician, vol. 43, pp. 563-566.
Bridge, P 2011. Ord Valley Aboriginal Health Service’s fetal alcohol spectrum disorders program: Big steps, solid outcome, Australian Indigenous Health Bulletin, vol. 11, no. 4.
Brimblecombe, JK & O’Dea, K 2009. The role of energy cost in food choices for an Aboriginal population in northern Australia, The Medical Journal of Australia, vol. 190, no. 10, pp. 549-551.
Brody, GH, Miller, GE, Yu, T, Beach, SR & Chen, E 2016. Supportive Family Environments Ameliorate the Link Between Racial Discrimination and Epigenetic Aging: A Replication Across Two Longitudinal Cohorts, Psychological Science, vol. 27, no. 4, pp. 530-541.
Bromfield, LM & Higgins, DJ 2004. The limitations of using statutory child protection data for research into child maltreatment, Australian Social Work, vol. 57, no. 1, pp. 19-30.
Brown, A 2010. Acute coronary syndromes in indigenous Australians: opportunities for improving outcomes across the continuum of care, Heart, Lung & Circulation, vol. 19, no. 5-6, pp. 325-336.
Brown, A 2012. Addressing cardiovascular inequalities among indigenous Australians, Global Cardiology Science & Practice, vol. 2012, no. 1, p. 2.
Brown, A, Roder, D, Yerrell, P, Cargo, M, Reilly, R, Banham, D, Micklem, J, Morey, K, Stewart, H, The CanDAD Aboriginal Community Reference Group & CanDADInvestigators 2016. Cancer Data and Aboriginal Disparities Project (CanDAD) – an overdue cancer control initiative, European Journal of Cancer Care, vol. 25, no. 2, pp. 208-213.
Brown, SJ, Mensah, FK, Ah Kit, J, Stuart-Butler, D, Glover, K, Leane, C, Weetra, D, Gartland, D, Newbury, J & Yelland, J 2016a. Use of cannabis during pregnancy and birth outcomes in an Aboriginal birth cohort: a cross-sectional, population-based study, BMJ open, vol. 6, no. 2, p. e010286.
Brown, SJ, Mensah, FK, Ah Kit, J, Stuart-Butler, D, Glover, K, Leane, C, Weetra, D, Gartland, D, Newbury, J & Yelland, J 2016b. Aboriginal Families Study Policy Brief No 4: Improving the health of Aboriginal babies, Murdoch Childrens Research Institute, Aboriginal Families Study Policy Brief, No. 4, MCRI: Melbourne.
Bryant, J, Ward, J, Wand, H, Byron, K, Bamblett, A, Waples-Crowe, P, Betts, S, Coburn, T, Delaney-Thiele, D, Worth, H, Kaldor, J & Pitts, M 2016. Illicit and injecting drug use among Indigenous young people in urban, regional and remote Australia, Drug & Alcohol Review, vol. 35, no. 4, pp. 447-455.
Bull, F, Bauman, A, Bellew, B & Brown, W 2004. Getting Australia Active II: An update of evidence on physical activity for health, National Public Health Partnership, NPHP: Melbourne.
Bunker, J 2014. Hypertension: diagnosis, assessment and management, Nursing Standard, vol. 28, no. 42, pp. 50-59.
Burgess, CP, Johnston, FH, Berry, HL, McDonnell, J, Yibarbuk, D, Gunabarra, C, Mileran, A & Bailie, RS 2009. Healthy country, healthy people: the relationship between Indigenous health status and" caring for country", The Medical Journal of Australia, vol. 190, no. 10, pp. 567-572.
Burgess, CP, Sinclair, G, Ramjan, M, Coffey, PJ, Connors, CM & Katekar, LV 2015. Strengthening cardiovascular disease prevention in remote indigenous communities in Australia's Northern Territory, Heart, Lung & Circulation, vol. 24, no. 5, pp. 450-457.
Burgess, M 2003. Immunisation: a public health success, New South Wales Public Health Bulletin, vol. 14, no. 1-2, pp. 1-5.
Burns, J & Thomson, N 2013. Review of ear health and hearing among Indigenous Australians, Australian Indigenous HealthInfoNet, vol. No 15.
Burrow, S, Galloway, A & Weissofner, N 2009. Review of educational and other approaches to hearing loss among Indigenous people, Australian Indigenous HealthInfoNet.
Burrow, S & Ride, K 2016. Review of diabetes among Aboriginal and Torres Strait Islander people, Australian Indigenous HealthInfoNet, vol. No.17.
Cable, N 2014. Life Course Approach in Social Epidemiology: An Overview, Application and Future Implications, Journal of Epidemiology, vol. 24, no. 5, pp. 347-352.
Campbell, N, McAllister, L & Eley, D 2012. The influence of motivation in recruitment and retention of rural and remote allied health professionals: a literature review, Rural and Remote Health, vol. 12, p. 1900.
Campbell, S, Lynch, J, Esterman, A & McDermott, R 2011. Pre-pregnancy predictors linked to miscarriage among Aboriginal and Torres Strait Islander women in North Queensland, Australian & New Zealand Journal of Public Health, vol. 35, no. 4, pp. 343-351.
Cancer Australia 2012. Study of breast cancer screening characteristics and breast cancer survival in Aboriginal and Torres Strait Islander women of Australia, Cancer Australia: Surry Hills, NSW.
Cancer Australia 2015. National Aboriginal and Torres Strait Islander Cancer Framework 2015, Cancer Australia: Surry Hills, NSW.

References
245
Canuto, KJ, McDermott, RA, Cargo, M & Esterman, AJ 2011. Study protocol: a pragmatic randomised controlled trial of a 12-week physical activity and nutritional education program for overweight Aboriginal and Torres Strait Islander women, BMC public health, vol. 11, p. 655.
Carapetis, JR, Brown, A, Wilson, NJ & Edwards, KN 2007. An Australian guideline for rheumatic fever and rheumatic heart disease: an abridged outline, The Medical Journal of Australia, vol. 186, no. 11, pp. 581-586.
Carson, KV, Brinn, MP, Peters, M, Veale, A, Esterman, AJ & Smith, BJ 2012. Interventions for smoking cessation in Indigenous populations, Cochrane Database of Systematic Reviews, vol. 1, p. CD009046.
Case, A, Lubotsky, D & Paxson, C 2002. Economic status and health in childhood: The origins of the gradient, The American Economic Review, vol. 92, no. 5, pp. 1308-1334.
Cass, A, Cunningham, J, Snelling, P, Wang, Z & Hoy, W 2003. Renal transplantation for Indigenous Australians: identifying the barriers to equitable access, Ethnicity & Health, vol. 8, no. 2, pp. 111-119.
Cass, A, Cunningham, J, Snelling, P, Wang, Z & Hoy, W 2004. Exploring the pathways leading from disadvantage to end-stage renal disease for indigenous Australians, Social Science & Medicine, vol. 58, no. 4, pp. 767-785.
Catto, M & Thomson, N 2008. Review of illicit drug use among Indigenous peoples, Australian Indigenous HealthPlain language, Australian Indigenous HealthInfoNet: http://www.healthinfonet.ecu.edu.au/uploads/docs/Illicits-pl-review.pdf.
Centers for Disease Control and Prevention 2011. Older Adults: Why Is Health Literacy Important?, Health Literacy, 2011, Centers for Disease Control, 'viewed' November 2016, https://www.cdc.gov/healthliteracy/DevelopMaterials/Audiences/OlderAdults/importance.html.
Chadban, S, McDonald, S, Excell, L, Livingstone, B & Shtangey, V 2005. Twenty Eighth Report: Australia and New Zealand Dialysis and Transplant Registry 2005, Commonwealth Department of Health and Ageing with Kidney Health Australia & New Zealand Ministry of Health, 28th ANZDATA Registry Report, ANZDATA Registry: Adelaide.
Chamberlain-Salaun, J, Mills, J, Kevat, PM, Remond, MG & Maguire, GP 2016. Sharing success - understanding barriers and enablers to secondary prophylaxis delivery for rheumatic fever and rheumatic heart disease, BMC Cardiovascular Disorders, vol. 16, no. 1, p. 166.
Chamberlain, C, McLean, A, Oats, J, Oldenburg, B, Eades, S, Sinha, A & Wolfe, R 2015. Low rates of postpartum glucose screening among indigenous and non-indigenous women in Australia with gestational diabetes, Maternal & Child Health Journal, vol. 19, no. 3, pp. 651-663.
Chandola, T & Jenkins, A 2014. The scope of adult and further education for reducing health inequalities, IF YOU COULD DO ONE THING... , The British Academy, pp. 82-90.
Charles, J 2016. An evaluation and comprehensive guide to successful Aboriginal health promotion, Australian Indigenous Health Bulletin, vol. 16, no. 1.
Chen, S, Matruglio, T, Weatherburn, D & Hua, J 2005. The Transition from Juvenile to Adult Criminal Careers, BOCSAR NSW Crime and Justice Bulletins, no. 86, May 2005, p. 12.
Chen, T & Harris, DC 2015. Challenges of chronic kidney disease prevention, The Medical Journal of Australia, vol. 203, no. 5, pp. 209-210.
Chew, DP, MacIsaac, AI, Lefkovits, J, Harper, RW, Slawomirski, L, Braddock, D, Horsfall, MJ, Buchan, HA, Ellis, CJ, Brieger, DB & Briffa, TG 2016. Variation in coronary angiography rates in Australia: correlations with socio-demographic, health service and disease burden indices, The Medical Journal of Australia, vol. 205, no. 3, pp. 114-120.
Chondur, R, Li, SQ, Guthridge, S & Lawton, P 2014. Does relative remoteness affect chronic disease outcomes? Geographic variation in chronic disease mortality in Australia, 2002-2006, Australian & New Zealand Journal of Public Health, vol. 38, no. 2, pp. 117-121.
Christou, A, Katzenellenbogen, J & Thompson, S 2010. Australia's national bowel cancer screening program: does it work for Indigenous Australians?, BMC public health, vol. 10, no. 373, p. 21.
Chung, LP, Lake, F, Hyde, E, McCamley, C, Phuangmalai, N, Lim, M, Waterer, G, Summers, Q & Moodley, Y 2016. Integrated multidisciplinary community service for chronic obstructive pulmonary disease reduces hospitalisations, Internal Medicine Journal, vol. 46, no. 4, pp. 427-434.
Clark, ML & Utz, SW 2014. Social determinants of type 2 diabetes and health in the United States, World journal of diabetes, vol. 5, no. 3, pp. 296-304.
Clifford, A, Doran, CM & Tsey, K 2012. Suicide prevention interventions targeting Indigenous peoples in Australia, New Zealand, the United States and Canada: a rapid review, Sax Institute for the NSW Ministry of Health, An Evidence Check Review, Sax Institute: http://www.saxinstitute.org.au.
Clifford, A, McCalman, J, Bainbridge, R & Tsey, K 2015. Interventions to improve cultural competency in health care for Indigenous peoples of Australia, New Zealand, Canada and the USA: a systematic review, International Journal for Quality in Health Care, vol. 27, no. 2, pp. 89-98.
Clough, AR, Guyula, T, Yunupingu, M & Burns, CB 2002. Diversity of substance use in eastern Arnhem Land (Australia): patterns and recent changes, Drug & Alcohol Review, vol. 21, no. 4, pp. 349-356.
Colley, JR 1974. Respiratory symptoms in children and parental smoking and phlegm production, British Medical Journal, vol. 2, no. 5912, pp. 201-204.
Collins, DJ & Lapsley, HM 2008. The costs of tobacco, alcohol and illicit drug abuse to Australian society in 2004/05, Department of Health and Ageing, DoHA: Canberra.
Commission for Children and Young People 2016. ‘Always was, always will be Koori children’: Systemic inquiry into services provided to Aboriginal children and young people in out- of-home care in Victoria, Commission for Children and Young People: Melbourne.

References
246
Committee for Economic Development of Australia 2015. Addressing entrenched disadvantage in Australia, Committee for Economic Development of Australia, CEDA: Melbourne.
Condon, JR, Barnes, A & Cunningham, J 2003. Cancer in Indigenous Australians: a review, Cancer Causes & Control, vol. 14, no. 2, pp. 109-121.
Condon, JR, Cunningham, J, Barnes, T, Armstrong, BK & Selva-Nayagam, S 2006. Cancer diagnosis and treatment in the Northern Territory: assessing health service performance for indigenous Australians, Internal Medicine Journal, vol. 36, no. 8, pp. 498-505.
Condon, JR, Zhang, X, Baade, P, Griffiths, K, Cunningham, J, Roder, DM, Coory, M, Jelfs, PL & Threlfall, T 2014. Cancer survival for Aboriginal and Torres Strait Islander Australians: a national study of survival rates and excess mortality, Population Health Metrics, vol. 12, no. 1, p. 1.
Conti, G, Heckman, J & Urzua, S 2010. The Education-Health Gradient, The American Economic Review, vol. 100, no. 2, pp. 234-238.
Coory, MD & Walsh, WF 2005. Rates of percutaneous coronary interventions and bypass surgery after acute myocardial infarction in Indigenous patients, The Medical Journal of Australia, vol. 182, no. 10, pp. 507-512.
Cosh, S, Hawkins, K, Skaczkowski, G, Copley, D & Bowden, J 2015. Tobacco use among urban Aboriginal Australian young people: a qualitative study of reasons for smoking, barriers to cessation and motivators for smoking cessation, Australian Journal of Primary Health, vol. 21, no. 3, pp. 334-341.
Council of Australian Governments 2014. COAG Meeting Communique 2 May 2014, Department of Social Services, Commonwealth of Australia: Canberra.
Cox, A, Dudgeon, P, Holland, C, Kelly, K, Scrine, C & Walker, R 2014. Using participatory action research to prevent suicide in Aboriginal and Torres Strait Islander communities, Australian Journal of Primary Health, vol. 20, no. 4, pp. 345-349.
Cramb, SM 2012. The first year counts: cancer survival among Indigenous and non-Indigenous Queenslanders, 1997–2006, The Medical Journal of Australia, vol. 196, no. 4, pp. 270-274.
Crane, JM, Keough, M, Murphy, P, Burrage, L & Hutchens, D 2011. Effects of environmental tobacco smoke on perinatal outcomes: a retrospective cohort study, BJOG: An International Journal of Obstetrics & Gynaecology, vol. 118, no. 7, pp. 865-871.
Crawford, H & Biddle, N 2017. Changing associations of selected social determinants with Aboriginal and Torres Strait Island health & wellbeing, 2002 to 2012-13, Centre for Aboriginal Economic Policy Research, Australian National University, Working Paper, No. 113/2017, CAEPR: Canberra.
Crinall, B, Boyle, J, Gibson-Helm, M, Esler, D, Larkins, S & Bailie, R 2016. Cardiovascular disease risk in young Indigenous Australians: a snapshot of current preventive health care, Australian & New Zealand Journal of Public Health,10.1111/1753-6405.12547.
Crowell, JA, Davis, CR, Joung, KE, Usher, N, McCormick, SP, Dearing, E & Mantzoros, CS 2016. Metabolic pathways link childhood adversity to elevated blood pressure in midlife adults, Obesity Research & Clinical Practice, vol. 10, no. 5, pp. 580-588.
Cullen, P, Chevalier, A, Byrne, J, Hunter, K, Gadsde, T & Ivers, R 2016. ‘It’s exactly what we needed’: A process evaluation of the DriveSafe NT Remote driver licensing program, by Australian College of Road Safety, presented at 2016 Australasian Road Safety Conference 6 – 8 September, ACRS: Canberra.
Cunningham, J 2002. Diagnostic and therapeutic procedures among Australian hospital patients identified as Indigenous, The Medical Journal of Australia, vol. 176, no. 2, pp. 58-62.
Cunningham, J, Rumbold, AR, Zhang, X & Condon, JR 2008. Incidence, aetiology, and outcomes of cancer in Indigenous peoples in Australia, Lancet Oncology, vol. 9, no. 6, pp. 585-595.
Cunningham, J 2010. Socio-economic gradients in self-reported diabetes for Indigenous and non-Indigenous Australians aged 18-64, Australian & New Zealand Journal of Public Health, vol. 34 Suppl 1, pp. S18-24.
Cunningham, J & Paradies, YC 2013. Patterns and correlates of self-reported racial discrimination among Australian Aboriginal and Torres Strait Islander adults, 2008-09: analysis of national survey data, International Journal for Equity in Health, vol. 12, p. 47.
d'Abbs, P & Shaw, G 2013. Monitoring trends in prevalence of petrol sniffing in selected Aboriginal communities: an interim report, Menzies School of Health Research, A report prepared for the Department of Health and Ageing, Menzies SHR: Darwin.
d'Abbs, P & Shaw, G 2016. Monitoring trends in the prevalence of petrol sniffing in selected Australian Aboriginal communities 2011-2014: Final Report, Menzies School of Health Research, Menzies SHR: Darwin.
Darwin Ottis Guidelines Group & Office for Aboriginal and Torres Strait Islander Health Otitis Media Technical Advisory Group 2010. Recommendations for Clinical Care Guidelines on the Management of Ottis Media in Aboriginal and Torres Strait Islander Populations, Menzies School of Health Research, Menzies SHR: Darwin.
Dasgupta, P, Baade, PD, Youlden, DR, Garvey, G, Aitken, JF, Wallington, I, Chynoweth, J, Zorbas, H, Roder, D & Youl, PH 2017. Variations in outcomes for Indigenous women with breast cancer in Australia: A systematic review, European Journal of Cancer Care,10.1111/ecc.12662 p. e12662.
References
247
Daws, K, Punch, A, Winters, M, Posenelli, S, Willis, J, MacIsaac, A, Rahman, MA & Worrall-Carter, L 2014. Implementing a working together model for Aboriginal patients with acute coronary syndrome: an Aboriginal Hospital Liaison Officer and a specialist cardiac nurse working together to improve hospital care, Australian Health Review, vol. 38, no. 5, pp. 552-556.
Day, A, Francisco, A & Jones, R 2013. Programs to improve
interpersonal safety in Indigenous communities: evidence and issues, AIHW & AIFS, Issues Paper, no. 4, Closing the Gap Clearinghouse: Canberra.
de Bortoli, L, Coles, J & Dolan, M 2015. Aboriginal and Torres Strait
Islander children in child protection: A sample from the Victorian Children’s Court, Journal of Social Work, vol. 15, no. 2, pp. 186-206.
de Costa, CM & Wenitong, M 2009. Could the Baby Bonus be a bonus for babies?, The Medical Journal of Australia, vol. 190, no. 5, pp. 242-243.
Deaton, A 2003. Health, Income, and Inequality, National Bureau of
Economic Research, NBER Reporter, NBER: https://www.nber.org/reporter/spring03/health.html.
Deeble, J 2009. Assessing the health service use of Aboriginal and
Torres Strait Islander peoples, National Health and Hospitals Reform Commission, NHHRC: Canberra.
Delpierre, C, Lauwers-Cances, V, Datta, GD, Lang, T & Berkman, L
2009. Using self-rated health for analysing social inequalities in health: a risk for underestimating the gap between socioeconomic groups?, Journal of Epidemiology and Community Health, vol. 63, no. 6, pp. 426-432.
Denney-Wilson, E, Robinson, A, Laws, R & Harris, MF 2014.
Development and feasibility of a child obesity prevention intervention in general practice: the Healthy 4 Life pilot study, Journal of Paediatrics & Child Health, vol. 50, no. 11, pp. 890-894.
Dennis, SM, Zwar, N, Griffiths, R, Roland, M, Hasan, I, Powell Davies,
G & Harris, M 2008. Chronic disease management in primary care: from evidence to policy, The Medical Journal of Australia, vol. 188, no. 8 Suppl, pp. S53-56.
Department for Child Protection and Family Support 2013. Family
and Domestic Violence Response Team: Monitoring and Evaluation Framework, Family and Domestic Violence Unit, FDVU: Perth.
Department of Education and Training 2016. Australian Early
Development Census National Report 2015, Department of Education and Training: Canberra.
Department of Families, Housing, Community Services and
Indigenous Affairs 2012. Footprints in Time: The Longitudinal Study of Indigenous Children Key Summary Report from Wave 3, FaHCSIA: Canberra.
Department of Families, Housing, Community Services and
Indigenous Affairs 2013. Footprints in Time: The Longitudinal Study of Indigenous Children Key Summary Report from Wave 4, FaHCSIA: Canberra.
Department of Families, Housing, Community Services and Indigenous Affairs 2015. Footprints in Time: The Longitudinal Study of Indigenous Children Key Summary Report from Wave 5, FaHCSIA: Canberra.
Department of Family and Community Services 2003. National
Indigenous Housing Guide: Improving the living environment for safety, health and sustainability, Department of Social Services, 2nd Edition, Commonwealth of Australia: Canberra.
Department of Health 2013. National Aboriginal & Torres Strait
Islander Health Plan 2013-2023, DoH, Cat. no. PAN 10290, Commonwealth of Australia: Canberra.
Department of Health 2014. Fourth National Aboriginal and Torres
Strait Islander Blood-borne Viruses and Sexually Transmissible Infections Strategy 2014–2017, DoH, Commonwealth of Australia: Canberra.
Department of Health 2016. Don't Make Smokes Your Story - Toolkit,
DoH, Commonwealth of Australia: Canberra. Department of Health 2017. Australia's Physical Activity and
Sedentary Behaviour Guidelines, Department of Health, 'viewed' November 2016, http://www.health.gov.au/internet/main/publishing.nsf/content/health-pubhlth-strateg-phys-act-guidelines.
Department of Health and Ageing 2001. Better Health Care: Studies
in the Successful Delivery of Primary Health Care Services for Aboriginal and Torres Strait Islander Australians, DoHA: Canberra.
Department of Social Services 2012. Cape York Welfare Reform
Evaluation, DSS: Canberra. Department of the Prime Minister and Cabinet 2016. Reporting
back.2014-15: How Indigenous Ranger and Indigenous Protected Areas programmes are working on country, Commonwealth of Australia: Canberra.
Department of the Prime Minister and Cabinet 2017. Closing the
Gap Prime Minister’s Report 2017, DPMC, Commonwealth of Australia: Canberra.
Devitt, J, Cass, A, Cunningham, J, Preece, C, Anderson, K & Snelling,
P 2008. Study Protocol--Improving Access to Kidney Transplants (IMPAKT): a detailed account of a qualitative study investigating barriers to transplant for Australian Indigenous people with end-stage kidney disease, BMC Health Services Research, vol. 8, p. 31.
Dietitians Association of Australia 2013. Food Security for Aboriginal
and Torres Strait Islander Peoples Policy, DAA: Canberra. Dockery, AM 2011. Traditional culture and the wellbeing of
Indigenous Australians: An analysis of the 2008 NATSISS, Centre for Labour Market Research, Curtin University, CLMR Discussion Paper Series 2011, CLMR: Perth.
Dockery, AM, Ong, R, Colquhoun, S, Li, J & Kendall, G 2013. Housing
and children’s development and wellbeing: evidence from Australian data, Australian Housing and Urban Research Institute, AHURI Final Report, no. 201, AHURI: Melbourne.

References
248
Dodson, M & Smith, D 2003. Governance for sustainable development: Strategic issues and principles for Indigenous Australian communities, Centre for Aboriginal Economic Policy Research, Australian National University, Discussion Paper, no. 250/2003, CAEPR: Canberra.
Dong, M, Giles, WH, Felitti, VJ, Dube, SR, Williams, JE, Chapman, DP & Anda, RF 2004. Insights into causal pathways for ischemic heart disease: adverse childhood experiences study, Circulation, vol. 110, no. 13, pp. 1761-1766.
Dooley, D, Fielding, J & Levi, L 1996. Health and unemployment, Annual Review of Public Health, vol. 17, pp. 449-465.
Drake, AJ & Reynolds, RM 2010. Impact of maternal obesity on offspring obesity and cardiometabolic disease risk, Reproduction, vol. 140, no. 3, pp. 387-398.
Drewnowski, A & Specter, SE 2004. Poverty and obesity: the role of energy density and energy costs, The American Journal of Clinical Nutrition, vol. 79, no. 1, pp. 6-16.
DSI Consulting Pty Ltd & Benham, D 2009. An investigation of the effect of socio-economic factors on the Indigenous life expectancy gap, DSI Consulting Pty Ltd: Canberra.
Dudgeon, P, Wright, M & Coffin, J 2010. Talking It and Walking It: Cultural Competence, Journal of Australian Indigenous Issues, vol. 13, no. 3, pp. 29-44.
Dudgeon, P, Cox, K, D'Anna, D, Dunkley, C, Hams, K, Kelly, K, Scrine, C & Walker, R 2012. Hear Our Voices: Community Consultations for the Development of an Empowerment, Healing and Leadership Program for Aboriginal people living in the Kimberley, Western Australia - Final Research Report, Centre for Research Excellence Aboriginal Health and Wellbeing, Australian Indigenous HealthBulletin, 3, Telethon Institute for Child Health Research: Perth.
Dudgeon, P, Walker, R, Scrine, C, Shepherd, CCJ, Calma, T & Ring, IT 2014a. Effective strategies to strengthen the mental health and wellbeing of Aboriginal and Torres Strait Islander people, AIHW & AIFS, Issues Paper, no. 12, Closing the Gap Clearinghouse: Canberra.
Dudgeon, P, Wright, M, Paradies, Y, Garvey, D & Walker, I 2014b. Aboriginal Social, Cultural and Historical Contexts, from Working Together: Aboriginal and Torres Strait Islander Mental Health and Wellbeing Principles and Practice, Commonwealth of Australia: Canberra, pp. 3-24.
Dudgeon, P, Milroy, J, Calma, T, Luxford, Y, Ring, IT, Walker, R, Cox, A, Georgatos, G & Holland, C 2016. Solutions That Work: What the evidence and our people tell us, Aboriginal and Torres Strait Islander Suicide Prevention Evaluation Project, University of Western Australia, Aboriginal and Torres Strait Islander Suicide Prevention Evaluation Project Report, ATSISPEP: Perth.
Duley, P, Botfield, JR, Ritter, T, Wicks, J & Brassil, A 2016. The Strong Family Program: An Innovative Model to Engage Aboriginal and Torres Strait Islander Youth and Elders With Reproductive and Sexual Health Community Education, Health Promotion Journal of Australia,DOI: 10.1071/HE16015.
Durey, A, McAullay, D, Gibson, B & Slack-Smith, L 2016. Aboriginal Health Worker perceptions of oral health: a qualitative study in Perth, Western Australia, International Journal for Equity in Health, vol. 15, no. 1, p. 4.
Duvivier, BM, Schaper, NC, Bremers, MA, van Crombrugge, G, Menheere, PP, Kars, M & Savelberg, HH 2013. Minimal intensity physical activity (standing and walking) of longer duration improves insulin action and plasma lipids more than shorter periods of moderate to vigorous exercise (cycling) in sedentary subjects when energy expenditure is comparable, PLOS ONE, vol. 8, no. 2, p. e55542.
Dwyer, J, Silburn, K & WIlson, G 2004. National Strategies for Improving Indigenous Health and Health Care, Office for Aboriginal and Torres Strait Islander Health, Review of the Australian Government’s Aboriginal and Torres Strait Islander Primary Health Care Program, no. 3486/JN8643, OATSIH: Canberra.
Dyson, K, Kruger, E & Tennant, M 2014. A decade of experience evolving visiting dental services in partnership with rural remote Aboriginal communities, Australian Dental Journal, vol. 59, no. 2, pp. 187-192.
Eades, D 2013. They don't speak an Aboriginal language, or do they?, from Aboriginal ways of using English, Aboriginal Studies Press: Canberra, ACT, pp. 56-75.
Eades, S 2004. Maternal and Child Health Care Services: Actions in the Primary Health Care Setting to Improve the Health of Aboriginal and Torres Strait Islander Women of Childbearing age, Infants and Young Children, Menzies School of Health Research, Aboriginal and Torres Strait Islander Primary Health Care Review, Consultant Report No 6, OATSIH: Darwin.
Eades, S, Read, AW, Stanley, FJ, Eades, FN, McCaullay, D & Williamson, A 2008. Bibbulung Gnarneep ('solid kid'): causal pathways to poor birth outcomes in an urban Aboriginal birth cohort, Journal of Paediatrics & Child Health, vol. 44, no. 6, pp. 342-346.
Eades, S, Sanson-Fisher, RW, Wenitong, M, Panaretto, K, D'Este, C, Gilligan, C & Stewart, J 2012. An intensive smoking intervention for pregnant Aboriginal and Torres Strait Islander women: a randomised controlled trial, The Medical Journal of Australia, vol. 197, no. 1, pp. 42-46.
Eckenrode, J, Campa, M, Luckey, DW, Henderson Jr, CR, Cole, R, Kitzman, H, Anson, E, Sidora-Arcoleo, K, Powers, J & Olds, D 2010. Long-term Effects of Prenatal and Infancy Nurse Home Visitation on the Life Course of Youths, Archives of Pediatrics & Adolescent Medicine, vol. 164, no. 1, pp. 9-15.
Edwards, D & McMillan, J 2015. Completing university in a growing sector: Is equity an issue?, Australian Council for Educational Research, Report submitted to the National Centre for Student Equity in Higher Education, ACER: Melbourne.
Edwards, J & Moffat, CD 2014. Otitis media in remote communities, Australian Nursing & Midwifery Journal, vol. 21, no. 9, p. 28.
Egger, G & Dixon, J 2014. Beyond Obesity and Lifestyle: A Review of 21st Century Chronic Disease Determinants, BioMed Research International, vol. 2014.

References
249
Ekblom-Bak, E, Ekblom, B, Vikström, M, de Faire, U & Hellénius, M 2014. The importance of non-exercise physical activity for cardiovascular health and longevity, British Journal of Sports Medicine, vol. 48, no. 3, pp. 233-238.
Elliott, DJ & Silverman, M 2013. Why Music Matters: Philosophical and Cultural Foundations, from Music, Health and Wellbeing, Oxford University Press: Oxford.
Emerson, L, Fox, S & Smith, C 2015. Good Beginnings: Getting it right in the early years Review of the evidence on the importance of a healthy start to life and on interventions to promote good beginnings: a report prepared for the Lowitja Institute, The Lowitja Institute: Melbourne.
England, LJ, Levine, RJ, Qian, C, Soule, LM, Schisterman, EF, Yu, KF & Catalano, PM 2004. Glucose tolerance and risk of gestational diabetes mellitus in nulliparous women who smoke during pregnancy, The American Journal of Epidemiology, vol. 160, no. 12, pp. 1205-1213.
Espey, DK, Jim, MA, Cobb, N, Bartholomew, M, Becker, T, Haverkamp, D & Plescia, M 2014. Leading causes of death and all-cause mortality in American Indians and Alaska Natives, The American Journal of Public Health, vol. 104 Suppl 3, pp. S303-311.
Esterman, AJ, Fountaine, T & McDermott, R 2016. Are general practice characteristics predictors of good glycaemic control in patients with diabetes? A cross-sectional study, The Medical Journal of Australia, vol. 204, no. 1, p. 23.
Fairley, CK & Hocking, JS 2012. Sexual health in Indigenous communities, The Medical Journal of Australia, vol. 197, no. 11, pp. 597-598.
Fairthorne, J, Walker, R, de Klerk, N & Shepherd, CCJ 2016. Early mortality from external causes in Aboriginal mothers: a retrospective cohort study, BMC public health, vol. 16, no. 1, p. 1.
Ferdinand, A, Paradies, Y & Kelaher, M 2012. Mental Health Impacts of Racial Discrimination in Victorian Aboriginal Communities: The Localities Embracing and Accepting Diversity (LEAD) Experiences of Racism Survey, The Lowitja Institute: Melbourne.
Fisher, DA & Weeramanthri, TS 2002. Hospital care for Aboriginals and Torres Strait Islanders: appropriateness and decision making, The Medical Journal of Australia, vol. 176, no. 2, pp. 49-50.
Fitts, MS, Palk, GR & Jacups, SP 2013. Alcohol restrictions and drink driving in remote Indigenous communities in Queensland, Australia, by Queensland University of Technology, presented at Proceedings of the 23rd Canadian Multidisciplinary Road Safety Conference, QUT: Montreal, Canada.
Fitts, MS, Palk, GR, Lennon, AJ & Clough, AR 2017. The characteristics of young Indigenous drink drivers in Queensland, Australia, Traffic Injury Prevention, vol. 18, no. 3, pp. 237-243.
Fitzpatrick, JP, Latimer, J, Carter, M, Oscar, J, Ferreira, ML, Carmichael Olson, H, Lucas, BR, Doney, R, Salter, C, Try, J, Hawkes, G, Fitzpatrick, E, Hand, M, Watkins, RE, Martiniuk, AL, Bower, C, Boulton, J & Elliott, EJ 2015. Prevalence of fetal alcohol syndrome in a population-based sample of children living in remote Australia: the Lililwan Project, Journal of Paediatrics & Child Health, vol. 51, no. 4, pp. 450-457.
Foley, M, Zhao, Y, You, J & Skov, S 2014. Injuries in the Northern Territory, 1997-2011, Department of Health - Northern Territory, DoH-NT: Darwin.
Foreman, J, Keel, S, Xie, J, van Wijngaarden, P, Crowston, J, Taylor, HR & Dirani, M 2016. The National Eye Health Survey 2016: Full report of the first national survey to determine the prevalence and major causes of vision impairment and blindness in Australia, Centre for Eye Research Australia & Vision 2020 Australia, CERA: Melbourne.
Forrest, CB & Starfield, B 1996. The effect of first-contact care with primary care clinicians on ambulatory health care expenditures, Journal of Family Practice, vol. 43, no. 1, pp. 40-48.
France, K, Henley, N, Payne, J, D'Antoine, H, Bartu, A, O'Leary, C, Elliott, E & Bower, C 2010. Health professionals addressing alcohol use with pregnant women in Western Australia: barriers and strategies for communication, Substance Use & Misuse, vol. 45, no. 10, pp. 1474-1490.
Franks, C 2006. Gallinyalla: a town of substance? A descriptive study of alcohol, tobacco, medicines and other drug use in a rural setting, Rural and Remote Health, vol. 6, no. 2, p. 491.
Freeman, T, Edwards, T, Baum, F, Lawless, A, Jolley, G, Javanparast, S & Francis, T 2014. Cultural respect strategies in Australian Aboriginal primary health care services: beyond education and training of practitioners, Australian & New Zealand Journal of Public Health, vol. 38, no. 4, pp. 355-361.
Freemantle, J, Ritte, R, Smith, K, Iskandar, D, Cutler, T, Heffernan, B, Zhong, G, Mensah, FK & Read, AW 2014. Victorian Aboriginal Child Mortality Study Patterns, Trends and Disparities in Mortality between Aboriginal and Non-Aboriginal Infants and Children, 1999–2008, The Lowitja Institute: Melbourne.
Gakidou, E, Cowling, K, Lozano, R & Murray, CJ 2010. Increased educational attainment and its effect on child mortality in 175 countries between 1970 and 2009: a systematic analysis, The Lancet, vol. 376, no. 9745, pp. 959-974.
Gall, S, Huynh, QL, Magnussen, CG, Juonala, M, Viikari, JS, Kahonen, M, Dwyer, T, Raitakari, OT & Venn, A 2014. Exposure to parental smoking in childhood or adolescence is associated with increased carotid intima-media thickness in young adults: evidence from the Cardiovascular Risk in Young Finns study and the Childhood Determinants of Adult Health Study, European Heart Journal, vol. 35, no. 36, pp. 2484-2491.
References
250
Gee, G & Walsemann, K 2009. Does health predict the reporting of racial discrimination or do reports of discrimination predict health? Findings from the National Longitudinal Study of Youth, Social Science & Medicine, vol. 68, no. 9, pp. 1676-1684.
Gee, G, Dudgeon, P, Schultz, C, Hart, A & Kelly, K 2014. Aboriginal and Torres Strait Islander social and emotional wellbeing, from Working Together: Aboriginal and Torres Strait Islander Mental Health and Wellbeing Principles and Practice, Commonwealth of Australia: Canberra, pp. 55-68.
Giarola, BF, McCallum, GB, Bailey, EJ, Morris, PS, Maclennan, C & Chang, AB 2014. Retrospective review of 200 children hospitalised with acute asthma. Identification of intervention points: a single centre study, Journal of Paediatrics & Child Health, vol. 50, no. 4, pp. 286-290.
Gibson, O & Segal, L 2009. Avoidable hospitalisation in Aboriginal and non-Aboriginal people in the Northern Territory, The Medical Journal of Australia, vol. 191, no. 1, p. 411.
Goldman-Mellor, SJ, Caspi, A, Harrington, H, Hogan, S, Nada-Raja, S, Poulton, R & Moffitt, TE 2014. Suicide attempt in young people: a signal for long-term health care and social needs, JAMA Psychiatry, vol. 71, no. 2, pp. 119-127.
Goldsmid, S & Willis, M 2016. Methamphetamine use and acquisitive crime: Evidence of a relationship Australian Institute of Criminology, Trends & issues in crime and criminal justice no. 516, AIC: Canberra.
Goodwin, V & Davis, B 2011. Crime families: Gender and the intergenerational transfer of criminal tendencies, Australian Institute of Criminology, no. 414, AIC: Canberra.
Gould, GS, Munn, J, Watters, T, McEwen, A & Clough, AR 2013. Knowledge and views about maternal tobacco smoking and barriers for cessation in Aboriginal and Torres Strait Islanders: A systematic review and meta-ethnography, Nicotine & Tobacco Research, vol. 15, no. 5, p. 863-874.
Graham, D, Wallace, V, Selway, D, Howe, E & Kelly, T 2014. Why are so many Indigenous Women Homeless in Far North and North West Queensland, Australia? Service Providers’ Views of Causes, Journal of Tropical Psychology, vol. Volume 4, no. 8.
Graham, S, Guy, RJ, Ward, JS, Kaldor, J, Donovan, B, Knox, J, McCowen, D, Bullen, P, Booker, J, O’Brien, C, Garrett, K & Wand, HC 2015. Incidence and predictors of annual chlamydia testing among 15–29 year olds attending Aboriginal primary health care services in New South Wales, Australia, BMC Health Services Research, vol. 15, no. 1, p. 437.
Grau, I, Ardanuy, C, Calatayud, L, Schulze, MH, Linares, J & Pallares, R 2014. Smoking and alcohol abuse are the most preventable risk factors for invasive pneumonia and other pneumococcal infections, International Journal of Infectious Diseases, vol. 25, pp. 59-64.
Gray, C, Brown, A & Thomson, N 2012. Review of cardiovascular health among Indigenous Australians, Australian Indigenous HealthInfoNet, http://www.healthinfonet.ecu.edu.au/heart_review.
Gray, C, Macniven, R & Thomson, N 2013. Review of physical activity among Indigenous people, Australian Indigenous Health Bulletin, vol. 13, no. 3.
Gray, D, Stearne, A, Bonson, M, Wilkes, E, Butt, J & Wilson, M 2014. Review of the Aboriginal and Torres Strait Islander Alcohol, Tobacco and Other Drugs Treatment Service Sector: Harnessing Good Intentions (Revised Version), National Drug Research Institute, Curtin University, NDRI: Perth, WA.
Gray, M, Hunter, B & Lohoar, S 2012. Increasing Indigenous employment rates, AIHW & AIFS, Issues Paper, no.3 Closing the Gap Clearinghouse: Canberra.
Gray, M, Hunter, B & Biddle, N 2014. The economic and social benefits of increasing Indigenous employment, Centre for Aboriginal Economic Policy Research, Australian National University, CAEPR Topical Issue, no. 1/2014, CAEPR: Canberra.
Gray, M & Hunter, B 2016. Indigenous Employment after the Boom, Centre for Aboriginal Economic Policy Research, Australian National University, CAEPR Topical Issue, no. 1/2016, CAEPR: Canberra.
Griew, R, Tilton, E, Stewart, J, Eades, S, Lea, T, Peltola, C, Livingstone, L, Harmon, K & Dawkins, Z 2007. Family Centred Primary Health Care: review of evidence and models Office of Aboriginal and Torres Strait Islander Health, Department of Health and Ageing, OATSIH: Canberra.
Griew, R 2008. The link between primary health care and health outcomes for Aboriginal and Torres Strait Islander Australians: A Report for the Office for Aboriginal andTorres Strait Islander Health Department of Health and Ageing, Robert Griew Consulting, DoHA: Waverley, NSW.
Gunasekera, H, Morris, PS, Daniels, J, Couzos, S & Craig, JC 2009. Otitis media in Aboriginal children: the discordance between burden of illness and access to services in rural/remote and urban Australia, Journal of Paediatrics & Child Health, vol. 45, no. 7-8, pp. 425-430.
Guthridge, SL, Ryan, P, Condon, JR, Moss, JR & Lynch, J 2014. Trends in hospital admissions for conditions associated with child maltreatment, Northern Territory, 1999-2010, The Medical Journal of Australia, vol. 201, pp. 162-166.
Guthridge, SL, Li, L, Silburn, S, Li, SQ, McKenzie, J & Lynch, J 2015. Impact of perinatal health and socio-demographic factors on school education outcomes: A population study of Indigenous and non-Indigenous children in the Northern Territory, Journal of Paediatrics & Child Health, vol. 51, no. 8, pp. 778-786.
Guy, R, Ward, JS, Smith, KS, Su, JY, Huang, RL, Tangey, A, Skov, S, Rumbold, A, Silver, B, Donovan, B & Kaldor, JM 2012. The impact of sexually transmissible infection programs in remote Aboriginal communities in Australia: a systematic review, Sex Health, vol. 9, no. 3, pp. 205-212.
Haastrup, MB, Pottegård, A & Damkier, P 2014. Alcohol and breastfeeding, Basic & clinical pharmacology & toxicology, vol. 114, no. 2, pp. 168-173.

References
251
Hall, J 2013. Communication disorders and indigenous Australians: a synthesis and critique of the available literature, Honours, Bachelor of Speech Pathology (Honours): Edith Cowan University.
Hall, SE, Bulsara, CE, Bulsara, MK, Leahy, TG, Culbong, MR, Hendrie, D & Holman, CD 2004. Treatment patterns for cancer in Western Australia: does being Indigenous make a difference?, The Medical Journal of Australia, vol. 181, no. 4, pp. 191-194.
Hamilton, S, Mills, B, McRae, S & Thompson, S 2016. Cardiac Rehabilitation for Aboriginal and Torres Strait Islander people in Western Australia, BMC Cardiovascular Disorders, vol. 16, p. 150.
Hancock, KJ, Shepherd, CCJ, Lawrence, D & Zubrick, SR 2013. Student attendance and educational outcomes: Every day counts., Telethon Institute for Child Health Research & Centre for Child Health Research, University of Western Australia, Report for the Department of Education, Employment and Workplace Relations, Telethon Institute: Canberra.
Hardy, LL, O'Hara, BJ, Hector, D, Engelen, L & Eades, SJ 2014. Temporal trends in weight and current weight-related behaviour of Australian Aboriginal school-aged children, The Medical Journal of Australia, vol. 200, no. 11, pp. 667-671.
Harlap, S & Davies, AM 1974. Infant admissions to hospital and maternal smoking, The Lancet, vol. 1, no. 7857, pp. 529-532.
Harvey, PW, Petkov, J, Kowanko, I, Helps, Y & Battersby, M 2013. Chronic condition management and self-management in Aboriginal communities in South Australia: outcomes of a longitudinal study, Australian Health Review, vol. 37, no. 2, pp. 246-250.
Hawkes, DC 2001. Indigenous peoples: self-government and intergovernmental relations, International Social Science Journal, vol. 53, no. 167, pp. 153-161.
Hayman, N 1999. The poor health status of Aboriginal and Torres Strait Islander peoples: Can more Indigenous doctors make a difference?, New Doctor, no. 70, pp. 19-21.
Hayman, NE, White, NE & Spurling, GK 2009. Improving Indigenous patients’ access to mainstream health services: the Inala experience, The Medical Journal of Australia, vol. 190, no. 10, pp. 604-606.
Haysom, L, Indig, D, Moore, E, Hardy, LL & van den Dolder, PA 2013. Prevalence and perceptions of overweight and obesity in Aboriginal and non-Aboriginal young people in custody, The Medical Journal of Australia, vol. 199, no. 4, pp. 266-270.
He, VY, Condon, JR, Ralph, AP, Zhao, Y, Roberts, K, de Dassel, JL, Currie, BJ, Fittock, M, Edwards, KN & Carapetis, JR 2016. Long-Term Outcomes From Acute Rheumatic Fever and Rheumatic Heart Disease: A Data-Linkage and Survival Analysis Approach, Circulation, vol. 134, no. 3, pp. 222-232.
Hearn, S, Nancarrow, H, Rose, M, Massi, L, Wise, M, Conigrave, K, Barnes, I & Bauman, A 2011. Evaluating NSW SmokeCheck: a culturally specific smoking cessation training program for health professionals working in Aboriginal health, Health Promotion Journal of Australia, vol. 22, no. 3, pp. 189-195.
Heffernan, EB, Andersen, KC, Dev, A & Kinner, S 2012. Prevalence of mental illness among Aboriginal and Torres Strait Islander people in Queensland prisons, The Medical Journal of Australia, vol. 197, no. 1, pp. 37-41.
Hefler, M & Thomas, D 2013. The Use of Incentives to Stop Smoking in Pregnancy among Aboriginal and Torres Strait Islander Women, The Lowitja Institute: Melbourne.
Helps, Y, Moodie, D & Warman, G 2010. Aboriginal People Travelling Well: Community Report, The Lowitja Institute & Flinders Aboriginal Health Research Unit, The Lowitja Institute: Melbourne.
Hendrickx, D, Stephen, A, Lehmann, D, Silva, D, Boelaert, M, Carapetis, J & Walker, R 2015. A systematic review of the evidence that swimming pools improve health and wellbeing in remote Aboriginal communities in Australia, Australian & New Zealand Journal of Public Health, vol. 40, no. 1, pp. 30-36.
Henley, G & Harrison, JE 2013. Injury of Aboriginal and Torres Strait Islander people due to transport 2005-06 to 2009-10, Australian Institute of Health and Welfare, Injury Research and Statistics Series, no. 85, Cat. no. INJCAT 161, AIHW: Canberra.
Hepworth, J, Askew, D, Foley, W, Duthie, D, Shuter, P, Combo, M & Clements, L-A 2015. How an urban Aboriginal and Torres Strait Islander primary health care service improved access to mental health care, International Journal for Equity in Health, vol. 14, no. 1, p. 51.
Herceg, A 2005. Improving health in Aboriginal and Torres Strait Islander mothers, babies and young children: a literature review, Office for Aboriginal and Torres Strait Islander Health, Department of Health and Ageing, Healthy for Life: Healthy Life. Healthy Community, OATSIH: Canberra.
Hernandez, SE, Conrad, DA, Marcus-Smith, MS, Reed, P & Watts, C 2012. Patient-centered innovation in health care organizations: A conceptual framework and case study application, Health Care Management Review.
Hewitt de Alcántara, C 1998. Uses and abuses of the concept of governance, International Social Science Journal, vol. 50, no. 155, pp. 105-113.
Hirayama, T 1981. Non-smoking wives of heavy smokers have a higher risk of lung cancer: a study from Japan, British Medical Journal (Clininical Research Edition), vol. 282, no. 6259, pp. 183-185.
Hodyl, NA, Grzeskowiak, LE, Stark, MJ, Scheil, W & Clifton, VL 2014. The impact of Aboriginal status, cigarette smoking and smoking cessation on perinatal outcomes in South Australia, The Medical Journal of Australia, vol. 201, no. 5, pp. 274-278.
References
252
Hollander, MJ, Kadlec, H, Hamdi, R & Tessaro, A 2009. Increasing value for money in the Canadian healthcare system: new findings on the contribution of primary care services, Healthcare Quarterly, vol. 12, no. 4, pp. 32-44.
Holman, C & Joyce, S 2014. A Promising Future: WA Aboriginal Health Programs, Department of Health - Western Australia, Review of performance with recommendations for consolidation and advance, DoH-WA: Perth.
Holmes, MD, Chen, WY, Feskanich, D, Kroenke, CH & Colditz, GA 2005. Physical activity and survival after breast cancer diagnosis, JAMA, vol. 293, no. 20, pp. 2479-2486.
Hopkins, S 2014. A visual profile of Queensland Indigenous and non-Indigenous school children, and the association between vision and reading, PhD, http://eprints.qut.edu.au/71393/
Horta, BL, Loret de Mola, C & Victora, CG 2015. Long-term consequences of breastfeeding on cholesterol, obesity, systolic blood pressure and type 2 diabetes: a systematic review and meta-analysis, Acta Paediatrica, vol. 104, no. 467, pp. 30-37.
House of Representatives Standing Committee on Socialy Policy and Legal Affairs 2012. FASD: The Hidden Harm - Inquiry into the prevention, diagnosis and management of Fetal Alcohol Spectrum Disorders, Department of the House of Representatives, The Parliament of the Commonwealth of Australia: Canberra.
Howlett, M, Gray, M & Hunter, B 2015. Unpacking the income of Indigenous and non-Indigenous Australians: Wages, government payments and other income, Centre for Aboriginal Economic Policy Research, Australian National University, CAEPR Working Paper, no. 99/2015, CAEPR: Canberra.
Hoy, W, Kelly, A, Jacups, S, McKendry, K, Baker, P, MacDonald, S, Wang, Z, Punguatji, N, Kerinauia, J, Tipiloura, E, Tipiloura, E & Harrison, C 1999. Stemming the tide: reducing cardiovascular disease and renal failure in Australian Aborigines, Australian & New Zealand Journal of Medicine, vol. 29, no. 3, pp. 480-483.
Hoy, W, Baker, P, Kelly, A & Wang, Z 2000. Reducing premature death and renal failure in Australian Aboriginals, The Medical Journal of Australia, vol. 172, no. 10, pp. 473-478.
Hoy, W & Nicol, J 2010. Birthweight and natural deaths in a remote Australian Aboriginal community, The Medical Journal of Australia, vol. 192, no. 1, pp. 14-19.
Hoy, WE, Kondalsamy-Chennakesavan, S, Wang, Z, Briganti, E, Shaw, J, Polkinghorne, K & Chadban, S 2007. Quantifying the excess risk for proteinuria, hypertension and diabetes in Australian Aborigines: comparison of profiles in three remote communities in the Northern Territory with those in the AusDiab study, Australian & New Zealand Journal of Public Health, vol. 31, no. 2, pp. 177-183.
Hoy, WE, White, AV, Tipiloura, B, Singh, GR, Sharma, S, Bloomfield, H, Swanson, CE, Dowling, A & McCredie, DA 2016. The influence of birthweight, past poststreptococcal glomerulonephritis and current body mass index on levels of albuminuria in young adults: the multideterminant model of renal disease in a remote Australian Aboriginal population with high rates of renal disease and renal failure, Nephrology, Dialysis, Transplantation, vol. 31, no. 6, pp. 971-977.
Hunt, J, Smith, D, Garling, S & Sanders, W 2008. Contested governance : culture, power and institutions in indigenous Australia, Centre for Aboriginal Economic Policy Research, Australian National University, Research Monograph, no. 29, CAEPR: Canberra.
Hunter, BH 2010. Pathways for Indigenous school leavers to undertake training or gain employment, AIHW & AIFS, Resource Sheet, no. 2, Closing the Gap Clearinghouse: Canberra.
Hunter, E 2007. Disadvantage and discontent: a review of issues relevant to the mental health of rural and remote Indigenous Australians, Australian Journal of Rural Health, vol. 15, no. 2, pp. 88-93.
Hunter, K, Porykali, B, Ivers, RQ, Clapham, K, Browne, J, Bilston, LE, Ralph, M, Simpson, JM & Keay, L 2016. Buckle-Up Safely: safe travel for Aboriginal and Torres Strait Islander children., presented at Lowitja Institute International Indigenous Health and Wellbeing Conference, The George Institute for Global Health: Australia, 8-10 Nov 2016.
Indig, D & Wales, NS 2010. 2009 NSW Inmate Health Survey: Key Findings Report, Justice Health: Sydney.
Indig, D, Vecchiato, C, Haysom, L, Beilby, R, Carter, J, Champion, U, Gaskin, C, Heller, E, Kumar, S, Mamone, N, Muir, P, Van den Dolder, PA & Whitton, G 2011. 2009 NSW Young People in Custody Health Survey: Full Report, Justice Health: Sydney.
Intergovernmental Committee on Drugs, SCoT 2012. National Tobacco Strategy 2012-2018 Department of Health, no. D1013, IGCD: Canberra.
Ip, P 2016. Environment, Child Health & Development, presented at International Behavioral Health Conference, BeHealth 2016, Hong Kong Society of Behavioral Health: Hong Kong, 2017.
Ivers, RQ, Hunter, K, Clapham, K, Helps, Y, Senserrick, T, Byrne, J, Martiniuk, A, Daniels, J & Harrison, JE 2016. Driver licensing: descriptive epidemiology of a social determinant of Aboriginal and Torres Strait Islander health, Australian & New Zealand Journal of Public Health, vol. 40, no. 4, pp. 377-382.
Jackson, N & Waters, E 2005. Criteria for the systematic review of health promotion and public health interventions, Health Promotion International, vol. 20, no. 4, pp. 367-374.
Jamieson, LM, Roberts-Thomson, KF & Sayers, SM 2010a. Risk indicators for severe impaired oral health among indigenous Australian young adults, BMC Oral Health, vol. 10, no. 1, p. 1.

References
253
Jamieson, LM, Sayers, S & Roberts-Thomson, KF 2010b. Clinical oral health outcomes in young Australian Aboriginal adults compared with national-level counterparts, The Medical Journal of Australia, vol. 192, pp. 558-561.
Jansen, PW, Mensah, FK, Nicholson, JM & Wake, M 2013. Family and neighbourhood socioeconomic inequalities in childhood trajectories of BMI and overweight: longitudinal study of Australian children, PLOS ONE, vol. 8, no. 7, p. e69676.
Janu, EK, Annabattula, BI, Kumariah, S, Zajaczkowska, M, Whitehall, JS, Edwards, MJ, Lujic, S & Masters, IB 2014. Paediatric hospitalisations for lower respiratory tract infections in Mount Isa, The Medical Journal of Australia, vol. 200, no. 10, pp. 591-594.
Jervis-Bardy, J, Sanchez, L & Carney, AS 2014. Otitis media in Indigenous Australian children: review of epidemiology and risk factors, Journal of Laryngology and Otology, vol. 128 Suppl 1, pp. S16-27.
Johanson, RP & Hill, P 2011. Indigenous health: A role for private general practice, Australian Family Physician, vol. 40, no. 1/2.
Johnson, NW, Lalloo, R, Kroon, J, Fernando, S & Tut, O 2014. Effectiveness of water fluoridation in caries reduction in a remote Indigenous community in Far North Queensland, Australian Dental Journal, vol. 59, no. 3, pp. 366-371.
Johnston, V & Thomas, DP 2008. Smoking behaviours in a remote Australian Indigenous community: The influence of family and other factors, Social Science & Medicine, vol. 67, no. 11, pp. 1708-1716.
Johnston, V, Lea, T & Carapetis, J 2009. Joining the dots: The links between education and health and implications for indigenous children, Journal of Paediatrics & Child Health, vol. 45, no. 12, pp. 692-697.
Johnston, V, Walker, N, Thomas, DP, Glover, M, Chang, AB, Bullen, C, Morris, P, Brown, N, Vander Hoorn, S, Borland, R, Segan, C, Trenholme, A, Mason, T, Fenton, D & Ellis, K 2010. The study protocol for a randomized controlled trial of a family-centred tobacco control program about environmental tobacco smoke (ETS) to reduce respiratory illness in Indigenous infants, BMC public health, vol. 10, p. 114.
Johnston, V, Thomas, DP, McDonnell, J & Andrews, RM 2011. Maternal smoking and smoking in the household during pregnancy and postpartum: findings from an Indigenous cohort in the Northern Territory, The Medical Journal of Australia, vol. 194, no. 10.
Kahneman, D & Deaton, A 2010. High income improves evaluation of life but not emotional well-being, Proceedings of the National Academy of Sciences, vol. 107, no. 38, pp. 489–493.
Karam, J, Sinclair, G & Rackstraw, L 2014. Dignity, Diversion, Home and Hope: A Review of Interventions for Volatile Substance Misuse in Regional North Queensland, Department of the Prime Minister and Cabinet, DPMC: Canberra.
Kariminia, A, Butler, T, Jones, J & Law, M 2012. Increased mortality among Indigenous persons during and after release from prison in New South Wales, Australian & New Zealand Journal of Public Health, vol. 36, no. 3, pp. 274-280.
Kassim, R, Harris, M-A, Leong, GM & Heussler, H 2016. Obstructive sleep apnoea in children with obesity, Journal of Paediatrics & Child Health, vol. 52, no. 3, pp. 284-290.
Katzenellenbogen, JM, Knuiman, MW, Sanfilippo, FM, Hobbs, MST & Thompson, SC 2014. Prevalence of stroke and coexistent conditions: disparities between indigenous and nonindigenous Western Australians, International Journal of Stroke, vol. 9, pp. 61-68.
Katzmarzyk, PT, Church, TS, Craig, CL & Bouchard, C 2009. Sitting time and mortality from all causes, cardiovascular disease, and cancer, Medicine & Science in Sports & Exercise, vol. 41, no. 5, pp. 998-1005.
Kavanagh, AM, Krnjacki, L, Beer, A, Lamontagne, AD & Bentley, R 2013. Time trends in socio-economic inequalities for women and men with disabilities in Australia: evidence of persisting inequalities, International Journal for Equity in Health, vol. 12, p. 73.
Kelaher, MA, Ferdinand, AS & Paradies, Y 2014. Experiencing racism in health care: The mental health impacts for Victorian Aboriginal communities, The Medical Journal of Australia, vol. 201, no. 1, pp. 44-47.
Kelly-Irving, M, Mabile, L, Grosclaude, P, Lang, T & Delpierre, C 2013. The embodiment of adverse childhood experiences and cancer development: potential biological mechanisms and pathways across the life course, International Journal of Public Health, vol. 58, no. 1, pp. 3-11.
Kelly, J, Dwyer, J, Willis, E & Pekarsky, B 2014. Travelling to the city for hospital care: access factors in country Aboriginal patient journeys, Australian Journal of Rural Health, vol. 22, no. 3, pp. 109-113.
Kennare, R, Heard, A & Chan, A 2005. Substance use during pregnancy: risk factors and obstetric and perinatal outcomes in South Australia, Australian & New Zealand Journal of Obstetrics and Gynaecology, vol. 45, no. 3, pp. 220-225.
Kennedy, B & Firman, D 2004. Indigenous SIFA- Revealing the ecological fallacy. Population and society: issues, research, policy, Australian Population Association, APA: Canberra.
Khalidi, N, McGill, K, Houweling, H, Arnett, K & Sheahan, A 2012. Closing the Gap in Low Birthweight Births between Indigenous and Non-Indigenous Mothers, Queensland, Health Statistics Centre, Queensland Health, Statbite no. 46, QLD Health: Brisbane.
Khan, J, Vesel, L, Bahl, R & Martines, JC 2015. Timing of breastfeeding initiation and exclusivity of breastfeeding during the first month of life: effects on neonatal mortality and morbidity--a systematic review and meta-analysis, Maternal & Child Health Journal, vol. 19, no. 3, pp. 468-479.
References
254
Khanal, N, Clayton, P, McDonald, S & Jose, M 2016. Overview of dialysis in indigenous compared to nonindigenous Australians, Clinical Nephrology, vol. 86 (2016), no. 13, pp. 123-127.
Kildea, S, Stapleton, H, Murphy, R, Low, NB & Gibbons, K 2012. The Murri clinic: a comparative retrospectivestudy of an antenatal clinic developed forAboriginal and Torres Strait Islander women, BMC Pregnancy & Childbirth, vol. 12, no. 159.
Kildea, S & Van Wagner, V 2013. 'Birthing on Country' maternity service delivery models: a rapid review An Evidence Check review brokered by the Sax Institute for the Maternity Services Inter-Jurisdictional Committee for the Australian Health Ministers’ Advisory Council, Sax Institute: Sydney.
Kim, S, Macaskill, P, Hodson, EM, Daylight, J, Williams, R, Kearns, R, Vukasin, N, Lyle, DM & Craig, JC 2017. Beginning the trajectory to ESKD in adult life: albuminuria in Australian aboriginal children and adolescents, Pediatric Nephrology, vol. 32, no. 1, pp. 119-129.
Kingsley, J, Townsend, M, Henderson-Wilson, C & Bolam, B 2013. Developing an Exploratory Framework Linking Australian Aboriginal Peoples’ Connection to Country and Concepts of Wellbeing, International Journal of Environmental Research and Public Health, vol. 10, no. 2, pp. 678-698.
Kiraly, M & Humphreys, C 2016. ‘It's about the whole family’: family contact for children in kinship care, Child & Family Social Work, vol. 21, no. 2, pp. 228-239.
Knott, VE, Gilligan, G, Maksimovic, L, Shen, D & Murphy, M 2016. Gender determinants of smoking practice in Indigenous communities: an exploratory study, European Journal of Cancer Care, vol. 25, no. 2, pp. 231-241.
Kokkinos, PF, Narayan, P & Papademetriou, V 2001. Exercise as hypertension therapy, Cardiology Clinics, vol. 19, no. 3, pp. 507-516.
Kong, K & Coates, HLC 2009. Natural history, definitions, risk factors and burden of otitis media, The Medical Journal of Australia, vol. 191, no. 9, p. 39.
Kowanko, I, Helps, Y, Harvey, P, Battersby, M, McCurry, B, Carbine, R, Boyd, J & Abdulla, O 2012. Chronic condition management strategies in Aboriginal communities: final report 2011, Flinders University, Aboriginal Health Council of South Australia: Adelaide.
Kratzmann, M, Mitchell, E, Ware, J, Banach, L, Ward, J & Ryan, J 2011. Injecting drug use and associated harms among Aboriginal Australians, Australian National Council on Drugs, Research Paper 22, ANCD: Canberra.
Kruger, E & Tennant, M 2015. Potentially preventable hospital separations related to oral health: a 10-year analysis, Australian Dental Journal, vol. 60, no. 2, pp. 205-211.
Kulaga, S, Zargarzadeh, AH & Berard, A 2009. Prescriptions filled during pregnancy for drugs with the potential of fetal harm, BJOG: An International Journal of Obstetrics & Gynaecology, vol. 116, no. 13, pp. 1788-1795.
Lalloo, R, Jamieson, LM, Ha, D, Ellershaw, A & Luzzi, L 2015. Does fluoride in the water close the dental caries gap between Indigenous and non-Indigenous children?, Australian Dental Journal, vol. 60, no. 3, pp. 390-396.
Lalloo, R, Jamieson, LM, Ha, D & Luzzi, L 2016. Inequalities in Tooth Decay in Australian Children by Neighbourhood Characteristics and Indigenous Status, Journal of Health Care for the Poor and Underserved, vol. 27, no. 1 Suppl, pp. 161-177.
Lamb, S & McKenzie, P 2001. Patterns of success and failure in the transition from school to work in Australia, Australian Council for Educational Research, Longitudinal Surveys of Australian Youth (LSAY) Research Report 18, ACER: http://research.acer.edu.au/lsay_research/67.
Larkins, S, Geia, L & Panaretto, K 2006. Consultations in general practice and at an Aboriginal community controlled health service: do they differ?, Rural and Remote Health, vol. 6, no. 3, p. 560.
LaVeist, TA, Nuru-Jeter, A & Jones, KE 2003. The Association of Doctor-Patient Race Concordance with Health Services Utilization, Journal of Public Health Policy, vol. 24, no. 3, pp. 312-323.
Lawrence, M, Dodd, Z, Mohor, S, Dunn, S, De Crespigny, C, Power, C & MacKean, L 2009. Improving the patient journey: Achieving positive outcomes for remote Aboriginal cardiac patients.
Laws, P & Sullivan, E 2005. Australia's mothers and babies 2003, Australian Institute of Health and Welfare, Perinatal statistics series no. 16, Cat. no. PER 29, AIHW National Perinatal Statistics Unit: Sydney.
Lawton, PD, Cunningham, J, Zhao, Y, Gray, NA, Chatfield, MD, Baade, PD, Murali, K & Jose, M 2015. Survival of Indigenous Australians receiving renal replacement therapy: closing the gap?, The Medical Journal of Australia, vol. 202, no. 4, pp. 200-204.
Laycock, A & Brands, J 2015. Chronic Illness Care for Aboriginal and Torres Strait Islander people: Final Report, Research, MSoH, ESP Project: Priority Evidence-Practice Gaps and Stakeholder Views on Barriers and Strategies for Improvement, Menzies SHR.
Lee, KS, Harrison, K, Mills, K & Conigrave, KM 2014. Needs of Aboriginal Australian women with comorbid mental and alcohol and other drug use disorders, Drug & Alcohol Review, vol. 33, no. 5, pp. 473-481.
Leeder, SR, Corkhill, R, Irwig, LM, Holland, WW & Colley, JR 1976. Influence of family factors on the incidence of lower respiratory illness during the first year of life, British journal of preventive & social medicine, vol. 30, no. 4, pp. 203-212.
Leite, RS, Marlow, NM & Fernandes, JK 2013. Oral Health and Type 2 Diabetes, The American Journal of the Medical Sciences, vol. 345, no. 4, pp. 271-273.

References
255
Leske, R, Sarmardin, D, Woods, A & Thorpe, K 2015. What works and why? Early childhood professionals’ perspectives on effective early childhood education and care services for Indigenous families, Australasian Journal of Early Childhood, vol. 40, no. 1, pp. 109-118.
Levy, M 2005. Prisoner health care provision: Reflections from Australia, International Journal of Prisoner Health, vol. 1, no. 1, pp. 65-73.
Li, M & McDermott, R 2015. Obesity, albuminuria, and gamma-glutamyl transferase predict incidence of hypertension in indigenous Australians in rural and remote communities in northern Australia, Journal of Hypertension, vol. 33, no. 4, pp. 704-709; discussion 709-710.
Li, SQ, Gray, N, Guthridge, S, Pircher, S, Wang, Z & Zhao, Y 2009. Avoidable mortality trends in Aboriginal and non-Aboriginal populations in the Northern Territory, 1985-2004, Australian & New Zealand Journal of Public Health, vol. 33, no. 6, pp. 544-550.
Lim, FJ, Lehmann, D, McLoughlin, A, Harrison, C, Willis, J, Giele, C, Keil, AD & Moore, HC 2014. Risk factors and comorbidities for invasive pneumococcal disease in Western Australian Aboriginal and non-Aboriginal people, Pneumonia, vol. 4, pp. 24-34.
Liu, J, Davidson, E, Bhopal, R, White, M, Johnson, M, Netto, G, Deverill, M & Sheikh, A 2012. Adapting health promotion interventions to meet the needs of ethnic minority groups: mixed-methods evidence synthesis, Health Technology Assessment, vol. 16, no. 44, Chapter 4.
Lloyd, J, Baldry, E, McEntyre, E, Indig, D, Harris, MF, Thiele, D, Bandjalan, K, Hure, S, Schuster, L, Moore, L, Davison, J, Abbott, P, Reath, J & Sherwood, J 2013. Primary health care services better meeting the needs of Aboriginal Australians transitioning from prison to the community: SPRINT final report, Centre for Primary Health Care and Equity, Faculty of Medicine, A predictable and preventable path: IAMHDCD Report, Study 7.3, UNSW: Sydney.
Lo Giudice, D, Smith, K, Fenner, S, Hyde, Z, Atkinson, D, Skeaf, L, Malay, R & Flicker, L 2016. Incidence and predictors of cognitive impairment and dementia in Aboriginal Australians: A follow-up study of 5 years, Alzheimers Dement, vol. 12, no. 3, pp. 252-261.
Lohoar, S, Butera, N & Kennedy, E 2014. Strengths of Australian Aboriginal cultural practices in family life and child rearing, Child Family Community Australia, Australian Institute of Famliy Studies, CFCA Paper No 25 AIFS: Canberra.
Longstreet, D, Heath, D, Savage, I, Vink, R & Panaretto, K 2008. Estimated nutrient intake of urban Indigenous participants enrolled in a lifestyle intervention program, Nutrition & Dietetics, vol. 65, no. 2, pp. 128-133.
Lucas, C, Charlton, KE & Yeatman, H 2014. Nutrition advice during pregnancy: do women receive it and can health professionals provide it?, Maternal & Child Health Journal, vol. 18, no. 10, pp. 2465-2478.
Ludlow, JP, Evans, SF & Hulse, G 2004. Obstetric and perinatal outcomes in pregnancies associated with illicit substance abuse, Australian & New Zealand Journal of Obstetrics and Gynaecology, vol. 44, no. 4, pp. 302-306.
Lukaszyk, C, Harvey, L, Sherrington, C, Keay, L, Tiedemann, A, Coombes, J, Clemson, L & Ivers, R 2016. Risk factors, incidence, consequences and prevention strategies for falls and fall-injury within older indigenous populations: a systematic review, Australian & New Zealand Journal of Public Health, vol. 40, no. 6, pp. 564-568.
Luyckx, VA, Bertram, JF, Brenner, BM, Fall, C, Hoy, WE, Ozanne, SE & Vikse, BE 2013. Effect of fetal and child health on kidney development and long-term risk of hypertension and kidney disease, The Lancet, vol. 382, no. 9888, pp. 273-283.
MacLachlan, JH, Allard, N, Towell, V & Cowie, BC 2013. The burden of chronic hepatitis B virus infection in Australia, 2011, Australian & New Zealand Journal of Public Health, vol. 37, no. 5, pp. 416-422.
MacLean, S, Harney, A & Arabena, K 2015. Primary health-care responses to methamphetamine use in Australian Indigenous communities, Australian Journal of Primary Health, vol. 21, no. 4, pp. 384-390.
MacPhail, C & McKay, K 2016. Social determinants in the sexual health of adolescent Aboriginal Australians: a systematic review, Health & Social Care in the Community, doi 10.1111/hsc.12355.
MacRae, A, Thomson, N, Potter, C & Anomie 2013. Review of injury among Indigenous peoples, Australian Indigenous HealthInfoNet.
Magee, C, Caputi, P & Iverson, D 2014. Lack of sleep could increase obesity in children and too much television could be partly to blame, Acta Paediatrica, vol. 103, no. 1, p. e27-31.
Mahuteau, S, Karmel, T, Mavromaras, K & Zhu, R 2015. Educational Outcomes of Young Indigenous Australians, National Institute of Labour Studies, Flinders University, Report submitted to the National Centre for Student Equity in Higher Education (NCSEHE), NILS: Adelaide.
Mainous, AG, 3rd, Baker, R, Love, MM, Gray, DP & Gill, JM 2001. Continuity of care and trust in one's physician: evidence from primary care in the United States and the United Kingdom, Family Medicine, vol. 33, no. 1, pp. 22-27.
Maksimovic, L, Shen, D, Bandick, M, Ettridge, K & Eckert, M 2015. Evaluation of the pilot phase of the 'Give up smokes for good' social marketing campaign, Health Promotion Journal of Australia, vol. 26, no. 1, pp. 16-23.
Malseed, C, Nelson, A & Ware, R 2014. Evaluation of a School-Based Health Education Program for Urban Indigenous Young People in Australia, Health,http://dx.doi.org/10.4236/health.2014.67077, no. 6, pp. 587-597.
Malvaso, CG, Delfabbro, PH & Day, A 2017. The child protection and juvenile justice nexus in Australia: A longitudinal examination of the relationship between maltreatment and offending, Child Abuse & Neglect, vol. 64, pp. 32-46.
Manning, M, Ambrey, C & Fleming, C 2016. A Longitudinal Study of Indigenous Wellbeing in Australia, Journal of Happiness Studies, vol. 17, no. 6, pp. 2503-2525.

References
256
Marashi-Pour, S, Cretikos, M, Lyons, C, Rose, N, Jalaludin, B & Smith, J 2015. The association between the density of retail tobacco outlets, individual smoking status, neighbourhood socioeconomic status and school locations in New South Wales, Australia, Spatial and Spatio-temporal Epidemiology, vol. 12, pp. 1-7.
Markwick, A, Ansari, Z, Sullivan, M & McNeil, J 2014. Social determinants and lifestyle risk factors only partially explain the higher prevalence of food insecurity among Aboriginal and Torres Strait Islanders in the Australian state of Victoria: a cross-sectional study, BMC public health, vol. 14, p. 598.
Marley, JV, Kitaura, T, Atkinson, D, Metcalf, S, Maguire, GP & Gray, D 2014. Clinical trials in a remote Aboriginal setting: lessons from the BOABS smoking cessation study, BMC public health, vol. 14, p. 579.
Marmot, M 2002. The influence of income on health: views of an epidemiologist, Health Affairs (Millwood), vol. 21, no. 2, pp. 31-46.
Marmot, M 2015. The Health Gap: The Challenge of an Unequal World, Bloomsbury Publishing: Great Britain.
Marmot, M 2016. 2016 Boyer Lectures: Fair Australia: Social Justice and the Health Gap, Sep 2016, Australian Broadcasting Corporation, http://www.abc.net.au/radionational/programs/boyerlectures/series/2016-boyer-lectures/7802472.
Massie, R, Theodoros, D, McPherson, B & Smaldino, J 2004. Sound-field Amplification: Enhancing the Classroom Listening Environment for Aboriginal and Torres Strait Islander Children, The Australian Journal of Indigenous Education, vol. 33, pp. 47-53.
May, PJ, Bowen, AC & Carapetis, JR 2016. The inequitable burden of group A streptococcal diseases in Indigenous Australians, The Medical Journal of Australia, vol. 205, no. 5, pp. 201-203.
Mazanov, J & Byrne, DG 2008. Modelling change in adolescent smoking behaviour: stability of predictors across analytic models, British Journal of Health Psychology, vol. 13, no. Pt 3, pp. 361-379.
McCallum, GB, Chatfield, MD, Morris, PS & Chang, AB 2016. Risk factors for adverse outcomes of Indigenous infants hospitalized with bronchiolitis, Pediatric Pulmonology, vol. 51, no. 6, pp. 613-623.
McCalman, J, Tsey, K, Bainbridge, R, Rowley, K, Percival, N, Lynette, O, Brands, J, Whiteside, M & Judd, J 2014. The characteristics, implementation and effects of Aboriginal and Torres Strait Islander health promotion tools: a systematic literature search, BMC public health, vol. 14, no. 1, p. 712.
McDermott, R, Tulip, F, Schmidt, B & Sinha, A 2003. Sustaining better diabetes care in remote indigenous Australian communities, British Medical Journal, vol. 327, no. 7412, p. 428.
McDermott, R, Campbell, S, Li, M & McCulloch, B 2009. The health and nutrition of young indigenous women in north Queensland - intergenerational implications of poor food quality, obesity, diabetes, tobacco smoking and alcohol use, Public Health Nutrition, vol. 12, no. 11, pp. 2143-2149.
McGough, S, Wynaden, D & Wright, M 2017. Experience of providing cultural safety in mental health to Aboriginal patients: A grounded theory study, International Journal of Mental Health Nursing, doi 10.1111/inm.12310.
McGrail, MR & Humphreys, JS 2015. Geographical mobility of general practitioners in rural Australia, The Medical Journal of Australia, vol. 203, no. 2, pp. 92-97.
McLennan, V 2015. Family and community resilience in an Australian Indigenous community, Australian Indigenous Health Bulletin, vol. 15, no. 3.
Measey, MA, Li, SQ, Parker, R & Wang, Z 2006. Suicide in the Northern Territory, 1981-2002, The Medical Journal of Australia, vol. 185, no. 6, pp. 315-319.
Medlin, LG, Chang, AB, Fong, K, Jackson, R, Bishop, P, Dent, A, Hill, DC, Vincent, S & O'Grady, KA 2014. Indigenous Respiratory Outreach Care: the first 18 months of a specialist respiratory outreach service to rural and remote Indigenous communities in Queensland, Australia, Australian Health Review, vol. 38, no. 4, pp. 447-453.
Meiklejohn, JA, Adams, J, Valery, PC, Walpole, ET, Martin, JH, Williams, HM & Garvey, G 2016. Health professional's perspectives of the barriers and enablers to cancer care for Indigenous Australians, European Journal of Cancer Care (Engl), vol. 25, no. 2, pp. 254-261.
Memmott, P, Birdsall-Jones, C & Greenop, K 2012. Australian Indigenous house crowding, Australian Housing and Urban Research Institute, AHURI Final Report, no. 194, AHURI: Melbourne.
Menéndez , P, Weatherburn, D, Kypri, K & Fitzgerald, J 2015. Lockouts and last drinks: The impact of the January 2014 liquor licence reforms on assaults in NSW, Australia, New South Wales Bureau of Crime Statistics & Research, Department of Justice, Crime and Justice Bulletin: Contemporary Issues in Crime and Justice, No. 183, NSW BoCSAR: NSW.
Menzies, RI & Singleton, RJ 2009. Vaccine preventable diseases and vaccination policy for indigenous populations, Pediatric Clinics of North America, vol. 56, no. 6, pp. 1263-1283.
Merkur, S, Sassi, F & McDaid, D 2013. Promoting health, preventing disease: is there an economic case?, World Health Organization, Policy summary 6, WHO: Copenhagen.
Meuleners, LB, Hendrie, D & Lee, AH 2008. Hospitalisations due to interpersonal violence: a population-based study in Western Australia, The Medical Journal of Australia, vol. 188, no. 10, pp. 572-575.
Midford, R, MacLean, S, Catto, M, Thomson, N & Debuyst, O 2011. Review of volatile substance use among Indigenous people, Australian Indigenous HealthBulletin, vol. 11, no. 1.

References
257
Miller, J, Knott, V, Wilson, C, Cunningham, J, Condon, J & Roder, Dea 2010. Aboriginal and Torres Strait Islander Cancer Control Research Project, Cancer Australia: Sydney.
Minichiello, A, Lefkowitz, ARF, Firestone, M, Smylie, JK & Schwartz, R 2015. Effective strategies to reduce commercial tobacco use in Indigenous communities globally: A systematic review, BMC public health, vol. 16, p. 21.
Minniecon, D & Kong, K 2005. Healthy Futures: Defining best practice in the recruitment and retention on Indigenous medical students, Australian Indigenous Doctors' Association: Canberra.
Mission Australia 2016. National Aboriginal and Torres Strait Islander Youth Report 2016, Mission Australia: www.missionaustralia.com.au.
Mitchell, L 2011. Domestic violence in Australia: an overview of the issues, Department of Parliamentary Services: Canberra.
Moeller, J & Quiñonez, C 2016. The Association Between Income Inequality and Oral Health in Canada: A Cross-Sectional Study, International Journal of Health Services, vol. 46, no. 4.
Möller, H, Falster, K, Ivers, R, Falster, MO, Clapham, K & Jorm, LR 2017. Closing the Aboriginal child injury gap: targets for injury prevention, Australian & New Zealand Journal of Public Health, vol. 41, no. 1, pp. 8-14.
Monson-Wilbraham, L 2014. Watering the Garden of Family Wellbeing: Empowering Aboriginal and Torres Strait Islander people to bloom and grow, The Lowitja Institute: Melbourne.
Moore, SP, Green, AC, Bray, F, Garvey, G, Coory, M, Martin, J & Valery, PC 2014. Survival disparities in Australia: an analysis of patterns of care and comorbidities among indigenous and non-indigenous cancer patients, BMC Cancer, vol. 14, p. 517.
Moran, M, Porter, D & Curth-Bibb, J 2014. Funding Indigenous organisations: improving governance performance through innovations in public finance management in remote Australia, AIHW & AIFS, Issues Paper, no. 11, Closing the Gap Clearinghouse: Canberra.
Morrell, S, You, H & Baker, D 2012. Estimates of cancer incidence, mortality and survival in aboriginal people from NSW, Australia, BMC Cancer, vol. 12, no. 1, p. 168.
Morris, PS, Leach, AJ, Halpin, S, Mellon, G, Gadil, G, Wigger, C, Mackenzie, G, Wilson, C, Gadil, E & Torzillo, P 2007. An overview of acute otitis media in Australian Aboriginal children living in remote communities, Vaccine, vol. 25, no. 13, pp. 2389-2393.
Mouzos, J & Makkai, T 2004. Women's Experiences of Male Violence: findings from the Australian component of the International Violence Against Women Survey (IVAWS), Australian Institute of Criminology, Research and Public Policy Series, no. 56, AIC: Canberra.
Moylan, S, Eyre, HA, Maes, M, Baune, BT, Jacka, FN & Berk, M 2013. Exercising the worry away: how inflammation, oxidative and nitrogen stress mediates the beneficial effect of physical activity on anxiety disorder symptoms and behaviours, Neuroscience & Biobehavioral Reviews, vol. 37, no. 4, pp. 573-584.
Multijurisdictional Syphilis Outbreak Working Group 2016. Meeting Communique 16 June 2016, SIREN-WA Sexual Health and Blood-borne Virus Applied Research and Evaluation Network, Multijurisdictional Syphilis Outbreak Working Group (MJSO) Communique, SIREN-WA: http://siren.org.au/research/multijurisdictional-syphilis-outbreak-working-group-mjso/.
Murphy, E & Best, E 2012. The Aboriginal Maternal and Infant Health Service: a decade of achievement in the health of women and babies in NSW, New South Wales Public Health Bulletin, vol. 23, no. 4, pp. 68-72.
Mutch, RC, Watkins, R & Bower, C 2015. Fetal alcohol spectrum disorders: notifications to the Western Australian Register of Developmental Anomalies, Journal of Paediatrics & Child Health, vol. 51, no. 4, pp. 433-436.
Naidu, L, Chiu, C, Habig, A, Lowbridge, C, Jayasinghe, S, Wang, H, McIntyre, P & Menzies, R 2013. Vaccine preventable diseases and vaccination coverage in Aboriginal and Torres Strait Islander people, Australia 2006-2010, Communicable diseases intelligence quarterly report, vol. 37 Suppl, pp. S1-95.
Napper, G, Fricke, T, Anjou, MD & Jackson, AJ 2015. Breaking down barriers to eye care for Indigenous people: a new scheme for delivery of eye care in Victoria, Clinical & Experimental Optometry, vol. 98, no. 5, pp. 430-434.
National Aboriginal Health Strategy Working Party 1989. A national Aboriginal health strategy / prepared by the National Aboriginal Health Strategy Working Party, National Aboriginal Health Strategy Working Party: Canberra.
National Disability Insurance Agency 2016. National Disability Insurance Agency 12th Quarterly Report to COAG Disability Reform Council 30 June 2016, National Disability Insurance Agency, Quarterly Reports, https://ndis.gov.au, NDIA:
National Health and Medical Research Council 2000. Nutrition in Aboriginal and Torres Strait Islander Peoples, Department of Health and Ageing, An Information Paper, NHMRC: Canberra.
National Health and Medical Research Council 2009. Australian Guidelines To Reduce Health Risks From Drinking Alcohol, Department of Health and Ageing, NHMRC: Canberra.
National Health and Medical Research Council 2013a. Australian Dietary Guidelines, Department of Health and Ageing, NHMRC: Canberra.
National Health and Medical Research Council 2013b. Infant Feeding Guidelines: Summary, Department of Health and Ageing, NHMRC: Canberra.
National Health Priority Action Council 2006. National Chronic Disease Strategy, Department of Health and Ageing, DoHA: Canberra.

References
258
National Heart Foundation of Australia 2006. Physical activity in the prevention and management of type 2 diabetes, National Health and Medical Research Council, Fact Sheet, NHFA: https://www.heartfoundation.org.au/.
National Heart Foundation of Australia & Australian Healthcare & Hospitals Association 2010. Better hospital care for Aboriginal and Torres Strait Islander people experiencing heart attack, National Heart Foundation of Australia & Australian Healthcare and Hospitals Association, NHFA: http://ahha.asn.au/.
National Heart Foundation of Australia 2016. Guideline for the diagnosis and management of hypertension in adults - 2016, National Heart Foundation of Australia, NHFA: Melbourne.
National Indigenous Drug and Alcohol Committee 2014. Alcohol and other drug treatment for Aboriginal and Torres Strait Islander peoples, National Indigenous Drug and Alcohol Committee, ANCD: Canberra.
National Inquiry into the Separation of Aboriginal and Torres Strait Islander Children from Their Families 1997. Bringing them Home: Report Human Rights and Equal Opportunity Commission, HREOC: Sydney.
National Public Health Partnership 2006. Making the connections: Guidelines for effective approaches to Aboriginal and Torres Strait Islander public health, National Public Health Partnership: Melbourne.
National Trachoma Surveillance and Reporting Unit 2017. Australian Trachoma Surveillance Report 2015, The Kirby Institute, University of New South Wales, UNSW: Sydney.
Nelson, J, MacDonald, H, Dufty-Jones, R, Dunn, K & Paradies, Y 2015. Ethnic discrimination in private rental housing markets in Australia, from Housing in 21st century Australia: people, practices and policies, Ashgate Publishing: England, pp. 39-56.
Nelson, SM, Matthews, P & Poston, L 2010. Maternal metabolism and obesity: modifiable determinants of pregnancy outcome, Human Reproduction Update, vol. 16, no. 3, pp. 255-275.
Nembhard, WN, Bourke, J, Leonard, H, Eckersley, L, Li, J & Bower, C 2016. Twenty-five-year survival for aboriginal and caucasian children with congenital heart defects in Western Australia, 1980 to 2010, Birth Defects Res A Clin Mol Teratol, vol. 106, no. 12, pp. 1016-1031.
Ness, AR, Leary, SD, Mattocks, C, Blair, SN, Reilly, JJ, Wells, J, Ingle, S, Tilling, K, Smith, GD & Riddoch, C 2007. Objectively Measured Physical Activity and Fat Mass in a Large Cohort of Children, PLoS Medicine, vol. 4, no. 3, p. e97.
Nettleton, C, Napolitano, DA & Stephens, C 2007. An Overview of Current Knowledge of the Social Determinants of Indigenous Health: Working Paper, London School of Hygiene & Tropical Medicine, Report Commissioned by Commission on Social Determinants of Health, World Health Organisation for Symposium on the Social Determinants of Indigenous Health Adelaide 2007: http://researchonline.lshtm.ac.uk/id/eprint/6662.
Nganampa Health Council, South Australia Committee of Review on Environmental and Public Health within the Anangu Pitjantjatjara Lands in South Australia, South Australian Health Commission & Aboriginal Health Organisation of South Australia 1987. Report of Uwankara Palyanyku Kanyintjaku: An Environmental and Public Health Review within the Anangu Pitjantjatjara Lands, Committee of Review on Environmental and Public Health within the Anangu Pitjantjatjara Lands: Adelaide.
Nicholson, A, Borland, R, Davey, ME, Stevens, M & Thomas, DP 2015. Past quit attempts in a national sample of Aboriginal and Torres Strait Islander smokers, The Medical Journal of Australia, vol. 202, no. 10.
Nicholson, A, Borland, R, Bennet, PT, Davey, MA, Sarin, J, Van der Sterren, A, Stevens, M & Thomas, D 2017. The Effect of Pack Warning Labels on Quitting and Related Thoughts and Behaviors in a National Cohort of Aboriginal and Torres Strait Islander Smokers, Nicotine & Tobacco Research, vol. NTW396.
Noble, N, Paul, C, Sanson-Fisher, R, Turon, H, Turner, N & Conigrave, K 2016. Ready, set, go: a cross-sectional survey to understand priorities and preferences for multiple health behaviour change in a highly disadvantaged group, BMC Health Services Research, vol. 16, no. 1, p. 488.
NSW Department of Health 2010. Closing the Gap: 10 Years of Housing for Health in NSW - An evaluation of a healthy housing intervention, Department of Health - NSW, DoH-NSW: Sydney.
O'Connor, CC, Ali, H, Guy, RJ, Templeton, DJ, Fairley, CK, Chen, MY, Dickson, BM, Marshall, LJ, Grulich, AE, Hellard, ME, Kaldor, JM, Donovan, B & Ward, JS 2014. High chlamydia positivity rates in Indigenous people attending Australian sexual health services, The Medical Journal of Australia, vol. 200, no. 10, pp. 595-598.
O'Leary, CM, Nassar, N, Kurinczuk, JJ, de Klerk, N, Geelhoed, E, Elliott, EJ & Bower, C 2010. Prenatal Alcohol Exposure and Risk of Birth Defects, Pediatrics,10.1542/peds.2010-0256.
O’Grady, K, Taylor-Thomson, DM, Chang, AB, Torzillo, PJ, Morris, PS, Mackenzie, GA, Wheaton, GR, Bauert, PA, De Campo, MP & De Campo, JF 2010. Rates of radiologically confirmed pneumonia as defined by the World Health Organization in Northern Territory Indigenous children, The Medical Journal of Australia, vol. 192, no. 10, pp. 592-595.
O’Sullivan, BG, Joyce, CM & McGrail, MR 2014. Rural outreach by specialist doctors in Australia: a national cross-sectional study of supply and distribution, Human Resources for Health, vol. 12, no. 1, p. 50.
Öberg, M, Jaakkola, MS, Woodward, A, Peruga, A & Prüss-Ustün, A 2011. Worldwide burden of disease from exposure to second-hand smoke: a retrospective analysis of data from 192 countries, The Lancet, vol. 377, no. 9760, pp. 139-146.
OECD 2009. Measuring disparities in health status and in access and use of health care in OECD countries, OECD Health Working Paper, no. 43, OECD Publishing.
OECD 2011. Health at a Glance 2011:OECD Indicators, OECD Publishing: Paris.

References
259
OECD 2014. Obesity Update, OECD Directorate for Employment, Labour and Social Affairs, OECD Publishing: www.oecd.org.
OECD 2015. Health at a Glance 2015: OECD Indicators, OECD Publishing: Paris.
Office for Aboriginal and Torres Strait Islander Health 2004. Defining the Domains: Aboriginal and Torres Strait Islander Health Performance Framework, Department of Health and Ageing, DoHA: Canberra.
Office of the Auditor General Western Australia 2015. SIHI: District Medical Workforce Investment Program, Office of the Auditor General Western Australia, Western Australian Auditor General’s Report, OAG-WA: Perth.
Office on Smoking and Health (US) 2006. The Health Consequences of Involuntary Exposure to Tobacco Smoke: A Report of the Surgeon General, Centers for Disease Control and Prevention (US), CDCP (US): Atlanta.
Olds, DL, Kitzman, H, Knudtson, MD, Anson, E, Smith, JA & Cole, R 2014. Effect of home visiting by nurses on maternal and child mortality: results of a 2-decade follow-up of a randomized clinical trial, JAMA Pediatrics, vol. 168, no. 9, pp. 800-806.
Ou, L, Chen, J, Hillman, K & Eastwood, J 2010. The comparison of health status and health services utilisation between Indigenous and non-Indigenous infants in Australia, Australian & New Zealand Journal of Public Health, vol. 34, no. 1, pp. 50-56.
Øvretveit, J 2012. Summary of 'Do changes to patient-provider relationships improve quality and save money?', The Health Foundation: London.
Page, A, Ambrose, S, Glover, J & Hetzel, D 2007. Atlas of Avoidable Hospitalisations in Australia: ambulatory care-sensitive conditions, Public Health Information Development Unit, University of Adelaide, PHIDU: Adelaide.
Panaretto, KS, Gardner, KL, Button, S, Carson, A, Schibasaki, R, Wason, G, Baker, D, Mein, J, Dellit, A & Lewis, D 2013. Prevention and management of chronic disease in aboriginal and islander community controlled health services in Queensland: a quality improvement study assessing change in selected clinical performance indicators over time in a cohort of services, BMJ open, vol. 3, no. 4.
Panaretto, KS, Wenitong, M, Button, S & Ring, IT 2014. Aboriginal community controlled health services: leading the way in primary care, The Medical Journal of Australia, vol. 200, no. 11, pp. 649-652.
Paradies, Y 2006. A review of psychosocial stress and chronic disease for 4th world indigenous peoples and African Americans, Ethnicity & Disease, vol. 16, no. 1, pp. 295-308.
Paradies, Y 2007. Exploring the Health Effects of Racism for Indigenous people, presented at Rural Health Research Colloquium, RHRC: Tamworth, NSW, 15 - 17 May 2007
Paradies, Y & Cunningham, J 2008. Development and validation of the Measure of Indigenous Racism Experiences (MIRE), International Journal for Equity in Health, vol. 7, p 9.
Paradies, Y 2011. Measuring interpersonal racism: An Indigenous Australian case study, presented at CAEPR Seminar Series, CAEPR: Centre for Aboriginal Economic Policy Research, Australian National University, Canberra, 10 August 2011.
Paradies, Y & Cunningham, J 2012. The DRUID study: exploring mediating pathways between racism and depressive symptoms among indigenous Australians, Social Psychiatry & Psychiatric Epidemiology, vol. 47, no. 2, pp. 165-173.
Paradies, Y, Priest, N, Ben, J, Truong, M, Gupta, A, Pieterse, A, Kelaher, M & Gee, G 2013. Racism as a determinant of health: a protocol for conducting a systematic review and meta-analysis, Systematic Reviews, vol. 2, no. 1, p. 85.
Paradies, Y, Truong, M & Priest, N 2014. A systematic review of the extent and measurement of healthcare provider racism, Journal of general internal medicine, vol. 29, no. 2, pp. 364-387.
Parker, PD, Bodkin-Andrews, G, Marsh, HW, Jerrim, J & Schoon, I 2013. Will closing the achievement gap solve the problem? An analysis of primary and secondary effects for indigenous university entry, Journal of Sociology, vol. 51, no. 4, pp. 1085-1102.
Parker, R & Milroy, H 2014. Aboriginal and Torres Strait Islander Mental Health: An Overview, from Working Together: Aboriginal and Torres Strait Islander Mental Health and Wellbeing Principles and Practice, Commonwealth of Australia: Canberra, pp. 25-38.
Parker, S, McKinnon, L & Kruske, S 2014. 'Choice, culture and confidence': key findings from the 2012 having a baby in Queensland Aboriginal and Torres Strait Islander survey, BMC Health Services Research, vol. 14, p. 196.
Passey, ME, D'Este, CA & Sanson-Fisher, RW 2012. Knowledge, attitudes and other factors associated with assessment of tobacco smoking among pregnant Aboriginal women by health care providers: a cross-sectional survey, BMC public health, vol. 12, no. 1, p. 165.
Passey, ME, Sanson-Fisher, RW, D'Este, CA & Stirling, JM 2014. Tobacco, alcohol and cannabis use during pregnancy: clustering of risks, Drug & Alcohol Dependence, vol. 134, pp. 44-50.
Peiris, DP, Patel, AA, Cass, A, Howard, MP, Tchan, ML, Brady, JP, De Vries, J, Rickards, B, Yarnold, D & Hayman, N 2009. Cardiovascular disease risk management for Aboriginal and Torres Strait Islander peoples in primary health care settings: findings from the Kanyini Audit, The Medical Journal of Australia, vol. 191, no. 6, pp. 304-309.
Pharmaceutical Society of Australia 2014. Guide to providing pharmacy services to Aboriginal and Torres Strait Islander people, Pharmaceutical Society of Australia, PSA: Canberra.
Pignone, MP, Flitcroft, KL, Howard, K, Trevena, LJ, Salkeld, GP & St John, DJB 2011. Costs and cost-effectiveness of full implementation of a biennial faecal occult blood test screening program for bowel cancer in Australia, The Medical Journal of Australia, vol. 194, no. 4, p. 180.

References
260
Pircher, SLM, Li, SQ & Guthridge, SL 2012. Trend analysis of hospital admissions attributable to tobacco smoking, Northern Territory Aboriginal and non-Aboriginal populations, 1998 to 2009, BMC public health, vol. 12, pp. 545-545.
Powe, NR & Cooper, LA 2004. Diversifying the racial and ethnic composition of the physician workforce, Annals of Internal Medicine, vol. 141, no. 3, pp. 223-224.
Power, C, Kuh, D & Morton, S 2013. From developmental origins of adult disease to life course research on adult disease and aging: insights from birth cohort studies, Annual Review of Public Health, vol. 34, pp. 7-28.
Pratt, S, DeMamiel, M, Reye, K, Huey, A & Pope, A 2014. Food Security in Remote Indigenous Communities, Department of the Prime Minister & Cabinet, Report, no.2, ANAO: Canberra.
Priest, N, Perry, R, Ferdinand, A, Paradies, Y & Kelaher, M 2014. Experiences of racism, racial/ethnic attitudes, motivated fairness and mental health outcomes among primary and secondary school students, Journal of Youth & Adolescence, vol. 43, no. 10, pp. 1672-1687.
Pringle, KG, Rae, K, Weatherall, L, Hall, S, Burns, C, Smith, R, Lumbers, ER & Blackwell, CC 2015. Effects of maternal inflammation and exposure to cigarette smoke on birth weight and delivery of preterm babies in a cohort of indigenous Australian women, Frontiers in immunology, vol. 6.
Productivity Commission 2016a. National Education Evidence Base, Productivity Commission Draft Report, Productivity Commission: Canberra.
Productivity Commission 2016b. Indigenous Primary School Achievement, Productivity Commission Research Paper, Productivity Commission: Canberra.
Purdie, N, Reid, K, Frigo, T, Stone, A & Kleinhenz, E 2011. Literacy and Numeracy Learning: Lessons from the Longitudinal Literacy and Numeracy Study for Indigenous Students, Australian Council for Educational Research, ACER Research Monograph 65, ACER: research.acer.edu.au.
Putt, J, Payne, J & Milner, L 2005. Indigenous male offending and substance abuse, Australian Institute of Criminology, no. 293, AIC: Canberra.
Radford, K, Mack, HA, Draper, B, Chalkley, S, Daylight, G, Cumming, R, Bennett, H, Delbaere, K & Broe, GA 2015. Prevalence of dementia in urban and regional Aboriginal Australians, Alzheimers Dement, vol. 11, no. 3, pp. 271-279.
Randall, DA, Jorm, LR, Lujic, S, O'Loughlin, AJ, Churches, TR, Haines, MM, Eades, SJ & Leyland, AH 2012. Mortality after admission for acute myocardial infarction in Aboriginal and non-Aboriginal people in New South Wales, Australia: a multilevel data linkage study, BMC public health, vol. 12, p. 281.
Randall, DA, Jorm, LR, Lujic, S, O'Loughlin, AJ, Eades, SJ & Leyland, AH 2013. Disparities in revascularization rates after acute myocardial infarction between aboriginal and non-aboriginal people in Australia, Circulation, vol. 127, no. 7, pp. 811-819.
Rankin, P, Morton, D, Kent, L & Mitchell, B 2016. A community-based lifestyle intervention targeting Type II Diabetes risk factors in an Australian Aboriginal population: a feasibility study, Australian Indigenous HealthBulletin, vol. 16, no. 3.
Reconciliation Australia 2015. 2016 Australian Reconciliation Barometer, Reconciliation Australia: www.reconciliation.org.au
Reed, M 2017. Reducing Out-of-Pocket Costs to Coordinate Prescription Medication Benefit Design with Chronic Disease Outreach and Clinical Care, Journal of general internal medicine,10.1007/s11606-016-3976-8.
Reibel, T & Walker, R 2010. Antenatal services for Aboriginal women: the relevance of cultural competence, Quality in Primary Care, vol. 18, pp. 65-74.
Reilly, R, Evans, K, Gomersall, J, Gorham, G, Peters, MDJ, Warren, S, O’Shea, R, Cass, A & Brown, A 2016. Effectiveness, cost effectiveness, acceptability and implementation barriers/enablers of chronic kidney disease management programs for Indigenous people in Australia, New Zealand and Canada: a systematic review of mixed evidence, BMC Health Services Research, vol. 16, p. 119.
Remond, MG, Severin, KL, Hodder, Y, Martin, J, Nelson, C, Atkinson, D & Maguire, GP 2013. Variability in disease burden and management of rheumatic fever and rheumatic heart disease in two regions of tropical Australia, Internal Medicine Journal, vol. 43, no. 4, pp. 386-393.
RHD Australia & Menzies School of Health Research 2015. Framework for a nurse practitioner role in ARF RHD (National RHD Australia), Menzies School of Health Research, Menzies SHR: Darwin.
RHD Australia (ARF/RHD writing group), National Heart Foundation of Australia & The Cardiac Society of Australia and New Zealand 2012. Australian guideline for prevention, diagnosis and management of acute rheumatic fever and rheumatic heart disease (2nd edition), Menzies School of Health Research, Menzies SHR: Darwin.
Rice, ES, Haynes, E, Royce, P & Thompson, SC 2016. Social media and digital technology use among Indigenous young people in Australia: a literature review, International Journal for Equity in Health, vol. 15, no. 1, p. 81.
Ridani, R, Shand, FL, Christensen, H, McKay, K, Tighe, J, Burns, J & Hunter, E 2015. Suicide Prevention in Australian Aboriginal Communities: A Review of Past and Present Programs, Suicide and Life-Threatening Behavior, vol. 45, no. 1, pp. 111-140.
Rix, EF, Barclay, L, Stirling, J, Tong, A & Wilson, S 2015. The perspectives of Aboriginal patients and their health care providers on improving the quality of hemodialysis services: A qualitative study, Hemodialysis International: International Symposium on Home Hemodialysis, vol. 19, no. 1, pp. 80-89.
Roberts-Thomson, KF, Spencer, AJ & Jamieson, L 2008. Oral health of Aboriginal and Torres Strait Islander Australians, The Medical Journal of Australia, vol. 188, no. 10, pp. 592-593.

References
261
Robertson, J, Conigrave, K, Ivers, R, Hindmarsh, E & Clough, A 2013. Addressing high rates of smoking in remote Aboriginal communities--new evidence for GPs, Australian Family Physician, vol. 42, no. 7, pp. 492-496.
Robinson, G, Silburn, S & Leckning, B 2011. Suicide of Children and
Youth in the NT 2006-2010: Public Release Report for the Child Deaths Review and Prevention Committee, Menzies Centre for Child Development and Education, Menzies SHR: Darwin.
Robinson, P, Comino, E, Forbes, A, Webster, V & Knight, J 2012.
Timeliness of antenatal care for mothers of Aboriginal and non-Aboriginal infants in an urban setting, Australian Journal of Primary Health, vol. 18, no. 1, pp. 56-61.
Roche, AM, Duraisingam, V, Trifonoff, A & Tovell, A 2013. The health
and well-being of Indigenous drug and alcohol workers: results from a national Australian survey, Journal of Substance Abuse Treatment, vol. 44, no. 1, pp. 17-26.
Rodrigues, BT, Vangaveti, VN & Malabu, UH 2016. Prevalence and
Risk Factors for Diabetic Lower Limb Amputation: A Clinic-Based Case Control Study, Journal of Diabetes Research, vol. 2016, p. 7.
Rowley, KG, Gault, A, McDermott, R, Knight, S, McLeay, T & O'Dea, K
2000. Reduced prevalence of impaired glucose tolerance and no change in prevalence of diabetes despite increasing BMI among Aboriginal people from a group of remote homeland communities, Diabetes Care, vol. 23, no. 7, pp. 898-904.
Royal Australian College of General Practitioners 2010. Standards for
general practices (4th edition) including Interpretive guide for Aboriginal and Torres Strait Islander health services, RACGP: East Melbourne, Victoria.
Rumbold, AR, Bailie, RS, Si, D, Dowden, MC, Kennedy, CM, Cox, RJ,
O'Donoghue, L, Liddle, HE, Kwedza, RK, Thompson, SC, Burke, HP, Brown, AD, Weeramanthri, T & Connors, CM 2011. Delivery of maternal health care in Indigenous primary care services: baseline data for an ongoing quality improvement initiative, BMC Pregnancy & Childbirth, vol. 11, p. 16.
Samitz, G, Egger, M & Zwahlen, M 2011. Domains of physical activity
and all-cause mortality: systematic review and dose-response meta-analysis of cohort studies, International Journal of Epidemiology, vol. 40, no. 5, pp. 1382-1400.
Sarin, J, Hunt, J, Ivers, R & Smyth, C 2015. Lifting the burden: a
coordinated approach to action on Aboriginal tobacco resistance and control in NSW, Public Health Research & Practice, vol. 25, no. 3, p. e2531528.
Sassi, F 2009. Health inequalities: a persistent problem, from
Towards a more equal society, The Policy Press: Bristol, pp. 135–156.
Sattelmair, J, Pertman, J, Ding, EL, Kohl, HW, 3rd, Haskell, W & Lee,
IM 2011. Dose response between physical activity and risk of coronary heart disease: a meta-analysis, Circulation, vol. 124, no. 7, pp. 789-795.
Saunders, P & Davidson, P 2007. Rising poverty is bad for our health,
The Medical Journal of Australia, vol. 187, no. 9, pp. 530-531.
Sav, A, King, MA, Kelly, F, McMillan, SS, Kendall, E, Whitty, JA & Wheeler, AJ 2013. Self-management of chronic conditions in a rural and remote context, Australian Journal of Primary Health, doi.org/10.1071/PY13084.
Sayers, S & Powers, J 1997. Risk factors for aboriginal low
birthweight, intrauterine growth retardation and preterm birth in the Darwin Health Region, Australian & New Zealand Journal of Public Health, vol. 21, no. 5, pp. 524-530.
Scelza, BA 2012. Food scarcity, not economic constraint limits
consumption in a rural Aboriginal community, Australian Journal of Rural Health, vol. 20, no. 3, pp. 108-112.
Schers, H, van den Hoogen, H, Bor, H, Grol, R & van den Bosch, W
2005. Familiarity with a GP and patients' evaluations of care. A cross-sectional study, Family Practice, vol. 22, no. 1, pp. 15-19.
Schierhout, G, Brands, J & Bailie, R 2010. Audit and Best Practice for
Chronic Disease Extension Project, 2005–2009: Final Report, The Lowitja Institute & Menzies School of Health Research, Audit and Best Practice for Chronic Disease The Lowitja Institute: Melbourne.
Schoen, D, Balchin, D & Thompson, S 2010. Health promotion
resources for Aboriginal people: lessons learned from consultation and evaluation of diabetes foot care resources, Health Promotion Journal of Australia, vol. 21, no. 1, pp. 64-69.
Scollo, M & Winstanley, M 2012. Tobacco in Australia: Facts and
issues. 4th edn., Cancer Council, Victoria, 'viewed' November 2016, http://www.tobaccoinaustralia.org.au/.
Scott, JA 2014. Chronic disease profiles in one high risk Indigenous
community: a comparison of chronic disease profiles after a 10 year follow up and the relationship between birth weight and chronic disease morbidity and mortality, PhD: The University of Queensland.
Semlitsch, T, Jeitler, K, Hemkens, LG, Horvath, K, Nagele, E,
Schuermann, C, Pignitter, N, Herrmann, KH, Waffenschmidt, S & Siebenhofer, A 2013. Increasing Physical Activity for the Treatment of Hypertension: A Systematic Review and Meta-Analysis, Sports Medicine, vol. 43, no. 10, pp. 1009-1023.
Sen, A 1999. Development As Freedom, Oxford University Press:
Oxford. Senate Community Affairs Committee Secretariat 2012. Community
Affairs References Committee: The factors affecting the supply of health services and medical professionals in rural areas, Senate Standing Committees on Community Affairs, SSCCA: Canberra.
Shahid, S, Finn, L, Bessarab, D & Thompson, S 2009. Understanding,
beliefs and perspectives of Aboriginal people in Western Australia about cancer and its impact on access to cancer services, BMC Health Services Research, vol. 9, no. 1, p. 132.
Shahid, S, Teng, TK, Bessarab, D, Aoun, S, Baxi, S & Thompson, SC
2016. Factors contributing to delayed diagnosis of cancer among Aboriginal people in Australia: a qualitative study, BMJ open, vol. 6, no. 6.

References
262
Shaw, C 2016. An evidence-based approach to reducing discharge against medical advice amongst Aboriginal and Torres Strait Islander patients, Deeble Institute for Health Policy Research & Australian Healthcare and Hospitals Association, Deeble Institute Issues Brief, No. 14, AHHA: Deakin, ACT.
Shepherd, CCJ, Li, J, Farrant, B, Hopkins, K & Priest, N 2016. Racism and its impact on the health of Aboriginal children: Insights from the Footprints in Time Study, presented at Lowitja Institute International Indigenous Health and Wellbeing Conference 2016, The Lowitja Institute: Melbourne, 10 Nov 2016.
Shonkoff, JP, Garner, AS, Siegel, BS, Dobbins, MI, Earls, MF, Garner, AS, McGuinn, L, Pascoe, J & Wood, DL 2011. The Lifelong Effects of Early Childhood Adversity and Toxic Stress, Pediatrics,10.1542/peds.2011-2663.
Siahpush, M, Huang, TT, Sikora, A, Tibbits, M, Shaikh, RA & Singh, GK 2014. Prolonged financial stress predicts subsequent obesity: results from a prospective study of an Australian national sample, Obesity (Silver Spring), vol. 22, no. 2, pp. 616-621.
Sikora, J & Biddle, N 2015. How gendered is ambition? Educational and occupational plans of Indigenous youth in Australia, International Journal of Educational Development, vol. 42, pp. 1-13.
Sivak, L, Arney, F & Lewig, K 2008. A Pilot Exploration of a Family Home Visiting Program for Families of Aboriginal and Torres Strait Islander Children Report and Recommendations: Perspectives of Parents of Aboriginal Children and Organisational Considerations, Australian Centre for Child Protection, University of South Australia, ACCP: Adelaide.
Smylie, J, Crengle, S, Freemantle, J & Taualii, M 2010. Indigenous birth outcomes in Australia, Canada, New Zealand and the United States–an overview, The open women's health journal, no. 4, p. 7.
Social Health Reference Group 2004. National Strategic Framework for Aboriginal and Torres Strait Islander Peoples' Mental Health and Social and Emotional Well Being (2004-2009), National Aboriginal and Torres Strait Islander Health Council & National Mental Health Working Group, Aboriginal Health & Medical Research Council of NSW: Canberra.
Spiranovic, C, Clare, J, Bartels, L, Clare, M & Clare, B 2015. Aboriginal Young People in the Children's Court of Western Australia: Findings From the National Assessment of Australian Children's Courts, University of Western Australia Law Review, vol. 38, no. 2, pp. 86-116.
Spurling, G, Hayman, NE & Cooney, AL 2009. Adult health checks for Indigenous Australians: the first year's experience from the Inala Indigenous Health Service, The Medical Journal of Australia, vol. 190, no. 10, pp. 562-564.
Srikartika, VM & O'Leary, CM 2015. Pregnancy outcomes of mothers with an alcohol-related diagnosis: a population-based cohort study for the period 1983-2007, BJOG: An International Journal of Obstetrics & Gynaecology, vol. 122, no. 6, pp. 795-804.
Starfield, B 1998. Primary Care: Balancing Health Needs, Services and Technology, Oxford University Press: New York.
Starfield, B & Shi, L 2004. The medical home, access to care, and insurance: a review of evidence, Pediatrics, vol. 113, no. 5 Suppl, pp. 1493-1498.
Statistics New Zealand 2015. New Zealand Period Life Tables: 2012–14, New Zealand Government: NZ, http://www.stats.govt.nz
Steele, RM, van Sluijs, EM, Cassidy, A, Griffin, SJ & Ekelund, U 2009. Targeting sedentary time or moderate- and vigorous-intensity activity: independent relations with adiposity in a population-based sample of 10-y-old British children, The American Journal of Clinical Nutrition, vol. 90, no. 5, pp. 1185-1192.
Steering Committee for the Review of Government Service Provision 2007. Overcoming Indigenous Disadvantage: Key Indicators 2007 Report, Productivity Commission: Canberra.
Steering Committee for the Review of Government Service Provision 2013. National Agreement Performance Information 2012-13, National Healthcare Agreement, Commonwealth of Australia: Canberra.
Steering Committee for the Review of Government Service Provision 2014. Report on Government Services 2014, Volume B: Child care, Education & Training, Productivity Commission: Canberra.
Steering Committee for the Review of Government Service Provision 2016a. Report on Government Services 2016, Vol. E: Health, Productivity Commission: Canberra.
Steering Committee for the Review of Government Service Provision 2016b. Overcoming Indigenous Disadvantage: Key Indicators 2016 Report, Productivity Commission: Canberra.
Steering Committee for the Review of Government Service Provision 2017. Report on Government Services 2017 Vol. E: Health, Productivity Commission: Canberra.
Stephens, A, Cullen, J, Massey, L & Bohanna, I 2014. Will the National Disability Insurance Scheme Improve the Lives of those Most in Need? Effective Service Delivery for People with Acquired Brain Injury and other Disabilities in Remote Aboriginal and Torres Strait Islander Communities, Australian Journal of Public Administration, vol. 73, no. 2, pp. 260-270.
Stephenson, J, Bauman, A, Armstrong, T, Smith, B & Bellew, B 2000. The Costs of Illness Attributable to Physical Inactivity in Australia: A preliminary study, Department of Health, no. PAN 2704, DoH: Canberra.
Stevenson, RJ, Lind, B & Weatherburn, D 1999. Property damage and public disorder: their relationship with sales of alcohol in New South Wales, Australia, Drug & Alcohol Dependence, vol. 54, no. 2, pp. 163-170.
Stockwell, T, Donath, S, Cooper-Stanbury, M, Chikritzhs, T, Catalano, P & Mateo, C 2004. Under-reporting of alcohol consumption in household surveys: a comparison of quantity-frequency, graduated-frequency and recent recall, Addiction, vol. 99, no. 8, pp. 1024-1033.

References
263
Stoneman, A, Atkinson, D, Davey, MA & Marley, JV 2014. Quality improvement in practice: improving diabetes care and patient outcomes in Aboriginal Community Controlled Health Services, BMC Health Services Research, vol. 14, no. 1, p. 481.
Strazdins, L, Shipley, M, Clements, M, Obrien, LV & Broom, DH 2010. Job quality and inequality: parents' jobs and children's emotional and behavioural difficulties, Social Science & Medicine, vol. 70, no. 12, pp. 2052-2060.
Strobel, NA & Ward, J 2012. Education programs for Indigenous Australians about sexually transmitted infections and bloodborne viruses, AIHW & AIFS, Resource Sheet, no. 14, Closing the Gap Clearinghouse: Canberra.
Supramaniam, R, Gibberd, A & O'Connell, D 2011. Non-small cell lung cancer treatment and survival for Aboriginal people in NSW, presented at Clinical Oncological Society of Australia 38th Annual Scientific Meeting 2011 - Partnerships against cancer: bridging gaps, breaking barriers, COSA: Perth.
Symons, M, Gray, D, Chikritzhs, T, Skov, SJ, Saggers, S, Boffa, J & Low, J 2012. A longitudinal study of influences on alcohol consumption and related harm in Central Australia: With a particular emphasis on the role of price, National Drug Research Institute, Curtin University, no. 0987364103, NDRI: Perth.
Tapp, RJ, Boudville, AI, Abouzeid, M, Anjou, MD & Taylor, HR 2015. Impact of diabetes on eye care service needs: the National Indigenous Eye Health Survey, Clinical & Experimental Ophthalmology, vol. 43, no. 6, pp. 540-543.
Taulbut, M, Walsh, D, Parcell, S, Hartmann, A, Poirier, G, Strniskova, D, Daniels, G & Hanlon, P 2013. What can ecological data tell us about reasons for divergence in health status between West Central Scotland and other regions of post-industrial Europe?, Public Health, vol. 127, no. 2, pp. 153-163.
Tavella, R, McBride, K, Keech, W, Kelly, J, Rischbieth, A, Zeitz, C, Beltrame, JF, Tideman, PA & Brown, A 2016. Disparities in acute in-hospital cardiovascular care for Aboriginal and non-Aboriginal South Australians, The Medical Journal of Australia, vol. 205, no. 5, pp. 222-227.
Taylor, HR, Anjou, MD, Boudville, AI & McNeil, RJ 2015. The Roadmap to Close the Gap for Vision: Summary Report, Melbourne School of Population and Global Health, The University of Melbourne, Indigenous Eye Health Unit: Melbourne.
Taylor, J, Edwards, J, Champion, S, Cheers, S, Chong, A, Cummins, R & Cheers, B 2012. Towards a conceptual understanding of Aboriginal and Torres Strait Islander community and community functioning, Community Development Journal, vol. 47, no. 1, pp. 94-110.
Taylor, KP, Thompson, SC, Wood, MM, Ali, M & Dimer, L 2009. Exploring the impact of an Aboriginal Health Worker on hospitalised Aboriginal experiences: lessons from cardiology, Australian Health Review, vol. 33, no. 4, pp. 549-557.
Taylor, LK, Lee, YY, Lim, K, Simpson, JM, Roberts, CL & Morris, J 2013. Potential prevention of small for gestational age in Australia: a population-based linkage study, BMC Pregnancy & Childbirth, vol. 13, no. 1, p. 210.
Telethon Institute for Child Health Research 2009. Alcohol and Pregnancy and Fetal Alcohol Spectrum Disorder: a Resource for Health Professionals (1st revision), Telethon Institute for Child Health Research, Alcohol and Pregnancy Project, Telethon Institute: Perth.
Templeton, DJ, Wright, ST, McManus, H, Lawrence, C, Russell, DB, Law, MG, Petoumenos, K & on behalf of the Australian, HIVOD 2015. Antiretroviral treatment use, co-morbidities and clinical outcomes among Aboriginal participants in the Australian HIV Observational Database (AHOD), BMC Infectious Diseases, vol. 15, p. 326.
Teng, THK, Katzenellenbogen, JM, Hung, J, Knuiman, M, Sanfilippo, FM, Geelhoed, E, Hobbs, M & Thompson, SC 2014. Rural–urban differentials in 30-day and 1-year mortality following first-ever heart failure hospitalisation in Western Australia: a population-based study using data linkage, BMJ open, vol. 4, no. 5, p. e004724.
Thomas, DP, Briggs, V, Anderson, IP & Cunningham, J 2008. The social determinants of being an Indigenous non-smoker, Australian & New Zealand Journal of Public Health, vol. 32, no. 2, pp. 110-116.
Thomas, DP & Stevens, M 2014. Aboriginal and Torres Strait Islander smoke-free homes, 2002 to 2008, Australian & New Zealand Journal of Public Health, vol. 38, no. 2, pp. 147-153.
Thomas, DP, Davey, MA, Briggs, V, Borland, R & project, obotTATS 2015a. Talking About The Smokes: summary and key findings, The Medical Journal of Australia, vol. 202, no. 10 Suppl, pp. S3-S4.
Thomas, DP, Panaretto, KS, Stevens, M, Bennet, PT & Borland, R 2015b. Smoke-free homes and workplaces of a national sample of Aboriginal and Torres Strait Islander people, The Medical Journal of Australia, vol. 202, no. 10, pp. S33-38.
Thomas, SL 2014. The cost-effectiveness of primary care for Indigenous Australians with diabetes living in remote Northern Territory communities, The Medical Journal of Australia, vol. 201, no. 8, p. 450.
Thompson, S, Shahid, S, Greville, H & Bessarab, D 2011. “A whispered sort of stuff” A community report on research around Aboriginal people’s beliefs about cancer and experiences of cancer care in Western Australia, Cancer Council, Western Australia, Cancer Council Perth.
Thompson, SL, Chenhall, RD & Brimblecombe, JK 2013. Indigenous perspectives on active living in remote Australia: a qualitative exploration of the socio-cultural link between health, the environment and economics, BMC public health, vol. 13, p. 473.
Thomson, H, Thomas, S, Sellstrom, E & Petticrew, M 2013. Housing improvements for health and associated socio-economic outcomes, Cochrane Database of Systematic Reviews,10.1002/14651858.CD008657.pub2 no. 2, p. CD008657.

References
264
Thomson, S, De Bortoli, L & Underwood, C 2016. PISA 2015: a first look at Australia’s results, Australian Council for Educational Research, ACER: Melbourne.
Thrift, AP, Nancarrow, H & Bauman, AE 2011. Maternal smoking during pregnancy among Aboriginal women in New South Wales is linked to social gradient, Australian & New Zealand Journal of Public Health, vol. 35, no. 4, pp. 337-342.
Thurber, K, Boxall, A & Partel, K 2014. Overweight and obesity among Indigenous children: individual and social determinants, Deeble Institute & Australian Health Care and Hospitals Association, Issues Brief, no. 3, AHHA: Canberra.
Tighe, J & McKay, K 2012. Alive and Kicking Goals!: Preliminary findings from a Kimberley suicide prevention program, Advances in Mental Health, vol. 10, no. 3, pp. 240-245.
Timms, L, Williams, C, Stokes, SF & Kane, R 2014. Literacy skills of Australian Indigenous school children with and without otitis media and hearing loss, International Journal of Speech Language Pathology, vol. 16, no. 3, pp. 327-334.
Tongs, J, Chatfield, H & Winnunga Nimmityjah Aboriginal Health Service 2007. The social determinants of Aboriginal prison health and the cycle of incarceration and their implications for policy: an Australian Capital Territory case study, presented at Commission on Social Determinants of Health: International Symposium on Indigenous Health, The Lowitja Institute: Adelaide.
Torzillo, PJ & Chang, AB 2014. Acute respiratory infections among Indigenous children, The Medical Journal of Australia, vol. 200, no. 10, pp. 559-560.
Trivedi, AN, Bailie, R, Bailie, J, Brown, A & Kelaher, M 2016. Hospitalizations for Chronic Conditions Among Indigenous Australians After Medication Copayment Reductions: the Closing the Gap Copayment Incentive, Journal of general internal medicine,10.1007/s11606-016-3912-y.
Truong, M, Paradies, Y & Priest, N 2014. Interventions to improve cultural competency in healthcare: a systematic review of reviews, BMC Health Services Research, vol. 14, p. 99.
Tsey, K & Every, A 2000. Evaluating Aboriginal empowerment programs: the case of Family WellBeing, Australian & New Zealand Journal of Public Health, vol. 24, no. 5, pp. 509-514.
Turrell, G & Mathers, CD 2000. Socioeconomic status and health in Australia, The Medical Journal of Australia, vol. 172, no. 9, pp. 434-438.
URBIS 2014. Literature Review - General Practice Accreditation Report prepared for the Australian Commission on Safety and Quality in Health Care, Australian Commission on Safety and Quality in Health Care, URBIS: Australia.
Valery, PC, Coory, M, Stirling, J & Green, AC 2006. Cancer diagnosis, treatment, and survival in Indigenous and non-Indigenous Australians: a matched cohort study, The Lancet, vol. 367, no. 9525, pp. 1842-1848.
Valery, PC, Youlden, DR, Baade, PD, Ward, LJ, Green, AC & Aitken, JF 2011. Cancer survival for Indigenous compared to non-Indigenous Australian children, presented at Clinical Oncological Society of Australia 38th Annual Scientific Meeting 2011 - Partnerships against cancer: bridging gaps, breaking barriers, COSA: Perth, 15-17 November 2011.
van der Sterren, A & Fowlie, C 2015. Reducing smoking in the ACT among Aboriginal and Torres Strait Islander women who are pregnant or who have young children, Alcohol, Tobacco and Other Drug Association ACT, ATODA Monograph Series, no. 1, ATODA: Canberra.
Vanderpoll, T & Howard, D 2012. Massive prevalence of hearing loss among Aboriginal inmates in the Northern Territory, Indigenous Law Bulletin, vol. 7, no. 28.
Vass, A, Mitchell, A & Dhurrkay, Y 2011. Health literacy and Australian Indigenous peoples: an analysis of the role of language and worldview, Health Promotion Journal of Australia, vol. 22, no. 1, pp. 33-37.
VicHealth 2012. Disability and health inequalities in Australia: Addressing the social and economic determinants of mental and physical health, Research Summary, VicHealth: Melbourne.
Wagner, EH, Austin, BT & Von Korff, M 1996. Organizing care for patients with chronic illness, The Milbank Quarterly, vol. 74, no. 4, pp. 511-544.
Walker, N, Johnston, V, Glover, M, Bullen, C, Trenholme, A, Chang, A, Morris, P, Segan, C, Brown, N, Fenton, D, Hawthorne, E, Borland, R, Parag, V, Von Blaramberg, T, Westphal, D & Thomas, D 2015. Effect of a Family-Centered, Secondhand Smoke Intervention to Reduce Respiratory Illness in Indigenous Infants in Australia and New Zealand: A Randomized Controlled Trial, Nicotine & Tobacco Research, vol. 17, no. 1, pp. 48-57.
Wallace, C, Burns, L, Gilmour, S & Hutchinson, D 2007. Substance use, psychological distress and violence among pregnant and breastfeeding Australian women, Australian & New Zealand Journal of Public Health, vol. 31, no. 1, pp. 51-56.
Wallace, GP 2014. What can circle sentencing courts tell us about drug and alcohol problems affecting Aboriginal communities?, The Medical Journal of Australia, vol. 200, no. 11, pp. 675-677.
Walter, M, Lovett, R, Priest, N & Thurber, K 2016. Good methodology in analysis of data on Indigenous health and wellbeing, presented at The Lowitja Institute International Indigenous Health and Wellbeing Conference The Lowitja Institute: Melbourne, 8-10 Nov.
Wand, H, Ward, J, Bryant, J, Delaney-Thiele, D, Worth, H, Pitts, M & Kaldor, JM 2016. Individual and population level impacts of illicit drug use, sexual risk behaviours on sexually transmitted infections among young Aboriginal and Torres Strait Islander people: results from the GOANNA survey, BMC public health, vol. 16, p. 600.
References
265
Wang, L, Mamudu, HM, Alamian, A, Anderson, JL & Brooks, B 2014. Independent and joint effects of prenatal maternal smoking and maternal exposure to second-hand smoke on the development of adolescent obesity: a longitudinal study, Journal of Paediatrics & Child Health, vol. 50, no. 11, pp. 908-915.
Wang, X, Ouyang, Y, Liu, J, Zhu, M, Zhao, G, Bao, W & Hu, FB 2014. Fruit and vegetable consumption and mortality from all causes, cardiovascular disease, and cancer: systematic review and dose-response meta-analysis of prospective cohort studies, British Medical Journal, vol. 349, p. g4490.
Wang, Z & Li, SQ 2010. Mortality in the Northern Territory 1967-2006, Health Gains Planning Information Sheet, Northern Territory Government: Darwin.
Ward, JS, Dyda, A, McGregor, S, Rumbold, A, Garton, L, Donovan, B, Kaldor, JM & Guy, RJ 2016. Low HIV testing rates among people with a sexually transmissible infection diagnosis in remote Aboriginal communities, The Medical Journal of Australia, vol. 205, no. 4, pp. 168-171.
Ware, VA 2013. Improving the accessibility of health services in urban and regional settings for Indigenous people, AIHW & AIFS, Resource Sheet, no. 27 Closing the Gap Clearinghouse: Canberra.
Ware, VA & Meredith, V 2013. Supporting healthy communities through sports and recreation programs, AIHW & AIFS, Resource Sheet, no. 26 Closing the Gap Clearinghouse: Canberra.
Warren, JM & Birrell, AL 2016. Trachoma in remote Indigenous Australia: a review and public health perspective, Australian & New Zealand Journal of Public Health, vol. 40 Suppl 1, pp. S48-52.
Waterworth, P, Pescud, M, Braham, R, Dimmock, J & Rosenberg, M 2015. Factors Influencing the Health Behaviour of Indigenous Australians: Perspectives from Support People, PLOS ONE, vol. 10, no. 11, p. e0142323.
Weatherburn, D 2014. Arresting Incarceration: pathways out of Indigenous imprisonment, Aboriginal Studies Press: Canberra.
Webster, RJ, Heeley, EL, Peiris, DP, Bayram, C, Cass, A & Patel, AA 2009. Gaps in cardiovascular disease risk management in Australian general practice, The Medical Journal of Australia, vol. 191, no. 6, pp. 324-329.
Weir, JK 2012. Country, Native Title and Ecology, from Country, Native Title and Ecology, Australian National University Press: Canberra, pp. 1-20.
Weisleder, A & Fernald, A 2013. Talking to Children Matters, Psychological Science, vol. 24, no. 11, pp. 2143-2152.
Wen, LM, Flood, VM, Simpson, JM, Rissel, C & Baur, LA 2010. Dietary behaviours during pregnancy: findings from first-time mothers in southwest Sydney, Australia, International Journal of Behavioural Nutrition & Physical Activity, vol. 7, p. 13.
West, C, Usher, K & Clough, AR 2014. Study protocol - resilience in individuals and families coping with the impacts of alcohol related injuries in remote indigenous communities: a mixed method study, BMC public health, vol. 14, pp. 479-479.
West, R, Usher, K & Foster, K 2010. Increased numbers of Australian Indigenous nurses would make a significant contribution to 'closing the gap' in Indigenous health: What is getting in the way?, Contemporary Nurse, vol. 36, no. 1-2, pp. 121-130.
West, R, Usher, K, Foster, K & Stewart, L 2014. Academic staff perceptions of factors underlying program completion by Australian indigenous nursing students, The Qualitative Report, vol. 19, no. 12, p. 1.
West, SK, Rubin, GS, Broman, AT, Munoz, B, Bandeen-Roche, K & Turano, K 2002. How does visual impairment affect performance on tasks of everyday life? The SEE Project. Salisbury Eye Evaluation, Archives of Ophthalmology, vol. 120, no. 6, pp. 774-780.
Westbury, ND 2002. The importance of Indigenous governance and its relationship to social and economic development. Unpublished Background Issues Paper produced for Reconciliation Australia, presented at Indigenous Governance Conference, IGC: Canberra, 3-5 April 2002.
White, A, Wong, W, Sureshkumur, P & Singh, G 2010. The burden of kidney disease in indigenous children of Australia and New Zealand, epidemiology, antecedent factors and progression to chronic kidney disease, Journal of Paediatrics & Child Health, vol. 46, no. 9, pp. 504-509.
White, SL, Dunstan, DW, Polkinghorne, KR, Atkins, RC, Cass, A & Chadban, SJ 2011. Physical inactivity and chronic kidney disease in Australian adults: the AusDiab study, Nutrition, Metabolism and Cardiovascular Disease, vol. 21, no. 2, pp. 104-112.
Whitehead, M 1991. The concepts and principles of equity and health, Health Promotion International, vol. 6, no. 3, pp. 217-228.
Whop, LJ, Baade, P, Garvey, G, Cunningham, J, Brotherton, JML, Lokuge, K, Valery, PC, O’Connell, DL, Canfell, K, Diaz, A, Roder, D, Gertig, DM, Moore, SP & Condon, JR 2016. Cervical Abnormalities Are More Common among Indigenous than Other Australian Women: A Retrospective Record-Linkage Study, 2000–2011, PLOS ONE, vol. 11, no. 4, p. e0150473.
Wilkinson, RG & Pickett, KE 2009. Income Inequality and Social Dysfunction, Annual Review of Sociology, vol. 35, no. 1, pp. 493-511.
Williams, CJ & Jacobs, AM 2009. The impact of otitis media on cognitive and educational outcomes, The Medical Journal of Australia, vol. 191, no. 9, pp. S69-S72.
Williams, DR & Mohammed, SA 2009. Discrimination and racial disparities in health: evidence and needed research, Journal of behavioral medicine, vol. 32, no. 1, p. 20.
Williams, DR & Mohammed, SA 2013. Racism and Health I: Pathways and Scientific Evidence, The American Behavioral Scientist, vol. 57, no. 8.

References
266
Williams, S, Jamieson, L, MacRae, A & Gray, C 2011. Review of Indigenous oral health, Australian Indigenous HealthInfoNet, vol. no. 7.
Williamson, AB, Raphael, B, Redman, S, Daniels, J, Eades, SJ & Mayers, N 2010. Emerging themes in Aboriginal child and adolescent mental health: findings from a qualitative study in Sydney, New South Wales, The Medical Journal of Australia, vol. 192, no. 10, pp. 603-605.
Wills, RA & Coory, MD 2008. Effect of smoking among Indigenous and non-Indigenous mothers on preterm birth and full-term low birthweight, The Medical Journal of Australia, vol. 189, no. 9, pp. 490-494.
Wilmot, EG, Edwardson, CL, Achana, FA, Davies, MJ, Gorely, T, Gray, LJ, Khunti, K, Yates, T & Biddle, SJ 2012. Sedentary time in adults and the association with diabetes, cardiovascular disease and death: systematic review and meta-analysis, Diabetologia, vol. 55, no. 11, pp. 2895-2905.
Wilson, G 2009. What do Aboriginal women think is good antenatal care? Consultation report, Cooperative Research Centre for Aboriginal Health, CRCAH: Darwin.
Wilson, M, Stearne, A, Gray, D & Saggers, S 2010. The harmful use of alcohol amongst Indigenous Australians, Australian Indigenous HealthInfoNet.
Wolfson, M, Kaplan, G, Lynch, J, Ross, N & Backlund, E 1999. Relation between income inequality and mortality: empirical demonstration, British Medical Journal, vol. 319, no. 7215, pp. 953-955.
Wong, J & Mellor, D 2014. Intimate partner violence and women's health and wellbeing: impacts, risk factors and responses, Contemporary Nurse, vol. 46, no. 2, pp. 170-179.
Wong, MD, Shapiro, MF, Boscardin, WJ & Ettner, SL 2002. Contribution of major diseases to disparities in mortality, The New England Journal of Medicine, vol. 347, no. 20, pp. 1585-1592.
Wood, L, France, K, Hunt, K, Eades, S & Slack-Smith, L 2008. Indigenous women and smoking during pregnancy: knowledge, cultural contexts and barriers to cessation, Social Science & Medicine, vol. 66, no. 11, pp. 2378-2389.
World Health Organization 2004. WHO Policy Perspectives on Medicines, WHO: Geneva.
World Health Organization 2005. The Bangkok Charter for Health Promotion in a Globalized World, WHO, 'viewed' November 2016, http://www.who.int/healthpromotion/conferences/6gchp/bangkok_charter/en/.
World Health Organization 2007. Health Services Coverage Statistics: Antenatal care coverage, WHO: Geneva.
World Health Organization 2010. Global recommendations on physical activity for health, WHO: Geneva.
World Health Organization 2013. A Global Brief on Hypertension: Silent Killer, Global Public Health Crisis WHO: Geneva.
World Health Organization 2017. The determinants of health, Health Impact Assessment (HIA) WHO, 'viewed' November 2016, http://www.who.int/hia/evidence/doh/en/
Yan, J & Groothuis, PA 2015. Timing of prenatal smoking cessation or reduction and infant birth weight: evidence from the United Kingdom Millennium Cohort Study, Maternal & Child Health Journal, vol. 19, no. 3, pp. 447-458.
Yao, R, Ananth, CV, Park, BY, Pereira, L & Plante, LA 2014. Obesity and the risk of stillbirth: a population-based cohort study, American Journal of Obstetrics & Gynecology, vol. 210, no. 5, pp. 457 e451-459.
Yeates, KE, Cass, A, Sequist, TD, McDonald, SP, Jardine, MJ, Trpeski, L & Ayanian, JZ 2009. Indigenous people in Australia, Canada, New Zealand and the United States are less likely to receive renal transplantation, Kidney International, vol. 76, no. 6, pp. 659-664.
You, J, Condon, JR, Zhao, Y & Guthridge, S 2009. Incidence and survival after acute myocardial infarction in Indigenous and non-Indigenous people in the Northern Territory, 1992–2004, The Medical Journal of Australia, vol. 190, no. 6, pp. 298-302.
You, J, Condon, JR, Zhao, Y & Guthridge, SL 2015. Stroke incidence and case-fatality among Indigenous and non-Indigenous populations in the Northern Territory of Australia, 1999-2011, International Journal of Stroke, vol. 10, no. 5, pp. 716-722.
Zhang, J & Webster, A 2010. An Analysis of Repeat Imprisonment Trends in Australia using Prisoner Census Data from 1994 to 2007, Australian Bureau of Statistics, Research Paper, Cat. no. 1351.0.55.031, ABS: Canberra.
Zhang, Z, Kris-Etherton, PM & Hartman, TJ 2014. Birth weight and risk factors for cardiovascular disease and type 2 diabetes in US children and adolescents: 10 year results from NHANES, Maternal & Child Health Journal, vol. 18, no. 6, pp. 1423-1432.
Zhao, Y, Wright, J, Begg, S & Guthridge, S 2013a. Decomposing Indigenous life expectancy gap by risk factors: a life table analysis, Population Health Metrics, vol. 11, no. 1, p. 1.
Zhao, Y, Wright, J, Guthridge, SL & Lawton, P 2013b. The relationship between number of primary health care visits and hospitalisations: evidence from linked clinic and hospital data for remote Indigenous Australians, BMC Health Services Research, vol. 13, no. 1, p. 466.
Zhao, Y, You, J, Wright, J, Guthridge, SL & Lee, AH 2013c. Health inequity in the Northern Territory, Australia, International Journal for Equity in Health, vol. 12, p. 79.
Zhao, Y, Thomas, SL, Guthridge, SL & Wakerman, J 2014. Better health outcomes at lower costs: the benefits of primary care utilisation for chronic disease management in remote Indigenous communities in Australia's Northern Territory, BMC Health Services Research, vol. 14, p. 463.
Zhao, Y, Condon, J, You, J, Guthridge, S & He, V 2015a. Assessing improvements in survival for stroke patients in the Northern Territory 1992-2013: a marginal structural analysis, Australian Health Review, vol. 39, no. 4, pp. 437-443.

References
267
Zhao, Y, Connors, C, Lee, AH & Liang, W 2015b. Relationship between primary care visits and hospital admissions in remote Indigenous patients with diabetes: a multivariate spline regression model, Diabetes Research & Clinical Practice, vol. 108, no. 1, pp. 106-112.
Zhao, Y, Vemuri, SR & Arya, D 2016. The economic benefits of eliminating Indigenous health inequality in the Northern Territory, The Medical Journal of Australia, vol. 205, no. 6, pp. 266-269.
Zorbas, H & Elston, J 2016. Sharing the challenge of cancer control for Indigenous Australians: a national agenda, European Journal of Cancer Care, vol. 25, no. 2, pp. 222-224.
Zubrick, SR, Silburn, SR, Lawrence, DM, Mitrou, FG, Dalby, RB, Blair, EM, Griffin, J, Milroy, H, De Maio, JA, Cox, A & Li, J 2005. The Western Australian Aboriginal Child Health Survey: The Social and Emotional Wellbeing of Aboriginal Children and Young People, Curtin University of Technology & Telethon Institute for Child Health Research, Telethon Institute: Perth
Zubrick, SR, Shepherd, CCJ, Dudgeon, P, Gee, G, Paradies, Y, Scrine, C & Walker, R 2014. Social determinants of social and emotional wellbeing, from Working Together: Aboriginal and Torres Strait Islander Mental Health and Wellbeing Principles and Practice, Commonwealth of Australia: Canberra.
Zwar, NA, Hermiz, O, Comino, EJ, Shortus, T, Burns, J & Harris, M 2007. Do multidisciplinary care plans result in better care for patients with type 2 diabetes?, Australian Family Physician, vol. 36, no. 1-2, pp. 85-89.


www.dpmc.gov.au/hpf